Embed Size (px)
Citation preview
Work-Sharing and the Fall of Unemployment in Germany
Carlos Carrillo-Tudela a), Andrey Launov b) and Jean-Marc Robin c)
a)
University of Essex,
b)
University of Kent,
c)
Sciences Po & UCL
CEP-IFS, 26-28/10/2017
Carrillo-Tudela, Launov and Robin (
a)
University of Essex,
b)
University of Kent,
c)
Sciences Po & UCL)Mini-jobs CEP-IFS, 26-28/10/2017 1 / 33

INTRODUCTION

Introduction
The fall of unemployment
The unemployment rate rose from 5.2% in January 1991 to 11.2% inJuly 2005, and then achieved its lowest level of 3.8% in June 2017.
Wage moderation and decentralisation of the wage setting processexplain the improvement of Germany’s competitiveness (seeDustmann, Fitzenberger, Schonberg and Spitz-Oener,JoEconPerspectives 2014).
However, there is little evidence that improved competitiveness is atthe heart of the reduction of unemployment.
What is the mechanism? and what role did the Hartz reformsplay?
We argue in this paper that unemployment fell in Germany because ofhardened conditions for unemployment and work sharing.
Carrillo-Tudela, Launov and Robin (
a)
University of Essex,
b)
University of Kent,
c)
Sciences Po & UCL)Mini-jobs CEP-IFS, 26-28/10/2017 3 / 33

Introduction
Did mini-jobs lift employment?
BREMEN, Germany—Germany's job market may be the envy of astruggling Europe, but many Germans say their country's"Jobwunder," or jobs miracle, is cutting them out of the nation'seconomic success.
Germany's unemployment rate was unchanged for the seventhstraight month at a relatively low 6.9% in May, after seasonaladjustment. Yet nearly one in five working Germans, or about 7.4million people, hold a so-called "minijob," a form of marginalemployment that allows someone to earn up to €450($580) a monthfree of tax.
In industries from retail to health care, minijobs have been a boon,allowing employers to keep down labor costs. Minijob hourly wagesare usually low and the positions often don't come with the samebenefits as a regular job.
As much of Europe looks to the Continent's economic powerhouse forlessons on how to revive moribund labor markets, the proliferation ofthese low-wage jobs has sparked a vigorous debate in Germany aboutwhether enough workers are sharing in the nation's strong economicperformance.
Proponents of minijobs argue they offer stay-at-home parents,retirees and students a legal option to earn tax-free money and givebusinesses the flexibility to adjust their workforce according to need."Minijobs are ideal for people who want to work only a small numberof hours a week or a month," said Oliver Stettes, labor market expert atCologne Institute for Economic Research. They are attractive to
This copy is for your personal, non-commercial use only. To order presentation-ready copies for distribution to your colleagues, clients or customers visithttp://www.djreprints.com.
http://www.wsj.com/articles/SB10001424127887324682204578512782697519080
EUROPE
'Minijobs' Lift Employment But MaskGerman Weakness
Minijobs are attractive to retailers and restaurants, like those above, who must staff peak and lowperiods. DPA/ZUMA PRESS
May 29, 2013 5:08 p.m. ET
By JAMES ANGELOS and NINA ADAM
Mini-jobs are a form oflow-pay (< 400€), part-timeemployment that is not subjectto income taxation.
The Hartz reforms facilitatedthe creation of mini-jobs andincreased incentives forworkers to take them.
Carrillo-Tudela, Launov and Robin (
a)
University of Essex,
b)
University of Kent,
c)
Sciences Po & UCL)Mini-jobs CEP-IFS, 26-28/10/2017 4 / 33

Introduction
The rise of moonlighting with a mini-job
Yes, the stock of mini-jobs grew by 76.1% between 1999 and 2014.
Yes, by 2014 there were more workers who had a mini-job as primaryemployment than unemployed workers (7.4% vs 6.8% of the labourforce).
However, most of the increase in the number of mini-jobs isaccounted by multiple job-holding (moonlighting).
We argue that moonlighting is a form of “Uberisation” of theeconomy which helped some skilled workers to accept wagemoderation.
Carrillo-Tudela, Launov and Robin (
a)
University of Essex,
b)
University of Kent,
c)
Sciences Po & UCL)Mini-jobs CEP-IFS, 26-28/10/2017 5 / 33

Introduction
The Hartz reforms (in a nutshell)
Hartz I (1/1/2003) aims at deregulating temporary employment.Personal Service Agencies (PSAs) were introduced, which areprivately managed and funded by local employment agencies,implementing on-the-job training, and facilitating work for the elderly.
Hartz II (1/1/2003) reformed marginal employment (mini- andmidi-jobs) and o↵ered new start-up subsidy for the unemployed. Easyto create a mini-job via the Minijobzentrale.
Hartz III (1/1/2004) reorganized the Federal Employment Agencyand local employment o�ces.
Hartz IV (1/1/2005) reformed the unemployment and welfare benefitsystem completely, increasing the need for non-employed individualsto accept low-paying jobs.
Carrillo-Tudela, Launov and Robin (
a)
University of Essex,
b)
University of Kent,
c)
Sciences Po & UCL)Mini-jobs CEP-IFS, 26-28/10/2017 6 / 33
Introduction
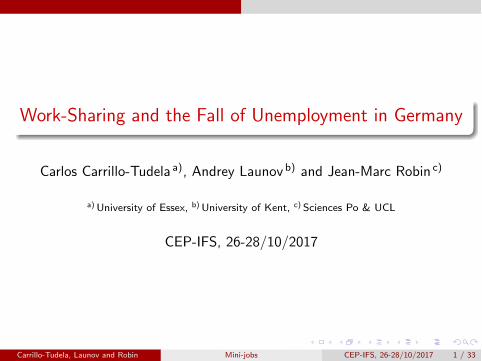
What can we learn from the German experience that couldbe useful, say to France?
Civilian labour force as % population 15-64 Unemployment rate Hours worked (millions)
Average hours worked per person employed GDP per hour worked Average annual wage (FT equivalent)
Source: OECD
Carrillo-Tudela, Launov and Robin (
a)
University of Essex,
b)
University of Kent,
c)
Sciences Po & UCL)Mini-jobs CEP-IFS, 26-28/10/2017 7 / 33

Introduction
Literature
On the role Hartz reforms on unemployment: Caliendo and Wrohlich(2010), Rinne and Zimmermann (2011, 2013), Fahr and Sunde(2009), Launov and Waelde (2012), Krause and Uhlig (2012), Krebsand Sche↵el (2013), Caliendo, Kunn and Uhlendor↵ (2016).
The role of part-time and marginal employment: Burda (2016),Burda and Seele (2016), Rothe and Walde (2016)
Carrillo-Tudela, Launov and Robin (
a)
University of Essex,
b)
University of Kent,
c)
Sciences Po & UCL)Mini-jobs CEP-IFS, 26-28/10/2017 8 / 33

THE MECHANISM OF UNEMPLOYMENTREDUCTION
The mechanism of unemployment reduction
Data
Sample of Integrated Labour Market Biographies (SIAB). 2%random sample from all registered (formal) employment and allactively seeking unemployed workers who receive unemploymentbenefits.
German Socio-Economic Panel (GSOEP)
Prime-aged workers between 25 and 54 years old.
Registered unemployment consists of those individuals who areregistered with the labour o�ce and have been actively searching fora job within the last 2 weeks irrespective of their benefit status.
Non-participants are those workers who are not in registeredunemployment or any form of registered employment (FT, PT orME). Non-participation = unregistered non-employment.
Carrillo-Tudela, Launov and Robin (
a)
University of Essex,
b)
University of Kent,
c)
Sciences Po & UCL)Mini-jobs CEP-IFS, 26-28/10/2017 10 / 33
The mechanism of unemployment reduction
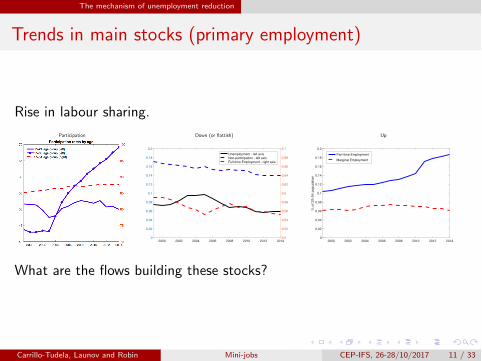
Trends in main stocks (primary employment)
Rise in labour sharing.
Participation Down (or flattish) Up
2000 2002 2004 2006 2008 2010 2012 20140
0.02
0.04
0.06
0.08
0.1
0.12
0.14
0.16
0.18
0.2
0.5
0.52
0.54
0.56
0.58
0.6
0.62
0.64
0.66
0.68
0.7
Unemployment - left axisNon-participation - left axisFull-time Employment - right axis
2000 2002 2004 2006 2008 2010 2012 20140
0.02
0.04
0.06
0.08
0.1
0.12
0.14
0.16
0.18
0.2
% o
f 25-5
4 p
opula
tion
Part-time Employment
Marginal Employment
What are the flows building these stocks?
Carrillo-Tudela, Launov and Robin (
a)
University of Essex,
b)
University of Kent,
c)
Sciences Po & UCL)Mini-jobs CEP-IFS, 26-28/10/2017 11 / 33

The mechanism of unemployment reduction
The ins and outs of unemployment (average monthly flows)
The unemployment rate decreased because many unemployed individualsstopped being registered as unemployed.
Inflows Outflows Inflows - Outflows
1999 2002 2005 2008 2011 20140
50
100
150
200
250
300
350
Th
ou
san
ds
from FT
from PT
from ME
from Nonparticipation
1999 2002 2005 2008 2011 20140
50
100
150
200
250
300
350
Th
ou
san
ds
to FT
to PT
to ME
to Nonparticipation
1999 2002 2005 2008 2011 2014−50
−40
−30
−20
−10
0
10
20
30
40
50
Th
ou
san
ds
FT
PT
ME
Nonparticipation
Carrillo-Tudela, Launov and Robin (
a)
University of Essex,
b)
University of Kent,
c)
Sciences Po & UCL)Mini-jobs CEP-IFS, 26-28/10/2017 12 / 33
The mechanism of unemployment reduction
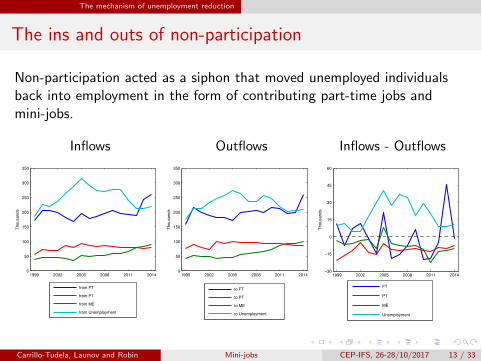
The ins and outs of non-participation
Non-participation acted as a siphon that moved unemployed individualsback into employment in the form of contributing part-time jobs andmini-jobs.
Inflows Outflows Inflows - Outflows
1999 2002 2005 2008 2011 20140
50
100
150
200
250
300
350
Th
ou
san
ds
from FT
from PT
from ME
from Unemployment
1999 2002 2005 2008 2011 20140
50
100
150
200
250
300
350T
ho
usa
nd
s
to FT
to PT
to ME
to Unemployment
1999 2002 2005 2008 2011 2014−30
−15
0
15
30
45
60
Th
ou
san
ds
FT
PT
ME
Unemployment
Carrillo-Tudela, Launov and Robin (
a)
University of Essex,
b)
University of Kent,
c)
Sciences Po & UCL)Mini-jobs CEP-IFS, 26-28/10/2017 13 / 33

The mechanism of unemployment reduction
The ins and outs of marginal employment
The vast majority of exclusive mini-jobbers churn betweennon-participation and marginal employment.
ME = stepping stone to contributing employment
Inflows Outflows Inflows - Outflows
1999 2002 2005 2008 2011 20140
20
40
60
80
100
120
Th
ou
san
ds
from FT
from PT
from Unemployment
from Nonparticipation
1999 2002 2005 2008 2011 20140
20
40
60
80
100
120
Th
ou
san
ds
to FT
to PT
to Unemployment
to Nonparticipation
1999 2002 2005 2008 2011 2014−25
−20
−15
−10
−5
0
5
10
15
20
25
Th
ou
san
ds
FT
PT
Unemployment
Nonparticipation
Carrillo-Tudela, Launov and Robin (
a)
University of Essex,
b)
University of Kent,
c)
Sciences Po & UCL)Mini-jobs CEP-IFS, 26-28/10/2017 14 / 33

The mechanism of unemployment reduction
The ins and outs of contributing part-time employment
Main net contributors are non-participants and mini-jobbers
Net outflow to unemployment
Inflows Outflows Inflows - Outflows
1999 2002 2005 2008 2011 20140
20
40
60
80
100
120
Th
ou
san
ds
from FT
from ME
from Unemployment
from Nonparticipation
1999 2002 2005 2008 2011 20140
20
40
60
80
100
120T
ho
usa
nd
s
to FT
to ME
to Unemployment
to Nonparticipation
1999 2002 2005 2008 2011 2014−15
0
15
30
45
60
Th
ou
san
ds
FT
ME
Unemployment
Nonparticipation
Carrillo-Tudela, Launov and Robin (
a)
University of Essex,
b)
University of Kent,
c)
Sciences Po & UCL)Mini-jobs CEP-IFS, 26-28/10/2017 15 / 33
The mechanism of unemployment reduction
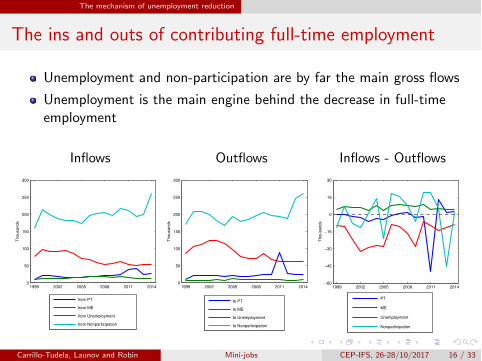
The ins and outs of contributing full-time employment
Unemployment and non-participation are by far the main gross flows
Unemployment is the main engine behind the decrease in full-timeemployment
Inflows Outflows Inflows - Outflows
1999 2002 2005 2008 2011 20140
50
100
150
200
250
300
Th
ou
san
ds
from PT
from ME
from Unemployment
from Nonparticipation
1999 2002 2005 2008 2011 20140
50
100
150
200
250
300
Th
ou
san
ds
to PT
to ME
to Unemployment
to Nonparticipation
1999 2002 2005 2008 2011 2014−60
−45
−30
−15
0
15
30
Th
ou
san
ds
PT
ME
Unemployment
Nonparticipation
Carrillo-Tudela, Launov and Robin (
a)
University of Essex,
b)
University of Kent,
c)
Sciences Po & UCL)Mini-jobs CEP-IFS, 26-28/10/2017 16 / 33

The mechanism of unemployment reduction
How well do flows determine the evolution of the stocks?
1999 2002 2005 2008 2011 20140.45
0.5
0.55
0.6
0.65
1999 2002 2005 2008 2011 20140.1
0.15
0.2
0.25
0.3
1999 2002 2005 2008 2011 20140
0.05
0.1
0.15
1999 2002 2005 2008 2011 20140
0.05
0.1
0.15
1999 2002 2005 2008 2011 20140.05
0.1
0.15
0.2
FT
FT (stocks)
PT
PT (stocks)
ME
ME (stocks)
Unemployment
Unempl. (stocks)
Nonparticipation
Nonpart. (stocks)
Compare actual stocks toequilibrium stockscalculated from transitionprobabilities (i.e. take theflows for each year andcalculate the limit stocks)
The fit is good because netflows are small compared togross flows.
Carrillo-Tudela, Launov and Robin (
a)
University of Essex,
b)
University of Kent,
c)
Sciences Po & UCL)Mini-jobs CEP-IFS, 26-28/10/2017 17 / 33

THE EXPANSION OF MARGINALEMPLOYMENT

The expansion of marginal employment
The rise in the stock of mini-jobs
The strong increase in the overall stock of mini-jobs occurred afterHartz II, increasing from 1.98 million in 2002 to 3.14 million in 2004.By 2014 there were about 3.54 million mini-job contracts in Germany,but only about 2 million workers had a mini-job as primaryemployment.
Primary jobs All contracts
1999 2002 2005 2008 2011 20140.65
0.7
0.75
0.8
0.05
0.1
0.15
0.2
0.25
Full−time (left)Part−time (right)
Marginal (right)
1999 2002 2005 2008 2011 2014
0.65
0.7
0.75
0.05
0.1
0.15
0.2
0.25
Full−time (left)Part−time (right)
Marginal (right)
Carrillo-Tudela, Launov and Robin (
a)
University of Essex,
b)
University of Kent,
c)
Sciences Po & UCL)Mini-jobs CEP-IFS, 26-28/10/2017 19 / 33
The expansion of marginal employment
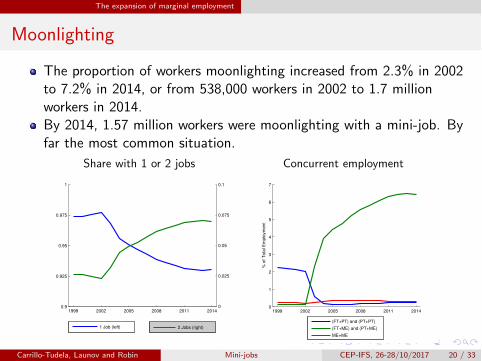
Moonlighting
The proportion of workers moonlighting increased from 2.3% in 2002to 7.2% in 2014, or from 538,000 workers in 2002 to 1.7 millionworkers in 2014.By 2014, 1.57 million workers were moonlighting with a mini-job. Byfar the most common situation.
Share with 1 or 2 jobs Concurrent employment
1999 2002 2005 2008 2011 20140.9
0.925
0.95
0.975
1
0
0.025
0.05
0.075
0.1
1 Job (left) 2 Jobs (right)
1999 2002 2005 2008 2011 20140
1
2
3
4
5
6
7
% o
f T
ota
l Em
plo
yme
nt
(FT+PT) and (PT+PT)
(FT+ME) and (PT+ME)
ME+ME
Carrillo-Tudela, Launov and Robin (
a)
University of Essex,
b)
University of Kent,
c)
Sciences Po & UCL)Mini-jobs CEP-IFS, 26-28/10/2017 20 / 33
The expansion of marginal employment
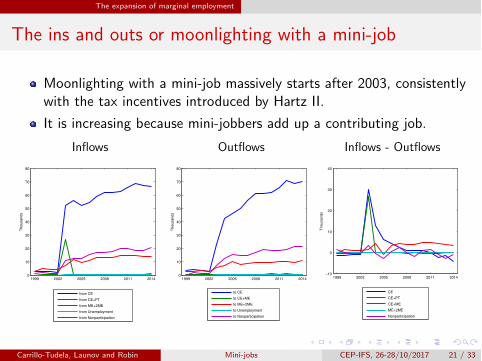
The ins and outs or moonlighting with a mini-job
Moonlighting with a mini-job massively starts after 2003, consistentlywith the tax incentives introduced by Hartz II.
It is increasing because mini-jobbers add up a contributing job.
Inflows Outflows Inflows - Outflows
1999 2002 2005 2008 2011 20140
10
20
30
40
50
60
70
80
Th
ou
san
ds
from CE
from CE+PT
from ME+2ME
from Unemployment
from Nonparticipation
1999 2002 2005 2008 2011 20140
10
20
30
40
50
60
70
80T
ho
usa
nd
s
to CE
to CE+ME
to ME+2ME
to Unemployment
to Nonparticipation
1999 2002 2005 2008 2011 2014−10
0
10
20
30
40
Th
ou
san
ds
CE
CE+PT
CE+ME
ME+2ME
Nonparticipation
Carrillo-Tudela, Launov and Robin (
a)
University of Essex,
b)
University of Kent,
c)
Sciences Po & UCL)Mini-jobs CEP-IFS, 26-28/10/2017 21 / 33
The expansion of marginal employment
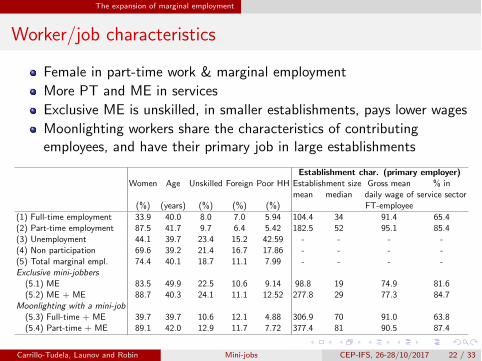
Worker/job characteristics
Female in part-time work & marginal employmentMore PT and ME in servicesExclusive ME is unskilled, in smaller establishments, pays lower wagesMoonlighting workers share the characteristics of contributingemployees, and have their primary job in large establishments
Establishment char. (primary employer)Women Age Unskilled Foreign Poor HH Establishment size Gross mean % in
mean median daily wage of service sector(%) (years) (%) (%) (%) FT-employee
(1) Full-time employment 33.9 40.0 8.0 7.0 5.94 104.4 34 91.4 65.4(2) Part-time employment 87.5 41.7 9.7 6.4 5.42 182.5 52 95.1 85.4(3) Unemployment 44.1 39.7 23.4 15.2 42.59 - - - -(4) Non participation 69.6 39.2 21.4 16.7 17.86 - - - -(5) Total marginal empl. 74.4 40.1 18.7 11.1 7.99 - - - -Exclusive mini-jobbers
(5.1) ME 83.5 49.9 22.5 10.6 9.14 98.8 19 74.9 81.6(5.2) ME + ME 88.7 40.3 24.1 11.1 12.52 277.8 29 77.3 84.7
Moonlighting with a mini-job
(5.3) Full-time + ME 39.7 39.7 10.6 12.1 4.88 306.9 70 91.0 63.8(5.4) Part-time + ME 89.1 42.0 12.9 11.7 7.72 377.4 81 90.5 87.4
Carrillo-Tudela, Launov and Robin (
a)
University of Essex,
b)
University of Kent,
c)
Sciences Po & UCL)Mini-jobs CEP-IFS, 26-28/10/2017 22 / 33
The expansion of marginal employment
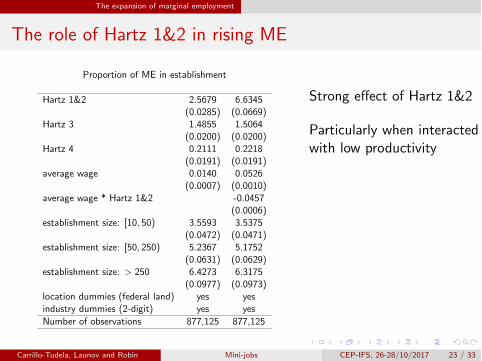
The role of Hartz 1&2 in rising ME
Proportion of ME in establishment
Hartz 1&2 2.5679 6.6345(0.0285) (0.0669)
Hartz 3 1.4855 1.5064(0.0200) (0.0200)
Hartz 4 0.2111 0.2218(0.0191) (0.0191)
average wage 0.0140 0.0526(0.0007) (0.0010)
average wage * Hartz 1&2 -0.0457(0.0006)
establishment size: [10, 50) 3.5593 3.5375(0.0472) (0.0471)
establishment size: [50, 250) 5.2367 5.1752(0.0631) (0.0629)
establishment size: > 250 6.4273 6.3175(0.0977) (0.0973)
location dummies (federal land) yes yesindustry dummies (2-digit) yes yesNumber of observations 877,125 877,125
Strong e↵ect of Hartz 1&2
Particularly when interactedwith low productivity
Carrillo-Tudela, Launov and Robin (
a)
University of Essex,
b)
University of Kent,
c)
Sciences Po & UCL)Mini-jobs CEP-IFS, 26-28/10/2017 23 / 33
The expansion of marginal employment
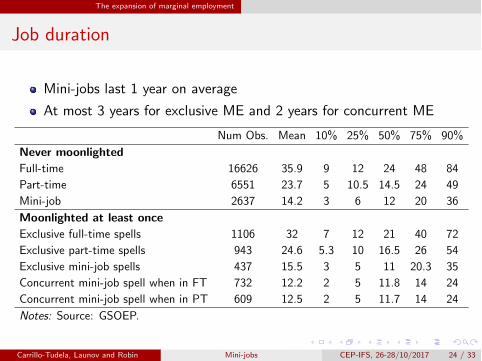
Job duration
Mini-jobs last 1 year on average
At most 3 years for exclusive ME and 2 years for concurrent ME
Num Obs. Mean 10% 25% 50% 75% 90%
Never moonlightedFull-time 16626 35.9 9 12 24 48 84
Part-time 6551 23.7 5 10.5 14.5 24 49
Mini-job 2637 14.2 3 6 12 20 36
Moonlighted at least onceExclusive full-time spells 1106 32 7 12 21 40 72
Exclusive part-time spells 943 24.6 5.3 10 16.5 26 54
Exclusive mini-job spells 437 15.5 3 5 11 20.3 35
Concurrent mini-job spell when in FT 732 12.2 2 5 11.8 14 24
Concurrent mini-job spell when in PT 609 12.5 2 5 11.7 14 24
Notes: Source: GSOEP.
Carrillo-Tudela, Launov and Robin (
a)
University of Essex,
b)
University of Kent,
c)
Sciences Po & UCL)Mini-jobs CEP-IFS, 26-28/10/2017 24 / 33

The expansion of marginal employment
Hours
Clear ranking
PT pushed up a bit
Full-time Part-time Mini-jobs
2000 2002 2004 2006 2008 2010 2012 20140
10
20
30
40
50
60
We
ekl
y h
ou
rs
Mean
P90
P50
P10
2000 2002 2004 2006 2008 2010 2012 20140
10
20
30
40
50
60
We
ekl
y h
ou
rsMean
P90
P50
P10
2000 2002 2004 2006 2008 2010 2012 20140
10
20
30
40
50
60
We
ekl
y h
ou
rs
Mean
P90
P50
P10
Carrillo-Tudela, Launov and Robin (
a)
University of Essex,
b)
University of Kent,
c)
Sciences Po & UCL)Mini-jobs CEP-IFS, 26-28/10/2017 25 / 33

The expansion of marginal employment
Hourly wages
Downward trend until 2008
More pronounced for PT and mini-jobs
2000 2002 2004 2006 2008 2010 2012 20140
5
10
15
20
25
30
35
40
Hourly
wages
Full-time
MeanP90P50P10
2000 2002 2004 2006 2008 2010 2012 20140
5
10
15
20
25
30
35
40
Hourly
wages
Part-time
MeanP90P50P10
2000 2002 2004 2006 2008 2010 2012 20140
5
10
15
20
25
30
35
40
Hourly
wages
Mini-jobs
MeanP90P50P10
Carrillo-Tudela, Launov and Robin (
a)
University of Essex,
b)
University of Kent,
c)
Sciences Po & UCL)Mini-jobs CEP-IFS, 26-28/10/2017 26 / 33

The expansion of marginal employment
Earnings inequality
Strong increase of earnings inequality at the bottom parallel to the rise ofPT & ME
Primary earnings Total earnings
1999 2002 2005 2008 2011 20141
2
3
4
5
6
7
8
9
10
11
P50/P10
P85/P50
P85/P10
1999 2002 2005 2008 2011 20141
2
3
4
5
6
7
8
9
10
11
P50/P10
P85/P50
P85/P10
Carrillo-Tudela, Launov and Robin (
a)
University of Essex,
b)
University of Kent,
c)
Sciences Po & UCL)Mini-jobs CEP-IFS, 26-28/10/2017 27 / 33
The expansion of marginal employment
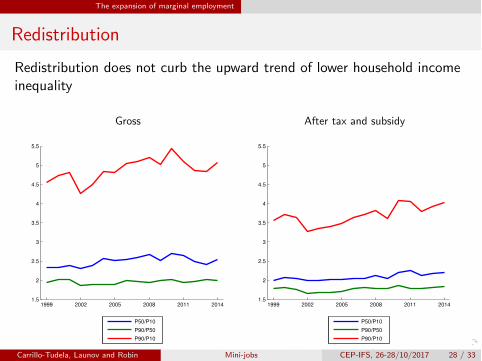
Redistribution
Redistribution does not curb the upward trend of lower household incomeinequality
Gross After tax and subsidy
1999 2002 2005 2008 2011 20141.5
2
2.5
3
3.5
4
4.5
5
5.5
P50/P10
P90/P50
P90/P10
1999 2002 2005 2008 2011 20141.5
2
2.5
3
3.5
4
4.5
5
5.5
P50/P10
P90/P50
P90/P10
Carrillo-Tudela, Launov and Robin (
a)
University of Essex,
b)
University of Kent,
c)
Sciences Po & UCL)Mini-jobs CEP-IFS, 26-28/10/2017 28 / 33
The expansion of marginal employment
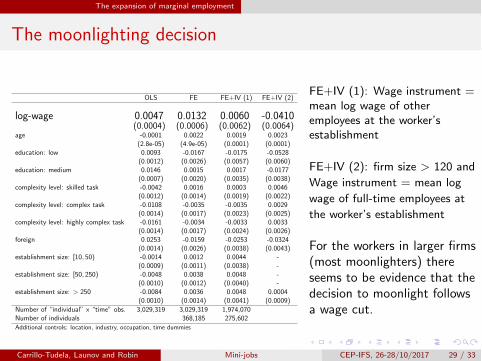
The moonlighting decision
OLS FE FE+IV (1) FE+IV (2)
log-wage 0.0047 0.0132 0.0060 -0.0410(0.0004) (0.0006) (0.0062) (0.0064)
age -0.0001 0.0022 0.0019 0.0023(2.8e-05) (4.9e-05) (0.0001) (0.0001)
education: low 0.0093 -0.0167 -0.0175 -0.0528(0.0012) (0.0026) (0.0057) (0.0060)
education: medium 0.0146 0.0015 0.0017 -0.0177(0.0007) (0.0020) (0.0035) (0.0038)
complexity level: skilled task -0.0042 0.0016 0.0003 0.0046(0.0012) (0.0014) (0.0019) (0.0022)
complexity level: complex task -0.0108 -0.0035 -0.0035 0.0029(0.0014) (0.0017) (0.0023) (0.0025)
complexity level: highly complex task -0.0161 -0.0034 -0.0033 0.0033(0.0014) (0.0017) (0.0024) (0.0026)
foreign 0.0253 -0.0159 -0.0253 -0.0324(0.0014) (0.0026) (0.0038) (0.0043)
establishment size: [10, 50) -0.0014 0.0012 0.0044 -(0.0009) (0.0011) (0.0038) -
establishment size: [50, 250) -0.0048 0.0038 0.0048 -(0.0010) (0.0012) (0.0040) -
establishment size: > 250 -0.0084 0.0036 0.0048 0.0004(0.0010) (0.0014) (0.0041) (0.0009)
Number of “individual” x “time” obs. 3,029,319 3,029,319 1,974,070Number of individuals 368,185 275,602Additional controls: location, industry, occupation, time dummies
FE+IV (1): Wage instrument =
mean log wage of other
employees at the worker’s
establishment
FE+IV (2): firm size > 120 and
Wage instrument = mean log
wage of full-time employees at
the worker’s establishment
For the workers in larger firms(most moonlighters) thereseems to be evidence that thedecision to moonlight followsa wage cut.
Carrillo-Tudela, Launov and Robin (
a)
University of Essex,
b)
University of Kent,
c)
Sciences Po & UCL)Mini-jobs CEP-IFS, 26-28/10/2017 29 / 33
The expansion of marginal employment
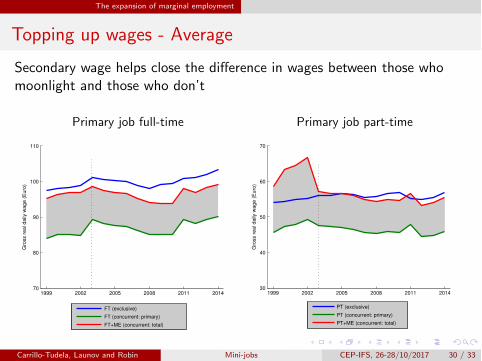
Topping up wages - Average
Secondary wage helps close the di↵erence in wages between those whomoonlight and those who don’t
Primary job full-time Primary job part-time
1999 2002 2005 2008 2011 201470
80
90
100
110
Gro
ss r
eal d
aily
wage (
Euro
)
FT (exclusive)
FT (concurrent: primary)
FT+ME (concurrent: total)
1999 2002 2005 2008 2011 201430
40
50
60
70
Gro
ss r
eal d
aily
wage (
Euro
)
PT (exclusive)
PT (concurrent: primary)
PT+ME (concurrent: total)
Carrillo-Tudela, Launov and Robin (
a)
University of Essex,
b)
University of Kent,
c)
Sciences Po & UCL)Mini-jobs CEP-IFS, 26-28/10/2017 30 / 33

The expansion of marginal employment
Topping up wages - Conditional
Moonlighting does increase total earnings.
Full-time Part-timeOLS FE OLS FE
moonlighting 0.0068 0.0442 0.1070 0.1384(0.0025) (0.0018) (0.0044) (0.0153)
age 0.0063 0.0079 0.0075 0.0153(0.0001) (6.4e-05) (0.0002) (0.0002)
education: low -0.2825 -0.1489 -0.2217 -0.2056(0.0028) (0.0049) (0.0073) (0.0155)
education: medium -0.1743 -0.0949 -0.1677 -0.1388(0.0018) (0.0033) (0.0053) (0.0120)
complexity level: skilled task 0.1768 0.0431 0.1730 0.0423(0.0028) (0.0020) (0.0053) (0.0050)
complexity level: complex task 0.3582 0.0875 0.2693 0.0590(0.0033) (0.0023) (0.0077) (0.0072)
complexity level: highly complex task 0.4000 0.0892 0.3489 0.0907(0.0034) (0.0025) (0.0077) (0.0078)
foreign -0.0348 -0.0026 0.0142 0.0219(0.0023) (0.0030) (0.0063) (0.0085)
establishment size: [10, 50) 0.1984 0.0640 0.2258 0.0579(0.0027) (0.0019) (0.0074) (0.0057)
establishment size: [50, 250) 0.2980 0.1048 0.3097 0.0845(0.0027) (0.0022) (0.0074) (0.0070)
establishment size: > 250 0.4009 0.1410 0.3763 0.1074(0.0027) (0.0024) (0.0074) (0.0078)
Number of “individual” x “time” obs. 2,318,491 2,318,491 541,987 541,987Number of individuals 302,327 103,001
Carrillo-Tudela, Launov and Robin (
a)
University of Essex,
b)
University of Kent,
c)
Sciences Po & UCL)Mini-jobs CEP-IFS, 26-28/10/2017 31 / 33

CONCLUSION

Conclusion
Conclusion
We try to present some evidence that the Hartz reforms had animpact on the economy.
By forcing more unemployed into non-participation, they madenon-employed workers more willing to accept part-time jobs, manylow-paid.
There is also evidence that the incentives to top up a mini-job werewelcome in the context of wage moderation.
Carrillo-Tudela, Launov and Robin (
a)
University of Essex,
b)
University of Kent,
c)
Sciences Po & UCL)Mini-jobs CEP-IFS, 26-28/10/2017 33 / 33