Embed Size (px)
DESCRIPTION
This work term report was written for the University of Waterloo Department of Civil and Environmental Engineering as required after one of my work terms. It is based on a portion of my work during an internship at SNC-Lavalin Inc. in Toronto. The report focuses on an evaluation of product alternatives for erosion and sediment control. The products in question are filter socks to be used as check dams in roadside drainage ditches.
Citation preview

An Evaluation of Filter Sock Check Dams
in Drainage Ditches for the Proposed Stark Avenue
Road Widening and Reconstruction Project
SNC-Lavalin Inc.
By ANJIE LIU 3A Civil Engineering
January 2015

20 Keewaydin St. Waterdown ON L0R 2H6 January 13, 2015 Dr. Jeffrey West Associate Chair, Undergraduate Studies Department of Civil and Environmental Engineering University of Waterloo Waterloo ON N2L 3G1 Dear Dr. West: This report, entitled "An Evaluation of Filter Sock Check Dams in Drainage Ditches for the Proposed Stark Avenue Widening and Reconstruction Project," was prepared as my 3A Work Report. This report was written to provide a comparison between different products available to be used as check dams for road drainage ditches. Of the three reports required by the Department of Civil and Environmental Engineering at the University of Waterloo, this report is my first. SNC-Lavalin is an engineering consulting firm with its head office located in Montreal. My work placement took place at the Toronto location, in Etobicoke. Services provided by the firm ranges from engineering design to construction and project management. My work placement in the transportation division involved me in municipal projects across the Greater Toronto Area, supervised by senior project manager Sunil Kothari. The name of the project road, Stark Avenue, has been changed to maintain confidentiality. This report was written solely by me and has not received academic credit at any academic institution. I would like to thank my co-workers for their advice and assistance in writing this report. I received no further help. Sincerely, Anjie Liu ID# 20 377 899

1
An Evaluation of Filter Sock Check Dams in Drainage Ditches for the
Proposed Stark Avenue Widening and Reconstruction Project
SNC-Lavalin Inc.
By Anjie Liu
3A Civil Engineering
January 2015
2
Summary In the proposed road widening and reconstruction project of Stark Avenue, the grading adjacent to the road must be completely reconstructed. This includes the construction of new drainage ditches which lead into two creeks. To mitigate the impacts of the storm water run-off on the water quality of the creeks, check dams constructed along the ditches using filter socks are proposed. The alternatives considered are products provided by Filtrexx, a company specialising in erosion and sediment control practices.
Filter socks of four different diameters are assessed in this study. Their diameters are 200 mm, 300 mm, 450 mm and 600 mm. Each size must be placed along the ditches according to different spacing requirements. The spacing requirements are provided by the design guidelines created by Filtrexx for this specific product for its application as check dams.
Each filter sock size option also poses different cost and performance characteristics. The cost assessment is based on published data from past experiences of using this product. The performance characteristics are assessed in terms of ditch flow filtration capacity and velocity reduction. To compare the alternatives, their results for each of the cost and environmental criterion are assigned a score and totalled for an overall comparison.
The recommended option is the 300 mm filter sock as it is the most cost efficient and has the greatest water filtration capacity. This option also has a higher performance than the average of the options in terms of flow velocity reduction.

3
TABLE OF CONTENTS Summary ...................................................................................................................................... 2 LIST OF TABLES ...................................................................................................................... 4 LIST OF FIGURES ..................................................................................................................... 4 LIST OF APPENDICES ............................................................................................................. 4 1.0 Introduction ...................................................................................................................... 5
1.1 Existing Conditions ....................................................................................................... 5 1.2 Proposed Project Design ............................................................................................... 5 1.3 Purpose and Scope of Study ......................................................................................... 7
2.0 Filtrexx Check Dams ........................................................................................................ 7 2.1 Check Dam Options ...................................................................................................... 9 2.2 Product Advantages .................................................................................................... 10 2.3 Product Disadvantages ................................................................................................ 11
3.0 Check Dam Design and Analysis ................................................................................... 12 3.1 Quantities .................................................................................................................... 13 3.2 Cost ............................................................................................................................. 16 3.3 Environmental Considerations .................................................................................... 18
3.3.1 Quantitative Considerations ................................................................................ 19 3.3.2 Qualitative Considerations .................................................................................. 20
3.4 Options Evaluation ..................................................................................................... 23 4.0 Conclusion ...................................................................................................................... 25 References ................................................................................................................................. 28

4
LIST OF TABLES Table 1 Quantities and Costs of Filter Sock Check Dams ....................................................... 18 Table 2 Filtering Capacities of the Filter Sock Alternatives .................................................... 20 Table 3 Cross-Sectional Area Filter Coverage ......................................................................... 21 Table 4 Decision Matrix for Evaluating the Filter Sock Options .............................................. 25
LIST OF FIGURES Figure 1 Filtrexx Check Dam (Filtrexx, p. web) ........................................................................ 8 Figure 2 Filtrexx Check Dam Design Specification Drawing (Filtrexx) ................................... 9 Figure 3 Check Dam Spacing Requirements (Filtrexx) ........................................................... 10 Figure 4 Typical Ditch Cross-Section ...................................................................................... 16 Figure 5 Cost Extrapolation for 600 mm Filter Sock ............................................................... 17 Figure 6 Ditch Cross-Sections for Each Filter Sock Size ......................................................... 22
LIST OF APPENDICES APPENDIX A - Plans and Profiles of Check Dam Placements ................................................ 29 APPENDIX B - Sample Calculations ....................................................................................... 37

5
1.0 Introduction Stark Avenue is a regional road in the Greater Golden Horseshoe Area. The Stark Avenue project involves the detailed design for the reconstruction and widening of Stark Avenue. The purpose of the proposed design is to meet the projected increase in traffic needs. The project site is located along Stark Avenue for a length of approximately 3.26 kilometres (km). Stark Avenue crosses two creeks within the project limits. This study investigates the use of filter socks available from Filtrexx as check dams for the drainage ditches adjacent to the road.
1.1 Existing Conditions The existing Stark Avenue within the project limits consists of a two lane rural road without sidewalks. The gravel shoulder varies in width. There are significant sections of the current road that are without curb and gutter.
The adjacent properties north and south of the road are predominantly green field. However, proposed residential developments are in the process of construction.
1.2 Proposed Project Design The proposed Stark Avenue will consist of an urban area and a rural area. In the urban area, the proposed road is a four lane urban road with boulevards, sidewalks and signalized

6
intersections. In the rural area, the proposed road is a re-pavement of the existing two lane road.
The detailed design for the proposed Stark Avenue includes the design for new storm sewers, a drainage system, the road and pavement structure, a new bridge for each creek crossing as well as the extension and addition of several culverts. The realignment of Wayne Creek is also part of the proposed design.
Due to the significant changes proposed to the existing infrastructure, the existing grading will be altered substantially. In the proposed design of Stark Avenue, the majority of the storm water runoff will drain into the two creeks crossing the road. The two creeks subsequently lead into a river connected directly to the local conservation body of water. The proposed grading will require sufficient erosion and sediment control to mitigate pollution carried into the waterways by storm water runoff.
In the design of the proposed road, ditches have been placed on both the north and south side of the road along certain portions of the road. The majority of the ditches have been placed along Stark Avenue where the land adjacent to the road will not be developed when the proposed road will be constructed. For portions where the land adjacent to the road will be developed, the grade of the edge of the proposed road boulevard will meet the grade of the developed land; thus no ditches are proposed at these locations.

7
1.3 Purpose and Scope of Study The majority of the storm water from the road pavement would drain into the storm sewers under the road, which will carry the storm water to outlets that release the water into the drainage ditches along the road. The runoff in the ditches along Stark Avenue will drain into two creeks and private lands. A minor portion of the road pavement runoff will drain into catch basins connected to existing storm sewers that lead outside the project limits. To mitigate the adverse effects of storm water runoff on the environment, erosion and sediment control methods must be implemented along the length of the ditches.
One of the necessary measures is to implement check dams along the ditches to reduce the erosion in the ditches and the quantity of sediments carried away by the ditch flow. The client, which is the local regional municipality, has specified Filtrexx products to be used. This study compares the effectiveness of different products available for implementation as check dams along the ditches. The products and their implementation are evaluated from an economic and environmental point of view.
2.0 Filtrexx Check Dams Filtrexx Check Dams (Figure 1) are a product application created by Filtrexx, a company specialised in erosion and sediment control. Filtrexx Check Dams are created by using sections of the Filtrexx product Siltsoxx. Siltsoxx is a filter sock product composed of coarse composted materials contained in a tubular mesh. The contents of the composted materials are

8
designed for the removal of solids and soluble pollutants from storm water runoff. The composted material is a specified mix that Filtrexx refers to as FilterMedia. According to Filtrexx, the product is designed to be used in storm water drainage ditches and small channels for the purposes of slowing directional flow velocity, reducing gully erosion and removing sediment and soluble pollutants from storm water runoff. Filtrexx Check Dams last between 2 to 5 years, depending on “UV exposure, freeze/thaw frequency, region of US/Canada, runoff-sediment frequency/duration/loading, and adherence to specified maintenance requirement” (Filtrexx).
Figure 1 Filtrexx Check Dam (Filtrexx, p. web)
To implement the product, the tubular mesh of FilterMedia is placed in a curve across drainage ditches at certain intervals along the ditch. The curve is placed horizontal to the direction of the ditch flow with the concave side of the curve facing upstream. The check dam is held in place by wooden stakes driven through the check dam into the ground. Figure 2 illustrates the product and its installation.

9
Figure 2 Filtrexx Check Dam Design Specification Drawing (Filtrexx) 2.1 Check Dam Options Filtrexx Check Dams are available in a variety of sizes, measured by the diameter of the tubular mesh and the length of the tube. The product can be purchased in standards diameters in tubes of up to 100 feet (30 m) long. The available diameter sizes investigated in this report are the 8-inch (200 mm), 12-inch (300 mm), 18-inch (450 mm) and 24-inch (600 mm) diameters. Using different sizes poses different design considerations and consequences. As summarized in the Filtrexx Design Manual, “Spacing check dams closer together will reduce

10
flow velocity and bed erosion, while higher check dams will remove more sediment from storm flows” (Filtrexx).
Figure 3 provides the requirements for spacing Filtrexx Check Dams according to their size.
Figure 3 Check Dam Spacing Requirements (Filtrexx)
2.2 Product Advantages Filtrexx filter socks were selected for its advantages of filtering and deposition capabilities as well as ease of installation. FilterMedia contains organic matter which adsorbs and binds metals, phosphorus, nitrates and hydrocarbons. “FilterMedia can be altered or customized to

11
target specific pollutants in runoff as approved by the Engineer or Filtrexx® International,” according to the Filtrexx Design Manual (Filtrexx). The Filtrexx Design Manual contains tabulated details for the percentage of pollutant that can be removed, including data for turbidity reduction and the removal of phosphorus, nitrates, ammonium, petroleum fuels and various metals. Furthermore, they can be directly seeded during installation to increase their filtration capabilities and stability as time passes (Filtrexx).
In addition to filtering benefits, Filtrexx filter socks incur minimal labour fees. Installations of Filtrexx filter socks do not require trenching or soil disturbance. Also, the filter socks do not need to be removed because the filter sock meshes are either biodegradable or photodegradable. Over time, they become part of the landscape.
2.3 Product Disadvantages There are logistical issues that apply to the usage of Filtrexx products due to its specificity as certified Filtrexx products. Choosing Filtrexx products require thorough and early preparation to ensure that the design can be implemented according to plan.
Since Filtrexx Siltsoxx is a specialized product line, they are not as readily available as materials for other methods of settling control practices such as sediment traps and rock check dams. Sediment traps and rock check dams are constructed from earth and granular material respectively (Greater Golden Horseshoe Area Conservation Authorities, 2006). These materials can often be found on site while Filtrexx products need to be ordered and shipped

12
from the manufacturer. This not only requires additional preparation and planning, but creates external environmental effects due to manufacturing and transportation.
Filtrexx products must be installed by a certified Filtrexx contractor (Filtrexx). This may limit the contractors available to carry out the site work. If the general contractor is not able to install the Filtrexx check dams and additional contractors or sub-contractors are required to perform the installation, additional administrative fees may occur. Potential cost increases associated with meeting Filtrexx certification requirements is dependent on the contractors available.
3.0 Check Dam Design and Analysis In compliance with the Filtrexx Design Manual, the check dam placements along the drainage ditches are spaced according to the slope of the ditch flow and follow the corresponding requirements for each check dam size.
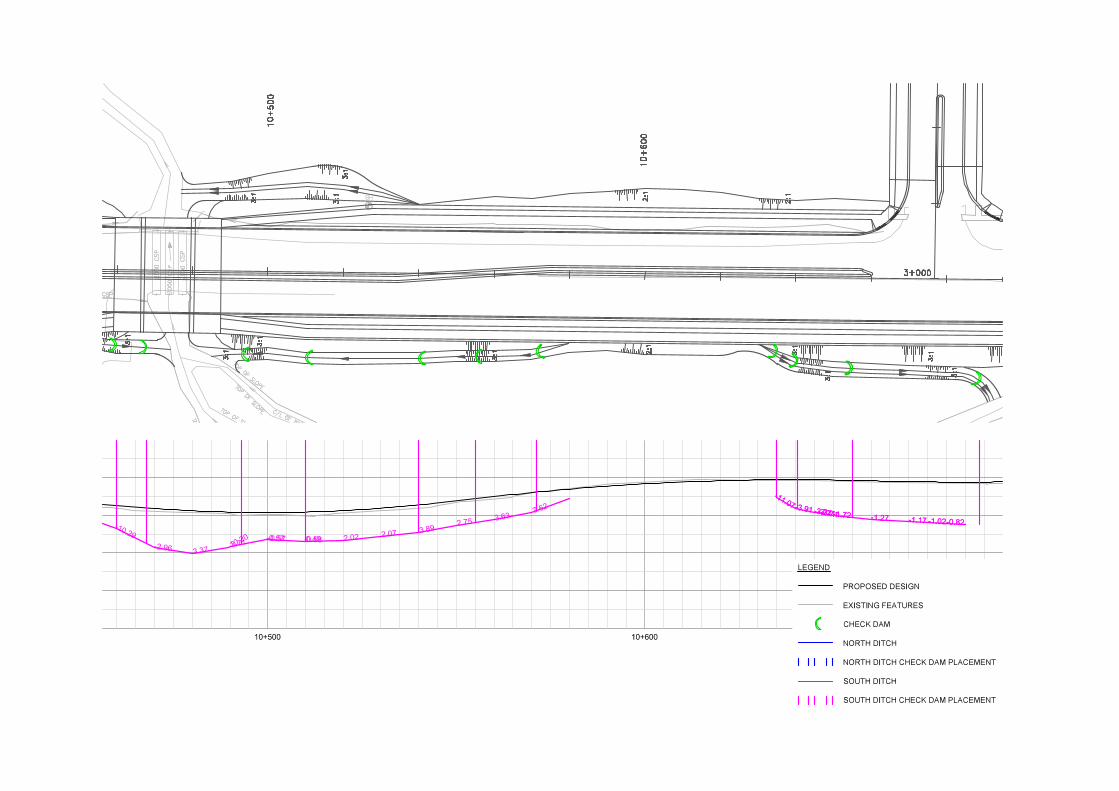
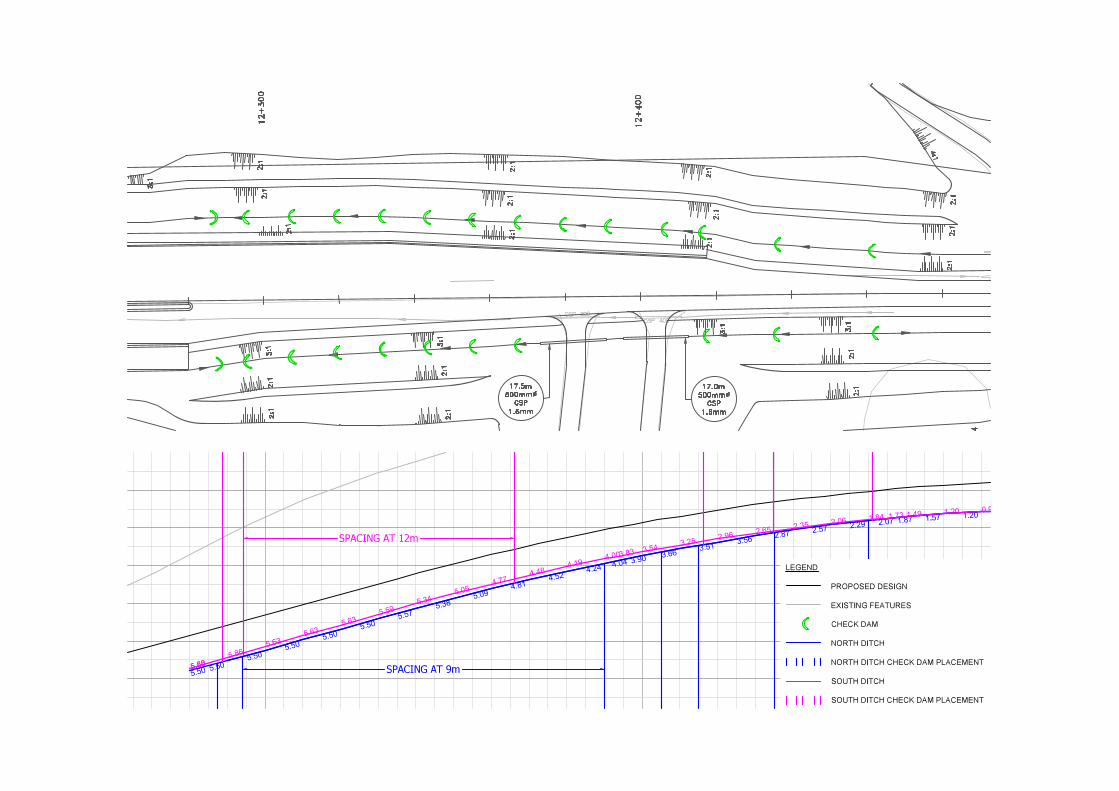
The general placement is designed using computer aided design software. The road geometry was designed using the software InRoads by Bentley. The components of the road geometry designed in InRoads include the horizontal alignments and vertical profiles of the ditches. By using InRoads to output line work into an AutoCAD drawing, the bottom of the ditches are drawn in a profile view along the length of the road (Appendix A). The ditch alignments are separated into two groups: the ditches north of the road and the ditches south of the road. In addition, InRoads was used to output labels for the ditch profile drawings. These labels

13
include the ditch slopes measured in percentages. Using the AutoCAD profile drawing created through InRoads, slopes along the ditches can be identified.
The ditches are separated into portions according to their slopes. Then, the spacing requirement for the maximum slope within each portion is applied to the entire portion. In the Filtrexx Design Manual spacing chart (Figure 3), the relationship between the recommended spacing and the ditch slope is a decreasing exponential relationship. Thus, the spacing recommendation differs less as the ditch slope becomes steeper. Consequently, for the ditch portions where the slope is steeper, a wider range of ditch slopes are grouped together since their spacing requirements are approximately equal.
For portions of the ditch where only one check dam fits along the length of the ditch according to the spacing requirement, a check dam is simply placed on the downstream end of the ditch portion. Appendix A contains the drawings indicating where the ditches were broken into portions and the locations where single check dams are placed. After the check dam placements have been determined, the placements are drawn in plan view onto the road design drawing. Appendix A contains the road design drawing showing where the check dams are placed.
3.1 Quantities Using the method illustrated in section 3.0 Check Dam Design and Analysis, the check dam placements for the 600 mm selection are designed and drawn in an AutoCAD file. They are quantified directly from their occurrences in the design drawings. The check dam placements

14
for the smaller size selections are quantified as a ratio of the 600 mm selection quantity. The lengths of each check dam are assumed to be approximately equal.
Every check dam in the road design is drawn by placing an instance of an AutoCAD block created for the check dam symbol. The check dams are quantified by using the Quick Select tool to select all instances of the check dam symbol block in the drawing. The total number of selected objects displayed by AutoCAD is the total number of check dams placed in the design. For the 600 mm filter sock, 136 check dams are needed.
According to the Filtrexx Design Manual chart for check dam spacing (Figure 3), the spacing required for the 300 mm check dam is half of the spacing required for the 600 mm check dam. Therefore, twice as many check dams are required if the 300 mm check dam is selected; that is, 273 check dams are required when using the 300 mm check dam. The 450 mm check dam is not indicated on the design manual chart. However, it is evident from the graph that the spacing requirements are proportional to the diameter size of the selected Siltsoxx. Therefore, the ratio between the spacing requirement of the 450 mm check dam and the spacing requirement of the 600 mm check dam is 450/600 or 3/4. The following conversion obtains the required number of check dams for the 450 mm diameter:
1 4501 600 = 3
4
1 600 = 43 × 1 450
136 600 = 43 × 136 450 = 181. 3 450 ≅ 182 450
Thus, 182 check dams are required when using the 450 mm diameter filter sock.

15
For the 200 mm check dam, the same principle is used. The ratio between the spacing requirement of the 200 mm check dam and the 300 mm check dam is 200/300 or 2/3.
1 2001 300 = 2
3
1 300 = 32 × 1 200
273 300 = 32 × 273 200 = 408 200
Therefore, 408 check dams are required when using the 200 mm diameter filter sock.
For varying sizes of check dams, the length of individual check dams do not vary significantly since the check dam lengths are dependent on the ditch width and embankment slope. Although the check dams are placed at different locations for different sizes, the required length varies insignificantly due to the fact that the ditches do not undergo abrupt changes in their cross sections.
To estimate the required length for check dams, the ditch flow depth and ditch embankment slope is taken into consideration. The Filtrexx Design Manual specifies that the ends of the check dams must be at 1.2 m beyond the normal ditch flow line on both banks (Filtrexx). The ditch flow depth varies, but can be assumed to be 0.5 m as an adequate design parameter. The slopes of the proposed ditch embankments are either 3:1 or 2:1 within the project limits, with the majority being 1:3. To be conservative in estimating the length requirement of the check dams, the embankment slopes are assumed to be all 3:1 to yield a greater length. Figure 4 illustrates the typical ditch cross section geometry.

16
Figure 4 Typical Ditch Cross-Section
ℎ = 2(1.2 + (0.5 ) + (1.5 ) ) = 5.6
Thus, approximately 5.6 m of filter sock is required for every check dam.
3.2 Cost The cost of installing filter sock check dams vary depending on the contractor involved and the product price quoted for the specific project. For the purpose of this analysis, the combined cost of purchase and installation is estimated based on information published by the United States Environmental Protection Agency (EPA) and by the Journal of Soil and Water Conservation (JSWC). According to the best management practices recommended by the EPA, the cost of using 450 mm diameter filter sock check dams is $2.75 to $4.75 per linear foot (30 cm) (United States Environmental Protection Agency, 2009). A median cost of $3.75 is used for this study. According to a study in the JSWC, for every 30 cm length of perimeter sediment and erosion control, the 200 mm and the 300 mm Siltsoxx cost $1.80 and $2.40 to purchase and install respectively (Faucette, Governo, Tyler, Gigley, Jordan, & Lockaby, 2009).
1 3
0.50m
1.50m
1.20m
DITCH EMBANKMENTFILTER SOCK CHECK DAM
DITCH FLOW SURFACE

17
Data for the cost of the 600 mm filter sock could not be found. To estimate a cost for the 600 mm check dam, the above costs are extrapolated (Figure 5). The filter sock sizes are placed at constant intervals on the x-axis since the cost of the product and installation are affected by size and weight. It is important to note that the 600 mm filter sock is not available as a pre-manufactured product. The 600 mm filter sock must be assembled during installation on site due to its large size. To better represent the cost increase from the pre-manufactured sizes to the site manufactured larger size, the cost data is fitted with an exponential curve rather than a linear curve. Using the equation of the exponential curve, the intersecting point at 600 mm is obtained.
Figure 5 Cost Extrapolation for 600 mm Filter Sock
= 0.999 . ( ) = 0.999 . ( ) = $5.69
The cost of implementing the 600 mm filter sock is $5.69 per linear metre. Table 1 summarizes the cost of the different sizes of check dams per meter length. The estimated total
y = 0.999e0.0029xR² = 0.9999
0.001.002.003.004.005.006.007.008.00
0 100 200 300 400 500 600 700
Cost p
er Line
ar Me
tre ($)
Filter Sock Diameter (mm)
Cost of Implementing Filter Socks
18
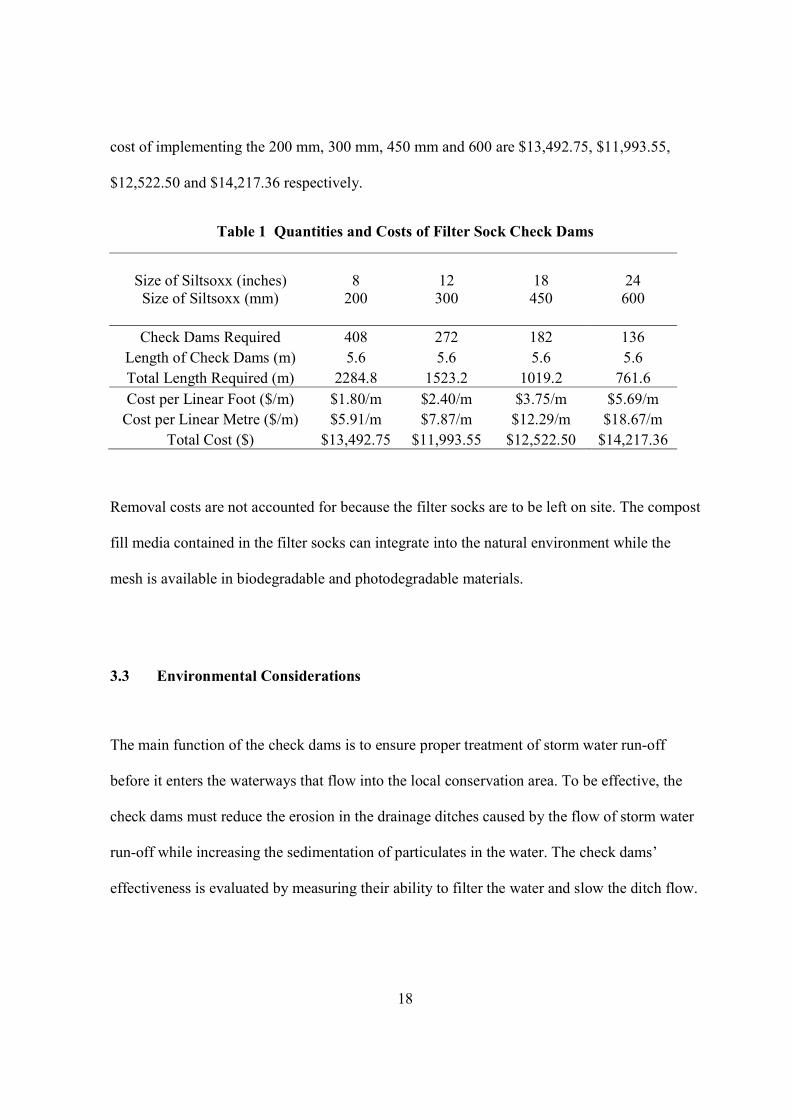
cost of implementing the 200 mm, 300 mm, 450 mm and 600 are $13,492.75, $11,993.55, $12,522.50 and $14,217.36 respectively.
Table 1 Quantities and Costs of Filter Sock Check Dams
Size of Siltsoxx (inches) 8 12 18 24 Size of Siltsoxx (mm)
200
300
450
600
Check Dams Required 408 272 182 136
Length of Check Dams (m) 5.6 5.6 5.6 5.6 Total Length Required (m) 2284.8 1523.2 1019.2 761.6 Cost per Linear Foot ($/m) $1.80/m $2.40/m $3.75/m $5.69/m
Cost per Linear Metre ($/m) $5.91/m $7.87/m $12.29/m $18.67/m Total Cost ($) $13,492.75 $11,993.55 $12,522.50 $14,217.36
Removal costs are not accounted for because the filter socks are to be left on site. The compost fill media contained in the filter socks can integrate into the natural environment while the mesh is available in biodegradable and photodegradable materials.
3.3 Environmental Considerations The main function of the check dams is to ensure proper treatment of storm water run-off before it enters the waterways that flow into the local conservation area. To be effective, the check dams must reduce the erosion in the drainage ditches caused by the flow of storm water run-off while increasing the sedimentation of particulates in the water. The check dams’ effectiveness is evaluated by measuring their ability to filter the water and slow the ditch flow.

19
3.3.1 Quantitative Considerations The key environmental factor considered is the filtering capacity of the different check dam sizes. The Filtrexx Design Manual indicates that all of the available filter sock sizes are capable of filtering the same percentage of each filtered pollutant (Filtrexx). However, the hydraulic flow through rate differs with size (Filtrexx). As the size of the filter sock increases, so does the hydraulic flow through rate. In the case of a single pass through a single filter sock, assuming that pollutants are evenly distributed throughout the water flow, an increase in the flow through rate would lead to an increase in the amount of pollutants being filtered. Also, the changes in the amount of pollutants filtered for each filter sock size would be proportional to the changes in the flow through rates. Thus, the flow through rates are used to compare the effectiveness of each design option.
The total flow through capacity of each design option, which is the total volume of water the filter socks are capable of filtering per unit of time, is found by using the total length of each filter sock size and the corresponding hydraulic flow through rate. The total length of each filter sock size is quantified in section 3.1 Quantities. It should be noted that only a portion of each check dam is effectively filtering ditch flow water, because only a portion of the check dams will be submerged in the ditch flow water during most times. The parameters considered are a ditch depth of 0.5 m, a ditch embankment slope of 3:1 for the majority of the ditches and a filter sock extension of 1.2 m beyond the ditch flow on both sides of the embankment. The percentage of the total length of filter sock that is effectively filtering ditch flow can be approximated as follows:
ℎ = 2 1.2 + (0.5 ) + (1.5 ) = 5.6

20
ℎ = 2 (0.5 ) + (1.5 ) = 3.2
= 3.25.6 × 100% = 57%
Approximately 57% of the total length of filter socks is effectively filtering ditch flow water. This portion of the length is multiplied by the hydraulic flow through rate to obtain the total filtering capacity in volumes of water flow per unit time. The filter capacity results are summarized in Table 2. The best performing check dam diameters in terms of filtering capacity are the 200 mm and 300 mm check dams with a filtering capacity of approximately 122,102 litres per minute.
Table 2 Filtering Capacities of the Filter Sock Alternatives
Size of Siltsoxx (mm) 200 300 450 600 Hydraulic Flow Through Rate
(litres/minute/m) 94 141 188 281 Total Length Required (m) 2284.8 1523.2 1019.2 761.6
Effective Length 1299.0 866.0 579.4 433.0 Total Filtering Capacity
(litres/minute) 122,102 122,102 108,934 121,669
3.3.2 Qualitative Considerations Another aspect to consider is the cross-sectional area occupied by the filter sock, as shown in Figure 6. The 600 mm check dam will be able to cover the entire cross-section of the ditch flow. Thus, 100% of the flow passing across each 600 mm check dam will pass through the
21
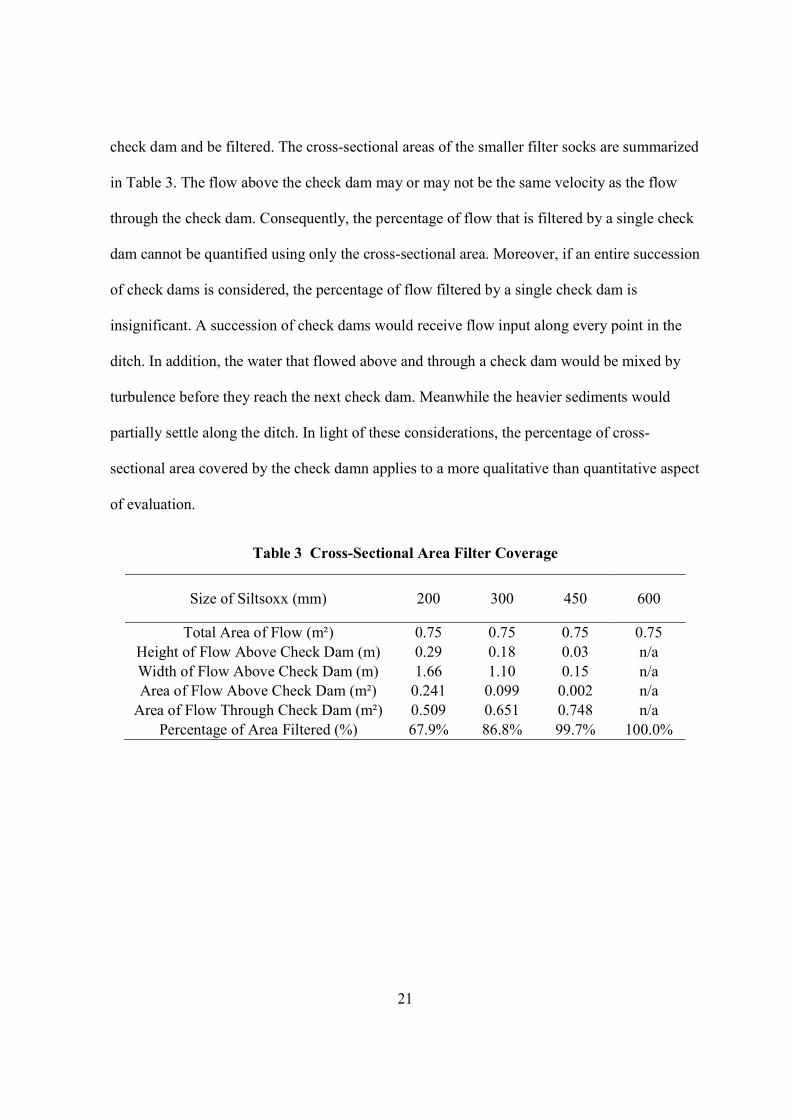
check dam and be filtered. The cross-sectional areas of the smaller filter socks are summarized in Table 3. The flow above the check dam may or may not be the same velocity as the flow through the check dam. Consequently, the percentage of flow that is filtered by a single check dam cannot be quantified using only the cross-sectional area. Moreover, if an entire succession of check dams is considered, the percentage of flow filtered by a single check dam is insignificant. A succession of check dams would receive flow input along every point in the ditch. In addition, the water that flowed above and through a check dam would be mixed by turbulence before they reach the next check dam. Meanwhile the heavier sediments would partially settle along the ditch. In light of these considerations, the percentage of cross-sectional area covered by the check damn applies to a more qualitative than quantitative aspect of evaluation.
Table 3 Cross-Sectional Area Filter Coverage
Size of Siltsoxx (mm) 200 300 450 600 Total Area of Flow (m²) 0.75 0.75 0.75 0.75
Height of Flow Above Check Dam (m) 0.29 0.18 0.03 n/a Width of Flow Above Check Dam (m) 1.66 1.10 0.15 n/a Area of Flow Above Check Dam (m²) 0.241 0.099 0.002 n/a
Area of Flow Through Check Dam (m²) 0.509 0.651 0.748 n/a Percentage of Area Filtered (%) 67.9% 86.8% 99.7% 100.0%

22
Figure 6 Ditch Cross-Sections for Each Filter Sock Size The flow velocity reduction for each filter sock option is also considered. A lower flow velocity would reduce erosion and increase settling for the sedimentation. The spacing
1 3
0.50m
1.50m
0.29m
1 3
0.50m
1.50m
0.18m
1 3
0.50m
1.50m
0.03m
1 3
0.50m
1.50m
200 mm CHECK DAM
300 mm CHECK DAM
450 mm CHECK DAM
600 mm CHECK DAM
1.66m
1.10m
0.15m
0.20m0.30m
0.45m0.60m

23
between the check dams affect how much the ditch flow velocity is reduced. The more frequent the check dams are, the more effective the check dams are as speed bumps, since there will be less travel distance between check dams for the water flow to accelerate. This aspect is also assessed qualitatively due to the lack of experimental data to make informed calculations. To assess this quality, the filter sock sizes are simply ranked from 1 to 4 with 1 assigned to the least capable of flow velocity reduction and 4 assigned to the most capable.
3.4 Options Evaluation To evaluate the relative desirability of each filter sock size option, a decision matrix is used to tabulate the results of this study. The criteria used to evaluate the design options include the cost of implementing the design, the filtering capacity of the design, the percentage of the cross-sectional area that pass thorough the filter sock and the design’s ability to reduce flow velocity. A score index is assigned to each decision criteria based on the result. Each score index is subject to a weighting assigned according to the significance of the result.
To evaluate the cost, the design option with the lowest cost is assigned an index of 1. For each other design option, the index assigned is the ratio between the lowest cost and the said cost. The filtering capacity index is assigned such that the option with the maximum filtering capacity has an index of 1. Each other option has a filtering index that is the ratio between its filtering capacity and the maximum filtering capacity. The indices for the cross-sectional area criteria are equal to the percentage of the filtered cross-sectional area. The flow velocity reduction index is determined by assigning the highest ranked design option a full score of 1, then reducing each subsequent design option by an equal fraction.

24
The indices are weighted to lend more influence for the quantitative evaluation criteria. The cost and filtering index are assigned weights of 2 while the cross-sectional filter area index and the flow velocity reduction index are assigned weights of 1.
The assigned indices are summed to show the total score of each design option (Table 4). When each design criterion is weighted equally, the 300 mm option has the highest score of 3.62. When the design criteria are weighted, the 300 mm option still has the highest score at 5.62. Therefore, the 300 mm option is the most preferred option according to the evaluation criterion used in this study.

25
Table 4 Decision Matrix for Evaluating the Filter Sock Options
Weight
of Index
Design Option (Size) 200 mm 300 mm 450 mm 600 mm Average
Criteri
on
Cost of Implementation ($)
13,492.75
11,993.55
12,522.50
14,217.36
13,056.54
Filtering Capacity
(litres/minute) 122,102 122,102 108,934 121,669 118,702
Cross-Sectional
Filter Area Percentage (%)
0.68 0.87 1.00 1.00 0.89
Flow Velocity Reduction (rank) 4 3 2 1 2.5
Criteri
on Ind
ex
2 Cost Index 0.89 1.00 0.96 0.84 0.92
2 Filtering Index 1.00 1.00 0.89 1.00 0.97
1 Cross-Sectional Filter Area Index 0.68 0.87 1.00 1.00 0.89
1 Flow Velocity Reduction Index 1 0.75 0.5 0.25 0.625
Index Total 3.57 3.62 3.35 3.09 3.41 Weighted Index
Total 5.46 5.62 5.20 4.93 5.30
4.0 Conclusion The selection of check dam option for the ditches along the proposed Stark Avenue are limited to Filtrexx products, as specified by the client, the local regional municipality. Filtrexx filter socks of four diameters were evaluated for their application as check dams. The evaluated diameters are 200 mm, 300 mm, 450 mm and 600 mm. These sizes are investigated in terms of their design requirements and performance capabilities. The design requirements follow

26
guidelines created by the product provider. Using data sourced from experimental publications as well as designed conditions specific to the project, the performance capabilities were evaluated.
In accordance with their design requirements, the assessment of the four check dam size options considers the cost of their implementation and their environmental effects. The environmental effects of each design option were analysed in terms of their ability to filter pollution in the ditch flow, their ability to reduce the ditch flow velocity and their coverage of the ditch flow cross-section.
To combine the cost and environmental criteria, each criterion was assigned a score index. The resulting indices are tallied in a decision matrix to compare each design option. To conclude, the recommended option is the 300 mm diameter filter sock check dam. This option yields a minimum cost and a maximum filtering capacity. Also, the 300 mm option provides a cross-sectional area coverage and flow velocity reduction ranking that is better than the average of the four options assessed. The option evaluated with the highest score provides the most benefits in terms of cost efficiency and environmental conservation.
5.0 Recommendations The cost of installing filter socks as check dams should be confirmed or updated by obtaining quotes in order to ensure that the cost estimate is current and accurate, especially for the 600 mm diameter filter sock. Another cost to consider is the long term cost. The cost estimate included in this study only considers the initial cost of installing filter sock check dams. For a

27
more holistic cost analysis, the cost of inspections and maintenance should be considered, including the removal of excess sediment build up.
For ditches with slopes exceeding 10%, soil stabilization measures should be considered. Filter sock check dams act to filter and slow the ditch flow, but their optimal performance applies to slopes up to 10%. For greater slopes, more extensive methods may be necessary.

28
References Faucette, L. B., Governo, J., Tyler, R., Gigley, G., Jordan, C. F., & Lockaby, B. G. (2009,
January/February). Performance of compost filter socks. Journal of Soil and Water Conservation, 64(1), 84.
Filtrexx. (n.d.). Filtrexx. Retrieved January 5, 2014, from Siltsoxx for Check Dams: http://www.filtrexx.com/check-dam/
Filtrexx. (n.d.). Filtrexx Standard Specifications and Design Manual for Erosion, Sediment, Pollution Control and Storm Water Management. Retrieved December 20, 2014, from Filtrexx Design Manual: http://www.filtrexxdesignmanual.com/
Greater Golden Horseshoe Area Conservation Authorities. (2006, December). Erosion and Sediment Control Guideline for Urban Construction. Retrieved December 20, 2014, from Credit Valley Conservation Authority: http://www.creditvalleyca.ca/wp-content/uploads/2011/01/010-ESC_Guideline-for-Urban-Construction.pdf
United States Environmental Protection Agency. (2009, November). Development Document for Final Effluent Guidelines and Standards for the Construction & Development Category. Retrieved December 27, 2014, from United States Environmental Protection Agency: http://water.epa.gov/scitech/wastetech/guide/construction/upload/Construction_-_Development_DD_2009_Chapters_1-11.pdf

29
APPENDIX A Plans and Profiles of Check Dam Placements


37
APPENDIX B Sample Calculations

Scanned by CamScanner

Scanned by CamScanner