Embed Size (px)
Citation preview

WORKABILITY QLD LOCAL WORKFORCE PROFILE
SOUTH WEST QUEENSLAND
NDIS REGION

WorkAbility Qld – South West Qld NDIS Region Workforce Profile
October 2016 2
This Local Workforce Profile has been developed by WorkAbility Qld for the South West
Queensland NDIS region. Should you require any clarification of the information contained in this
document please email [email protected].

WorkAbility Qld – South West Qld NDIS Region Workforce Profile
October 2016 3
PURPOSE OF THIS REPORT
This report discusses the population profile of the South West Queensland NDIS region,
comprising the Local Government Authorities of:
Balonne
Bullo
Goondiwindi
Maranoa
Murweh
Paroo
Quilpie
Southern Downs
Toowoomba
Western Downs
Discussion is aimed at evaluating the demand for and potential supply of workers for the
NDIS rollout in the region, and to highlight any particular areas of opportunity or risk for
delivery of services to participants.
In most cases the profile will discuss the picture of the overall population of these 3 areas.
In the Appendix you can find comparisons of results of key metrics for each of the areas
in order to highlight any particular regional variations.
This report contains statistical data (STAC and DELTA) in relation to Vocational Education
and Training (VET) student enrolments. Permission to publish and distribute to external
parties requires permission from the Department of Education and Training.
In lieu of an executive summary the report will start with a short summary of the main
findings of the report. The body of the report will go into the full detail and discussion of
findings, but this summary may be of more use to those without an interest in the depth
of the detail.


CONTENTS
SOUTH WEST QUEENSLAND NDIS REGION POPULATION PROFILE ............................................... 6
The South West Queensland NDIS region population is growing slowly .............................. 6
The population of the South West Queensland NDIS region is older than average .......... 6
There are variances between the male and female populations at different life stages. 7
The indigenous population varies across LGAs in the region ............................................... 8
The culturally and linguistically diverse population is a small potential workforce target
cohort ............................................................................................................................................ 9
WHO WORKS IN THE DISABILITY SECTOR? ................................................................................... 10
Workload variations in Allied Health ...................................................................................... 11
WORKFORCE DEMAND .................................................................................................................. 12
HOW CAN WE SUPPLY THE WORKFORCE? ................................................................................... 13
Part time workforce utilisation ................................................................................................. 13
Casual workers .......................................................................................................................... 14
Unemployed people ................................................................................................................. 14
GRADUATES IN DISABILITY AND ALLIED HEALTH RELATED QUALIFICATIONS ........................... 15
Disability...................................................................................................................................... 16
Allied Health ............................................................................................................................... 18
Mental Health ............................................................................................................................. 20
HIGHER EDUCATION QUALIFICATIONS ........................................................................................ 21
IS THIS ENOUGH TO MEET PROJECTED DEMAND? ...................................................................... 23
Data Notes ..................................................................................................................................... 24
ABS population data ................................................................................................................. 24
ABS Census Data ....................................................................................................................... 24
STAC Training Data .................................................................................................................... 24
DATA REGIONS AND MAPS........................................................................................................... 25
Department of Education and Training Regions ................................................................... 26
APPENDIX – LGA LEVEL DATA FOR KEY MEASURES .................................................................... 27
WorkAbility Qld – South West Qld NDIS Region Workforce Profile
October 2016 6
SOUTH WEST QUEENSLAND NDIS REGION POPULATION PROFILE
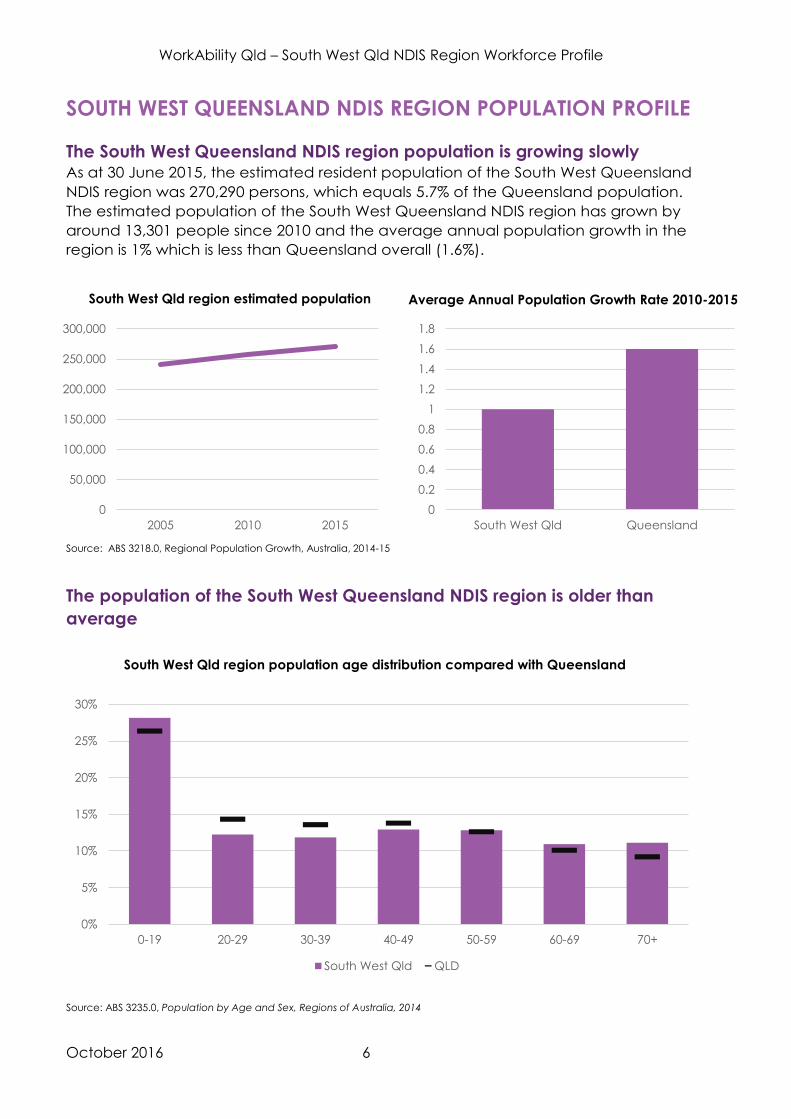
The South West Queensland NDIS region population is growing slowly As at 30 June 2015, the estimated resident population of the South West Queensland
NDIS region was 270,290 persons, which equals 5.7% of the Queensland population.
The estimated population of the South West Queensland NDIS region has grown by
around 13,301 people since 2010 and the average annual population growth in the
region is 1% which is less than Queensland overall (1.6%).
Source: ABS 3218.0, Regional Population Growth, Australia, 2014-15
The population of the South West Queensland NDIS region is older than
average
Source: ABS 3235.0, Population by Age and Sex, Regions of Australia, 2014
0
50,000
100,000
150,000
200,000
250,000
300,000
2005 2010 2015
0
0.2
0.4
0.6
0.8
1
1.2
1.4
1.6
1.8
South West Qld Queensland
0%
5%
10%
15%
20%
25%
30%
0-19 20-29 30-39 40-49 50-59 60-69 70+
South West Qld QLD
South West Qld region estimated population
Average Annual Population Growth Rate 2010-2015
South West Qld region population age distribution compared with Queensland

WorkAbility Qld – South West Qld NDIS Region Workforce Profile
October 2016 7
The population distribution of the South West Queensland NDIS region is skewed
slightly to an older demographic than that of Queensland overall, with 34.9% of the
population over the age of 50. At the overall state level, 26% of people are over the
age of 55 and approaching retirement eligibility – comparatively 28.9% of the South
West Queensland NDIS region population falls into that age bracket. The median
ages in Maranoa (1 year younger), Murweh (0.5 years younger)and Western Downs
(0.1 years younger) are younger than Queensland overall, but median ages in the
other 7 Local Government Areas comprising South West Queensland is older than
average Queensland overall. Overall the South West Queensland NDIS region
population is 1.3 years older than Queensland.
There may be opportunity in the South West Queensland NDIS region to explore
attraction strategies around the engagement of this older cohort. The age distribution of
the workforce would need to be monitored though to ensure that there are sufficient
workers with age and experience to teach and mentor this cohort, and ensure that a
career path remains visible and appealing to them. It may also be desirable to try and
increase the number of younger workers, in order to impact the diversity of the workforce
in this area, considering workforce diversity is one of the most commonly expressed
priorities for participants.
There are variances between the male and female populations at different
life stages
In the South West Queensland NDIS region the population of females is noticeably larger
than that of males from the age of 35 (around 4,442 more females). However there are
more males than females in the younger age groups (0-24). This could impact
participant experience if the workforce is not sufficiently diverse in gender and age to
reflect this breakdown.
Source: ABS 32 35.0, Population by Age and Sex, Regions of Australia, 2014
South West Qld region age distribution by gender
0
1,000
2,000
3,000
4,000
5,000
6,000
7,000
8,000
9,000
10,000
Male Female

WorkAbility Qld – South West Qld NDIS Region Workforce Profile
October 2016 8
There is an opportunity here for some age and gender specific marketing of the disability
sector as a desirable career path, as well as ensuring that the existing workforce is
equipped to deal with the varying needs and expectations of different employee
cohorts. Targeting new entrants outside of the typical caring profession demographic of
women in their 30s-40s could be an opportunity to increase the diversity of the NDIS
workforce. Given the interpersonal nature of the work this diversity could be of great
benefit for participants in choosing support workers closer to their own demographics.
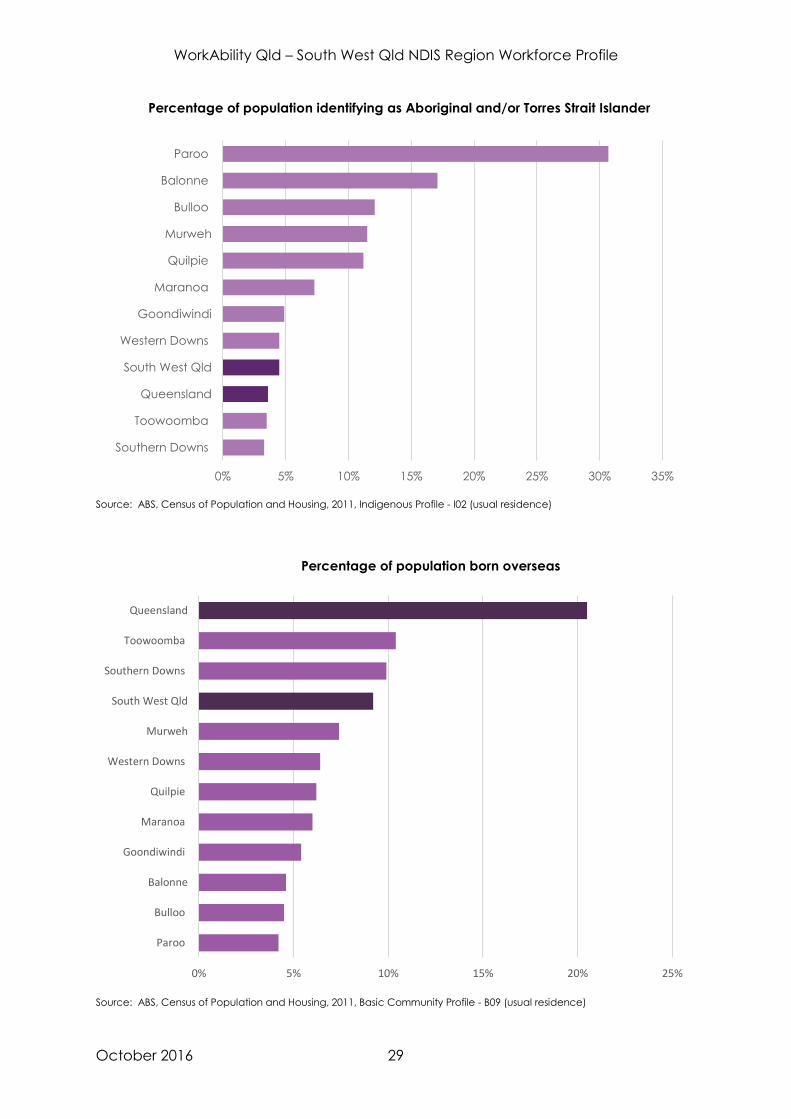
The indigenous population varies across LGAs in the region
Source: ABS, Census of Population and Housing, 2011, Indigenous Profile - I02 (usual residence)
Nearly 11,329 people in the South West Queensland NDIS region identify as Aboriginal
and/or Torres Strait Islander. Paroo Shire has the highest proportion of Indigenous people
in their population (30.7%) followed by Balonne Shire (17.1%), Bullo Shire (12.1%), Murweh
Shire (11.5%) and Quilpie Shire (11.2 %). This region has a slightly higher proportion of
Aboriginal people in their population (4.2%) than Queensland overall (2.8%).
This will have an impact on both the workforce and client base, and consideration
should be given to the needs and expectations of Aboriginal and/or Torres Strait Islander
people within the disability sector. Aboriginal and/or Torres Strait Islander people have
been identified as key NDIS workforce target populations so this represents a great
opportunity for the South West Queensland NDIS region disability workforce in the areas
with high representation.
0% 5% 10% 15% 20% 25% 30% 35%
Southern Downs
Toowoomba
Queensland
South West Qld
Western Downs
Goondiwindi
Maranoa
Quilpie
Murweh
Bulloo
Balonne
Paroo
Percentage of population identifying as Aboriginal and/or Torres Strait Islander
WorkAbility Qld – South West Qld NDIS Region Workforce Profile
October 2016 9
The culturally and linguistically diverse population is a small potential
workforce target cohort
At the time of the 2011 Census, South West Queensland region had 23,225 persons
who stated they were born overseas (9.2% of the South West Queensland region
population). Comparatively, in Queensland overall 20.5% of the population were
born overseas. Of the overseas born population of South West Queensland region,
1,279 (5.5%) state that they cannot speak English at all, or not well.
People from culturally and linguistically diverse backgrounds have been identified as
key NDIS workforce target populations. There may need to be specific attention
paid to the needs of this cohort, and ensuring that any career marketing and
disability support is inclusive and sensitive to cultural and linguistic needs. However,
given that the region is only half as multicultural as the Queensland average, this
target population may not be sufficient to close the workforce supply gap.

WorkAbility Qld – South West Qld NDIS Region Workforce Profile
October 2016 10
WHO WORKS IN THE DISABILITY SECTOR?
For the purpose of this profile and identifying key disability occupations at the LGA level
for South West Queensland region, core community service occupations have been
identified at the ANZCO 4 Digit Level using ABS 2011 occupation data. These core
occupations give a preliminary scope of the community services workforce most likely to
comprise future employment growth as a result of the NDIS. The core occupations are:
Aged and Disabled carers
Occupational therapists
Physiotherapists
Speech professionals and audiologists
This covers the allied health occupations, and the only other occupational group that
can be clearly identified as relating to disability. It is important to note that it is not known
what proportion of people in these occupations actually works within disability, or across
other sectors, so these numbers should be considered indicative only.
Data Source: 2011 Census of Population and Housing
People identifying in the 2011 Census as aged and disabled carers are the largest of the
disability related occupations, by a significant margin – with around 10 times as many
workers as the next largest occupation. Given the age profile of the region it is
unsurprising that there are so many aged and disabled workers, but this skew towards
aged care may have an impact on the supply of disability support workers if the aged
care sector is viewed as larger and more stable. Conversely, this may have a positive
impact on supply if aged care workers can be encouraged to engage in disability
support work as well. The Queensland Market Position Statement indicates that there are
currently 1,050 – 1,300 FTE in the South West Queensland NDIS region workforce – 1417
people identified in the chosen occupations in the census, which may give us a general
rule of thumb that around 75-90% of the Census identified workers are actually involved
in disability work. This is a reasonably high proportion, and counter-intuitive considering
that you may expect more aged care workers in the region with the generally older
0 200 400 600 800 1,000 1,200
Speech Professionals and Audiologists
Occupational Therapists
Physiotherapists
Aged and Disabled Carers
Workers in Disability Related Occupations – South West Qld Region

WorkAbility Qld – South West Qld NDIS Region Workforce Profile
October 2016 11
population. If aged care workers are already crossing over into disability support work as
well then the potential strategy of cross skilling them to fill the disability support workforce
gap may not have a significant impact on the gap.
Speech professionals are the smallest cohort, which will need to be compared to
forecasted demand in order to determine whether this may have a detrimental impact
for service provision to people with a disability in the region.
Workload variations in Allied Health As a rough indication of the demand placed on workers in the disability related
occupations the following graph will show the number of workers in disability related
occupations, per 100,000 population.
Data Source: 2011 Census of Population and Housing
Aged and disabled carers in the South West Queensland NDIS region have significantly
less population to service compared to Aged and disabled carers in Queensland overall.
The ratio is similar for both Occupational Therapists and Speech Professionals, but slightly
less for Physiotherapists, meaning that Physiotherapists in the area have more people to
provide services for than is typical in Queensland overall.
Obviously not everyone in the region will require the services of a worker in one of these
occupations, but this gives a picture of the differential demand placed on workers in
disability related occupations in the South West Queensland NDIS region compared with
the Queensland average pattern.
0 50 100 150 200 250 300 350 400 450
Speech Professionals and Audiologists
Occupational Therapists
Physiotherapists
Aged and Disabled Carers
Workers per 100,000 Population – South West Qld region compared to Queensland
WorkAbility Qld – South West Qld NDIS Region Workforce Profile
October 2016 12
WORKFORCE DEMAND
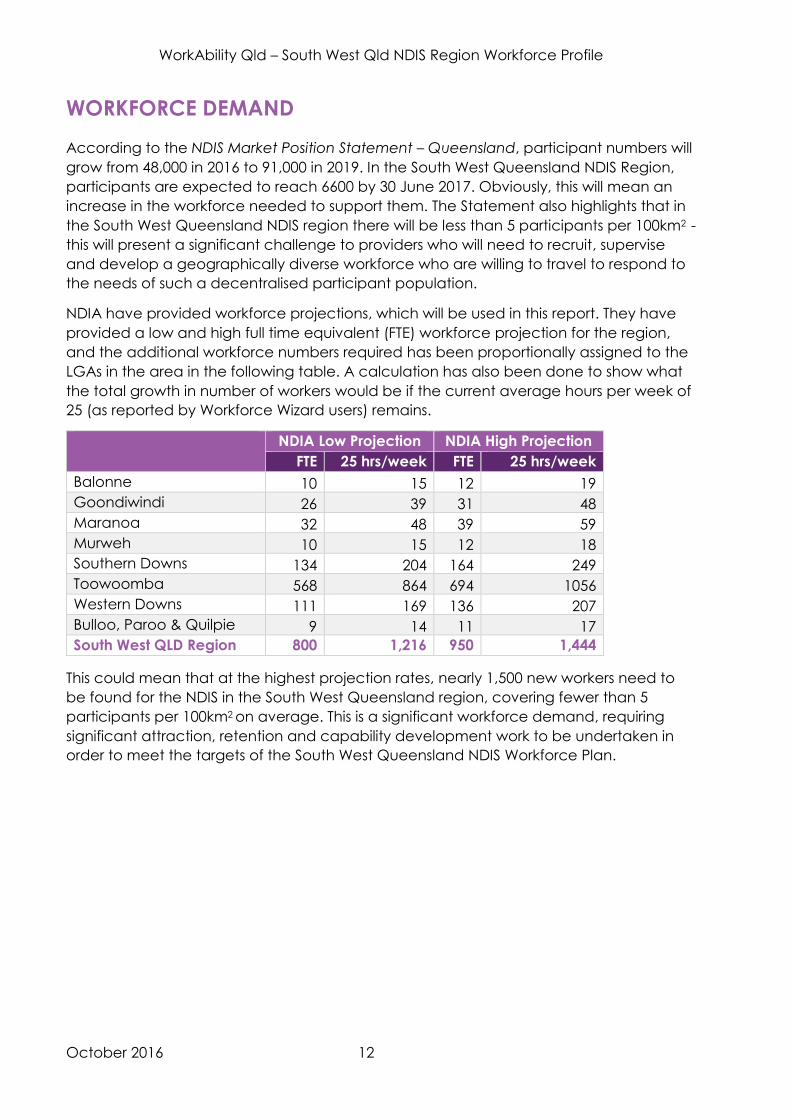
According to the NDIS Market Position Statement – Queensland, participant numbers will
grow from 48,000 in 2016 to 91,000 in 2019. In the South West Queensland NDIS Region,
participants are expected to reach 6600 by 30 June 2017. Obviously, this will mean an
increase in the workforce needed to support them. The Statement also highlights that in
the South West Queensland NDIS region there will be less than 5 participants per 100km2 -
this will present a significant challenge to providers who will need to recruit, supervise
and develop a geographically diverse workforce who are willing to travel to respond to
the needs of such a decentralised participant population.
NDIA have provided workforce projections, which will be used in this report. They have
provided a low and high full time equivalent (FTE) workforce projection for the region,
and the additional workforce numbers required has been proportionally assigned to the
LGAs in the area in the following table. A calculation has also been done to show what
the total growth in number of workers would be if the current average hours per week of
25 (as reported by Workforce Wizard users) remains.
NDIA Low Projection NDIA High Projection
FTE 25 hrs/week FTE 25 hrs/week
Balonne 10 15 12 19
Goondiwindi 26 39 31 48
Maranoa 32 48 39 59
Murweh 10 15 12 18
Southern Downs 134 204 164 249
Toowoomba 568 864 694 1056
Western Downs 111 169 136 207
Bulloo, Paroo & Quilpie 9 14 11 17
South West QLD Region 800 1,216 950 1,444
This could mean that at the highest projection rates, nearly 1,500 new workers need to
be found for the NDIS in the South West Queensland region, covering fewer than 5
participants per 100km2 on average. This is a significant workforce demand, requiring
significant attraction, retention and capability development work to be undertaken in
order to meet the targets of the South West Queensland NDIS Workforce Plan.

WorkAbility Qld – South West Qld NDIS Region Workforce Profile
October 2016 13
HOW CAN WE SUPPLY THE WORKFORCE?
Part time workforce utilisation
Data Source: 2011 Census of Population and Housing
In 2011 there were 751 part time workers in the South West Queensland NDIS region in the
selected occupations, of whom the majority are Aged and Disabled Carers (677). Other
NDIS sites have explored the idea that some of the newly required jobs could be
absorbed by existing part time support workers. According to Workforce Wizard national
data, the care workforce averages 25 hours per week – as a basic calculation, assuming
an average 40 hour full time work week, that means there may be an extra 253 FTE
available within the part time Aged and Disabled Carer workforce in the South West
Queensland region1 - which would be nowhere near able to meet even the lowest
workforce demand projection made by the NDIA (800 FTE).
Workforce Wizard data also states that 70% of the workforce are female, and 48% are
over 45 years – traditionally females are more likely to seek part time work and it may
therefore be difficult to engage this group in extending their work hours. It may also be
challenging to extend the hours of the older age groups who may be in transition to
retirement. This also assumes that every part time aged and disabled carer is working
within disability, which is unlikely to be the case. Demand for disability support is highest
at particular times of day and it is likely this pattern will remain under NDIS. This means
that the extra hours of support may be in demand at peak times when current workers
are already fully deployed.
1 Calculated as: 15 hours per week unused time x 677 part time workers = 10,155 extra hours. 3430 hours /
10,155 hours per week = 86 Full Time Equivalents
0 100 200 300 400 500 600 700
Speech Professionals and Audiologists
Occupational Therapists
Physiotherapists
Aged and Disabled Carers
Part time workers in disability related occupations – South West Qld region

WorkAbility Qld – South West Qld NDIS Region Workforce Profile
October 2016 14
Even though current part-time workers can help to fill the gap where there are
opportunities to extend working hours, they are unlikely to meet more than 30% of the
expected demand.
Casual workers Workforce Wizard data states that 40% of the workforce are casual, with a 25% growth in
the casual workforce compared with 4% in the permanent workforce. This may be
reflective of the provider caution to recruit until service demand is known, and using
casual employees to fill employment gaps. Again it is risky to assume that these casual
employees will want to transition to full time work, or have the appropriate skill sets to fill
the roles required.
For both casual and part time workers there may be cross employment, meaning that
one worker could potentially appear (for example) as a part time worker in 2
organisations, and a casual worker in a third. This would artificially inflate the
employment numbers within the sector, and could also give a false view of part time/full
time/casual employment.
Unemployed people As at March 2016 there were nearly 5,945 unemployed people in the South West
Queensland region – however the unemployment rate in South West Queensland region
(4.4%) is less than overall Queensland rate (6.2%). Given that training and qualifications
have been reported as not being as important to recruitment as the correct attitudes,
aptitudes and values, this cohort could be a valuable target group for recruitment.

WorkAbility Qld – South West Qld NDIS Region Workforce Profile
October 2016 15
GRADUATES IN DISABILITY AND ALLIED HEALTH RELATED
QUALIFICATIONS
Anecdotally we know that training and qualifications are only a part of the match of an
employee to the disability sector. Due to the significant interpersonal nature of the work
some organisations may be more likely to seek certain aptitudes, attributes, attitudes,
values and capabilities in new entrants than formal qualifications.
In 2014/15 there were 261 enrolments into disability related qualifications in the Darling
Downs South West DET region (this region contains all 10 LGAs belongs to South West
Queensland region). 43.3% of these were into Certificate IV in Disability – this is higher
than the proportion overall in Queensland. Given the forecast growth in disability related
occupations in the region may be as high as 1,444 new workers, this level of training
supply will not be sufficient to meet the demand for new NDIS workers.
The notable difference for enrolments in Darling Downs South west is that there are
comparatively twice as many enrolments into Certificate IV in Disability than there are in
Queensland overall. Also there are significantly fewer enrolments for Certificate IV in
Mental Health and Certificate III in Allied Health Assistance. This could impact the
delivery of specific mental health and allied health services in the region, and further
investigation may be required into the demand for those qualifications in the area to
assess the impact.
Certificate III in disability has now been superseded by Certificate III in Individual Support,
which is already being delivered in some areas of Queensland.
0% 5% 10% 15% 20% 25% 30% 35% 40% 45%
Certificate III In Allied Health Assistance
Certificate IV In Allied Health Assistance
Diploma Of Disability
Certificate IV In Mental Health
Certificate III In Disability
Certificate IV In Disability
VET Enrolments in Darling Downs South West compared with Queensland – 2014/15

WorkAbility Qld – South West Qld NDIS Region Workforce Profile
October 2016 16
Disability
Certificates in Disability
At Certificate III level, this qualification addresses work in the community and/or
residential facilities under direct or regular supervision within clearly defined organisation
guidelines and service plans. These workers:
Carry out activities to maintain personal care and/or other activities of living for
people with a disability
Carry out activities related to an individualised plan
Report directly to a supervisor and are not responsible for other workers.
Occupational titles may include:
Accommodation
support worker
Community support
worker Community house
worker Home care assistant
Personal care worker Disability service officer Support worker School support officer
(working with children
with disabilities)
Care assistant Disability support officer Residential care
support worker Residential care officer
Client assistant Disability support
worker Residential aide In-home respite care
worker
Community access
coordinator
Family support worker Residential care officer Personal care assistant
Community care
worker
Field officer Residential aide Personal care giver
At Certificate IV level, this qualification addresses work in residential group homes,
training resource centres, day respite centres and open employment services, other
community settings and clients' homes. These workers:
Apply knowledge and skills gained through qualifications and/or previous experience
to provide training and support to people with disabilities to enhance their ability to
achieve greater levels of independence, self-reliance and community participation
Report to service managers and may liaise with health professionals and other service
agencies
May work without direct supervision and may be required to supervise and/or
coordinate a limited number of lower classified workers.
Occupational titles may include:
Behavioural support
officer
Senior personal care
assistant Employment
coordinator (disability) Residential care officer
Development officer Social educator Job coordinator Marketing coordinator
Disability officer - day
support
Social trainer Lifestyle support officer Project officer (life
enhancement team)
Disability support
officer / worker
Supervisor Local area coordinator

WorkAbility Qld – South West Qld NDIS Region Workforce Profile
October 2016 17
These are the core qualifications for disability support roles. Whilst overall numbers are
low, enrolments in both Certificate levels have increased over the last 2 years, and this
may be a good opportunity to capitalise on this increasing interest in disability work to
recruit into the NDIS workforce.
VET Enrolments – Certificate III in Disability by DET Regions
VET Enrolments – Certificate IV in Disability by DET Regions
0
50
100
150
200
250
300
350
400
Darling Downs
South West
Central
Queensland
North
Queensland
Far North
Queensland
Metropolitan North Coast South East
2013 - 2014 2014 - 2015
0
50
100
150
200
250
300
350
Darling Downs
South West
Central
Queensland
North
Queensland
Far North
Queensland
Metropolitan North Coast South East
2013 - 2014 2014 - 2015
WorkAbility Qld – South West Qld NDIS Region Workforce Profile
October 2016 18
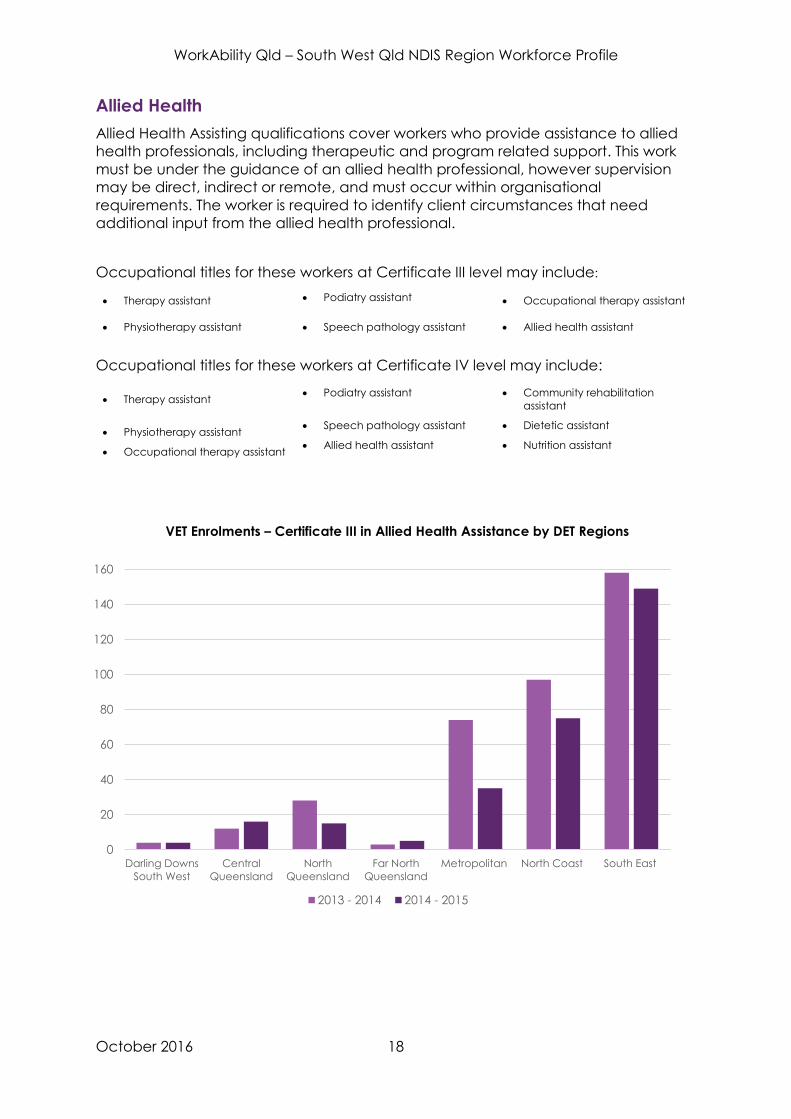
Allied Health
Allied Health Assisting qualifications cover workers who provide assistance to allied
health professionals, including therapeutic and program related support. This work
must be under the guidance of an allied health professional, however supervision
may be direct, indirect or remote, and must occur within organisational
requirements. The worker is required to identify client circumstances that need
additional input from the allied health professional.
Occupational titles for these workers at Certificate III level may include:
Therapy assistant Podiatry assistant Occupational therapy assistant
Physiotherapy assistant Speech pathology assistant Allied health assistant
Occupational titles for these workers at Certificate IV level may include:
Therapy assistant Podiatry assistant Community rehabilitation
assistant
Physiotherapy assistant Speech pathology assistant Dietetic assistant
Occupational therapy assistant Allied health assistant Nutrition assistant
VET Enrolments – Certificate III in Allied Health Assistance by DET Regions
0
20
40
60
80
100
120
140
160
Darling Downs
South West
Central
Queensland
North
Queensland
Far North
Queensland
Metropolitan North Coast South East
2013 - 2014 2014 - 2015
WorkAbility Qld – South West Qld NDIS Region Workforce Profile
October 2016 19
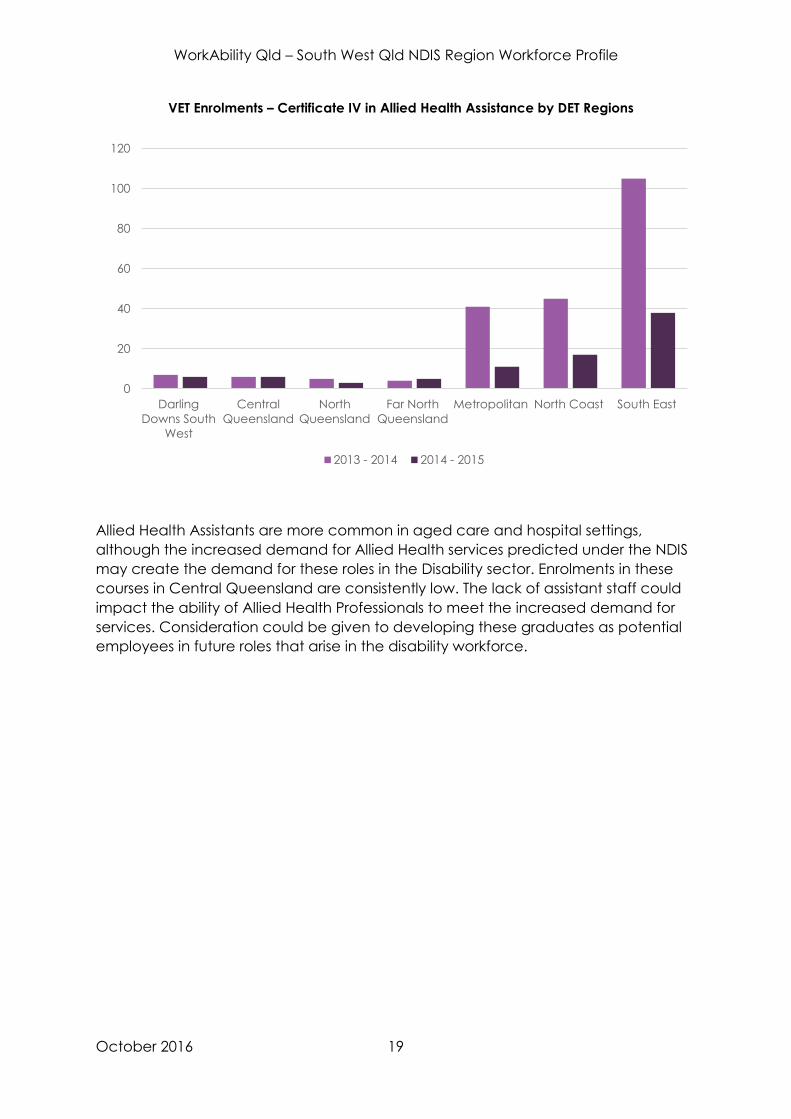
Allied Health Assistants are more common in aged care and hospital settings,
although the increased demand for Allied Health services predicted under the NDIS
may create the demand for these roles in the Disability sector. Enrolments in these
courses in Central Queensland are consistently low. The lack of assistant staff could
impact the ability of Allied Health Professionals to meet the increased demand for
services. Consideration could be given to developing these graduates as potential
employees in future roles that arise in the disability workforce.
VET Enrolments – Certificate IV in Allied Health Assistance by DET Regions
0
20
40
60
80
100
120
Darling
Downs South
West
Central
Queensland
North
Queensland
Far North
Queensland
Metropolitan North Coast South East
2013 - 2014 2014 - 2015

WorkAbility Qld – South West Qld NDIS Region Workforce Profile
October 2016 20
Mental Health
This qualification covers workers who provide a range of community services
focusing on:
• Rehabilitation and support for people affected by mental illness and psychiatric
disability
• Implementing community based activities focusing on mental health, mental illness
and psychiatric disability, and
• Mental health promotion work.
Work may focus on engaging people with mental illness in community participation,
prevention of relapse and promotion of recovery through programs such as
residential rehabilitation, work in clinical settings, home based outreach and centre-
based programs delivered by community based non-government organisations. This
work may also involve supported employment and programmed respite care.
Occupational titles may include:
• Community
rehabilitation and
support worker
• Mental health
rehabilitation
support worker
• Community
support worker
• Mental health
support worker
• Mental health
outreach worker
Enrolment numbers have increased slightly over the last 2 years, but remain relatively
low. More work will need to be done in identifying the demand for newly qualified
mental health workers to see if this supply can provide the workers needed within this
area. Peer workers and workers with lived experience is an emerging area of focus
within mental health services, which may be a concurrent source of workforce
supply to be explored. There may also be some cross sector demand for workers in
mental health from Domestic Violence or Housing services for example.
VET Enrolments – Certificate IV in Mental Health by DET Regions
0
50
100
150
200
250
300
350
Darling Downs
South West
Central
Queensland
North
Queensland
Far North
Queensland
Metropolitan North Coast South East
2013 - 2014 2014 - 2015

WorkAbility Qld – South West Qld NDIS Region Workforce Profile
October 2016 21
HIGHER EDUCATION QUALIFICATIONS
The University of Southern Queensland which has a campus situated in Toowoomba
and is therefore the only University situated in the region does not offer any higher
education qualifications in Physiotherapy, Occupational Therapy or Speech
Pathology. The closest Universities offering these qualifications are the University of
Queensland and Griffith University, both with campuses in Brisbane. Further
investigation may be required in order to understand how many students from the
region move to those universities in order to pursue these qualifications, and more
importantly, how many choose to move back. Also, it may be worth exploring the
possibility of bringing these qualifications into the suite offered by the University of
Southern Queensland. It may also be possible to attract students in other disciplines
into part time disability support work as a way to extend the workforce, and increase
diversity.
Source: Health Workforce Australia, Health Workforce Data, http://data.hwa.gov.au/webapi
0
20
40
60
80
100
120
140
Hospital Non Hospital
2013 2014
0
20
40
60
80
100
120
140
160
180
Hospital Non Hospital
2013 2014
Number of registered Occupational Therapists by practice setting in the South West Qld Region
Number of registered Physiotherapists by practice setting in the South West Qld NDIS region

WorkAbility Qld – South West Qld NDIS Region Workforce Profile
October 2016 22
There was an increase of registered occupational therapists and physiotherapists in
both hospital and non-hospital settings in the South West Queensland Region
between 2013-2014. This is an encouraging sign of an increasing workforce and
greater allied health support in the region. It also means that any occupational
therapy graduates moving to the region will be more likely to find supervision and on
the job experience with more experienced therapists.

WorkAbility Qld – South West Qld NDIS Region Workforce Profile
October 2016 23
IS THIS ENOUGH TO MEET PROJECTED DEMAND?
Workforce projections from NDIA put the minimum number of people who need to
be newly recruited into disability services in the South West Queensland region at
800, and by calculating the FTE from current average weekly hours, the maximum
could be around 1,444. The report above has discussed some potential sources of
new workers in the area.
If it were possible to leverage the underutilised part time workforce, and if all
currently VET enrolled students chose to stay within the South West Queensland
Region and work in disability services, this would meet just over half of the minimum
demand projection.
These are huge ‘ifs’, and this is a highly unlikely scenario. Strategies that focus on
extending working hours, and retention of current students will go some way to
closing the demand/supply gap, but there will need to be a significant focus on
recruitment – with the caveat that this cannot disadvantage the NDIS rollout across
the state (i.e. aiming to recruit from other geographical areas just displaces the
problem rather than solves it).
For further discussion of strategies and activities being developed and rolled out in
the region, please see the South West Queensland Region NDIS Workforce Plan.
0
200
400
600
800
1000
1200
1400
1600
Current Vet Enroledstudents
Extending current PartTime Hours
Minimum WorkforceProjection
Maximum WorkforceProjection
Demand and Supply Projections

WorkAbility Qld – South West Qld NDIS Region Workforce Profile
October 2016 24
Data Notes
ABS population data Regional Population Growth, Australia 2013 -14 (ABS Cat. No. 3218.0)
This data source contains estimates of the resident population of Statistical Areas
Level 2 to 4 (SA2s - SA4s) and Greater Capital City Statistical Areas (GCCSAs) of
Australia.
Population by Age and Sex, Regions of Australia, 2014 (ABS Cat. No. 3235.0)
This data source contains estimates of the resident population of Statistical Areas
Levels 2 to 4 (SA2s - SA4s) and Greater Capital City Statistical Areas (GCCSAs) of
Australia as at 30 June 2001 to 30 June 2014, by age and sex.
The estimates in this issue are final for 2001 to 2011, revised for 2012 and 2013, and
preliminary for 2014.
ABS Census Data The most recent Census of Population and Housing was conducted on 9 August
2011.
STAC Training Data STAC Data
Some students will have not given adequate address details to map them to a
DET Region,
Students with overseas or residential addresses outside of Qld do not map to a
DET Region, these students will be mapped to Unknown/Interstate.

WorkAbility Qld – South West Qld NDIS Region Workforce Profile
October 2016 25
DATA REGIONS AND MAPS
WorkAbility Qld – South West Qld NDIS Region Workforce Profile
October 2016 26
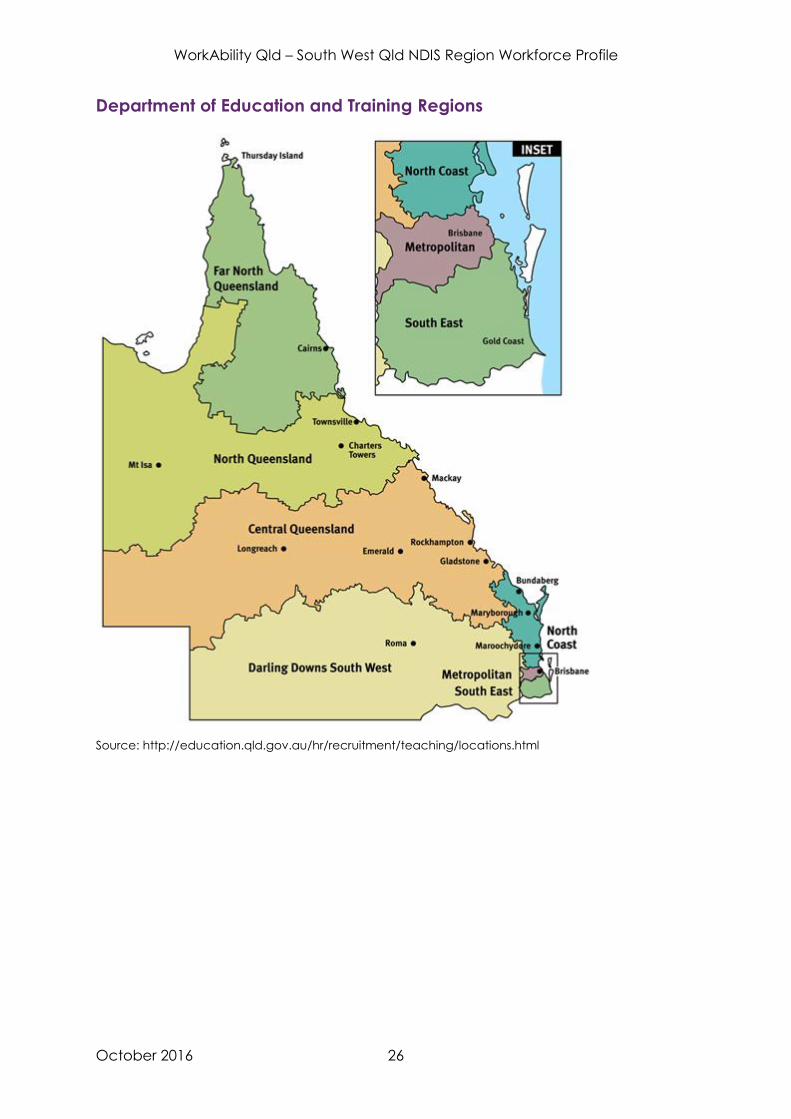
Department of Education and Training Regions
Source: http://education.qld.gov.au/hr/recruitment/teaching/locations.html

WorkAbility Qld – South West Qld NDIS Region Workforce Profile
October 2016 27
APPENDIX – LGA LEVEL DATA FOR KEY MEASURES
Source: ABS 3218.0, Regional Population Growth, Australia, 2014-15
Source: ABS 3235.0, Population by Age and Sex, Regions of Australia, 2014
396
948
1,841
4,626
4,826
11,022
13,862
33,799
35,738
163,232
0 20,000 40,000 60,000 80,000 100,000 120,000 140,000 160,000 180,000
Bulloo
Quilpie
Paroo
Murweh
Balonne
Goondiwindi
Maranoa
Western Downs
Southern Downs
Toowoomba
Estimated resident population 2015
Percentage of population over 65 years of age
12.8
13.1
13.1
13.3
14.0
14.6
14.8
15.1
16.1
16.2
16.4
21.0
0 5 10 15 20 25
Bulloo
Balonne
Quilpie
Maranoa
Queensland
Western Downs
Murweh
Paroo
Goondiwindi
Toowoomba
South West Qld
Southern Downs

WorkAbility Qld – South West Qld NDIS Region Workforce Profile
October 2016 28
Source: ABS 3235.0, Population by Age and Sex, Regions of Australia unpublished data and Queensland Treasury estimates
Median Age
35.8
36.3
36.7
36.8
37.1
37.5
38.1
38.9
39
39.2
39.7
43.6
0 5 10 15 20 25 30 35 40 45 50
Maranoa
Murweh
Western Downs
Queensland
Balonne
Toowoomba
South West Queensland
Quilpie
Paroo
Goondiwindi
Bulloo
Southern Downs
WorkAbility Qld – South West Qld NDIS Region Workforce Profile
October 2016 29
Source: ABS, Census of Population and Housing, 2011, Indigenous Profile - I02 (usual residence)
Source: ABS, Census of Population and Housing, 2011, Basic Community Profile - B09 (usual residence)
Percentage of population identifying as Aboriginal and/or Torres Strait Islander
Percentage of population born overseas
0% 5% 10% 15% 20% 25% 30% 35%
Southern Downs
Toowoomba
Queensland
South West Qld
Western Downs
Goondiwindi
Maranoa
Quilpie
Murweh
Bulloo
Balonne
Paroo
0% 5% 10% 15% 20% 25%
Paroo
Bulloo
Balonne
Goondiwindi
Maranoa
Quilpie
Western Downs
Murweh
South West Qld
Southern Downs
Toowoomba
Queensland

WorkAbility Qld – South West Qld NDIS Region Workforce Profile
October 2016 30