Embed Size (px)
Citation preview

EU-WORKCLIMATE STUDY Executive Report -November 2005
1
E U - W O R K C L I M A T E
WORKCLIMATE AND EMPLOYMENT RELATIONS IN THE E.U., WITHIN
THE CONTEXT OF QUALITY OF WORK
(LESSONS,BENCHMARKS AND CHALLENGES AHEAD )

EU-WORKCLIMATE STUDY Executive Report -November 2005
2
Project Coordinator SPAIN: ESADE Business School, Instituto de Estudios Laborales (hereafter – IEL)
Partners GREECE: ALBA - Athens Laboratory of Business Administration
THE NETHERLANDS: Erasmus University Rotterdam
BELGIUM: Vlerick Leuven Gent Management School, HRM Centre
Associate Collaborators and Project Consultants ISRAEL: University of Haifa
UNITED KINDOM: Cranfield University
Great Place to Work Institute Europe1
Generalitat de Catalunya
EUWORKCLIMATE is a project funded by the Directorate General for Employment,
Social Affairs & Equal Opportunities within the Industrial relations and Social
Dialogue
1 Great Place to Work® (referred to hereafter as GPTW) is a registered trademark of Great Place to
Work® Institute, Inc. The material related to Great Place to Work® cited in this paper is the intellectual property of Great Place, is owned by Great Place to Work® Institute, Inc., and includes copyrightable subject matter that has been registred with the Copyright Office of the Library of Congress and other International bodies, as well as other valuable proprietary information. Use of the material owned by Great Place to Work® Institute, Inc. requires prior permission, and must conform with generally accepted legal and ethical standards of intellectual property protection, and with the guidelines of Great Place to Work® institute, Inc.
EU-WORKCLIMATE STUDY Executive Report -November 2005
3
Members of the Research Team
SPAIN: ESADE Business School, IEL
• Professor Simon L. Dolan – Director of Research, IEL
• Professor Joan Sureda - Professor of Quantitative Methods
• Mr. Francesc Cribillers Riera - Budget and Liaison Coordinator
• Ms. Miriam Diez Piñol - Senior Researcher IEL
• Mr. Xavier Suriol - Research Assistant IEL
• Ms. Sandra Rubio - Research Assistant IEL
• Ms. Begoña Puente Ordoñez - Research Assistant IEL
BELGIUM - Vlerick Leuven Ghent Management School
• Koen Dewettinck –
• Katleen de Stobbeleir -
GREECE - ALBA Graduate Business School
• Olga Epitropaki - Associate Professor of Organizational Behavior and
Human Resources Management
• Zoe Kourounakou - Director, Applied Research & International Projects
Department

EU-WORKCLIMATE STUDY Executive Report -November 2005
4
NETHERLANDS - Erasmus University Rotterdam Marcel Van Marrewijk - [email protected]
ISRAEL - University of Haifa
• Shay Tzafrir - [email protected]
UNITED KINDOM - Cranfield University
• Emma Parry - Research Fellow
• Richard Croucher - (Former Cranfield University - Currently at ….TBA)
EU-WORKCLIMATE STUDY Executive Report -November 2005
5
CONTENT
1. INTRODUCTION
2. SAMPLE PROFILE
2.1. Description of companies and participants in the sample profile
by year.
2.2. Demographic profile of the employees.
2.3. Profile of the participating companies by Industrial Sector.
3. DATA REDUCTION AND IDENTIFICATION OF A NEW SUB-SETS OF
FACETS: WORKCLIMATE REVISITED
4. PRINCIPAL RESULTS AND FINDING
4.1. Work climate in the EU: country differences analyses from a
cross sectional and longitudinal perspective.
4.2. Workclimate: analysis via cluster of countries.
4.3. Differences and communalities based on industrial sector.
4.4. The universal vs. the differential effects of work climate on firm
competitiveness in the UE.
5. CONCLUSIONS AND AGENDA FOR DEBATE
5.1. Work climate and Competitiveness: Analysis by Proxy.
5.2. Do happy employees equal Happy Shareholders?
5.3. Do happy and healthy employee contribute to company
competitiveness?

EU-WORKCLIMATE STUDY Executive Report -November 2005
6
1. INTRODUCTION
Is there a link between the quality of the workplace culture and productivity?
Do improvements in work climate and working conditions increase the quality and
efficiency of investment in human capital and does it translate into productivity
gains?. European firms are now involved in a dual race to increase the quality of life
of its respective employees and at the same time to remain competitive in the ever
increasing complex global world. Since the conclusion of the Lisbon European
Council at the year 2000, one of the challenges for the European Union has been “to
become the most competitive and dynamic knowledge-based economy in the world,
capable of sustaining economic growth, with more and better jobs, and greater
social cohesion”. Therefore, it is necessary to seek a convergence between
competitiveness and the quality of working life for employees as the basis for
promoting employee commitment, unleashing of organizational initiatives and the
development of personal potential. The social dialogue is the driving force behind
successful economic and social reforms.
The fundamental aim of the EU Workclimate project has been to conduct a
comparative analysis amongst 14 member countries based on standardized
information extrapolated from the “Great Place to Work® Europe” data bank. The
Great Place to Work® Institute, Inc. has developed over the years a methodology
(standardized instruments and data collection procedures) enabling the choice of
“best companies to work for” in each country. The data bank includes information
provided by employees and managers in hundreds of companies in each EU
member state, compiled during the period of 2003-2005. The Institute of Labor
Studies (IEL) at ESADE along with its other EU partners, has developed a strategy
to apply secondary data analyses in view of further exploring the data and
attempting to identify trends and benchmark cases at the country and industrial
sector levels.
The EU Workclimate project is based on standardized data supplied by
Great Place to Work® Europe. It has been collected in 14 European countries,
during the period 2003-2005 (i.e. three consecutive years). These data comes from
two sources: 1) The Trust Index© employee survey tool and, 2) The Culture Audit©.

EU-WORKCLIMATE STUDY Executive Report -November 2005
7
The Trust Index© is a measurement tool created to consider the quality of
relationships an employee experiences in the workplace. The Great Place to Work®
Model© is based on the experiences of people in the best companies or “Great
Workplaces” and the survey instrument was designed to reflect the attitudes and
behaviours that employees experience in a great workplace. The dimensions were
applied as an organizing principle – to support the broader discussion of the
concepts and enable people to see the theoretical link between the notion of trust
and trustworthiness, the overarching characteristics embedded in the perception of
trust (credibility, respect and fairness), and the sub dimensions of the model that
identify the behaviours and attitudes in framing clusters that make sense to
employees, managers and leaders in workplaces This questionnaire has been
completed by employees (in all job categories) who work in the firms that
participated in the Great Place to Work® as part of the annual competition/rankings.
In graphic form, the basic GPTW Model© is displayed in Figure 1.
Figure 1. Basic GPTW Model©
2005 Great Place to Work Institute Inc.
Credibility
Respect
Pride
Fairness
Camaraderie
Two-way Communication Competence
Integrity
Professional Support Collaboration
Caring
Equity Impartiality
Justice
Job Team
Organisation
Individuality Welcoming Atmosphere
“Family” Feeling
Dimension How it plays out in the
EU-WORKCLIMATE STUDY Executive Report -November 2005
8
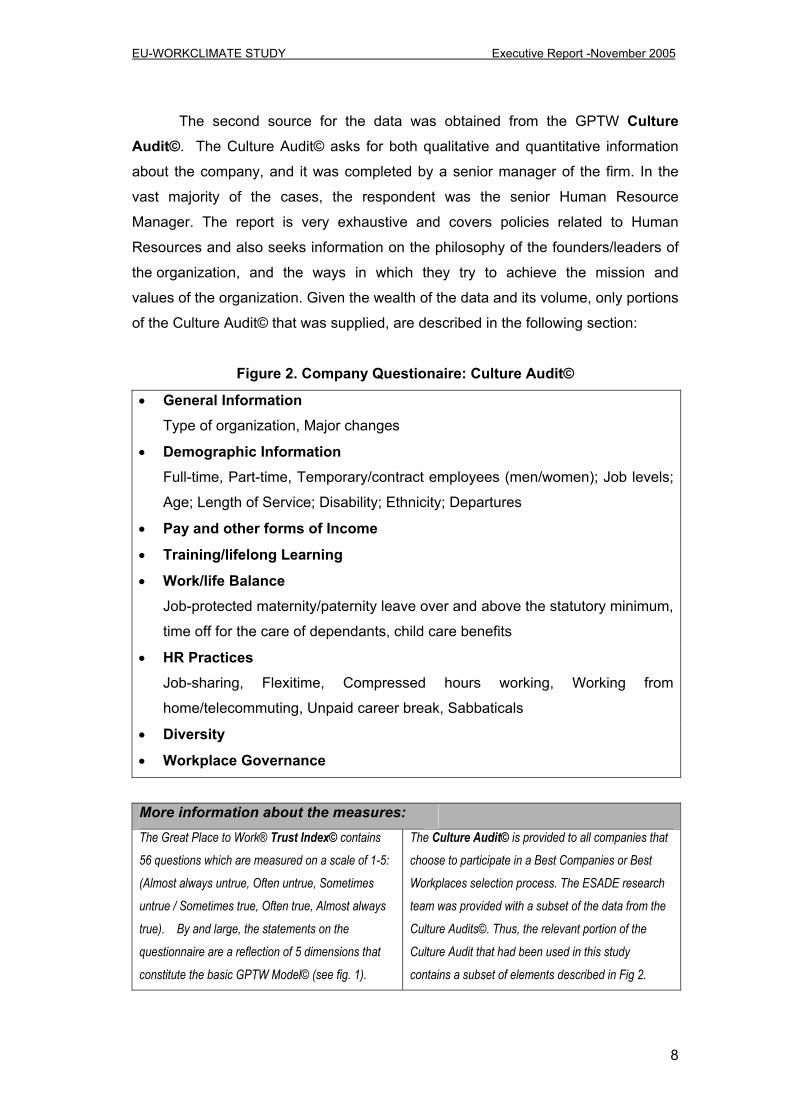
The second source for the data was obtained from the GPTW Culture Audit©. The Culture Audit© asks for both qualitative and quantitative information
about the company, and it was completed by a senior manager of the firm. In the
vast majority of the cases, the respondent was the senior Human Resource
Manager. The report is very exhaustive and covers policies related to Human
Resources and also seeks information on the philosophy of the founders/leaders of
the organization, and the ways in which they try to achieve the mission and
values of the organization. Given the wealth of the data and its volume, only portions
of the Culture Audit© that was supplied, are described in the following section:
Figure 2. Company Questionaire: Culture Audit©
• General Information Type of organization, Major changes
• Demographic Information Full-time, Part-time, Temporary/contract employees (men/women); Job levels;
Age; Length of Service; Disability; Ethnicity; Departures
• Pay and other forms of Income
• Training/lifelong Learning
• Work/life Balance Job-protected maternity/paternity leave over and above the statutory minimum,
time off for the care of dependants, child care benefits
• HR Practices Job-sharing, Flexitime, Compressed hours working, Working from
home/telecommuting, Unpaid career break, Sabbaticals
• Diversity
• Workplace Governance
More information about the measures:
The Great Place to Work® Trust Index© contains
56 questions which are measured on a scale of 1-5:
(Almost always untrue, Often untrue, Sometimes
untrue / Sometimes true, Often true, Almost always
true). By and large, the statements on the
questionnaire are a reflection of 5 dimensions that
constitute the basic GPTW Model© (see fig. 1).
The Culture Audit© is provided to all companies that
choose to participate in a Best Companies or Best
Workplaces selection process. The ESADE research
team was provided with a subset of the data from the
Culture Audits©. Thus, the relevant portion of the
Culture Audit that had been used in this study
contains a subset of elements described in Fig 2.

EU-WORKCLIMATE STUDY Executive Report -November 2005
9
2. SAMPLE PROFILE 2.1. Description of Companies and Participants in the sample profile by
year
While the study was intended to cover 15 countries, only 14 European
Countries were used as Luxemburg’s data was not made available. The sample is
made up of 2,578 companies where the Trust Index© of employees was obtained
during the three year period, with a total participation of 354,476 employees. Due to
the objectives and the methodology employed by GPTW, some countries have
greater number of firms participating in the survey than others. For example, the
larger contingency of participating employees (of the total population) are Germany
(16.8%), Italy (12.2%) and the UK (10.6%); whereas the lower participating
employees are the Netherlands (2.7%), Portugal (3.5%) and France (3.8%). Table 1
summarizes the distribution of the sample by year and country while also indicating
the participation of companies and employees (participants).
Table 1: Sample description by Year and Country
Companies Participants Companies Participants Companies Participants Companies ParticipantsAustria 56 7.100 57 7.280 49 7.176 162 21.556Belgium 50 6.148 61 7.327 43 5.462 154 18.937Denmark 88 11.681 70 10.428 67 9.188 225 31.297Finland 55 6.745 53 7.973 35 4.646 143 19.364France 49 5.938 23 3.026 27 4.577 99 13.541Germany 125 17.356 175 18.014 108 24.006 408 59.376Greece 50 5.408 50 5.651 39 4.200 139 15.259Ireland 101 10.422 83 9.781 75 9.060 259 29.263Italy 71 13.384 60 14.663 62 15.134 193 43.181Portugal 39 3.395 33 4.550 33 4.388 105 12.333Spain 109 11.819 38 6.242 49 7.722 196 25.783Sweden 66 8.909 30 4.074 29 4.676 125 17.659The Netherlands 17 1.656 23 2.498 27 5.356 67 9.510United Kingdom 101 12.289 98 11.859 104 13.269 303 37.417Total 977 122.250 854 113.366 747 118.860 2.578 354.476
2003 2004 2005 TOTAL

EU-WORKCLIMATE STUDY Executive Report -November 2005
10
2.2. Demographic profile of the employees
Figures 3a. 3b. and 3c, provides a synoptic description of the sample
demographic characteristics of the employees by gender, age, type of job, years of
service and work status. The principal observations that can be extracted from the
above figures are summarized in the paragraphs that follow.
Figure 3a. Demographic Distribution for 2003
Gender: Although the percentage of women in employment remains lower than that
of men, we can see that the gender composition shows a slight increase of
feminization in employment. In 2004, the difference between male and female
employees was just of 4% compared to a 10% difference in 2003. In 2005 the
difference did not show a significant change when compared to the previous year.
Age: No considerable variation in the age composition along the three year period
was noticed. The concentration of the employees is between 26 and 44 years---
representing the 64%, 65% and 66% of the employees in years 2003, 2004 and
2005 respectively. The younger and older employees represent the minority across
all three year, not more than 11% and 6% in each case, respectively.
GENDER
2%
44%
54%
Female Male Missed
TYPE OF JOB
32%
19%
26%
16%
4% 3%
Clerical/Administrative Production/Services
Professional/Technical Manager/Supervisor
Executive/Senior Manager Missed
AGE2%
6%11%
17%
29%
35%
25 years or younger 26 years to 34 years
35 years to 44 years 45 years to 54 years
55 years or older Missed
YEARS OF SERVICE
6%
2%
16%
12%
13% 22%
29%
Less than 2 years 2 years to 5 years6 years to 10 years 11 years to 15 years16 years to 20 years Over 20 yearsMissed
WORK STATUS
10%
85%
5%
Full-time Part-time Missed
RACIAL / ETNIC MINORITY
5%9%
86%
Yes No Missed
EU-WORKCLIMATE STUDY Executive Report -November 2005
11
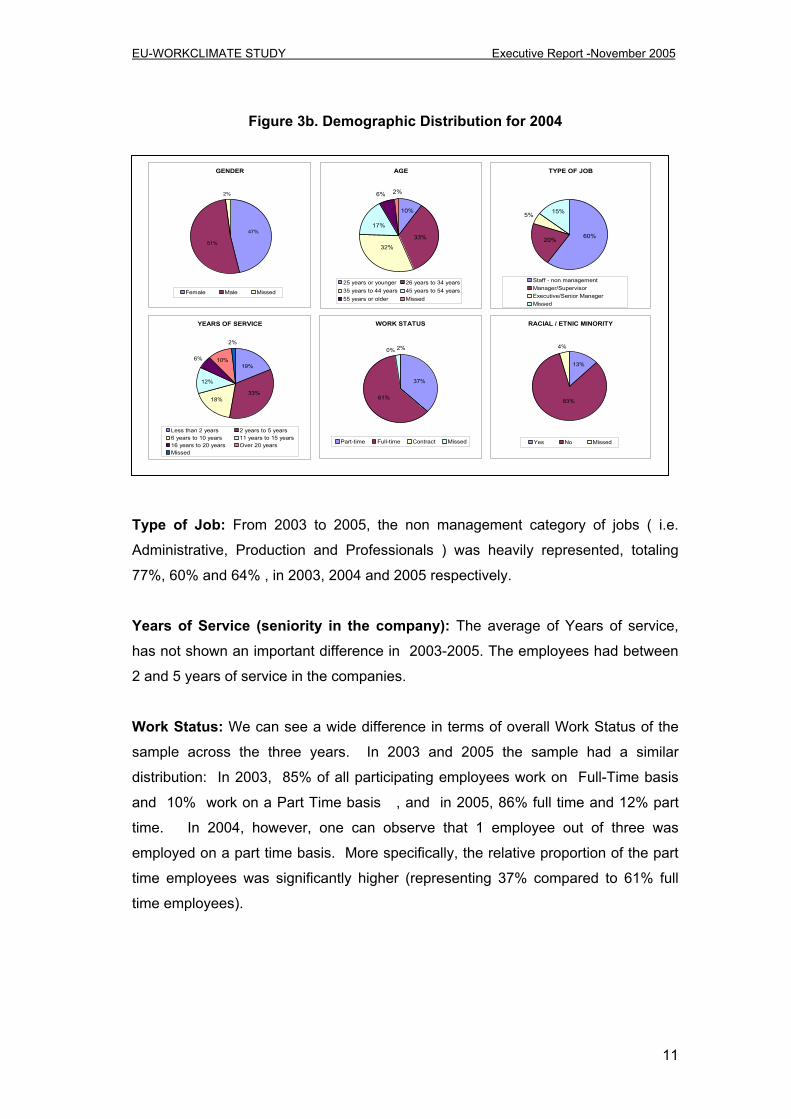
Figure 3b. Demographic Distribution for 2004
Type of Job: From 2003 to 2005, the non management category of jobs ( i.e.
Administrative, Production and Professionals ) was heavily represented, totaling
77%, 60% and 64% , in 2003, 2004 and 2005 respectively.
Years of Service (seniority in the company): The average of Years of service,
has not shown an important difference in 2003-2005. The employees had between
2 and 5 years of service in the companies.
Work Status: We can see a wide difference in terms of overall Work Status of the
sample across the three years. In 2003 and 2005 the sample had a similar
distribution: In 2003, 85% of all participating employees work on Full-Time basis
and 10% work on a Part Time basis , and in 2005, 86% full time and 12% part
time. In 2004, however, one can observe that 1 employee out of three was
employed on a part time basis. More specifically, the relative proportion of the part
time employees was significantly higher (representing 37% compared to 61% full
time employees).
GENDER
2%
47%
51%
Female Male Missed
AGE
6% 2%
10%
17%
32%
33%
25 years or younger 26 years to 34 years35 years to 44 years 45 years to 54 years55 years or older Missed
TYPE OF JOB
5%
60%20%
15%
Staff - non managementManager/SupervisorExecutive/Senior ManagerMissed
YEARS OF SERVICE
6%
2%
18%
12%
10%19%
33%
Less than 2 years 2 years to 5 years6 years to 10 years 11 years to 15 years16 years to 20 years Over 20 yearsMissed
WORK STATUS
0% 2%
61%
37%
Part-time Full-time Contract Missed
RACIAL / ETNIC MINORITY
4%
13%
83%
Yes No Missed

EU-WORKCLIMATE STUDY Executive Report -November 2005
12
Figure 3c. Demographic Distribution for 2005
2.3. Profile of the Participating Companies by industrial sector
Sector Description
In an attempt to identify some benchmarks sectors across the EU, the
companies profiled in the data set were re-grouped into the following categories:
Automotive, Financial services, Consumer Goods / Food & Beverage Industry ,
Construction, Consulting & Auditing, Healthcare, Hotels, Restaurants, catering and
tourism, Information technology & Telecommunications, Public service / Non Profit,
manufacturing & Production Industry, Media, retail and distribution, Transport,
textile/Clothing/Leather and services.2
2 The classification was adopted from the Cranfield Network on Comparative Human
Resource Management (CRANET) project. The Network itself is a collaboration between 39 universities and business schools, of which ESADE is part of. The Network: (a) carries out a regular international comparative survey of organisational policies and practices in comparative Human Resource Management (HRM) across Europe (b) provides benchmarks for comparing Europe with developments elsewhere in the world. This allows a systematic comparative analysis of trends in Human Resource Management policies and practices within employing organisations. For more information see: http://www.cranet.org/about/about.htm
GENDER
45%
52%
3%
Female Male Missed
AGE
11%
34%
32%
16%
5% 2%
25 years or younger 26 to 34 years
35 to 44 years 45 to 54 years
55 years or older Missed
TYPE OF JOB
64%
23%
8%5%
Staff - non-management Manager/Supervisor
Executive/Senior Manager Missed
YEARS OF SERVICE
19%
32%
20%
11%
6%
10%2%
Less than 2 years 2 to 5 years6 to 10 years 11 to 15 years16 to 20 years Over 20 yearsMissed
WORK STATUS
86%
12%2%
Full-time Part-time Missed
RACIAL OR ETNIC MINORITY
5%
76%
19%
Yes No Missed
EU-WORKCLIMATE STUDY Executive Report -November 2005
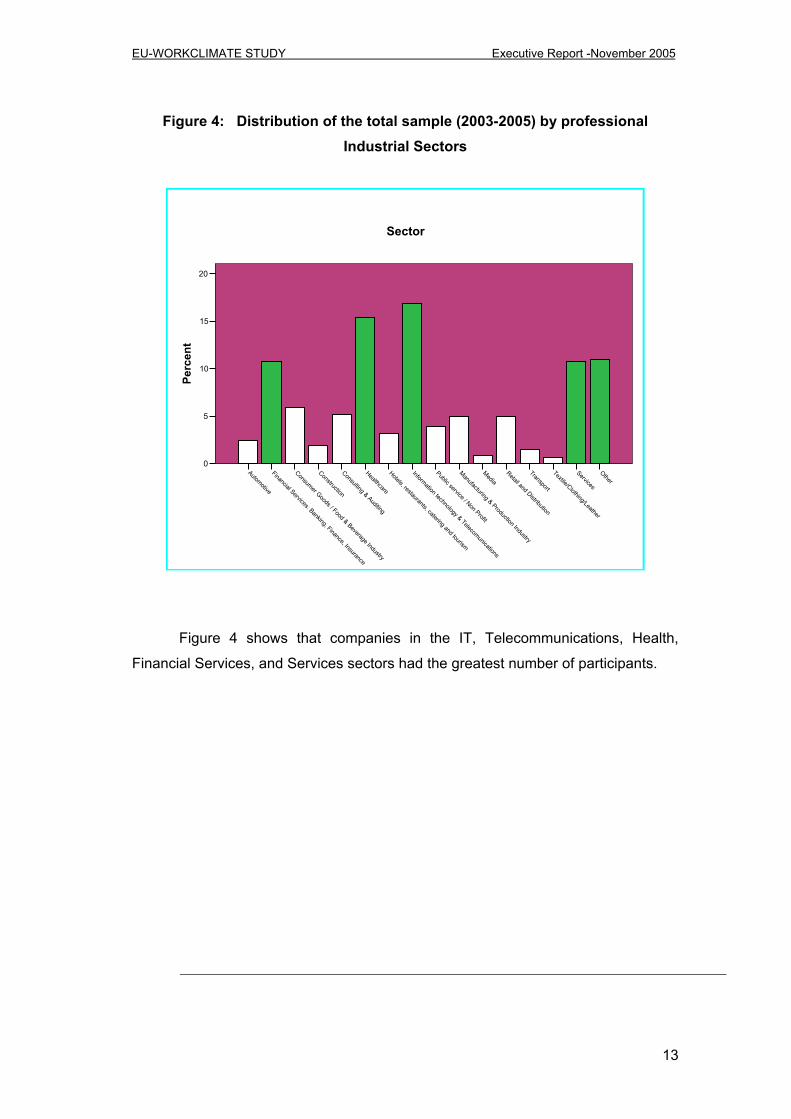
13
Figure 4: Distribution of the total sample (2003-2005) by professional Industrial Sectors
OtherServices
Textile/Clothing/Leather
Transport
Retail and Distribution
MediaManufacturing & Production Industry
Public service / Non Profit
Information technology & Telecomunications
Hotels, restaurants, catering and tourism
Healthcare
Consulting & Auditing
Construction
Consumer Goods / Food & Beverage Industry
Financial Services: Banking, Finance, Insurance
Automotive
20
15
10
5
0
Perc
ent
Sector
Figure 4 shows that companies in the IT, Telecommunications, Health,
Financial Services, and Services sectors had the greatest number of participants.

EU-WORKCLIMATE STUDY Executive Report -November 2005
14
3. DATA REDUCTION AND IDENTIFICATION OF NEW SUB-SETS OF FACETS: WORK CLIMATE REVISITED
The gathering of primary data was based on the original model proposed by
Great Place to Work®. Subsequently, the robustness and stability of the conceptual
model were studied in order to compare the results obtained for European countries
and to provide a reference point when drawing upon secondary sources.
Analyses revealed the initial model to be stable over the 3 years studied
(2003, 2004 and 2005) and for each of the participating countries. This gives us
reasonable confidence that the data structure remains fairly consistent over time.
The original GPTW Model© tested via Factor Analysis and LISREL, shows
one unique factor and does not clearly support the orthogonality of the dimensions.
The same picture arises when tested for each country and year. Thus, an attempt
was made to develop a simple and more parsimonious approach using only subsets
of the data. For strategic as well as for psychometric reasons, it was decided that
new subsets of data be used for the remainder of the analyses. Using only 34 relevant statements (see Table 2) provided sufficient psychometric properties (as to reliability and validity) to justify the subsequent analyses.
Lastly, the selected statements have been rearranged in five new “facets”.
Only “camaraderie” is repeated in the new analysis format. This was the result of the
content validation process (through direct debate and semi-Delphi methods amongst
the partners and consultants participating in this study). All of the study partners
have taken part in this process, contributing their own theoretical perspectives. The
methodology employed is often referred to in the academic literature as an “expert
panels”.

EU-WORKCLIMATE STUDY Executive Report -November 2005
15
Table 2: Description of the facets resulting from the factor analysis with its corresponding items and coefficients of homogeneity (Alphas) as well as
goodness of fit (Comparative Fit Index, CFI)
Note: The survey tool Trust Index© and each individual statement is copyrighted
and protected intellectual Property of the Great Place to Work© Institute, Inc.
LEVEL OF ANALYSIS
DIMENSION/ FACTOR
ÍTEMS
Relations
amongst
employees
CAMARADERIE
Alpha = 0.856
CFI =0.998
You can count on people to co-operate When people change jobs or work units,
they are made to feel right at home People care about each other here There is a "family" or "team" feeling here We are all in this together
EQUAL
OPPORTUNITIES
Alpha = 0.831
CFI = Model
perfectly identified
(no test available)
People here are treated fairly, regardless of age
People here are treated fairly, regardless of race
People here are treated fairly, regardless of sex
Relations
between
employees
and the firm
in general PRIDE IN JOB & COMPANY
Alpha = 0.851
CFI = 0.999
My work has special meaning, this is not "just a job"
When I look at what we accomplish, I feel a sense of pride
I feel good about the ways we contribute to the community
I am proud to tell others I work here I feel I make a difference here

EU-WORKCLIMATE STUDY Executive Report -November 2005
16
FAIR & SOUND HR PRACTICES
Alpha = 0.828
CFI = 0.998
People here are paid fairly for the work they do
People are encouraged to balance their work life and personal life
If I am unfairly treated, I believe I will be given a fair shake if I appeal
We have special and unique benefits here
People celebrate special events around here
Our facilities contribute to a good working environment
Relations
between
Employees
and
Management
MANAGEMENT COMPETENCY &
CREDIBILITY
Alpha = 0.954
CFI = 0.980
Everyone has an opportunity to get special recognition
Management makes its expectations clear
I can ask management any reasonable question and get a straight answer
Management shows appreciation for good work and extra effort
Management is approachable, easy to talk with
Management genuinely seeks and responds to suggestions and ideas
Management keeps me informed about important issues and changes
Management has a clear view of where the organization is going and how to get there
Management involves people in decisions that affect their jobs or work environment
Management does a good job of assigning and co-ordinating people
Promotions go to those who best deserve them
Management delivers on its promises Managements actions match its words Management is competent at running the
business Management is honest and ethical in its
business practices
EU-WORKCLIMATE STUDY Executive Report -November 2005
17
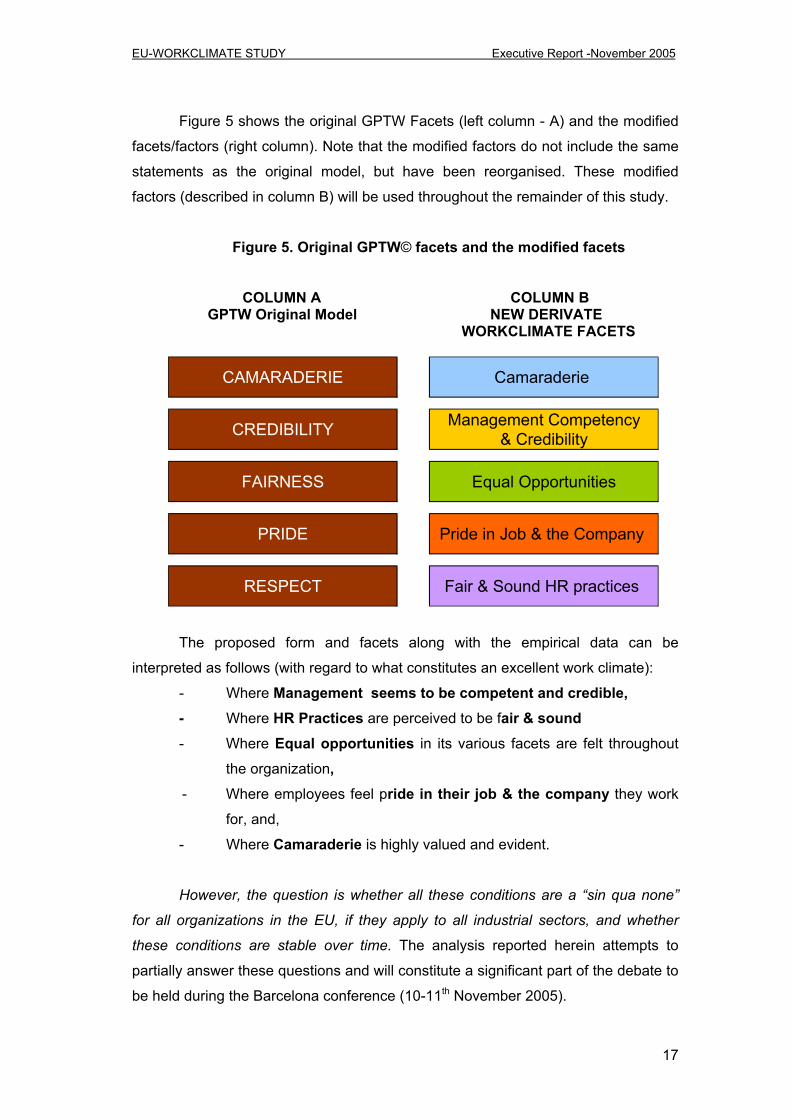
Figure 5 shows the original GPTW Facets (left column - A) and the modified
facets/factors (right column). Note that the modified factors do not include the same
statements as the original model, but have been reorganised. These modified
factors (described in column B) will be used throughout the remainder of this study.
Figure 5. Original GPTW© facets and the modified facets
COLUMN A COLUMN B
GPTW Original Model NEW DERIVATE WORKCLIMATE FACETS
The proposed form and facets along with the empirical data can be
interpreted as follows (with regard to what constitutes an excellent work climate):
- Where Management seems to be competent and credible, - Where HR Practices are perceived to be fair & sound - Where Equal opportunities in its various facets are felt throughout
the organization, - Where employees feel pride in their job & the company they work
for, and,
- Where Camaraderie is highly valued and evident.
However, the question is whether all these conditions are a “sin qua none”
for all organizations in the EU, if they apply to all industrial sectors, and whether
these conditions are stable over time. The analysis reported herein attempts to
partially answer these questions and will constitute a significant part of the debate to
be held during the Barcelona conference (10-11th November 2005).
CAMARADERIE Camaraderie
CREDIBILITY Management Competency & Credibility
FAIRNESS Equal Opportunities
PRIDE Pride in Job & the Company
RESPECT Fair & Sound HR practices

EU-WORKCLIMATE STUDY Executive Report -November 2005
18
4. PRINCIPAL RESULTS AND FINDINGS 4.1 Work Climate in the EU: analyses of Country Differences from a cross-
sectional and longitudinal perspective
The primary data cover 3 years (2003, 2004 and 2005). This is not a
representative sample given that although the same company may appear from one
year to the next, the samples themselves are different. One should also note that
the variation explained by the various factors is relatively low given that the universe
of companies studied belongs to those at the top of the business rankings.
An initial analysis was conducted to ascertain whether the data from one
year to the next showed significant variations. The ANOVA studies ( p=.0000)
revealed that there were certain differences between the 3 years, for which reason
we have chosen to present the partial results for each of the years in the study. The
following figure (figure 6) shows the differences observed over the 3 years with
respect to the 5 dimensions/facets of work climate analysed.
Figure 6: Results by the 5 dimensions of Work Climate in 2003-05 CAMARADERIE
200520042003
any
4,15000
4,10000
4,05000
4,00000
3,95000
3,90000
Mea
n of
CA
MA
R_S
O

EU-WORKCLIMATE STUDY Executive Report -November 2005
19
MANAGEMENT COMPETENCY & CREDIBILITY
200520042003
any
4,25000
4,20000
4,15000
4,10000
4,05000
4,00000
Mea
n of
CR
ED_S
O
EQUAL OPPORTUNITIES
200520042003
any
4,78000
4,76000
4,74000
4,72000
4,70000
4,68000
4,66000
4,64000
Mea
n of
DIS
CR
I_SO
PRIDE IN JOB & COMPANY
200520042003
any
4,45000
4,40000
4,35000
4,30000
4,25000
4,20000
4,15000
Mea
n of
PR
IDE_
SO

EU-WORKCLIMATE STUDY Executive Report -November 2005
20
FAIR & SOUND PRACTICES
200520042003
any
3,98000
3,96000
3,94000
3,92000
3,90000
3,88000
3,86000
3,84000
Mea
n of
RES
P_SO
Examination of Figure 6 reveals that the differences between the 3 years all
follow the same trend. However, the slop is a bit steeper for 2004 and less steep
for 2005.
Camaraderie
Figures 7 a, b and c shows the relative position of the 14 EU countries on the
Camaraderie scale for the three-year study. Although all the countries are
characterized by relatively higher score (i.e. high means on the scale), differences
between some countries on Camaraderie are statistically significant (p=oooo).

EU-WORKCLIMATE STUDY Executive Report -November 2005
21
Figure 7a: Camaraderie by country for the year 2003
United Kingdom
The Netherlands
Sweden
SpainPortugal
ItalyIreland
Greece
Germany
France
Finland
Denmark
Belgium
Austria
Country
4,30000
4,20000
4,10000
4,00000
3,90000
3,80000
3,70000
3,60000
3,50000
Mea
n of
CA
MA
R_S
O
Figure 7b: Camaraderie by country for the year 2004
United Kingdom
The Netherlands
Sweden
SpainPortugal
ItalyIreland
Greece
Germany
France
Finland
Denmark
Belgium
Austria
Country
4,40000
4,20000
4,00000
3,80000
3,60000
Mea
n of
CA
MA
R_S
O

EU-WORKCLIMATE STUDY Executive Report -November 2005
22
Figure 7c: Camaraderie by country for the year 2005
United Kingdom
The Netherlands
Sweden
SpainPortugal
ItalyIreland
Greece
Germany
France
Finland
Denmark
Belgium
Austria
Country
4,40000
4,30000
4,20000
4,10000
4,00000
3,90000
3,80000
3,70000
Mea
n of
CA
MA
R_S
O
Conclusion: As far as Camaraderie is concerned, the interpretation of the relatively
lower scores is more evident: Italian firms have systematically lower scores than the
rest of the countries in Europe. In 2004, France joined Italy to manifest relatively
lower scores in this respect. The picture with regard to those countries scoring
highest on Camaraderie is not as clear-cut. There is a large block of countries where
the differences is minimal. Yet, Austrian firms show a higher score for all the three
years, followed by Scandinavian countries in the other years, and the UK.
Management Competency and Credibility
Figures 8a, b and c show the relative position of the 14 EU countries on the
Management competency and credibility scale for the three year study. Although all
the countries are characterized by relatively high score (i.e. high means on the
scale), differences between some countries on this criteria are statistically significant
(p=oooo).

EU-WORKCLIMATE STUDY Executive Report -November 2005
23
Figure 8a: Management competency and credibility by country in 2003
United Kingdom
The Netherlands
Sweden
SpainPortugal
ItalyIreland
Greece
Germany
France
Finland
Denmark
Belgium
Austria
Country
4,40000
4,30000
4,20000
4,10000
4,00000
3,90000
3,80000
Mea
n of
CR
ED_S
O
Figure 8b: Management Competency & Credibility by country in 2004
United Kingdom
The Netherlands
Sweden
SpainPortugal
ItalyIreland
Greece
Germany
France
Finland
Denmark
Belgium
Austria
Country
4,40000
4,30000
4,20000
4,10000
4,00000
3,90000
Mea
n of
CR
ED_S
O

EU-WORKCLIMATE STUDY Executive Report -November 2005
24
Figure 8c: Management Competency and Credibility by country in 2005
United Kingdom
The Netherlands
Sweden
SpainPortugal
ItalyIreland
Greece
Germany
France
Finland
Denmark
Belgium
Austria
Country
4,60000
4,50000
4,40000
4,30000
4,20000
4,10000
4,00000
3,90000
3,80000
Mea
n of
CR
ED_S
O
Conclusion: Italy seemed to score lowest over the 3 years, and was joined in 2004
by Finland. Greece was one of the countries with the highest average, particularly
in 2003 and 2004.

EU-WORKCLIMATE STUDY Executive Report -November 2005
25
Equal opportunities
Figure 9a: Equal Opportunities by country in 2003
United Kingdom
The Netherlands
Sweden
SpainPortugal
ItalyIreland
Greece
Germany
France
Finland
Denmark
Belgium
Austria
Country
4,90000
4,80000
4,70000
4,60000
4,50000
4,40000
4,30000
Mea
n of
DIS
CR
I_SO
Figure 9b: Equal Opportunities by country in 2004
United Kingdom
The Netherlands
Sweden
SpainPortugal
ItalyIreland
Greece
Germany
France
Finland
Denmark
Belgium
Austria
Country
4,90000
4,80000
4,70000
4,60000
4,50000
4,40000
Mea
n of
DIS
CR
I_SO

EU-WORKCLIMATE STUDY Executive Report -November 2005
26
Figure 9c: Equal Opportunities by country in 2005
United Kingdom
The Netherlands
Sweden
SpainPortugal
ItalyIreland
Greece
Germany
France
Finland
Denmark
Belgium
Austria
Country
5,00000
4,90000
4,80000
4,70000
4,60000
4,50000
4,40000
Mea
n of
DIS
CR
I_SO
Conclusion: One of the results that stand out in comparison with the other
dimensions presented so far is the high dispersion of marks according to country.
Nonetheless, Italy maintains its lowest score on this dimension.
EU-WORKCLIMATE STUDY Executive Report -November 2005
27
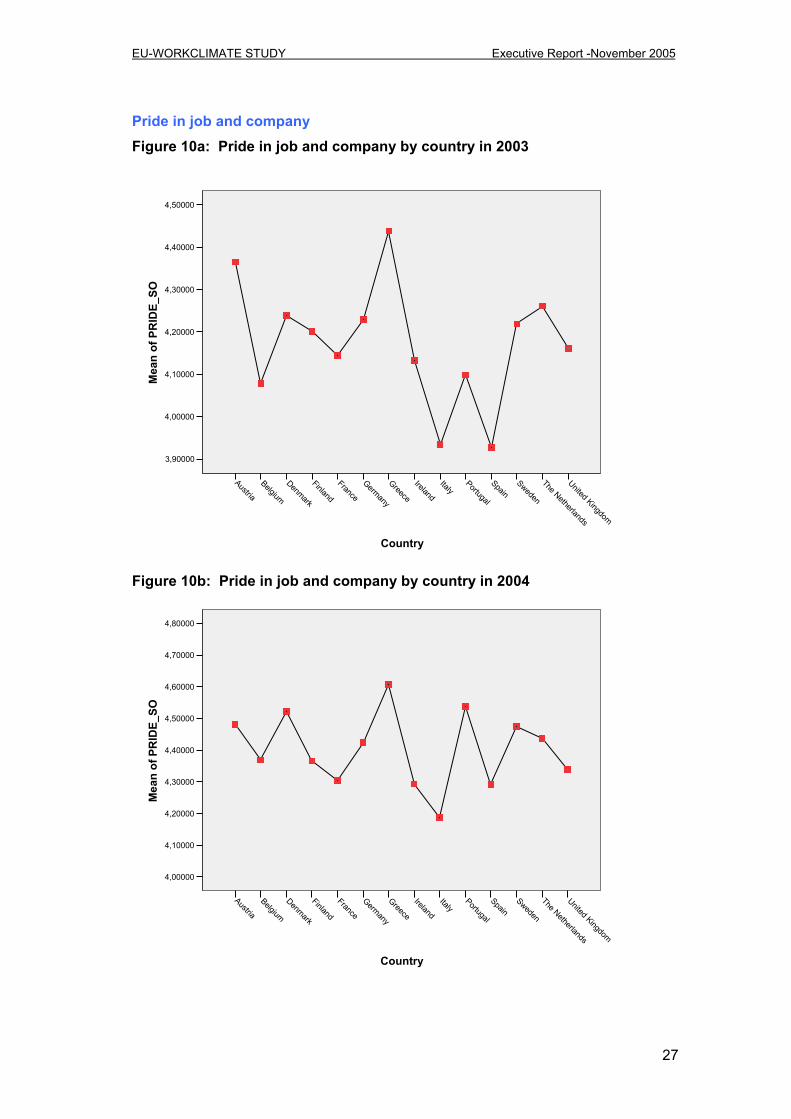
Pride in job and company Figure 10a: Pride in job and company by country in 2003
United Kingdom
The Netherlands
Sweden
SpainPortugal
ItalyIreland
Greece
Germany
France
Finland
Denmark
Belgium
Austria
Country
4,50000
4,40000
4,30000
4,20000
4,10000
4,00000
3,90000
Mea
n of
PR
IDE_
SO
Figure 10b: Pride in job and company by country in 2004
United Kingdom
The Netherlands
Sweden
SpainPortugal
ItalyIreland
Greece
Germany
France
Finland
Denmark
Belgium
Austria
Country
4,80000
4,70000
4,60000
4,50000
4,40000
4,30000
4,20000
4,10000
4,00000
Mea
n of
PR
IDE_
SO

EU-WORKCLIMATE STUDY Executive Report -November 2005
28
Figure 10c: Pride in job and company by country in 2005
United Kingdom
The Netherlands
Sweden
SpainPortugal
ItalyIreland
Greece
Germany
France
Finland
Denmark
Belgium
Austria
Country
4,60000
4,50000
4,40000
4,30000
4,20000
4,10000
Mea
n of
PR
IDE_
SO
Conclusion: The charts for each period reveal the absence of any response
pattern over the period. However, some countries, such as Italy, have the relatively
lowest score in each year. One should also note that Spain (along with Italy) also
appeared in the lower score for 2003.

EU-WORKCLIMATE STUDY Executive Report -November 2005
29
Fair & Sound HR practices
Figure 11a: Fair & Sound HR practices by country in 2003
United Kingdom
The Netherlands
Sweden
SpainPortugal
ItalyIreland
Greece
Germany
France
Finland
Denmark
Belgium
Austria
Country
4,20000
4,10000
4,00000
3,90000
3,80000
3,70000
3,60000
3,50000
3,40000
Mea
n of
RES
P_SO
Figure 11b: Fair & Sound HR practices by country in 2004
United Kingdom
The Netherlands
Sweden
SpainPortugal
ItalyIreland
Greece
Germany
France
Finland
Denmark
Belgium
Austria
Country
4,10000
4,00000
3,90000
3,80000
Mea
n of
RES
P_SO

EU-WORKCLIMATE STUDY Executive Report -November 2005
30
Figure 11c: Fair & Sound HR practices by country in 2005
United Kingdom
The Netherlands
Sweden
SpainPortugal
ItalyIreland
Greece
Germany
France
Finland
Denmark
Belgium
Austria
Country
4,20000
4,10000
4,00000
3,90000
3,80000
3,70000
3,60000
Mea
n of
RES
P_SO
Conclusion: The 3 graphs in Figure 11a, b and c shows again that Italy, France
and Spain were consistently at the bottom end of the scale over the 3-year period.
4.2. Work Climate: Analysis via Cluster of Countries
4.2.1. Identification of country clusters
In a series of subsequent analyses, using cluster analysis based on the 5
factors and Ward algorithm, 3 clusters of countries were identified as having
commonalities: The results are summarized in Figure 12 and 13 respectively.

EU-WORKCLIMATE STUDY Executive Report -November 2005
31
Figure 12: Classification of European participant countries (14) by clusters
Denmark 3 òø Sweden 12 òôòø United Kingdom 14 ò÷ ùòòòø Germany 6 òø ó ó Portugal 10 òôò÷ ùòòòòòòòòòòòòòòòòòòòòòòòòòòòòòòòòòòòòòòòòòø Belgium 2 ò÷ ó ó Ireland 8 òûòòòø ó ó The Netherlands 13 ò÷ ùò÷ ó Austria 1 òûòòò÷ ó Greece 7 ò÷ ó Finland 4 òø ó France 5 òôòòòø ó Spain 11 ò÷ ùòòòòòòòòòòòòòòòòòòòòòòòòòòòòòòòòòòòòòòòòòòò÷ Italy 9 òòòòò÷
Figure 13: Sample distribution by cluster of countries
Cluster1: Countries with relative high score on the criterion (each of the 5 facets of
Workclimate)
Cluster 2: Countries with relative medium score on the criterion (each of the 5
facets of Workclimate)
Cluster 3: Countries with relative low score on the criterion (each of the 5 facets of
Workclimate)
Figure 13a: CLUSTER 1
The Netherlands
IrelandGreece
Austria
Country
40
30
20
10
0
Perce
nt
Country
EU-WORKCLIMATE STUDY Executive Report -November 2005
32
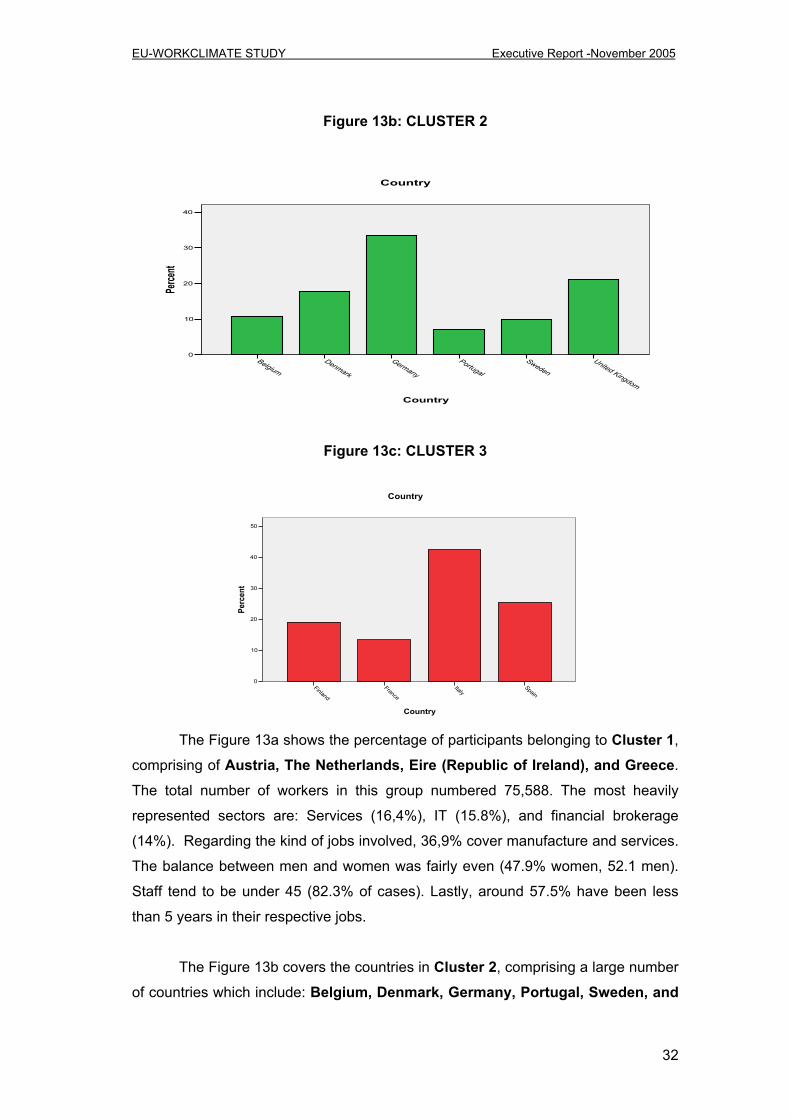
Figure 13b: CLUSTER 2
United Kingdom
SwedenPortugal
Germany
Denmark
Belgium
Country
40
30
20
10
0
Perce
ntCountry
Figure 13c: CLUSTER 3
SpainItaly
France
Finland
Country
50
40
30
20
10
0
Perc
ent
Country
The Figure 13a shows the percentage of participants belonging to Cluster 1,
comprising of Austria, The Netherlands, Eire (Republic of Ireland), and Greece.
The total number of workers in this group numbered 75,588. The most heavily
represented sectors are: Services (16,4%), IT (15.8%), and financial brokerage
(14%). Regarding the kind of jobs involved, 36,9% cover manufacture and services.
The balance between men and women was fairly even (47.9% women, 52.1 men).
Staff tend to be under 45 (82.3% of cases). Lastly, around 57.5% have been less
than 5 years in their respective jobs.
The Figure 13b covers the countries in Cluster 2, comprising a large number
of countries which include: Belgium, Denmark, Germany, Portugal, Sweden, and

EU-WORKCLIMATE STUDY Executive Report -November 2005
33
the UK. 15.2% of participants work in the health sector, 14.7% work in IT, and
35.2% work in manufacturing/services sectors. The balance between men and
women is fairly even (54.3% and 45.7%, respectively). The average age of
participants is a little higher than in the previous group (52.1% have worked less
than 5 years in their respective firms).
Lastly, figure 13c, Cluster 3, depicts comprising Finland, France, Italy, and Spain. The total number of workers in this group totals 101,872. The largest
segment of these (25%) work in the health industry, followed by IT (15,9%). The
major portion of these workers do professional and technical jobs (28.9%). 77.2%
are under 45 and 49.8% have worked 5 years or less in their firms. One should also
note that this group of workers has the largest number of people with long-term
employment contracts (78.5%).
We have seen that there are certain constant patterns in the survey responses
which lead to the same countries being placed in one part or other of the scale.
Various CHAID analyses were performed to test that the country differences were
not contaminated by the demographic composition of the samples.3 We have
analyzed the relationship between each of the dimensions and a variety of
demographic characteristics. Albeit the fact that some significant differences
appears in some cases (e.g. type of job, years of service, sector), the results were
negligible and none significant for the majority of the cases, except for Country. For
this reason, the variable “country” was the one that had been retained for comparing
the dimensions in the remainder of this analysis.
4.2. 2. Relationship between country clusters and work climate dimensions
The following figures (Fig. 14 and Fig. 15) show some of the trends between
the various country clusters for some of the dimensions studied, the most relevant of
which are presented below.
3 Note: CHAID (Chi-Square Automatic Interaction Detection) is a classification trees program
developed by Kass (1980) that performs multi-level splits when computing classification trees. Classification trees are used to predict membership of cases or objects in the classes of a categorical dependent variable from their measurements on one or more predictor variable

EU-WORKCLIMATE STUDY Executive Report -November 2005
34
Figure 14: Cameraderie between 2003-2005
321
group
4,10000
4,00000
3,90000
3,80000
3,70000
Mea
n of
CA
MA
R_S
O2003
321
group
4,20000
4,15000
4,10000
4,05000
4,00000
3,95000
3,90000
Mea
n of
CA
MA
R_S
O
2004
321
group
4,25000
4,20000
4,15000
4,10000
4,05000
4,00000
3,95000
3,90000
3,85000
Mea
n of
CA
MA
R_S
O
2005

EU-WORKCLIMATE STUDY Executive Report -November 2005
35
Figure. 15. Management Competency and Credibility between 2003-2005
321
group
4,25000
4,20000
4,15000
4,10000
4,05000
4,00000
3,95000
3,90000
3,85000
Mea
n of
CR
ED_S
O
2003
321
group
4,30000
4,20000
4,10000
4,00000
Mea
n of
CR
ED_S
O
2004
321
group
4,40000
4,30000
4,20000
4,10000
4,00000
Mea
n of
CR
ED_S
O
2005
EU-WORKCLIMATE STUDY Executive Report -November 2005
36
Based on the foregoing figures, one can say that the analyses support the
country results. In general, 2005 has revealed changes in perceptions of work
climate.
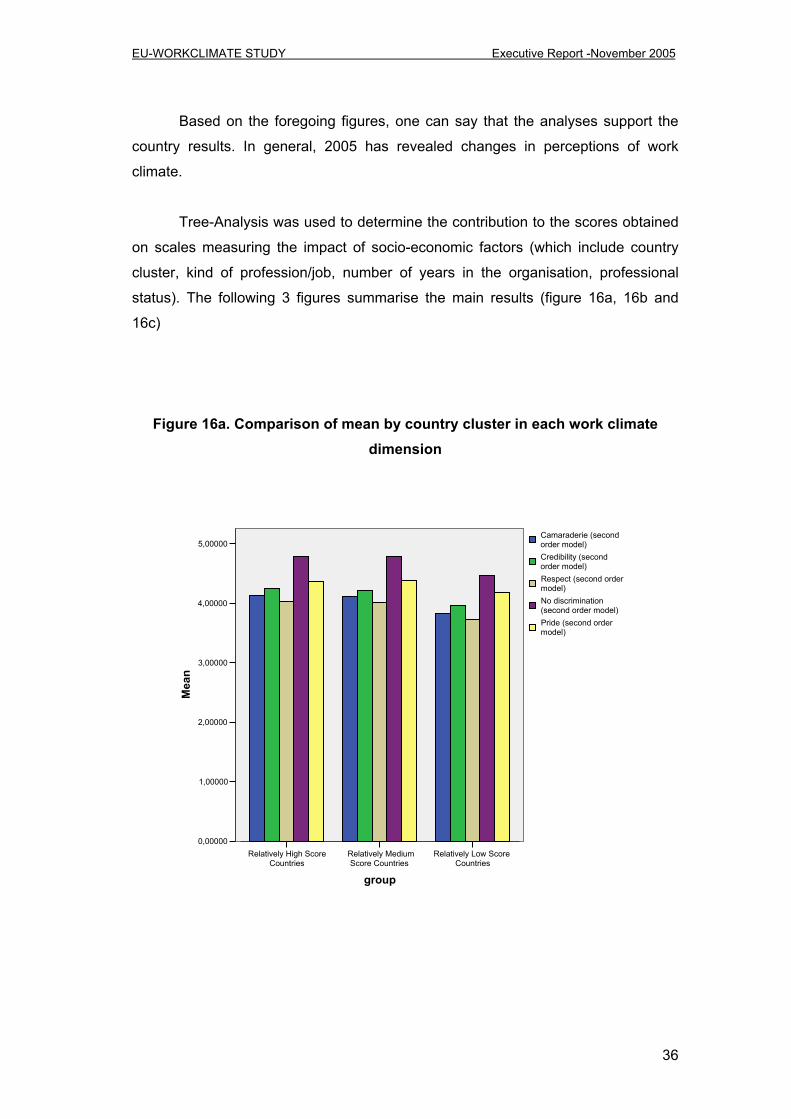
Tree-Analysis was used to determine the contribution to the scores obtained
on scales measuring the impact of socio-economic factors (which include country
cluster, kind of profession/job, number of years in the organisation, professional
status). The following 3 figures summarise the main results (figure 16a, 16b and
16c)
Figure 16a. Comparison of mean by country cluster in each work climate dimension
Relatively Low ScoreCountries
Relatively MediumScore Countries
Relatively High ScoreCountries
group
5,00000
4,00000
3,00000
2,00000
1,00000
0,00000
Mea
n
Pride (second ordermodel)
No discrimination(second order model)
Respect (second ordermodel)
Credibility (secondorder model)
Camaraderie (secondorder model)

EU-WORKCLIMATE STUDY Executive Report -November 2005
37
Figure 16b. Comparison of the mean by type of job in each work climate dimensions
Executive/SeniorManager
Manager/Supervisor
Professional/Technical
Production/Services
Clerical/Administrative
A. Type of job:
5,00000
4,00000
3,00000
2,00000
1,00000
Mea
n
Pride (second ordermodel)
No discrimination(second order model)
Respect (second ordermodel)
Credibility (secondorder model)
Camaraderie (secondorder model)
Figure 16c. Comparison of mean by years in the organization in each work
climate dimension
Over 20years
16 years to20 years
11 years to15 years
6 years to10 years
2 years to5 years
Less than2 years
D. Years of service with this organization:
5,00000
4,00000
3,00000
2,00000
1,00000
Mea
n
Pride (second ordermodel)
No discrimination(second order model)
Respect (second ordermodel)
Credibility (secondorder model)
Camaraderie (secondorder model)

EU-WORKCLIMATE STUDY Executive Report -November 2005
38
As demonstrated in figure 16 (a, b & c), the variable most strongly
determining the differences between countries with regard to the 5 dimensions of
work climate is that of belonging to a given country cluster (we establish 3 types,
which are based on our findings). Countries in the “Relatively high” and “Medium
high” groups were those obtaining the highest scores. By the same token,
“Relatively low score countries” were those that fared worst and comprises Spain,
France, Finland and Italy.
After the country variable, “Type of job” is the variable that most affects
employees’ scores. In this respect, a rising trend in management (as opposed to
executive) work is shown. However, there appears to be something of a levelling off
in the “Professional/technical” category, where scores appear to be slightly lower
than for other kinds of work.
Lastly, the “Years in the organization” variable appears to be the third most
important variable explaining the differences between employees. As seen in these
figures, it appears that staff has a less positive perception of their working conditions
as time goes by, with the lowest scores being given for all 5 dimensions of work
climate.
4.3 Differences and commonalities based on the Industrial Sector
The data has been studied at the industry level to see whether there are
significant differences between sectors. This section only shows the most relevant
results (i.e. those with < p. 0.000).

EU-WORKCLIMATE STUDY Executive Report -November 2005
39
Figure 17a : Relevant differences by sector for the Year 2003 (Equal Opportunities)
OtherServices
Textile/Clothing/Leather
Retail and Distribution
MediaManufacturing & Production Ind
Public service / Non Profit
Information technology & Teleco
Hotels, restaurants, catering and
Healthcare
Consulting & Auditing
Construction
Consumer Goods / Food & Bev
Financial Services: Banking, Fin
Automotive
Sector
5,10000
5,00000
4,90000
4,80000
4,70000
4,60000
Mea
n of
DIS
CR
I_SO
There is significant heterogeneity between sectors regarding high and low
scores. Thus with regard to the Equal Opportunities dimension, automobile and
public service-related sectors all have low scores. By contrast, the media score
highly.

EU-WORKCLIMATE STUDY Executive Report -November 2005
40
Figure 17b : Relevant differences by sector for the Year 2004 (Management Competency and Credibility, Fair & Sound HR practices, Equal opportunities,
and Pride in Job & the company).
OtherServices
Textile/Clothing/Leather
Transport
Retail and Distribution
MediaManufacturing & Production Ind
Public service / Non Profit
Information technology & Teleco
Hotels, restaurants, catering and
Healthcare
Consulting & Auditing
Construction
Consumer Goods / Food & Bev
Financial Services: Banking, Fin
Automotive
Sector
4,40000
4,30000
4,20000
4,10000
Mea
n of
CRE
D_SO
OtherServices
Textile/Clothing/Leather
Transport
Retail and Distribution
MediaManufacturing & Production Ind
Public service / Non Profit
Information technology & Teleco
Hotels, restaurants, catering and
Healthcare
Consulting & Auditing
Construction
Consumer Goods / Food & Bev
Financial Services: Banking, Fin
Automotive
Sector
4,90000
4,85000
4,80000
4,75000
4,70000
4,65000
4,60000
Mea
n of
DIS
CR
I_SO

EU-WORKCLIMATE STUDY Executive Report -November 2005
41
OtherServices
Textile/Clothing/Leather
Transport
Retail and Distribution
MediaManufacturing & Production Ind
Public service / Non Profit
Information technology & Teleco
Hotels, restaurants, catering and
Healthcare
Consulting & Auditing
Construction
Consumer Goods / Food & Bev
Financial Services: Banking, Fin
Automotive
Sector
4,55000
4,50000
4,45000
4,40000
Mea
n of
PR
IDE_
SO
OtherServices
Textile/Clothing/Leather
Transport
Retail and Distribution
MediaManufacturing & Production Ind
Public service / Non Profit
Information technology & Teleco
Hotels, restaurants, catering and
Healthcare
Consulting & Auditing
Construction
Consumer Goods / Food & Bev
Financial Services: Banking, Fin
Automotive
Sector
4,20000
4,15000
4,10000
4,05000
4,00000
3,95000
Mea
n of
RES
P_SO
The figure 17b reflect the average scores obtained by companies by
business sector in each of the 4 dimensions of work climate, and in which significant
differences are revealed, depending on the sector the firms belong to. The results
appear to suggest that companies’ behaviour patterns vary according to the kind of
dimension analysed (Management competency and credibility, Fair & Sound HR
practices, Equal opportunities, and Pride in Job & the company).

EU-WORKCLIMATE STUDY Executive Report -November 2005
42
Figure 17c : Relevant differences by sector for the Year 2005 (Management competency and credibility, Fair & Sound HR practices, Equal opportunities,
and Pride in Job & the company).
OtherServices
Textile/Clothing/Leather
Transport
Retail and Distribution
MediaManufacturing & Production Ind
Public service / Non Profit
Information technology & Teleco
Hotels, restaurants, catering and
Healthcare
Consulting & Auditing
Construction
Consumer Goods / Food & Bev
Financial Services: Banking, Fin
Automotive
Sector
4,70000
4,60000
4,50000
4,40000
4,30000
4,20000
4,10000
Mea
n of
CR
ED_S
O
OtherServices
Textile/Clothing/Leather
Transport
Retail and Distribution
MediaManufacturing & Production Ind
Public service / Non Profit
Information technology & Teleco
Hotels, restaurants, catering and
Healthcare
Consulting & Auditing
Construction
Consumer Goods / Food & Bev
Financial Services: Banking, Fin
Automotive
Sector
5,20000
5,10000
5,00000
4,90000
4,80000
4,70000
4,60000
Mea
n of
DIS
CR
I_SO

EU-WORKCLIMATE STUDY Executive Report -November 2005
43
OtherServices
Textile/Clothing/Leather
Transport
Retail and Distribution
MediaManufacturing & Production Ind
Public service / Non Profit
Information technology & Teleco
Hotels, restaurants, catering and
Healthcare
Consulting & Auditing
Construction
Consumer Goods / Food & Bev
Financial Services: Banking, Fin
Automotive
Sector
4,70000
4,60000
4,50000
4,40000
Mea
n of
PR
IDE_
SO
OtherServices
Textile/Clothing/Leather
Transport
Retail and Distribution
MediaManufacturing & Production Ind
Public service / Non Profit
Information technology & Teleco
Hotels, restaurants, catering and
Healthcare
Consulting & Auditing
Construction
Consumer Goods / Food & Bev
Financial Services: Banking, Fin
Automotive
Sector
4,50000
4,40000
4,30000
4,20000
4,10000
4,00000
3,90000
3,80000
Mea
n of
RES
P_SO

EU-WORKCLIMATE STUDY Executive Report -November 2005
44
The results obtained for year 2005, give different trends according to the
Industrial Sector. Some sectors show results that separate from the general trend,
having a greater or less punctuation. The following table (Table 3) covers additional
information for the 3-year period (2003-2005). Note that the highest scores in each
dimension are found in the media sector.
Table 3. Distribution of 5-dimensional means by sector
Report
Mean
4,2482 4,3754 4,1660 4,8498 4,5461
4,2029 4,3332 4,0967 4,8298 4,4407
4,1655 4,3227 4,1013 4,7771 4,4952
4,2342 4,3983 4,1584 4,8125 4,52854,2380 4,3678 4,0993 4,8985 4,45914,1856 4,3361 4,1073 4,8147 4,5040
4,2504 4,4079 4,1370 4,8501 4,4854
4,1674 4,2746 4,0685 4,8572 4,3900
4,1465 4,2372 4,0578 4,7961 4,4212
4,2014 4,3440 4,1237 4,8280 4,4925
4,3412 4,4529 4,2333 4,9302 4,54094,2136 4,3529 4,1042 4,7953 4,44804,1072 4,2430 3,9941 4,7476 4,42934,1887 4,3273 4,0581 4,7910 4,48514,1552 4,2699 4,0247 4,7769 4,40094,1551 4,2629 4,0617 4,7682 4,45784,1847 4,3125 4,0861 4,8173 4,4524
SectorAutomotiveFinancial Services: Banking,Finance, InsuranceConsumer Goods / Food &Beverage IndustryConstructionConsulting & AuditingHealthcareHotels, restaurants, cateringand tourismInformation technology &TelecomunicationsPublic service / Non ProfitManufacturing & ProductionIndustryMediaRetail and DistributionTransportTextile/Clothing/LeatherServicesOtherTotal
CAMAR_SO_mean
CRED_SO_mean
RESP_SO_mean
DISCRI_SO_mean
PRIDE_SO_mean
Conclusion: Participants’ scores in each of the work climate dimensions and for
each sector show considerable dispersion. However, we found that automobile,
transport and public service sectors consistently scored towards the bottom of the
scale. By contrast, employees working in the media scored towards the top of the
scale.

EU-WORKCLIMATE STUDY Executive Report -November 2005
45
5. CONCLUSIONS AND AGENDA FOR DEBATE
The preliminary results obtained to date need to be compared with other
sources of information in order to reach worthwhile conclusions on the differences
between European countries regarding quality of work climate and conditions.
These results can be summarized as following:
- Country differences go beyond demographic variables.
- Similar behavior between same groups of countries (clusters),
Clear country types
- Big differences between countries on some items/dimensions
- Different perception of the evaluations between countries.
Obviously, in the EU, there is a gradual trend towards convergence and
harmonization of labor policies. In this respect, one should note that all EU countries
(and sectors) will eventually operate within the same legal framework. However,
given the mosaic of cultures, values, historical institutions and other environmental
factors characterizing each state, one can reasonably ask whether extending the
logic of harmonization will necessarily lead to sustained competitiveness. The above
findings reveal that differences in work climate among the various countries,
industries and cluster of countries. This means that the road to company excellence
is somehow different in the various countries, given that their definition of what
constitutes a good work climate varies. The data, nonetheless, does not permit us to
draw a direct conclusion about the relationships between work climate and the firm’s
economic success. More specifically, . in this study we did not have information
regarding the economic success or otherwise of firms, and thus linking work climate
to competitiveness can only be done via proxy and the results of other studies.
Accordingly, the next section highlights some findings published by other
researchers about the possible link between work climate and a firm’s business
success.
EU-WORKCLIMATE STUDY Executive Report -November 2005
46
5.1. WORK CLIMATE AND COMPETITIVENESS: ANALYSIS BY PROXY
The idea that employees are critical element to a firm’s success has become
common wisdom. Indeed, a growing number of experts now state that the key to a
firm’s economic success can be attributed to the effective management of its work
climate and the corresponding human resources policies. However, the links
between HR effectiveness and organizational effectiveness have been explored
from many conceptual angles.
In a recent paper, researchers from IEL (ESADE Institute of Labor Study),
analyzing the Spanish CRANET data. report a positive link between certain HR
policies and productivity. Dolan et al (2005) conclude that certain HR configurations
and investment in human capital, leads to substantial productivity gains and
sustainable competitiveness, and vice versa, the lack of certain HR policies and
practices is linked to lower productivity for the firm. (Dolan, Mach & Sierra, 2005)4.
In the same vein, a recent ILO report states that productive efficiency and
equity in society are key elements of a vicious circle. During the past century,
improvements in working conditions have played a crucial role in business
development and stability. In turn, this has generated a more equitable share of
wealth, both through the economic boost given by greater worker purchasing power
and the redistribution of incomes arising from the taxation of company profits and
employees' earnings. At the heart of this process is the ability of workers and
employers to interact on an equal footing so as to solve problems arising in the
world of work. This has generally been a function of their capacity to get organized
and act collectively. 5
4 Dolan S.L., Mach M., Sierra V., “HR contribution to a firm’s success examined from a configurational
perspective: An Exploratory Study Based on The Spanish CRANET Data” Management Review (The international Review of Management Studies), 2005(2): 272-290.
5 Source:
http://www.ilo.org/dyn/empent/empent.portal?p_docid=SRAGLOBAL&p_prog=S&p_subprog=RA)

EU-WORKCLIMATE STUDY Executive Report -November 2005
47
Nonetheless, the prospects for this efficiency-equity relationship face several
limitations in today's globalized economy, where governments and labour market
institutions exercise ever less control over processes that are decided upon at the
global level. At the same time, the experience of several countries confirms that
growth does not translate automatically into substantial trickle-down and that the
resulting rise in inequality is bad not only for social justice, but also for productivity.
Inequality often leads to political instability, which in turn discourages investments
and growth. Inequality also undermines the development of institutions that increase
productivity and remedy market failures. At the micro-level more co-operative forms
of work organization in which workers participate in finding low-cost solutions or in
improving production methods remain relevant to fostering a climate of trust and
solidarity, promoting an entrepreneurial culture and reducing labour turnover,
ultimately helping employers and organizations to be more efficient. In this context,
organization remains an important conduit to both efficiency and equity.6
A 2003 study reported by Watson Wyatt Management Consulting came to
the conclusion that companies with better human capital practices get more than
double the shareholder value of companies with average human capital practices.
Their findings were based on data from Europe, Asia-Pacific and North America.
The findings, according to Watson Wyatt, provide evidence of a strong link between
human capital practices and shareholder value creation and that is applicable in
several continents. 7
The HCI studies of companies in Europe, Asia-Pacific and North America
report the impact of human capital practices on business performance. Their
combined database includes more than 2,000 major companies globally and tracks
shareholder performance from 1994 to 2002. "While each regional study carries
some cultural differences, the results demonstrate that great HR practices can be a
true competitive advantage.8. In fact the report suggests that superior human capital
practices prevail, regardless of economic conditions or geographic location. The
studies report that companies have better total returns to shareholders (TRS) or
6 Ibid 7 http://www.watsonwyatt.com/canada-english/news/press.asp?id=10935 8 Quote by ," J.P. Orbeta, global director of Watson Wyatt’s Human Capital practice.

EU-WORKCLIMATE STUDY Executive Report -November 2005
48
growth in shareholder value if they have the following superior human capital
practices:
• Clear Rewards and Accountability – a 16.5 to 21.5 percent increase is
associated with practices such as broad-based stock ownership, paying
above the market rate and effective performance management.
• Excellence in Recruitment and Retention – a 5.4 to 14.6 percent
increase is associated with practices such as an effective recruiting
process, a positive employer brand and focus on key skills retention.
• A Collegial, Flexible Workplace – a 9.0 to 21.5 percent increase is
associated with practices such as employee input into how the work gets
done, higher trust in senior management and a lack of workplace
hierarchy.
• Communications Integrity – a 2.6 to 7.1 percent increase is associated
with practices such as effective use of employee surveys, sharing of
strategy and financial data with employees and employee input into
decision-making.
• Focused HR Technology – a 4.2 to 6.5 percent increase is associated
with practices such as using technology to improve service and accuracy,
or to cut costs. We found this consistently in North America and Europe,
and among larger organizations in the Asia-Pacific study.
• Prudent Use of Resources – some practices, however, had a negative
effect as a 14.5 to 33.9 percent decrease is associated with practices such
as development training for career advancement, 360-degree feedback
programs and using HR technology for softer goals such as improved
culture and/or communication.
5.2. DO HAPPY EMPLOYEES EQUAL HAPPY SHAREHOLDERS?
There are endless examples and anecdotes linking employee’s happiness to
shareholders values, and sceptics have always fallen back on the old defence that
there is no hard-and-fast independent data to prove it. To some extent, they are
right - the lack of data has been a real handicap. On the other hand, a body of
EU-WORKCLIMATE STUDY Executive Report -November 2005
49
evidence—past, present and forthcoming— amassed by the Forum for People
Performance Management and Measurement, founded by the Department of
Integrated Marketing Communications at Northwestern University (a non-profit
research and education resource center), points out that employee satisfaction and
engagement drive an organization’s bottom-line success. The highlights leading to
their conclusion is based on the following evidence:9
• the Russell Investment Group and the Great Place To Work Institute
released a joint study that tracked stocks of publicly traded
companies on Fortune’s “100 Best Companies to Work for”® from
early 1998 through 2004. The study determined that companies on
the list of best places, compiled for Fortune by the GPTW Institute,
produced returns three times greater than the broad market. study
came one from The Jackson Organization, a performance
improvement research and consulting group based in Columbia, Md.,
which partnered with recognition firm OC Tanner of Salt Lake City.
They asked 26,000 workers at all levels of 31 organizations, most of
them hospitals of varying sizes and profitability, how much they
agreed with the statement “My organization recognizes excellence.”
• Further evidence comes from the study by The Jackson
Organization, a performance improvement research and consulting
group based in Columbia, Md., which partnered with recognition firm
OC Tanner of Salt Lake City. They asked 26,000 workers at all levels
of 31 organizations, most of them hospitals of varying sizes and
profitability, how much they agreed with the statement “My
organization recognizes excellence.” The study showed that the top
25 percent of companies—those whose employees agreed most
strongly with the statement—performed the best in three measures of
financial success examined: return on equity, return on assets and
operating margin, which is a company’s gross profit.
9 Source: B. Coffey, in: http://www.motivationstrategies.com/Ask_the_Experts__Do_Happy_Employees_Equal_Happy_Sh.582.0.html

EU-WORKCLIMATE STUDY Executive Report -November 2005
50
5.3. DO HAPPY AND HEALTHY EMPLOYEE CONTRIBUTE TO COMPANY COMPETITIVENESS?
Research over the past 25 years, has identified job factors and work climate
aspects that are associated with employee stress and ill-health and has resulted in
lengthy lists of both job stressors and stress-related health outcomes. The
consequences are bad for both employees and the organization. Ever since the
1980´s, the proposed conceptual framework has been broadened to focus not only
on the job stressor-health relationships, but to overall organizational health10.
Organizational health is a more inclusive concept and refers to enhanced
organizational performance (productivity and effectiveness) plus worker good health.
A healthy work organization is one whose culture/climate, values and practices
promote employee health and company effectiveness. This definition
accommodates hitherto opposing goals: (1) organizational goals of profitability and
competitiveness, and (2) worker goals of health and well-being.
In 1991, the National Institute for Occupational Health and Safety (hereafter
NIOSH) initiated a program of research to study healthy work organizations. The
research emphasized the interrelationship of individual worker well-being and
organization effectiveness, and focused on macro-organization characteristics, in
addition to job-level characteristics, as risk factors for ill health and performance
impairment. NIOSH analyzed organizational climate survey data obtained from one
corporate partner during the years 1993-1995. Over 10,000 workers filled out the
anonymous questionnaire, which contained measures of stress and coping,
management practices, individual and team performance, organizational culture,
values, and performance. Statistical analyses of these cross-sectional data identified
key organizational variables associated with low employee stress and high
organizational effectiveness11.
10 Dolan S.L. Arsenault A., Stress, Santé et Travail (stress, Health and Work). Université de Montréal,
Monographie 5, 1980 11 http://www.cdc.gov/niosh/frn98024.html

EU-WORKCLIMATE STUDY Executive Report -November 2005
51
Based on these analyses, NIOSH developed a provisional model of a healthy
work organization which contains three broad, interrelated categories: organizational
values, culture/climate, and management practices.
Healthy work organizations demonstrate commitment to company values
which emphasize employee growth and development, integrity and honesty in
communication, workforce diversity, and view the individual worker as a valuable
human resource. These organizations have a culture/climate in which workers (a)
are personally valued, (b) have authority to take actions to solve problems, (c) are
encouraged by management to express opinions and become involved in decision-
making, and (d) resolve group conflicts effectively. Management practices in an
healthy work organization include (1) management actively engaged in leadership
and strategic planning, (2) management making the necessary changes to follow
through on long term business strategies, (3) workers recognized forproblem-solving
and rewarded for doing quality work, and (4) first line supervisors provide assistance
and resources in helping workers plan for their future. In the same period.
Researchers from IEL (Institute of Labour Studies, at the ESADE business school)
have developed a similar concept and corresponding measures labelled:
Management by Values12. According to them, a culture that shares values in terms
of Economic objectives, Ethical-Social Objectives and Passion-Compassion
objectives, leads to employee’s well-being and to corporate sustained
competitiveness13. The model is presented in Figures 18 and 19.
12 Garcia-Sanchez S., Dolan S.L. LA DIRECCION POR VALORES (DPV): gobierno de cambio en la
empresa de s. XXI. McGraw- Hill Professional Management Series. Madrid. McGraw Hill Inter-America. 1997 13 Dolan S.L. Garcia S., Diez-Pinol M. Autoestima estrés ,y trabajo. (McGraw Hill - Colección
Negocios) Madrid. 2005; Dolan S.L.,Garcia S.,Richley B.,, MANAGING BY VALUES: A corporate guide to living, being alive and making a living in the 21st century , 2006. London.

EU-WORKCLIMATE STUDY Executive Report -November 2005
52
Figure 18. Management by values
V I S I ON
M I S S I ON
V A L U E S
FinancialInternal and external image
Physical structure & organization Processes
Technologies Products / Services
““BODYBODY””
““SPIRITSPIRIT””
ResultsResults
MANAGEMENT BY VALUES TMMANAGEMENT BY VALUES TM
“A spirit without a body is a phantom
But
A body without a spirit is a corps.”
Figure 19. A new perspective of organizational well-being
Beyond these determined characteristics, two additional factors need to be
incorporated into the model: external economic/market conditions and physical work
conditions. External market conditions exert a strong influence on company
profitability and competitiveness independent of the culture/climate, values, and
management practices. Similarly, a healthy work organization should meet certain
minimum standards for physical working conditions in order to protect the health and
safety of employees.
ETHICAL
HEALTH
Organizational Organizational Well BeingWell Being
ECONOMIC
HEALTH
EMOTIONAL
HEALTH
A NEW PERSPECTIVE OF ORGANIZATIONAL WELL-BEINGA NEW PERSPECTIVE OF ORGANIZATIONAL WELLA NEW PERSPECTIVE OF ORGANIZATIONAL WELL--BEINGBEING

EU-WORKCLIMATE STUDY Executive Report -November 2005
53
In summary, organizational characteristics listed above form a provisional
profile of a healthy work organization, and can be used to design interventions for
improving organizational health. The model is provisional because it has not been
validated in various cultures, countries and has not been tested across all industry
groups. Furthermore, it is not known whether all of the characteristics listed above
are necessary and sufficient measures of a healthy work organization, or whether
certain combinations of characteristics are more important than others.
Based on the aforementioned evidence, the agenda for debate in the
Barcelona conference will include the following issues:
Is there a link between Quality of Work and Productivity across Europe and
across industries?
Does improvement in certain work climate dimensions increase in the quality
and efficiency of investment in human capital and does it translates it into
productivity gains?
Can an organization afford to manage their Human resource policies with
emphasis on “Trust, Equity and Respect”?
Is it possible that Camaraderie and team spirit coexist with
competitiveness”?
What is the importance of internal coherence (“what you say is what you do”)
and how leaders can create excellent climate?
Can the definition of sustained competitiveness and work climate be
replaces by the concept of organizational well being?