Embed Size (px)
Citation preview
2015–2016 ANNUAL REPORT

3 WorkCover Queensland annual report 2015–2016
WELCOME ............................... 4
ABOUT WORKCOVER ............ 5 CUSTOMER SERVICE COMMITMENT .................. 6
2015–2019 CORPORATE PLAN .......................... 7
STATEMENT OF CORPORATE INTENT 2015–2016 ...................................................... 9
HIGHLIGHTS ......................... 13
LEADERSHIP ......................... 15 CHAIR AND CEO REPORT ................................ 15
BOARD OF DIRECTORS .................................... 18
EXECUTIVE TEAM ............................................ 20
ENGAGED PEOPLE................ 22
STATISTICS ............................ 25
CORPORATE GOVERNANCE 30 ETHICS, COMPLIANCE AND RISK MANAGEMENT .............................................. 32
FINANCIAL PERFORMANCE 36 CONSOLIDATED STATEMENT OF COMPREHENSIVE INCOME ............................. 41
CONSOLIDATED STATEMENT OF FINANCIAL POSITION ....................................................... 42
CONSOLIDATED STATEMENT OF CHANGES IN EQUITY ........................................................... 43
CONSOLIDATED STATEMENT OF CASH FLOWS 44
DECLARATION BY DIRECTORS .......................... 76
INDEPENDENT AUDIT REPORT .......................... 77
ACTUARIAL CERTIFICATE ON NET OUTSTANDING CLAIMS LIABILITIES ........................................... 79
CERTIFICATE OF WORKCOVER QUEENSLAND .. 80
COMPLIANCE CHECKLIST ................................ 81
GLOSSARY ...................................................... 82
NOTES ................................... 45 BASIS OF PREPARATION .................................... 45
SIGNIFICANT ACCOUNTING POLICIES ............... 45
ACCOUNTING JUDGEMENTS AND ESTIMATES ..... 45
PREMIUM .......................................................... 46
P1 NET PREMIUM REVENUE ................................ 46
P2 UNEARNED PREMIUM LIABILITY ....................... 46
P3 LIABILITY ADEQUACY TEST ............................. 46
CLAIMS ............................................................. 47
C1 NET CLAIMS INCURRED................................ 47
C2 OUTSTANDING CLAIMS LIABILITY AND RECOVERIES RECEIVABLE ................................... 48
C3 INSURANCE RISK ........................................ 52
FINANCIAL INSTRUMENTS ................................. 53
F1 INVESTMENT INCOME ................................. 53
F2 CATEGORIES OF FINANCIAL INSTRUMENTS .... 53
F3 FAIR VALUE MEASUREMENTS.......................... 55
F4 OFFSETTING FINANCIAL ASSETS AND FINANCIAL LIABILITIES ........................................................ 56
F5 FINANCIAL RISK MANAGEMENT .................... 57
SUPPORTING OUR BUSINESS ............................. 61
S1 UNDERWRITING EXPENSES ........................... 61
S2 EMPLOYEE BENEFITS LIABILITIES ...................... 61
S3 KEY MANAGEMENT PERSONNEL DISCLOSURES 63
S4 PROPERTY, PLANT AND EQUIPMENT ............... 67
S5 INTANGIBLE ASSETS .................................... 68
S6 COMMITMENTS .......................................... 69
OTHER .............................................................. 70
O1 INCOME TAX EQUIVALENT ........................... 70
O2 RECONCILIATION OF CASH FLOWS FROM OPERATING ACTIVITIES ..................................... 72
O3 AUDITORS’ REMUNERATION ......................... 72
O4 CONTINGENT LIABILITIES ............................. 72
O5 EVENTS AFTER REPORTING DATE ................... 72
O6 DIFFERENCES BETWEEN WORKCOVER CONSOLIDATED FINANCIAL STATEMENTS AND WORKCOVER QUEENSLAND FINANCIAL STATEMENTS ................................................... 72
O7 SUMMARY OF ADDITIONAL SIGNIFICANT ACCOUNTING POLICIES ................................... 74
CONTENTS
NOTES TO THE CONSOLIDATED FINANCIAL STATEMENTS .................................................. 45
4 WorkCover Queensland annual report 2015–2016
QAS paramedic Anthony Windle returned to work with the support of WorkCover Customer Advisor Rebecca Pyke
WELCOME Welcome to WorkCover Queensland’s annual report. This annual report summarises WorkCover’s results, outlook and financial position for 2015–2016.
ABOUT THIS REPORT Under the Workers’ Compensation and Rehabilitation Act 2003, WorkCover is required to produce an annual report. This report has been prepared to meet the needs of stakeholders and the accountability requirements under the Financial Accountability Act 2009.
WorkCover is committed to providing accessible services to Queenslanders from all culturally and linguistically diverse backgrounds. If you have difficulty in understanding the annual report, you can contact us on 1300 362 128 and we will arrange an interpreter to effectively communicate the report to you.
To view this and previous reports, please visit our website worksafe.qld.gov.au.
If you wish to speak to us about this report, please contact:
Communications WorkCover Queensland GPO Box 2459, Brisbane Qld 4001 1300 362 128 [email protected]
ISSN 1329-6539 © WorkCover Queensland 2016
Licence: This annual report is licensed by WorkCover Queensland under a Creative Commons Attribution (CC BY) 4.0 Australia licence.
CC BY Licence Summary Statement: In essence, you are free to copy, communicate and adapt this annual report, as long as you attribute the work to WorkCover Queensland. To view a copy of this licence, visit https://creativecommons.org/licenses/by/4.0/
Attribution: Content from this annual report should be attributed as: WorkCover Queensland annual report 2015–2016
LETTER OF COMPLIANCE
1 September 2016
The Honourable Grace Grace MP Minister for Employment and Industrial Relations Minister for Racing and Minister for Multicultural Affairs GPO Box 611 BRISBANE QLD 4001
Dear Minister
I am pleased to present the 2015–2016 WorkCover Queensland annual report.
I acknowledge the contributions of our Board and, most of all, the hard work and dedication of our people, each of whom have helped us to care about our customers and provide appropriate workers’ compensation cover.
I certify that this annual report complies with:
• the requirements under the Workers’Compensation and Rehabilitation Act2003
• the prescribed requirements of theFinancial Accountability Act 2009 and the Financial Performance Management Standard 2009, and
• the detailed requirements set out in theAnnual report requirements for Queensland Government agencies.
A checklist outlining the annual reporting requirements can be found at page 43.
Yours sincerely
Glenn Ferguson AM
Chair
5
WorkCover Queensland annual report 2015–2016
Who we are
WorkCover Queensland is a self-funded statutory authority providing tailored workers’ compensation insurance solutions to over 150,000 Queensland businesses since 1997.
WorkCover strives to maintain Australia’s lowest average premium rate by continuously investing in efficient online customer services and experienced in-house claims management capability to support employers and injured workers.
We maintain one of Australia’s best return to work rates by partnering with our customers, unions, industry associations, medical and allied health providers.
We are passionate about striking the right balance between keeping premium costs low for employers and providing injured workers with access to rehabilitation and return to work services.
The principal place of business for WorkCover Queensland is 280 Adelaide Street, Brisbane, Queensland 4000.
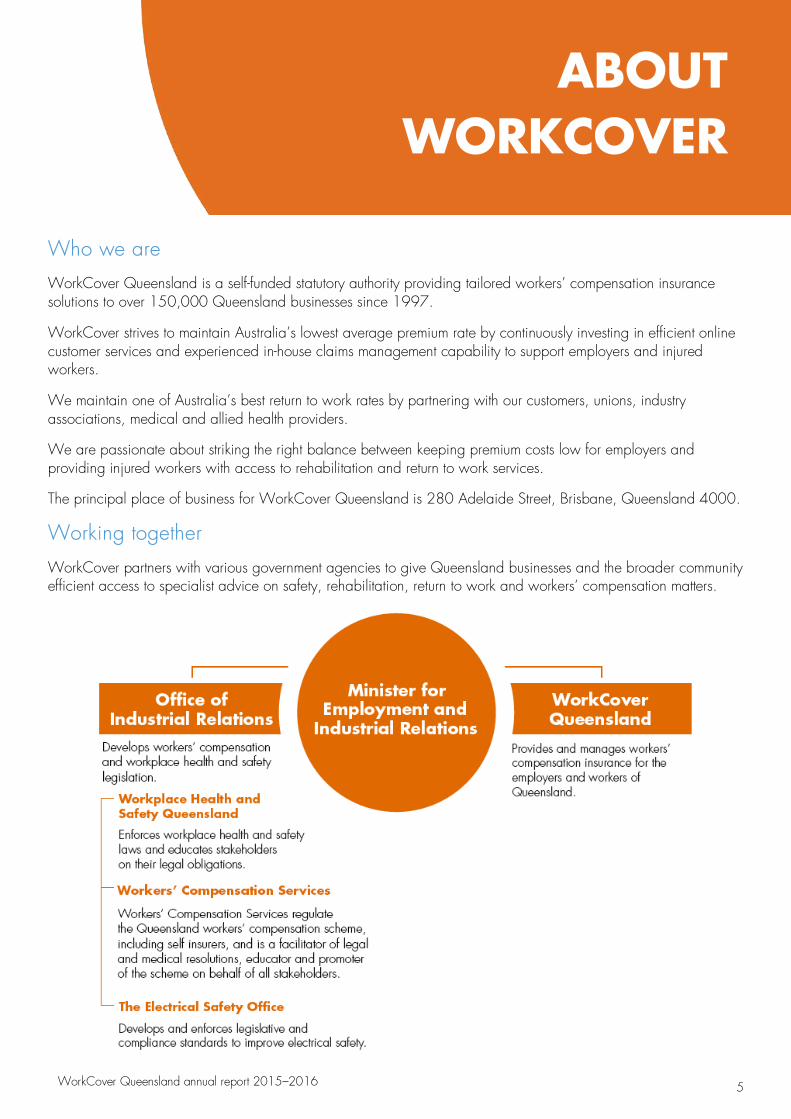
Working together
WorkCover partners with various government agencies to give Queensland businesses and the broader community efficient access to specialist advice on safety, rehabilitation, return to work and workers’ compensation matters.
ABOUT WORKCOVER
6 WorkCover Queensland annual report 2015–2016
CUSTOMER SERVICE COMMITMENT WorkCover Queensland is committed to providing exceptional service and partnering with our customers and stakeholders.
Our values of excellence, integrity, responsiveness and respect are incorporated into everything we do.
Service
WorkCover’s aim is to deliver excellent customer service and to make doing business with us easy. We will always strive to meet our customers’ expectations by:
• personally answering calls during business hours• listening first, then responding in a timely way• communicating openly and in plain language• providing contact details of a person to assist• being fair and impartial in all our interactions.
Engagement WorkCover cares about its customers and stakeholders and wants to engage with them in a positive way for mutual benefit through:
• understanding individual requirements• asking how we can improve• providing regular updates• proactively building relationships• offering value added services.
Recovery from injury WorkCover is here to support the often difficult and emotional experience of a work-related injury. We are committed to assisting people to recover at work and liaising with all parties involved to achieve the best possible outcome by:
• communicating regularly with everyone involved• undertaking necessary rehabilitation• facilitating early, safe and appropriate return to work• providing support to reduce the impact of the injury• assisting to reduce the disruption an injury can cause.
Information and feedback WorkCover values customer and stakeholder feedback to help continually improve services. We are also committed to protecting the privacy of our customers. We take all reasonable precautions to protect the information given to us by:
• storing your personal information securely• allowing access to information quickly and easily.
7
WorkCover Queensland annual report 2015–2016
CORPORATE PLAN 2015–2019 Who we are
WorkCover Queensland is the main provider of workers’ compensation insurance in Queensland. We are a government owned statutory body established under the Workers’ Compensation and Rehabilitation Act 2003.
Our vision
To excel in workers’ compensation insurance by providing the best possible benefits and return to work programs for workers, at the lowest possible sustainable premium for employers.
Our values
Excellence
To deliver customer satisfying services
Integrity
To always do the right thing
Responsiveness
To respond in a timely and welcoming way and deliver solutions
Respect
To be considerate of the rights and dignity of others
Our customers
Our customers are injured workers and employers, supported by various stakeholder groups.
Challenges
• influencing employers to prevent and better manage injuries • achieving optimal stay at/return to work outcomes • engaging with customers and stakeholders to achieve mutually beneficial outcomes • delivering focused/relevant customer communication and education • retaining a financially viable customer base • streamlining and enhancing customer experience through the use of technology • maintaining an engaged workforce.
8 WorkCover Queensland annual report 2015–2016
Our goals, strategies and performance indicators
1. Customer/stakeholderGoal
• be a customer focused insurerStrategies
• influence employers to prevent and better manage injuries• achieve optimal work outcomes for injured workers• engage with customers and stakeholders• deliver communication and education to customers• further develop and streamline customer experience through the use of technologyPerformance indicators
• customer attraction/retention• stay at work results• return to work outcomes• usage of online and mobile services
2. FinancialGoal
• be financially viable, well managed and efficient, balancing injured worker and employer needsStrategies
• provide flexible insurance arrangements suited to the particular needs of industry• appropriately price and collect premium to cover costs• monitor claim numbers, trends and costs and implement strategies to optimise claim outcomes• focus on employer and injured worker compliance• retain and attract customers for the benefit of the Fund• manage and monitor the investment strategy to optimise investment returnsPerformance indicators
• capital adequacy requirements• average premium rate, claims costs and durations
3. People
Goal
• be an organisation of professional, engaged peopleStrategies
• maintain a zero harm at work culture and continuously educate/reinforce occupational health and safetyand early return to work practices
• ensure ongoing capability and capacity, through investment in our peoplePerformance indicators
• return to work outcomes• absenteeism (unplanned absences) rate• staff attrition rate
9 WorkCover Queensland annual report 2015–2016
STATEMENT OF CORPORATE INTENT 2015–2016 Introduction
This Statement of Corporate Intent has been prepared under the direction of, and is submitted by, the Board of Directors of WorkCover Queensland (WorkCover), in accordance with the Workers’ Compensation and Rehabilitation Act 2003 (the Act).
This Statement of Corporate Intent should be read in conjunction with the 2015−2019 WorkCover Queensland Corporate Plan.
1. Goals
WorkCover’s goals are to be:
• a customer focused insurer• financially viable, well managed and efficient, balancing injured worker and employer needs• an organisation of professional, engaged people
2. Main undertakings
WorkCover is a government owned statutory body and is the main provider of workers’ compensation insurance in Queensland. A WorkCover accident insurance policy covers injured workers for their lost wages and medical and rehabilitation costs after a workplace accident, and covers employers against these costs and possible common law claims.
The main provisions of the Act provide the following for workers and employers:
• compensation• appropriate access to damages• employers’ liability for compensation• employers’ obligation to be covered against liability for compensation and damages under a WorkCover
insurance policy• management of compensation claims by WorkCover• injury management, emphasising rehabilitation of workers particularly for return to work.
It is intended that WorkCover will:
• maintain a balance between:— providing the best possible benefits and return to work programs for injured workers, and — ensuring the lowest possible sustainable premiums for employers
• ensure that injured workers or dependants are treated fairly• provide for employers and injured workers to participate in effective return to work programs• provide flexible insurance arrangements suited to the particular needs of industry.
10 WorkCover Queensland annual report 2015–2016
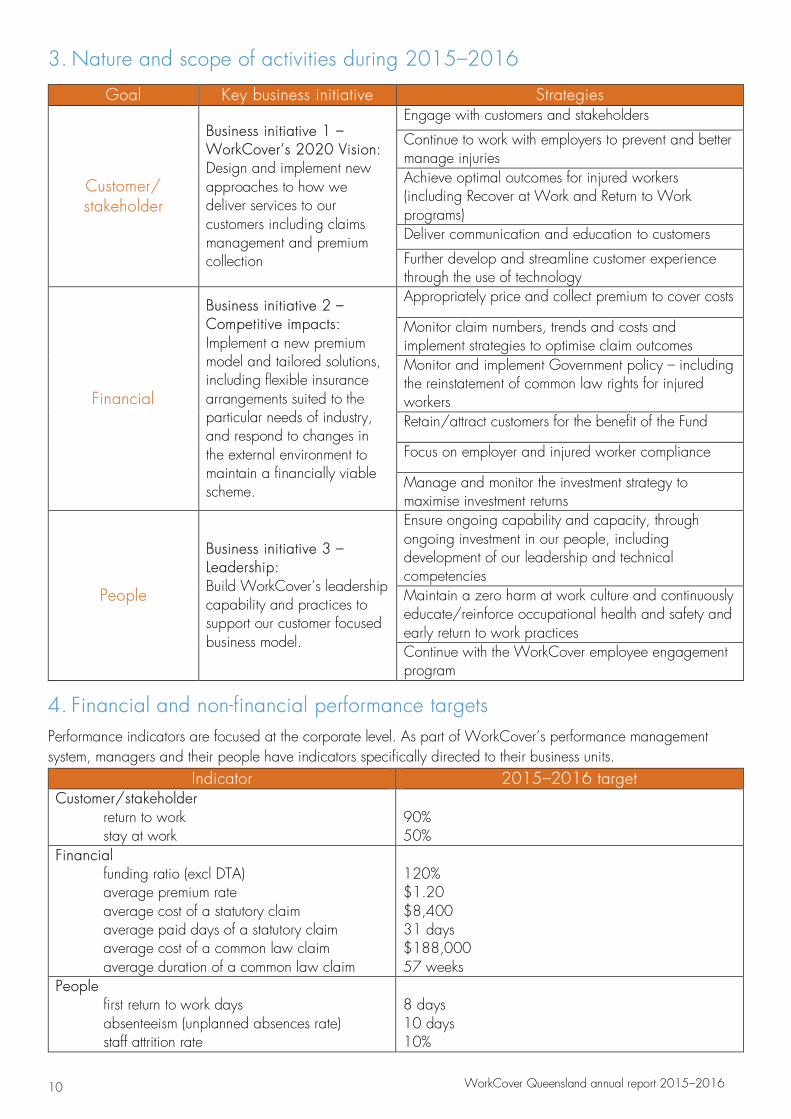
3. Nature and scope of activities during 2015–2016
Goal Key business initiative Strategies
Customer/ stakeholder
Business initiative 1 – WorkCover’s 2020 Vision: Design and implement new approaches to how we deliver services to our customers including claims management and premium collection
Engage with customers and stakeholders
Continue to work with employers to prevent and better manage injuries Achieve optimal outcomes for injured workers (including Recover at Work and Return to Work programs) Deliver communication and education to customers
Further develop and streamline customer experience through the use of technology
Financial
Business initiative 2 – Competitive impacts: Implement a new premium model and tailored solutions, including flexible insurance arrangements suited to the particular needs of industry, and respond to changes in the external environment to maintain a financially viable scheme.
Appropriately price and collect premium to cover costs
Monitor claim numbers, trends and costs and implement strategies to optimise claim outcomes Monitor and implement Government policy – including the reinstatement of common law rights for injured workers Retain/attract customers for the benefit of the Fund
Focus on employer and injured worker compliance
Manage and monitor the investment strategy to maximise investment returns
People
Business initiative 3 – Leadership: Build WorkCover’s leadership capability and practices to support our customer focused business model.
Ensure ongoing capability and capacity, through ongoing investment in our people, including development of our leadership and technical competencies Maintain a zero harm at work culture and continuously educate/reinforce occupational health and safety and early return to work practices Continue with the WorkCover employee engagement program
4. Financial and non-financial performance targetsPerformance indicators are focused at the corporate level. As part of WorkCover’s performance management system, managers and their people have indicators specifically directed to their business units.
Indicator 2015–2016 target Customer/stakeholder
return to work stay at work
90% 50%
Financial funding ratio (excl DTA) average premium rate average cost of a statutory claim average paid days of a statutory claim average cost of a common law claim average duration of a common law claim
120% $1.20 $8,400 31 days $188,000 57 weeks
People first return to work days absenteeism (unplanned absences rate) staff attrition rate
8 days 10 days 10%
11 WorkCover Queensland annual report 2015–2016
5. Capital structure and payments to the consolidated fund
In accordance with the Act, WorkCover is taken to be fully funded if it is able to meet its liabilities for compensation and damages payable from its funds and accounts and maintain capital adequacy as required under the Workers’ Compensation and Rehabilitation Regulation 2014 (the Regulation). The Regulation states that in order to maintain capital adequacy, WorkCover’s total assets must at least be equal to total liabilities (this correlates to a funding ratio of 100%).
The Act allows for payments to be made to the consolidated fund. The WorkCover Board will make a recommendation to the Minister with respect to such a payment (if any) following certification of the 2014−2015 financial statements.
WorkCover will also contribute to levies administered by the Regulator by way of an annual levy.
6. Borrowings made, proposed to be made
WorkCover currently has no borrowings and there are none planned for the immediate future. Investment funds are used to manage all cash flow requirements. WorkCover’s borrowing policy is outlined in 7.3.
7. Policies adopted to minimise and manage risk of investments andborrowings that may adversely affect financial stability
7.1 Investment risk
WorkCover currently invests all excess funds with QIC. WorkCover maintains a balanced investment profile with a long-term outlook commensurate with being a long-term insurance operation. Derivative instruments are used as part of the investment strategy to hedge foreign exchange risks and rebalance asset classes.
An Investment Management Agreement governs the arrangement. In addition, the WorkCover Board monitors investment on a monthly basis and receives at least quarterly presentations from QIC. The Board reviews the investment strategy annually.
7.2 Business risk
WorkCover has a risk management program in place. Risk registers are maintained and monitored by each business division. Strategies to manage risk are incorporated into each division’s business planning process. The WorkCover Risk and Audit Committee is responsible for overseeing the risk management program, including reviewing and monitoring WorkCover’s top strategic risks on a quarterly basis.
7.3 Borrowing risk
The Act provides the framework for WorkCover’s procedures for borrowing. WorkCover may enter into such arrangements to procure equipment up to an amount and on such terms as it considers appropriate. All financing arrangements will be made in conjunction with Queensland Treasury Corporation in order to establish that applicable rates are competitive and conditions are appropriate. Board approval will be required for all financing arrangements over pre-defined expenditure limits. All limits are as stated in the WorkCover delegations manual.
8. Policies and procedures relating to acquisition and disposal of major assets
In acquiring or disposing of major assets, WorkCover complies with the Financial and Performance Management Standard 2009 and Queensland Treasury guideline—Non-Current Asset Policies for the Queensland Public Sector.
Major assets may be acquired via purchase, finance lease agreement, donations, or transfer from other government entities. A business case must be submitted to the CEO and/or General Manager Finance seeking approval. The CEO will present any major initiatives to the Board for approval. Approval limits are as stated in the WorkCover delegations manual.
12 WorkCover Queensland annual report 2015–2016
In disposing of major assets, approval must be sought from the appropriate delegated authority. Approval limits are as stated in the WorkCover delegations manual.
9. Accounting policies applying to preparation of accounts
WorkCover’s accounting policies are outlined each year in the Annual Report and are reviewed as part of the financial statements audit process. Further information on accounting policies is provided in WorkCover’s Financial Management Practice Manual (FMPM).
10. Community service obligations
It is not envisaged that the government will require WorkCover to perform any specific community service obligations.
11. Employment and industrial relations plan
WorkCover prepare an Employment and Industrial Relations Plan annually in accordance with the Act. Refer to Attachment 1 for a copy of WorkCover Queensland’s Employment and Industrial Relations Plan.
12. Information to be reported to the Minister
12.1 Quarterly reporting
A quarterly report will be provided to the Minister within one month of the end of the relevant quarter as required by the Act. The report will contain information regarding WorkCover’s performance against the Statement of Corporate Intent.
12.2 Annual reporting
A full annual report will be provided to the Minister in accordance with the Act and in compliance with the Financial and Performance Management Standard 2009, which requires WorkCover to give the annual report to the Minister to allow the report to be tabled in the Legislative Assembly within three months after the conclusion of each financial year.
13
WorkCover Queensland annual report 2015–2016
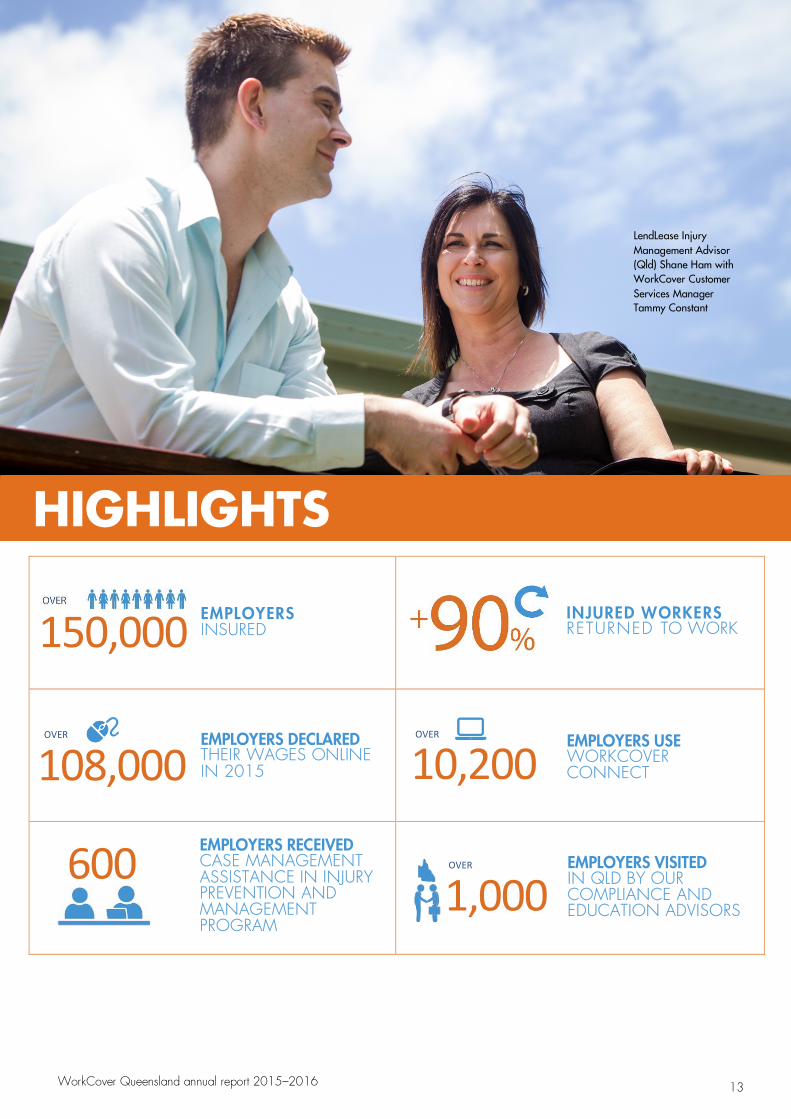
EMPLOYERS DECLARED THEIR WAGES ONLINE IN 2015
600
EMPLOYERS RECEIVED CASE MANAGEMENT ASSISTANCE IN INJURY PREVENTION AND MANAGEMENT PROGRAM
1,000
108,000 10,200
150,000
LendLease Injury Management Advisor (Qld) Shane Ham with WorkCover Customer Services Manager Tammy Constant
HIGHLIGHTS
INJURED WORKERS RETURNED TO WORK
EMPLOYERS INSURED
OVER EMPLOYERS USE WORKCOVER CONNECT
EMPLOYERS VISITED IN QLD BY OUR COMPLIANCE AND EDUCATION ADVISORS
OVER
OVER

14
WorkCover Queensland annual report 2015–2016
PERFORMANCE SCORECARD The following scorecard provides an overview of our performance, including targets from our Statement of Corporate Intent.
AIM WHAT DID WE ACHIEVE?
CUSTOMER/STAKEHOLDER
90% return to work 92%
50% stay at work 49.6%
FINANCIAL
Funding ratio (excl DTA) of 120% 162%
Average premium rate of $1.20 $1.20
Average cost of a statutory claim: $8,400 $8,252
Average paid days of a statutory claim: 31 days 27.8 days
Average cost of a common law claim: $188,000 $172,557
Average duration of a common law claim: 57 weeks 58.2 weeks
PEOPLE
First return to work days : 8 4.3 days
Absenteeism (unplanned absences rate): 10 days 10.8 days
Staff attrition rate: 10% 9.2%
15
WorkCover Queensland annual report 2015–2016
We are pleased to present the WorkCover Queensland Annual Report for 2015–2016. During the year, we continued to work together with our customers and stakeholders to provide the best possible rehabilitation and return to work support for workers and sustainable premiums for employers.
Maintained lowest premium rate in Australia
For the third consecutive year, we are pleased to maintain an average premium rate of $1.20 per $100 of wages for 2016–2017, the lowest rate in Australia. We are committed to working with and educating our customers on the benefits of maintaining safe and healthy work environments and assisting workers to return to work quickly and safely following injury.
Implementing legislative reforms
During the year, WorkCover worked closely with stakeholders to support the implementation of legislative reforms, including provisions for specified diseases developed by firefighters and the removal of the common law threshold.
WorkCover will continue to work with all stakeholders associated with these legislative reforms to ensure consistent and fair coverage is provided for customers.
Co-creating tailored solutions
This year we worked with our customers to tailor solutions which can optimise their business outcomes. We supported employers through the Prevention and Performance Initiative, a grant program designed to help innovative businesses reduce injuries and enhance return to work outcomes. Over 130 applications were received from businesses across all industry sectors. Together with these businesses, WorkCover is co-funding initiatives which will be implemented throughout 2016.
During the year, we launched employer education and awareness campaigns aimed at reducing the cost and frequency of claims associated with mental health disorders and musculoskeletal injuries.
Employer feedback for our mental health campaign was positive, with employers indicating they are now more confident in managing health and wellbeing issues in the workplace. Employers welcomed the tailored advice and injury data provided by our people, with many indicating they are likely to increase their investment in mental health and wellbeing management.
Promoting the health benefits of good work
During the year, our Recover at Work program facilitated successful temporary employment placements at host employers for injured workers who are unable to return to work with their pre-injury employer.
We also maintained our focus on delivering positive return to work outcomes. Working closely with medical and allied health providers, we promoted the benefits of good work, early rehabilitation and return to work support following an injury and regular communication between all parties to an injury.
CHAIR AND CEO REPORT
16
WorkCover Queensland annual report 2015–2016
Enhancing our service delivery experience
In late 2015, we launched WorkCover Connect, an online service for employers that delivers industry specific trends, claims and injury tracking, and up-to-date data and policy analytics. Over 10,200 employers are using WorkCover Connect as their platform of choice to manage their workers’ compensation policy.
During the year, we engaged with our customers and stakeholders to better understand which aspects of our service they value and how they want to work with us in the future. We have incorporated this feedback into our planning for the coming year as we continually improve the way we work and provide a customer experience that delivers excellent return to work outcomes for workers at the lowest cost for Queensland businesses.
Committed and engaged people
In April, we received approval from the Queensland Industrial Relations Commission for the WorkCover Employing Office Certified Agreement (CA). The Agreement, which expires on 30 September 2018, demonstrates WorkCover’s commitment to work closely with union representatives through our consultative committee to ensure a positive working relationship that will benefit WorkCover’s people.
During the year, we strengthened the leadership capabilities and behavioural competencies of our people with the delivery of an integrated training program targeting championing change and innovation through teamwork and collaboration, enhancing customer relationships and maximising strategic effectiveness with a focus on operational excellence.
Financial and investment performance
Against the backdrop of a challenging national economic environment and a transitioning Queensland economy, WorkCover’s operating result for 2015–2016 was a loss of $38.2 million, after tax.
The net return on our investment portfolio was 2.02% (2014–2015: 4.85%) reflecting adverse financial market conditions experienced during the year.
QIC manages WorkCover’s investments and as at 30 June 2016, the net market value in funds invested was $4.01 billion (30 June 2015: $4.022 billion). We will continue to work with QIC to ensure our portfolio achieves its long term objectives.
WorkCover continues to be fully funded and will maintain a strong financial position as a direct result of our disciplined financial management, prudent investment approach and cost control focus.
Outlook
Over the next 12 months, WorkCover will continue to work with our people, customers and stakeholders to improve our service delivery, ensuring our people and customers are supported by technology and data analytics to achieve the best possible outcomes.
We will continue to enhance our innovative online services for employers and workers, so they receive a high quality experience across our service channels.
Our state-wide compliance and education activities program will target under-insured and uninsured businesses, ensuring they have the right cover and every Queensland employer is paying their fair share.
WorkCover will also work with stakeholders to implement arrangements to support the introduction of legislative reforms.
Thank you
We would like to thank and acknowledge the hard work of our Board members, Executive Management Team, and all our people for their commitment to achieving the best results for Queensland’s workers and employers.
17 WorkCover Queensland annual report 2015–2016
We also thank the Minister for Employment and Industrial Relations, the Honourable Grace Grace MP, and the Queensland Government for their support.
Glenn Ferguson Tony Hawkins
Chair CEO
Postscript to this report – message from the Chair, Glenn Ferguson
The Board wishes to announce that WorkCover CEO, Tony Hawkins will retire in December 2016. During 19 years of outstanding service, Tony has worked with Government, the Board and WorkCover’s people and customers to build an organisation that is financially sustainable and providing the best possible rehabilitation and return to work support for workers at Australia’s lowest premium rates.
The Board and WorkCover’s Executive Management Team would like to thank Tony for his commitment and significant leadership contribution in transforming WorkCover’s operations. He leaves the organisation in outstanding shape and well placed to deliver on our strategy of making WorkCover the best workers’ compensation insurer in Australia.

18 WorkCover Queensland annual report 2015–2016
BOARD OF DIRECTORS Glenn Ferguson AM, FAAL, FAICD, FANZCN, FCOL Chair
Glenn is a Director of Ferguson Cannon, Lexon Insurance and the Queensland Law Foundation. He is a Solicitor of the High Court of Australia and the Supreme Court of Queensland. He was made a Member of the Order of Australia in 2015.
Justin O'Connor BA Deputy Chair
Justin is a Director at Intrust Super Fund and IS Financial Planning Pty Ltd and recently retired as Chief Executive of the Queensland Hotels Association Union of Employers. Justin is a member of the Queensland Responsible Gambling Advisory Committee and delegate to the National Executive of the Australian Hotels Association.
Melinda Bailey BCom (Hons), FCPA, FAICD Director
Melinda is the Director, Regulatory Reform at NSW Maritime and Road Services. Melinda is a Fellow CPA and is a Fellow of the Australian Institute of Company Directors. Melinda is also the Chairperson of WorkCover's Risk and Audit Committee.
John Crittall BEcon (Hons), MAdmin (IR) Director
John has extensive experience providing strategic guidance in the key areas of industrial relations, workplace health and safety and legislative compliance. He was formerly a Director at Master Builders, a role he held for over 10 years. John is a Director of the Work Health and Safety Queensland Board and CIPQ.
Peter Dowling AM, BA (Acc), FCPA, FAICD Director
Peter is an accountant and company director, a Fellow of CPA Australia and Chartered Accountants Australia and New Zealand, and a Fellow of The Australian Institute of Company Directors. He was formerly a partner with international accounting firm Ernst & Young, is a Centenary of Federation Medal recipient and was made a Member of the Order of Australia in 2007.

19
WorkCover Queensland annual report 2015–2016
Flavia Gobbo BA/LLB, GAICD Director
Flavia is a Solicitor of the High Court of Australia and the Supreme Court of Queensland and has extensive experience as a senior corporate lawyer with one of Australia’s top publicly listed companies. She was previously Chair of Q-COMP and is a Director of Rowing Australia and SecondBite.
Ian Leavers Director
Ian is General President and CEO of the Queensland Police Union of Employees and has held this position since 2009. He has been involved with the Queensland Police Union and as a Union official since 1997. Ian is also a Director of the Work Health and Safety Queensland Board.
Roslyn McLennan BEcon Director
Roslyn was appointed to the Board on 7 July 2016. She is currently General Secretary of the Queensland Council of Unions, a Director of Sunsuper and was formerly Assistant General Secretary of the Queensland Independent Education Union.
Ian Winterburn Dip Acc, BEcon, MBEcon (Hons) Director
Ian is the Deputy Chairperson of the National Retail Association. He has a wide range of senior financial and operational management experience in the construction, hotel, manufacturing and retail industries and has been associated with major Queensland and national companies over the past 40 years.

20 WorkCover Queensland annual report 2015–2016
EXECUTIVE TEAM Tony Hawkins BCom, Dip Fin Mgt, FCPA, GAICD Chief Executive Officer
Tony has led WorkCover Queensland as Chief Executive Officer since 1998. Prior to this, Tony had 13 years' insurance experience with the AXA Group and 14 years' mining experience with CSR. As Chief Executive Officer, Tony has continued to guide WorkCover with a clear focus on continuing excellence and delivering customer focused services.
Trevor Barrenger BA, GAICD General Manager Business Solutions
Trevor has had extensive experience in the delivery of business solutions and technology systems in a number of global consulting organisations. He has had the opportunity to work on large projects across Europe, America and Australia, and his experience supports his ability to deliver technology solutions to meet WorkCover's business needs and customer service outcomes.
David Heley BAdmin, FCPA, DFP, AGIA, GAICD General Manager Finance
David has more than 20 years' experience in the finance and insurance sector. As General Manager Finance, David ensures WorkCover maintains a strong financial position. His division provides financial strategy, reporting and analysis, taxation, treasury, compliance, and audit functions that support the business. David is also the company secretary.
Paul Abernethy MBA Lead Customer Experience, Trade Services
Paul has worked in the workers’ compensation industry for over 15 years and is passionate about delivering an outstanding customer experience. Within the industry aligned customer service model, he is responsible for construction, labour hire, mining, and security and safety industries. He is also responsible for WorkCover’s contact centre. His background supports his ability to lead people in the delivery of customer-focused services to achieve quality outcomes for injured workers, at the lowest cost for employers.
Christina Carras BComm, ACA, SIA (Aff), AGIA, GAICD Lead Customer Experience, Professional Services
Christina oversees the claims, premium and relationship management of our industry aligned customer service model. She is responsible for the health and community care, education, tourism and technical industries, and plays an integral role in delivery changes that benefit both our employers and injured workers, while at the same time engaging with our people to deliver the best outcomes.
21 WorkCover Queensland annual report 2015–2016
Barbara Martin BBehSc, MRehabCounsel Lead Customer Experience, Logistics and Supply Services
Barbara has contributed to the vision of the personal injury industry for the last 14 years. She is responsible for the agriculture, manufacturing, logistics and supply sectors and provides leadership to a range of management groups. Barbara’s passion for injury prevention and the health benefits of work has influenced positive outcomes for customers and stakeholders. Her comprehensive knowledge of the scheme provides for integrity in our information and education, within a changing business environment.
Janine Reid BLaws, MBA, GIA (Cert), GAICD Legal Counsel
Janine has worked in personal injuries for over 20 years. Her knowledge and experience in personal injuries support her ability to manage our common law strategy and legal panel. She is also responsible for providing legal advice to the business and the WorkCover Board and engaging with external stakeholders.
22 WorkCover Queensland annual report 2015–2016
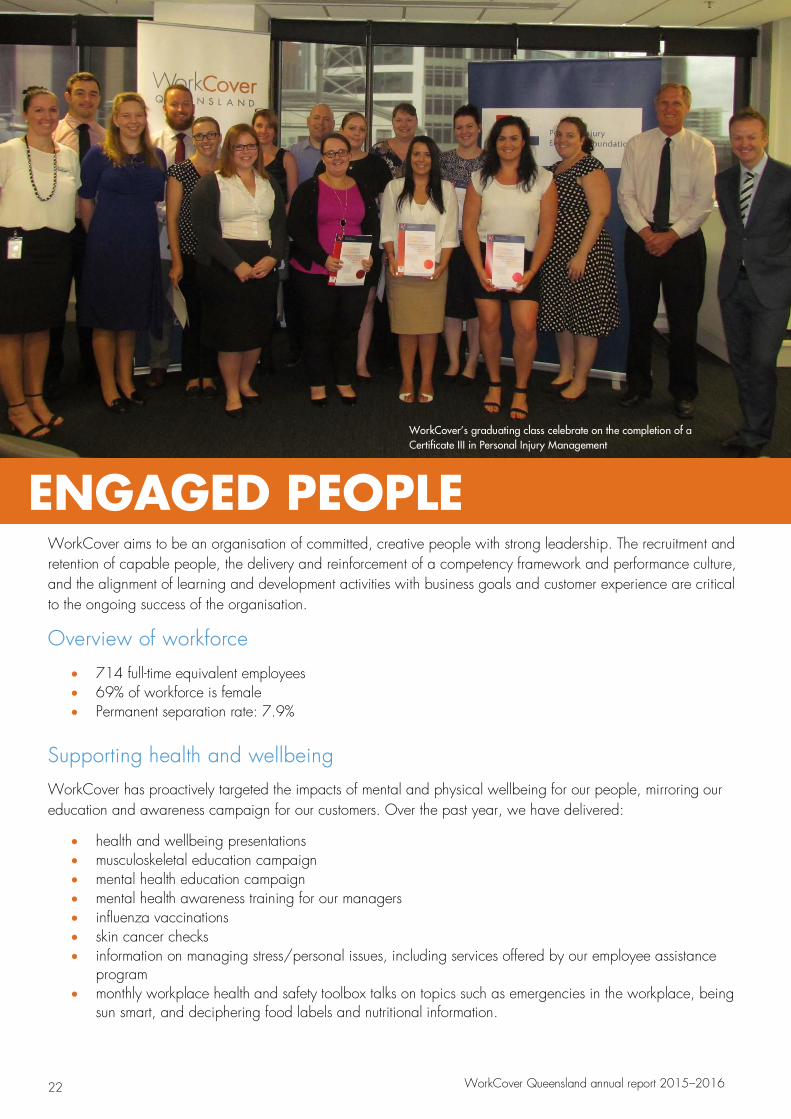
WorkCover aims to be an organisation of committed, creative people with strong leadership. The recruitment and retention of capable people, the delivery and reinforcement of a competency framework and performance culture, and the alignment of learning and development activities with business goals and customer experience are critical to the ongoing success of the organisation.
Overview of workforce
• 714 full-time equivalent employees• 69% of workforce is female• Permanent separation rate: 7.9%
Supporting health and wellbeing
WorkCover has proactively targeted the impacts of mental and physical wellbeing for our people, mirroring our education and awareness campaign for our customers. Over the past year, we have delivered:
• health and wellbeing presentations• musculoskeletal education campaign• mental health education campaign• mental health awareness training for our managers• influenza vaccinations• skin cancer checks• information on managing stress/personal issues, including services offered by our employee assistance
program• monthly workplace health and safety toolbox talks on topics such as emergencies in the workplace, being
sun smart, and deciphering food labels and nutritional information.
WorkCover’s graduating class celebrate on the completion of a Certificate III in Personal Injury Management
ENGAGED PEOPLE
23 WorkCover Queensland annual report 2015–2016
Our Workplace Health and Safety Committee and champions meet regularly to promote and raise awareness of safety at work.
We have also continued to encourage a healthy work-life balance through flexible working hours, parental leave, part-time and job share opportunities.
Professional development
Induction
Our induction day is an opportunity to welcome our new starters, introduce the way we work and support our formal on-boarding program. Our new starters engage in a workshop about our organisational values and how they guide our behaviour as well as their role in fostering a diverse and inclusive workplace. Our CEO also talks about the journey of WorkCover and the importance of creating a customer experience, no matter what your role.
Leadership development
WorkCover has identified six leadership competencies, which are a combination of the knowledge, skills and behaviours needed to perform a leadership role effectively. The six competencies set a high standard for leadership throughout WorkCover.
• Strive for operational excellence• Enhance customer relationships• Champion change and drive innovation• Foster teamwork and collaboration• Lead and develop people• Maximise strategic effectiveness
WorkCover uses these competencies to guide our recruitment, selection and development of employees across the organisation. The competencies help us to:
• deliver the corporate strategy• optimise our performance• contribute our best and maximise our potential• build sustainable relationships with customers and other stakeholders• create a culture of leadership and accountability• structure our leadership development programs and initiatives.
All WorkCover leaders participated in a corporate education initiative, attending one-day workshops on topics such as Behavioural economics, Systems thinking to manage complexity, Coaching as essential leadership practice, Intellectual asset management and protection, Leading change organisational renewal, and Cyber safety.
Leadership sessions were also delivered in-house and included sessions on: Leading with emotional intelligence, Fostering a culture of lifelong learning, and Recognising, responding and referring employees experiencing Domestic Violence.
Developing our people
WorkCover seeks people who believe in and are committed to our vision and values. We have captured the behavioural expectations in four key competencies that are designed to empower our people to achieve their full potential.
• We foster teamwork and collaboration in our daily work practices• We enhance relationships with our customers• We strive for operational excellence everyday• We champion change and drive innovation in the way we work
24 WorkCover Queensland annual report 2015–2016
To deliver the best outcomes for our customers, we believe it is important that our people are experts in workers’ compensation. Our people have the opportunity to learn and gain skills across all areas of the business, from claims support through to claims management and ultimately managing and fostering client relationships.
As part of our learning programs and career development options, we offer our people the opportunity to undertake a Certificate III in Personal Injury Management (Claims Management) with the Personal Injury Education Foundation. This certificate is a national vocational qualification that is recognised within the personal injury industry.
Recruitment and retention
Attracting suitably qualified candidates has been a core focus over the past year. A holistic approach to recruitment has seen the use of psychometric evaluations, in-house assessment centres and robust pre-employment checks to inform our selection decisions. A workforce planning methodology has been used to identify future people requirements. This methodology has been piloted across the Customer Experience Division and Customer Support divisions of our business and coincides with the annual budgeting and planning cycle. It is anticipated this methodology will be fully integrated in 2016–2017.
To improve our practices for the year ahead, we will be focusing on developing manager capability across recruitment, defining our talent profiles and using online platforms to make hiring more efficient. We will be working on better understanding our candidate experience to ensure we are communicating our employer brand accurately to attract and retain our future talent.
Industrial and employee relations
The Consultative Committee meets 10 times each year, one meeting per calendar month excluding December and January. It is comprised of the Manager Human Resources, the General Manager Finance as the management representative and Together Queensland representatives and workplace delegates. The Consultative Committee is used to consult on a broad range of issues, including the modernisation of the WorkCover Queensland Employees Award – State 2015, and the negotiation of the 2016 Certified Agreement.
25
WorkCover Queensland annual report 2015–2016
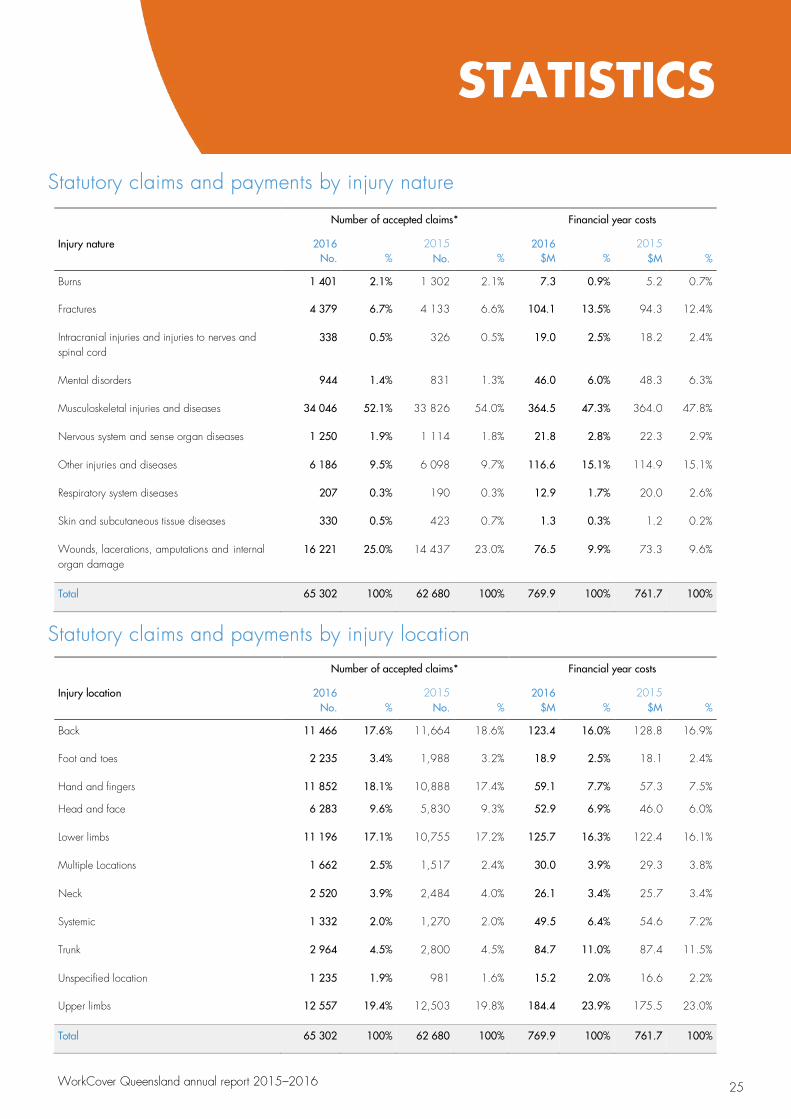
Statutory claims and payments by injury nature
Number of accepted claims* Financial year costs
Injury nature 2016 No.
%
2015 No.
%
2016 $M
%
2015 $M
%
Burns 1 401 2.1% 1 302 2.1% 7.3 0.9% 5.2 0.7%
Fractures 4 379 6.7% 4 133 6.6% 104.1 13.5% 94.3 12.4%
Intracranial injuries and injuries to nerves and spinal cord
338 0.5% 326 0.5% 19.0 2.5% 18.2 2.4%
Mental disorders 944 1.4% 831 1.3% 46.0 6.0% 48.3 6.3%
Musculoskeletal injuries and diseases 34 046 52.1% 33 826 54.0% 364.5 47.3% 364.0 47.8%
Nervous system and sense organ diseases 1 250 1.9% 1 114 1.8% 21.8 2.8% 22.3 2.9%
Other injuries and diseases 6 186 9.5% 6 098 9.7% 116.6 15.1% 114.9 15.1%
Respiratory system diseases 207 0.3% 190 0.3% 12.9 1.7% 20.0 2.6%
Skin and subcutaneous tissue diseases 330 0.5% 423 0.7% 1.3 0.3% 1.2 0.2%
Wounds, lacerations, amputations and internal organ damage
16 221 25.0% 14 437 23.0% 76.5 9.9% 73.3 9.6%
Total 65 302 100% 62 680 100% 769.9 100% 761.7 100%
Statutory claims and payments by injury location
Number of accepted claims* Financial year costs
Injury location 2016 No.
%
2015 No.
%
2016 $M
%
2015 $M
%
Back 11 466 17.6% 11,664 18.6% 123.4 16.0% 128.8 16.9%
Foot and toes 2 235 3.4% 1,988 3.2% 18.9 2.5% 18.1 2.4%
Hand and fingers 11 852 18.1% 10,888 17.4% 59.1 7.7% 57.3 7.5%
Head and face 6 283 9.6% 5,830 9.3% 52.9 6.9% 46.0 6.0%
Lower limbs 11 196 17.1% 10,755 17.2% 125.7 16.3% 122.4 16.1%
Multiple Locations 1 662 2.5% 1,517 2.4% 30.0 3.9% 29.3 3.8%
Neck 2 520 3.9% 2,484 4.0% 26.1 3.4% 25.7 3.4%
Systemic 1 332 2.0% 1,270 2.0% 49.5 6.4% 54.6 7.2%
Trunk 2 964 4.5% 2,800 4.5% 84.7 11.0% 87.4 11.5%
Unspecified location 1 235 1.9% 981 1.6% 15.2 2.0% 16.6 2.2%
Upper limbs 12 557 19.4% 12,503 19.8% 184.4 23.9% 175.5 23.0%
Total 65 302 100% 62 680 100% 769.9 100% 761.7 100%
STATISTICS
26
WorkCover Queensland annual report 2015–2016
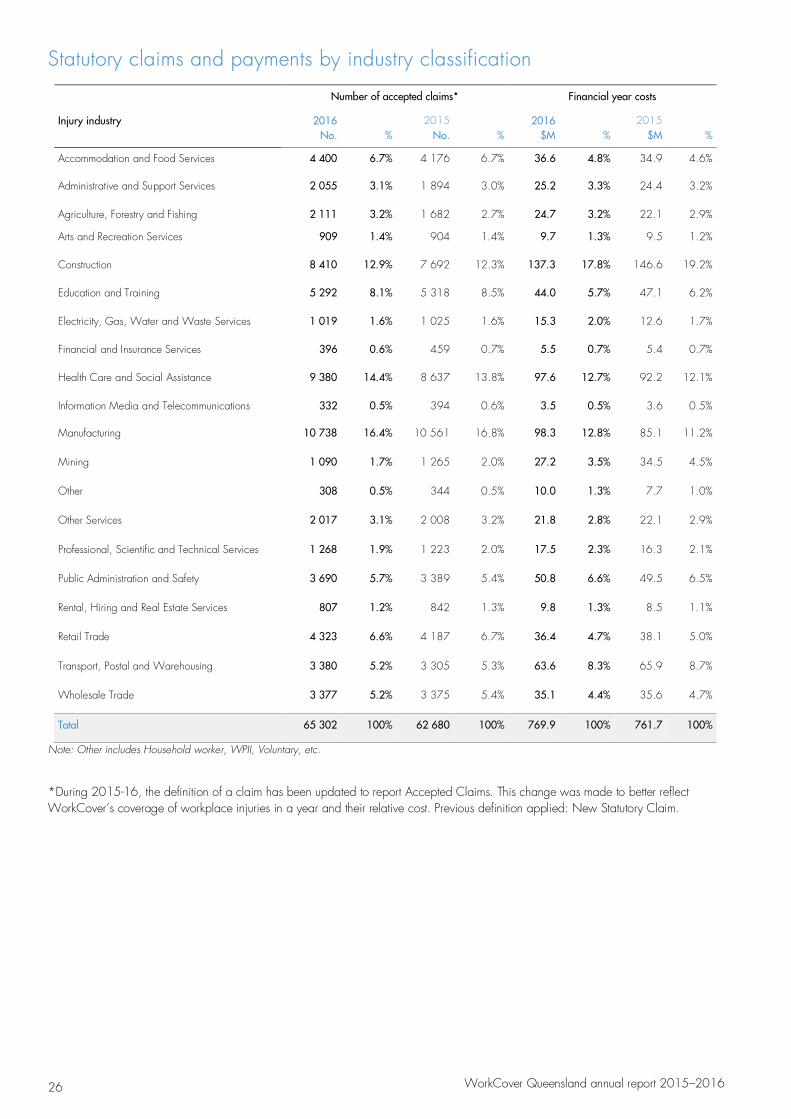
Statutory claims and payments by industry classification
Number of accepted claims* Financial year costs
Injury industry 2016 No.
%
2015 No.
%
2016 $M
%
2015 $M
%
Accommodation and Food Services 4 400 6.7% 4 176 6.7% 36.6 4.8% 34.9 4.6%
Administrative and Support Services 2 055 3.1% 1 894 3.0% 25.2 3.3% 24.4 3.2%
Agriculture, Forestry and Fishing 2 111 3.2% 1 682 2.7% 24.7 3.2% 22.1 2.9%
Arts and Recreation Services 909 1.4% 904 1.4% 9.7 1.3% 9.5 1.2%
Construction 8 410 12.9% 7 692 12.3% 137.3 17.8% 146.6 19.2%
Education and Training 5 292 8.1% 5 318 8.5% 44.0 5.7% 47.1 6.2%
Electricity, Gas, Water and Waste Services 1 019 1.6% 1 025 1.6% 15.3 2.0% 12.6 1.7%
Financial and Insurance Services 396 0.6% 459 0.7% 5.5 0.7% 5.4 0.7%
Health Care and Social Assistance 9 380 14.4% 8 637 13.8% 97.6 12.7% 92.2 12.1%
Information Media and Telecommunications 332 0.5% 394 0.6% 3.5 0.5% 3.6 0.5%
Manufacturing 10 738 16.4% 10 561 16.8% 98.3 12.8% 85.1 11.2%
Mining 1 090 1.7% 1 265 2.0% 27.2 3.5% 34.5 4.5%
Other 308 0.5% 344 0.5% 10.0 1.3% 7.7 1.0%
Other Services 2 017 3.1% 2 008 3.2% 21.8 2.8% 22.1 2.9%
Professional, Scientific and Technical Services 1 268 1.9% 1 223 2.0% 17.5 2.3% 16.3 2.1%
Public Administration and Safety 3 690 5.7% 3 389 5.4% 50.8 6.6% 49.5 6.5%
Rental, Hiring and Real Estate Services 807 1.2% 842 1.3% 9.8 1.3% 8.5 1.1%
Retail Trade 4 323 6.6% 4 187 6.7% 36.4 4.7% 38.1 5.0%
Transport, Postal and Warehousing 3 380 5.2% 3 305 5.3% 63.6 8.3% 65.9 8.7%
Wholesale Trade 3 377 5.2% 3 375 5.4% 35.1 4.4% 35.6 4.7%
Total 65 302 100% 62 680 100% 769.9 100% 761.7 100%
Note: Other includes Household worker, WPII, Voluntary, etc.
*During 2015-16, the definition of a claim has been updated to report Accepted Claims. This change was made to better reflect WorkCover’s coverage of workplace injuries in a year and their relative cost. Previous definition applied: New Statutory Claim.
27
WorkCover Queensland annual report 2015–2016
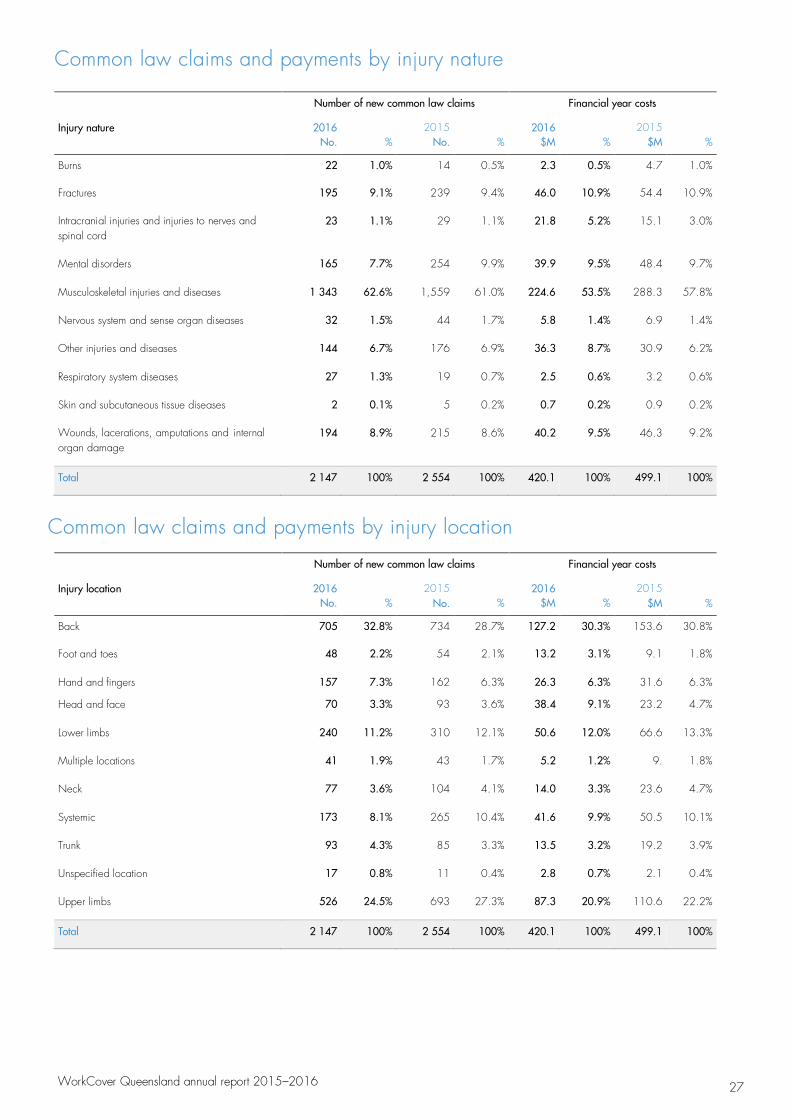
Common law claims and payments by injury nature
Number of new common law claims Financial year costs
Injury nature 2016 No.
%
2015 No.
%
2016 $M
%
2015 $M
%
Burns 22 1.0% 14 0.5% 2.3 0.5% 4.7 1.0%
Fractures 195 9.1% 239 9.4% 46.0 10.9% 54.4 10.9%
Intracranial injuries and injuries to nerves and spinal cord
23 1.1% 29 1.1% 21.8 5.2% 15.1 3.0%
Mental disorders 165 7.7% 254 9.9% 39.9 9.5% 48.4 9.7%
Musculoskeletal injuries and diseases 1 343 62.6% 1,559 61.0% 224.6 53.5% 288.3 57.8%
Nervous system and sense organ diseases 32 1.5% 44 1.7% 5.8 1.4% 6.9 1.4%
Other injuries and diseases 144 6.7% 176 6.9% 36.3 8.7% 30.9 6.2%
Respiratory system diseases 27 1.3% 19 0.7% 2.5 0.6% 3.2 0.6%
Skin and subcutaneous tissue diseases 2 0.1% 5 0.2% 0.7 0.2% 0.9 0.2%
Wounds, lacerations, amputations and internal organ damage
194 8.9% 215 8.6% 40.2 9.5% 46.3 9.2%
Total 2 147 100% 2 554 100% 420.1 100% 499.1 100%
Common law claims and payments by injury location
Number of new common law claims Financial year costs
Injury location 2016 No.
%
2015 No.
%
2016 $M
%
2015 $M
%
Back 705 32.8% 734 28.7% 127.2 30.3% 153.6 30.8%
Foot and toes 48 2.2% 54 2.1% 13.2 3.1% 9.1 1.8%
Hand and fingers 157 7.3% 162 6.3% 26.3 6.3% 31.6 6.3%
Head and face 70 3.3% 93 3.6% 38.4 9.1% 23.2 4.7%
Lower limbs 240 11.2% 310 12.1% 50.6 12.0% 66.6 13.3%
Multiple locations 41 1.9% 43 1.7% 5.2 1.2% 9. 1.8%
Neck 77 3.6% 104 4.1% 14.0 3.3% 23.6 4.7%
Systemic 173 8.1% 265 10.4% 41.6 9.9% 50.5 10.1%
Trunk 93 4.3% 85 3.3% 13.5 3.2% 19.2 3.9%
Unspecified location 17 0.8% 11 0.4% 2.8 0.7% 2.1 0.4%
Upper limbs 526 24.5% 693 27.3% 87.3 20.9% 110.6 22.2%
Total 2 147 100% 2 554 100% 420.1 100% 499.1 100%
28
WorkCover Queensland annual report 2015–2016
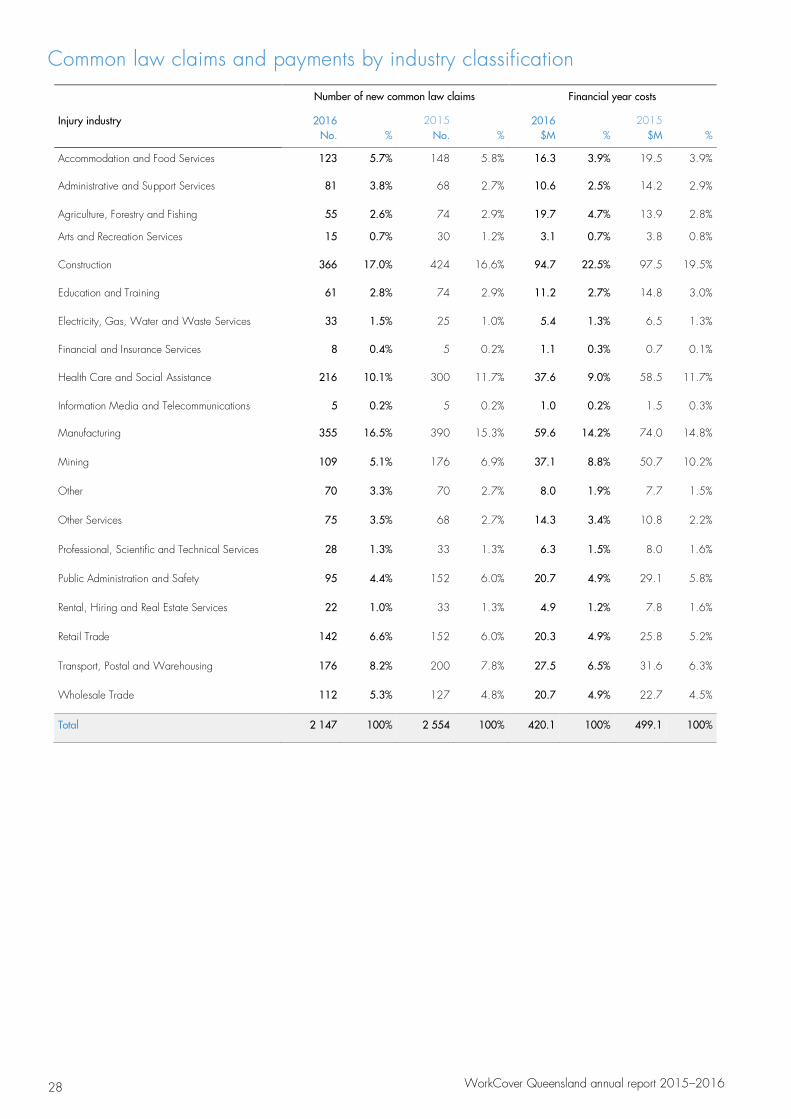
Common law claims and payments by industry classification
Number of new common law claims Financial year costs
Injury industry 2016 No.
%
2015 No.
%
2016 $M
%
2015 $M
%
Accommodation and Food Services 123 5.7% 148 5.8% 16.3 3.9% 19.5 3.9%
Administrative and Support Services 81 3.8% 68 2.7% 10.6 2.5% 14.2 2.9%
Agriculture, Forestry and Fishing 55 2.6% 74 2.9% 19.7 4.7% 13.9 2.8%
Arts and Recreation Services 15 0.7% 30 1.2% 3.1 0.7% 3.8 0.8%
Construction 366 17.0% 424 16.6% 94.7 22.5% 97.5 19.5%
Education and Training 61 2.8% 74 2.9% 11.2 2.7% 14.8 3.0%
Electricity, Gas, Water and Waste Services 33 1.5% 25 1.0% 5.4 1.3% 6.5 1.3%
Financial and Insurance Services 8 0.4% 5 0.2% 1.1 0.3% 0.7 0.1%
Health Care and Social Assistance 216 10.1% 300 11.7% 37.6 9.0% 58.5 11.7%
Information Media and Telecommunications 5 0.2% 5 0.2% 1.0 0.2% 1.5 0.3%
Manufacturing 355 16.5% 390 15.3% 59.6 14.2% 74.0 14.8%
Mining 109 5.1% 176 6.9% 37.1 8.8% 50.7 10.2%
Other 70 3.3% 70 2.7% 8.0 1.9% 7.7 1.5%
Other Services 75 3.5% 68 2.7% 14.3 3.4% 10.8 2.2%
Professional, Scientific and Technical Services 28 1.3% 33 1.3% 6.3 1.5% 8.0 1.6%
Public Administration and Safety 95 4.4% 152 6.0% 20.7 4.9% 29.1 5.8%
Rental, Hiring and Real Estate Services 22 1.0% 33 1.3% 4.9 1.2% 7.8 1.6%
Retail Trade 142 6.6% 152 6.0% 20.3 4.9% 25.8 5.2%
Transport, Postal and Warehousing 176 8.2% 200 7.8% 27.5 6.5% 31.6 6.3%
Wholesale Trade 112 5.3% 127 4.8% 20.7 4.9% 22.7 4.5%
Total 2 147 100% 2 554 100% 420.1 100% 499.1 100%
29
WorkCover Queensland annual report 2015–2016
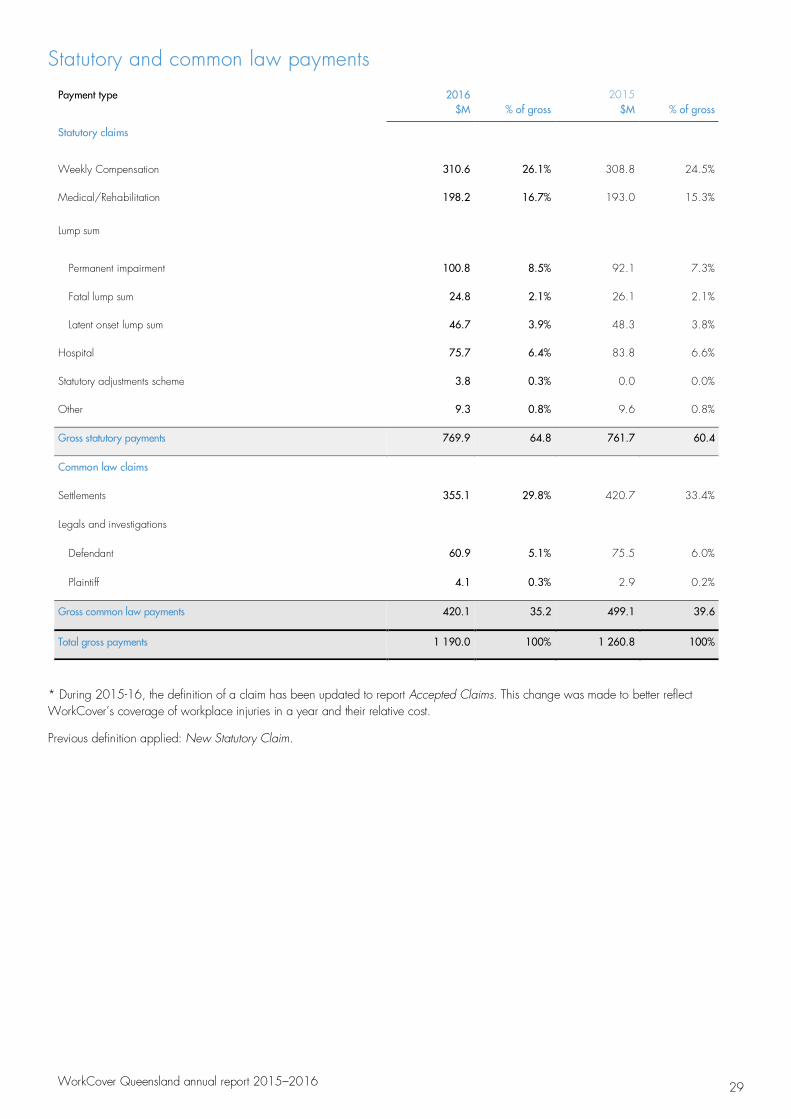
Statutory and common law payments
Payment type 2016 $M
% of gross
2015 $M
% of gross
Statutory claims
Weekly Compensation 310.6 26.1% 308.8 24.5%
Medical/Rehabilitation 198.2 16.7% 193.0 15.3%
Lump sum
Permanent impairment 100.8 8.5% 92.1 7.3%
Fatal lump sum 24.8 2.1% 26.1 2.1%
Latent onset lump sum 46.7 3.9% 48.3 3.8%
Hospital 75.7 6.4% 83.8 6.6%
Statutory adjustments scheme 3.8 0.3% 0.0 0.0%
Other 9.3 0.8% 9.6 0.8%
Gross statutory payments 769.9 64.8 761.7 60.4
Common law claims
Settlements 355.1 29.8% 420.7 33.4%
Legals and investigations
Defendant 60.9 5.1% 75.5 6.0%
Plaintiff 4.1 0.3% 2.9 0.2%
Gross common law payments 420.1 35.2 499.1 39.6
Total gross payments 1 190.0 100% 1 260.8 100%
* During 2015-16, the definition of a claim has been updated to report Accepted Claims. This change was made to better reflect WorkCover’s coverage of workplace injuries in a year and their relative cost.
Previous definition applied: New Statutory Claim.
30
WorkCover Queensland annual report 2015–2016
Strategic planning
A four-year Corporate Plan and Statement of Corporate Intent are prepared annually and approved by the Minister in accordance with the Workers’ Compensation and Rehabilitation Act 2003. The Corporate Plan summarises our vision, values, goals, strategies and performance indicators. The plan forms the basis for divisional business plans, which define operational strategies to meet our business objectives. The divisional business plans outline our key financial and operational performance indicators, which we monitor monthly. Our Statement of Corporate Intent outlines our objectives and major activities, and specifies various financial and nonfinancial performance targets for the financial year.
Board of Directors
The statutory role and requirements of the Board are set out in section 427 of the Workers’ Compensation and Rehabilitation Act 2003, and chapter 8 outlines the powers and functions of WorkCover. The WorkCover Board charter specifies the role and responsibilities of the Board in detail and is available on our website.
The WorkCover Board consists of independent non-executive directors appointed by the Governor in Council who is responsible for appointing directors, based on experience and knowledge, and determining their remuneration. Information on directors’ and executives’ benefits is detailed within note S3 of the financial statements.
Kylie Easton returned to work after injury with Recover@Work host employer LendLease
CORPORATE GOVERNANCE
31
WorkCover Queensland annual report 2015–2016
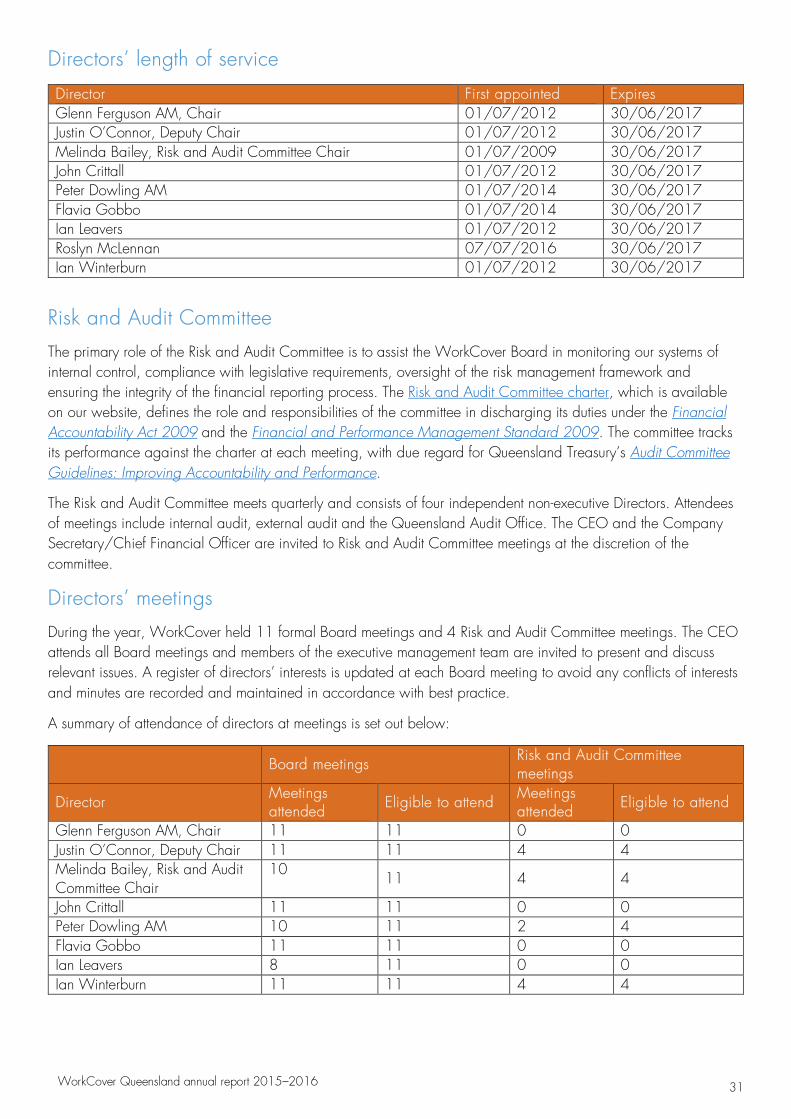
Directors’ length of service
Director First appointed Expires Glenn Ferguson AM, Chair 01/07/2012 30/06/2017 Justin O’Connor, Deputy Chair 01/07/2012 30/06/2017 Melinda Bailey, Risk and Audit Committee Chair 01/07/2009 30/06/2017 John Crittall 01/07/2012 30/06/2017 Peter Dowling AM 01/07/2014 30/06/2017 Flavia Gobbo 01/07/2014 30/06/2017 Ian Leavers 01/07/2012 30/06/2017 Roslyn McLennan 07/07/2016 30/06/2017 Ian Winterburn 01/07/2012 30/06/2017
Risk and Audit Committee
The primary role of the Risk and Audit Committee is to assist the WorkCover Board in monitoring our systems of internal control, compliance with legislative requirements, oversight of the risk management framework and ensuring the integrity of the financial reporting process. The Risk and Audit Committee charter, which is available on our website, defines the role and responsibilities of the committee in discharging its duties under the Financial Accountability Act 2009 and the Financial and Performance Management Standard 2009. The committee tracks its performance against the charter at each meeting, with due regard for Queensland Treasury’s Audit Committee Guidelines: Improving Accountability and Performance.
The Risk and Audit Committee meets quarterly and consists of four independent non-executive Directors. Attendees of meetings include internal audit, external audit and the Queensland Audit Office. The CEO and the Company Secretary/Chief Financial Officer are invited to Risk and Audit Committee meetings at the discretion of the committee.
Directors’ meetings
During the year, WorkCover held 11 formal Board meetings and 4 Risk and Audit Committee meetings. The CEO attends all Board meetings and members of the executive management team are invited to present and discuss relevant issues. A register of directors’ interests is updated at each Board meeting to avoid any conflicts of interests and minutes are recorded and maintained in accordance with best practice.
A summary of attendance of directors at meetings is set out below:
Board meetings Risk and Audit Committee meetings
Director Meetings attended Eligible to attend Meetings
attended Eligible to attend
Glenn Ferguson AM, Chair 11 11 0 0 Justin O’Connor, Deputy Chair 11 11 4 4 Melinda Bailey, Risk and Audit Committee Chair
10 11 4 4
John Crittall 11 11 0 0 Peter Dowling AM 10 11 2 4 Flavia Gobbo 11 11 0 0 Ian Leavers 8 11 0 0 Ian Winterburn 11 11 4 4
32 WorkCover Queensland annual report 2015–2016
Senior executives
The CEO assesses performance of senior executives on an annual basis as part of the organisation’s performance review process. The Board also assesses the performance of the CEO as part of this process.
Stakeholder feedback
WorkCover maintains a complaints management policy in accordance with the AS ISO10002–2014: Guidelines for complaints management in organisations and section 219A of the Public Service Act 2008. This policy is published on our website for easy customer access and is routinely monitored and audited to ensure compliance with statutory, policy and reporting requirements.
WorkCover recognises the importance of complaints management as part of delivering a quality customer experience. We support the rights of our customers and stakeholders to have their complaints heard and actioned appropriately. We are committed to resolving complaints quickly and objectively and believe that all customer and stakeholder feedback, both positive and negative, presents opportunities for continuous improvement.
Our centralised complaints management system is used to record, monitor and respond to complaints. In addition, the Board and executive management review complaints data quarterly.
In 2015–2016, we recorded 266 complaints, of which 83 resulted in further action and 183 required no further action. The Queensland Ombudsman received 14 complaints relating to WorkCover, of which 11 were declined for investigation by the Ombudsman. Where the complaints required further action, we reviewed our processes and implemented improvements, including staff training to enhance customer experience.
Mandatory open data reporting
WorkCover has reported online information for consultancies and overseas travel in accordance with mandatory reporting requirements.
ETHICS, COMPLIANCE AND RISK MANAGEMENT Ethics
Ethics provide the overarching principles and rules that govern the behaviour of WorkCover’s people and also consider the impact on the community and environment. WorkCover’s ethics program aims to provide a framework to ensure the organisation has high standards of ethical behaviour in compliance with relevant legislative requirements and promotes an ethical culture consistent with our values.
Code of Conduct
WorkCover’s Board members and employees are expected to maintain the highest level of ethical standards whilst performing their duties. WorkCover’s code of conduct supports our values providing a framework for high ethical standards and has been written to align with the requirements of the Public Sector Ethics Act 1994 (PSEA). The assertions of integrity and accountability are integrated into WorkCover’s strategies, objectives and actions. The code of conduct is communicated to our people through the corporate induction program and is available on the WorkCover intranet and website. Our staff receive annual refresher training on this document and the PSEA in general. All relevant internal policies and practices align with the code and the PSEA, including the ethics principles and values detailed in this Act. All WorkCover staff are required to comply with the code of conduct. Any noncompliance may result in disciplinary action, which could include termination of employment.
The WorkCover Board is bound by ethical standards outlined in the Workers’ Compensation and Rehabilitation Act 2003 (the Act), which requires directors to act honestly, disclose interests, exercise due diligence and not use information or their position inappropriately. Directors are bound by the PSEA and as such, WorkCover’s code of
33 WorkCover Queensland annual report 2015–2016
conduct, on which they annually receive the same training as staff. Additionally, the Board follows the guidelines set out in Welcome Aboard: A Guide for Members of Government Boards, Committees and Statutory Authorities as issued by the Department of Premier and Cabinet.
Compliance
We maintain a number of policies and procedures detailing our compliance obligations in relation to relevant legislation, regulations, and codes of practice. We continually monitor our systems and processes to ensure these obligations are met. WorkCover’s obligations are managed through the Risk and Audit Committee and progress is reported in the annual compliance calendar at quarterly meetings.
Internal audit
Internal audit supports WorkCover’s Risk and Audit Committee in meeting its charter by providing an independent function that evaluates and provides impartial advice on the effectiveness of WorkCover’s governance, internal controls and corporate governance processes to executive management and the Board. The internal audit function is managed by Ernst & Young, who are both independent from management and WorkCover’s external auditors, and operate in accordance with WorkCover’s internal audit charter. This charter outlines the objectives, roles and responsibilities for the internal audit function and is consistent with all key internal audit and ethical standards.
Both the strategic and annual audit plans prepared by the internal auditors are approved by the Risk and Audit Committee and the Board. This Risk and Audit Committee operates with due regard for Treasury’s Audit Committee Guidelines, including the monitoring of the effectiveness, efficiency and economy of the internal audit function. Significant financial and operational risks identified by the internal auditors are reported through to the Risk and Audit Committee, as per the Internal Audit Charter. Risks are reviewed regularly through the use of an assurance map.
In 2015–2016, a total of 13 internal audit engagements were completed in line with the annual internal audit plan. All recommendations from these audits have been implemented or are on track to be implemented within agreed timeframes.
Quality assurance reviews
Our quality assurance reviews are designed to confirm that the controls in place to manage risks are effective and identify potential areas for improvement to our processes, policies, and procedures.
Compliance training
WorkCover is committed to ensuring the ongoing capability and capacity of our people through the continued investment and development of our leadership and technical training competencies delivered throughout the year. As part of this commitment, all staff complete regular training to keep up-to-date with compliance requirements in key areas, including:
• Australian consumer legislation• Code of conduct• Privacy and record keeping• Fraud, corruption and risk• Technology use• Our people policies and workplace health and safety• PSEA
34
WorkCover Queensland annual report 2015–2016
Customer compliance and education
WorkCover has a dedicated compliance and education team to ensure Queensland employers are aware of their obligations to maintain adequate cover when engaging workers. We maintain a balanced compliance strategy by providing targeted education and compliance activities across the state.
The compliance and education team educate stakeholders, conduct audits and site visits with businesses who appear to contravene their requirements, including failing to insure or not maintaining the correct level of cover, by underinsuring.
The following results were achieved during the year:
• 1,013 random site visits were conducted including 573 regional site visits • 142 non-compliant employers identified representing a 14% non-compliance detection rate • 1,660 targeted audits were conducted • 634 employers were non-compliant with the Act representing a 38% non-compliance rate.
Recordkeeping
All staff at WorkCover are responsible for keeping and maintaining records which are maintained through WorkCover’s Claims and Policy Information System (CPIS) for our claims and policy records and through an integrated electronic records system for all corporate records. Annual compliance training is completed to ensure that all staff are aware of their obligations under the Public Records Act 2002. This is essential training given that all of our claims and policy records have been digitised since 2008 and corporate records have been successfully transitioned to digital records during the financial year. WorkCover is now maintaining all records electronically.
The approach to recordkeeping was reviewed throughout the year to ensure continuous improvement strategies are implemented to maintain the quality and compliance of all records.
Public records are being retained in line with WorkCover’s recordkeeping policy, the Queensland State Archives’ General Retention and Disposal Schedule for Administrative Records and WorkCover’s Queensland State Archives approved Retention and Disposal Schedule, which was last reviewed in May 2014. No records were transferred to the Queensland State Archives during the 2016 financial year. Additionally, no breaches of the retention and disposal schedules were noted during the year, with no records being reported as missing or lost during this same period.
Privacy
WorkCover is committed to protecting the privacy of customers, staff and third parties in accordance with the Information Privacy Act 2009 (IP Act), which governs how information is collected, used, stored and disclosed by Queensland government agencies. All disclosures of private and personal information by WorkCover are managed under this Act, the Right to Information Act 2009 (RTI Act) or the Workers’ Compensation and Rehabilitation Act 2003. WorkCover has a Privacy Committee responsible for the promotion of privacy principles throughout the organisation. The Committee actively encourages privacy awareness through initiatives such as the participation in the Privacy Awareness Week which highlighted the importance of the protection of personal information to our staff. Additionally, staff undertake annual privacy training in accordance with our compliance program.
Risk management
WorkCover’s risk management framework and policy is based on AS/NZS ISO 31000:2009 Risk Management – Principles and Guidelines. This framework involves the establishment of an appropriate structure and culture designed to systematically identify, analyse, treat, monitor and communicate key risks associated with its activities
35 WorkCover Queensland annual report 2015–2016
and operating environment. In 2015–2016, WorkCover has continued to enhance existing risk management processes and encourage a culture of risk awareness.
WorkCover has a Risk and Assurance team responsible for:
• informing the Risk and Audit Committee of WorkCover’s Corporate Risks• monitoring the risk management framework• assisting risk champions.
Our risk management policy is available on our website.
Workplace health and safety
WorkCover is committed to maintaining a safe working environment, preventing workplace injuries and appropriately managing injuries should they occur. The focus on safety culture and early intervention resulted in 100% of workers’ compensation claimants returning to work.
WorkCover provides and maintains safe equipment for staff and undertakes scheduled safety inspections throughout the year, while monitoring our compliance with the Work Health and Safety Act 2011.
We have continued to strive for employer excellence over the last year by maintaining our commitment to continuous evaluation of safety ergonomics, injury management strategies and processes, training, wellness, and the safety culture of the organisation.
WorkCover uses a software program for recording workplace incidents, which includes a workplace injury/illness, a dangerous event or a ‘near miss’. Reports from this system are used to provide information to our Workplace Health and Safety (WHS) Committee for review and setting of strategies to mitigate the risk of injuries. These reports are also presented to the Board to assist in meeting their obligations of due diligence to our people and maintaining a safe work environment.
Workplace induction updates and monthly WHS toolbox talks inform new and existing employees of the obligations, expectations and due diligence required of those who work within the organisation.
Our WHS Committee maintains its commitment to meeting on a monthly basis in accordance with WorkCover policy and the Work Health and Safety Act 2011, and fosters open communication with workers and transparency with executive management. In 2016, a WHS Champions group was established to deliver and communicate operational outcomes of the WHS Committee. The WHS Champions meet on a quarterly basis.
A review of emergency procedures has also seen the introduction of cardiac defibrillator machines in WorkCover’s office.
See the Engaged people section of our annual report for more information on other initiatives WorkCover delivered in 2015–2016 to promote a safe and healthy working environment for our people.
Business continuity management
Our business continuity and disaster recovery plan has been developed to minimise the impact of a crisis on customer service and our people. On a regular basis, plans are reviewed and tested and training is undertaken by key Business Continuity Plan personnel.
36
WorkCover Queensland annual report 2015–2016
Our core financial goal is to be financially viable, well managed and efficient, balancing worker and employer needs.
Financial results
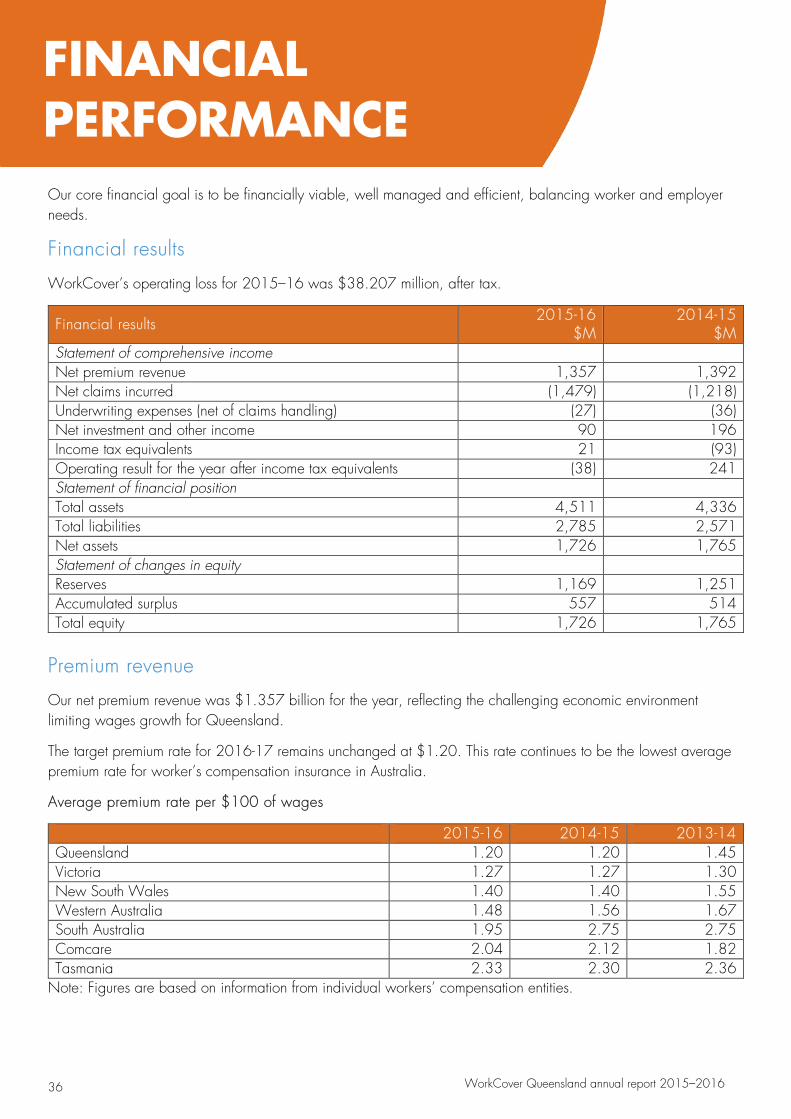
WorkCover’s operating loss for 2015–16 was $38.207 million, after tax.
Financial results 2015-16 $M
2014-15 $M
Statement of comprehensive income Net premium revenue 1,357 1,392 Net claims incurred (1,479) (1,218) Underwriting expenses (net of claims handling) (27) (36) Net investment and other income 90 196 Income tax equivalents 21 (93) Operating result for the year after income tax equivalents (38) 241 Statement of financial position Total assets 4,511 4,336 Total liabilities 2,785 2,571 Net assets 1,726 1,765 Statement of changes in equity Reserves 1,169 1,251 Accumulated surplus 557 514 Total equity 1,726 1,765
Premium revenue
Our net premium revenue was $1.357 billion for the year, reflecting the challenging economic environment limiting wages growth for Queensland.
The target premium rate for 2016-17 remains unchanged at $1.20. This rate continues to be the lowest average premium rate for worker’s compensation insurance in Australia.
Average premium rate per $100 of wages
2015-16 2014-15 2013-14 Queensland 1.20 1.20 1.45 Victoria 1.27 1.27 1.30 New South Wales 1.40 1.40 1.55 Western Australia 1.48 1.56 1.67 South Australia 1.95 2.75 2.75 Comcare 2.04 2.12 1.82 Tasmania 2.33 2.30 2.36
Note: Figures are based on information from individual workers’ compensation entities.
FINANCIAL PERFORMANCE
37 WorkCover Queensland annual report 2015–2016
Net claims incurred
Net claims incurred were $1.479 billion (2014-15: $1.218 billion) for 2015-16.
Net claims costs increased in 2015-16 following the latest valuation of the outstanding claims provision completed by our actuaries.
Underwriting expenses
Underwriting expenses include WorkCover’s management and operational expenses and the annual levy payable to the Workers’ Compensation Regulator and Workplace Health and Safety Queensland. To meet disclosure requirements under accounting standards, the claims handling expense portion of underwriting expenses is added to gross claims expense to reflect the total cost of administering claims during the year.
Investment portfolio
WorkCover’s investment portfolio is managed by QIC. The net market value in funds invested as at 30 June 2016 was $4.010 billion (30 June 2015: $4.022 billion).
The net return on our investment portfolio was 2.02% (2014-15: 4.85%). The long term investment strategy was revised by the Board with QIC during the year to position the investment portfolio to be able to balance the competing factors of maximising investment return whilst ensuring the portfolio is not exposed to excessive risk.
We will continue to work with our investment fund manager to effectively manage our investment risk to ensure our portfolio achieves its long term objectives.
Capital adequacy
The Workers’ Compensation and Rehabilitation Act 2003 and Workers’ Compensation and Rehabilitation Regulation 2014 outline specific requirements WorkCover must meet to be considered fully funded. As with other workers’ compensation schemes in Australia, WorkCover is fully funded if total assets are at least equal to its total liabilities. WorkCover’s funding ratio as at 30 June 2016 is 162%, achieving both our legislative requirements and management’s aim of maintaining a funding ratio of at least 120%.
As the funding ratio for WorkCover exceeded 120%, the excess of capital over this requirement has been transferred to the investment fluctuation reserve. The investment fluctuation reserve acts to mitigate the effects of future volatility in the investment return and supports stability in the setting of premium rates. The balance of the investment fluctuation reserve as at 30 June 2016 is $1.156 billion.
Looking to the future
We will continue to use prudent financial management to ensure a balanced, financially viable scheme for all customers and stakeholders. Part of this continuing prudent financial management entails a focus by WorkCover in continuing to operate within budget, achieving value for money, and more generally, ensuring WorkCover continues to minimise its costs and risks in relation to its liabilities. Premiums will be set, claims and operational expenses carefully managed in order to deliver this balance and we will continue our long term investment strategy built around a balanced portfolio.

0
2015-16 CONSOLIDATED
FINANCIAL REPORT Updated to the period ending 31 March 2016
Contents
Consolidated statement of comprehensive income ............................................................................................................... 441 Consolidated statement of financial position .......................................................................................................................... 442 Consolidated statement of changes in equity ......................................................................................................................... 443 Consolidated statement of cash flows .................................................................................................................................... 444 Notes to the consolidated financial statements
Basis of preparation ........................................................................................................................................................... 445 Significant accounting policies ........................................................................................................................................ 4455
Accounting judgements and estimates ........................................................................................................................... 445
Premium ............................................................................................................................................................................ 446 P1 Net premium revenue ............................................................................................................................................... 446
P2 Unearned premium liability ........................................................................................................................................ 446
P3 Liability adequacy test .............................................................................................................................................. 4466
Claims ................................................................................................................................................................................ 447 C1 Net claims incurred .................................................................................................................................................... 447
C2 Outstanding claims liability and recoveries receivable ............................................................................................. 4488
C3 Insurance risk ............................................................................................................................................................ 552
Financial instruments .......................................................................................................................................................... 553 F1 Investment income ..................................................................................................................................................... 553
F2 Categories of financial instruments .......................................................................................................................... 553
F3 Fair value measurements ........................................................................................................................................ 555
F4 Offsetting financial assets and financial liabilities ....................................................................................................... 556
F5 Financial risk management ...................................................................................................................................... 557
Supporting our business ..................................................................................................................................................... 661 S1 Underwriting expenses ............................................................................................................................................. 661
S2 Employee benefits liabilities ....................................................................................................................................... 661
S3 Key management personnel disclosures ................................................................................................................. 663
S4 Property, plant and equipment .................................................................................................................................. 667
S5 Intangible assets ...................................................................................................................................................... 668
S6 Commitments ........................................................................................................................................................... 669
Other ................................................................................................................................................................................. 770 O1 Income tax equivalent ............................................................................................................................................. 770
O2 Reconciliation of cash flows from operating activities ............................................................................................. 772
O3 Auditors’ remuneration ............................................................................................................................................. 772
O4 Contingent liabilities .................................................................................................................................................. 772
O5 Events after reporting date ...................................................................................................................................... 772
O6 Differences between WorkCover consolidated financial statements and WorkCover Queensland financial statements ..................................................................................................................................................................... 772
O7 Summary of additional significant accounting policies ............................................................................................... 774
Declaration by directors .......................................................................................................................................................... 776 Independent audit report .......................................................................................................................................................... 777 Actuarial certificate on net outstanding claims liabilities ......................................................................................................... 779 Certificate of WorkCover Queensland .................................................................................................................................... 780
40 WorkCover Queensland annual report 2015–2016
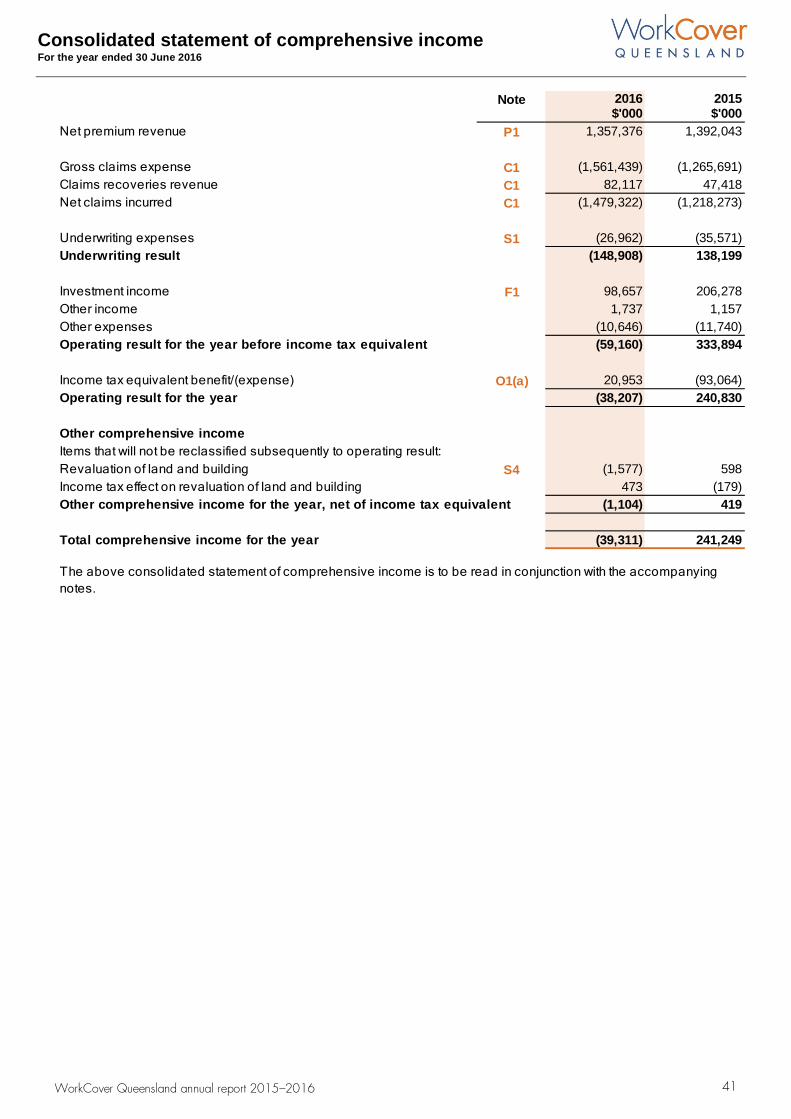
Consolidated statement of comprehensive income For the year ended 30 June 2016
Note 2016 2015$'000 $'000
Net premium revenue P1 1,357,376 1,392,043
Gross claims expense C1 (1,561,439) (1,265,691)Claims recoveries revenue C1 82,117 47,418Net claims incurred C1 (1,479,322) (1,218,273)
Underwriting expenses S1 (26,962) (35,571)Underwriting result (148,908) 138,199
Investment income F1 98,657 206,278Other income 1,737 1,157Other expenses (10,646) (11,740)Operating result for the year before income tax equivalent (59,160) 333,894
Income tax equivalent benefit/(expense) O1(a) 20,953 (93,064)Operating result for the year (38,207) 240,830
Other comprehensive incomeItems that will not be reclassified subsequently to operating result:Revaluation of land and building S4 (1,577) 598Income tax effect on revaluation of land and building 473 (179)Other comprehensive income for the year, net of income tax equivalent (1,104) 419
Total comprehensive income for the year (39,311) 241,249
The above consolidated statement of comprehensive income is to be read in conjunction with the accompanying notes.
Consolidated statement of comprehensive income
41 WorkCover Queensland annual report 2015–2016
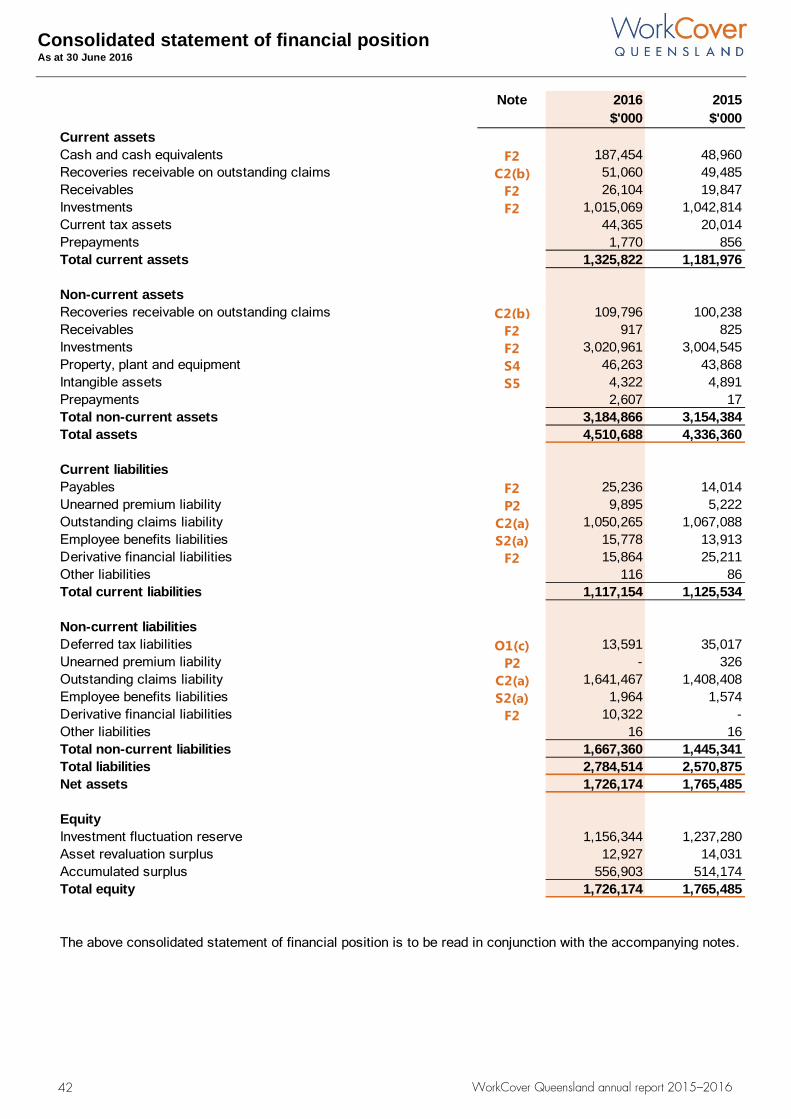
Consolidated statement of financial position As at 30 June 2016
Note 2016 2015$'000 $'000
Current assetsCash and cash equivalents F2 187,454 48,960Recoveries receivable on outstanding claims C2(b) 51,060 49,485Receivables F2 26,104 19,847Investments F2 1,015,069 1,042,814Current tax assets 44,365 20,014Prepayments 1,770 856Total current assets 1,325,822 1,181,976
Non-current assetsRecoveries receivable on outstanding claims C2(b) 109,796 100,238Receivables F2 917 825Investments F2 3,020,961 3,004,545Property, plant and equipment S4 46,263 43,868Intangible assets S5 4,322 4,891Prepayments 2,607 17Total non-current assets 3,184,866 3,154,384Total assets 4,510,688 4,336,360
Current liabilitiesPayables F2 25,236 14,014Unearned premium liability P2 9,895 5,222Outstanding claims liability C2(a) 1,050,265 1,067,088Employee benefits liabilities S2(a) 15,778 13,913Derivative financial liabilities F2 15,864 25,211Other liabilities 116 86Total current liabilities 1,117,154 1,125,534
Non-current liabilitiesDeferred tax liabilities O1(c) 13,591 35,017Unearned premium liability P2 - 326Outstanding claims liability C2(a) 1,641,467 1,408,408Employee benefits liabilities S2(a) 1,964 1,574Derivative financial liabilities F2 10,322 -Other liabilities 16 16Total non-current liabilities 1,667,360 1,445,341Total liabilities 2,784,514 2,570,875Net assets 1,726,174 1,765,485
EquityInvestment fluctuation reserve 1,156,344 1,237,280Asset revaluation surplus 12,927 14,031Accumulated surplus 556,903 514,174Total equity 1,726,174 1,765,485
The above consolidated statement of financial position is to be read in conjunction with the accompanying notes.
Consolidated statement of financial position
42 WorkCover Queensland annual report 2015–2016
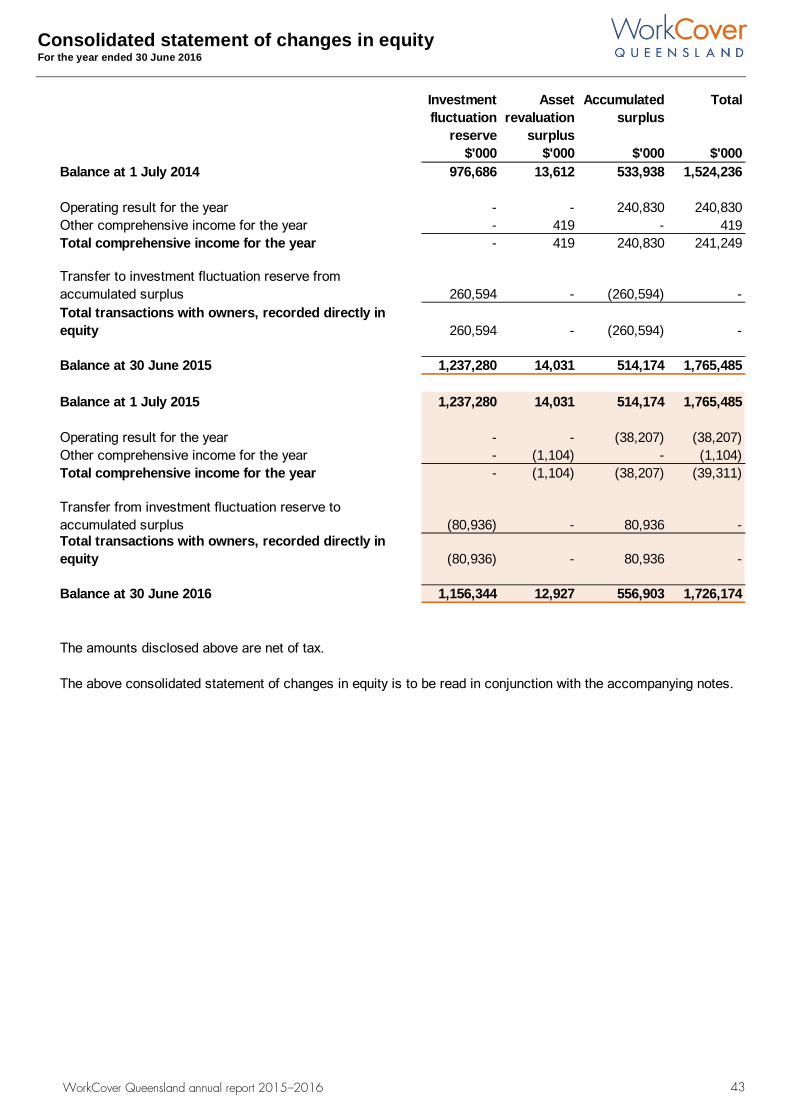
Consolidated statement of changes in equity For the year ended 30 June 2016
Investment fluctuation
reserve
Asset revaluation
surplus
Accumulated surplus
Total
$'000 $'000 $'000 $'000Balance at 1 July 2014 976,686 13,612 533,938 1,524,236
Operating result for the year - - 240,830 240,830Other comprehensive income for the year - 419 - 419Total comprehensive income for the year - 419 240,830 241,249
260,594 - (260,594) -
260,594 - (260,594) -
Balance at 30 June 2015 1,237,280 14,031 514,174 1,765,485
Balance at 1 July 2015 1,237,280 14,031 514,174 1,765,485
Operating result for the year - - (38,207) (38,207)Other comprehensive income for the year - (1,104) - (1,104)Total comprehensive income for the year - (1,104) (38,207) (39,311)
(80,936) - 80,936 -
(80,936) - 80,936 -
Balance at 30 June 2016 1,156,344 12,927 556,903 1,726,174
The amounts disclosed above are net of tax.
The above consolidated statement of changes in equity is to be read in conjunction with the accompanying notes.
Transfer to investment fluctuation reserve from accumulated surplusTotal transactions with owners, recorded directly in equity
Transfer from investment fluctuation reserve to accumulated surplusTotal transactions with owners, recorded directly in equity
Consolidated statement of changes in equity
43 WorkCover Queensland annual report 2015–2016
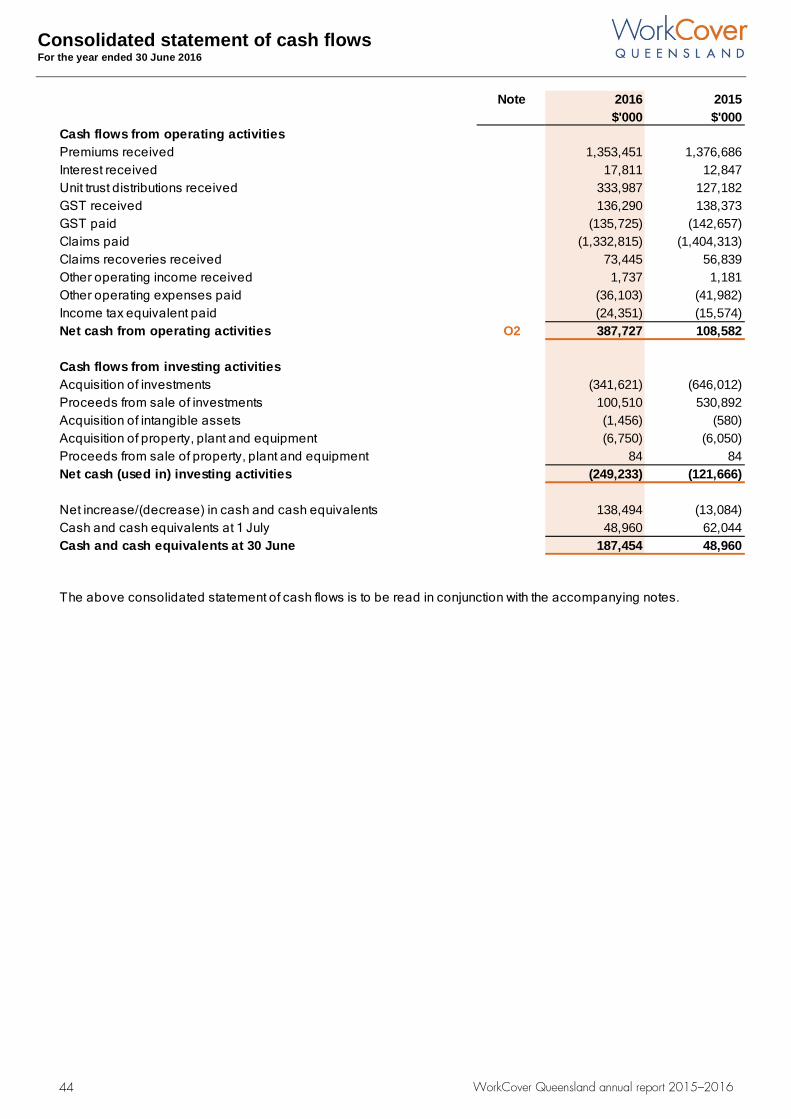
Consolidated statement of cash flows For the year ended 30 June 2016
Note 2016 2015$'000 $'000
Cash flows from operating activitiesPremiums received 1,353,451 1,376,686Interest received 17,811 12,847Unit trust distributions received 333,987 127,182GST received 136,290 138,373GST paid (135,725) (142,657)Claims paid (1,332,815) (1,404,313)Claims recoveries received 73,445 56,839Other operating income received 1,737 1,181Other operating expenses paid (36,103) (41,982)Income tax equivalent paid (24,351) (15,574)Net cash from operating activities O2 387,727 108,582
Cash flows from investing activitiesAcquisition of investments (341,621) (646,012)Proceeds from sale of investments 100,510 530,892Acquisition of intangible assets (1,456) (580)Acquisition of property, plant and equipment (6,750) (6,050)Proceeds from sale of property, plant and equipment 84 84Net cash (used in) investing activities (249,233) (121,666)
Net increase/(decrease) in cash and cash equivalents 138,494 (13,084)Cash and cash equivalents at 1 July 48,960 62,044Cash and cash equivalents at 30 June 187,454 48,960
The above consolidated statement of cash flows is to be read in conjunction with the accompanying notes.
Consolidated statement of cash flows
44 WorkCover Queensland annual report 2015–2016
Basis of preparation
WorkCover Queensland is a statutory body established under the Workers' Compensation and Rehabilitation Act 2003, and is controlled by the Queensland State Government. WorkCover is the main provider of workers’ compensation insurance in Queensland and is a not-for-profit entity. Notes to the consolidated financial statements This financial report represents the financial statements for the consolidated entity ‘WorkCover’ consisting of the parent entity, WorkCover Queensland and its controlled entity, the WorkCover Employing Office (WEO). This financial report does not separately disclose WorkCover Queensland’s financial statements due to the immaterial differences between the consolidated and parent entity’s financial statements. These differences are disclosed in note O6. Basis of preparation WorkCover's principal place of business is 280 Adelaide Street, Brisbane, Queensland, Australia.
This general purpose financial report has been prepared in accordance with Australian Accounting Standards (AASBs) adopted by the Australian Accounting Standards Board (AASB), other authoritative pronouncements of the AASB, Financial Accountability Act 2009, Financial Accountability Regulation 2009, Financial and Performance Management Standard 2009, Workers’ Compensation and Rehabilitation Act 2003 and the Workers’ Compensation and Rehabilitation Regulation 2014.
This financial report has been prepared on a historical cost basis, unless the application of fair value measurements are required by the relevant accounting standard, or as described in this financial report.
The presentation currency is Australian dollars and amounts included in this financial report have been rounded to the nearest $1,000 or, where the amount is less than $500, to zero.
WorkCover Queensland’s Chair, Mr Glenn Ferguson, authorised this report for issue on 30 August 2016.
Significant accounting policies The significant accounting policies adopted in the preparation of this financial report have been included in the relevant note to which the policies relate. These policies have been consistently applied for all years presented, unless otherwise stated.
Accounting judgements and estimates The preparation of consolidated financial statements requires the use of accounting estimates. It also requires management to exercise its judgement in the process of applying WorkCover’s accounting policies. Estimates and judgements are continually evaluated and are based on historical experience and other factors, including expectations of future events that are believed to be reasonable under the circumstances. Revisions to accounting estimates are recognised in the period in which the estimate is revised and in future periods as relevant. The areas involving a higher degree of judgement or complexity, or areas where assumptions and estimates are significant to the consolidated financial statements have been disclosed as follows: • consolidation of a structured entity – note O7(a); and• outstanding claims liability and claims recoveries
receivable – note C2(d).
45 WorkCover Queensland annual report 2015–2016
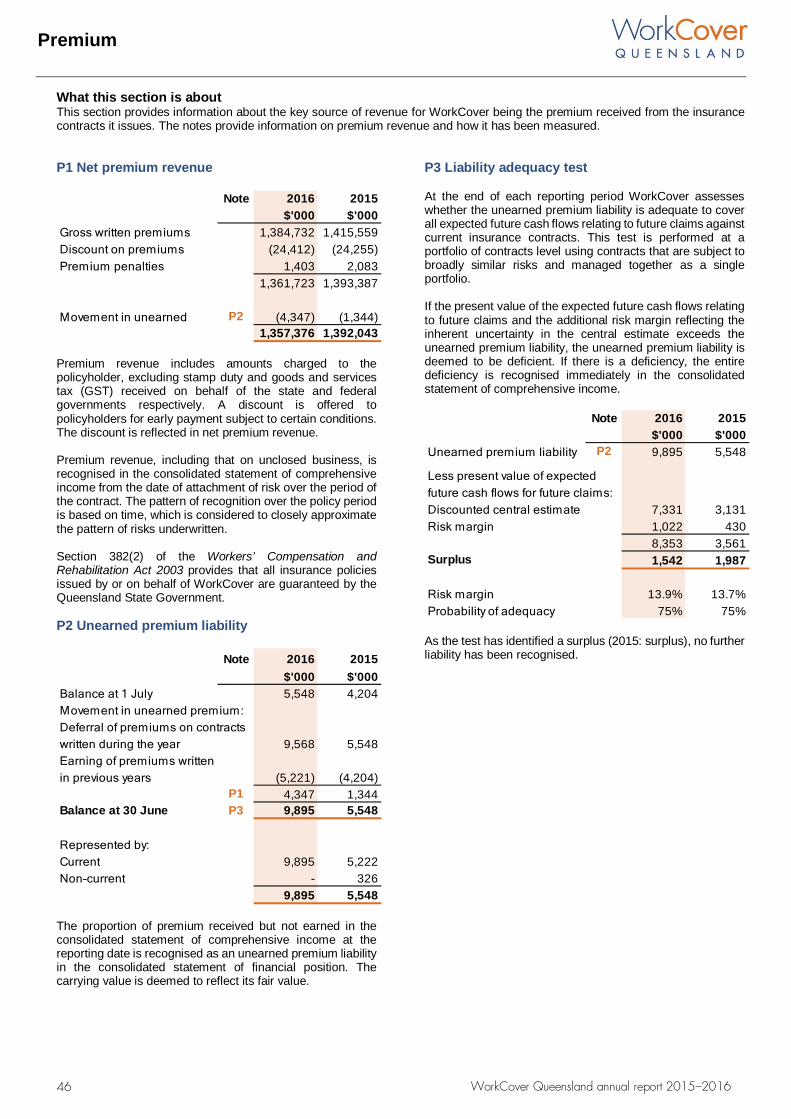
Premium
What this section is about This section provides information about the key source of revenue for WorkCover being the premium received from the insurance contracts it issues. The notes provide information on premium revenue and how it has been measured. Premium
P1 Net premium revenue
Note 2016 2015$'000 $'000
Gross written premiums 1,384,732 1,415,559Discount on premiums (24,412) (24,255)Premium penalties 1,403 2,083
1,361,723 1,393,387
Movement in unearned P2 (4,347) (1,344)1,357,376 1,392,043
Premium revenue includes amounts charged to the policyholder, excluding stamp duty and goods and services tax (GST) received on behalf of the state and federal governments respectively. A discount is offered to policyholders for early payment subject to certain conditions. The discount is reflected in net premium revenue.
Premium revenue, including that on unclosed business, is recognised in the consolidated statement of comprehensive income from the date of attachment of risk over the period of the contract. The pattern of recognition over the policy period is based on time, which is considered to closely approximate the pattern of risks underwritten.
Section 382(2) of the Workers’ Compensation and Rehabilitation Act 2003 provides that all insurance policies issued by or on behalf of WorkCover are guaranteed by the Queensland State Government.
P2 Unearned premium liability
Note 2016 2015$'000 $'000
Balance at 1 July 5,548 4,204
9,568 5,548Earning of premiums written in previous years (5,221) (4,204)
P1 4,347 1,344Balance at 30 June P3 9,895 5,548
Represented by:Current 9,895 5,222Non-current - 326
9,895 5,548
Deferral of premiums on contracts written during the year
Movement in unearned premium:
The proportion of premium received but not earned in the consolidated statement of comprehensive income at the reporting date is recognised as an unearned premium liability in the consolidated statement of financial position. The carrying value is deemed to reflect its fair value.
P3 Liability adequacy test
At the end of each reporting period WorkCover assesses whether the unearned premium liability is adequate to cover all expected future cash flows relating to future claims against current insurance contracts. This test is performed at a portfolio of contracts level using contracts that are subject to broadly similar risks and managed together as a single portfolio.
If the present value of the expected future cash flows relating to future claims and the additional risk margin reflecting the inherent uncertainty in the central estimate exceeds the unearned premium liability, the unearned premium liability is deemed to be deficient. If there is a deficiency, the entire deficiency is recognised immediately in the consolidated statement of comprehensive income.
ium liability is insufficient to co Note 2016 2015$'000 $'000
Unearned premium liability P2 9,895 5,548
7,331 3,1311,022 4308,353 3,561
Surplus 1,542 1,987
Risk margin 13.9% 13.7%Probability of adequacy 75% 75%
Discounted central estimateRisk margin
Less present value of expected future cash flows for future claims:
As the test has identified a surplus (2015: surplus), no further liability has been recognised.
46 WorkCover Queensland annual report 2015–2016
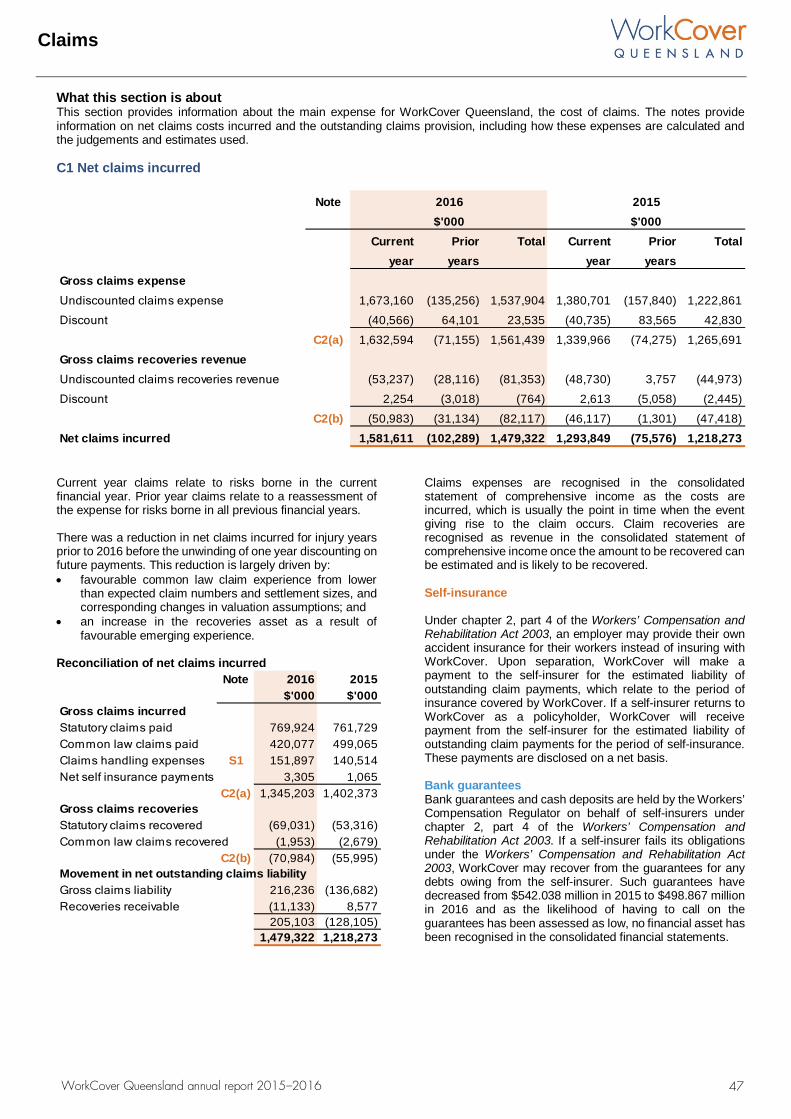
Claims
What this section is about This section provides information about the main expense for WorkCover Queensland, the cost of claims. The notes provide information on net claims costs incurred and the outstanding claims provision, including how these expenses are calculated and the judgements and estimates used. Claims C1 Net claims incurred
Note 2016 2015$'000 $'000
e in the current reporting period; and Current Prior Total Current Prior Totalsment of risks borne in all previous reporting periods. year years year yearsGross claims expenseUndiscounted claims expense 1,673,160 (135,256) 1,537,904 1,380,701 (157,840) 1,222,861
Discount (40,566) 64,101 23,535 (40,735) 83,565 42,830
C2(a) 1,632,594 (71,155) 1,561,439 1,339,966 (74,275) 1,265,691
Gross claims recoveries revenue Undiscounted claims recoveries revenue (53,237) (28,116) (81,353) (48,730) 3,757 (44,973)
Discount 2,254 (3,018) (764) 2,613 (5,058) (2,445)
C2(b) (50,983) (31,134) (82,117) (46,117) (1,301) (47,418)
Net claims incurred 1,581,611 (102,289) 1,479,322 1,293,849 (75,576) 1,218,273
Current year claims relate to risks borne in the current financial year. Prior year claims relate to a reassessment of the expense for risks borne in all previous financial years.
There was a reduction in net claims incurred for injury years prior to 2016 before the unwinding of one year discounting on future payments. This reduction is largely driven by: • favourable common law claim experience from lower
than expected claim numbers and settlement sizes, andcorresponding changes in valuation assumptions; and
• an increase in the recoveries asset as a result offavourable emerging experience.
Reconciliation of net claims incurred Note 2016 2015
$'000 $'000Gross claims incurredStatutory claims paid 769,924 761,729Common law claims paid 420,077 499,065Claims handling expenses S1 151,897 140,514Net self insurance payments 3,305 1,065
C2(a) 1,345,203 1,402,373Gross claims recoveriesStatutory claims recovered (69,031) (53,316)Common law claims recovered (1,953) (2,679)
C2(b) (70,984) (55,995)Movement in net outstanding claims liabilityGross claims liability 216,236 (136,682)Recoveries receivable (11,133) 8,577
205,103 (128,105)1,479,322 1,218,273
Claims expenses are recognised in the consolidated statement of comprehensive income as the costs are incurred, which is usually the point in time when the event giving rise to the claim occurs. Claim recoveries are recognised as revenue in the consolidated statement of comprehensive income once the amount to be recovered can be estimated and is likely to be recovered.
Self-insurance
Under chapter 2, part 4 of the Workers’ Compensation and Rehabilitation Act 2003, an employer may provide their own accident insurance for their workers instead of insuring with WorkCover. Upon separation, WorkCover will make a payment to the self-insurer for the estimated liability of outstanding claim payments, which relate to the period of insurance covered by WorkCover. If a self-insurer returns to WorkCover as a policyholder, WorkCover will receive payment from the self-insurer for the estimated liability of outstanding claim payments for the period of self-insurance. These payments are disclosed on a net basis.
Bank guarantees Bank guarantees and cash deposits are held by the Workers’ Compensation Regulator on behalf of self-insurers under chapter 2, part 4 of the Workers’ Compensation and Rehabilitation Act 2003. If a self-insurer fails its obligations under the Workers’ Compensation and Rehabilitation Act 2003, WorkCover may recover from the guarantees for any debts owing from the self-insurer. Such guarantees have decreased from $542.038 million in 2015 to $498.867 million in 2016 and as the likelihood of having to call on the guarantees has been assessed as low, no financial asset has been recognised in the consolidated financial statements.
47 WorkCover Queensland annual report 2015–2016
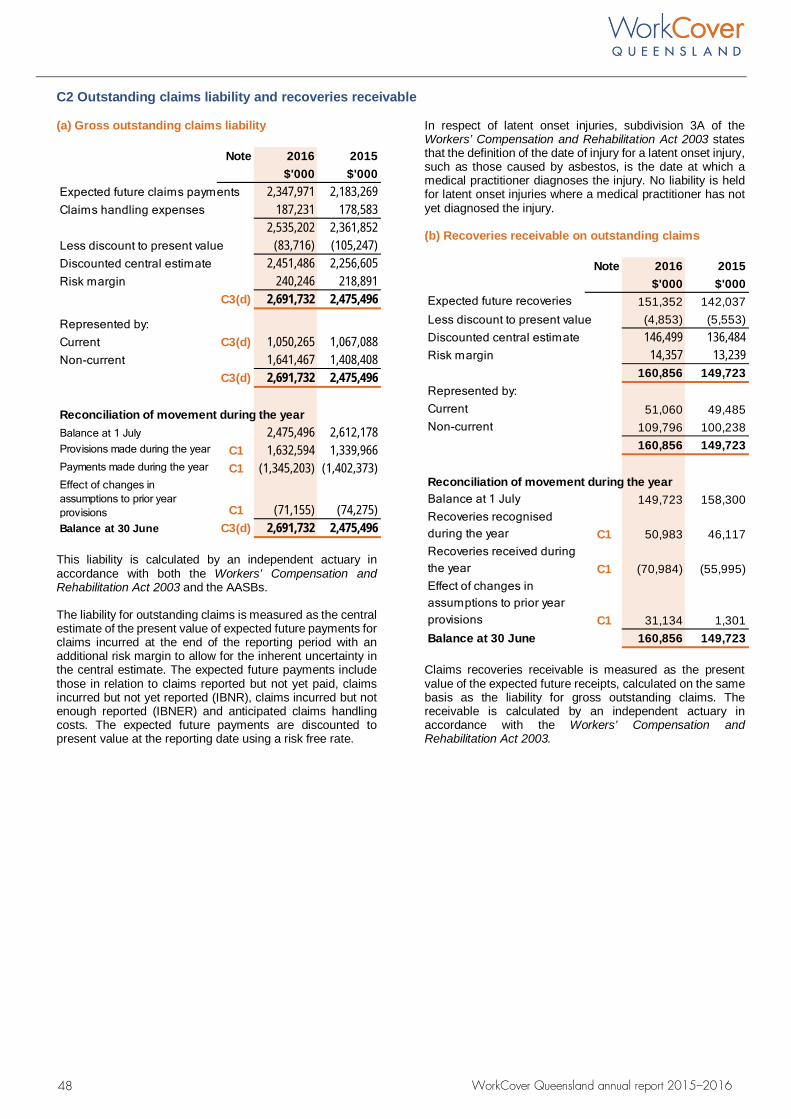
C2 Outstanding claims liability and recoveries receivable
(a) Gross outstanding claims liability
Note 2016 2015$'000 $'000
Expected future claims payments 2,347,971 2,183,269Claims handling expenses 187,231 178,583
2,535,202 2,361,852Less discount to present value (83,716) (105,247)Discounted central estimate 2,451,486 2,256,605Risk margin 240,246 218,891
C3(d) 2,691,732 2,475,496
Represented by:Current C3(d) 1,050,265 1,067,088Non-current 1,641,467 1,408,408
C3(d) 2,691,732 2,475,496
Reconciliation of movement during the yearBalance at 1 July 2,475,496 2,612,178Provisions made during the year C1 1,632,594 1,339,966Payments made during the year C1 (1,345,203) (1,402,373)Effect of changes in assumptions to prior year provisions C1 (71,155) (74,275)Balance at 30 June C3(d) 2,691,732 2,475,496
This liability is calculated by an independent actuary in accordance with both the Workers’ Compensation and Rehabilitation Act 2003 and the AASBs.
The liability for outstanding claims is measured as the central estimate of the present value of expected future payments for claims incurred at the end of the reporting period with an additional risk margin to allow for the inherent uncertainty in the central estimate. The expected future payments include those in relation to claims reported but not yet paid, claims incurred but not yet reported (IBNR), claims incurred but not enough reported (IBNER) and anticipated claims handling costs. The expected future payments are discounted to present value at the reporting date using a risk free rate.
In respect of latent onset injuries, subdivision 3A of the Workers’ Compensation and Rehabilitation Act 2003 states that the definition of the date of injury for a latent onset injury, such as those caused by asbestos, is the date at which a medical practitioner diagnoses the injury. No liability is held for latent onset injuries where a medical practitioner has not yet diagnosed the injury.
(b) Recoveries receivable on outstanding claims
Note 2016 2015$'000 $'000
Expected future recoveries 151,352 142,037Less discount to present value (4,853) (5,553)Discounted central estimate 146,499 136,484Risk margin 14,357 13,239
160,856 149,723Represented by:Current 51,060 49,485Non-current 109,796 100,238
160,856 149,723
Reconciliation of movement during the yearBalance at 1 July 149,723 158,300Recoveries recognised during the year C1 50,983 46,117Recoveries received during the year C1 (70,984) (55,995)Effect of changes in assumptions to prior year provisions C1 31,134 1,301Balance at 30 June 160,856 149,723
Claims recoveries receivable is measured as the present value of the expected future receipts, calculated on the same basis as the liability for gross outstanding claims. The receivable is calculated by an independent actuary in accordance with the Workers’ Compensation and Rehabilitation Act 2003.
48 WorkCover Queensland annual report 2015–2016
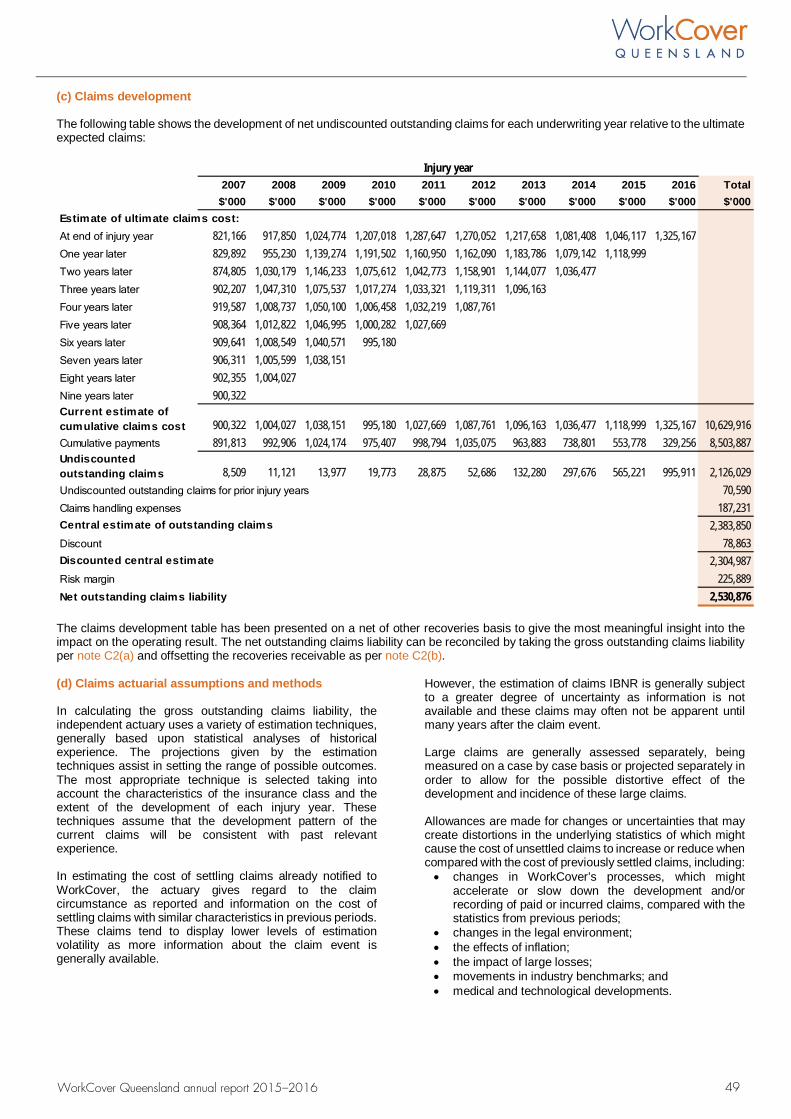
(c) Claims development
The following table shows the development of net undiscounted outstanding claims for each underwriting year relative to the ultimate expected claims:
2007 2008 2009 2010 2011 2012 2013 2014 2015 2016 Total$'000 $'000 $'000 $'000 $'000 $'000 $'000 $'000 $'000 $'000 $'000
Estimate of ultimate claims cost:At end of injury year 821,166 917,850 1,024,774 1,207,018 1,287,647 1,270,052 1,217,658 1,081,408 1,046,117 1,325,167One year later 829,892 955,230 1,139,274 1,191,502 1,160,950 1,162,090 1,183,786 1,079,142 1,118,999Two years later 874,805 1,030,179 1,146,233 1,075,612 1,042,773 1,158,901 1,144,077 1,036,477Three years later 902,207 1,047,310 1,075,537 1,017,274 1,033,321 1,119,311 1,096,163Four years later 919,587 1,008,737 1,050,100 1,006,458 1,032,219 1,087,761Five years later 908,364 1,012,822 1,046,995 1,000,282 1,027,669Six years later 909,641 1,008,549 1,040,571 995,180Seven years later 906,311 1,005,599 1,038,151Eight years later 902,355 1,004,027Nine years later 900,322Current estimate of cumulative claims cost 900,322 1,004,027 1,038,151 995,180 1,027,669 1,087,761 1,096,163 1,036,477 1,118,999 1,325,167 10,629,916Cumulative payments 891,813 992,906 1,024,174 975,407 998,794 1,035,075 963,883 738,801 553,778 329,256 8,503,887Undiscounted outstanding claims 8,509 11,121 13,977 19,773 28,875 52,686 132,280 297,676 565,221 995,911 2,126,029Undiscounted outstanding claims for prior injury years 70,590Claims handling expenses 187,231Central estimate of outstanding claims 2,383,850Discount 78,863Discounted central estimate 2,304,987Risk margin 225,889Net outstanding claims liability 2,530,876
Injury year
The claims development table has been presented on a net of other recoveries basis to give the most meaningful insight into the impact on the operating result. The net outstanding claims liability can be reconciled by taking the gross outstanding claims liability per note C2(a) and offsetting the recoveries receivable as per note C2(b).
(d) Claims actuarial assumptions and methods
In calculating the gross outstanding claims liability, the independent actuary uses a variety of estimation techniques, generally based upon statistical analyses of historical experience. The projections given by the estimation techniques assist in setting the range of possible outcomes. The most appropriate technique is selected taking into account the characteristics of the insurance class and the extent of the development of each injury year. These techniques assume that the development pattern of the current claims will be consistent with past relevant experience.
In estimating the cost of settling claims already notified to WorkCover, the actuary gives regard to the claim circumstance as reported and information on the cost of settling claims with similar characteristics in previous periods. These claims tend to display lower levels of estimation volatility as more information about the claim event is generally available.
However, the estimation of claims IBNR is generally subject to a greater degree of uncertainty as information is not available and these claims may often not be apparent until many years after the claim event.
Large claims are generally assessed separately, being measured on a case by case basis or projected separately in order to allow for the possible distortive effect of the development and incidence of these large claims.
Allowances are made for changes or uncertainties that may create distortions in the underlying statistics of which might cause the cost of unsettled claims to increase or reduce when compared with the cost of previously settled claims, including: • changes in WorkCover’s processes, which might
accelerate or slow down the development and/or recording of paid or incurred claims, compared with the statistics from previous periods;
• changes in the legal environment;• the effects of inflation;• the impact of large losses;• movements in industry benchmarks; and• medical and technological developments.
41 WorkCover Queensland annual report 2015–2016 41 WorkCover Queensland annual report 2015–2016
49 WorkCover Queensland annual report 2015–2016
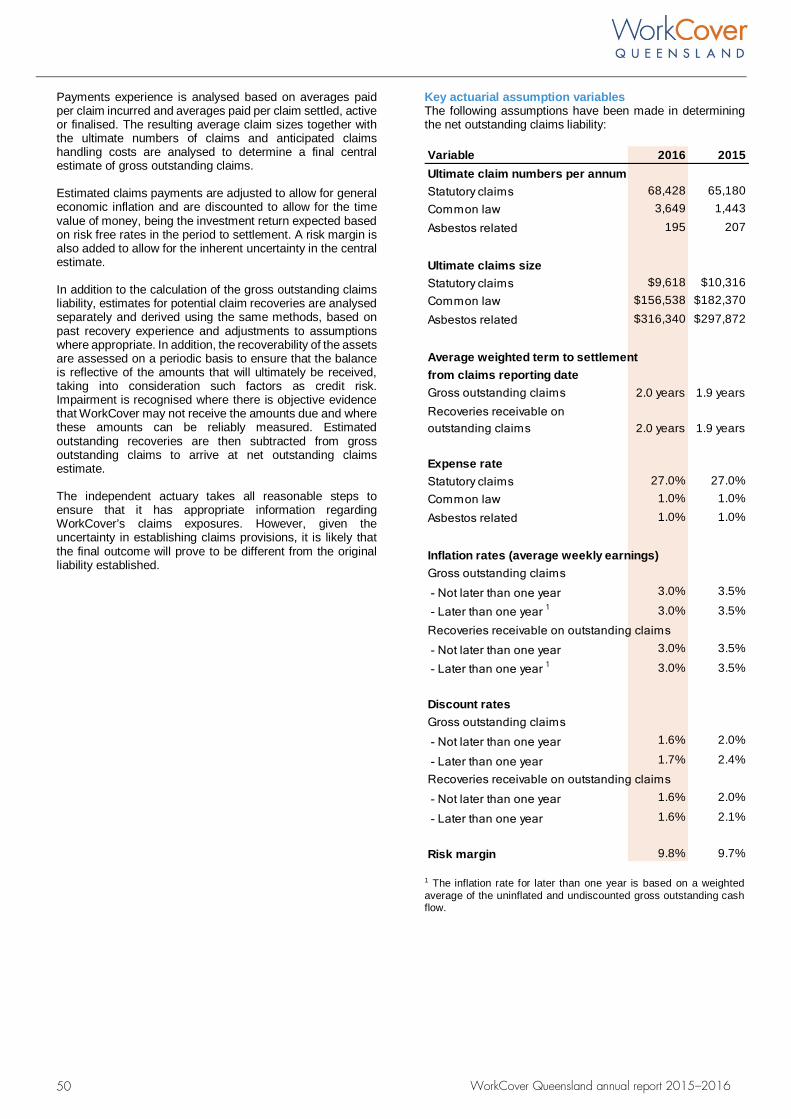
Payments experience is analysed based on averages paid per claim incurred and averages paid per claim settled, active or finalised. The resulting average claim sizes together with the ultimate numbers of claims and anticipated claims handling costs are analysed to determine a final central estimate of gross outstanding claims.
Estimated claims payments are adjusted to allow for general economic inflation and are discounted to allow for the time value of money, being the investment return expected based on risk free rates in the period to settlement. A risk margin is also added to allow for the inherent uncertainty in the central estimate.
In addition to the calculation of the gross outstanding claims liability, estimates for potential claim recoveries are analysed separately and derived using the same methods, based on past recovery experience and adjustments to assumptions where appropriate. In addition, the recoverability of the assets are assessed on a periodic basis to ensure that the balance is reflective of the amounts that will ultimately be received, taking into consideration such factors as credit risk. Impairment is recognised where there is objective evidence that WorkCover may not receive the amounts due and where these amounts can be reliably measured. Estimated outstanding recoveries are then subtracted from gross outstanding claims to arrive at net outstanding claims estimate.
The independent actuary takes all reasonable steps to ensure that it has appropriate information regarding WorkCover’s claims exposures. However, given the uncertainty in establishing claims provisions, it is likely that the final outcome will prove to be different from the original liability established.
Key actuarial assumption variables The following assumptions have been made in determining the net outstanding claims liability:
Variable 2016 2015Ultimate claim numbers per annumStatutory claims 68,428 65,180Common law 3,649 1,443
Asbestos related 195 207
Ultimate claims sizeStatutory claims $9,618 $10,316Common law $156,538 $182,370
Asbestos related $316,340 $297,872
Average weighted term to settlementfrom claims reporting dateGross outstanding claims 2.0 years 1.9 years
2.0 years 1.9 years
Expense rateStatutory claims 27.0% 27.0%Common law 1.0% 1.0%
Asbestos related 1.0% 1.0%
Inflation rates (average weekly earnings)Gross outstanding claims
- Not later than one year 3.0% 3.5%
- Later than one year 1 3.0% 3.5%
Recoveries receivable on outstanding claims
- Not later than one year 3.0% 3.5%
- Later than one year 1 3.0% 3.5%
Discount ratesGross outstanding claims
- Not later than one year 1.6% 2.0%
- Later than one year 1.7% 2.4%
Recoveries receivable on outstanding claims
- Not later than one year 1.6% 2.0%
- Later than one year 1.6% 2.1%
Risk margin 9.8% 9.7%
Recoveries receivable on outstanding claims
1 The inflation rate for later than one year is based on a weighted average of the uninflated and undiscounted gross outstanding cash flow.
50 WorkCover Queensland annual report 2015–2016
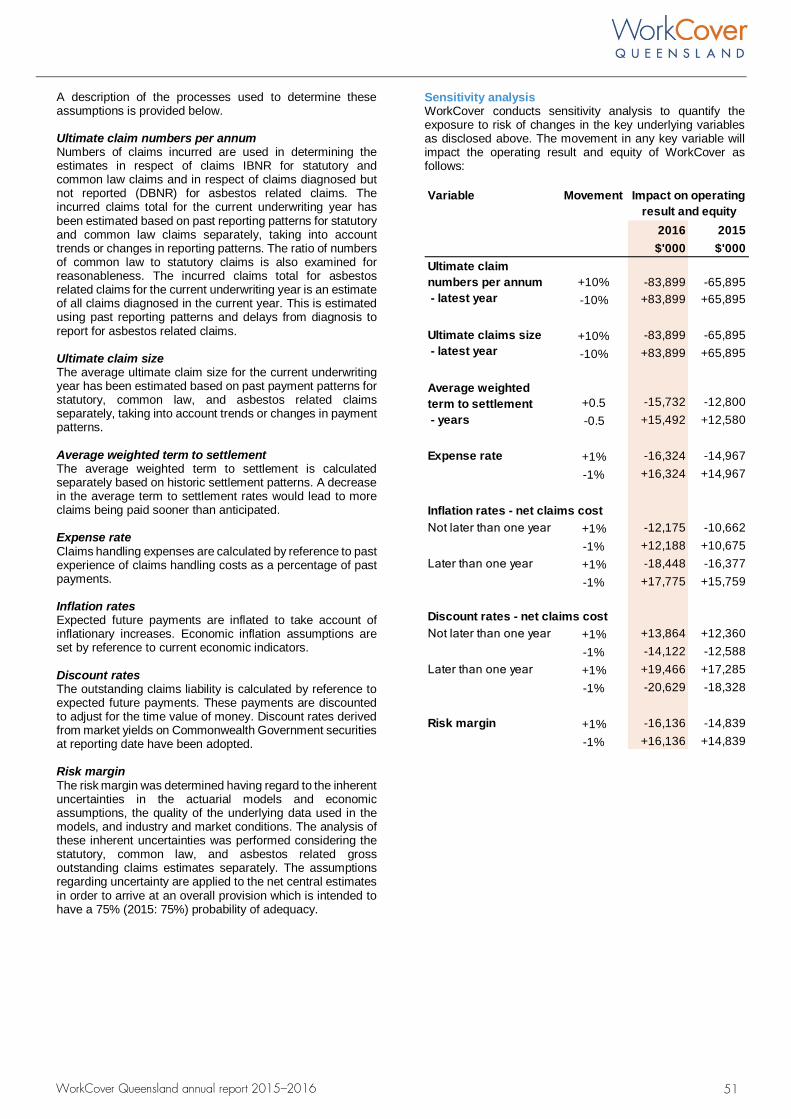
A description of the processes used to determine these assumptions is provided below.
Ultimate claim numbers per annum Numbers of claims incurred are used in determining the estimates in respect of claims IBNR for statutory and common law claims and in respect of claims diagnosed but not reported (DBNR) for asbestos related claims. The incurred claims total for the current underwriting year has been estimated based on past reporting patterns for statutory and common law claims separately, taking into account trends or changes in reporting patterns. The ratio of numbers of common law to statutory claims is also examined for reasonableness. The incurred claims total for asbestos related claims for the current underwriting year is an estimate of all claims diagnosed in the current year. This is estimated using past reporting patterns and delays from diagnosis to report for asbestos related claims.
Ultimate claim size The average ultimate claim size for the current underwriting year has been estimated based on past payment patterns for statutory, common law, and asbestos related claims separately, taking into account trends or changes in payment patterns.
Average weighted term to settlement The average weighted term to settlement is calculated separately based on historic settlement patterns. A decrease in the average term to settlement rates would lead to more claims being paid sooner than anticipated.
Expense rate Claims handling expenses are calculated by reference to past experience of claims handling costs as a percentage of past payments.
Inflation rates Expected future payments are inflated to take account of inflationary increases. Economic inflation assumptions are set by reference to current economic indicators.
Discount rates The outstanding claims liability is calculated by reference to expected future payments. These payments are discounted to adjust for the time value of money. Discount rates derived from market yields on Commonwealth Government securities at reporting date have been adopted.
Risk margin The risk margin was determined having regard to the inherent uncertainties in the actuarial models and economic assumptions, the quality of the underlying data used in the models, and industry and market conditions. The analysis of these inherent uncertainties was performed considering the statutory, common law, and asbestos related gross outstanding claims estimates separately. The assumptions regarding uncertainty are applied to the net central estimates in order to arrive at an overall provision which is intended to have a 75% (2015: 75%) probability of adequacy.
Sensitivity analysis WorkCover conducts sensitivity analysis to quantify the exposure to risk of changes in the key underlying variables as disclosed above. The movement in any key variable will impact the operating result and equity of WorkCover as follows:
Variable Movement
2016 2015$'000 $'000
+10% -83,899 -65,895-10% +83,899 +65,895
+10% -83,899 -65,895-10% +83,899 +65,895
+0.5 -15,732 -12,800-0.5 +15,492 +12,580
Expense rate +1% -16,324 -14,967-1% +16,324 +14,967
Inflation rates - net claims costNot later than one year +1% -12,175 -10,662
-1% +12,188 +10,675Later than one year +1% -18,448 -16,377
-1% +17,775 +15,759
Discount rates - net claims costNot later than one year +1% +13,864 +12,360
-1% -14,122 -12,588Later than one year +1% +19,466 +17,285
-1% -20,629 -18,328
Risk margin +1% -16,136 -14,839-1% +16,136 +14,839
Average weighted term to settlement - years
Ultimate claim numbers per annum - latest year
Ultimate claims size - latest year
Impact on operating result and equity
51 WorkCover Queensland annual report 2015–2016
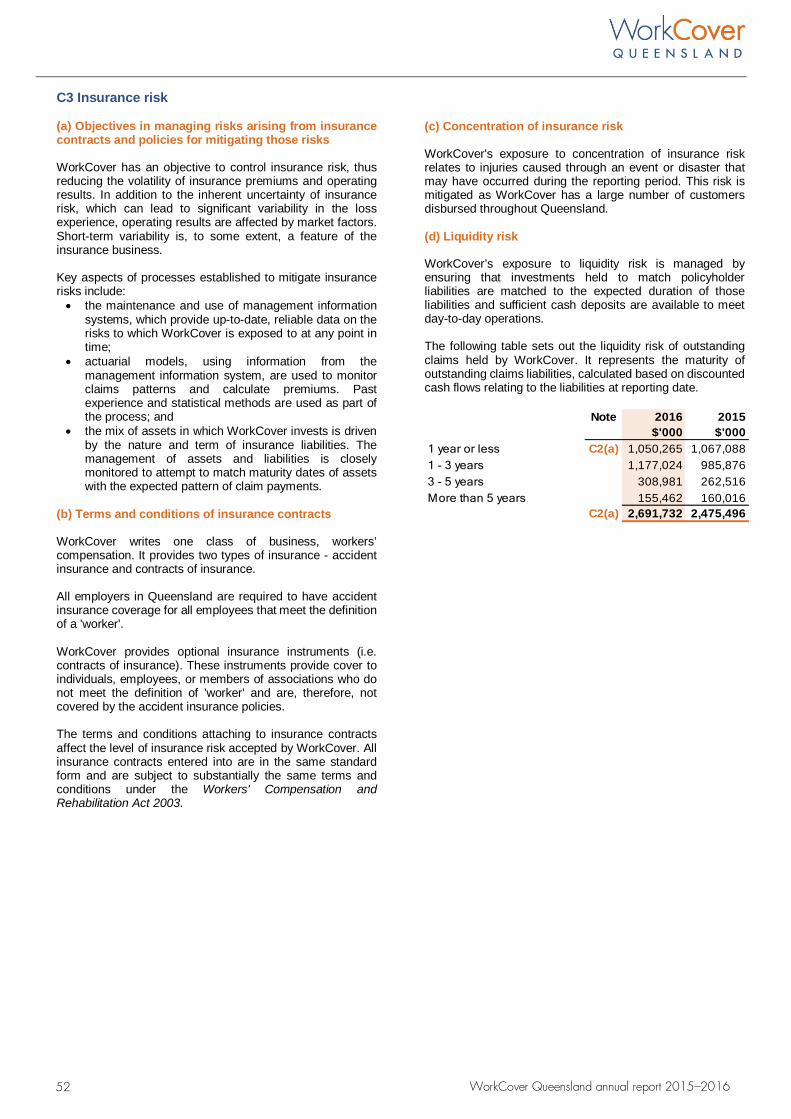
C3 Insurance risk
(a) Objectives in managing risks arising from insurance contracts and policies for mitigating those risks
WorkCover has an objective to control insurance risk, thus reducing the volatility of insurance premiums and operating results. In addition to the inherent uncertainty of insurance risk, which can lead to significant variability in the loss experience, operating results are affected by market factors. Short-term variability is, to some extent, a feature of the insurance business.
Key aspects of processes established to mitigate insurance risks include: • the maintenance and use of management information
systems, which provide up-to-date, reliable data on therisks to which WorkCover is exposed to at any point intime;
• actuarial models, using information from themanagement information system, are used to monitorclaims patterns and calculate premiums. Pastexperience and statistical methods are used as part ofthe process; and
• the mix of assets in which WorkCover invests is drivenby the nature and term of insurance liabilities. Themanagement of assets and liabilities is closelymonitored to attempt to match maturity dates of assetswith the expected pattern of claim payments.
(b) Terms and conditions of insurance contracts
WorkCover writes one class of business, workers’ compensation. It provides two types of insurance - accident insurance and contracts of insurance.
All employers in Queensland are required to have accident insurance coverage for all employees that meet the definition of a 'worker'.
WorkCover provides optional insurance instruments (i.e. contracts of insurance). These instruments provide cover to individuals, employees, or members of associations who do not meet the definition of 'worker' and are, therefore, not covered by the accident insurance policies.
The terms and conditions attaching to insurance contracts affect the level of insurance risk accepted by WorkCover. All insurance contracts entered into are in the same standard form and are subject to substantially the same terms and conditions under the Workers' Compensation and Rehabilitation Act 2003.
(c) Concentration of insurance risk
WorkCover's exposure to concentration of insurance risk relates to injuries caused through an event or disaster that may have occurred during the reporting period. This risk is mitigated as WorkCover has a large number of customers disbursed throughout Queensland.
(d) Liquidity risk
WorkCover’s exposure to liquidity risk is managed by ensuring that investments held to match policyholder liabilities are matched to the expected duration of those liabilities and sufficient cash deposits are available to meet day-to-day operations.
The following table sets out the liquidity risk of outstanding claims held by WorkCover. It represents the maturity of outstanding claims liabilities, calculated based on discounted cash flows relating to the liabilities at reporting date.
Note 2016 2015$'000 $'000
1 year or less C2(a) 1,050,265 1,067,0881 - 3 years 1,177,024 985,8763 - 5 years 308,981 262,516More than 5 years 155,462 160,016
C2(a) 2,691,732 2,475,496
52 WorkCover Queensland annual report 2015–2016
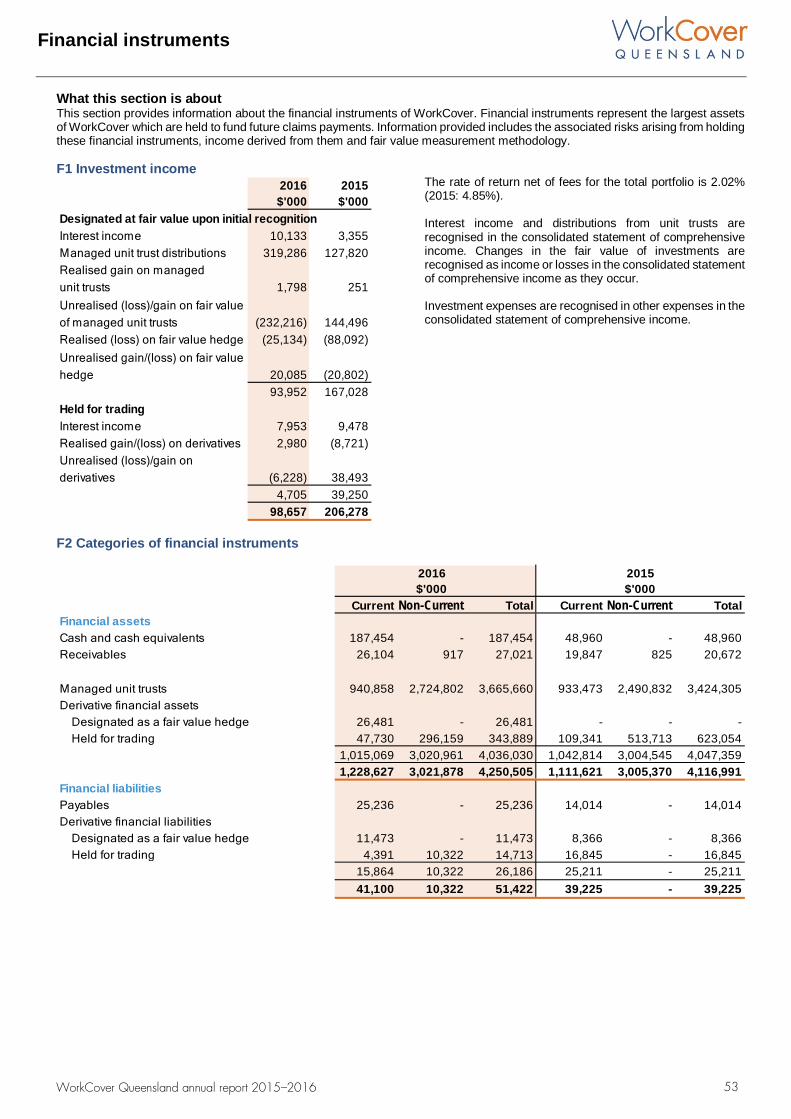
Financial instruments
What this section is about This section provides information about the financial instruments of WorkCover. Financial instruments represent the largest assets of WorkCover which are held to fund future claims payments. Information provided includes the associated risks arising from holding these financial instruments, income derived from them and fair value measurement methodology. Financial instruments
F1 Investment income 2016 2015$'000 $'000
Designated at fair value upon initial recognitionInterest income 10,133 3,355Managed unit trust distributions 319,286 127,820Realised gain on managed unit trusts 1,798 251
(232,216) 144,496(25,134) (88,092)
20,085 (20,802)93,952 167,028
Held for tradingInterest income 7,953 9,478Realised gain/(loss) on derivatives 2,980 (8,721)
(6,228) 38,4934,705 39,250
98,657 206,278
Unrealised (loss)/gain on fair value of managed unit trustsRealised (loss) on fair value hedgeUnrealised gain/(loss) on fair value hedge
Unrealised (loss)/gain on derivatives
The rate of return net of fees for the total portfolio is 2.02% (2015: 4.85%).
Interest income and distributions from unit trusts are recognised in the consolidated statement of comprehensive income. Changes in the fair value of investments are recognised as income or losses in the consolidated statement of comprehensive income as they occur.
Investment expenses are recognised in other expenses in the consolidated statement of comprehensive income.
F2 Categories of financial instruments
2016 2015$'000 $'000
Current Non-Current Total Current Non-Current TotalFinancial assetsCash and cash equivalents 187,454 - 187,454 48,960 - 48,960Receivables 26,104 917 27,021 19,847 825 20,672
940,858 2,724,802 3,665,660 933,473 2,490,832 3,424,305Derivative financial assets
26,481 - 26,481 - - -47,730 296,159 343,889 109,341 513,713 623,054
1,015,069 3,020,961 4,036,030 1,042,814 3,004,545 4,047,3591,228,627 3,021,878 4,250,505 1,111,621 3,005,370 4,116,991
Financial liabilitiesPayables 25,236 - 25,236 14,014 - 14,014Derivative financial liabilities
11,473 - 11,473 8,366 - 8,3664,391 10,322 14,713 16,845 - 16,845
15,864 10,322 26,186 25,211 - 25,21141,100 10,322 51,422 39,225 - 39,225
Managed unit trusts
Designated as a fair value hedgeHeld for trading
Designated as a fair value hedgeHeld for trading
53 WorkCover Queensland annual report 2015–2016
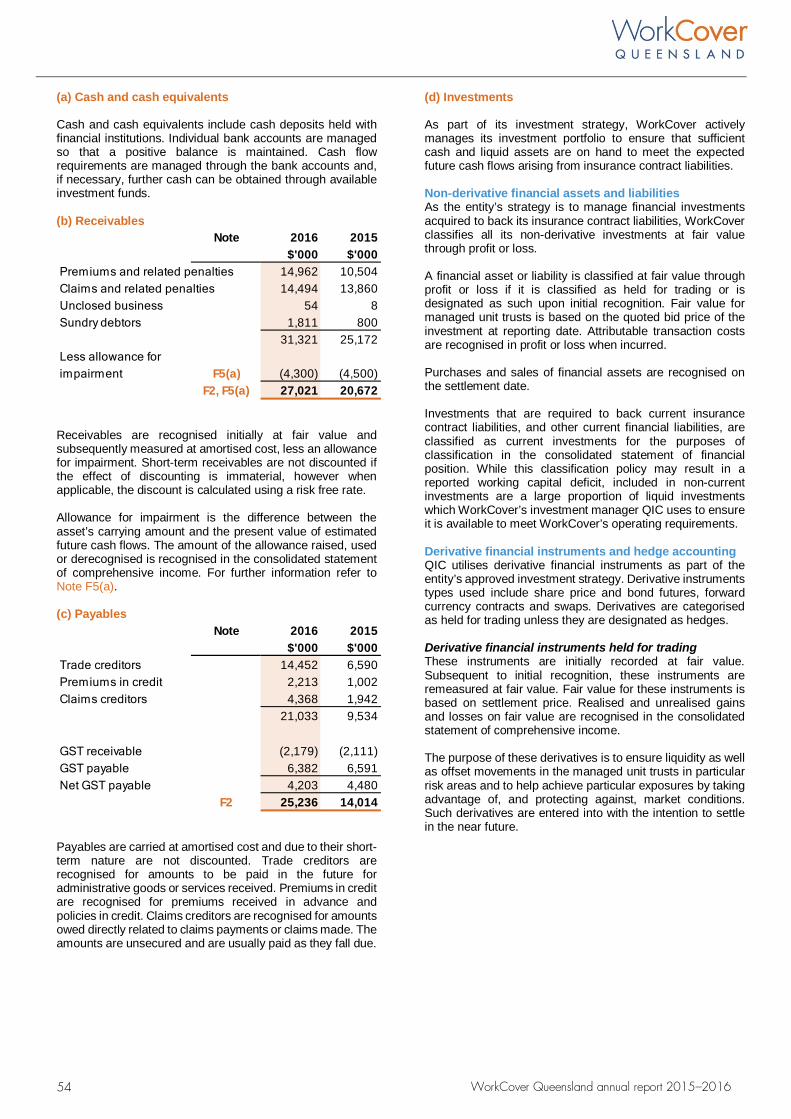
(a) Cash and cash equivalents
Cash and cash equivalents include cash deposits held with financial institutions. Individual bank accounts are managed so that a positive balance is maintained. Cash flow requirements are managed through the bank accounts and, if necessary, further cash can be obtained through available investment funds.
(b) Receivables Note 2016 2015
$'000 $'000Premiums and related penalties 14,962 10,504Claims and related penalties 14,494 13,860Unclosed business 54 8Sundry debtors 1,811 800
31,321 25,172
F5(a) (4,300) (4,500)F2, F5(a) 27,021 20,672
Less allowance for impairment
Receivables are recognised initially at fair value and subsequently measured at amortised cost, less an allowance for impairment. Short-term receivables are not discounted if the effect of discounting is immaterial, however when applicable, the discount is calculated using a risk free rate.
Allowance for impairment is the difference between the asset’s carrying amount and the present value of estimated future cash flows. The amount of the allowance raised, used or derecognised is recognised in the consolidated statement of comprehensive income. For further information refer to Note F5(a).
(c) Payables Note 2016 2015
$'000 $'000Trade creditors 14,452 6,590Premiums in credit 2,213 1,002Claims creditors 4,368 1,942
21,033 9,534
GST receivable (2,179) (2,111)GST payable 6,382 6,591Net GST payable 4,203 4,480
F2 25,236 14,014
Payables are carried at amortised cost and due to their short-term nature are not discounted. Trade creditors are recognised for amounts to be paid in the future for administrative goods or services received. Premiums in credit are recognised for premiums received in advance and policies in credit. Claims creditors are recognised for amounts owed directly related to claims payments or claims made. The amounts are unsecured and are usually paid as they fall due.
(d) Investments
As part of its investment strategy, WorkCover actively manages its investment portfolio to ensure that sufficient cash and liquid assets are on hand to meet the expected future cash flows arising from insurance contract liabilities.
Non-derivative financial assets and liabilities As the entity’s strategy is to manage financial investments acquired to back its insurance contract liabilities, WorkCover classifies all its non-derivative investments at fair value through profit or loss.
A financial asset or liability is classified at fair value through profit or loss if it is classified as held for trading or is designated as such upon initial recognition. Fair value for managed unit trusts is based on the quoted bid price of the investment at reporting date. Attributable transaction costs are recognised in profit or loss when incurred.
Purchases and sales of financial assets are recognised on the settlement date.
Investments that are required to back current insurance contract liabilities, and other current financial liabilities, are classified as current investments for the purposes of classification in the consolidated statement of financial position. While this classification policy may result in a reported working capital deficit, included in non-current investments are a large proportion of liquid investments which WorkCover’s investment manager QIC uses to ensure it is available to meet WorkCover’s operating requirements.
Derivative financial instruments and hedge accounting QIC utilises derivative financial instruments as part of the entity’s approved investment strategy. Derivative instruments types used include share price and bond futures, forward currency contracts and swaps. Derivatives are categorised as held for trading unless they are designated as hedges.
Derivative financial instruments held for trading These instruments are initially recorded at fair value. Subsequent to initial recognition, these instruments are remeasured at fair value. Fair value for these instruments is based on settlement price. Realised and unrealised gains and losses on fair value are recognised in the consolidated statement of comprehensive income.
The purpose of these derivatives is to ensure liquidity as well as offset movements in the managed unit trusts in particular risk areas and to help achieve particular exposures by taking advantage of, and protecting against, market conditions. Such derivatives are entered into with the intention to settle in the near future.
54 WorkCover Queensland annual report 2015–2016
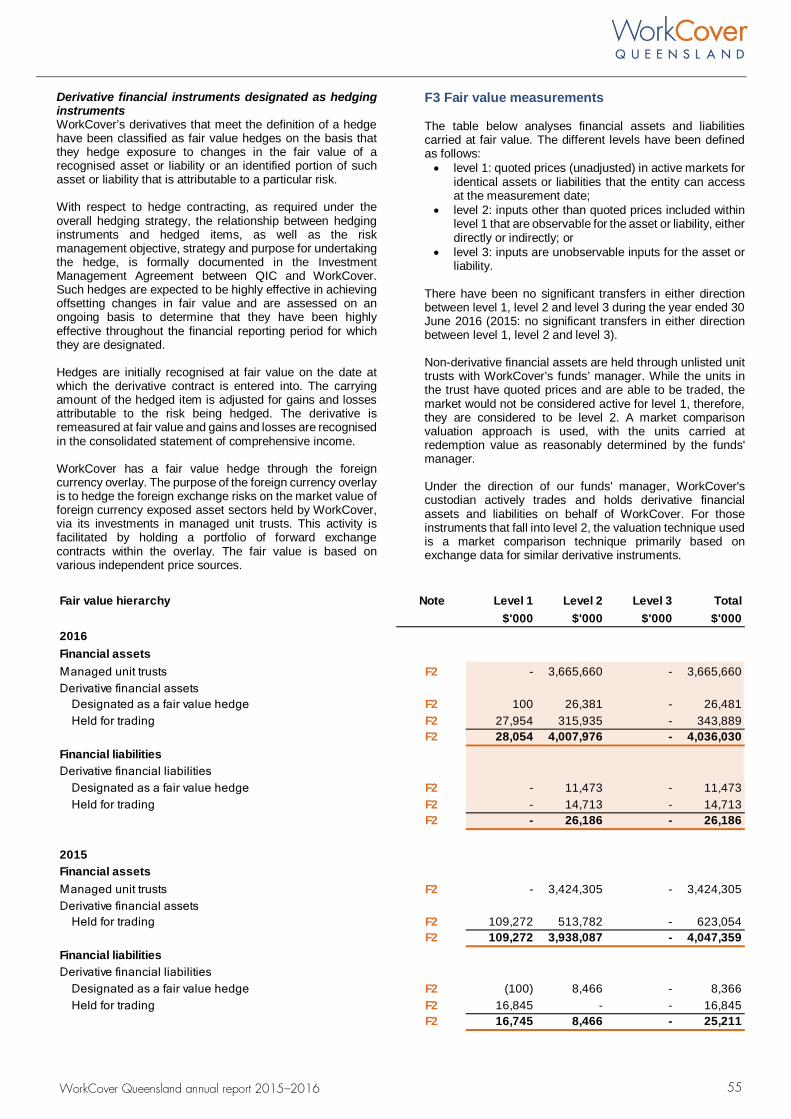
Derivative financial instruments designated as hedging instruments WorkCover’s derivatives that meet the definition of a hedge have been classified as fair value hedges on the basis that they hedge exposure to changes in the fair value of a recognised asset or liability or an identified portion of such asset or liability that is attributable to a particular risk.
With respect to hedge contracting, as required under the overall hedging strategy, the relationship between hedging instruments and hedged items, as well as the risk management objective, strategy and purpose for undertaking the hedge, is formally documented in the Investment Management Agreement between QIC and WorkCover. Such hedges are expected to be highly effective in achieving offsetting changes in fair value and are assessed on an ongoing basis to determine that they have been highly effective throughout the financial reporting period for which they are designated.
Hedges are initially recognised at fair value on the date at which the derivative contract is entered into. The carrying amount of the hedged item is adjusted for gains and losses attributable to the risk being hedged. The derivative is remeasured at fair value and gains and losses are recognised in the consolidated statement of comprehensive income.
WorkCover has a fair value hedge through the foreign currency overlay. The purpose of the foreign currency overlay is to hedge the foreign exchange risks on the market value of foreign currency exposed asset sectors held by WorkCover, via its investments in managed unit trusts. This activity is facilitated by holding a portfolio of forward exchange contracts within the overlay. The fair value is based on various independent price sources.
F3 Fair value measurements
The table below analyses financial assets and liabilities carried at fair value. The different levels have been defined as follows: • level 1: quoted prices (unadjusted) in active markets for
identical assets or liabilities that the entity can accessat the measurement date;
• level 2: inputs other than quoted prices included withinlevel 1 that are observable for the asset or liability, either directly or indirectly; or
• level 3: inputs are unobservable inputs for the asset orliability.
There have been no significant transfers in either direction between level 1, level 2 and level 3 during the year ended 30 June 2016 (2015: no significant transfers in either direction between level 1, level 2 and level 3).
Non-derivative financial assets are held through unlisted unit trusts with WorkCover’s funds’ manager. While the units in the trust have quoted prices and are able to be traded, the market would not be considered active for level 1, therefore, they are considered to be level 2. A market comparison valuation approach is used, with the units carried at redemption value as reasonably determined by the funds' manager.
Under the direction of our funds' manager, WorkCover's custodian actively trades and holds derivative financial assets and liabilities on behalf of WorkCover. For those instruments that fall into level 2, the valuation technique used is a market comparison technique primarily based on exchange data for similar derivative instruments.
Fair value hierarchy Note Level 1 Level 2 Level 3 Total$'000 $'000 $'000 $'000
2016Financial assets
F2 - 3,665,660 - 3,665,660
Designated as a fair value hedge F2 100 26,381 - 26,481Held for trading F2 27,954 315,935 - 343,889
F2 28,054 4,007,976 - 4,036,030Financial liabilitiesDerivative financial liabilities
Designated as a fair value hedge F2 - 11,473 - 11,473Held for trading F2 - 14,713 - 14,713
F2 - 26,186 - 26,186
2015Financial assets
F2 - 3,424,305 - 3,424,305
Held for trading F2 109,272 513,782 - 623,054F2 109,272 3,938,087 - 4,047,359
Financial liabilitiesDerivative financial liabilities
Designated as a fair value hedge F2 (100) 8,466 - 8,366Held for trading F2 16,845 - - 16,845
F2 16,745 8,466 - 25,211
Derivative financial assets
Managed unit trustsDerivative financial assets
Managed unit trusts
55WorkCover Queensland annual report 2015–2016
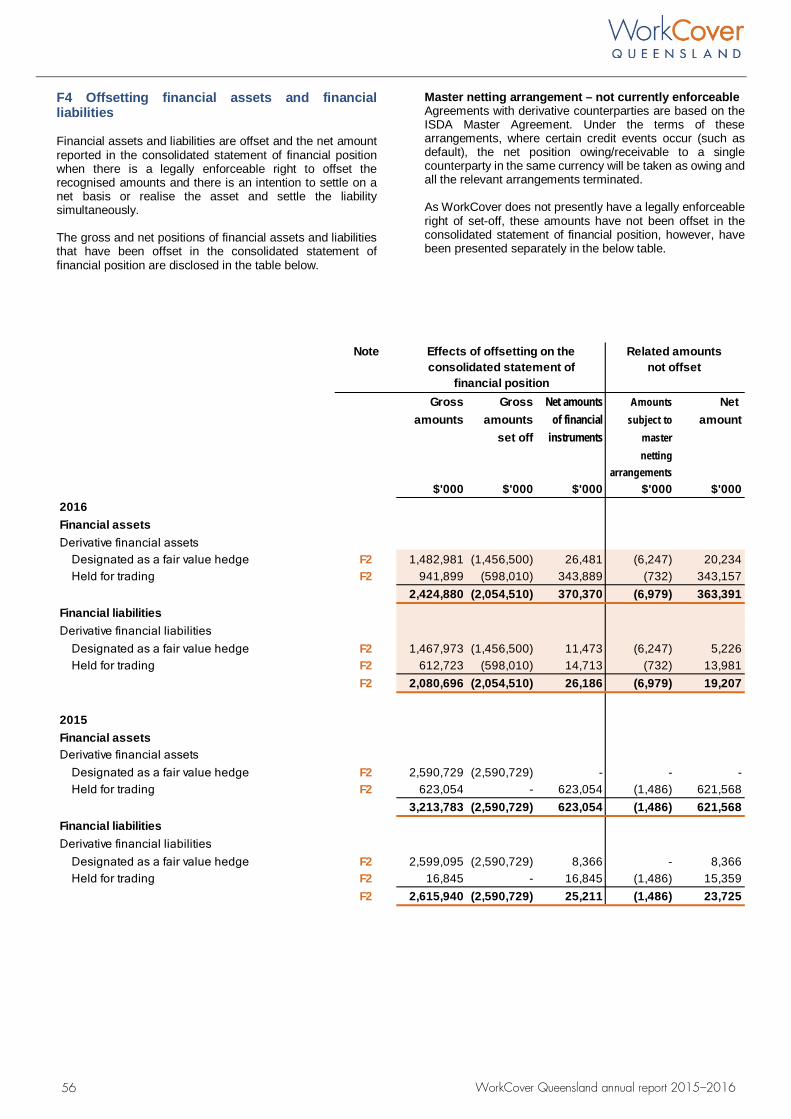
F4 Offsetting financial assets and financial liabilities
Financial assets and liabilities are offset and the net amount reported in the consolidated statement of financial position when there is a legally enforceable right to offset the recognised amounts and there is an intention to settle on a net basis or realise the asset and settle the liability simultaneously.
The gross and net positions of financial assets and liabilities that have been offset in the consolidated statement of financial position are disclosed in the table below.
Master netting arrangement – not currently enforceable Agreements with derivative counterparties are based on the ISDA Master Agreement. Under the terms of these arrangements, where certain credit events occur (such as default), the net position owing/receivable to a single counterparty in the same currency will be taken as owing and all the relevant arrangements terminated.
As WorkCover does not presently have a legally enforceable right of set-off, these amounts have not been offset in the consolidated statement of financial position, however, have been presented separately in the below table.
Note
Gross Gross Net amounts Amounts Net amounts amounts of financial subject to amount
set off instruments masternetting
arrangements$'000 $'000 $'000 $'000 $'000
2016Financial assets
F2 1,482,981 (1,456,500) 26,481 (6,247) 20,234Held for trading F2 941,899 (598,010) 343,889 (732) 343,157
2,424,880 (2,054,510) 370,370 (6,979) 363,391Financial liabilitiesDerivative financial liabilities
F2 1,467,973 (1,456,500) 11,473 (6,247) 5,226Held for trading F2 612,723 (598,010) 14,713 (732) 13,981
F2 2,080,696 (2,054,510) 26,186 (6,979) 19,207
2015Financial assetsDerivative financial assets
F2 2,590,729 (2,590,729) - - -Held for trading F2 623,054 - 623,054 (1,486) 621,568
3,213,783 (2,590,729) 623,054 (1,486) 621,568Financial liabilitiesDerivative financial liabilities
F2 2,599,095 (2,590,729) 8,366 - 8,366Held for trading F2 16,845 - 16,845 (1,486) 15,359
F2 2,615,940 (2,590,729) 25,211 (1,486) 23,725
Designated as a fair value hedge
Effects of offsetting on the consolidated statement of
financial position
Related amountsnot offset
Designated as a fair value hedge
Designated as a fair value hedge
Derivative financial assets
Designated as a fair value hedge
56 WorkCover Queensland annual report 2015–2016
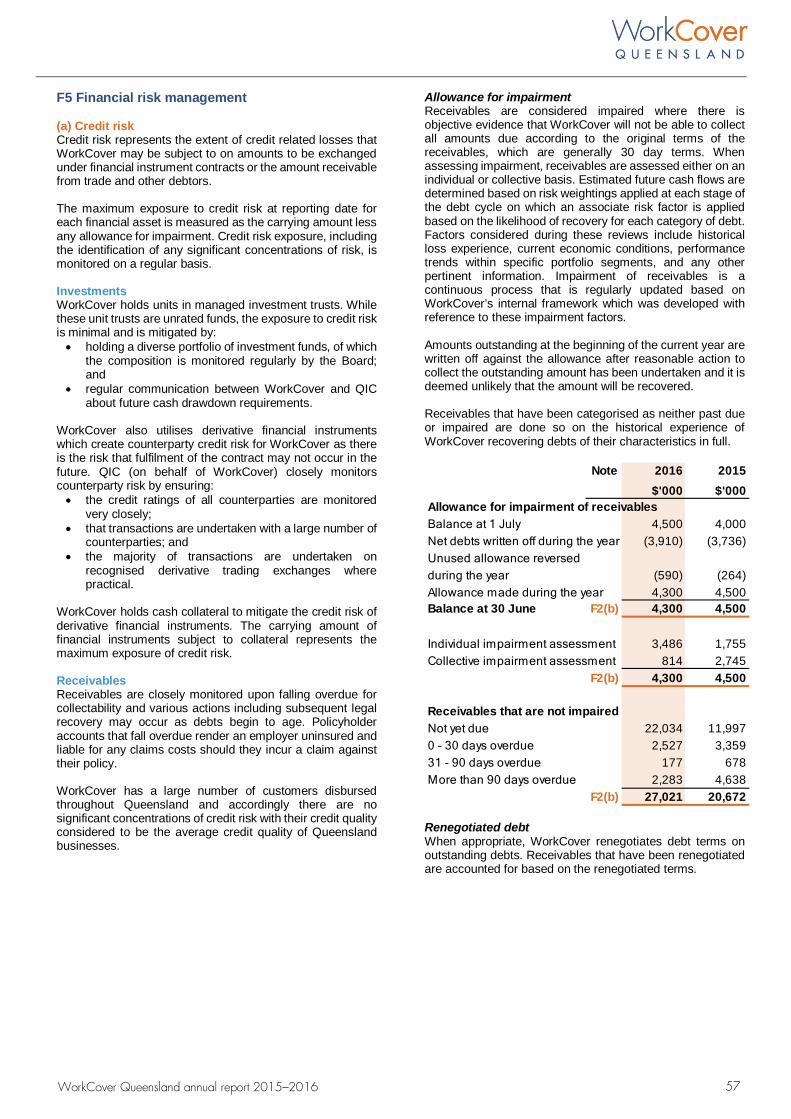
F5 Financial risk management
(a) Credit risk Credit risk represents the extent of credit related losses that WorkCover may be subject to on amounts to be exchanged under financial instrument contracts or the amount receivable from trade and other debtors.
The maximum exposure to credit risk at reporting date for each financial asset is measured as the carrying amount less any allowance for impairment. Credit risk exposure, including the identification of any significant concentrations of risk, is monitored on a regular basis.
Investments WorkCover holds units in managed investment trusts. While these unit trusts are unrated funds, the exposure to credit risk is minimal and is mitigated by: • holding a diverse portfolio of investment funds, of which
the composition is monitored regularly by the Board;and
• regular communication between WorkCover and QICabout future cash drawdown requirements.
WorkCover also utilises derivative financial instruments which create counterparty credit risk for WorkCover as there is the risk that fulfilment of the contract may not occur in the future. QIC (on behalf of WorkCover) closely monitors counterparty risk by ensuring: • the credit ratings of all counterparties are monitored
very closely;• that transactions are undertaken with a large number of
counterparties; and• the majority of transactions are undertaken on
recognised derivative trading exchanges wherepractical.
WorkCover holds cash collateral to mitigate the credit risk of derivative financial instruments. The carrying amount of financial instruments subject to collateral represents the maximum exposure of credit risk.
Receivables Receivables are closely monitored upon falling overdue for collectability and various actions including subsequent legal recovery may occur as debts begin to age. Policyholder accounts that fall overdue render an employer uninsured and liable for any claims costs should they incur a claim against their policy.
WorkCover has a large number of customers disbursed throughout Queensland and accordingly there are no significant concentrations of credit risk with their credit quality considered to be the average credit quality of Queensland businesses.
Allowance for impairment Receivables are considered impaired where there is objective evidence that WorkCover will not be able to collect all amounts due according to the original terms of the receivables, which are generally 30 day terms. When assessing impairment, receivables are assessed either on an individual or collective basis. Estimated future cash flows are determined based on risk weightings applied at each stage of the debt cycle on which an associate risk factor is applied based on the likelihood of recovery for each category of debt. Factors considered during these reviews include historical loss experience, current economic conditions, performance trends within specific portfolio segments, and any other pertinent information. Impairment of receivables is a continuous process that is regularly updated based on WorkCover’s internal framework which was developed with reference to these impairment factors.
Amounts outstanding at the beginning of the current year are written off against the allowance after reasonable action to collect the outstanding amount has been undertaken and it is deemed unlikely that the amount will be recovered.
Receivables that have been categorised as neither past due or impaired are done so on the historical experience of WorkCover recovering debts of their characteristics in full.
Note 2016 2015$'000 $'000
Allowance for impairment of receivablesBalance at 1 July 4,500 4,000
(3,910) (3,736)Unused allowance reversed during the year (590) (264)Allowance made during the year 4,300 4,500Balance at 30 June F2(b) 4,300 4,500
Individual impairment assessment 3,486 1,755Collective impairment assessment 814 2,745
F2(b) 4,300 4,500
Receivables that are not impairedNot yet due 22,034 11,9970 - 30 days overdue 2,527 3,35931 - 90 days overdue 177 678More than 90 days overdue 2,283 4,638
F2(b) 27,021 20,672
Net debts written off during the year
Renegotiated debt When appropriate, WorkCover renegotiates debt terms on outstanding debts. Receivables that have been renegotiated are accounted for based on the renegotiated terms.
57 WorkCover Queensland annual report 2015–2016
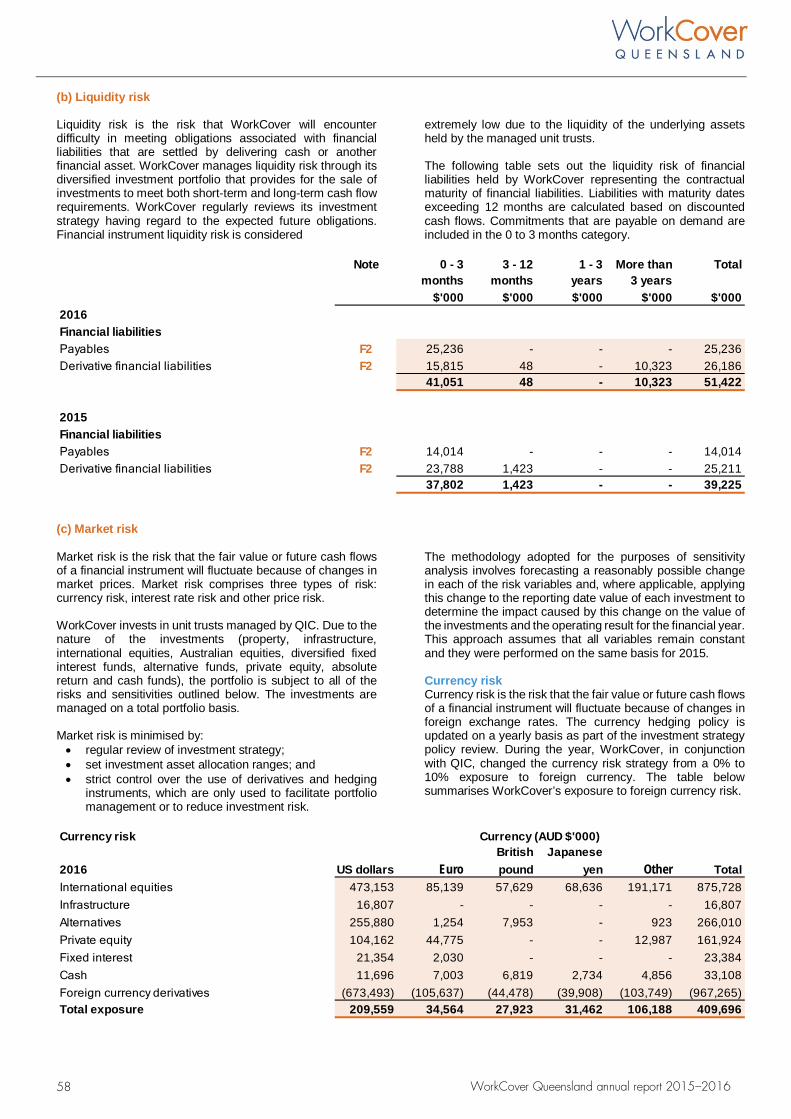
(b) Liquidity risk
Liquidity risk is the risk that WorkCover will encounter difficulty in meeting obligations associated with financial liabilities that are settled by delivering cash or another financial asset. WorkCover manages liquidity risk through its diversified investment portfolio that provides for the sale of investments to meet both short-term and long-term cash flow requirements. WorkCover regularly reviews its investment strategy having regard to the expected future obligations. Financial instrument liquidity risk is considered
extremely low due to the liquidity of the underlying assets held by the managed unit trusts.
The following table sets out the liquidity risk of financial liabilities held by WorkCover representing the contractual maturity of financial liabilities. Liabilities with maturity dates exceeding 12 months are calculated based on discounted cash flows. Commitments that are payable on demand are included in the 0 to 3 months category.
Note 0 - 3 3 - 12 1 - 3 More than Totalmonths months years 3 years
$'000 $'000 $'000 $'000 $'0002016Financial liabilitiesPayables F2 25,236 - - - 25,236Derivative financial liabilities F2 15,815 48 - 10,323 26,186
41,051 48 - 10,323 51,422
2015Financial liabilitiesPayables F2 14,014 - - - 14,014Derivative financial liabilities F2 23,788 1,423 - - 25,211
37,802 1,423 - - 39,225
(c) Market risk
Market risk is the risk that the fair value or future cash flows of a financial instrument will fluctuate because of changes in market prices. Market risk comprises three types of risk: currency risk, interest rate risk and other price risk.
WorkCover invests in unit trusts managed by QIC. Due to the nature of the investments (property, infrastructure, international equities, Australian equities, diversified fixed interest funds, alternative funds, private equity, absolute return and cash funds), the portfolio is subject to all of the risks and sensitivities outlined below. The investments are managed on a total portfolio basis.
Market risk is minimised by: • regular review of investment strategy;• set investment asset allocation ranges; and• strict control over the use of derivatives and hedging
instruments, which are only used to facilitate portfoliomanagement or to reduce investment risk.
The methodology adopted for the purposes of sensitivity analysis involves forecasting a reasonably possible change in each of the risk variables and, where applicable, applying this change to the reporting date value of each investment to determine the impact caused by this change on the value of the investments and the operating result for the financial year. This approach assumes that all variables remain constant and they were performed on the same basis for 2015.
Currency risk Currency risk is the risk that the fair value or future cash flows of a financial instrument will fluctuate because of changes in foreign exchange rates. The currency hedging policy is updated on a yearly basis as part of the investment strategy policy review. During the year, WorkCover, in conjunction with QIC, changed the currency risk strategy from a 0% to 10% exposure to foreign currency. The table below summarises WorkCover’s exposure to foreign currency risk.
Currency riskBritish Japanese
2016 US dollars Euro pound yen Other TotalInternational equities 473,153 85,139 57,629 68,636 191,171 875,728Infrastructure 16,807 - - - - 16,807Alternatives 255,880 1,254 7,953 - 923 266,010Private equity 104,162 44,775 - - 12,987 161,924Fixed interest 21,354 2,030 - - - 23,384Cash 11,696 7,003 6,819 2,734 4,856 33,108Foreign currency derivatives (673,493) (105,637) (44,478) (39,908) (103,749) (967,265)
209,559 34,564 27,923 31,462 106,188 409,696
Currency (AUD $'000)
Total exposure
58 WorkCover Queensland annual report 2015–2016
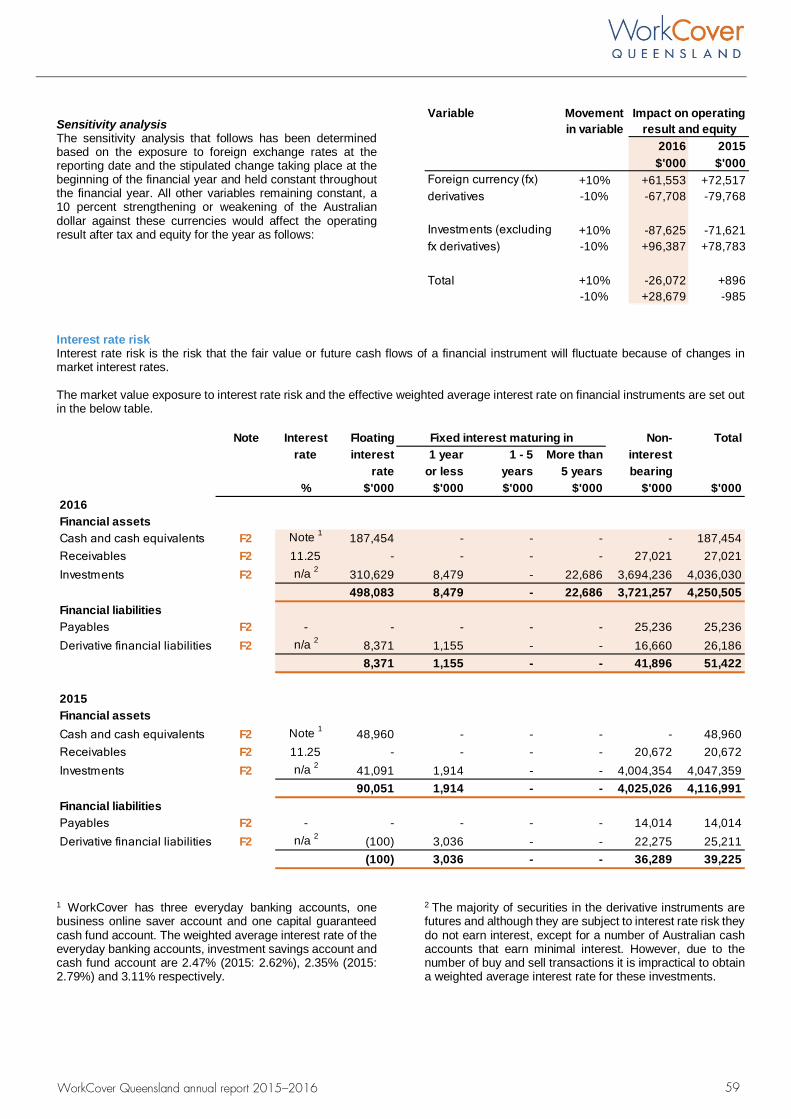
Sensitivity analysis The sensitivity analysis that follows has been determined based on the exposure to foreign exchange rates at the reporting date and the stipulated change taking place at the beginning of the financial year and held constant throughout the financial year. All other variables remaining constant, a 10 percent strengthening or weakening of the Australian dollar against these currencies would affect the operating result after tax and equity for the year as follows:
Variable Movement in variable
2016 2015$'000 $'000
+10% +61,553 +72,517-10% -67,708 -79,768
+10% -87,625 -71,621-10% +96,387 +78,783
Total +10% -26,072 +896-10% +28,679 -985
Impact on operating result and equity
Foreign currency (fx) derivatives
Investments (excluding fx derivatives)
Interest rate risk Interest rate risk is the risk that the fair value or future cash flows of a financial instrument will fluctuate because of changes in market interest rates.
The market value exposure to interest rate risk and the effective weighted average interest rate on financial instruments are set out in the below table.
Note Interest Floating Fixed interest maturing in Non- Totalrate interest 1 year 1 - 5 More than interest
rate or less years 5 years bearing% $'000 $'000 $'000 $'000 $'000 $'000
2016Financial assetsCash and cash equivalents F2 Note 1 187,454 - - - - 187,454Receivables F2 11.25 - - - - 27,021 27,021Investments F2 n/a 2 310,629 8,479 - 22,686 3,694,236 4,036,030
498,083 8,479 - 22,686 3,721,257 4,250,505Financial liabilitiesPayables F2 - - - - - 25,236 25,236Derivative financial liabilities F2 n/a 2 8,371 1,155 - - 16,660 26,186
8,371 1,155 - - 41,896 51,422
2015Financial assetsCash and cash equivalents F2 Note 1 48,960 - - - - 48,960Receivables F2 11.25 - - - - 20,672 20,672Investments F2 n/a 2 41,091 1,914 - - 4,004,354 4,047,359
90,051 1,914 - - 4,025,026 4,116,991Financial liabilitiesPayables F2 - - - - - 14,014 14,014Derivative financial liabilities F2 n/a 2 (100) 3,036 - - 22,275 25,211
(100) 3,036 - - 36,289 39,225
1 WorkCover has three everyday banking accounts, one business online saver account and one capital guaranteed cash fund account. The weighted average interest rate of the everyday banking accounts, investment savings account and cash fund account are 2.47% (2015: 2.62%), 2.35% (2015: 2.79%) and 3.11% respectively.
2 The majority of securities in the derivative instruments are futures and although they are subject to interest rate risk they do not earn interest, except for a number of Australian cash accounts that earn minimal interest. However, due to the number of buy and sell transactions it is impractical to obtain a weighted average interest rate for these investments.
59 WorkCover Queensland annual report 2015–2016
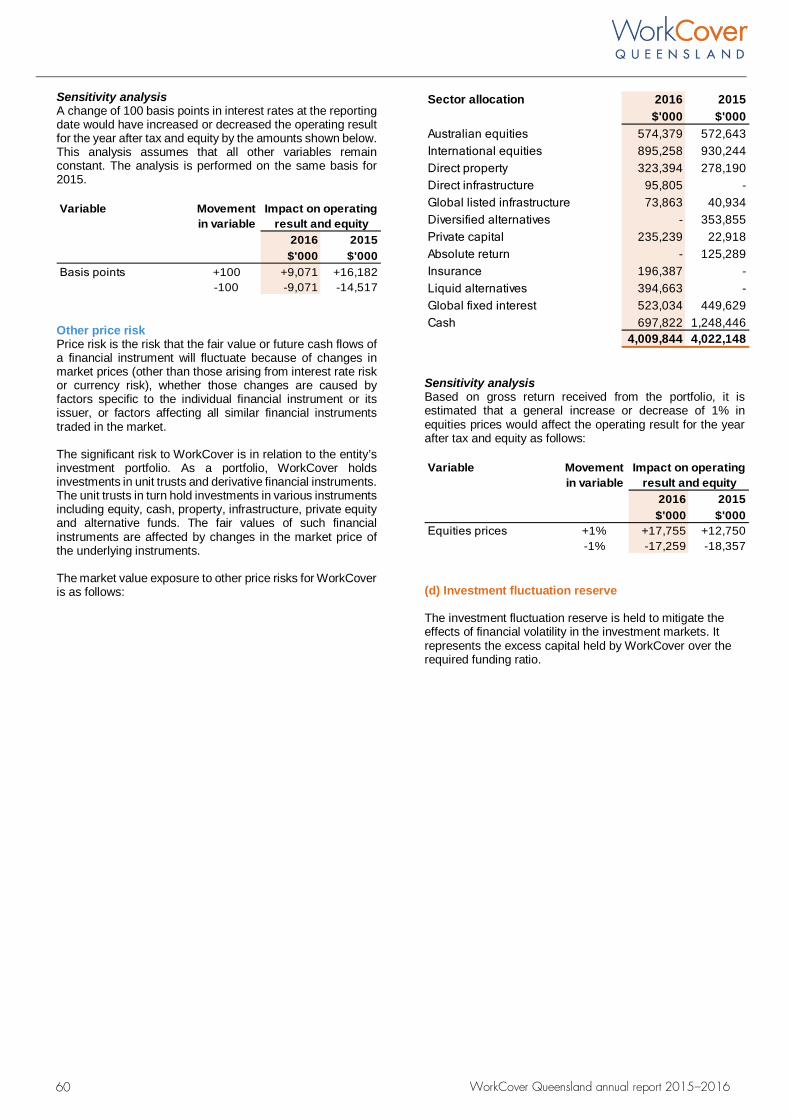
Sensitivity analysis A change of 100 basis points in interest rates at the reporting date would have increased or decreased the operating result for the year after tax and equity by the amounts shown below. This analysis assumes that all other variables remain constant. The analysis is performed on the same basis for 2015.
Variable Movement in variable
2016 2015$'000 $'000
Basis points +100 +9,071 +16,182-100 -9,071 -14,517
Impact on operating result and equity
Other price risk Price risk is the risk that the fair value or future cash flows of a financial instrument will fluctuate because of changes in market prices (other than those arising from interest rate risk or currency risk), whether those changes are caused by factors specific to the individual financial instrument or its issuer, or factors affecting all similar financial instruments traded in the market.
The significant risk to WorkCover is in relation to the entity’s investment portfolio. As a portfolio, WorkCover holds investments in unit trusts and derivative financial instruments. The unit trusts in turn hold investments in various instruments including equity, cash, property, infrastructure, private equity and alternative funds. The fair values of such financial instruments are affected by changes in the market price of the underlying instruments.
The market value exposure to other price risks for WorkCover is as follows:
Sector allocation 2016 2015$'000 $'000
Australian equities 574,379 572,643International equities 895,258 930,244Direct property 323,394 278,190Direct infrastructure 95,805 -Global listed infrastructure 73,863 40,934Diversified alternatives - 353,855Private capital 235,239 22,918Absolute return - 125,289Insurance 196,387 -Liquid alternatives 394,663 -Global fixed interest 523,034 449,629Cash 697,822 1,248,446
4,009,844 4,022,148
Sensitivity analysis Based on gross return received from the portfolio, it is estimated that a general increase or decrease of 1% in equities prices would affect the operating result for the year after tax and equity as follows:
Variable Movement in variable
2016 2015$'000 $'000
Equities prices +1% +17,755 +12,750-1% -17,259 -18,357
Impact on operating result and equity
(d) Investment fluctuation reserve
The investment fluctuation reserve is held to mitigate the effects of financial volatility in the investment markets. It represents the excess capital held by WorkCover over the required funding ratio.
60 WorkCover Queensland annual report 2015–2016
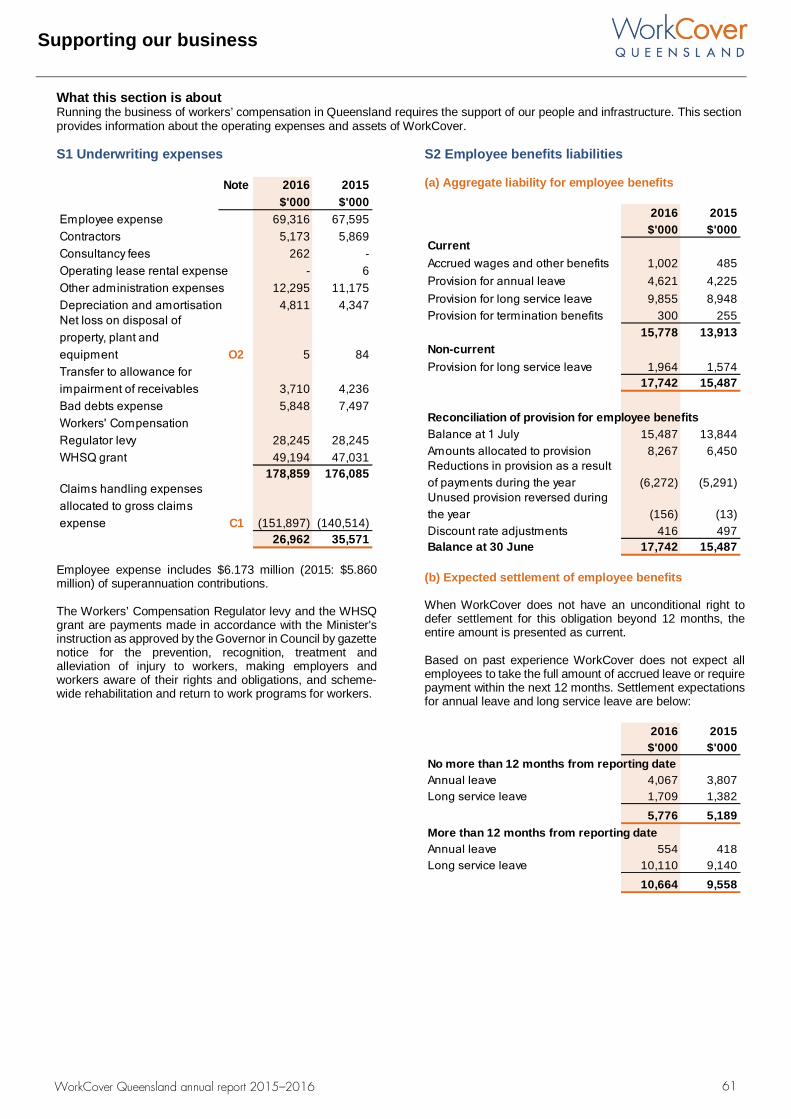
Supporting our business
What this section is about Running the business of workers’ compensation in Queensland requires the support of our people and infrastructure. This section provides information about the operating expenses and assets of WorkCover. Supporting our business S1 Underwriting expenses
Note 2016 2015$'000 $'000
Employee expense 69,316 67,595Contractors 5,173 5,869Consultancy fees 262 -Operating lease rental expense - 6Other administration expenses 12,295 11,175Depreciation and amortisation 4,811 4,347Net loss on disposal of property, plant and equipment O2 5 84Transfer to allowance for impairment of receivables 3,710 4,236Bad debts expense 5,848 7,497Workers' Compensation Regulator levy 28,245 28,245WHSQ grant 49,194 47,031
178,859 176,085
C1 (151,897) (140,514)26,962 35,571
Claims handling expenses allocated to gross claims expense
Employee expense includes $6.173 million (2015: $5.860 million) of superannuation contributions.
The Workers’ Compensation Regulator levy and the WHSQ grant are payments made in accordance with the Minister's instruction as approved by the Governor in Council by gazette notice for the prevention, recognition, treatment and alleviation of injury to workers, making employers and workers aware of their rights and obligations, and scheme-wide rehabilitation and return to work programs for workers.
S2 Employee benefits liabilities
(a) Aggregate liability for employee benefits
2016 2015$'000 $'000
CurrentAccrued wages and other benefits 1,002 485Provision for annual leave 4,621 4,225Provision for long service leave 9,855 8,948Provision for termination benefits 300 255
15,778 13,913Non-currentProvision for long service leave 1,964 1,574
17,742 15,487
Reconciliation of provision for employee benefitsBalance at 1 July 15,487 13,844
8,267 6,450
(6,272) (5,291)
(156) (13)Discount rate adjustments 416 497Balance at 30 June 17,742 15,487
Amounts allocated to provisionReductions in provision as a result of payments during the yearUnused provision reversed during the year
(b) Expected settlement of employee benefits
When WorkCover does not have an unconditional right to defer settlement for this obligation beyond 12 months, the entire amount is presented as current.
Based on past experience WorkCover does not expect all employees to take the full amount of accrued leave or require payment within the next 12 months. Settlement expectations for annual leave and long service leave are below:
2016 2015$'000 $'000
No more than 12 months from reporting dateAnnual leave 4,067 3,807Long service leave 1,709 1,382
5,776 5,189More than 12 months from reporting dateAnnual leave 554 418Long service leave 10,110 9,140
10,664 9,558
61 WorkCover Queensland annual report 2015–2016
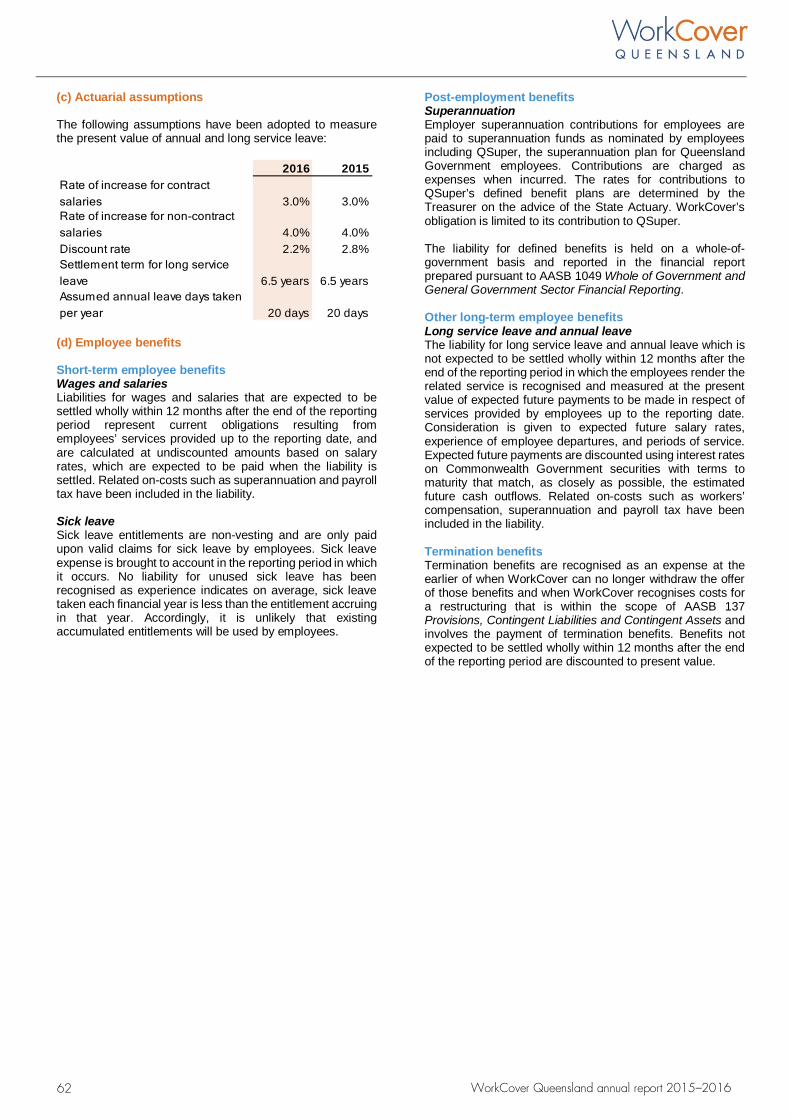
(c) Actuarial assumptions
The following assumptions have been adopted to measure the present value of annual and long service leave:
2016 2015Rate of increase for contract salaries 3.0% 3.0%
4.0% 4.0%Discount rate 2.2% 2.8%
6.5 years 6.5 years
20 days 20 days
Rate of increase for non-contract salaries
Assumed annual leave days taken per year
Settlement term for long service leave
(d) Employee benefits
Short-term employee benefits Wages and salaries Liabilities for wages and salaries that are expected to be settled wholly within 12 months after the end of the reporting period represent current obligations resulting from employees’ services provided up to the reporting date, and are calculated at undiscounted amounts based on salary rates, which are expected to be paid when the liability is settled. Related on-costs such as superannuation and payroll tax have been included in the liability.
Sick leave Sick leave entitlements are non-vesting and are only paid upon valid claims for sick leave by employees. Sick leave expense is brought to account in the reporting period in which it occurs. No liability for unused sick leave has been recognised as experience indicates on average, sick leave taken each financial year is less than the entitlement accruing in that year. Accordingly, it is unlikely that existing accumulated entitlements will be used by employees.
Post-employment benefits Superannuation Employer superannuation contributions for employees are paid to superannuation funds as nominated by employees including QSuper, the superannuation plan for Queensland Government employees. Contributions are charged as expenses when incurred. The rates for contributions to QSuper’s defined benefit plans are determined by the Treasurer on the advice of the State Actuary. WorkCover’s obligation is limited to its contribution to QSuper.
The liability for defined benefits is held on a whole-of-government basis and reported in the financial report prepared pursuant to AASB 1049 Whole of Government and General Government Sector Financial Reporting.
Other long-term employee benefits Long service leave and annual leave The liability for long service leave and annual leave which is not expected to be settled wholly within 12 months after the end of the reporting period in which the employees render the related service is recognised and measured at the present value of expected future payments to be made in respect of services provided by employees up to the reporting date. Consideration is given to expected future salary rates, experience of employee departures, and periods of service. Expected future payments are discounted using interest rates on Commonwealth Government securities with terms to maturity that match, as closely as possible, the estimated future cash outflows. Related on-costs such as workers’ compensation, superannuation and payroll tax have been included in the liability.
Termination benefits Termination benefits are recognised as an expense at the earlier of when WorkCover can no longer withdraw the offer of those benefits and when WorkCover recognises costs for a restructuring that is within the scope of AASB 137 Provisions, Contingent Liabilities and Contingent Assets and involves the payment of termination benefits. Benefits not expected to be settled wholly within 12 months after the end of the reporting period are discounted to present value.
62 WorkCover Queensland annual report 2015–2016
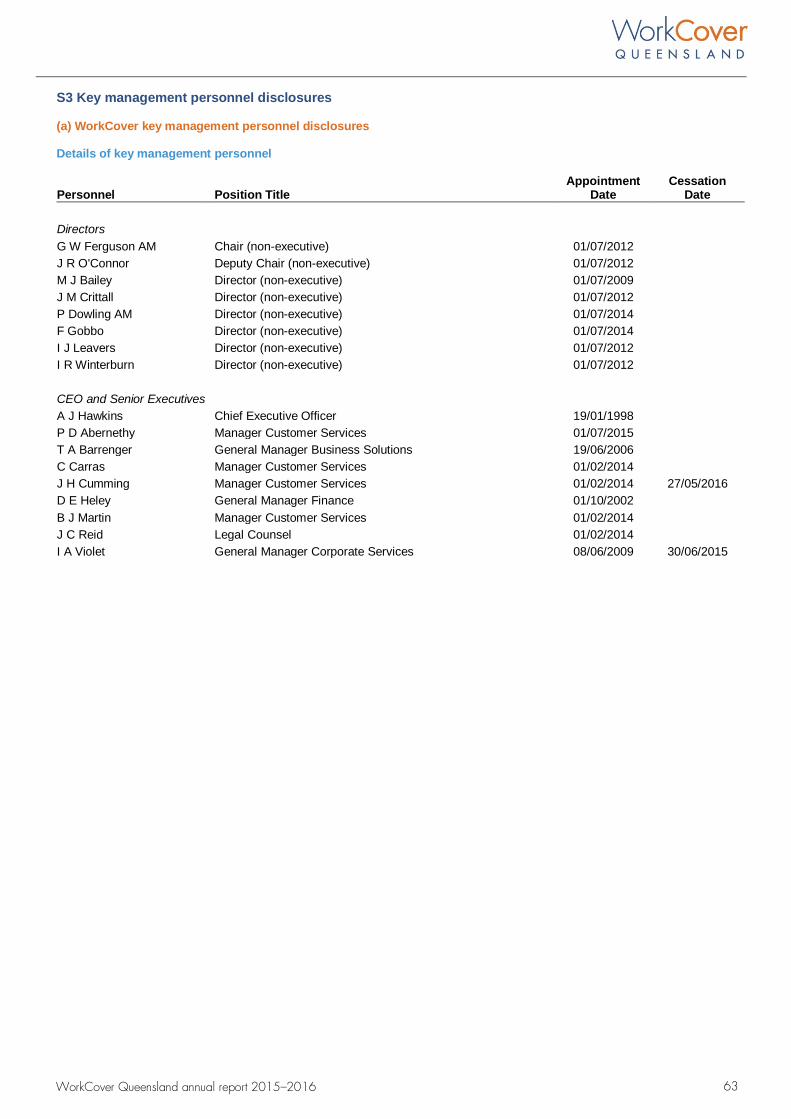
S3 Key management personnel disclosures
(a) WorkCover key management personnel disclosures
Details of key management personnel
Personnel Position Title Appointment
Date Cessation
Date
Directors G W Ferguson AM Chair (non-executive) 01/07/2012 J R O'Connor Deputy Chair (non-executive) 01/07/2012 M J Bailey Director (non-executive) 01/07/2009 J M Crittall Director (non-executive) 01/07/2012 P Dowling AM Director (non-executive) 01/07/2014 F Gobbo Director (non-executive) 01/07/2014 I J Leavers Director (non-executive) 01/07/2012 I R Winterburn Director (non-executive) 01/07/2012
CEO and Senior Executives A J Hawkins Chief Executive Officer 19/01/1998 P D Abernethy Manager Customer Services 01/07/2015 T A Barrenger General Manager Business Solutions 19/06/2006 C Carras Manager Customer Services 01/02/2014 J H Cumming Manager Customer Services 01/02/2014 27/05/2016 D E Heley General Manager Finance 01/10/2002 B J Martin Manager Customer Services 01/02/2014 J C Reid Legal Counsel 01/02/2014 I A Violet General Manager Corporate Services 08/06/2009 30/06/2015
63 WorkCover Queensland annual report 2015–2016
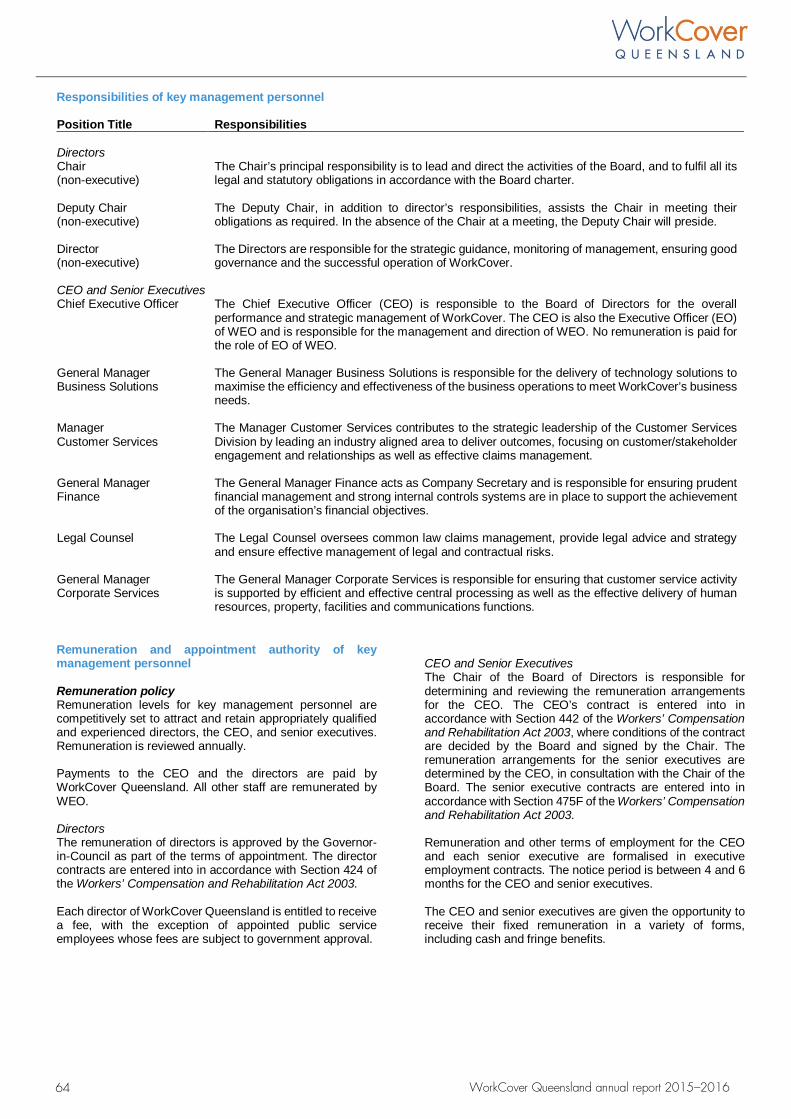
Responsibilities of key management personnel
Position Title Responsibilities
Directors Chair (non-executive)
The Chair’s principal responsibility is to lead and direct the activities of the Board, and to fulfil all its legal and statutory obligations in accordance with the Board charter.
Deputy Chair (non-executive)
The Deputy Chair, in addition to director’s responsibilities, assists the Chair in meeting their obligations as required. In the absence of the Chair at a meeting, the Deputy Chair will preside.
Director (non-executive)
The Directors are responsible for the strategic guidance, monitoring of management, ensuring good governance and the successful operation of WorkCover.
CEO and Senior Executives Chief Executive Officer The Chief Executive Officer (CEO) is responsible to the Board of Directors for the overall
performance and strategic management of WorkCover. The CEO is also the Executive Officer (EO) of WEO and is responsible for the management and direction of WEO. No remuneration is paid for the role of EO of WEO.
General Manager Business Solutions
The General Manager Business Solutions is responsible for the delivery of technology solutions to maximise the efficiency and effectiveness of the business operations to meet WorkCover’s business needs.
Manager Customer Services
The Manager Customer Services contributes to the strategic leadership of the Customer Services Division by leading an industry aligned area to deliver outcomes, focusing on customer/stakeholder engagement and relationships as well as effective claims management.
General Manager Finance
The General Manager Finance acts as Company Secretary and is responsible for ensuring prudent financial management and strong internal controls systems are in place to support the achievement of the organisation’s financial objectives.
Legal Counsel The Legal Counsel oversees common law claims management, provide legal advice and strategy and ensure effective management of legal and contractual risks.
General Manager Corporate Services
The General Manager Corporate Services is responsible for ensuring that customer service activity is supported by efficient and effective central processing as well as the effective delivery of human resources, property, facilities and communications functions.
Remuneration and appointment authority of key management personnel
Remuneration policy Remuneration levels for key management personnel are competitively set to attract and retain appropriately qualified and experienced directors, the CEO, and senior executives. Remuneration is reviewed annually.
Payments to the CEO and the directors are paid by WorkCover Queensland. All other staff are remunerated by WEO.
Directors The remuneration of directors is approved by the Governor-in-Council as part of the terms of appointment. The director contracts are entered into in accordance with Section 424 of the Workers’ Compensation and Rehabilitation Act 2003.
Each director of WorkCover Queensland is entitled to receive a fee, with the exception of appointed public service employees whose fees are subject to government approval.
CEO and Senior Executives The Chair of the Board of Directors is responsible for determining and reviewing the remuneration arrangements for the CEO. The CEO’s contract is entered into in accordance with Section 442 of the Workers’ Compensation and Rehabilitation Act 2003, where conditions of the contract are decided by the Board and signed by the Chair. The remuneration arrangements for the senior executives are determined by the CEO, in consultation with the Chair of the Board. The senior executive contracts are entered into in accordance with Section 475F of the Workers’ Compensation and Rehabilitation Act 2003.
Remuneration and other terms of employment for the CEO and each senior executive are formalised in executive employment contracts. The notice period is between 4 and 6 months for the CEO and senior executives.
The CEO and senior executives are given the opportunity to receive their fixed remuneration in a variety of forms, including cash and fringe benefits.
64 WorkCover Queensland annual report 2015–2016
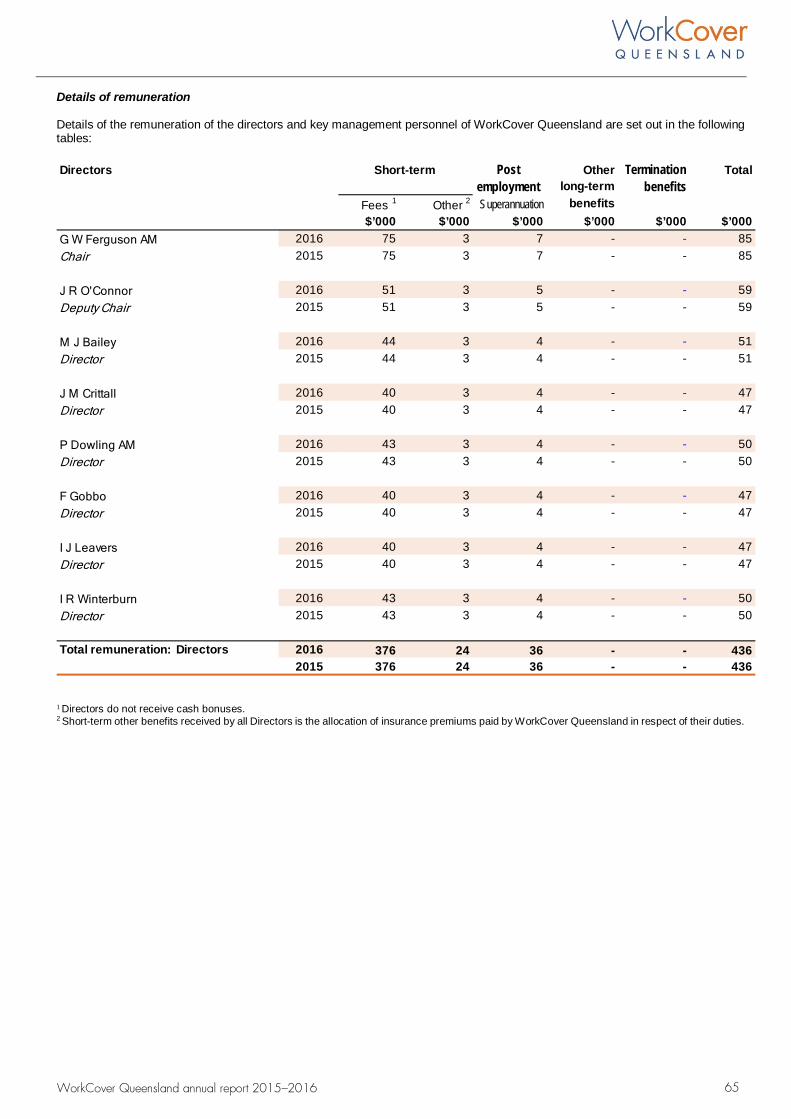
Details of remuneration
Details of the remuneration of the directors and key management personnel of WorkCover Queensland are set out in the following tables:
Directors Post Other Termination Totalemployment long-term benefits
Fees 1 Other 2 Superannuation benefits$’000 $’000 $’000 $’000 $’000 $’000
G W Ferguson AM 2016 75 3 7 - - 85Chair 2015 75 3 7 - - 85
J R O'Connor 2016 51 3 5 - - 59Deputy Chair 2015 51 3 5 - - 59
M J Bailey 2016 44 3 4 - - 51Director 2015 44 3 4 - - 51
J M Crittall 2016 40 3 4 - - 47Director 2015 40 3 4 - - 47
P Dowling AM 2016 43 3 4 - - 50Director 2015 43 3 4 - - 50
F Gobbo 2016 40 3 4 - - 47Director 2015 40 3 4 - - 47
I J Leavers 2016 40 3 4 - - 47Director 2015 40 3 4 - - 47
I R Winterburn 2016 43 3 4 - - 50Director 2015 43 3 4 - - 50
Total remuneration: Directors 2016 376 24 36 - - 4362015 376 24 36 - - 436
Short-term
1 Directors do not receive cash bonuses. 2 Short-term other benefits received by all Directors is the allocation of insurance premiums paid by WorkCover Queensland in respect of their duties.
65 WorkCover Queensland annual report 2015–2016
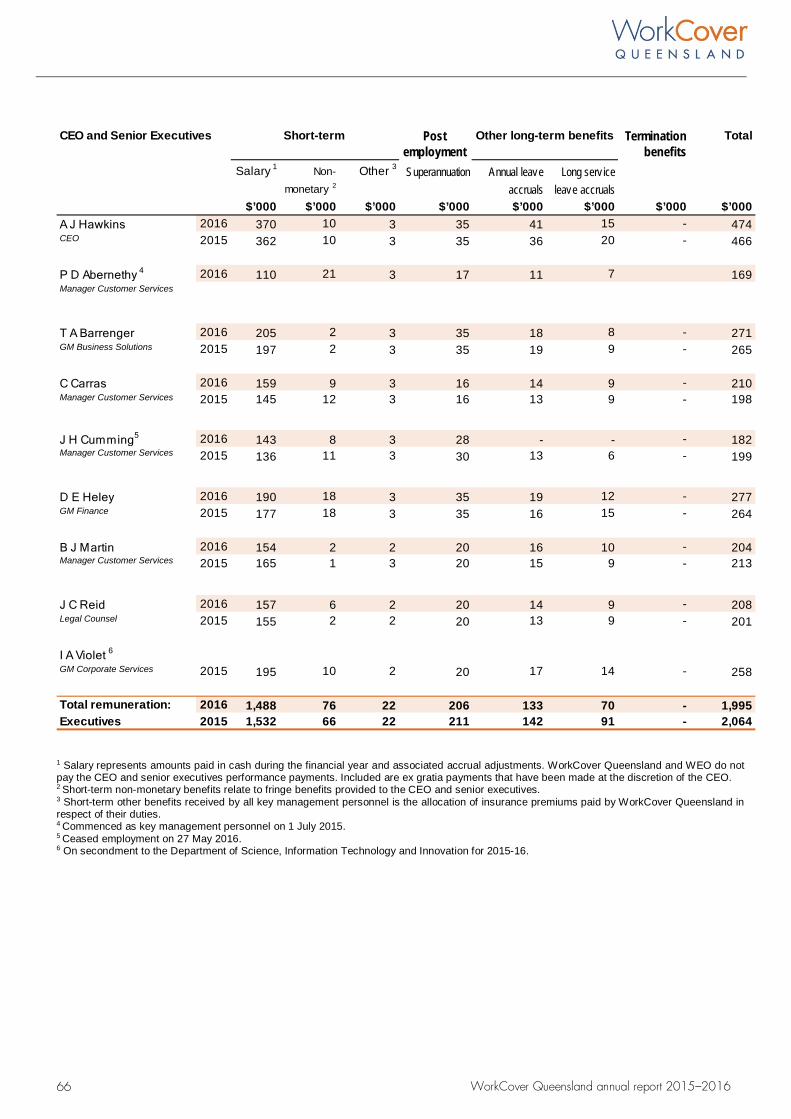
CEO and Senior Executives Post Terminationemployment benefits
Salary 1 Non- Other 3 Superannuation Annual leave Long serv icemonetary 2 accruals leave accruals
$’000 $’000 $’000 $’000 $’000 $’000 $’000 $’000A J Hawkins 2016 370 10 3 35 41 15 - 474CEO 2015 362 10 3 35 36 20 - 466
P D Abernethy 4 2016 110 21 3 17 11 7 169
T A Barrenger 2016 205 2 3 35 18 8 - 271GM Business Solutions 2015 197 2 3 35 19 9 - 265
C Carras 2016 159 9 3 16 14 9 - 2102015 145 12 3 16 13 9 - 198
J H Cumming5 2016 143 8 3 28 - - - 1822015 136 11 3 30 13 6 - 199
D E Heley 2016 190 18 3 35 19 12 - 277GM Finance 2015 177 18 3 35 16 15 - 264
B J Martin 2016 154 2 2 20 16 10 - 2042015 165 1 3 20 15 9 - 213
J C Reid 2016 157 6 2 20 14 9 - 208Legal Counsel 2015 155 2 2 20 13 9 - 201
I A Violet 6
GM Corporate Services 2015 195 10 2 20 17 14 - 258
Total remuneration: 2016 1,488 76 22 206 133 70 - 1,995Executives 2015 1,532 66 22 211 142 91 - 2,064
Manager Customer Services
Manager Customer Services
Manager Customer Services
Short-term Other long-term benefits Total
Manager Customer Services
1 Salary represents amounts paid in cash during the financial year and associated accrual adjustments. WorkCover Queensland and WEO do not pay the CEO and senior executives performance payments. Included are ex gratia payments that have been made at the discretion of the CEO. 2 Short-term non-monetary benefits relate to fringe benefits provided to the CEO and senior executives. 3 Short-term other benefits received by all key management personnel is the allocation of insurance premiums paid by WorkCover Queensland in respect of their duties. 4 Commenced as key management personnel on 1 July 2015. 5 Ceased employment on 27 May 2016. 6 On secondment to the Department of Science, Information Technology and Innovation for 2015-16.
66 WorkCover Queensland annual report 2015–2016
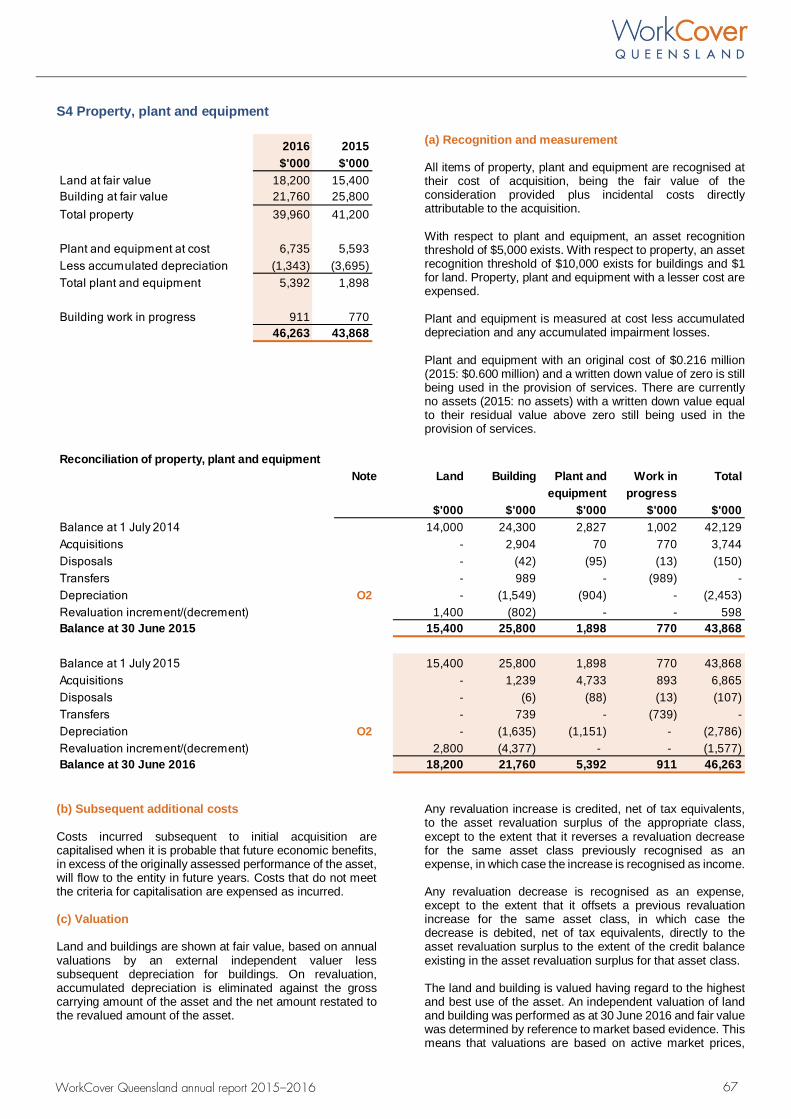
S4 Property, plant and equipment
2016 2015$'000 $'000
Land at fair value 18,200 15,400Building at fair value 21,760 25,800Total property 39,960 41,200
Plant and equipment at cost 6,735 5,593Less accumulated depreciation (1,343) (3,695)Total plant and equipment 5,392 1,898
Building work in progress 911 77046,263 43,868
(a) Recognition and measurement
All items of property, plant and equipment are recognised at their cost of acquisition, being the fair value of the consideration provided plus incidental costs directly attributable to the acquisition.
With respect to plant and equipment, an asset recognition threshold of $5,000 exists. With respect to property, an asset recognition threshold of $10,000 exists for buildings and $1 for land. Property, plant and equipment with a lesser cost are expensed.
Plant and equipment is measured at cost less accumulated depreciation and any accumulated impairment losses.
Plant and equipment with an original cost of $0.216 million (2015: $0.600 million) and a written down value of zero is still being used in the provision of services. There are currently no assets (2015: no assets) with a written down value equal to their residual value above zero still being used in the provision of services.
Reconciliation of property, plant and equipmentNote Land Building Plant and Work in Total
equipment progress$'000 $'000 $'000 $'000 $'000
Balance at 1 July 2014 14,000 24,300 2,827 1,002 42,129Acquisitions - 2,904 70 770 3,744Disposals - (42) (95) (13) (150)Transfers - 989 - (989) -Depreciation O2 - (1,549) (904) - (2,453)Revaluation increment/(decrement) 1,400 (802) - - 598Balance at 30 June 2015 15,400 25,800 1,898 770 43,868
Balance at 1 July 2015 15,400 25,800 1,898 770 43,868Acquisitions - 1,239 4,733 893 6,865Disposals - (6) (88) (13) (107)Transfers - 739 - (739) -Depreciation O2 - (1,635) (1,151) - (2,786)Revaluation increment/(decrement) 2,800 (4,377) - - (1,577)Balance at 30 June 2016 18,200 21,760 5,392 911 46,263
(b) Subsequent additional costs
Costs incurred subsequent to initial acquisition are capitalised when it is probable that future economic benefits, in excess of the originally assessed performance of the asset, will flow to the entity in future years. Costs that do not meet the criteria for capitalisation are expensed as incurred.
(c) Valuation
Land and buildings are shown at fair value, based on annual valuations by an external independent valuer less subsequent depreciation for buildings. On revaluation, accumulated depreciation is eliminated against the gross carrying amount of the asset and the net amount restated to the revalued amount of the asset.
Any revaluation increase is credited, net of tax equivalents, to the asset revaluation surplus of the appropriate class, except to the extent that it reverses a revaluation decrease for the same asset class previously recognised as an expense, in which case the increase is recognised as income.
Any revaluation decrease is recognised as an expense, except to the extent that it offsets a previous revaluation increase for the same asset class, in which case the decrease is debited, net of tax equivalents, directly to the asset revaluation surplus to the extent of the credit balance existing in the asset revaluation surplus for that asset class.
The land and building is valued having regard to the highest and best use of the asset. An independent valuation of land and building was performed as at 30 June 2016 and fair value was determined by reference to market based evidence. This means that valuations are based on active market prices,
67 WorkCover Queensland annual report 2015–2016
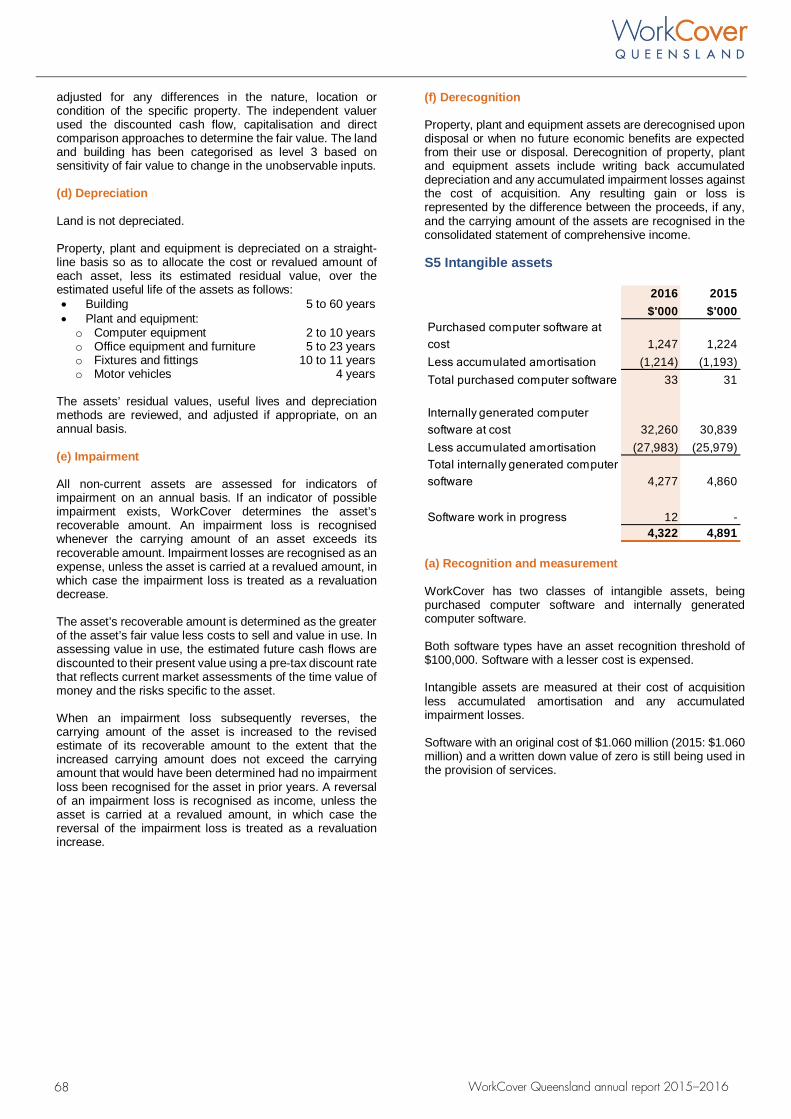
adjusted for any differences in the nature, location or condition of the specific property. The independent valuer used the discounted cash flow, capitalisation and direct comparison approaches to determine the fair value. The land and building has been categorised as level 3 based on sensitivity of fair value to change in the unobservable inputs.
(d) Depreciation
Land is not depreciated.
Property, plant and equipment is depreciated on a straight-line basis so as to allocate the cost or revalued amount of each asset, less its estimated residual value, over the estimated useful life of the assets as follows: • Building 5 to 60 years • Plant and equipment:o Computer equipment 2 to 10 years o Office equipment and furniture 5 to 23 years o Fixtures and fittings 10 to 11 years o Motor vehicles 4 years
The assets’ residual values, useful lives and depreciation methods are reviewed, and adjusted if appropriate, on an annual basis.
(e) Impairment
All non-current assets are assessed for indicators of impairment on an annual basis. If an indicator of possible impairment exists, WorkCover determines the asset’s recoverable amount. An impairment loss is recognised whenever the carrying amount of an asset exceeds its recoverable amount. Impairment losses are recognised as an expense, unless the asset is carried at a revalued amount, in which case the impairment loss is treated as a revaluation decrease.
The asset’s recoverable amount is determined as the greater of the asset’s fair value less costs to sell and value in use. In assessing value in use, the estimated future cash flows are discounted to their present value using a pre-tax discount rate that reflects current market assessments of the time value of money and the risks specific to the asset.
When an impairment loss subsequently reverses, the carrying amount of the asset is increased to the revised estimate of its recoverable amount to the extent that the increased carrying amount does not exceed the carrying amount that would have been determined had no impairment loss been recognised for the asset in prior years. A reversal of an impairment loss is recognised as income, unless the asset is carried at a revalued amount, in which case the reversal of the impairment loss is treated as a revaluation increase.
(f) Derecognition
Property, plant and equipment assets are derecognised upon disposal or when no future economic benefits are expected from their use or disposal. Derecognition of property, plant and equipment assets include writing back accumulated depreciation and any accumulated impairment losses against the cost of acquisition. Any resulting gain or loss is represented by the difference between the proceeds, if any, and the carrying amount of the assets are recognised in the consolidated statement of comprehensive income.
S5 Intangible assets
2016 2015$'000 $'000
1,247 1,224Less accumulated amortisation (1,214) (1,193)Total purchased computer software 33 31
32,260 30,839Less accumulated amortisation (27,983) (25,979)
4,277 4,860
Software work in progress 12 -4,322 4,891
Purchased computer software at cost
Internally generated computer software at cost
Total internally generated computer software
(a) Recognition and measurement
WorkCover has two classes of intangible assets, being purchased computer software and internally generated computer software.
Both software types have an asset recognition threshold of $100,000. Software with a lesser cost is expensed.
Intangible assets are measured at their cost of acquisition less accumulated amortisation and any accumulated impairment losses.
Software with an original cost of $1.060 million (2015: $1.060 million) and a written down value of zero is still being used in the provision of services.
68 WorkCover Queensland annual report 2015–2016
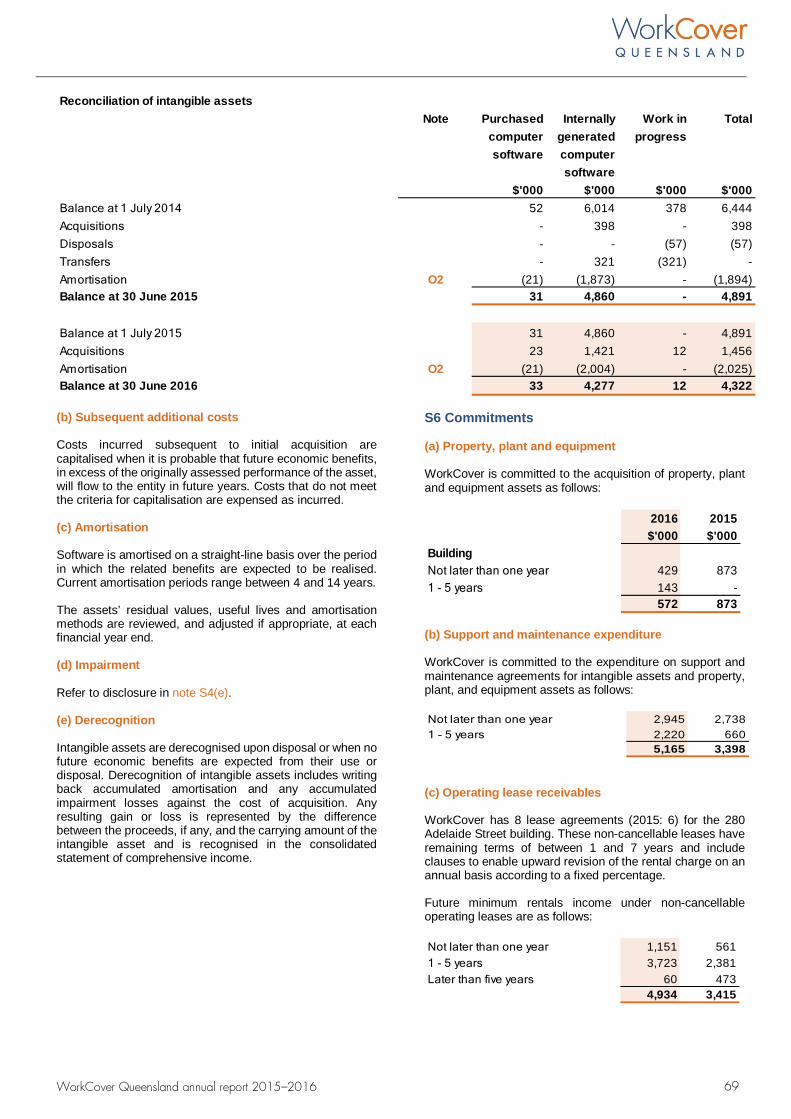
Reconciliation of intangible assetsNote Purchased Internally Work in Total
computer generated progresssoftware computer
software$'000 $'000 $'000 $'000
Balance at 1 July 2014 52 6,014 378 6,444Acquisitions - 398 - 398Disposals - - (57) (57)Transfers - 321 (321) -Amortisation O2 (21) (1,873) - (1,894)Balance at 30 June 2015 31 4,860 - 4,891
Balance at 1 July 2015 31 4,860 - 4,891Acquisitions 23 1,421 12 1,456Amortisation O2 (21) (2,004) - (2,025)Balance at 30 June 2016 33 4,277 12 4,322
(b) Subsequent additional costs
Costs incurred subsequent to initial acquisition are capitalised when it is probable that future economic benefits, in excess of the originally assessed performance of the asset, will flow to the entity in future years. Costs that do not meet the criteria for capitalisation are expensed as incurred.
(c) Amortisation
Software is amortised on a straight-line basis over the period in which the related benefits are expected to be realised. Current amortisation periods range between 4 and 14 years.
The assets’ residual values, useful lives and amortisation methods are reviewed, and adjusted if appropriate, at each financial year end.
(d) Impairment
Refer to disclosure in note S4(e).
(e) Derecognition
Intangible assets are derecognised upon disposal or when no future economic benefits are expected from their use or disposal. Derecognition of intangible assets includes writing back accumulated amortisation and any accumulated impairment losses against the cost of acquisition. Any resulting gain or loss is represented by the difference between the proceeds, if any, and the carrying amount of the intangible asset and is recognised in the consolidated statement of comprehensive income.
S6 Commitments
(a) Property, plant and equipment
WorkCover is committed to the acquisition of property, plant and equipment assets as follows:
2016 2015$'000 $'000
BuildingNot later than one year 429 873
143 -572 873
1 - 5 years
(b) Support and maintenance expenditure
WorkCover is committed to the expenditure on support and maintenance agreements for intangible assets and property, plant, and equipment assets as follows:
Not later than one year 2,945 2,7382,220 6605,165 3,398
1 - 5 years
(c) Operating lease receivables
WorkCover has 8 lease agreements (2015: 6) for the 280 Adelaide Street building. These non-cancellable leases have remaining terms of between 1 and 7 years and include clauses to enable upward revision of the rental charge on an annual basis according to a fixed percentage.
Future minimum rentals income under non-cancellable operating leases are as follows:
Not later than one year 1,151 5611 - 5 years 3,723 2,381Later than five years 60 473
4,934 3,415
69 WorkCover Queensland annual report 2015–2016
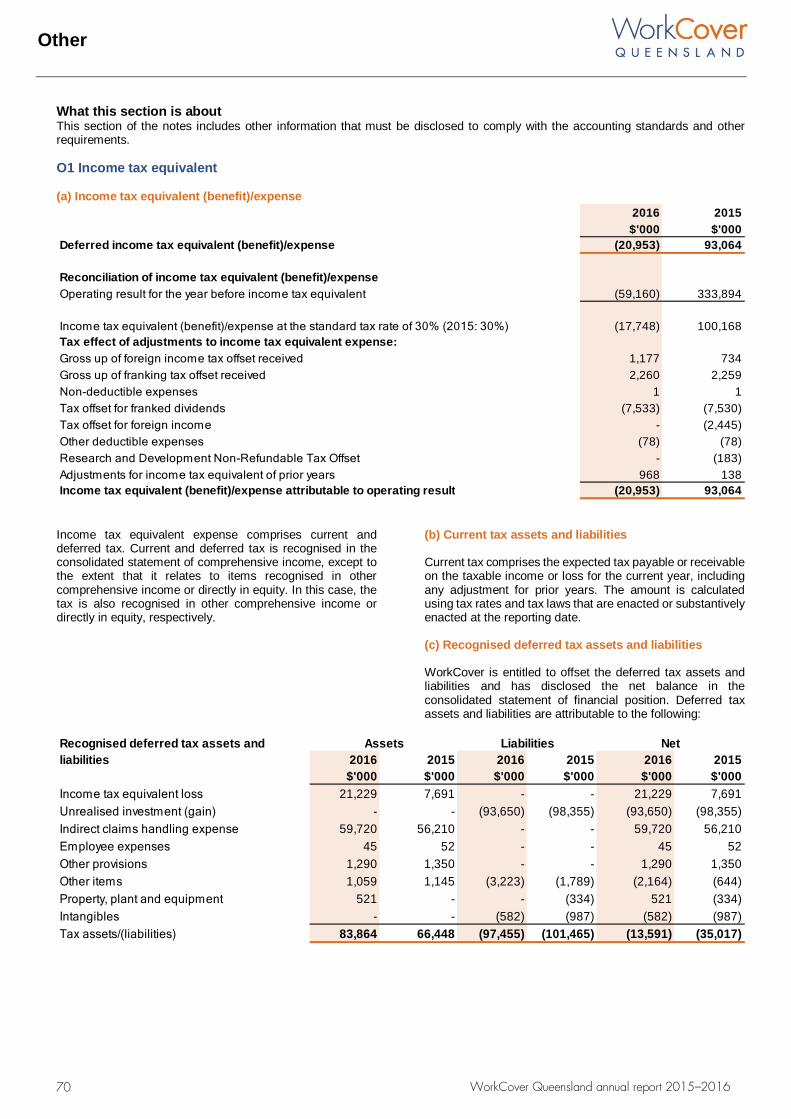
Other
What this section is about This section of the notes includes other information that must be disclosed to comply with the accounting standards and other requirements. Other O1 Income tax equivalent
(a) Income tax equivalent (benefit)/expense 2016 2015$'000 $'000
Deferred income tax equivalent (benefit)/expense (20,953) 93,064
Reconciliation of income tax equivalent (benefit)/expenseOperating result for the year before income tax equivalent (59,160) 333,894
Income tax equivalent (benefit)/expense at the standard tax rate of 30% (2015: 30%) (17,748) 100,168Tax effect of adjustments to income tax equivalent expense:Gross up of foreign income tax offset received 1,177 734Gross up of franking tax offset received 2,260 2,259Non-deductible expenses 1 1Tax offset for franked dividends (7,533) (7,530)Tax offset for foreign income - (2,445)Other deductible expenses (78) (78)Research and Development Non-Refundable Tax Offset - (183)Adjustments for income tax equivalent of prior years 968 138Income tax equivalent (benefit)/expense attributable to operating result (20,953) 93,064
Income tax equivalent expense comprises current and deferred tax. Current and deferred tax is recognised in the consolidated statement of comprehensive income, except to the extent that it relates to items recognised in other comprehensive income or directly in equity. In this case, the tax is also recognised in other comprehensive income or directly in equity, respectively.
(b) Current tax assets and liabilities
Current tax comprises the expected tax payable or receivable on the taxable income or loss for the current year, including any adjustment for prior years. The amount is calculated using tax rates and tax laws that are enacted or substantively enacted at the reporting date.
(c) Recognised deferred tax assets and liabilities
WorkCover is entitled to offset the deferred tax assets and liabilities and has disclosed the net balance in the consolidated statement of financial position. Deferred tax assets and liabilities are attributable to the following:
2016 2015 2016 2015 2016 2015$'000 $'000 $'000 $'000 $'000 $'000
Income tax equivalent loss 21,229 7,691 - - 21,229 7,691Unrealised investment (gain) - - (93,650) (98,355) (93,650) (98,355)Indirect claims handling expense 59,720 56,210 - - 59,720 56,210Employee expenses 45 52 - - 45 52Other provisions 1,290 1,350 - - 1,290 1,350Other items 1,059 1,145 (3,223) (1,789) (2,164) (644)Property, plant and equipment 521 - - (334) 521 (334)Intangibles - - (582) (987) (582) (987)Tax assets/(liabilities) 83,864 66,448 (97,455) (101,465) (13,591) (35,017)
Liabilities NetAssetsRecognised deferred tax assets and liabilities
70 WorkCover Queensland annual report 2015–2016
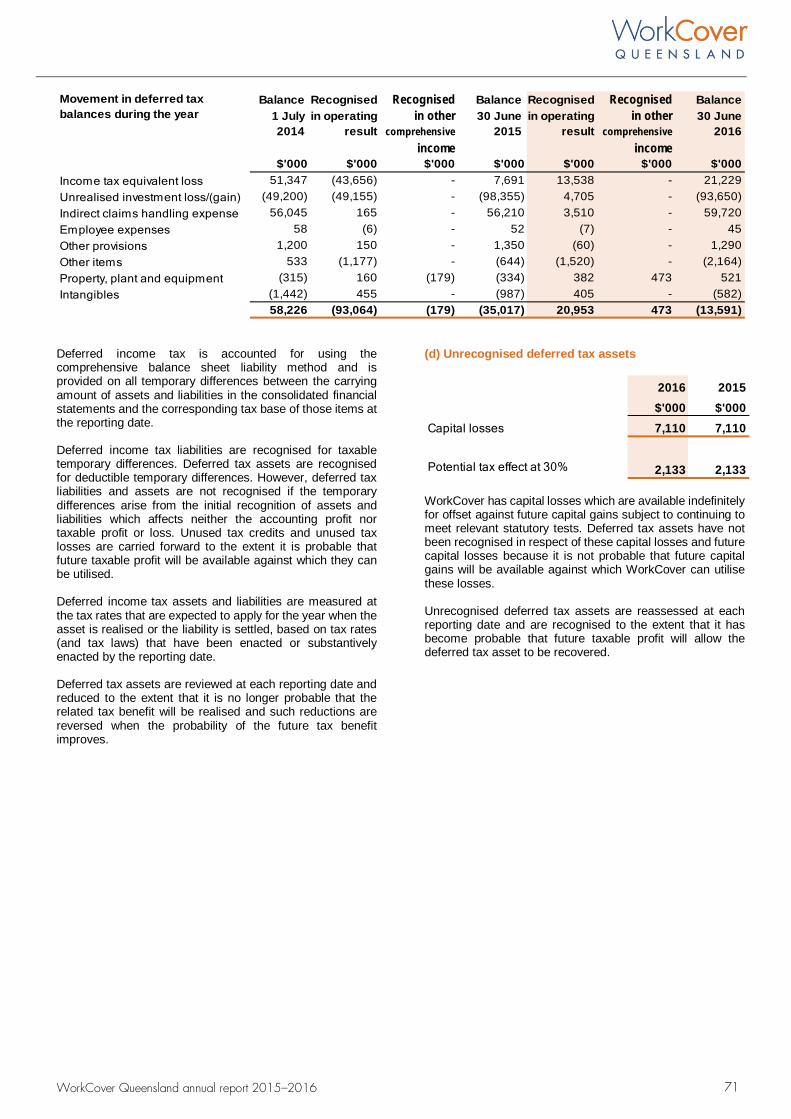
Balance Recognised Recognised Balance Recognised Recognised Balance1 July in operating in other 30 June in operating in other 30 June2014 result comprehensive 2015 result comprehensive 2016
income income$'000 $'000 $'000 $'000 $'000 $'000 $'000
Income tax equivalent loss 51,347 (43,656) - 7,691 13,538 - 21,229Unrealised investment loss/(gain) (49,200) (49,155) - (98,355) 4,705 - (93,650)Indirect claims handling expense 56,045 165 - 56,210 3,510 - 59,720Employee expenses 58 (6) - 52 (7) - 45Other provisions 1,200 150 - 1,350 (60) - 1,290Other items 533 (1,177) - (644) (1,520) - (2,164)Property, plant and equipment (315) 160 (179) (334) 382 473 521Intangibles (1,442) 455 - (987) 405 - (582)
58,226 (93,064) (179) (35,017) 20,953 473 (13,591)
Movement in deferred tax balances during the year
Deferred income tax is accounted for using the comprehensive balance sheet liability method and is provided on all temporary differences between the carrying amount of assets and liabilities in the consolidated financial statements and the corresponding tax base of those items at the reporting date.
Deferred income tax liabilities are recognised for taxable temporary differences. Deferred tax assets are recognised for deductible temporary differences. However, deferred tax liabilities and assets are not recognised if the temporary differences arise from the initial recognition of assets and liabilities which affects neither the accounting profit nor taxable profit or loss. Unused tax credits and unused tax losses are carried forward to the extent it is probable that future taxable profit will be available against which they can be utilised.
Deferred income tax assets and liabilities are measured at the tax rates that are expected to apply for the year when the asset is realised or the liability is settled, based on tax rates (and tax laws) that have been enacted or substantively enacted by the reporting date.
Deferred tax assets are reviewed at each reporting date and reduced to the extent that it is no longer probable that the related tax benefit will be realised and such reductions are reversed when the probability of the future tax benefit improves.
(d) Unrecognised deferred tax assets
2016 2015$'000 $'000
Capital losses 7,110 7,110
Potential tax effect at 30% 2,133 2,133
WorkCover has capital losses which are available indefinitely for offset against future capital gains subject to continuing to meet relevant statutory tests. Deferred tax assets have not been recognised in respect of these capital losses and future capital losses because it is not probable that future capital gains will be available against which WorkCover can utilise these losses.
Unrecognised deferred tax assets are reassessed at each reporting date and are recognised to the extent that it has become probable that future taxable profit will allow the deferred tax asset to be recovered.
71 WorkCover Queensland annual report 2015–2016
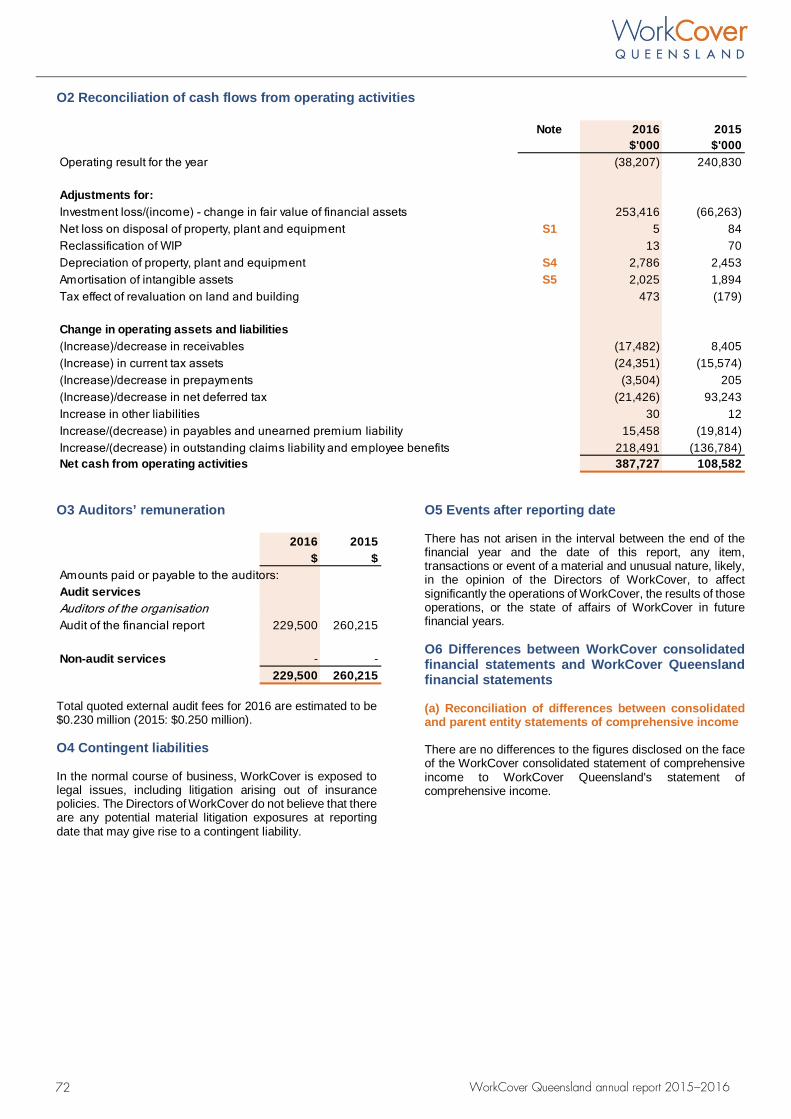
O2 Reconciliation of cash flows from operating activities
Note 2016 2015$'000 $'000
Operating result for the year (38,207) 240,830
Adjustments for:Investment loss/(income) - change in fair value of financial assets 253,416 (66,263)Net loss on disposal of property, plant and equipment S1 5 84Reclassification of WIP 13 70Depreciation of property, plant and equipment S4 2,786 2,453Amortisation of intangible assets S5 2,025 1,894Tax effect of revaluation on land and building 473 (179)
Change in operating assets and liabilities(Increase)/decrease in receivables (17,482) 8,405(Increase) in current tax assets (24,351) (15,574)(Increase)/decrease in prepayments (3,504) 205(Increase)/decrease in net deferred tax (21,426) 93,243Increase in other liabilities 30 12Increase/(decrease) in payables and unearned premium liability 15,458 (19,814)Increase/(decrease) in outstanding claims liability and employee benefits 218,491 (136,784)Net cash from operating activities 387,727 108,582
O3 Auditors’ remuneration
2016 2015$ $
Amounts paid or payable to the auditors:Audit servicesAuditors of the organisationAudit of the financial report 229,500 260,215
Non-audit services - -229,500 260,215
Total quoted external audit fees for 2016 are estimated to be $0.230 million (2015: $0.250 million).
O4 Contingent liabilities
In the normal course of business, WorkCover is exposed to legal issues, including litigation arising out of insurance policies. The Directors of WorkCover do not believe that there are any potential material litigation exposures at reporting date that may give rise to a contingent liability.
O5 Events after reporting date
There has not arisen in the interval between the end of the financial year and the date of this report, any item, transactions or event of a material and unusual nature, likely, in the opinion of the Directors of WorkCover, to affect significantly the operations of WorkCover, the results of those operations, or the state of affairs of WorkCover in future financial years.
O6 Differences between WorkCover consolidated financial statements and WorkCover Queensland financial statements
(a) Reconciliation of differences between consolidated and parent entity statements of comprehensive income
There are no differences to the figures disclosed on the face of the WorkCover consolidated statement of comprehensive income to WorkCover Queensland's statement of comprehensive income.
72 WorkCover Queensland annual report 2015–2016
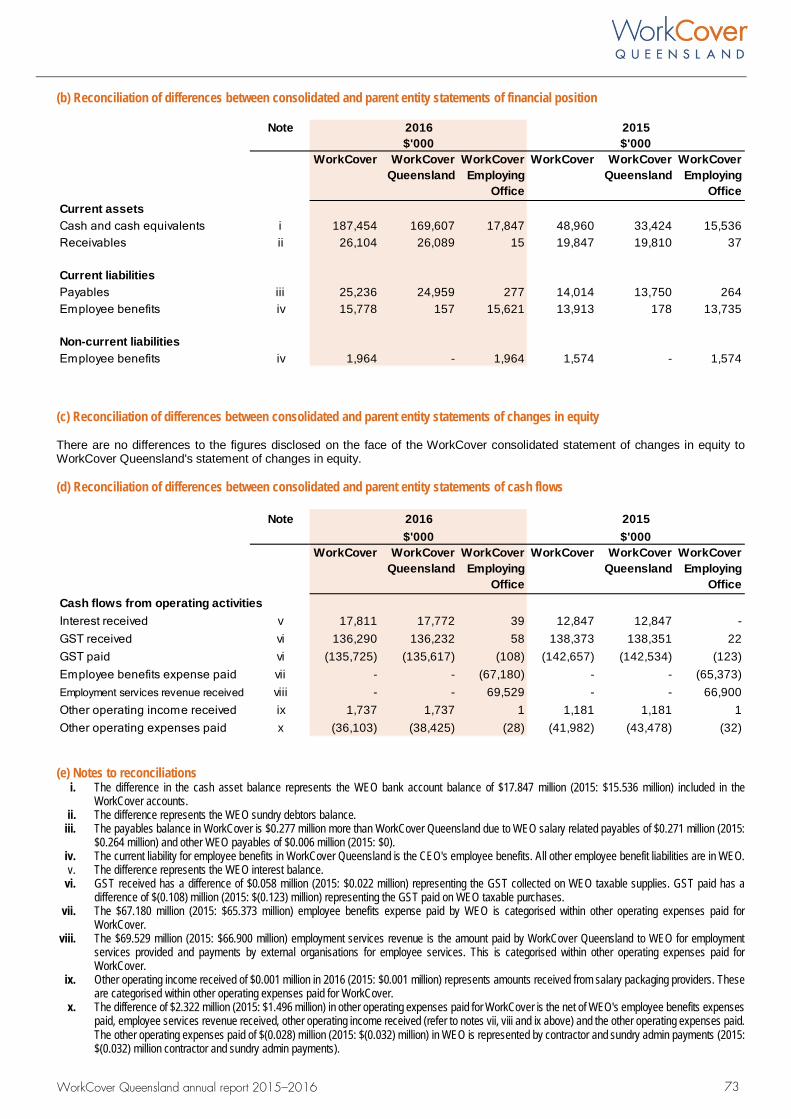
(b) Reconciliation of differences between consolidated and parent entity statements of financial position
Note 2016 2015$'000 $'000
WorkCover WorkCover Queensland
WorkCover Employing
Office
WorkCover WorkCover Queensland
WorkCover Employing
OfficeCurrent assetsCash and cash equivalents i 187,454 169,607 17,847 48,960 33,424 15,536Receivables ii 26,104 26,089 15 19,847 19,810 37
Current liabilitiesPayables iii 25,236 24,959 277 14,014 13,750 264Employee benefits iv 15,778 157 15,621 13,913 178 13,735
Non-current liabilitiesEmployee benefits iv 1,964 - 1,964 1,574 - 1,574
(c) Reconciliation of differences between consolidated and parent entity statements of changes in equity
There are no differences to the figures disclosed on the face of the WorkCover consolidated statement of changes in equity to WorkCover Queensland's statement of changes in equity.
(d) Reconciliation of differences between consolidated and parent entity statements of cash flows
Note 2016 2015$'000 $'000
WorkCover WorkCover Queensland
WorkCover Employing
Office
WorkCover WorkCover Queensland
WorkCover Employing
OfficeCash flows from operating activitiesInterest received v 17,811 17,772 39 12,847 12,847 -GST received vi 136,290 136,232 58 138,373 138,351 22GST paid vi (135,725) (135,617) (108) (142,657) (142,534) (123)Employee benefits expense paid vii - - (67,180) - - (65,373)Employment services revenue received viii - - 69,529 - - 66,900Other operating income received ix 1,737 1,737 1 1,181 1,181 1Other operating expenses paid x (36,103) (38,425) (28) (41,982) (43,478) (32)
(e) Notes to reconciliations i. The difference in the cash asset balance represents the WEO bank account balance of $17.847 million (2015: $15.536 million) included in the
WorkCover accounts. ii. The difference represents the WEO sundry debtors balance.
iii. The payables balance in WorkCover is $0.277 million more than WorkCover Queensland due to WEO salary related payables of $0.271 million (2015:$0.264 million) and other WEO payables of $0.006 million (2015: $0).
iv. The current liability for employee benefits in WorkCover Queensland is the CEO's employee benefits. All other employee benefit liabilities are in WEO.v. The difference represents the WEO interest balance.
vi. GST received has a difference of $0.058 million (2015: $0.022 million) representing the GST collected on WEO taxable supplies. GST paid has adifference of $(0.108) million (2015: $(0.123) million) representing the GST paid on WEO taxable purchases.
vii. The $67.180 million (2015: $65.373 million) employee benefits expense paid by WEO is categorised within other operating expenses paid forWorkCover.
viii. The $69.529 million (2015: $66.900 million) employment services revenue is the amount paid by WorkCover Queensland to WEO for employmentservices provided and payments by external organisations for employee services. This is categorised within other operating expenses paid forWorkCover.
ix. Other operating income received of $0.001 million in 2016 (2015: $0.001 million) represents amounts received from salary packaging providers. These are categorised within other operating expenses paid for WorkCover.
x. The difference of $2.322 million (2015: $1.496 million) in other operating expenses paid for WorkCover is the net of WEO's employee benefits expensespaid, employee services revenue received, other operating income received (refer to notes vii, viii and ix above) and the other operating expenses paid.The other operating expenses paid of $(0.028) million (2015: $(0.032) million) in WEO is represented by contractor and sundry admin payments (2015:$(0.032) million contractor and sundry admin payments).
73 WorkCover Queensland annual report 2015–2016
O7 Summary of additional significant accounting policies
This note provides a list of significant accounting policies adopted in the preparation of these consolidated financial statements to the extent they have not already been disclosed in the other notes above.
(a) Basis of consolidation
The financial statements of a subsidiary are included in the consolidated financial statements from the date on which control over the subsidiary commences until the date on which control ceases. WorkCover Queensland controls an entity if, and only if, it has: • power over the entity (i.e. existing rights that give it the
current ability to direct the relevant activities of the entity);
• exposure, or rights, to variable returns from itsinvolvement with the entity; and
• the ability to use its power over the entity to affect itsreturns.
All inter-entity balances and transactions, and income and expenses resulting from intra-group transactions are eliminated in full on consolidation.
Key accounting judgement WEO is a statutory body established under the Workers' Compensation and Rehabilitation Act 2003, and is controlled by WorkCover Queensland. A work performance arrangement exists between WorkCover Queensland and WEO, where WEO is required to provide staff to perform work for WorkCover Queensland. Currently WEO has only the one agreement and is unlikely to make another. Further to this, WorkCover Queensland has been deemed to act as the principal under the delegation of powers, due to the fact that it exercises its own discretion and is not subject to specific direction by the Minister. Based on the contractual terms in the work performance agreement and other relevant factors, WorkCover Queensland assessed that WEO is a structured entity under AASB 10 Consolidated Financial Statements and that WorkCover Queensland controls it. Therefore, WEO is consolidated in the consolidated financial statements.
(b) Changes in accounting policies and disclosures
The following standards, and amendments to standards, relevant to WorkCover have been applied for the first time in the presentation of these consolidated financial statements: • AASB 2015-7 Amendments to Australian Accounting
Standards – Fair Value Disclosures of Not-for-Profit Public Sector Entities; and
• AASB 2015-2 Amendments to Australian AccountingStandards – Disclosure Initiative: Amendments to AASB 101.
The following amendments to Queensland Public Sector policies relevant to WorkCover have been applied for the first time: • Financial Reporting Requirements 5E Commitments.
These changes have not had a material impact on the consolidated financial statements.
Fair Value AASB 2015-7 Amendments to Australian Accounting Standards – Fair Value Disclosures of Not-for-Profit Public Sector Entities amends AASB 13 Fair Value Measurement effective from reporting periods beginning on or after 1 July 2016, provides relief from certain disclosures about fair values categorised as level 3 assets under the fair value hierarchy where the following disclosures will no longer be required: • the disaggregation of certain gains/losses on assets
reflected in the operating result; • quantitative information about the significant
unobservable inputs used in the fair value measurement; and
• a description of the sensitivity of the fair valuemeasurement to changes in the unobservable inputs.
The relief has impacted on the fair value disclosures of WorkCover for Property (land and building) as it is categorised within level 3 of the fair value hierarchy. WorkCover has early adopted this relief (on instruction from Queensland Treasury) for the 2015-16 reporting period.
Disclosure requirements AASB 2015-2 Amendments to Australian Accounting Standards – Disclosure Initiative: Amendments to AASB 101 has been early adopted (on instruction from Queensland Treasury) for reporting periods beginning 1 July 2015. It provides amendments to existing presentation and disclosure requirements, in particular requiring entities to use judgment when determining what information is material to disclose in their financial statements even if it is a required disclosure under a standard. The amendment also removes the requirement to include a summary of significant accounting policies section in the notes to the financial statements and allows entities to determine the appropriate order of the notes to the financial statements.
WorkCover, in accordance with these changes, has re-ordered the notes to the financial statements by topic and significance and disclosed accounting policies within the relevant notes.
(c) New and revised Australian Accounting Standards issued but not yet effective
A number of new standards, amendments to standards and interpretations are effective for annual periods beginning on or after 1 July 2016, and have not been early adopted in preparing these consolidated financial statements. None of the upcoming standards relevant to WorkCover are expected to have a material impact on the consolidated financial statements and WorkCover does not plan to adopt any standard early.
The nature and effects of these standards not yet effective are explained below:
Leases AASB 16 Leases applies from reporting periods beginning on or after 1 January 2019.
This standard introduces new requirements for lessees by requiring an asset and liability to be recognised for the majority of lease contracts. WorkCover is yet to complete its analysis of current arrangements, but at this stage does not expect a significant impact.
74 WorkCover Queensland annual report 2015–2016
Financial instruments AASB 9 Financial Instruments applies from reporting periods beginning on or after 1 January 2018. AASB 9 Financial Instruments introduces new requirements for: • the classification, measurement and derecognition of
financial assets and financial liabilities;• impairment methodology; and• hedge accounting.
WorkCover is yet to undertake a detailed assessment of the potential impact on the consolidated financial statements.
Related parties AASB 2015-6 Amendments to Australian Accounting Standards – Extending Related Party Disclosures to Not-for-Profit Public Sector Entities amends AASB 124 Related Party Disclosures to extend the scope of the standard to include not-for-profit public sector entities and applies for reporting periods starting on or after 1 July 2016.
WorkCover already discloses detailed information about remuneration of its KMP, based on Queensland Treasury’s Financial Reporting Requirements for Queensland Government Agencies. Additional disclosures will be required from 2016-17 for related party transactions with information provided including the terms and conditions and amounts. These related party transaction disclosures will be grouped unless individual transactions are significant.
(d) Goods and services tax
Income, expenses, assets, and liabilities are recognised net of the amount of associated GST, unless the GST incurred is not recoverable from the Australian Taxation Office (ATO). In this case, the GST is recognised as part of the cost of acquisition of the asset or in the amount of the expense.
Receivables and payables are stated with the amount of GST included, where applicable. The net amount of GST recoverable from, or payable to, the ATO is included as part of receivables or payables, respectively, in the consolidated statement of financial position.
Cash flows are included in the consolidated statement of cash flows net of the amount of GST. The GST component of cash flows arising from investing activities which is recoverable from or payable to the ATO is classified as part of operating cash flows.
Commitments and contingencies are disclosed net of the amount of GST, unless the GST incurred is not recoverable from the ATO.
WorkCover is grouped for GST purposes.
75 WorkCover Queensland annual report 2015–2016
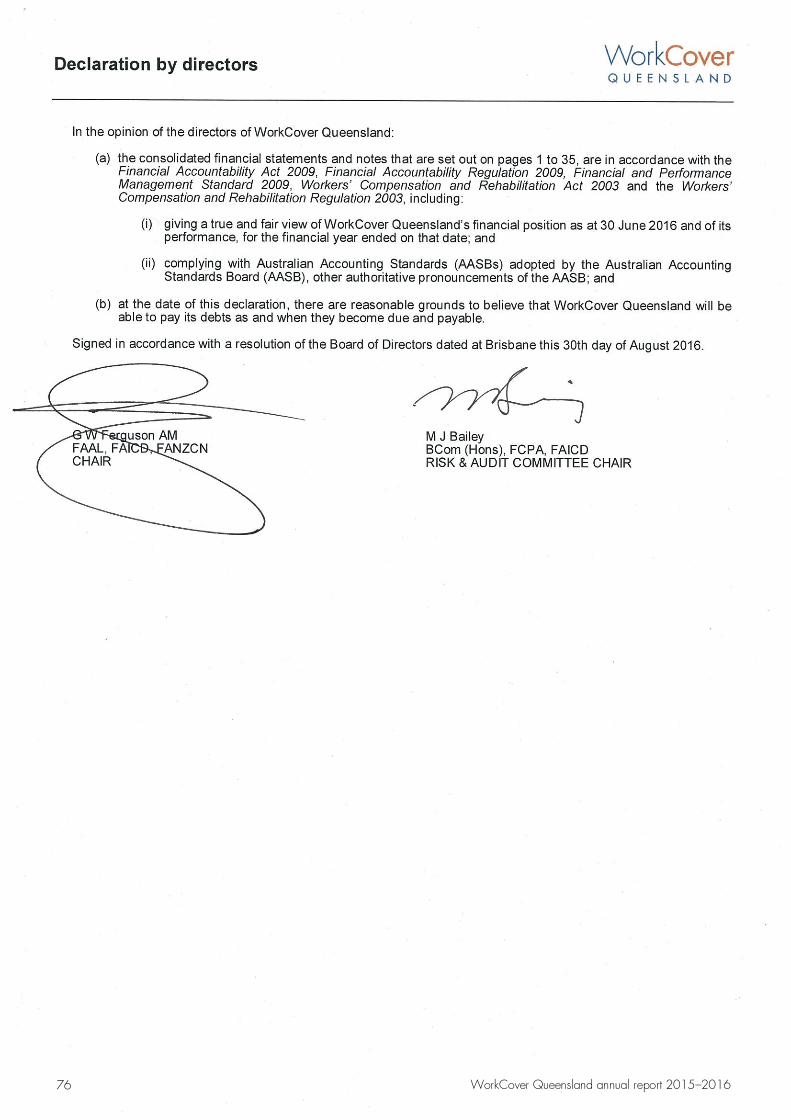
76 WorkCover Queensland annual report 2015–2016
INDEPENDENT AUDITOR'S REPORT
To the Board ofWorkCoverQueensland
Report on the Financial Report
I have audited the accompanying financial report ofWorkCover Queensland, which comprises the consolidated statement of financial position as at 30 June 2016, the consolidated statement of comprehensive income, consolidated statement of changes in equity and consolidated statement of cash flows for the year then ended, notes to the financial statements including significant accounting policies and other explanatory information, and certificates given by the Chair and Chief Executive Officer of the entity and the consolidated entity comprising the Board and the entities it controlled at the year's end or from time to time during the financial year.
The Board's Responsibility for the Financial Report
The Board is responsible for the preparation of the financial report that gives a true and fair view in accordance with prescribed accounting requirements identified in the Financial Accountability Act 2009 and the Financial and Performance Management Standard 2009, including compliance with Australian Accounting Standards. The Board's responsibility also includes such internal control as the .Board determines is necessary to enable the preparation of the financial report that gives a true and fair view and is free from material misstatement, whether due to fraud or error.
Auditor's Responsibility
My responsibility is to express an opinion on the financial report based on the audit. The audit was conducted in accordance with the Auditor-General of Queensland Auditing Standards, which incorporate the Australian Auditing Standards. Those standards require compliance with relevant ethical requirements relating to audit engagements and that the audit is planned and performed to obtain reasonable assurance about whether the financial report is free from material misstatement.
An audit involves performing procedures to obtain audit evidence about the amounts and disclosures in the financial report. The procedures selected depend on the auditor's judgement, including the assessment of the risks of material misstatement of the financial report, whether due to fraud or error. In making those risk assessments, the auditor considers internal control relevant to the entity's preparation of the financial report that gives a true and fair view in order to design audit procedures that are appropriate in the circumstances, but not for the purpose of expressing an opinion on the effectiveness of the entity's internal control, other than in expressing an opinion on compliance with prescribed requirements. An audit also includes evaluating the appropriateness of accounting policies used and the reasonableness of accounting estimates made by the Board, as well as evaluating the overall presentation of the financial report including any mandatory financial reporting requirements approved by the Treasurer for application in Queensland.
I believe that the audit evidence obtained is sufficient and appropriate to provide a basis for my audit opinion.
77 WorkCover Queensland annual report 2015–2016
Independence
The Auditor-General Act 2009 promotes the independence ot the Auditor-General and all authorised auditors. The Auditor-General is the auditor of all Queensland public sector entities and can be removed only by Parliament
The Auditor-General may conduct an audit in any way considered appropriate and is not subject to direction by any person about the way in which audit powers are to be exercised. The Auditor-Genera! has for the purposes of conducting an audit, access to all documents and property and can report to Parliament matters which in the Auditor-General's opinion are significant.
Opinion
In accordance with s.40 of the Auditor-General Act 2009-
(a) ! have received all the information and explanations which ~ have required; and
(b) in my opinion -
(i) the piescribed requirements in re~ation to the estab~ishment and keeping of accounts have been complied with !r. a!t materia~ respects; and
(ii) the financiai report presents a true and fa~r view, i~ accordance with the prescribed accounting standards, of the transactions of Work Cover Queensland and the consolidated entity for the financial year 1 July 2015 to 30 June 2016 and of the financial position as at the end of that year.
Other Matters· Electronic Presentation of the Audited Financial Report
Those v~ew~ng an electronic presentation of these financia~ statements shouid note that audit does not provide assurance on the integrity of the information presented eiectronically and does not provide an opinion on any information which may be hyperHnked to or from the financia: s'ratements. If users of the financial statements are concerned with the inherent risks arising from electronic presentation of information, they are advised to refer to the printed copy of the audited financial statements to cor~firm the accuracy of this electronically presented information.
P CHRISTENSEN FCPA (As Delegate of the Auditor-General of Queensland)
Queensland Audit Office Brisbane
78 WorkCover Queensland annual report 2015–2016
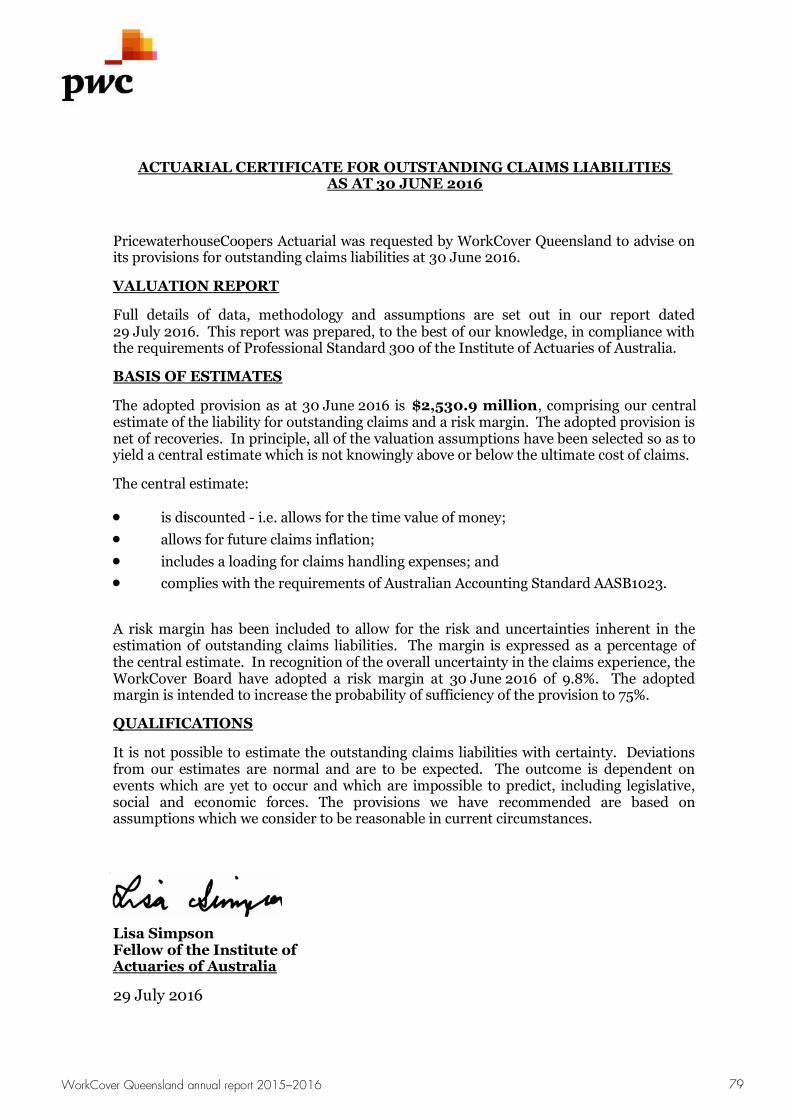
ACTUARIAL CERTIFICATE FOR OUTSTANDING CLAIMS LIABILITIESAS AT 30 JUNE 2016
PricewaterhouseCoopers Actuarial was requested by WorkCover Queensland to advise onits provisions for outstanding claims liabilities at 30 June 2016.
VALUATION REPORT
Full details of data, methodology and assumptions are set out in our report dated29 July 2016. This report was prepared, to the best of our knowledge, in compliance withthe requirements of Professional Standard 300 of the Institute of Actuaries of Australia.
BASIS OF ESTIMATES
The adopted provision as at 30 June 2016 is $2,530.9 million, comprising our centralestimate of the liability for outstanding claims and a risk margin. The adopted provision isnet of recoveries. In principle, all of the valuation assumptions have been selected so as toyield a central estimate which is not knowingly above or below the ultimate cost of claims.
The central estimate:
is discounted - i.e. allows for the time value of money;
allows for future claims inflation;
includes a loading for claims handling expenses; and
complies with the requirements of Australian Accounting Standard AASB1023.
A risk margin has been included to allow for the risk and uncertainties inherent in theestimation of outstanding claims liabilities. The margin is expressed as a percentage ofthe central estimate. In recognition of the overall uncertainty in the claims experience, theWorkCover Board have adopted a risk margin at 30 June 2016 of 9.8%. The adoptedmargin is intended to increase the probability of sufficiency of the provision to 75%.
QUALIFICATIONS
It is not possible to estimate the outstanding claims liabilities with certainty. Deviationsfrom our estimates are normal and are to be expected. The outcome is dependent onevents which are yet to occur and which are impossible to predict, including legislative,social and economic forces. The provisions we have recommended are based onassumptions which we consider to be reasonable in current circumstances.
Lisa SimpsonFellow of the Institute ofActuaries of Australia
29 July 2016
79 WorkCover Queensland annual report 2015–2016
80 WorkCover Queensland annual report 2015–2016
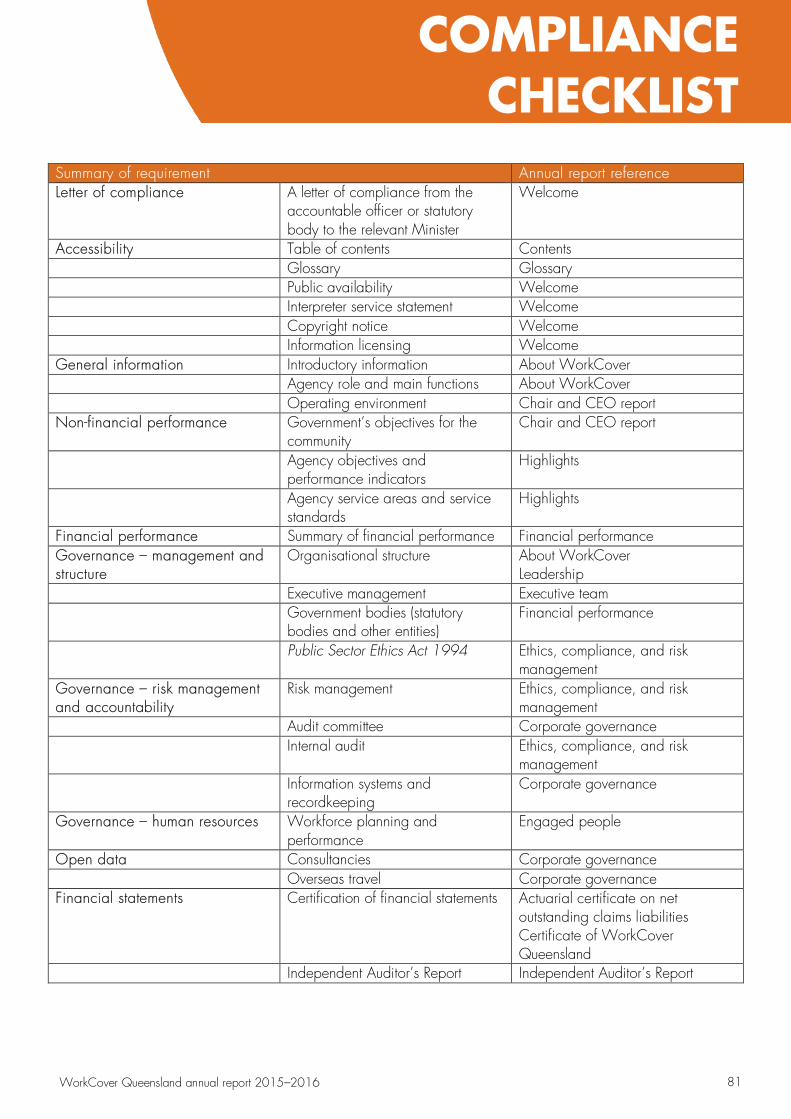
Summary of requirement Annual report reference Letter of compliance A letter of compliance from the
accountable officer or statutory body to the relevant Minister
Welcome
Accessibility Table of contents Contents Glossary Glossary Public availability Welcome Interpreter service statement Welcome Copyright notice Welcome Information licensing Welcome
General information Introductory information About WorkCover Agency role and main functions About WorkCover Operating environment Chair and CEO report
Non-financial performance Government’s objectives for the community
Chair and CEO report
Agency objectives and performance indicators
Highlights
Agency service areas and service standards
Highlights
Financial performance Summary of financial performance Financial performance Governance – management and structure
Organisational structure About WorkCover Leadership
Executive management Executive team Government bodies (statutory bodies and other entities)
Financial performance
Public Sector Ethics Act 1994 Ethics, compliance, and risk management
Governance – risk management and accountability
Risk management Ethics, compliance, and risk management
Audit committee Corporate governance Internal audit Ethics, compliance, and risk
management Information systems and recordkeeping
Corporate governance
Governance – human resources Workforce planning and performance
Engaged people
Open data Consultancies Corporate governance Overseas travel Corporate governance
Financial statements Certification of financial statements Actuarial certificate on net outstanding claims liabilities Certificate of WorkCover Queensland
Independent Auditor’s Report Independent Auditor’s Report
COMPLIANCE CHECKLIST
81 WorkCover Queensland annual report 2015–2016
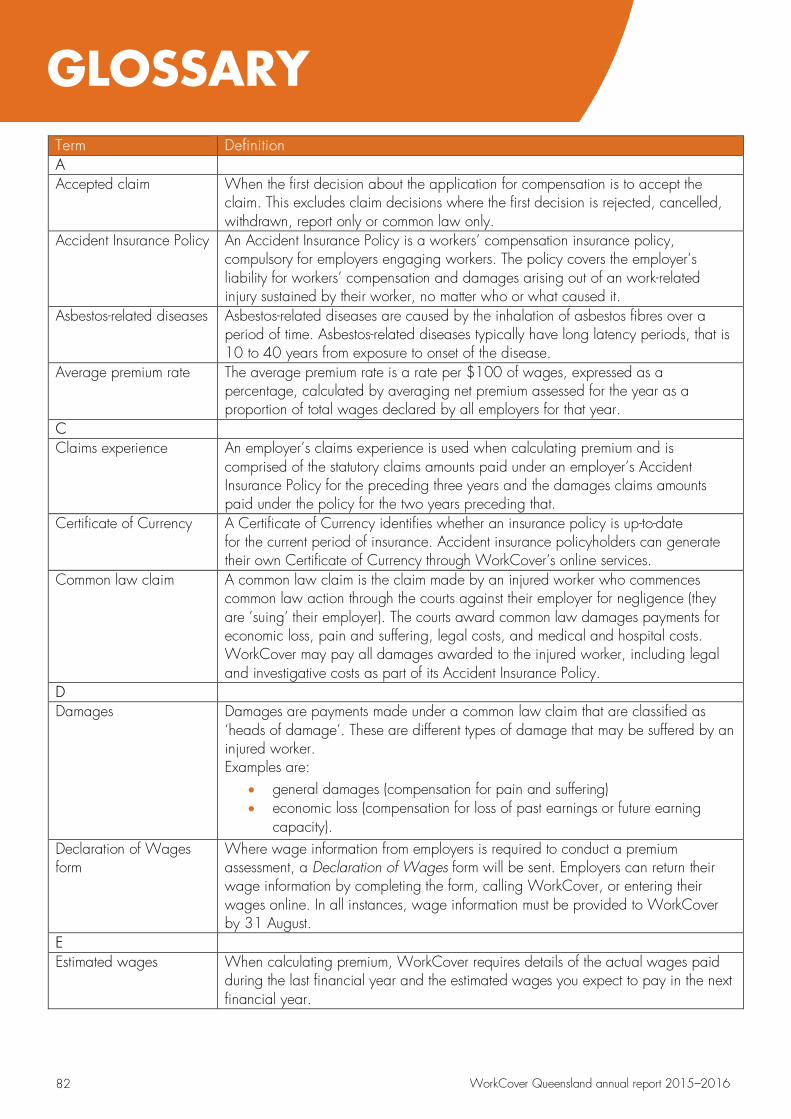
Term Definition A Accepted claim When the first decision about the application for compensation is to accept the
claim. This excludes claim decisions where the first decision is rejected, cancelled, withdrawn, report only or common law only.
Accident Insurance Policy An Accident Insurance Policy is a workers’ compensation insurance policy, compulsory for employers engaging workers. The policy covers the employer’s liability for workers’ compensation and damages arising out of an work-related injury sustained by their worker, no matter who or what caused it.
Asbestos-related diseases Asbestos-related diseases are caused by the inhalation of asbestos fibres over a period of time. Asbestos-related diseases typically have long latency periods, that is 10 to 40 years from exposure to onset of the disease.
Average premium rate The average premium rate is a rate per $100 of wages, expressed as a percentage, calculated by averaging net premium assessed for the year as a proportion of total wages declared by all employers for that year.
C Claims experience An employer’s claims experience is used when calculating premium and is
comprised of the statutory claims amounts paid under an employer’s Accident Insurance Policy for the preceding three years and the damages claims amounts paid under the policy for the two years preceding that.
Certificate of Currency A Certificate of Currency identifies whether an insurance policy is up-to-date for the current period of insurance. Accident insurance policyholders can generate their own Certificate of Currency through WorkCover’s online services.
Common law claim A common law claim is the claim made by an injured worker who commences common law action through the courts against their employer for negligence (they are ’suing’ their employer). The courts award common law damages payments for economic loss, pain and suffering, legal costs, and medical and hospital costs. WorkCover may pay all damages awarded to the injured worker, including legal and investigative costs as part of its Accident Insurance Policy.
D Damages Damages are payments made under a common law claim that are classified as
‘heads of damage’. These are different types of damage that may be suffered by an injured worker. Examples are:
• general damages (compensation for pain and suffering)• economic loss (compensation for loss of past earnings or future earning
capacity).Declaration of Wages form
Where wage information from employers is required to conduct a premium assessment, a Declaration of Wages form will be sent. Employers can return their wage information by completing the form, calling WorkCover, or entering their wages online. In all instances, wage information must be provided to WorkCover by 31 August.
E Estimated wages When calculating premium, WorkCover requires details of the actual wages paid
during the last financial year and the estimated wages you expect to pay in the next financial year.
GLOSSARY
82 WorkCover Queensland annual report 2015–2016
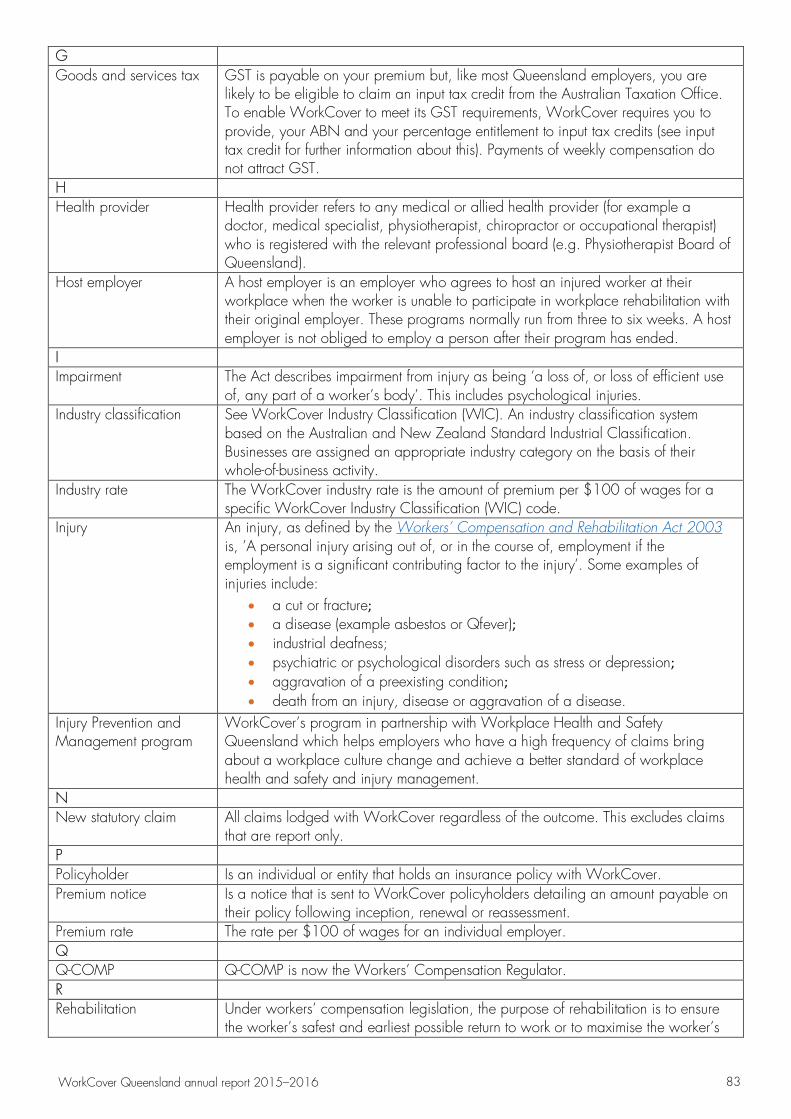
G Goods and services tax GST is payable on your premium but, like most Queensland employers, you are
likely to be eligible to claim an input tax credit from the Australian Taxation Office. To enable WorkCover to meet its GST requirements, WorkCover requires you to provide, your ABN and your percentage entitlement to input tax credits (see input tax credit for further information about this). Payments of weekly compensation do not attract GST.
H Health provider Health provider refers to any medical or allied health provider (for example a
doctor, medical specialist, physiotherapist, chiropractor or occupational therapist) who is registered with the relevant professional board (e.g. Physiotherapist Board of Queensland).
Host employer A host employer is an employer who agrees to host an injured worker at their workplace when the worker is unable to participate in workplace rehabilitation with their original employer. These programs normally run from three to six weeks. A host employer is not obliged to employ a person after their program has ended.
I Impairment The Act describes impairment from injury as being ‘a loss of, or loss of efficient use
of, any part of a worker’s body’. This includes psychological injuries. Industry classification See WorkCover Industry Classification (WIC). An industry classification system
based on the Australian and New Zealand Standard Industrial Classification. Businesses are assigned an appropriate industry category on the basis of their whole-of-business activity.
Industry rate The WorkCover industry rate is the amount of premium per $100 of wages for a specific WorkCover Industry Classification (WIC) code.
Injury An injury, as defined by the Workers’ Compensation and Rehabilitation Act 2003 is, ’A personal injury arising out of, or in the course of, employment if the employment is a significant contributing factor to the injury’. Some examples of injuries include:
• a cut or fracture;• a disease (example asbestos or Qfever);• industrial deafness;• psychiatric or psychological disorders such as stress or depression;• aggravation of a preexisting condition;• death from an injury, disease or aggravation of a disease.
Injury Prevention and Management program
WorkCover’s program in partnership with Workplace Health and Safety Queensland which helps employers who have a high frequency of claims bring about a workplace culture change and achieve a better standard of workplace health and safety and injury management.
N New statutory claim All claims lodged with WorkCover regardless of the outcome. This excludes claims
that are report only. P Policyholder Is an individual or entity that holds an insurance policy with WorkCover. Premium notice Is a notice that is sent to WorkCover policyholders detailing an amount payable on
their policy following inception, renewal or reassessment. Premium rate The rate per $100 of wages for an individual employer. Q Q-COMP Q-COMP is now the Workers’ Compensation Regulator. R Rehabilitation Under workers’ compensation legislation, the purpose of rehabilitation is to ensure
the worker’s safest and earliest possible return to work or to maximise the worker’s
83 WorkCover Queensland annual report 2015–2016
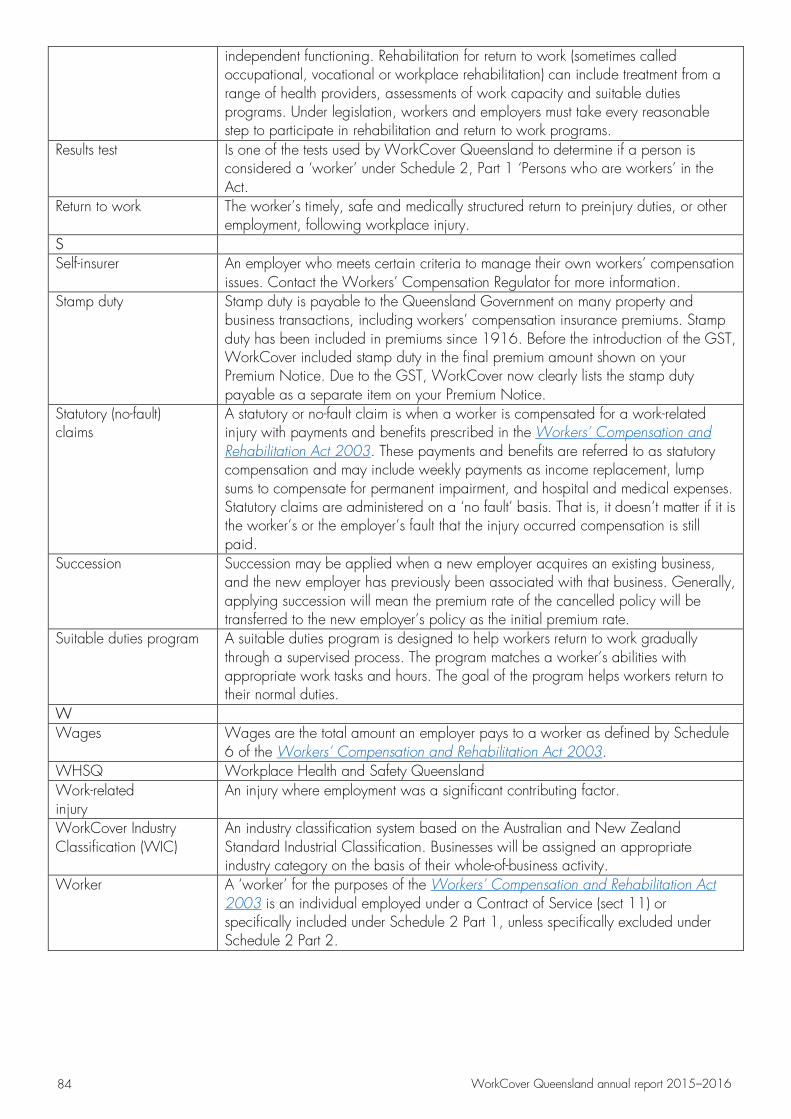
independent functioning. Rehabilitation for return to work (sometimes called occupational, vocational or workplace rehabilitation) can include treatment from a range of health providers, assessments of work capacity and suitable duties programs. Under legislation, workers and employers must take every reasonable step to participate in rehabilitation and return to work programs.
Results test Is one of the tests used by WorkCover Queensland to determine if a person is considered a ‘worker’ under Schedule 2, Part 1 ‘Persons who are workers’ in the Act.
Return to work The worker’s timely, safe and medically structured return to preinjury duties, or other employment, following workplace injury.
S Self-insurer An employer who meets certain criteria to manage their own workers’ compensation
issues. Contact the Workers’ Compensation Regulator for more information. Stamp duty Stamp duty is payable to the Queensland Government on many property and
business transactions, including workers’ compensation insurance premiums. Stamp duty has been included in premiums since 1916. Before the introduction of the GST, WorkCover included stamp duty in the final premium amount shown on your Premium Notice. Due to the GST, WorkCover now clearly lists the stamp duty payable as a separate item on your Premium Notice.
Statutory (no-fault) claims
A statutory or no-fault claim is when a worker is compensated for a work-related injury with payments and benefits prescribed in the Workers’ Compensation and Rehabilitation Act 2003. These payments and benefits are referred to as statutory compensation and may include weekly payments as income replacement, lump sums to compensate for permanent impairment, and hospital and medical expenses. Statutory claims are administered on a ‘no fault’ basis. That is, it doesn’t matter if it is the worker’s or the employer’s fault that the injury occurred compensation is still paid.
Succession Succession may be applied when a new employer acquires an existing business, and the new employer has previously been associated with that business. Generally, applying succession will mean the premium rate of the cancelled policy will be transferred to the new employer’s policy as the initial premium rate.
Suitable duties program A suitable duties program is designed to help workers return to work gradually through a supervised process. The program matches a worker’s abilities with appropriate work tasks and hours. The goal of the program helps workers return to their normal duties.
W Wages Wages are the total amount an employer pays to a worker as defined by Schedule
6 of the Workers’ Compensation and Rehabilitation Act 2003. WHSQ Workplace Health and Safety Queensland Work-related injury
An injury where employment was a significant contributing factor.
WorkCover Industry Classification (WIC)
An industry classification system based on the Australian and New Zealand Standard Industrial Classification. Businesses will be assigned an appropriate industry category on the basis of their whole-of-business activity.
Worker A ‘worker’ for the purposes of the Workers’ Compensation and Rehabilitation Act 2003 is an individual employed under a Contract of Service (sect 11) or specifically included under Schedule 2 Part 1, unless specifically excluded under Schedule 2 Part 2.
84 WorkCover Queensland annual report 2015–2016

48 WorkCover Queensland annual report 2015–2016
280 Adelaide Street (GPO Box 2459)
Brisbane Qld 4001
p: 1300 362 128
f: 1300 651 387
worksafe.qld.gov.au ABN: 40 577 162 756
ISSN: 1329 - 6539


![26.06.15 - [45] General Gazette - WorkSafe Queensland · WorkCover Queensland Notice (No. 1) of 2015 Part 1 — Preliminary matters 1 Commencement and application 1.1 This notice](https://img.pdfslide.net/doc/110x75/5f53923063581c581c10e0bf/260615-45-general-gazette-worksafe-queensland-workcover-queensland-notice.jpg)