Embed Size (px)
Citation preview
Workers’ Compensation Claims 2014 Report:
Insurance and Premium InformationFive Year Claims History
What’s New in Workers’ Compensation
University of WashingtonOffice of Risk Management
Claims Services Workers’ Compensation Program

Insurance Information
Who Insures the University?Who Manages Our Claims?
• Insured through the State of Washington’s Department of Labor and Industries (L&I)– NOT self insured– NOT commercially insured (prohibited in
WA)
• L&I’s Claims Managers manage and pay our workers’ compensation claims with careful oversight and coordination by UW’s Claims Specialists in the Office of Risk Management
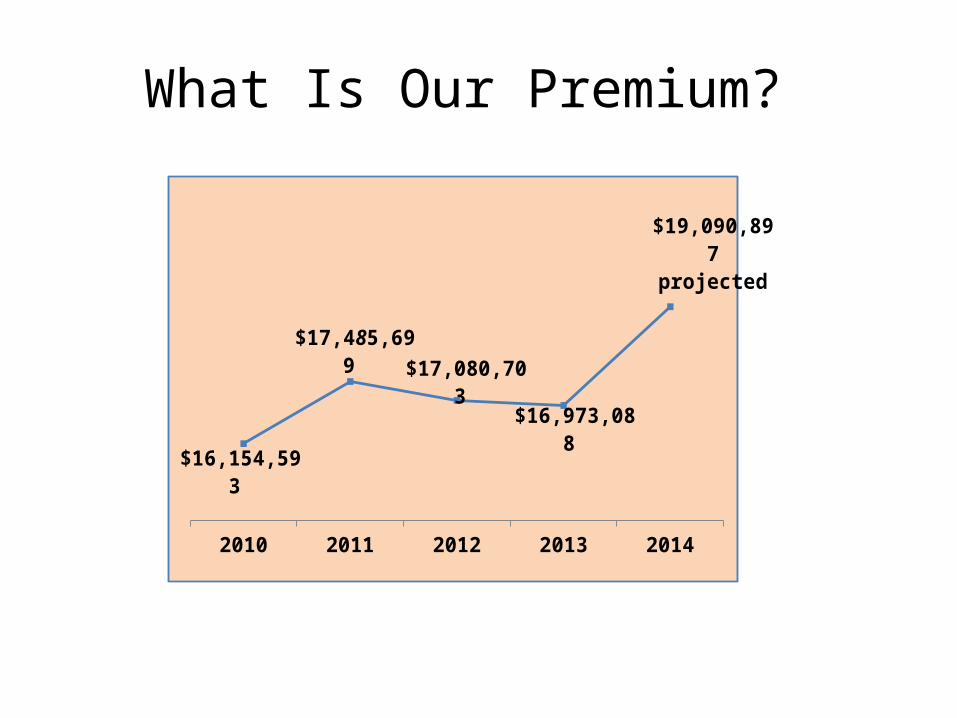
What Is Our Premium?
2010 2011 2012 2013 2014
$16,154,593
$17,485,699 $17,080,703
$16,973,088
$19,090,897 projected
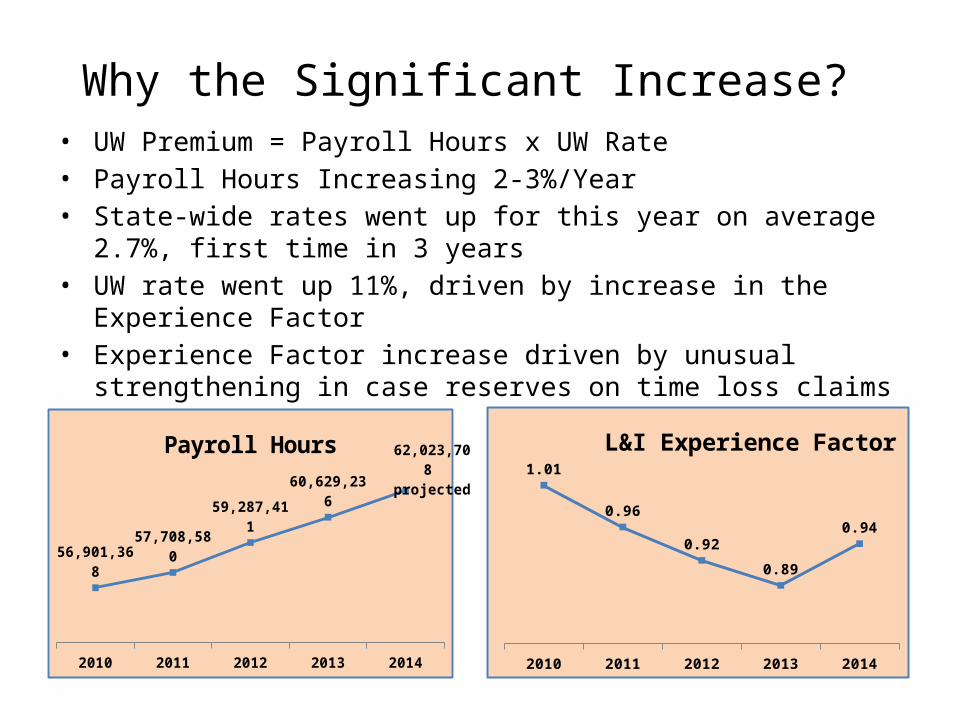
Why the Significant Increase? • UW Premium = Payroll Hours x UW Rate• Payroll Hours Increasing 2-3%/Year• State-wide rates went up for this year on average 2.7%, first time in 3
years• UW rate went up 11%, driven by increase in the Experience Factor • Experience Factor increase driven by unusual strengthening in case
reserves on time loss claims
2010 2011 2012 2013 2014
56,901,36857,708,580
59,287,411
60,629,236
62,023,708 projected
Payroll Hours
2010 2011 2012 2013 2014
1.01
0.96
0.92
0.89
0.94
L&I Experience Factor
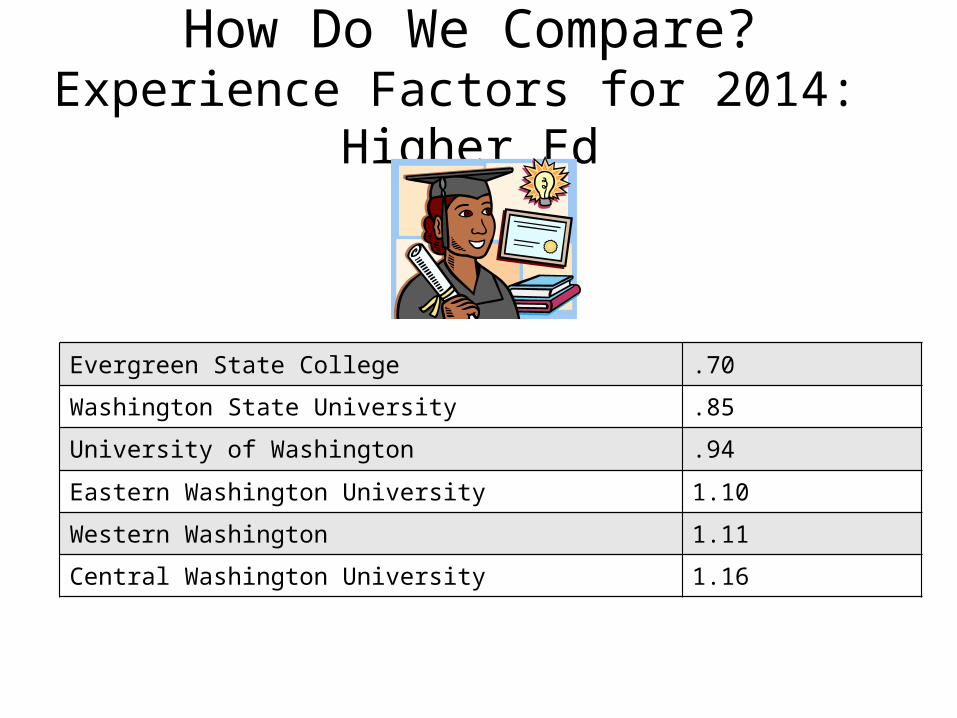
How Do We Compare?Experience Factors for 2014:
Higher Ed
Evergreen State College .70Washington State University .85University of Washington .94
Eastern Washington University 1.10
Western Washington 1.11
Central Washington University 1.16
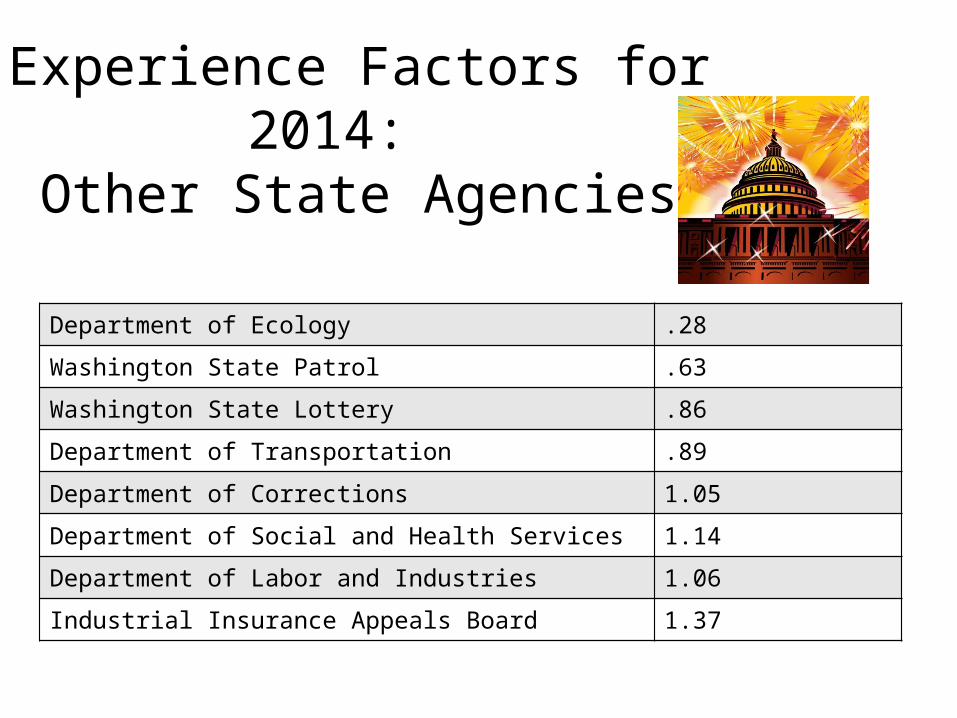
Experience Factors for 2014:
Other State Agencies
Department of Ecology .28
Washington State Patrol .63
Washington State Lottery .86
Department of Transportation .89
Department of Corrections 1.05
Department of Social and Health Services 1.14
Department of Labor and Industries 1.06
Industrial Insurance Appeals Board 1.37

Modified/Light Duty
A Winning Strategy For All!
Keeping Our Employees At Work Benefits Everyone
• Longer absence from work=greater risk of long term disability - 4-6 weeks=20% chance - 6 months= 50% chance
• Research shows that people who return to work following occupational injury are healthier than those who have not returned to work
• Not returning to work may cause physical effects such as deconditioning, psychological effects such as boredom and depression, and vocation effects such as loss of confidence and financial loss
• Peer and supervisor support is highest immediately following injury
• Shortens duration of lost productivity
L&I’s Stay-At-Work Incentive Program
An Added Incentive to Return Injured Workers to Modified/Light Duty
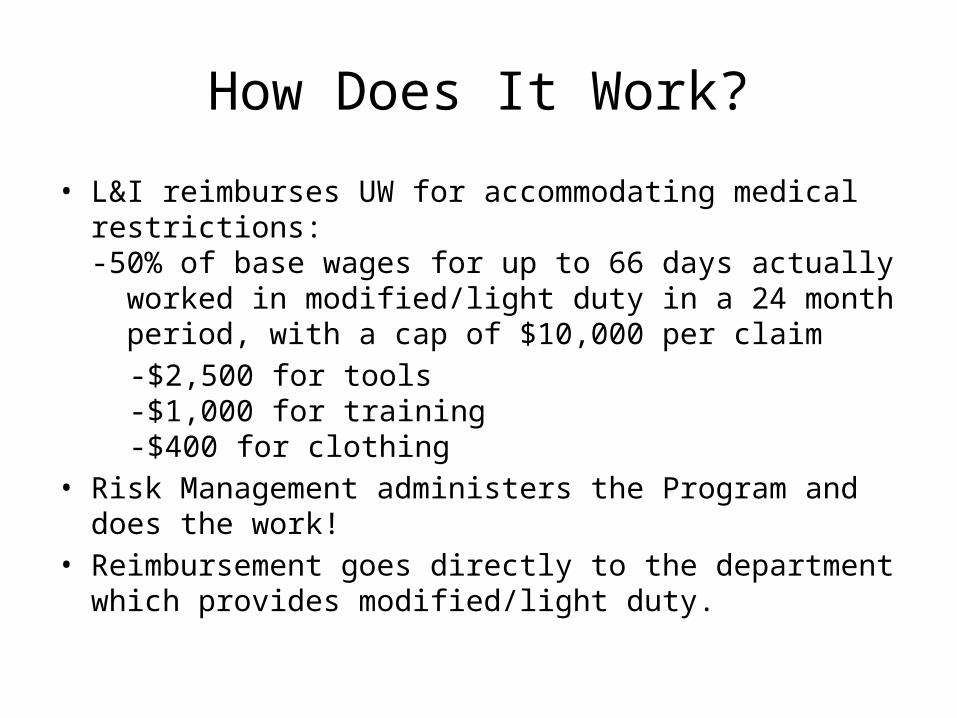
How Does It Work?
• L&I reimburses UW for accommodating medical restrictions: -50% of base wages for up to 66 days actually worked in modified/light duty in a 24 month period, with a cap of $10,000 per claim
-$2,500 for tools -$1,000 for training -$400 for clothing• Risk Management administers the Program and does the
work!• Reimbursement goes directly to the department which
provides modified/light duty.
Workers’ Compensation Claim Information
Five Calendar Years 2009 – 2013
University –Wide by Departments Generating Highest Time-Loss Dollars
HMC, UWMC, Facilities Services, and Student Life
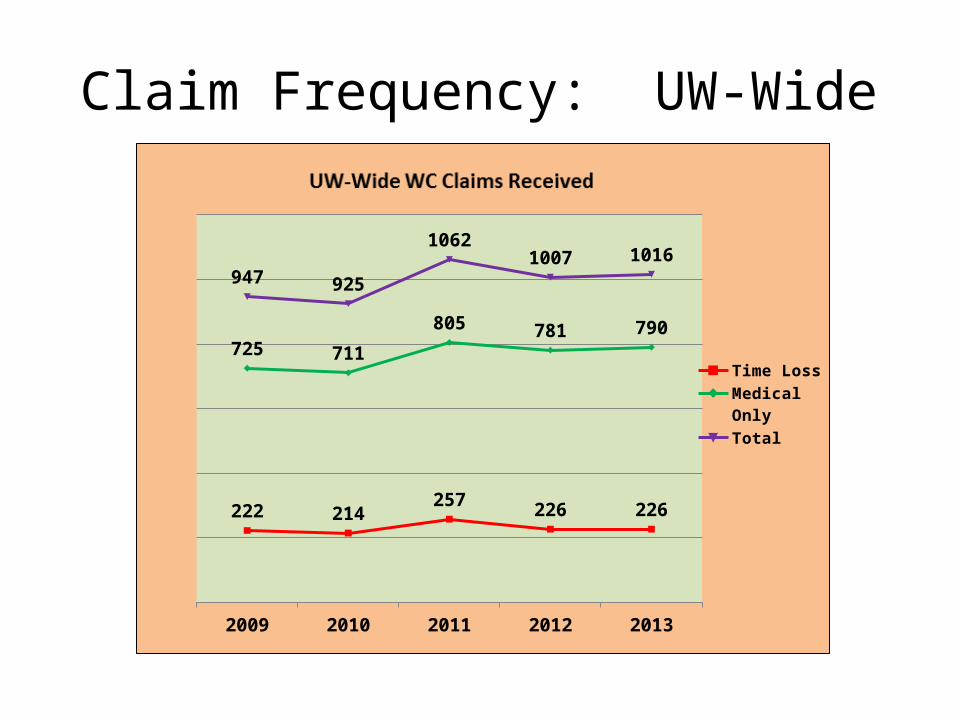
Claim Frequency: UW-Wide
2009 2010 2011 2012 2013
222 214257 226 226
725 711
805 781 790
947 925
10621007 1016
Time Loss
Medical Only
Total
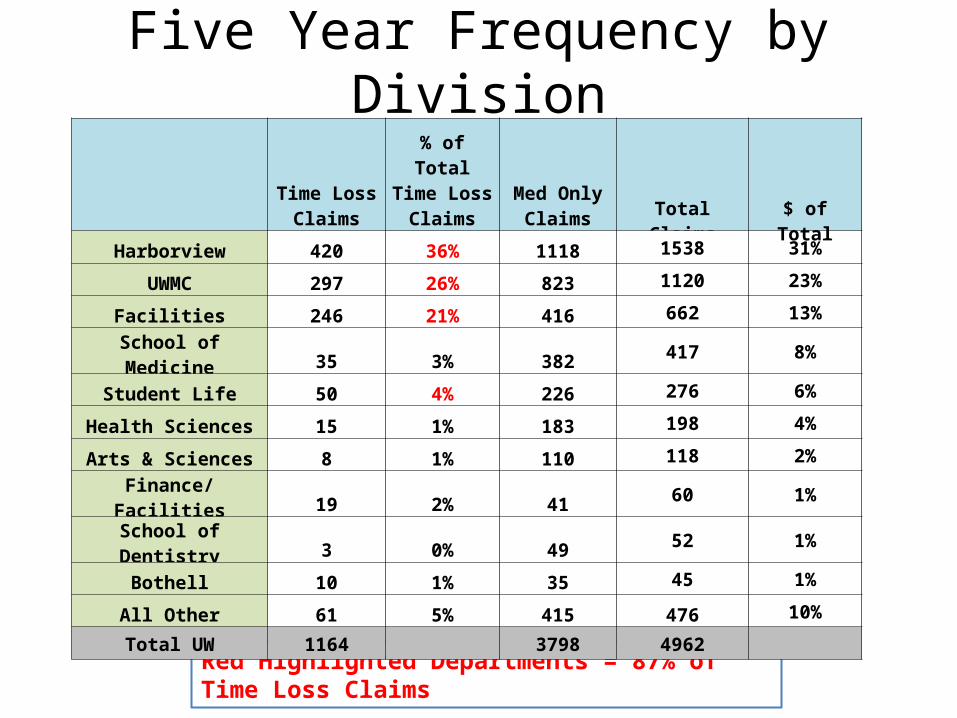
Five Year Frequency by Division
Red Highlighted Departments = 87% of Time Loss Claims
Time Loss
Claims
% of Total Time Loss
ClaimsMed Only
Claims Total Claims $ of Total
Harborview 420 36% 1118 1538 31%
UWMC 297 26% 823 1120 23%
Facilities 246 21% 416 662 13%
School of Medicine 35 3% 382 417 8%
Student Life 50 4% 226 276 6%
Health Sciences 15 1% 183 198 4%
Arts & Sciences 8 1% 110 118 2%
Finance/Facilities 19 2% 41 60 1%
School of Dentistry 3 0% 49 52 1%
Bothell 10 1% 35 45 1%
All Other 61 5% 415 476 10%
Total UW 1164 3798 4962
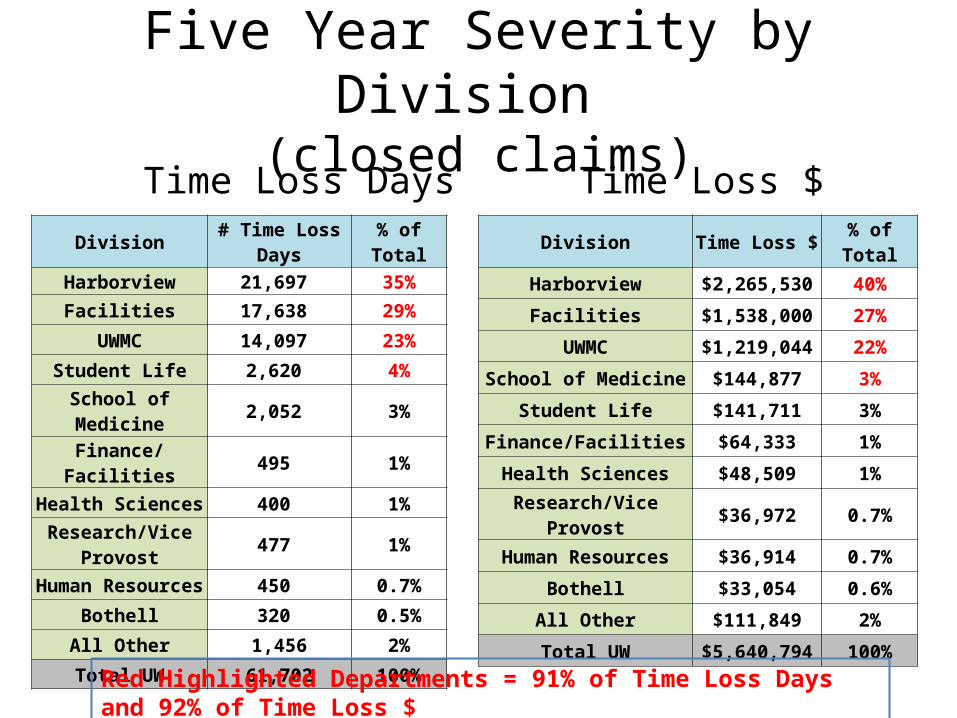
Five Year Severity by Division (closed claims)
Time Loss Days Time Loss $Division # Time Loss Days % of Total
Harborview 21,697 35%
Facilities 17,638 29%
UWMC 14,097 23%
Student Life 2,620 4%
School of Medicine 2,052 3%
Finance/Facilities 495 1%
Health Sciences 400 1%Research/Vice
Provost 477 1%
Human Resources 450 0.7%
Bothell 320 0.5%
All Other 1,456 2%
Total UW 61,702 100%
Division Time Loss $ % of Total
Harborview $2,265,530 40%
Facilities $1,538,000 27%
UWMC $1,219,044 22%
School of Medicine $144,877 3%
Student Life $141,711 3%
Finance/Facilities $64,333 1%
Health Sciences $48,509 1%
Research/Vice Provost $36,972 0.7%
Human Resources $36,914 0.7%
Bothell $33,054 0.6%
All Other $111,849 2%
Total UW $5,640,794 100%
Red Highlighted Departments = 91% of Time Loss Days and 92% of Time Loss $
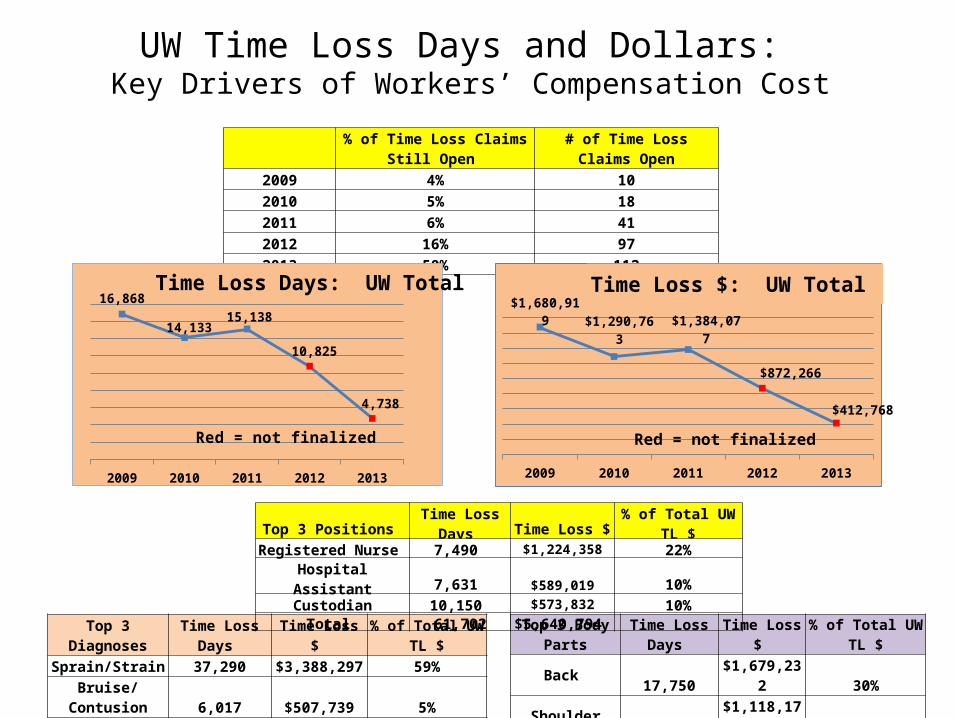
UW Time Loss Days and Dollars: Key Drivers of Workers’ Compensation Cost
% of Time Loss Claims Still Open # of Time Loss Claims Open2009 4% 102010 5% 182011 6% 412012 16% 972013 50% 112
Top 3 Diagnoses Time Loss Days Time Loss $ % of Total UW TL $Sprain/Strain 37,290 $3,388,297 59%
Bruise/Contusion 6,017 $507,739 5%Fracture 3,009 $266,465 9%
Top 3 Body Parts Time Loss Days Time Loss $ % of Total UW TL $Back 17,750 $1,679,232 30%
Shoulder 1,1883 $1,118,176 20%Knee 5,746 $472,375 8%
Red=not finalized
2009 2010 2011 2012 2013
16,868
14,13315,138
10,825
4,738
Time Loss Days: UW Total
Red = not finalized
2009 2010 2011 2012 2013
$1,680,919
$1,290,763 $1,384,077
$872,266
$412,768
Time Loss $: UW Total
Top 3 Positions Time Loss Days Time Loss $ % of Total UW TL $Registered Nurse 7,490 $1,224,358 22%Hospital Assistant 7,631 $589,019 10%
Custodian 10,150 $573,832 10%Total 61,702 $5,640,794
Red = not finalized
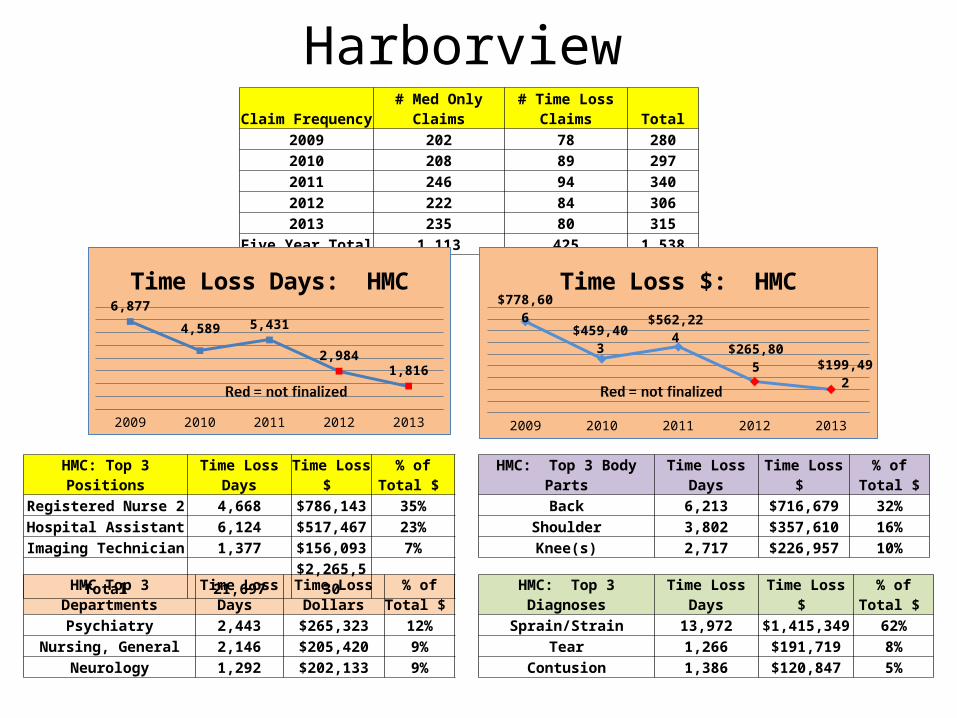
Harborview Claim Frequency # Med Only Claims # Time Loss Claims Total
2009 202 78 2802010 208 89 2972011 246 94 3402012 222 84 3062013 235 80 315
Five Year Total 1,113 425 1,538
HMC: Top 3 Diagnoses Time Loss Days Time Loss $ % of Total $ Sprain/Strain 13,972 $1,415,349 62%
Tear 1,266 $191,719 8%Contusion 1,386 $120,847 5%
HMC: Top 3 Body Parts Time Loss Days Time Loss $ % of Total $Back 6,213 $716,679 32%
Shoulder 3,802 $357,610 16%Knee(s) 2,717 $226,957 10%
HMC Top 3 DepartmentsTime Loss
Days Time Loss
Dollars % of Total $ Psychiatry 2,443 $265,323 12%
Nursing, General 2,146 $205,420 9%Neurology 1,292 $202,133 9%
HMC: Top 3 Positions Time Loss Days Time Loss $ % of Total $ Registered Nurse 2 4,668 $786,143 35%Hospital Assistant 6,124 $517,467 23%
Imaging Technician 1,377 $156,093 7%Total 21,697 $2,265,530
2009 2010 2011 2012 2013
6,877
4,589 5,431
2,9841,816
Time Loss Days: HMC
2009 2010 2011 2012 2013
$778,606
$459,403$562,224
$265,805$199,492
Time Loss $: HMC
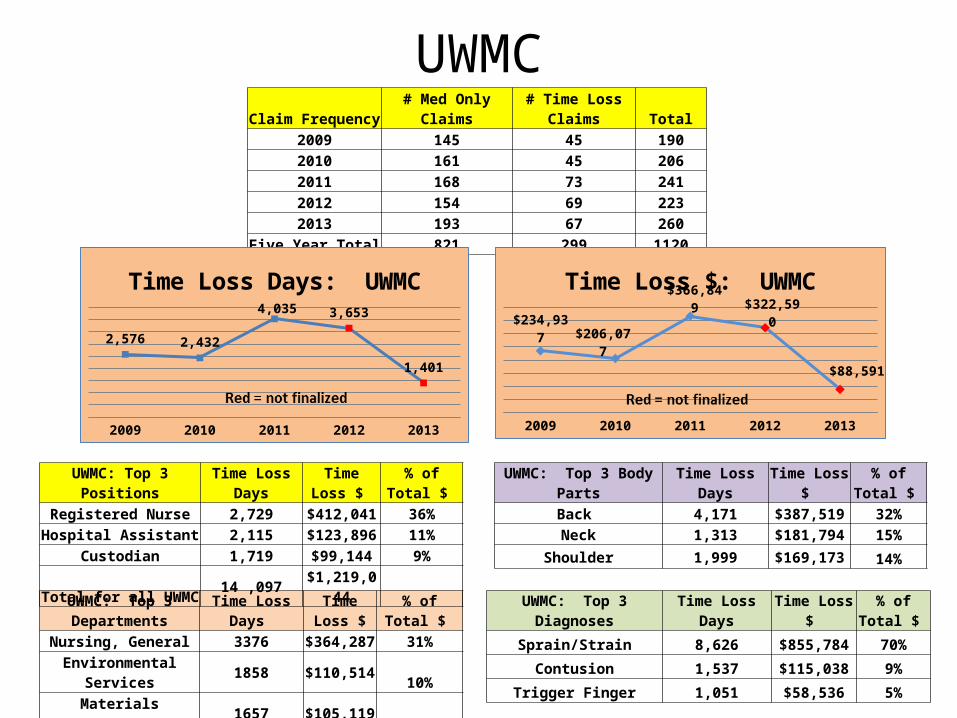
UWMCClaim Frequency # Med Only Claims # Time Loss Claims Total
2009 145 45 1902010 161 45 2062011 168 73 2412012 154 69 2232013 193 67 260
Five Year Total 821 299 1120
UWMC: Top 3 Diagnoses Time Loss Days Time Loss $ % of Total $
Sprain/Strain 8,626 $855,784 70%
Contusion 1,537 $115,038 9%
Trigger Finger 1,051 $58,536 5%
UWMC: Top 3 Body Parts Time Loss Days Time Loss $ % of Total $ Back 4,171 $387,519 32%Neck 1,313 $181,794 15%
Shoulder 1,999 $169,173 14%
UWMC: Top 3 Departments Time Loss Days Time Loss $ % of Total $
Nursing, General 3376 $364,287 31%Environmental Services 1858 $110,514 10%Materials Management 1657 $105,119 8%
UWMC: Top 3 Positions Time Loss Days Time Loss $ % of Total $ Registered Nurse 2,729 $412,041 36%Hospital Assistant 2,115 $123,896 11%
Custodian 1,719 $99,144 9%Total for all UWMC 14 ,097 $1,219,044
Red=not finalized
2009 2010 2011 2012 2013
2,576 2,432
4,035 3,653
1,401
Time Loss Days: UWMC
2009 2010 2011 2012 2013
$234,937$206,077
$366,849$322,590
$88,591
Time Loss $: UWMC
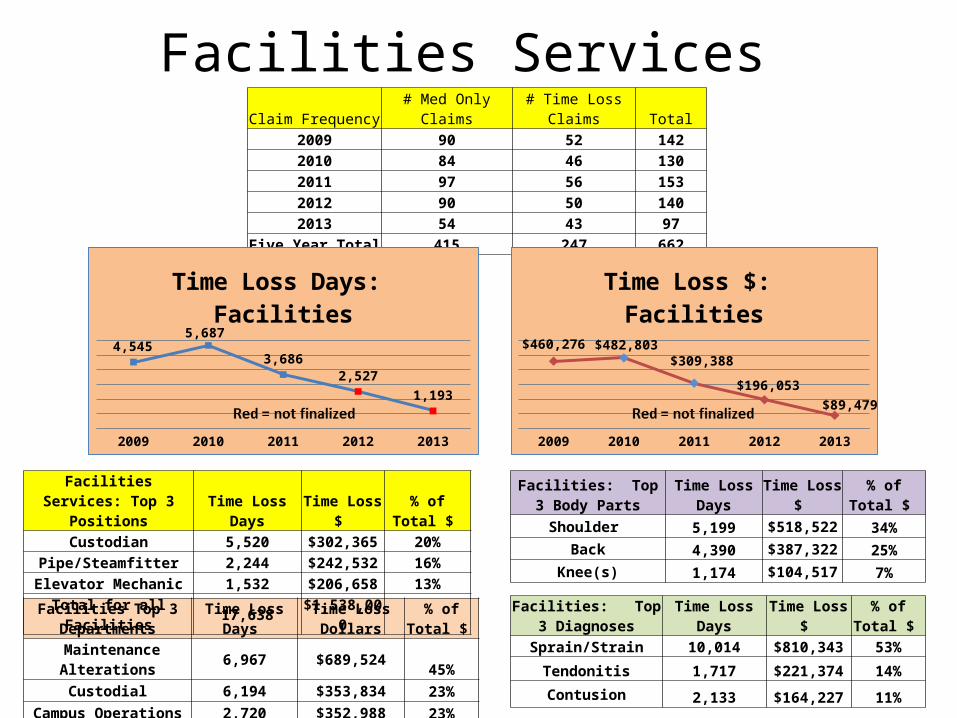
Facilities Services Claim Frequency # Med Only Claims # Time Loss Claims Total
2009 90 52 142
2010 84 46 1302011 97 56 1532012 90 50 1402013 54 43 97
Five Year Total 415 247 662
Facilities: Top 3 Diagnoses Time Loss Days Time Loss $ % of Total $
Sprain/Strain 10,014 $810,343 53%
Tendonitis 1,717 $221,374 14%Contusion 2,133 $164,227 11%
Facilities: Top 3 Body Parts Time Loss Days Time Loss $ % of Total $
Shoulder 5,199 $518,522 34%Back 4,390 $387,322 25%
Knee(s) 1,174 $104,517 7%
Facilities Top 3 Departments Time Loss Days Time Loss Dollars% of Total $
Maintenance Alterations 6,967 $689,524 45%Custodial 6,194 $353,834 23%
Campus Operations 2,720 $352,988 23%
Facilities Services: Top 3 Positions Time Loss Days Time Loss $ % of Total $ Custodian 5,520 $302,365 20%
Pipe/Steamfitter 2,244 $242,532 16%Elevator Mechanic 1,532 $206,658 13%
Total for all Facilities 17,638 $1,538,000
2009 2010 2011 2012 2013
4,545
5,687
3,686
2,527
1,193
Time Loss Days: Facilities
2009 2010 2011 2012 2013
$460,276 $482,803
$309,388
$196,053
$89,479
Time Loss $: Facilities
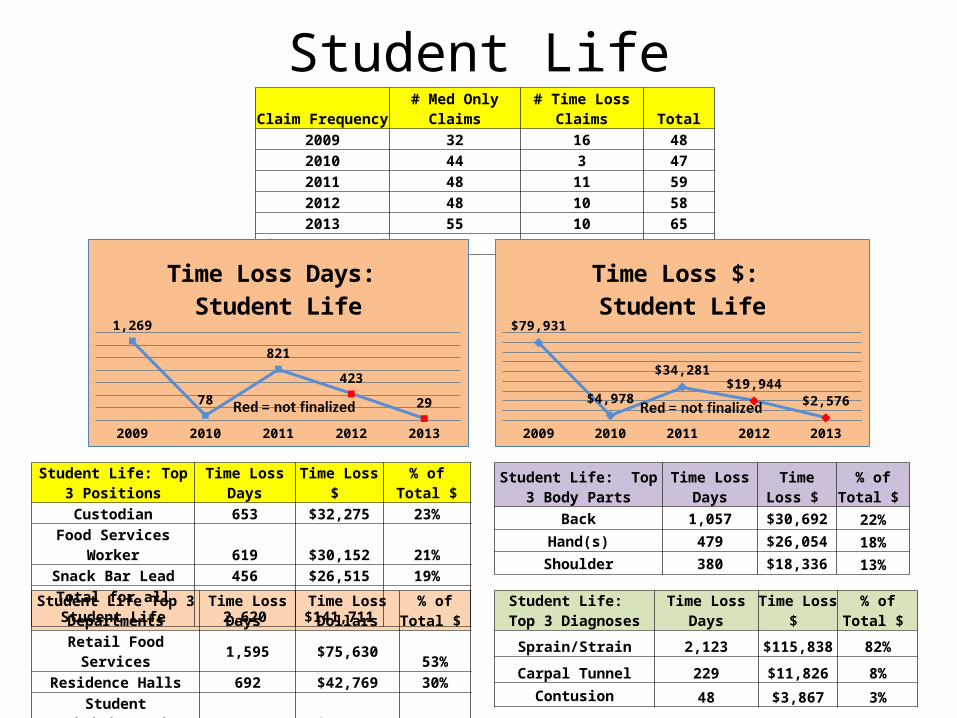
Student LifeClaim Frequency # Med Only Claims # Time Loss Claims Total
2009 32 16 482010 44 3 472011 48 11 592012 48 10 582013 55 10 65
Five Year Total 227 50 277
Student Life: Top 3 Diagnoses Time Loss Days Time Loss $ % of Total $
Sprain/Strain 2,123 $115,838 82%
Carpal Tunnel 229 $11,826 8%Contusion 48 $3,867 3%
Student Life: Top 3 Body Parts Time Loss Days Time Loss $ % of Total $ Back 1,057 $30,692 22%
Hand(s) 479 $26,054 18%Shoulder 380 $18,336 13%
Student Life Top 3 Departments Time Loss Days
Time Loss Dollars % of Total $
Retail Food Services 1,595 $75,630 53%Residence Halls 692 $42,769 30%
Student Activities/Union Facilities 189 $12,706 9%
Student Life: Top 3 Positions Time Loss Days Time Loss $ % of Total $Custodian 653 $32,275 23%
Food Services Worker 619 $30,152 21%Snack Bar Lead 456 $26,515 19%
Total for all Student Life 2,620 $141,711
2009 2010 2011 2012 2013
1,269
78
821
423
29
Time Loss Days: Student Life
2009 2010 2011 2012 2013
$79,931
$4,978
$34,281
$19,944
$2,576
Time Loss $: Student Life
What’s New In Workers’ Compensation
Workers’ Comp Forum Meetings
• Quarterly meetings for those who partner with us on Workers’ Compensation on relevant topics: – Education on medical and disability issues– New developments impacting Workers’
Compensation– New ideas and initiatives– Guest speakers
• Includes HR, Employee Health, Key Departments, Providers, Occupational Health, Risk Management, EH&S, L&I, and others – the forum is open!
• Email us to be included on the distribution list for invitations
Claims Fraud
• Partnering with L&I’s Fraud Prevention Program• Publicizing L&I’s Claim Fraud Reporting to the UW
Community Hotline: 1-888-811-5974, www.fraud.lni.wa.gov.
• Complementing L&I’s fraud investigation work with our own background checks on time loss claims and other claims with red flags
• UW Claims Fraud Brochure• Website material on Claims Fraud http://
f2.washington.edu/treasury/riskmgmt/wc• Education on Red Flags to watch for!
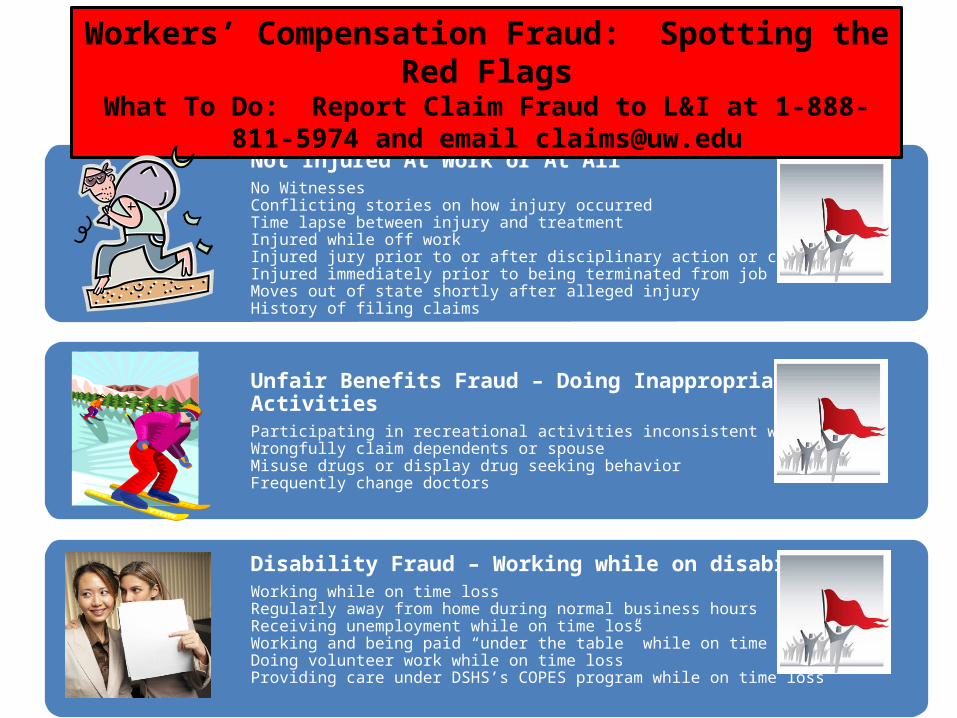
Not Injured At Work or At AllNo WitnessesConflicting stories on how injury occurredTime lapse between injury and treatmentInjured while off workInjured jury prior to or after disciplinary action or change in jobInjured immediately prior to being terminated from jobMoves out of state shortly after alleged injuryHistory of filing claims
Unfair Benefits Fraud – Doing Inappropriate ActivitiesParticipating in recreational activities inconsistent with injuryWrongfully claim dependents or spouseMisuse drugs or display drug seeking behaviorFrequently change doctors
Disability Fraud – Working while on disabilityWorking while on time lossRegularly away from home during normal business hoursReceiving unemployment while on time lossWorking and being paid “under the table” while on time lossDoing volunteer work while on time lossProviding care under DSHS’s COPES program while on time loss
Workers’ Compensation Fraud: Spotting the Red FlagsWhat To Do: Report Claim Fraud to L&I at 1-888-811-5974 and email
SHIP Grant Return-to-Work Training Module and Research Study
• Safety & Health Investment Projects Grant granted by L&I• Participation with Environmental Health’s research team led
by Dr. June Spector• Created and Implemented a Training Module for the
injury/return to work process for supervisors and managers, piloted at Harborview.
• Surveys before and after to determine effectiveness and impact on time loss (ongoing)
• Possible future project for similar module for injured workers
UW Claims SpecializationWe have designated Claims Specialists assigned to major Divisions who specialize in helping find light duty and working with these areas on return-to-work. Please contact any of us to help you at any time.
• Wendy Winslow-Nason: UWMC 616 7510, [email protected]
• Pam Nathan: HMC (on HMC campus every Thursdays), Health Sciences and SOM221 1679, [email protected]
• Elena Williams: Facilities Services, Student Life, all Upper Campus, Tacoma, and Bothell 685 4740, [email protected]
• Linda Chihara: Program Coordinator for all543 0183, [email protected]
• Shari Spung, Director, Claims Services616 3455, [email protected]