Embed Size (px)
Citation preview
Workers’ Compensation In Wisconsin
Employers’ Costs And Workers’ Outcomes

Today’s Outline
Introduce WCRI as a resource for public officials in Wisconsin
Summarize major findings for WI from many WCRI studiesEmployer costs and cost driversWorker outcomesHow WI compares to other statesWhat are the trends in WI
About WCRI
Not-for-profit public policy research organization
Diverse membershipEmployers, governments, insurers,
managed care firms, healthcare providers, labor
Focus on benefit delivery system, not insurance market & pricing issues
Not make recommendations nor take positions on issues
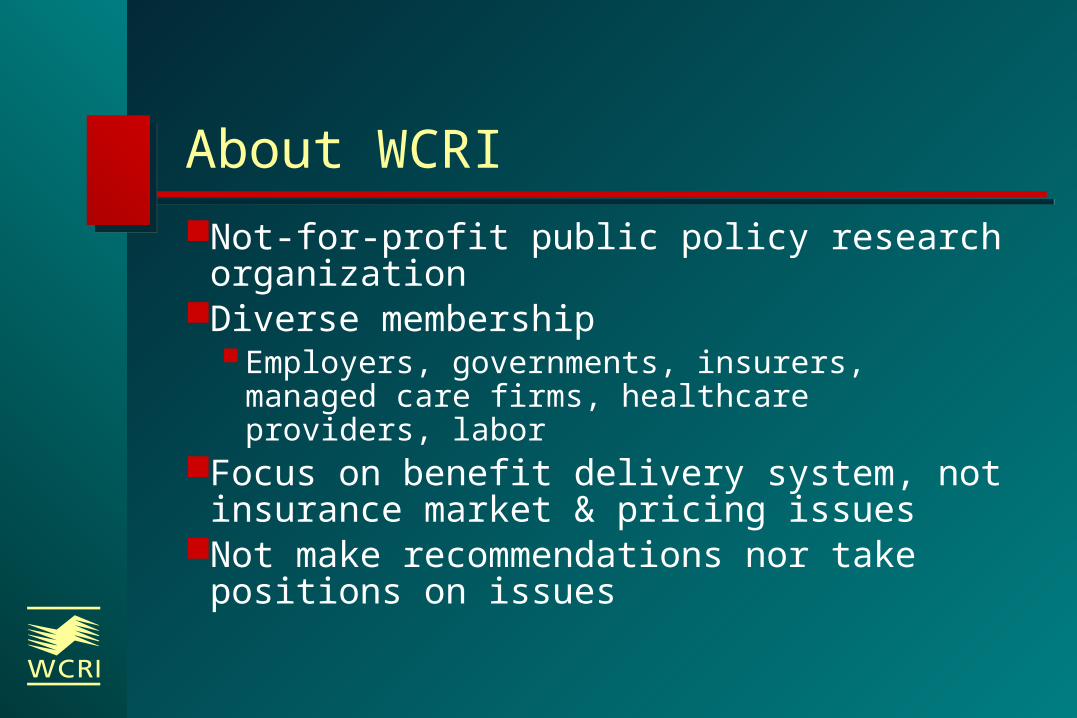
WI Workers’ Compensation System: A National Perspective
Nationally, Wisconsin WC historically seen as very well-functioning Costs to WI employers lower than average Worker outcomes better than average Typical for most statutory income benefits
Historically stable system Advisory committee process/legislative discipline
controls costs and improves worker outcomesState regulatory approach
High trust, active monitoring

Major Findings From WCRI Studies
Worker outcomes better than average
Cost per claim lower than average Medical costs high and growing
rapidlyMedical prices high and growing rapidlyWI is 1 of 6 states with no formal state
fee schedule
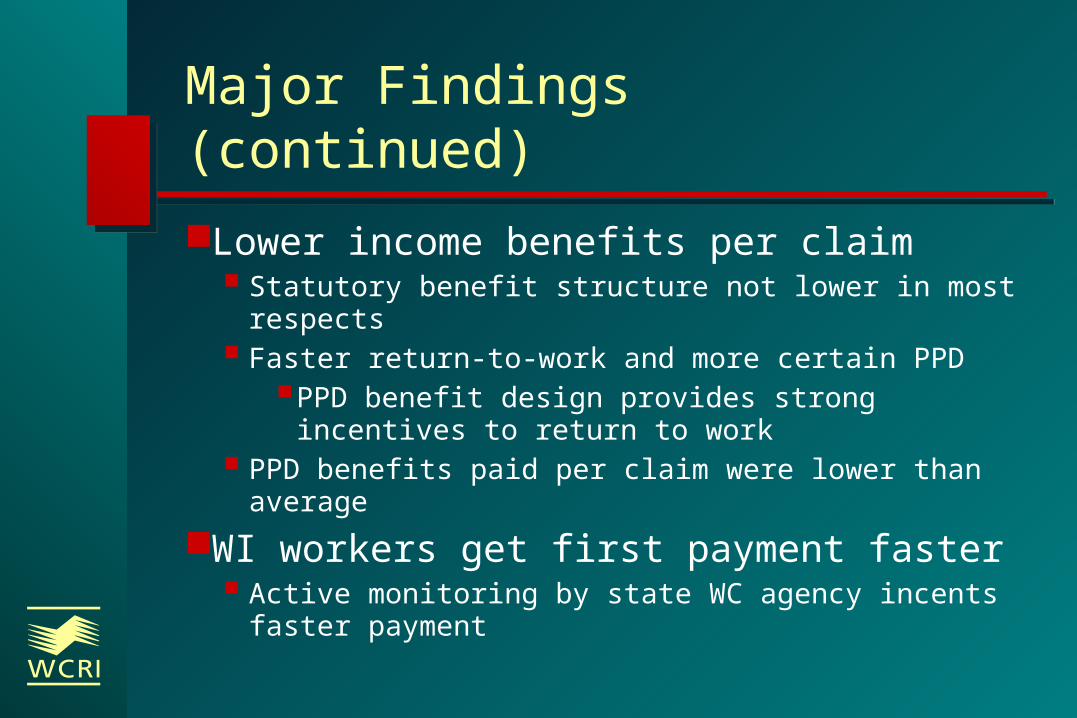
Major Findings (continued)
Lower income benefits per claim Statutory benefit structure not lower in most
respects Faster return-to-work and more certain PPD
PPD benefit design provides strong incentives to return to work
PPD benefits paid per claim were lower than average
WI workers get first payment faster Active monitoring by state WC agency incents faster
payment
$0
$200
$400
$600
$800
$1,000
$1,200
$1,400
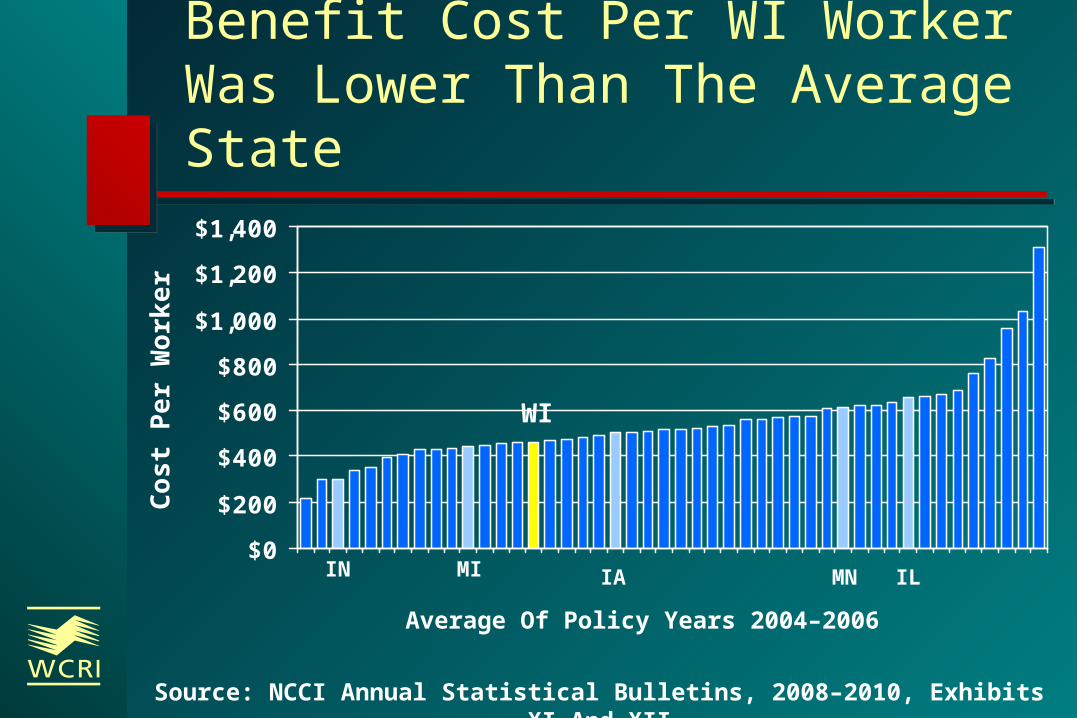
Benefit Cost Per WI Worker Was Lower Than The Average State
Average Of Policy Years 2004–2006
Source: NCCI Annual Statistical Bulletins, 2008–2010, Exhibits XI And XII
WI
Cost
Per
Work
er
ILMNIAMIIN
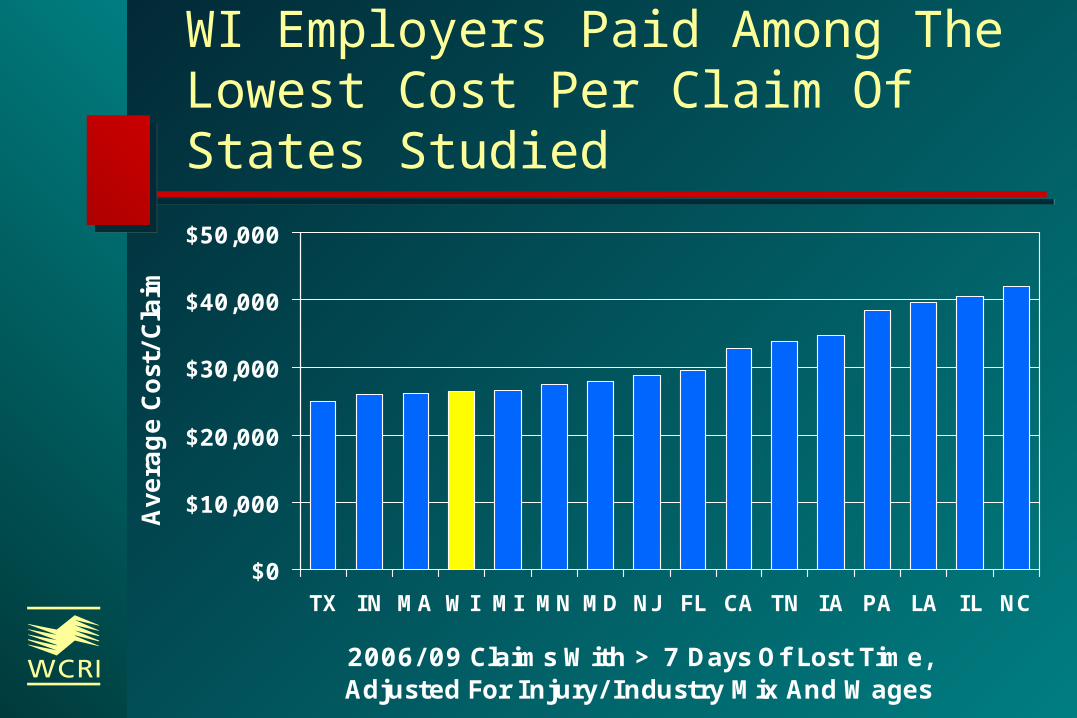
WI Employers Paid Among The Lowest Cost Per Claim Of States Studied
$0
$10,000
$20,000
$30,000
$40,000
$50,000
TX IN MA WI MI MN MD NJ FL CA TN IA PA LA IL NC
2006/ 09 Claims With > 7 Days Of Lost Time, Adjusted For Injury/ Industry Mix And Wages
Ave
rage C
ost
/Cla
im
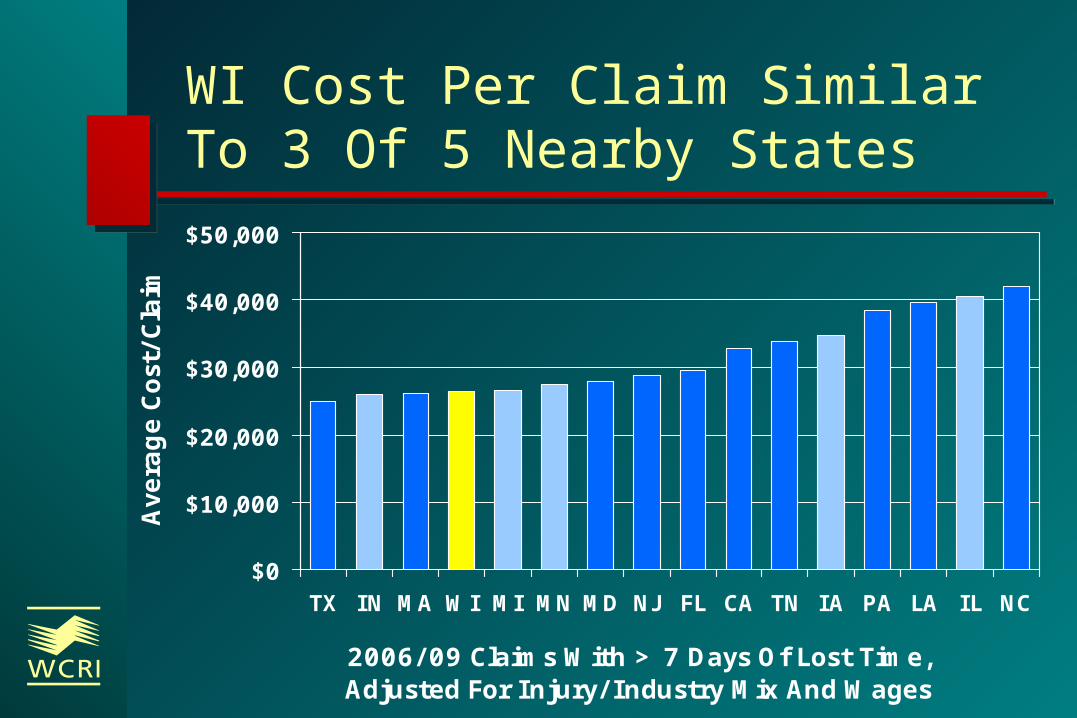
WI Cost Per Claim Similar To 3 Of 5 Nearby States
$0
$10,000
$20,000
$30,000
$40,000
$50,000
TX IN MA WI MI MN MD NJ FL CA TN IA PA LA IL NC
2006/ 09 Claims With > 7 Days Of Lost Time, Adjusted For Injury/ Industry Mix And Wages
Ave
rage C
ost
/Cla
im
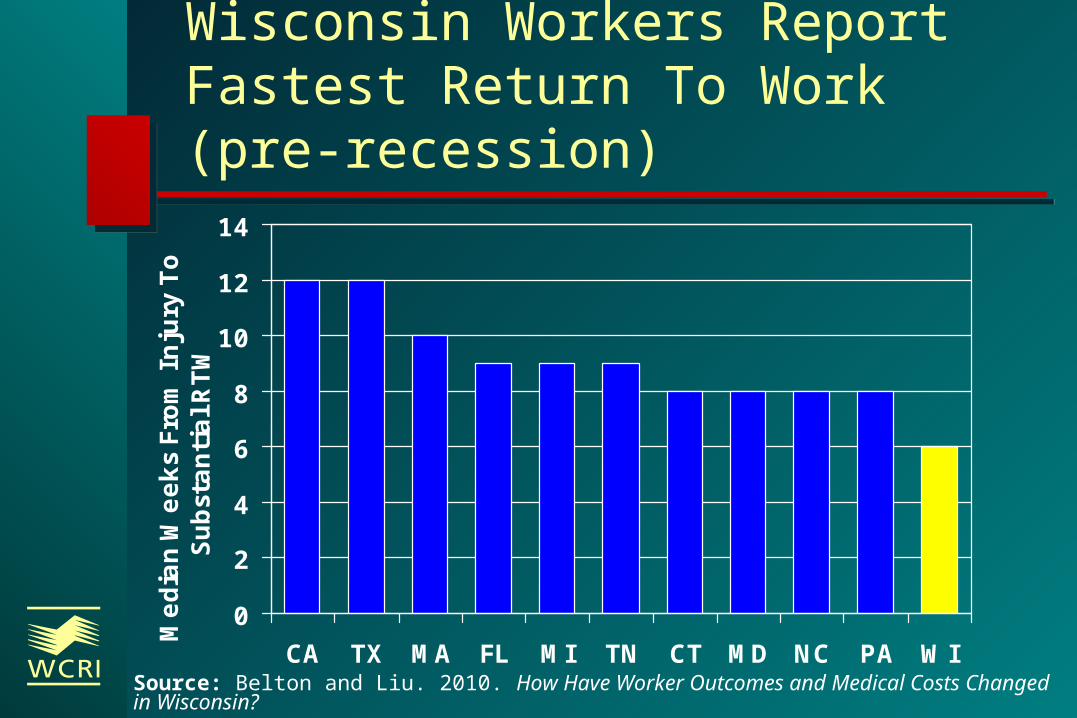
Wisconsin Workers Report Fastest Return To Work (pre-recession)
0
2
4
6
8
10
12
14
CA TX MA FL MI TN CT MD NC PA WI
Media
n W
eeks
From
Inju
ry T
o
Subst
anti
al R
TW
Source: Belton and Liu. 2010. How Have Worker Outcomes and Medical Costs Changed in Wisconsin?

WI Workers’ Recovery Of Health Better Than Most States Studied
0
5
10
15
20
25
CA TN FL NC MD TX CT MI WI PA MA
Reco
very
Of H
ealt
h
(Poin
ts O
n S
F-12®
Sca
le)
Source: Belton and Liu. 2010. How Have Worker Outcomes and Medical Costs Changed in Wisconsin?
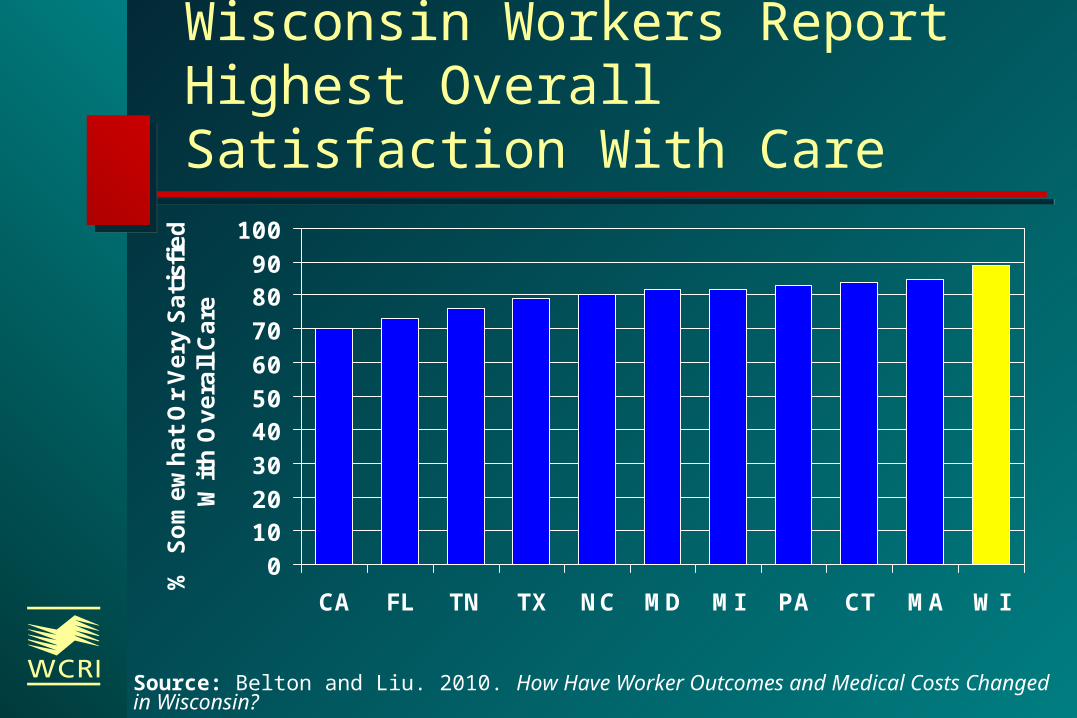
Wisconsin Workers Report Highest Overall Satisfaction With Care
0102030405060708090
100
CA FL TN TX NC MD MI PA CT MA WI
% S
om
ew
hat
Or
Very
Sati
sfied
Wit
h O
vera
ll C
are
Source: Belton and Liu. 2010. How Have Worker Outcomes and Medical Costs Changed in Wisconsin?
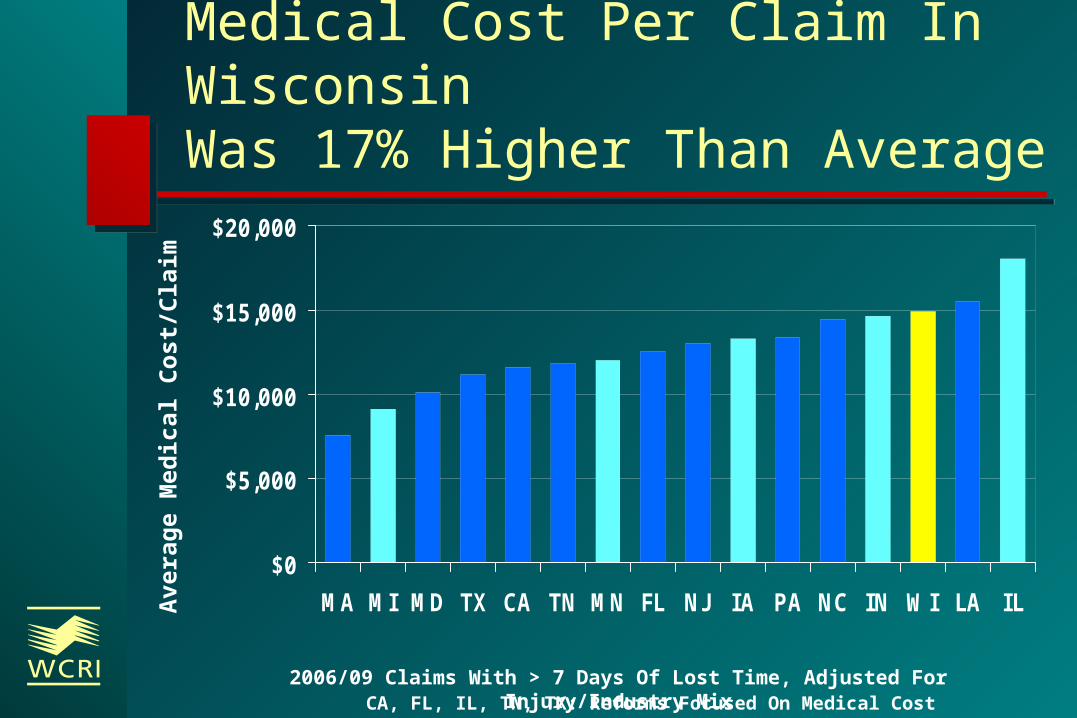
Medical Cost Per Claim In WisconsinWas 17% Higher Than Average
$0
$5,000
$10,000
$15,000
$20,000
MA MI MD TX CA TN MN FL NJ IA PA NC IN WI LA ILAvera
ge M
ed
ical C
ost/
Cla
im
2006/09 Claims With > 7 Days Of Lost Time, Adjusted For Injury/Industry MixCA, FL, IL, TN, TX: Reforms Focused On Medical Cost
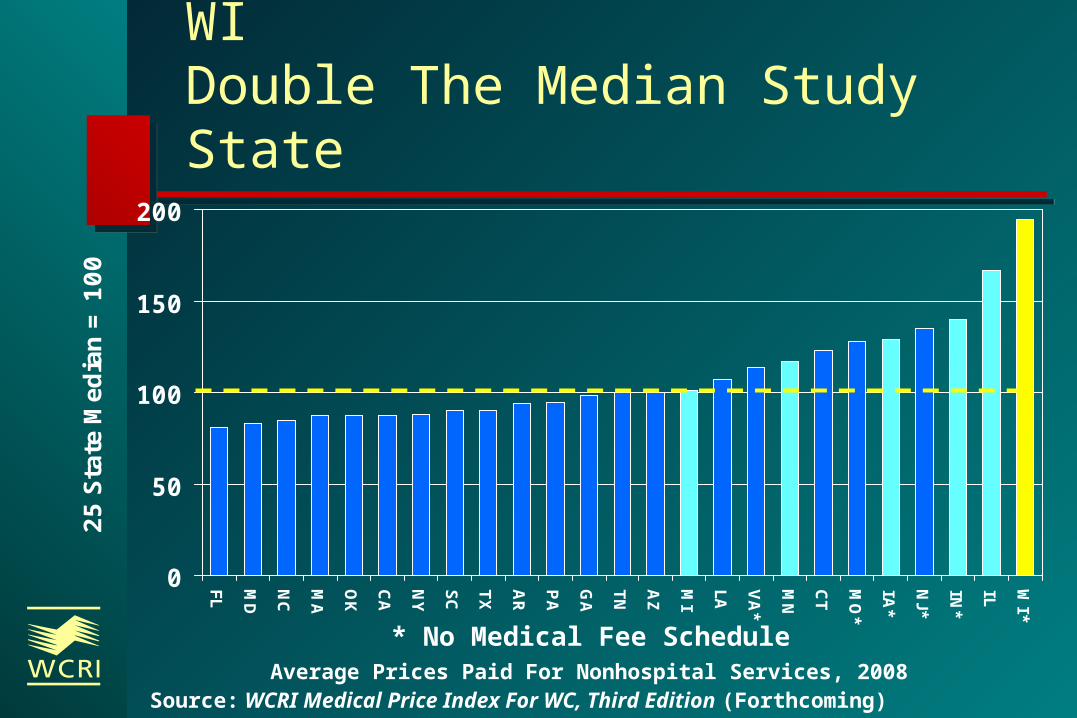
Nonhospital Prices Paid In WI Double The Median Study State
0
50
100
150
200
FL MD
NC
MA
OK
CA
NY
SC
TX
AR
PA
GA
TN
AZ
MI
LA VA*
MN
CT
MO
*
IA*
NJ*
IN*
IL WI*
25 S
tate
Med
ian =
100
Source: WCRI Medical Price Index For WC, Third Edition (Forthcoming)Average Prices Paid For Nonhospital Services, 2008
* No Medical Fee Schedule

Highest Prices Paid In WI For Common “Established Patient Office Visit”
$0
$20
$40
$60
$80
$100
$120
NY NC CA MA OK FL PA AZ MD LA SC NJ TX GA AR IN MO CT MI VA IA IL TN MN WI
Ave
rage P
rice
/Serv
ice I
n 2
008
* Non Fee Schedule States
** **
Prices Paid For Nonhospital Services, 2008
CPT 99213
Source: WCRI Medical Price Index For WC, Third Edition (Forthcoming)
**
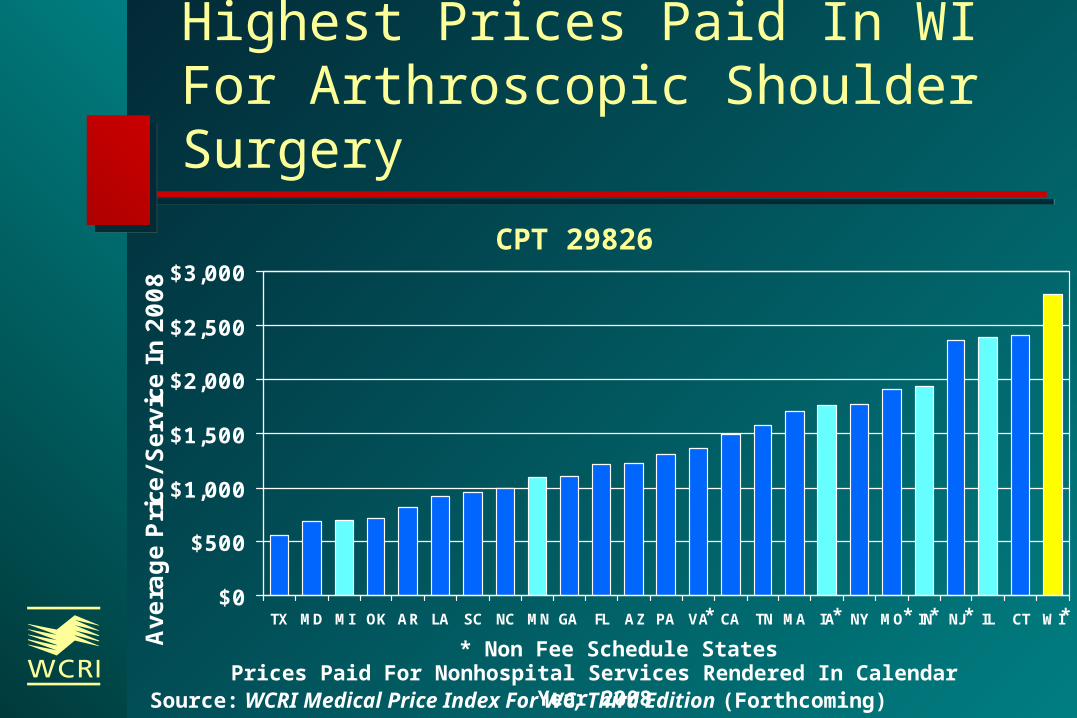
Highest Prices Paid In WI For Arthroscopic Shoulder Surgery
$0
$500
$1,000
$1,500
$2,000
$2,500
$3,000
TX MD MI OK AR LA SC NC MN GA FL AZ PA VA CA TN MA IA NY MO IN NJ IL CT WI
Ave
rage P
rice
/Serv
ice I
n 2
008
* Non Fee Schedule States
** **
Prices Paid For Nonhospital Services Rendered In Calendar Year 2008
CPT 29826
Source: WCRI Medical Price Index For WC, Third Edition (Forthcoming)
**
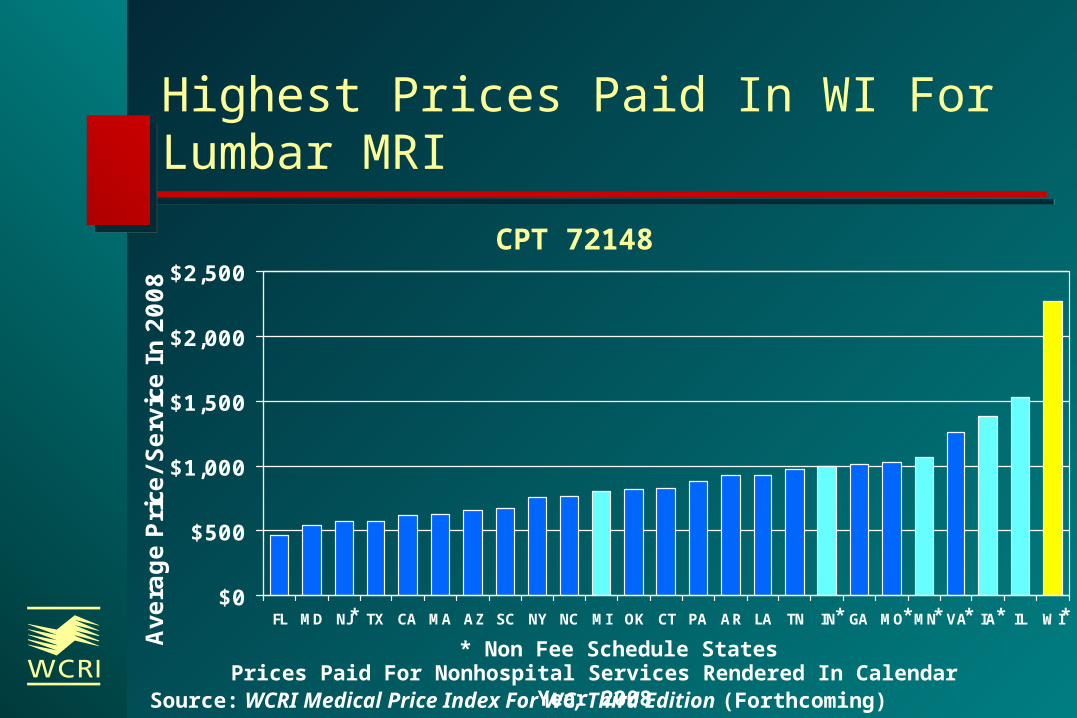
Highest Prices Paid In WI For Lumbar MRI
$0
$500
$1,000
$1,500
$2,000
$2,500
FL MD NJ TX CA MA AZ SC NY NC MI OK CT PA AR LA TN IN GA MO MN VA IA IL WI
Ave
rage P
rice
/Serv
ice I
n 2
008
* Non Fee Schedule States
** **
Prices Paid For Nonhospital Services Rendered In Calendar Year 2008
CPT 72148
Source: WCRI Medical Price Index For WC, Third Edition (Forthcoming)
** *
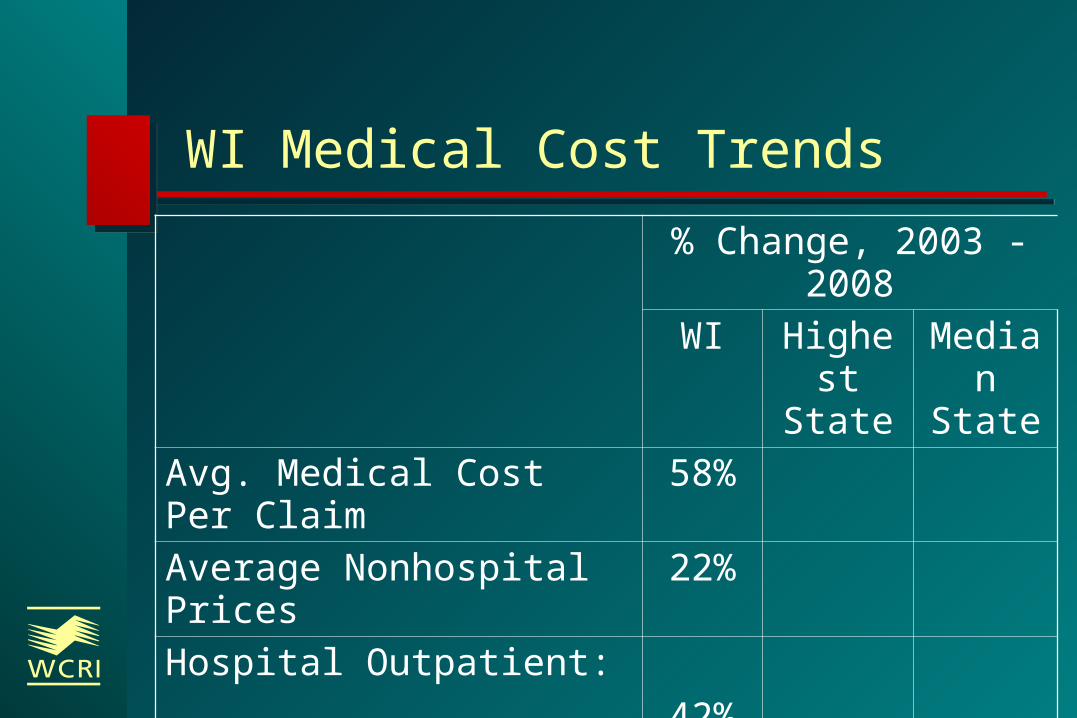
WI Medical Cost Trends
% Change, 2003 - 2008
WI Highest State
Median
StateAvg. Medical Cost Per Claim
58%
Average Nonhospital Prices
22%
Hospital Outpatient: Average Price Per Service
42%
Hospital Inpatient: Average Payment Per Claim
50%

WI Medical Cost Per Claim Grew More Rapidly Than Other States
% Change, 2003 - 2008
WI Highest State
Median
StateAvg. Medical Cost Per Claim
58% 58% 38%
Average Nonhospital Prices
22%
Hospital Outpatient: Average Price Per Service
42%
Hospital Inpatient: Average Payment Per Claim
50%
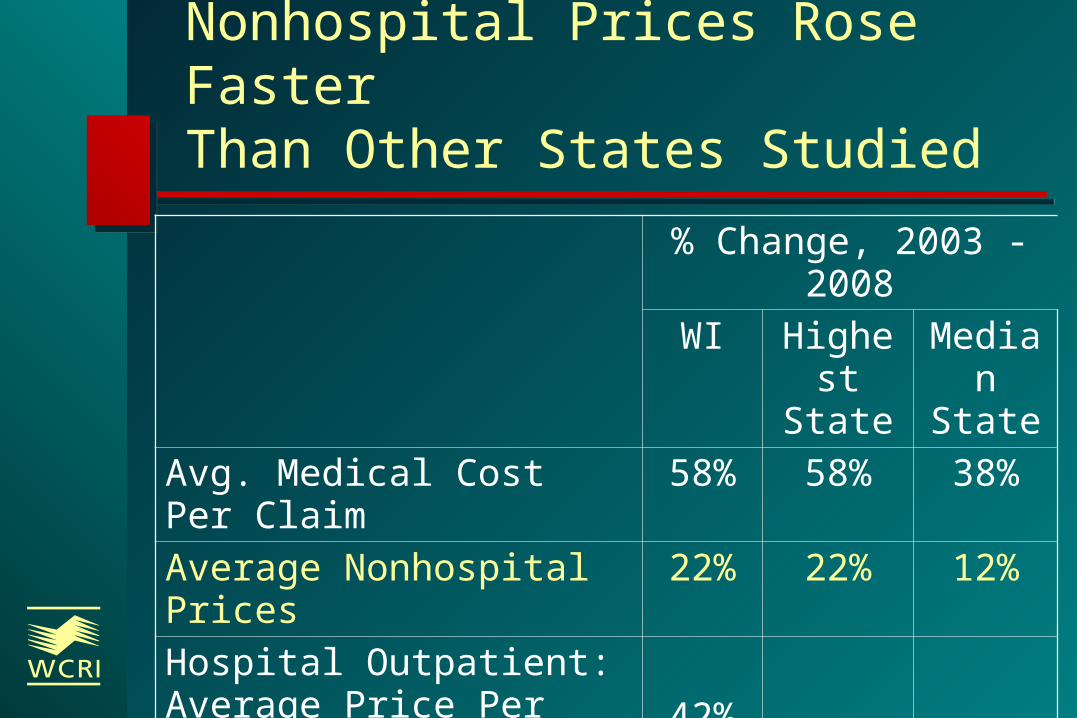
Nonhospital Prices Rose Faster Than Other States Studied
% Change, 2003 - 2008
WI Highest State
Median
StateAvg. Medical Cost Per Claim
58% 58% 38%
Average Nonhospital Prices
22% 22% 12%
Hospital Outpatient: Average Price Per Service
42%
Hospital Inpatient: Average Payment Per Claim
50%
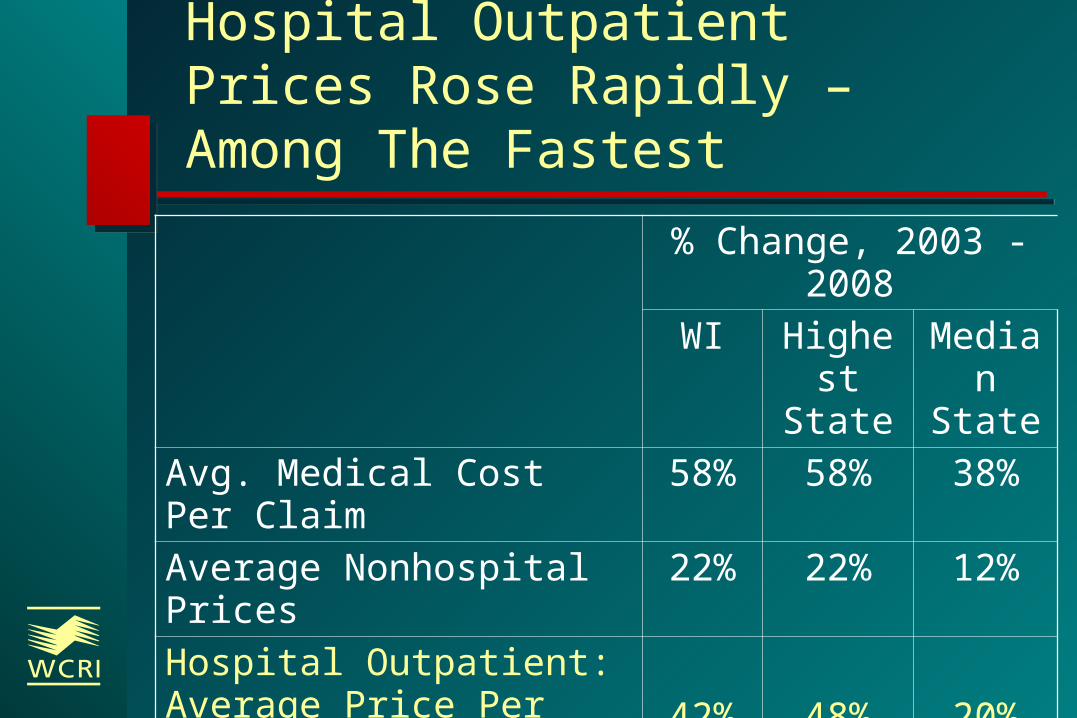
Hospital Outpatient Prices Rose Rapidly – Among The Fastest
% Change, 2003 - 2008
WI Highest State
Median
StateAvg. Medical Cost Per Claim
58% 58% 38%
Average Nonhospital Prices
22% 22% 12%
Hospital Outpatient: Average Price Per Service
42% 48% 20%
Hospital Inpatient: Average Payment Per Claim
50%
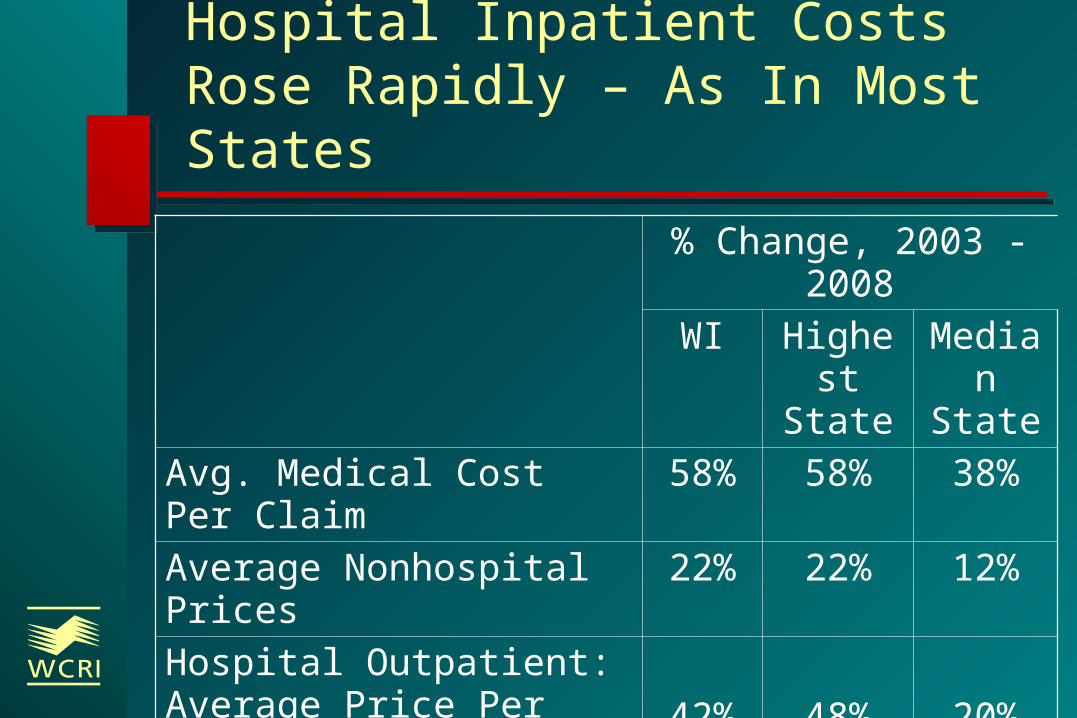
Hospital Inpatient Costs Rose Rapidly – As In Most States
% Change, 2003 - 2008
WI Highest State
Median
StateAvg. Medical Cost Per Claim
58% 58% 38%
Average Nonhospital Prices
22% 22% 12%
Hospital Outpatient: Average Price Per Service
42% 48% 20%
Hospital Inpatient: Average Payment Per Claim
50% 83% 58%
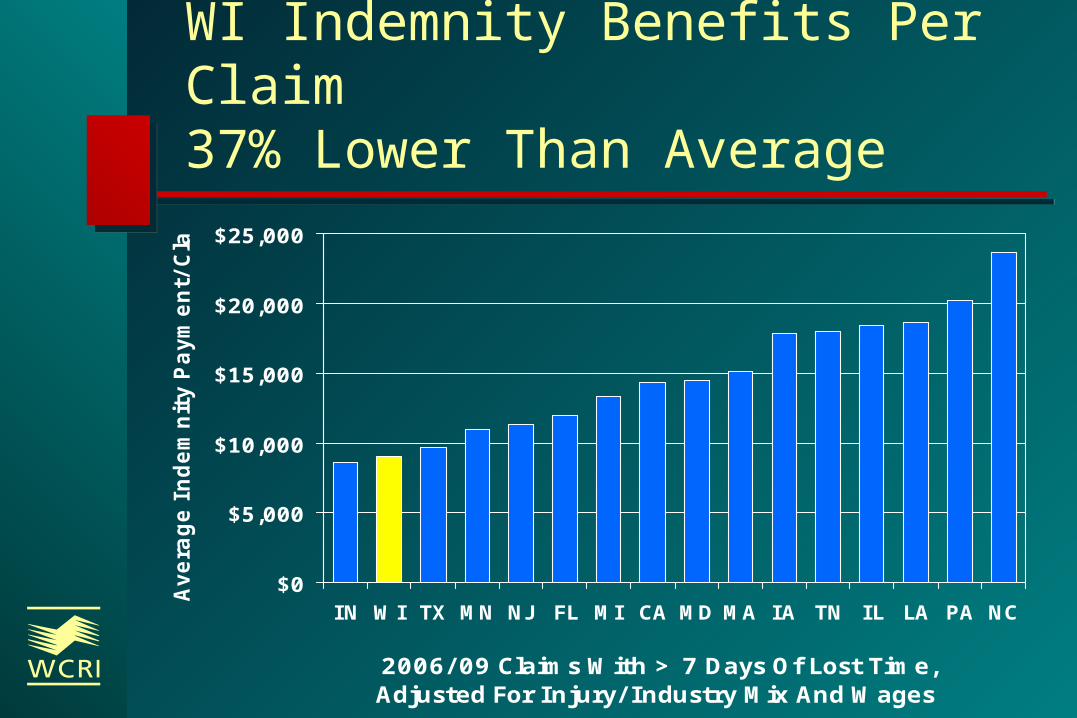
WI Indemnity Benefits Per Claim 37% Lower Than Average
$0
$5,000
$10,000
$15,000
$20,000
$25,000
IN WI TX MN NJ FL MI CA MD MA IA TN IL LA PA NC
2006/ 09 Claims With > 7 Days Of Lost Time, Adjusted For Injury/ Industry Mix And Wages
Avera
ge I
ndem
nit
y P
aym
ent/
Cla
im
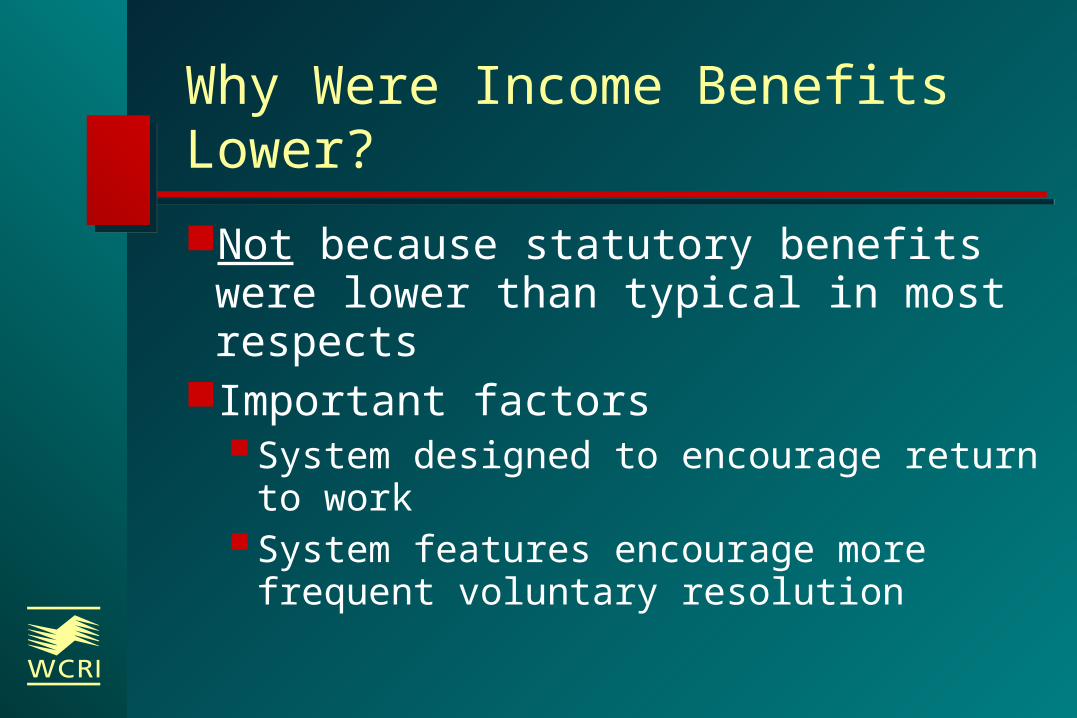
Why Were Income Benefits Lower?
Not because statutory benefits were lower than typical in most respects
Important factorsSystem designed to encourage return to
workSystem features encourage more
frequent voluntary resolution
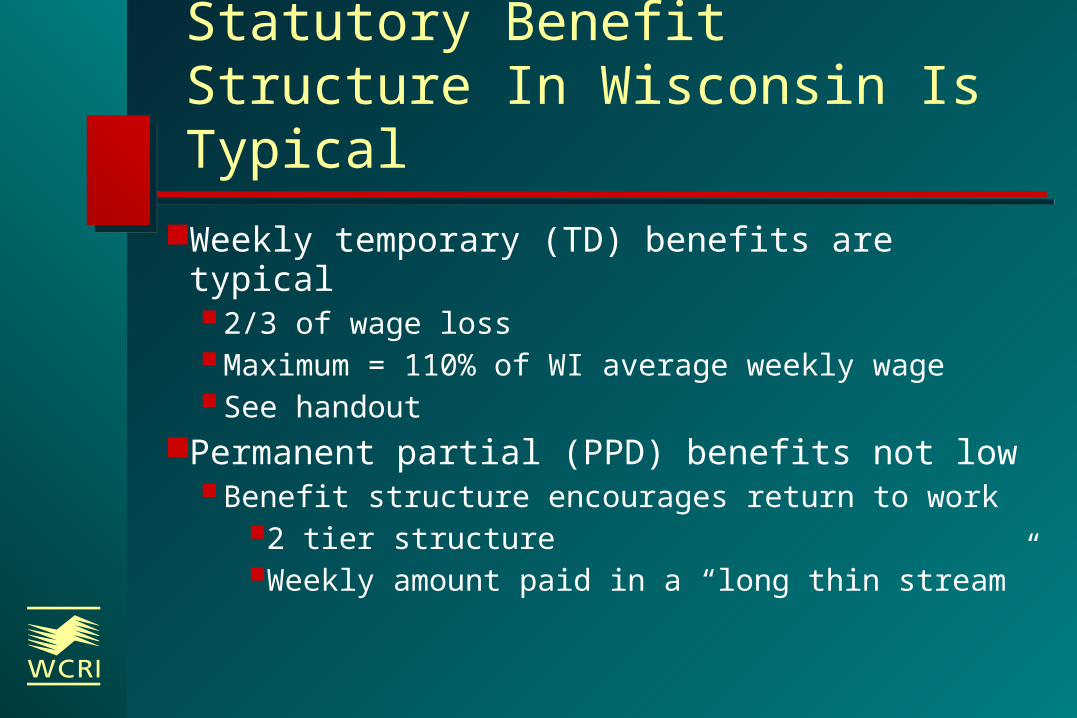
Statutory Benefit Structure In Wisconsin Is Typical
Weekly temporary (TD) benefits are typical2/3 of wage loss Maximum = 110% of WI average weekly wageSee handout
Permanent partial (PPD) benefits not lowBenefit structure encourages return to work
2 tier structureWeekly amount paid in a “long thin stream”
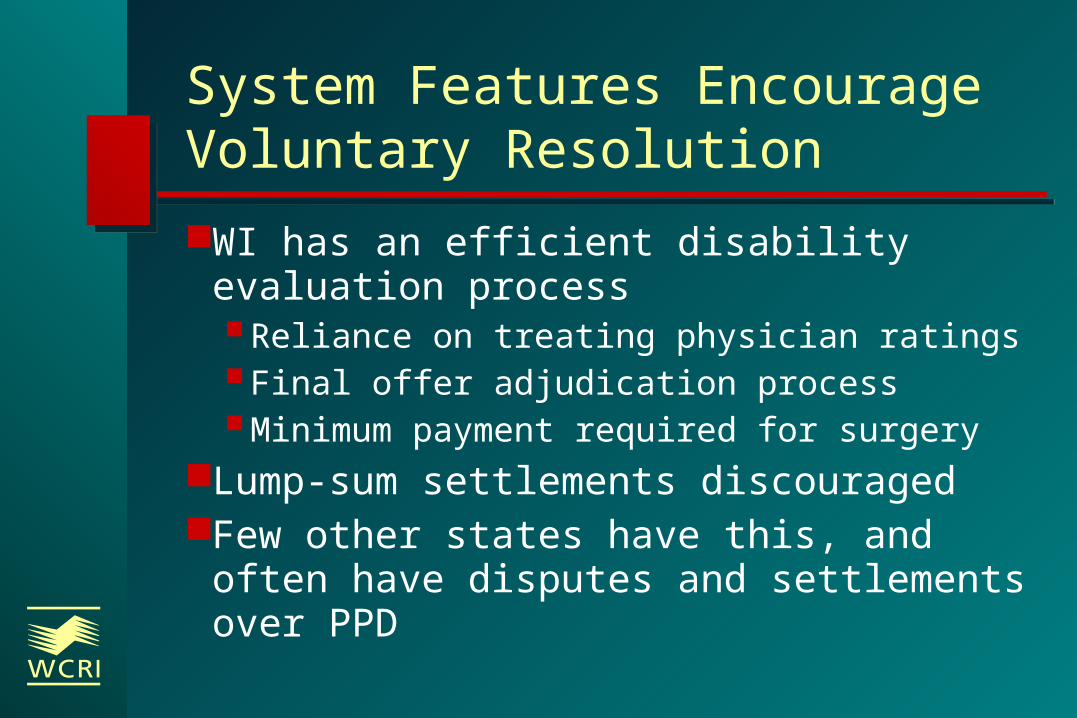
System Features Encourage Voluntary Resolution
WI has an efficient disability evaluation process Reliance on treating physician ratingsFinal offer adjudication processMinimum payment required for surgery
Lump-sum settlements discouragedFew other states have this, and often
have disputes and settlements over PPD
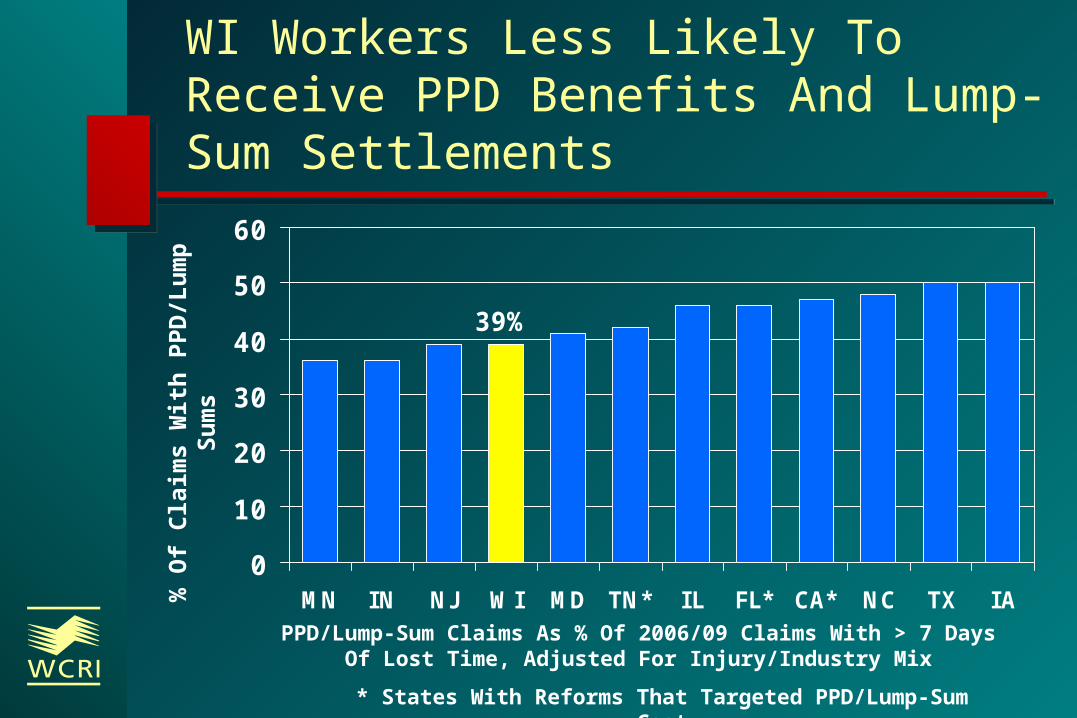
WI Workers Less Likely To Receive PPD Benefits And Lump-Sum Settlements
39%
0
10
20
30
40
50
60
MN IN NJ WI MD TN* IL FL* CA* NC TX IA
PPD/Lump-Sum Claims As % Of 2006/09 Claims With > 7 Days Of Lost Time, Adjusted For Injury/Industry Mix
% O
f C
laim
s W
ith
PP
D/L
um
p
Su
ms
* States With Reforms That Targeted PPD/Lump-Sum Cost
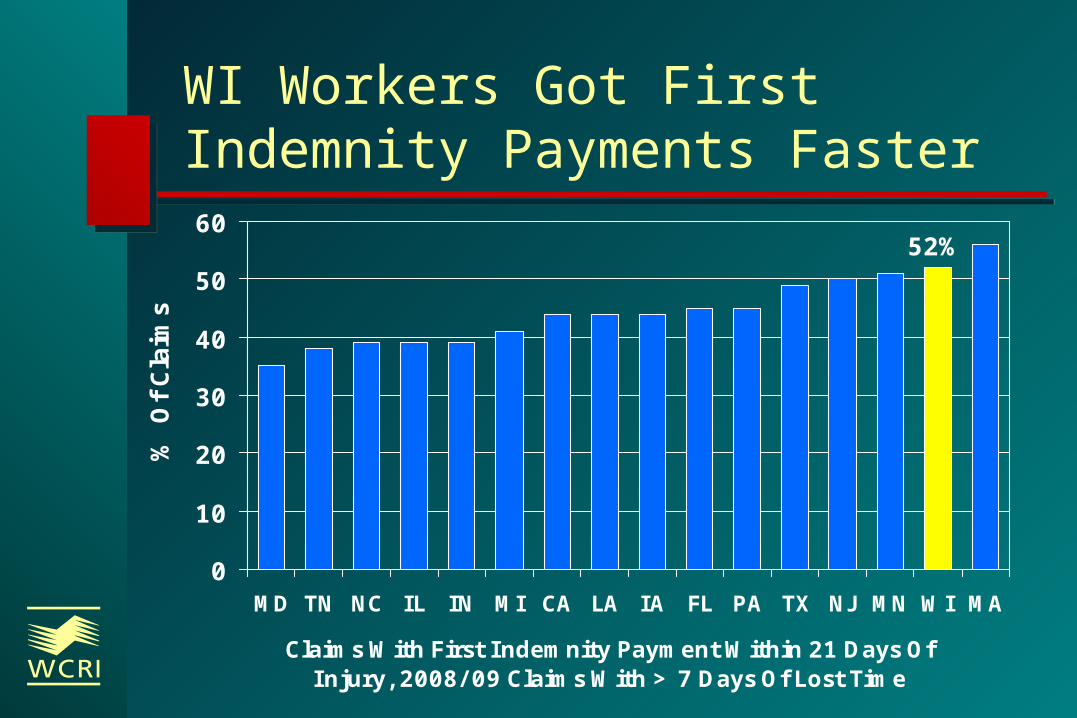
WI Workers Got First Indemnity Payments Faster
52%
0
10
20
30
40
50
60
MD TN NC IL IN MI CA LA IA FL PA TX NJ MN WI MA
Claims With First Indemnity Payment Within 21 Days Of Injury, 2008/ 09 Claims With > 7 Days Of Lost Time
% O
f Cla
ims

WI Workers’ Compensation System: A National Perspective
Nationally, Wisconsin WC historically seen as very well-functioning Costs to WI employers lower than average Worker outcomes better than average Typical for most statutory income benefits
Historically stable system Advisory committee process/legislative discipline
controls costs and improves worker outcomesState regulatory approach
High trust, active monitoring
Major Findings From WCRI Studies
Worker outcomes better than average
Cost per claim lower than average Medical costs high and growing
rapidlyMedical prices high and growing rapidlyWI is 1 of 6 states with no formal state
fee schedule

Major Findings (continued)
Lower income benefits per claim Statutory benefit structure not lower in most
respects Faster return-to-work and more certain PPD
PPD benefit design provides strong incentives to return to work
PPD benefits paid per claim were lower than average
WI workers get first payment faster Active monitoring by state WC agency incents faster
payment