Embed Size (px)
Citation preview
Benefits, Costs, and Coverage
October 2019
Washington, DC
Workers’ Compensation:
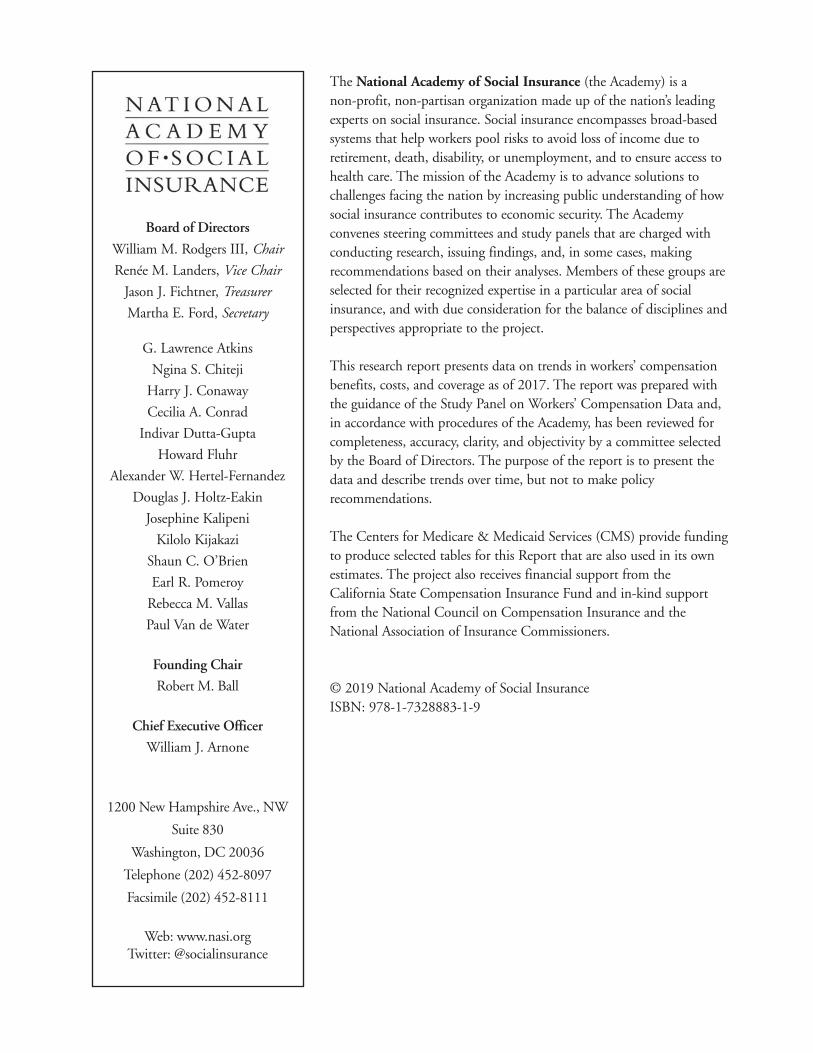
The National Academy of Social Insurance (the Academy) is a non-profit, non-partisan organization made up of the nation’s leading experts on social insurance. Social insurance encompasses broad-based systems that help workers pool risks to avoid loss of income due to retirement, death, disability, or unemployment, and to ensure access to health care. The mission of the Academy is to advance solutions to challenges facing the nation by increasing public understanding of how social insurance contributes to economic security. The Academy convenes steering committees and study panels that are charged with conducting research, issuing findings, and, in some cases, making recommendations based on their analyses. Members of these groups are selected for their recognized expertise in a particular area of social insurance, and with due consideration for the balance of disciplines and perspectives appropriate to the project. This research report presents data on trends in workers’ compensation benefits, costs, and coverage as of 2017. The report was prepared with the guidance of the Study Panel on Workers’ Compensation Data and, in accordance with procedures of the Academy, has been reviewed for completeness, accuracy, clarity, and objectivity by a committee selected by the Board of Directors. The purpose of the report is to present the data and describe trends over time, but not to make policy recommendations. The Centers for Medicare & Medicaid Services (CMS) provide funding to produce selected tables for this Report that are also used in its own estimates. The project also receives financial support from the California State Compensation Insurance Fund and in-kind support from the National Council on Compensation Insurance and the National Association of Insurance Commissioners. © 2019 National Academy of Social Insurance ISBN: 978-1-7328883-1-9
Board of Directors
William M. Rodgers III, Chair
Renée M. Landers, Vice Chair
Jason J. Fichtner, Treasurer
Martha E. Ford, Secretary
G. Lawrence Atkins
Ngina S. Chiteji
Harry J. Conaway
Cecilia A. Conrad
Indivar Dutta-Gupta
Howard Fluhr
Alexander W. Hertel-Fernandez
Douglas J. Holtz-Eakin
Josephine Kalipeni
Kilolo Kijakazi
Shaun C. O’Brien
Earl R. Pomeroy
Rebecca M. Vallas
Paul Van de Water
Founding Chair
Robert M. Ball
Chief Executive Officer
William J. Arnone
1200 New Hampshire Ave., NW
Suite 830
Washington, DC 20036
Telephone (202) 452-8097
Facsimile (202) 452-8111
Web: www.nasi.org
Twitter: @socialinsurance
Workers’ Compensation:
Benefits, Costs, and Coverage (2017 data)
by
Elaine Weiss, Griffin Murphy, and Leslie I. Boden
with advice from the
Study Panel on Workers’ Compensation Data
Washington, DC
October 2019

Workers’ Compensation: Benefits, Costs, and Coverage • i
Workers’ compensation provides funding for medical care, rehabilitation, and cash benefits for workers who are injured on the job or who contract work-related illnesses. The program also pays benefits to families of workers who die of work-related injuries or illnesses. The programs were established by state statute or within state constitutions beginning in 1911, before most federal social insurance programs were enacted. Unlike most other U.S. social insur-ance programs, workers’ compensation is primarily a state program. (As described below, a number of federal programs, such as the Longshore and Black Lung funds, insure workers in specific occupations.) No federal laws set standards for the state workers’ compensation programs or require comprehensive reporting of workers’ compensation data, however, nor is there any federal financing of these state programs. The lack of uniform federal standards or reporting requirements for state workers’ compensation pro-grams makes it difficult to provide national estimates based on uniform definitions of amounts of benefits paid, costs to employers, and numbers of workers covered. In order to produce national summary sta-tistics on the program, it is necessary to compile data from various sources. Until 1995, the U.S. Social Security Administration (SSA) produced the only comprehensive national data on workers’ compensation benefits, costs, and coverage, with annual estimates dating back to 1946. SSA discontinued the series in 1995 and the National Academy of Social Insurance (the Academy) assumed the task of reporting national data on workers’ compensation in 1997. The Academy published its first report that year and has produced the report annually ever since. This is the Academy’s 22nd annual report on work-ers’ compensation benefits, costs, and coverage. This report presents new data on state and federal work-ers’ compensation programs for 2017 and updated estimates for 2013-2016. The revised estimates in this report replace estimates in the Academy’s prior reports. The Academy and its expert advisors are continually seeking ways to improve the report and to adapt esti-mation methods to track new developments in
workers’ compensation programs. Detailed descrip-tions of the methods used to produce the estimates in this report are available online at www.nasi.org/research/workers-compensation. Despite the Academy’s continued efforts to improve the quality of its estimates, there are limitations to the data which we acknowledge in the report. It is important to note, for example, that our estimates of workers’ compensation costs borne by employers and in three states by employees may not capture the full cost borne by employers through insurance or other payments made outside the workers’ compensation report system or other economic and human costs of work-related injuries, illnesses, and fatalities. These costs – borne by workers, families, and communities – are significant but beyond the scope of this report. Additionally, the report does not evaluate whether workers’ compensation programs are meeting key objectives, such as: preventing work-related injuries and illnesses; compensating injured workers ade-quately and equitably; rehabilitating injured workers; and returning them to work at an affordable cost. The audience for the Academy’s annual report on workers’ compensation includes actuaries, insurers, journalists, business and labor leaders, employee ben-efit specialists, federal and state policymakers, students, and researchers working in universities, government, and private consulting firms. The data from some tables are published by the National Safety Council (NSC) (in Injury Facts), by the Employee Benefit Research Institute (in Employee Benefit News, Fundamentals of Employee Benefit Programs) and by the SSA (in the Annual Statistical Supplement to the Social Security Bulletin). The Academy’s estimates inform state and federal policymakers in numerous ways. The federal Centers for Medicare & Medicaid Services (CMS), for exam-ple, uses the data in estimates and projections of health care spending in the United States. The National Institute for Occupational Safety and Health (NIOSH) uses the data to track the costs of workplace injuries in the United States. The International Association of Industrial Accident Boards and Commissions (IAIABC), the organiza-tion of state and provincial agencies that administer workers’ compensation in the United States and Canada, uses the information to track and compare
Preface

the performance of workers’ compensation programs in the United States with similar systems in Canada.
Acknowledgements
The Academy expresses its deep appreciation to staff members in the 50 states and District of Columbia workers’ compensation offices who provide data on their jurisdictions each year. While there are too many individuals to name here, we are grateful for the time they spend responding to our survey and answering clarification questions as needed. Without support from these individuals, constructing this annual data series would be impossible. The Centers for Medicare & Medicaid Services (CMS) provide funding to produce selected tables for this Report that are also used in its own estimates. The project
also receives financial support from the California State Compensation Insurance Fund and in-kind support from the National Council on Compensation Insurance and the National Association of Insurance Commissioners. The authors gratefully acknowledge the time and expertise contributed by members of the Academy’s Study Panel on Workers’ Compensation Data. All members of the Panel are listed on page iii, but we especially acknowledge the contributions of: Aaron Brandenburg, Terry Bogyo, John F. Burton Jr., Jeff Eddinger, Doug Holmes, Mike Manley, and Frank Neuhauser. Finally, we appreciate comments from Michael Dworsky (RAND Corporation), Jeanne Sears (University of Washington), and Steven Wurzelbacher (NIOSH) who reviewed a final draft for the Board.
ii NATIONAL ACADEMY OF SOCIAL INSURANCE
Elaine Weiss Leslie I. Boden Griffin Murphy Lead Policy Analyst, Income Security, Chair, Study Panel on Workers’ Research Assistant, NASI Compensation Data Income Security, NASI
Workers’ Compensation: Benefits, Costs, and Coverage • iii
Leslie Boden, Chair Professor, School of Public Health, Boston University Christine Baker Principal Consultant, Baker & Welsh Marjorie Baldwin Professor, W. P. Carey School of Business, Department of Economics, Arizona State University Terry Bogyo Independent Workers’ Compensation Researcher, Canada Aaron Brandenburg Assistant Director, Data Coordination and Statistical Analysis, National Association of Insurance Commissioners John F. Burton, Jr. Professor Emeritus, School of Management & Labor Relations, Rutgers University, and School of Industrial and Labor Relations, Cornell University Aaron Catlin Deputy Director, National Health Statistics Group, Office of the Actuary, Centers for Medicare & Medicaid Services Charles Davoli Louisiana Workers’ Advocate Labor Representative of the Governor’s Workers’ Compensation Advisory Council
Michael Duff Professor of Law University of Wyoming College of Law Jeff Eddinger Senior Divisional Executive Regulatory Services, National Council on Compensation Insurance Douglas J. Holmes President, UWC Strategic Services on Unemployment and Workers’ Compensation Jennifer Wolf Horejsh Executive Director, International Association of Industrial Accident Boards and Commissions Kate Kimpan Vice President, Workers’ Compensation Programs, Dade Moeller & Associates Mike Manley Independent Workers’ Compensation Researcher, Panama Nicole Nestoriak Research Economist, Bureau of Labor Statistics, U.S. Department of Labor Frank Neuhauser Researcher, Institute for the Study of Societal Issues University of California, Berkeley
Seth A. Seabury Associate Professor of Ophthalmology; Director, Keck-Schaeffer Initiative for Population Health, University of Southern California Hilery Simpson Assistant Commissioner, Office of Safety, Health, and Working Conditions, U.S. Bureau of Labor Statistics Emily A. Spieler Professor of Law, Northeastern University School of Law Gary Steinberg Retired, Deputy Director, Office of Workers’ Compensation Programs, U.S. Department of Labor Alex Swedlow President, California Workers’ Compensation Institute Ramona Tanabe Executive Vice President, Workers Compensation Research Institute David B. Torrey Workers’ Compensation Judge PA Dept. of Labor & Industry Adjunct Professor of Law University of Pittsburgh School of Law Benjamin Washington Economist, National Health Statistics Group, Office of the Actuary, Centers for Medicare & Medicaid Services
Study Panel on Workers’ Compensation Data

iv NATIONAL ACADEMY OF SOCIAL INSURANCE
Workers’ Compensation: Benefits, Costs, and Coverage • v
Table of Contents Preface . . . . . . . . . . . . . . . . . . . . . . . . . . . . . . . . . . . . . . . . . . . . . . . . . . . . . . . . . . . . . . . . . . . . . . . . . . . . . . . . i
Study Panel on Workers’ Compensation Data. . . . . . . . . . . . . . . . . . . . . . . . . . . . . . . . . . . . . . . . . . . . . . . iii
Highlights . . . . . . . . . . . . . . . . . . . . . . . . . . . . . . . . . . . . . . . . . . . . . . . . . . . . . . . . . . . . . . . . . . . . . . . . . . . . . 1
National Trends (Table 1) . . . . . . . . . . . . . . . . . . . . . . . . . . . . . . . . . . . . . . . . . . . . . . . . . . . . . . . . . . . . 1
State Trends . . . . . . . . . . . . . . . . . . . . . . . . . . . . . . . . . . . . . . . . . . . . . . . . . . . . . . . . . . . . . . . . . . . . . . 1
Background on Workers’ Compensation. . . . . . . . . . . . . . . . . . . . . . . . . . . . . . . . . . . . . . . . . . . . . . . . . . . . 2
History of Workers’ Compensation. . . . . . . . . . . . . . . . . . . . . . . . . . . . . . . . . . . . . . . . . . . . . . . . . . . . 2
Workers’ Compensation Benefits . . . . . . . . . . . . . . . . . . . . . . . . . . . . . . . . . . . . . . . . . . . . . . . . . . . . . 7
Sources of Workers’ Compensation Insurance. . . . . . . . . . . . . . . . . . . . . . . . . . . . . . . . . . . . . . . . . . 8
Estimates for 2017 . . . . . . . . . . . . . . . . . . . . . . . . . . . . . . . . . . . . . . . . . . . . . . . . . . . . . . . . . . . . . . . . . . . . . . 9
Covered Employment and Wages . . . . . . . . . . . . . . . . . . . . . . . . . . . . . . . . . . . . . . . . . . . . . . . . . . . . . . . . 10
Methods for Estimating Covered Employment and Wages . . . . . . . . . . . . . . . . . . . . . . . . . . . . . . 10
National Estimates of Covered Employment and Wages . . . . . . . . . . . . . . . . . . . . . . . . . . . . . . . . 12
State Estimates of Covered Employment and Wages . . . . . . . . . . . . . . . . . . . . . . . . . . . . . . . . . . . 12
Workers’ Compensation Benefits Paid . . . . . . . . . . . . . . . . . . . . . . . . . . . . . . . . . . . . . . . . . . . . . . . . . . . . 18
Data Sources and Methods for Estimating Benefits Paid . . . . . . . . . . . . . . . . . . . . . . . . . . . . . . . . 18
National Estimates of Benefits Paid . . . . . . . . . . . . . . . . . . . . . . . . . . . . . . . . . . . . . . . . . . . . . . . . . . 20
State Estimates of Benefits Paid in 2017 . . . . . . . . . . . . . . . . . . . . . . . . . . . . . . . . . . . . . . . . . . . . . . 28
State Trends in Benefits Paid. . . . . . . . . . . . . . . . . . . . . . . . . . . . . . . . . . . . . . . . . . . . . . . . . . . . . . . . 29
Benefits Per $100 of Covered Wages . . . . . . . . . . . . . . . . . . . . . . . . . . . . . . . . . . . . . . . . . . . . . . . . . 29
Cash Benefits by Type of Claim . . . . . . . . . . . . . . . . . . . . . . . . . . . . . . . . . . . . . . . . . . . . . . . . . . . . . 37
Employer Costs for Workers’ Compensation . . . . . . . . . . . . . . . . . . . . . . . . . . . . . . . . . . . . . . . . . . . . . . . 38
Data Sources for Estimating Employer Costs . . . . . . . . . . . . . . . . . . . . . . . . . . . . . . . . . . . . . . . . . . 38
National Estimates of Employer Costs. . . . . . . . . . . . . . . . . . . . . . . . . . . . . . . . . . . . . . . . . . . . . . . . 39
State Estimates of Employer Costs . . . . . . . . . . . . . . . . . . . . . . . . . . . . . . . . . . . . . . . . . . . . . . . . . . 41
Benefits Paid Relative to Employer Costs . . . . . . . . . . . . . . . . . . . . . . . . . . . . . . . . . . . . . . . . . . . . . 43
Estimates of Employer Costs from Other Sources . . . . . . . . . . . . . . . . . . . . . . . . . . . . . . . . . . . . . . 47
Costs to Workers. . . . . . . . . . . . . . . . . . . . . . . . . . . . . . . . . . . . . . . . . . . . . . . . . . . . . . . . . . . . . . . . . . 48
Incidence of Workplace Injuries and Workers’ Compensation Claims. . . . . . . . . . . . . . . . . . . . . . . . . . . 50
Incidence of Work-Related Injuries. . . . . . . . . . . . . . . . . . . . . . . . . . . . . . . . . . . . . . . . . . . . . . . . . . . 50
Incidence of Workers’ Compensation Claims . . . . . . . . . . . . . . . . . . . . . . . . . . . . . . . . . . . . . . . . . . 53
Addendum . . . . . . . . . . . . . . . . . . . . . . . . . . . . . . . . . . . . . . . . . . . . . . . . . . . . . . . . . . . . . . . . . . . . . . . . . . . 55
Other Benefits Available to Disabled Workers . . . . . . . . . . . . . . . . . . . . . . . . . . . . . . . . . . . . . . . . . 55
Benefits Incurred vs. Benefits Paid . . . . . . . . . . . . . . . . . . . . . . . . . . . . . . . . . . . . . . . . . . . . . . . . . . . 59
Glossary . . . . . . . . . . . . . . . . . . . . . . . . . . . . . . . . . . . . . . . . . . . . . . . . . . . . . . . . . . . . . . . . . . . . . . . . . . . . . 61
Appendix A: Coverage Estimates. . . . . . . . . . . . . . . . . . . . . . . . . . . . . . . . . . . . . . . . . . . . . . . . . . . . . . . . . 65
Appendix B: Federal Programs. . . . . . . . . . . . . . . . . . . . . . . . . . . . . . . . . . . . . . . . . . . . . . . . . . . . . . . . . . . 71
Federal Programs Included in NASI Estimates. . . . . . . . . . . . . . . . . . . . . . . . . . . . . . . . . . . . . . . . . 71
Federal Employees . . . . . . . . . . . . . . . . . . . . . . . . . . . . . . . . . . . . . . . . . . . . . . . . . . . . . . . . . . . 71
Longshore and Harbor Workers . . . . . . . . . . . . . . . . . . . . . . . . . . . . . . . . . . . . . . . . . . . . . . . . 71
Coal Miners with Black Lung Disease. . . . . . . . . . . . . . . . . . . . . . . . . . . . . . . . . . . . . . . . . . . . 71
Federal Programs Not Included in NASI Estimates . . . . . . . . . . . . . . . . . . . . . . . . . . . . . . . . . . . . . 72
Energy Employees . . . . . . . . . . . . . . . . . . . . . . . . . . . . . . . . . . . . . . . . . . . . . . . . . . . . . . . . . . . 72
Workers Exposed to Radiation . . . . . . . . . . . . . . . . . . . . . . . . . . . . . . . . . . . . . . . . . . . . . . . . . 73
Veterans of Military Service . . . . . . . . . . . . . . . . . . . . . . . . . . . . . . . . . . . . . . . . . . . . . . . . . . . . 74
Railroad Employees and Merchant Mariners . . . . . . . . . . . . . . . . . . . . . . . . . . . . . . . . . . . . . 75
Appendix C: Workers’ Compensation under State Laws. . . . . . . . . . . . . . . . . . . . . . . . . . . . . . . . . . . . . . 77
Appendix D: Workers’ Compensation Costs Paid by Employees . . . . . . . . . . . . . . . . . . . . . . . . . . . . . . 85
References. . . . . . . . . . . . . . . . . . . . . . . . . . . . . . . . . . . . . . . . . . . . . . . . . . . . . . . . . . . . . . . . . . . . . . . . . . . . 88
Tables
Table 1: Overview of Workers’ Compensation Benefits, Costs, and Coverage, 2013-2017 . . . . . . . .2
Table 2: Workers’ Compensation Covered Jobs and Covered Wages, 1997-2017 . . . . . . . . . . . . . .13
Table 3: Workers’ Compensation Covered Jobs by State, 2013-2017 . . . . . . . . . . . . . . . . . . . . . . . .14
Table 4: Workers’ Compensation Covered Wages by State, 2013-2017 . . . . . . . . . . . . . . . . . . . . . . .16
Table 5: Workers’ Compensation Benefits Paid, by Type of Payer, 1997-2017 . . . . . . . . . . . . . . . . . .21
Table 6: Workers’ Compensation Employer-Paid Benefits Under Deductible Provisions, 1997-2017 . . . . . . . . . . . . . . . . . . . . . . . . . . . . . . . . . . . . . . . . .22
Table 7: Percentage Distribution of Workers’ Compensation Benefit Payments, by Type of Coverage: With and Without Deductibles, 1997-2017 . . . . . . . . . . . . . . . . . . . . . . . . . . . . . .23
Table 8: Workers’ Compensation Benefits, by Type of Coverage and State, 2017 . . . . . . . . . . . . . .24
Table 9: Workers’ Compensation Total Benefits Paid and Five-Year Percent Change, by State, 2013-2017 . . . . . . . . . . . . . . . . . . . . . . . . . . . . . . . . . . . . . . . . . . . . . . . . . . . . . . . . . .26
Table 10: Workers’ Compensation Medical Benefits Paid and Five-Year Percent Change, by State, 2013-2017 . . . . . . . . . . . . . . . . . . . . . . . . . . . . . . . . . . . . . . . . . . . . . . . . . . . . . . . . . .30
Table 11: Workers’ Compensation Cash Benefits Paid and Five-Year Percent Change, by State, 2013-2017 . . . . . . . . . . . . . . . . . . . . . . . . . . . . . . . . . . . . . . . . . . . . . . . . . . . . . . . . . .32
Table 12: Workers’ Compensation Total Benefits Paid Per $100 of Covered Wages, by State, 2013-2017 . . . . . . . . . . . . . . . . . . . . . . . . . . . . . . . . . . . . . . . . . . . . . . . . . . . . . . . . . .34
Table 13: Workers’ Compensation Employer Costs, by Type of Coverage, 1997-2017 . . . . . . . . . . . .42
Table 14: Workers’ Compensation Employer Costs Per $100 of Covered Wages, by State, 2013-2017 . . . . . . . . . . . . . . . . . . . . . . . . . . . . . . . . . . . . . . . . . . . . . . . . . . . . . . . . . .44
Table 15: Workers’ Compensation Benefit/Cost Ratios, 1997-2017 . . . . . . . . . . . . . . . . . . . . . . . . . . . .46
Table 16: Fatal Occupational Injuries: All and Private Industry, 1997-2017 . . . . . . . . . . . . . . . . . . . . . .49
Table 17: Non-Fatal Occupational Injuries and Illnesses Among Private Industry Employers, 1996-2017 . . . . . . . . . . . . . . . . . . . . . . . . . . . . . . . . . . . . . . . . . . . . . . . . . . . . . . . .52
Table 18: Number of Workers’ Compensation Claims per 100,000 Insured Workers: Private Carriers in 38 Jurisdictions, 1996-2015 . . . . . . . . . . . . . . . . . . . . . . . . . . . . . . . . . . . .54
Table 19: Dual Eligible Individuals: Social Security Disability Insurance Beneficiaries with Workers’ Compensation or Public Disability Benefits, 2017 . . . . . . . . . . . . . . . . . . . . .58
Table A.1: Documenting Workers’ Compensation Coverage Estimates, 2017 Annual Averages . . . .68
Table A.2: Workers’ Compensation Coverage as a Percent of the Employed Workforce, 2007-2017 National Averages . . . . . . . . . . . . . . . . . . . . . . . . . . . . . . . . . . . . . . . . . . . . . . . . . .70
vi NATIONAL ACADEMY OF SOCIAL INSURANCE
Workers’ Compensation: Benefits, Costs, and Coverage • vii
Table B.1: Federal Employees’ Compensation Act, Benefits and Costs, 2013-2017 . . . . . . . . . . . . . . .72
Table B.2: Longshore and Harbor Workers’ Compensation Act, Benefits, Costs, and Number of Defense Base Act Death Claims, 2013-2017 . . . . . . . . . . . . . . . . . . . . . . . . . . . . .73
Table B.3: Black Lung Benefits Act, Benefits and Costs, 2013-2017 . . . . . . . . . . . . . . . . . . . . . . . . . . . .74
Table B.4: Benefits and Costs of the Energy Employees Occupational Illness Compensation Program Act: Part B and Part E 2013-2017 . . . . . . . . . . . . . . . . . . . . . . . . . . . . . . . . . . . . . . . .75
Table B.5: Radiation Exposure Compensation Act, Benefits Paid as of December, 2017 . . . . . . . . . .76
Table B.6: Federal Veterans’ Compensation Program: Fiscal Year 2017 . . . . . . . . . . . . . . . . . . . . . . . .76
Table C: Workers’ Compensation State Laws as of 2018 . . . . . . . . . . . . . . . . . . . . . . . . . . . . . . . . . . .78
Table D.1: Employee Costs, Employer Costs, and Benefits for States in which Employees Directly Pay for a Portion of the Workers' Compensation Program, 2013–2017 . . . . . . . . .86
Figures
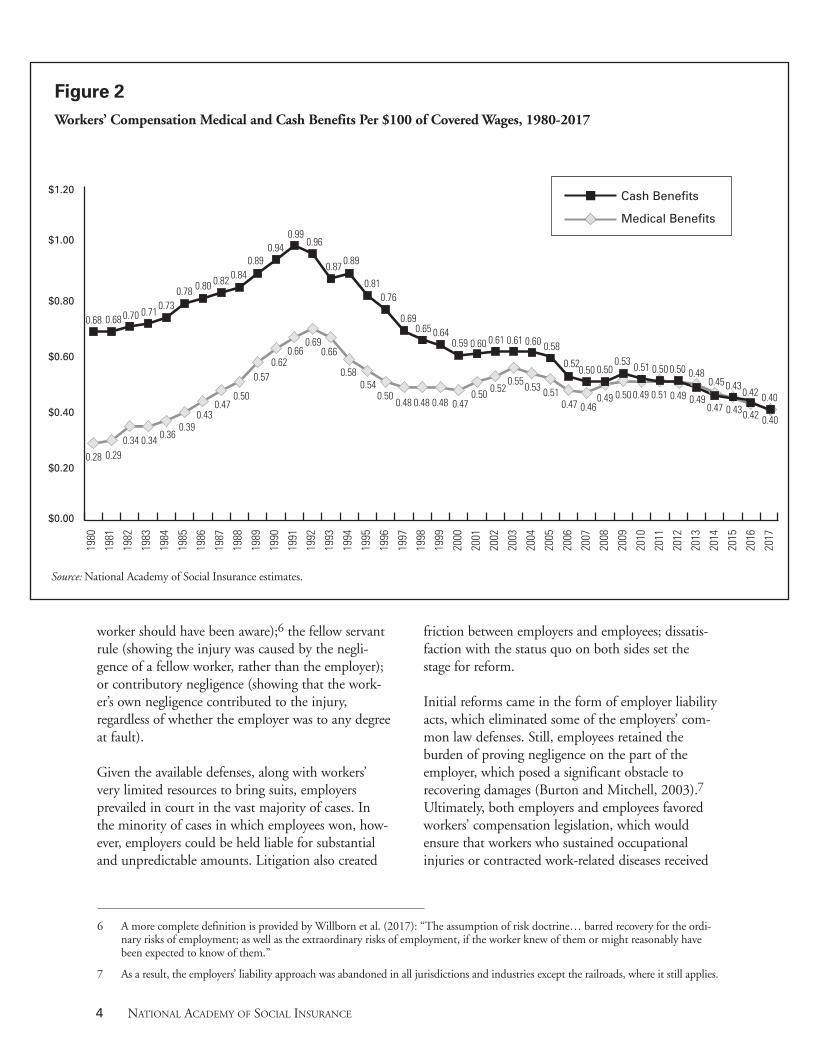
Figure 1: Workers’ Compensation Benefits and Costs Per $100 of Covered Wages, 1980–2017 . . . . .3
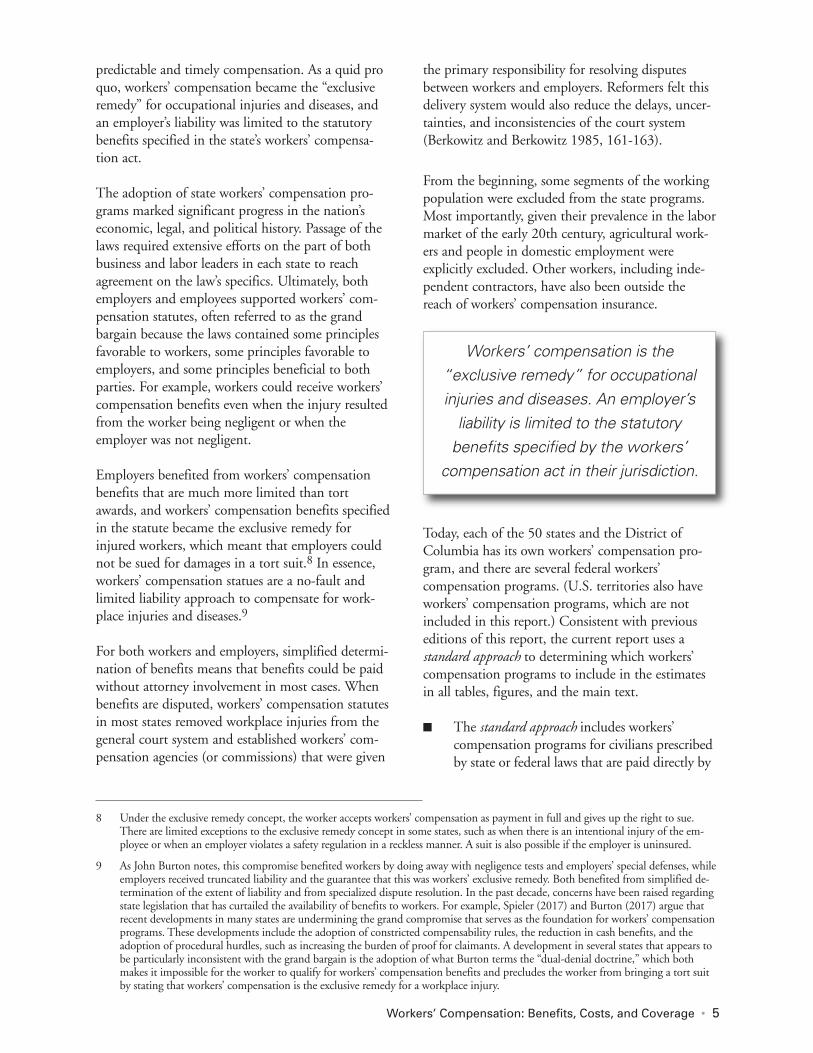
Figure 2: Workers’ Compensation Medical and Cash Benefits per $100 of Covered Wages, 1980–2017 . . . . . . . . . . . . . . . . . . . . . . . . . . . . . . . . . . . . . . . . . . . . . . . . . . . . . . . . . . . . . . . . . . .4
Figure 3: Percentage Share of Medical and Cash Benefits, 1980–2017 . . . . . . . . . . . . . . . . . . . . . . . .38
Figure 4a: Types of Disabilities in Workers’ Compensation Cases with Cash Benefits, 1996-2015, Percent of Cases . . . . . . . . . . . . . . . . . . . . . . . . . . . . . . . . . . . . . . . . . . . . . . . . . . . . . . . . . . . . .40
Figure 4b: Types of Disabilities in Workers’ Compensation Cases with Cash Benefits, 1996-2015, Percent of Benefits . . . . . . . . . . . . . . . . . . . . . . . . . . . . . . . . . . . . . . . . . . . . . . . . . . . . . . . . . . .40
Figure 5: Private Industry Occupational Injuries and Illnesses: Incidence Rates 1980-2017 . . . . . . .53
Figure 6: Proportion of Worker SSDI Beneficiaries with Connection to Workers’ Compensation or Public Disability Benefits, 2007-2017 . . . . . . . . . . . . . . . . . . . . .59
Additional Appendices Online
Additional appendices are published in Sources, Methods, and State Summaries: A Companion to Workers’ Compensation: Benefits, Costs, and Coverage available on the Academy’s website at www.nasi.org. These appendices provide more information on:
■ Data sources for each state
■ Methods used to estimate workers’ compensation benefits and costs by type of coverage,
including:
• Deductibles
• Self-insured benefit payments and administrative costs
• Medical benefits
■ Updated version of Table 9.B1 of the Annual Statistical Supplement to the Social Security Bulletin
■ 2014 to 2017 trends in benefits paid by second injury funds, special funds, and guaranty funds
■ State summary tables that report key metrics from 2013 to 2017

viii NATIONAL ACADEMY OF SOCIAL INSURANCE

Highlights For more than two decades, the National Academy of Social Insurance has produced an annual report on workers’ compensation benefits, costs, and coverage. The report provides summary statistics on state and federal workers’ compensation programs, with the aim of facilitating policymaking that improves the system for both injured workers and employers. This report provides new data for 2017, with comparison data for the five-year period from 2013 to 2017.
National Trends (Table 1)
■ Covered employment and wages continued to rise, albeit at a slower rate than in the past few years
• The number of U.S. workers covered by workers’ compensation continues to grow, with that growth slowing slightly from 4.2 percent between 2013 and 2015 to 3.2 per-cent between 2015 and 2017. (Table 3)
• A similar trend is seen with respect to cov-ered wages, which grew by 10.7 percent 2013-2015, and then by 8.0 percent in the two subsequent years. (Table 4)
■ Benefits paid to injured workers and their health care providers continued to decline
• In 2017, workers’ compensation total bene-fits paid were $62.0 billion, a decrease of 2.2 percent from 2013. After falling by 1.8 per-cent from 2013-2015, the rate of decline in benefits slowed to 0.4 percent from 2015-2017. (Table 9)
• Adjusting for the increase in coverage, how-ever, total benefits were $0.80 per $100 of covered wages in 2017, a decrease of $0.18 since 2013. (Table 12). This reflects a 19.6 percent decline in medical benefits per $100 of covered wages (Table 10) and a 16.9 per-cent decline in cash benefits per $100 of covered wages. (Table 11)
■ Employer costs increased in total, but decreased as a percentage of covered wages
• In 2017, employers’ costs for workers’ compensation were $97.4 billion, a 9.1
percent increase since 2013. (Table 13) When adjusted for the increase in covered wages, however, employers’ costs were $1.25 per $100 of covered wages, down $0.12 (8.8%) from 2013. (Table 14)
■ Declines in standardized benefits and costs are substantial: The $0.18 decline in benefits since 2013 represents an 18.2 percent decline in benefits per $100 of payroll, and the $0.12 decline in costs represents an 8.8 percent decline in costs per $100 of payroll).1
State Trends
■ Workers’ compensation covered employment and wages increased in almost every state between 2013 and 20172
• Covered jobs increased in all jurisdictions except Alaska, North Dakota, West Virginia, and Wyoming. The largest percentage increase (14.4%) occurred in Nevada. (Table 3)
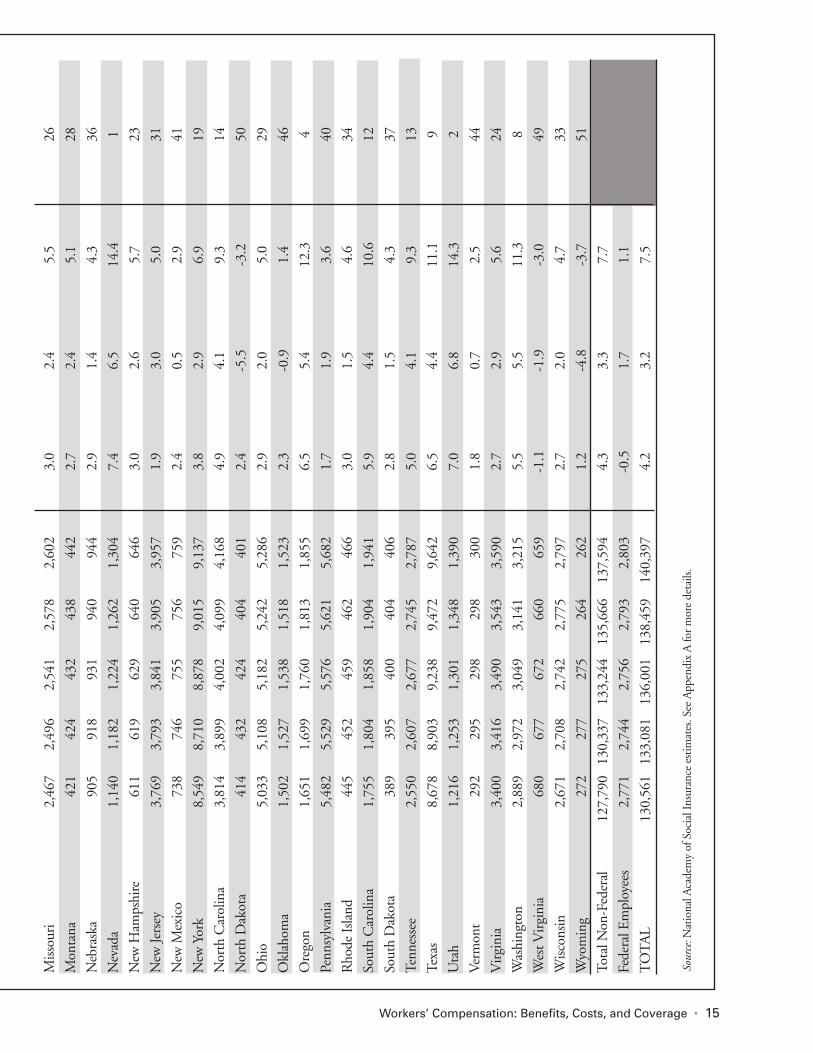
• Covered wages increased in all jurisdictions except Wyoming. The largest percentage increase occurred in Washington (30.5%), with seven states having increases greater than 25%. (Table 4)
■ Workers’ compensation benefits per $100 of covered wages decreased in almost all states
• Benefits per $100 of covered wages decreased in all jurisdictions except Hawaii and Missouri. (Table 12)
• The largest percent decrease occurred in Tennessee, where benefits declined by 38.2 percent between 2013 and 2017. (Table 12)
■ Employers’ costs per $100 of covered wages decreased in almost all states
• Costs per $100 of covered wages decreased in all but five jurisdictions, with the largest percent decrease (38.3 percent) in Oklahoma. (Table 14)
• Costs per $100 of covered wages increased in five states. Among these states, the largest percent increases were in Hawaii and Missouri (7.3 percent and 5.6 percent, respectively). (Table 14)
Workers’ Compensation: Benefits, Costs, and Coverage • 1
1 The disparity between the smaller reduction in employer costs and the larger decline in benefits is discussed in the text
accompanying table 15.
2 This report includes data from all fifty states and the District of Columbia, as well as for select federal programs. For the purposes of this report, we treat DC like a 51st state and, thus, use the terms “state” and “jurisdiction” interchangeably throughout.
Background on Workers’ Compensation This section of the report, covering background material that is repeated annually, describes the his-tory of workers’ compensation insurance in the United States; the current structure of state workers’ compensation programs; types of benefits paid; and how workers’ compensation is financed. Reporting of detailed program data for 2017 begins on page 9, and a glossary of terms used in this report is available on page 61. History of Workers’ Compensation
Workers’ compensation was the first social insurance program adopted in most developed countries. The
first modern workers’ compensation laws, known as Sickness and Accident Laws based on the principle of employer liability for workplace injuries, were adopted in Germany in 1884 under Chancellor Otto von Bismarck (Clayton, 2004). In 1897, England passed a similar law that held employers liable so long as employees could prove that they had been injured on the job. The first workers’ compensation law in the United States was enacted in 1908 to cover certain federal civilian workers. The first state law, passed by New York in 1910, which was compulsory for certain very risky jobs, was struck down as unconstitutional by the state’s court of appeals in 1911.3 That same year, Kansas and Washington passed the first state laws
2 NATIONAL ACADEMY OF SOCIAL INSURANCE
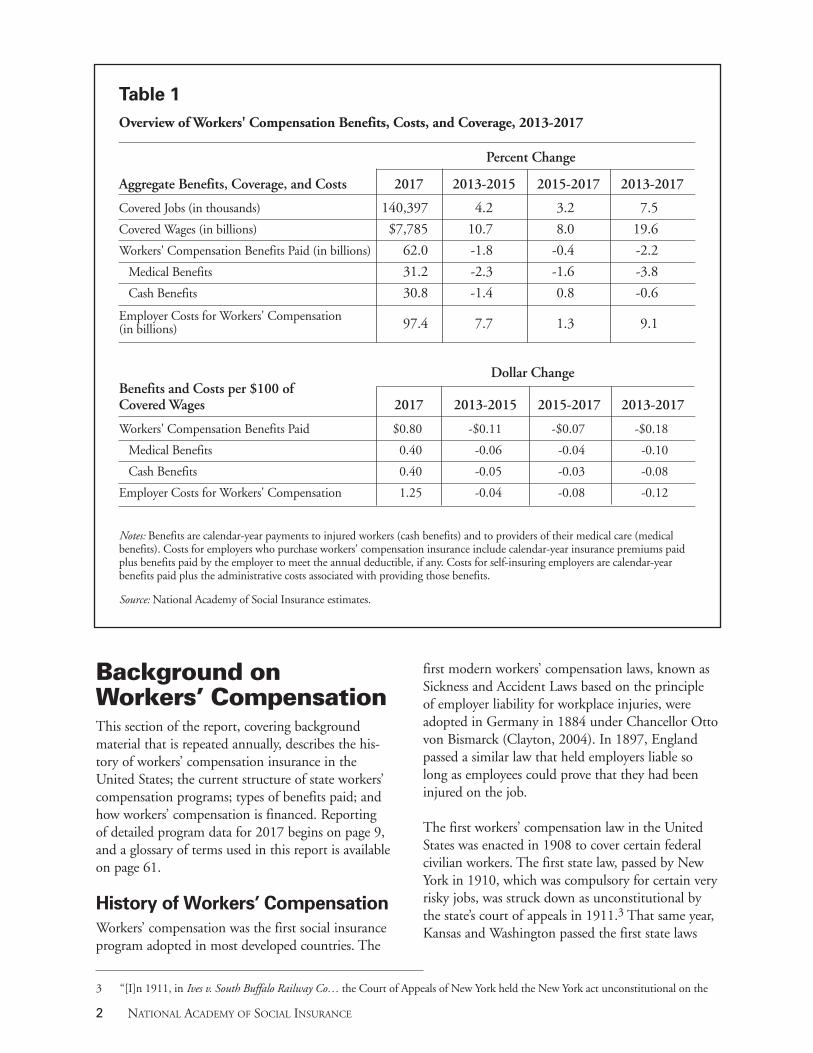
Table 1
Overview of Workers' Compensation Benefits, Costs, and Coverage, 2013-2017
Percent Change
Aggregate Benefits, Coverage, and Costs 2017 2013-2015 2015-2017 2013-2017
Covered Jobs (in thousands) 140,397 4.2 3.2 7.5
Covered Wages (in billions) $7,785 10.7 8.0 19.6
Workers' Compensation Benefits Paid (in billions) 62.0 -1.8 -0.4 -2.2
Medical Benefits 31.2 -2.3 -1.6 -3.8
Cash Benefits 30.8 -1.4 0.8 -0.6
Employer Costs for Workers' Compensation (in billions) 97.4 7.7 1.3 9.1
Benefits and Costs per $100 of Dollar Change
Covered Wages 2017 2013-2015 2015-2017 2013-2017
Workers' Compensation Benefits Paid $0.80 -$0.11 -$0.07 -$0.18
Medical Benefits 0.40 -0.06 -0.04 -0.10
Cash Benefits 0.40 -0.05 -0.03 -0.08
Employer Costs for Workers' Compensation 1.25 -0.04 -0.08 -0.12
Notes: Benefits are calendar-year payments to injured workers (cash benefits) and to providers of their medical care (medical benefits). Costs for employers who purchase workers' compensation insurance include calendar-year insurance premiums paid plus benefits paid by the employer to meet the annual deductible, if any. Costs for self-insuring employers are calendar-year benefits paid plus the administrative costs associated with providing those benefits.
Source: National Academy of Social Insurance estimates.
3 “[I]n 1911, in Ives v. South Buffalo Railway Co… the Court of Appeals of New York held the New York act unconstitutional on the
that survived constitutional challenges (though New Jersey and Wisconsin both claim the “first in WC” title), with five other states enacting laws that went into effect that year.4 Most other states then adopted workers’ compensation laws by 1920, though the last of the 48 contiguous states to pass one, Mississippi, did so only in 1948.
Before the enactment of these laws, the primary legal remedy for workers who were injured on the job was to file a tort suit claiming negligence by their employer.5 Employers had three commonly used legal defenses to shield themselves from liability: assumption of risk (showing that the injury resulted from an ordinary risk of employment of which the
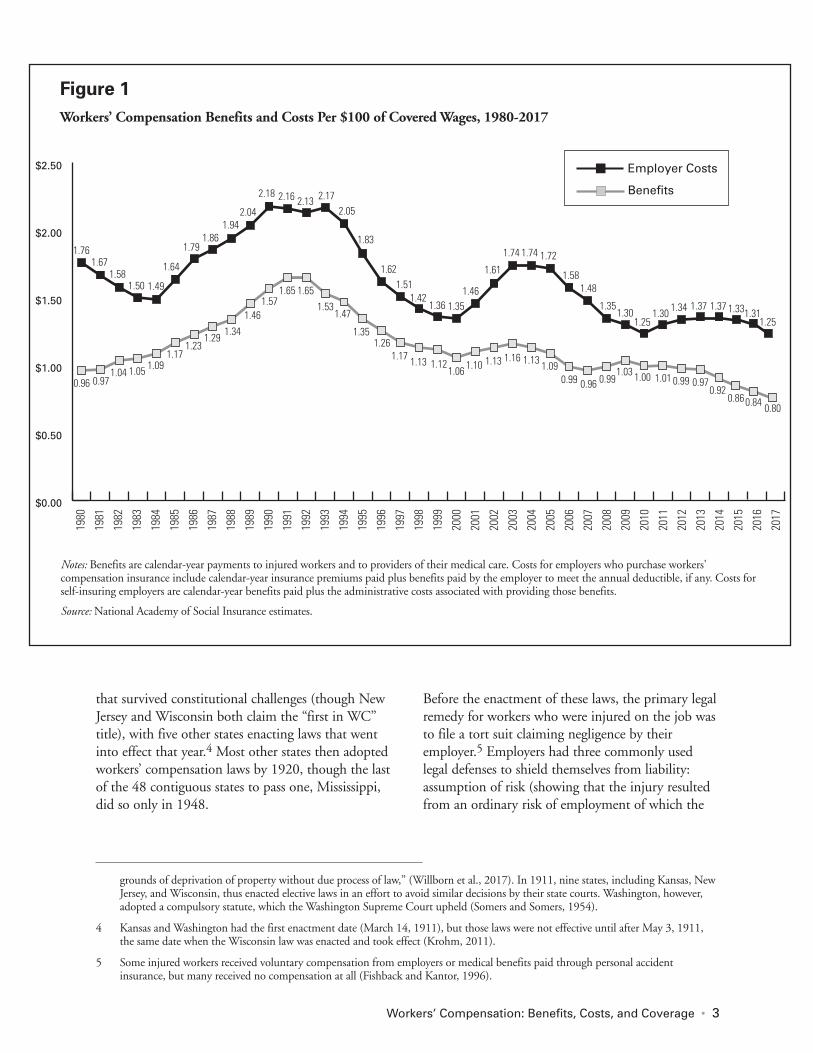
Figure 1
Workers’ Compensation Benefits and Costs Per $100 of Covered Wages, 1980-2017
Notes: Benefits are calendar-year payments to injured workers and to providers of their medical care. Costs for employers who purchase workers' compensation insurance include calendar-year insurance premiums paid plus benefits paid by the employer to meet the annual deductible, if any. Costs for self-insuring employers are calendar-year benefits paid plus the administrative costs associated with providing those benefits.
Source: National Academy of Social Insurance estimates.
$0.00
$0.50
$1.00
$1.50
$2.00
$2.50
1980
1981
1982
1983
1984
1985
1986
1987
1988
1989
1990
1991
1992
1993
1994
1995
1996
1997
1998
1999
2000
2001
2002
2003
2004
2005
2006
2007
2008
2009
2010
2011
2012
2013
2014
2015
2016
2017
1.861.76
1.671.58
1.94
1.50
1.64
1.49
1.79
2.04
2.18 2.16 2.172.132.05
1.83
1.621.51
1.421.36 1.35
1.46
1.61
1.74 1.74 1.72
1.581.48
1.351.30
1.251.30 1.34 1.37 1.37
0.96 0.971.04 1.05 1.09
1.171.23
1.291.34
1.461.57
1.65 1.65
1.531.47
1.351.26
1.17 1.13 1.121.06 1.10 1.13 1.16 1.13 1.09
0.99 0.96 0.991.03 1.00 1.01 0.99 0.97
0.92
1.33
0.86
1.31
0.84
1.25
0.80
Workers’ Compensation: Benefits, Costs, and Coverage • 3
Employer Costs
Benefits
grounds of deprivation of property without due process of law,” (Willborn et al., 2017). In 1911, nine states, including Kansas, New Jersey, and Wisconsin, thus enacted elective laws in an effort to avoid similar decisions by their state courts. Washington, however, adopted a compulsory statute, which the Washington Supreme Court upheld (Somers and Somers, 1954).
4 Kansas and Washington had the first enactment date (March 14, 1911), but those laws were not effective until after May 3, 1911, the same date when the Wisconsin law was enacted and took effect (Krohm, 2011).
5 Some injured workers received voluntary compensation from employers or medical benefits paid through personal accident insurance, but many received no compensation at all (Fishback and Kantor, 1996).
worker should have been aware);6 the fellow servant rule (showing the injury was caused by the negli-gence of a fellow worker, rather than the employer); or contributory negligence (showing that the work-er’s own negligence contributed to the injury, regardless of whether the employer was to any degree at fault). Given the available defenses, along with workers’ very limited resources to bring suits, employers prevailed in court in the vast majority of cases. In the minority of cases in which employees won, how-ever, employers could be held liable for substantial and unpredictable amounts. Litigation also created
friction between employers and employees; dissatis-faction with the status quo on both sides set the stage for reform. Initial reforms came in the form of employer liability acts, which eliminated some of the employers’ com-mon law defenses. Still, employees retained the burden of proving negligence on the part of the employer, which posed a significant obstacle to recovering damages (Burton and Mitchell, 2003).7 Ultimately, both employers and employees favored workers’ compensation legislation, which would ensure that workers who sustained occupational injuries or contracted work-related diseases received
4 NATIONAL ACADEMY OF SOCIAL INSURANCE
6 A more complete definition is provided by Willborn et al. (2017): “The assumption of risk doctrine… barred recovery for the ordi-
nary risks of employment; as well as the extraordinary risks of employment, if the worker knew of them or might reasonably have been expected to know of them.”
7 As a result, the employers’ liability approach was abandoned in all jurisdictions and industries except the railroads, where it still applies.
Figure 2
Workers’ Compensation Medical and Cash Benefits Per $100 of Covered Wages, 1980-2017
Source: National Academy of Social Insurance estimates.
$0.00
$0.20
$0.40
$0.60
$0.80
$1.00
$1.20
1980
1981
1982
1983
1984
1985
1986
1987
1988
1989
1990
1991
1992
1993
1994
1995
1996
1997
1998
1999
2000
2001
2002
2003
2004
2005
2006
2007
2008
2009
2010
2011
2012
2013
2014
2015
2016
2017
0.68 0.68 0.70 0.710.73
0.78 0.80 0.82 0.840.89
0.940.99
0.96
0.87 0.89
0.810.76
0.690.65 0.64
0.59 0.60 0.61 0.61 0.60
0.28 0.290.34 0.36
0.390.43
0.470.50
0.570.62
0.660.69
0.580.54
0.500.48 0.48 0.48 0.47
0.50 0.520.550.53 0.51
0.58
0.520.50 0.50
0.53 0.51 0.50 0.50 0.480.45
0.34
0.66
0.47 0.460.49 0.50 0.49 0.51 0.49 0.49
0.47
0.43
0.43
0.42
0.42
0.40
0.40
Cash Benefits
Medical Benefits
predictable and timely compensation. As a quid pro quo, workers’ compensation became the “exclusive remedy” for occupational injuries and diseases, and an employer’s liability was limited to the statutory benefits specified in the state’s workers’ compensa-tion act. The adoption of state workers’ compensation pro-grams marked significant progress in the nation’s economic, legal, and political history. Passage of the laws required extensive efforts on the part of both business and labor leaders in each state to reach agreement on the law’s specifics. Ultimately, both employers and employees supported workers’ com-pensation statutes, often referred to as the grand bargain because the laws contained some principles favorable to workers, some principles favorable to employers, and some principles beneficial to both parties. For example, workers could receive workers’ compensation benefits even when the injury resulted from the worker being negligent or when the employer was not negligent. Employers benefited from workers’ compensation benefits that are much more limited than tort awards, and workers’ compensation benefits specified in the statute became the exclusive remedy for injured workers, which meant that employers could not be sued for damages in a tort suit.8 In essence, workers’ compensation statues are a no-fault and limited liability approach to compensate for work-place injuries and diseases.9 For both workers and employers, simplified determi-nation of benefits means that benefits could be paid without attorney involvement in most cases. When benefits are disputed, workers’ compensation statutes in most states removed workplace injuries from the general court system and established workers’ com-pensation agencies (or commissions) that were given
the primary responsibility for resolving disputes between workers and employers. Reformers felt this delivery system would also reduce the delays, uncer-tainties, and inconsistencies of the court system (Berkowitz and Berkowitz 1985, 161-163).
From the beginning, some segments of the working population were excluded from the state programs. Most importantly, given their prevalence in the labor market of the early 20th century, agricultural work-ers and people in domestic employment were explicitly excluded. Other workers, including inde-pendent contractors, have also been outside the reach of workers’ compensation insurance.
Today, each of the 50 states and the District of Columbia has its own workers’ compensation pro-gram, and there are several federal workers’ compensation programs. (U.S. territories also have workers’ compensation programs, which are not included in this report.) Consistent with previous editions of this report, the current report uses a standard approach to determining which workers’ compensation programs to include in the estimates in all tables, figures, and the main text. n The standard approach includes workers’
compensation programs for civilians prescribed by state or federal laws that are paid directly by
Workers’ Compensation: Benefits, Costs, and Coverage • 5
Workers’ compensation is the “exclusive remedy” for occupational injuries and diseases. An employer’s
liability is limited to the statutory benefits specified by the workers’
compensation act in their jurisdiction.
8 Under the exclusive remedy concept, the worker accepts workers’ compensation as payment in full and gives up the right to sue.
There are limited exceptions to the exclusive remedy concept in some states, such as when there is an intentional injury of the em-ployee or when an employer violates a safety regulation in a reckless manner. A suit is also possible if the employer is uninsured.
9 As John Burton notes, this compromise benefited workers by doing away with negligence tests and employers’ special defenses, while employers received truncated liability and the guarantee that this was workers’ exclusive remedy. Both benefited from simplified de-termination of the extent of liability and from specialized dispute resolution. In the past decade, concerns have been raised regarding state legislation that has curtailed the availability of benefits to workers. For example, Spieler (2017) and Burton (2017) argue that recent developments in many states are undermining the grand compromise that serves as the foundation for workers’ compensation programs. These developments include the adoption of constricted compensability rules, the reduction in cash benefits, and the adoption of procedural hurdles, such as increasing the burden of proof for claimants. A development in several states that appears to be particularly inconsistent with the grand bargain is the adoption of what Burton terms the “dual-denial doctrine,” which both makes it impossible for the worker to qualify for workers’ compensation benefits and precludes the worker from bringing a tort suit by stating that workers’ compensation is the exclusive remedy for a workplace injury.
employers or workers. The scope of this approach includes all state workers’ compensa-tion programs plus the Federal Employees’ Compensation Act (FECA), which provides benefits to federal civilian workers, the portion of the Longshore and Harbor Workers Act (LHWCA) paid by employers, which provides protection to longshore, harbor, and other mar-itime workers, and the portion of the Black Lung Benefits Act financed by employers, which provides compensation to coal miners with black lung disease. In Appendix D, this report introduces two broader measures of the scope of workers’ compensation programs in the US.
The state and federal programs in this report vary with respect to which employers and workers are covered, which injuries and diseases are compens-able, and the levels of benefits provided. However, there are common features in most of these programs: n Workers’ compensation programs still largely
adhere to the no-fault and limited liability prin-ciples that are the central features of the grand bargain agreed to when the program emerged in the early 20th Century.
n With the exceptions of Texas and Wyoming, workers’ compensation insurance coverage is mandatory in all states, with limited exemp-tions for small employers. Workers in specific classifications, such as agricultural or domestic employees, and workers who are classified as independent contractors are generally excluded from coverage.10 In Texas, employers are not covered by the workers’ compensation law unless they elect to be covered. Wyoming
employs an unusual system, requiring workers’ compensation coverage only for workers in “extra-hazardous” occupations, which is what the state designates most occupations. Still, under the state’s workers’ compensation law, only 75% of the state’s covered workforce are employed by employers who are required to provide coverage. In recent years, several large employers have decided not to provide workers’ compensation coverage, leading to a shrinking share of workers with mandatory coverage.11 In 2014, Oklahoma enacted a law that allowed employers to opt out of a traditional workers’ compensation plan by adopting an alternative benefit plan. The Supreme Court of the State of Oklahoma held in September 2016 that the Opt-Out Act was unconstitutional.12
n In principle, workers’ compensation pays 100 percent of injury-related medical costs for injured workers and cash benefits for a portion of wages lost because of the injury. Lost-time compensation may be subject to a waiting period (typically three to seven days) that may be paid retroactively if the disability involves hospitalization or a lengthy duration of work absence. Statutory wage-replacement rates vary by state but, on average, replace about two-thirds of a worker’s pre-injury gross wage, sub-ject to minimum and maximum weekly bene-fits, which vary among states. Cash benefits are tax-exempt.
n Workers’ compensation benefits are financed exclusively by employers except in three states where workers pay part of the cost of benefits and services through direct payroll deductions or charges.13
n Employers purchase workers’ compensation insurance from private insurers or from state
6 NATIONAL ACADEMY OF SOCIAL INSURANCE
10 In addition, many states allow specific classes of employers to voluntarily purchase workers’ compensation coverage or to opt out of
statutory coverage, e.g., independent contractors, corporate officers, and local governments. ?
11 As University of Wyoming law professor Michael Duff notes, “Like the situation in Texas, most [Wyoming] employers not covered are liable in tort. Also like in Texas, there are significant numbers of workers employed by companies that offer ‘alternative WC’ plans.” He points to Araguz v. State, ex rel. Wyoming Workers’ Safety and Comp. Div., 2011 WY 148, 262 P.3d 1263 (Wyo. 2011), as an example of how dual-denial is expanding in that state. This case involved two injured Walmart employees. Duff 2018 and Elaine Weiss correspondence with Michael Duff, July 2019.
12 As the section on major changes to state law, starting on p.36, details, in 2013 Oklahoma passed sweeping statutory changes to the state’s workers’ compensation program that became effective in January 2014. Although some of those changes, in particular the opt-out portion, were subsequently struck down by the state supreme court in 2016, the aftereffects of other changes still linger in the form of sharply declining costs for employers and benefits for injured workers.
13 Employees directly pay for a portion of workers’ compensation programs in New Mexico, Oregon, and Washington, as discussed in Appendix D.
workers’ compensation insurance funds. In most states, large employers have the option to self-insure.
Workers’ Compensation Benefits
Injured workers or their medical providers may collect benefits through one of three basic types of claims: n Medical-only claims: Most workers’ compen-
sation claims do not involve lost work time in excess of the waiting period for cash benefits, so only medical benefits (and no cash benefits) are paid for these claims. “Medical-only” claims are the most common type of workers’ compensa-tion claim, but they represent only a small share of overall payments.14
n Temporary disability claims: When a work-related injury or illness temporarily prevents a worker from returning to his or her pre-injury job or to another job for the same employer, the worker receives temporary total disability (TTD) benefits in addition to medical benefits. These TTD benefits replace approximately two-thirds of the worker’s gross, pre-injury weekly earnings up to state-specified limits. Depending on the jurisdiction, if workers had additional jobs with another employer at the time of injury, earnings from that second or other job may or may not be covered by tempo-rary disability benefits, even if the worker can-not perform any job.
Compensation for temporary disability is subject to minimum and maximum benefit levels that vary from state to state. As of 2019, the minimum weekly TTD benefit ranged from a low of $20 in Arkansas, Florida, and Wisconsin, to a high of $561 in North Dakota. The maximum weekly benefit ranged from a low of $494 in Mississippi to a high of $1,765 in
Iowa.15 Generally, the maximum benefit is tied to the state’s average weekly wage. Most workers who receive TTD benefits fully recov-er and return to work, at which time those benefits end. In many cases, however, employers make accommodations that allow injured workers to return to transitional work before they are physically able to resume all of their former job duties. In these cases, workers may be assigned to restricted duties or given shorter hours at lower wages. When injured workers return to work at less than their pre-injury wage during the healing period, they may be eligible for temporary partial disability (TPD). n Permanent disability claims: Some injured
workers experience work-related injuries or ill-nesses that result in permanent impairments. These workers may be eligible for either perma-nent partial or permanent total disability bene-fits, after they reach maximum medical improvement (the point at which further med-ical intervention is no longer expected to improve functional capacity or provide further healing).16 Permanent total disability (PTD) benefits are paid to workers who are considered legally unable to work at all because of a work-related injury or illness.17 States differ in their methods for determining whether a worker is entitled to permanent partial disability benefits, the extent of permanent disability, and the amount of benefits to be paid (Barth and Niss, 1999; Burton, 2008). There are three opera-tional approaches to determining eligibility for PPD benefits: The impairment approach pays benefits if the worker has a permanent medical loss, without regard to actual loss of earnings. The loss of earning capacity approach pays bene-fits if the impairment causes a permanent loss of earning capacity. The wage loss approach pays benefits only if the worker has actual wage
Workers’ Compensation: Benefits, Costs, and Coverage • 7
14 For example, medical-only claims accounted for 75 percent of workers’ compensation cases, but only 6 percent of total benefit pay-
ments, in the 38 NCCI member states for policy years 1998-2009 (NCCI 2013).
15 Arizona, Colorado, Iowa, Maine, Montana, Nebraska, Nevada, Oklahoma, and Rhode Island do not have a specified minimum weekly TTD benefit. Details on benefit and coverage provisions of state laws are summarized in Appendix C.
16 In most claims where the workers ultimately receive permanent disability benefits, there is initially a period in which the workers re-ceive temporary disability benefits, as described in the preceding paragraphs.
17 Most states allow permanently and totally disabling conditions to be compensated for life if the condition leads to an inability to work. The requirements for a PTD benefit vary across jurisdictions, but many have a provision such that if an injured worker has a permanent disability rating over a specified threshold (for instance, more than 70 percent disabled), then the worker would qualify.
losses. In the first case, the amount of perma-nent disability benefits is determined by some measure of physical loss to the body; in the sec-ond case by an estimate of reduced earning capacity. In the third case, if the worker has the ability to work in some capacity and actually works, he or she will not receive PPD benefits if no wage loss is incurred. Most states impose limits on either the maximum duration or maximum amount of permanent disability benefits. Many cases involving permanent disability are settled through the use of compro-mise and release agreements, which generally provide a lump sum to the injured worker, may cover possible future medical costs, and release the employer from future liability.18
n Fatalities: Workers’ compensation programs also pay death benefits when a work-related ill-ness or injury is fatal. The benefits typically include an amount for funeral and burial expenses, as well as cash benefits for the work-ers’ family or other dependents.
Sources of Workers’ Compensation Insurance
Non-federal employers pay for workers’ compensa-tion by purchasing insurance from a private insurance carrier or a state workers’ compensation insurance fund (a state fund), or by self-insuring. Federal workers’ compensation insurance covers fed-eral civilian employees and some private-sector workers who are employed either in high-risk jobs or jobs related to national defense (see Federal Programs on p.71). Many states also have special workers’ compensation funds to cover exceptional circum-stances, such as a second work-related injury. Private insurance. Workers’ compensation policies provided by private insurers operate much like auto-mobile or homeowners’ insurance. Employers
purchase insurance for a premium that varies accord-ing to expected risk. There are two types of policies: 1) policies that require the insurer to pay all workers’ compensation benefits; and 2) policies with a deductible that require the employer to reimburse the insurer for benefits paid up to the specified deductible amount. With a deductible policy, the employer is self-insuring to a specified limit, and in return pays a lower premium. Deductibles may be written into an insurance policy on a per-injury basis, an aggregate-benefit basis, or a combination of the two. Most states permit deductible policies in workers’ compensation insurance, but state regula-tions vary on the specifics. State funds. In 21 states, workers’ compensation insurance is provided to some (or all) employers by a state fund. State workers’ compensation insurance funds, which are established by an act of the state legislature, may be designated as exclusive or competitive. An exclusive state fund is the sole provider of workers’ compensation insurance in a state (although most states with exclusive state funds allow large employers to self-insure). A competitive state fund competes with private insurers. In this report, we define an insurer as a competitive state fund if: 1) the insurer sells workers’ compensation policies to private-sector employers in the voluntary insurance market; and 2) the insurer is exempt from federal taxes.19 In 2017, four states had exclusive state funds and, according to our criteria, 16 states had competitive state funds.20, 21 In addition, South Carolina’s state fund provides workers’ compensation insurance for state and local government employees and competes with private insurers for the quasi-state agency market segment. West Virginia discontinued its state fund in 2006. However, the state was still paying benefits in 2017 on some claims involving injuries that occurred before 2006.
18 See glossary for complete definition.
19 All competitive state funds are exempt from federal taxes, and six funds (Hawaii, Idaho, Louisiana, New Mexico, Texas, and Utah) are also exempt from paying state premium taxes.
20 In 2017, North Dakota, Ohio, Washington, and Wyoming had exclusive state funds. Competitive state funds operated in California, Colorado, Hawaii, Idaho, Kentucky, Louisiana, Maryland, Missouri, Montana, New Mexico, New York, Oklahoma, Oregon, Pennsylvania, Rhode Island, and Texas.
21 Of the 16 competitive state funds, 13 (all but ID, NM, and OR) operated as the “insurer of last resort” by selling policies to high-risk employers or any other employers that were unable to self-insure or to purchase insurance from a private carrier. See Table 8 footnotes for information on Utah.
8 NATIONAL ACADEMY OF SOCIAL INSURANCE
Workers’ Compensation: Benefits, Costs, and Coverage • 9
Self-insurance. Many large employers choose to self-insure for workers’ compensation.22 Where self-insurance is permitted, employers must apply for permission to self-insure from the regulatory authori-ty and demonstrate that they have sufficient financial resources to cover their expected workers’ compensa-tion losses.23 Some states permit groups of employers in the same industry or trade association to self-insure through group self-insurance. Federal programs. The federal government covers workers’ compensation benefits for federal civilian employees under the Federal Employees Compensation Act (FECA). Federal programs also cover some private-sector workers, including coal miners with black lung disease, employees of over-seas contractors with the U.S. government, energy employees exposed to certain hazardous materials, workers engaged in manufacturing atomic bombs, and veterans injured while on active duty in the armed forces. The federal government also provides oversight for workers covered under the Longshore and Harbor Workers’ Compensation Act (LHWCA), but employers are still required to purchase private insurance or self-insure. (More details about these federal programs are provided in Appendix B.) Guaranty funds. State guaranty funds ensure benefit payments to injured workers in cases where a private insurance carrier or self-insured employer becomes insolvent and lacks sufficient earmarked assets to pay outstanding benefits. The benefit payments and administrative costs of guaranty funds for private insurers are typically funded through assessments on workers’ compensation insurers, while the costs of guaranty funds for self-insured employers are funded through assessments on self-insuring employers. Second injury funds. Second injury funds reim-burse employers or insurance carriers in cases where an employee with a pre-existing condition related to a work-related injury experiences another work- related injury or illness. The second injury fund pays any costs associated with the prior condition in order to reduce the cost burden on the current employer.
The funds encourage employers to hire injured workers who want to return to work with residual impairments, because the current employer is responsible only for workers’ compensation benefits associated with a subsequent illness or injury. Second injury funds are financed through assessments on employers and, in a small number of jurisdictions, with general fund monies.24
Estimates for 2017 The workers’ compensation system involves multiple stakeholder groups: employers, workers, insurers, attorneys, medical providers, and state governments. The estimates presented in this report reflect the experience mainly of two groups: workers who rely on compensation for workplace injuries and illnesses and employers (including the federal government) who pay the bills. The estimates represent benefits and costs paid in each of the last five calendar years. Estimates of benefits for 2017 include only pay-ments made in 2017 for injuries and illnesses that occurred in 2017 and in prior years. If an employer purchases workers’ compensation insurance from a private insurer or state fund, estimates of costs for 2017 include premiums that incorporate projected future liabilities for injuries and illnesses that occur in 2017. If an employer is self-insured, the cost esti-mates include only those payments made in 2017, even though the employer is liable for future costs. For additional discussion of these measures, refer to the Addendum, Benefits Paid vs. Benefits Incurred.
22 All states allow employers to self-insure except for North Dakota and Wyoming, both of which require all employers to obtain work-
ers’ compensation insurance from their exclusive state funds.
23 Nearly all self-insured firms are required to post some type of financial security (e.g. surety bonds) so that workers’ compensation benefits are paid even if the employer experiences financial distress.
24 See Sources and Methods 2017 on the Academy’s website for further details on special funds, second injury funds, and guaranty funds.
Employers pay for workers’ compensation by purchasing
insurance from a private carrier, or a state workers’ compensation
insurance plan (called a state fund), or some large employers
may self-insure.
10 NATIONAL ACADEMY OF SOCIAL INSURANCE
The Academy has designed its measures to provide the best available estimates of workers’ compensation benefits, costs, and coverage in a given year and over time. The estimates are not designed to assess the performance of the insurance industry or insurance markets. Other organizations analyze insurance trends.25 The estimates also are not designed to mea-sure the performance of the workers’ compensation system with respect to: the prevention of occupation-al injuries and illnesses; the adequacy or equity of benefits paid to workers; the adequacy of payment for medical coverage; affordability of compensation; or the impact of vocational rehabilitation and job accommodations in returning injured employees to work or on the benefits they receive. Finally, it is not appropriate to use the estimates to compare the performance of workers’ compensation systems in different states. Benefits and costs vary across states not only due to differences in their workers’ compensation laws and systems, but also because states vary in the relative risk of their mix of industries and occupations. A meaningful compari-
son of benefits or costs across states is beyond the scope of this report. As described in the following table, Oregon produces a biannual report on state costs of workers’ compensation premiums that does control for industry mix. However, that report also lacks some controls needed for a valid comparison of system performance.
Covered Employment and Wages There is no national system for counting the number of jobs covered by workers’ compensation, so the number of covered jobs and amount of covered wages must be estimated. The Academy’s methodol-ogy is designed to count the number of jobs that are legally required to be covered by workers’ compensa-tion under state laws.26 (This is true for all states except Texas, for which we acquire information on both workers who are required to be covered, and also those who are covered but not required to be. It has recently come to our attention that not all work-ers in Wyoming are required to be covered by workers’ compensation. Until we have the necessary data, however, we will report 100 percent coverage in Wyoming.) Methods for Estimating Covered Employment and Wages
We use the number of jobs and amount of wages covered by unemployment insurance (UI) in each state as the starting point for our estimates.27 Then, we estimate the number of jobs that are not required to be covered by workers’ compensation according to each state’s statute regarding exemptions for small firms and/or agricultural employers. We subtract the number of exempted jobs from the UI base to deter-mine the number of UI-covered jobs that are covered by workers’ compensation. We then calculate the proportion of UI-covered jobs that are covered by workers’ compensation in each state, and apply this
25 The National Council on Compensation Insurance and state rating bureaus, for example, assess insurance developments in the states
and advise regulators and insurers on proposed insurance rates.
26 Workers’ compensation covered employment is measured in terms of “covered jobs” as opposed to “covered workers.” Refer to Appendix A, Employed Workforce Coverage Estimates.
27 Unemployment Insurance (UI) programs provide cash benefits to workers who become unemployed (through no fault of their own) and meet specific eligibility requirements. The UI programs are largely controlled by the states, although there are several federal standards, including a requirement that states produce uniform data. (These aspects of federal involvement are not present in work-ers’ compensation.)
The Academy’s measures are designed to provide the best
available estimates of workers’ compensation benefits, costs, and coverage at the state and national
levels. The estimates provide data on trends over time, both nationally
and within states. However, it is not appropriate to use the estimates to
compare the performance of workers’ compensation systems
across different states.
Workers’ Compensation: Benefits, Costs, and Coverage • 11
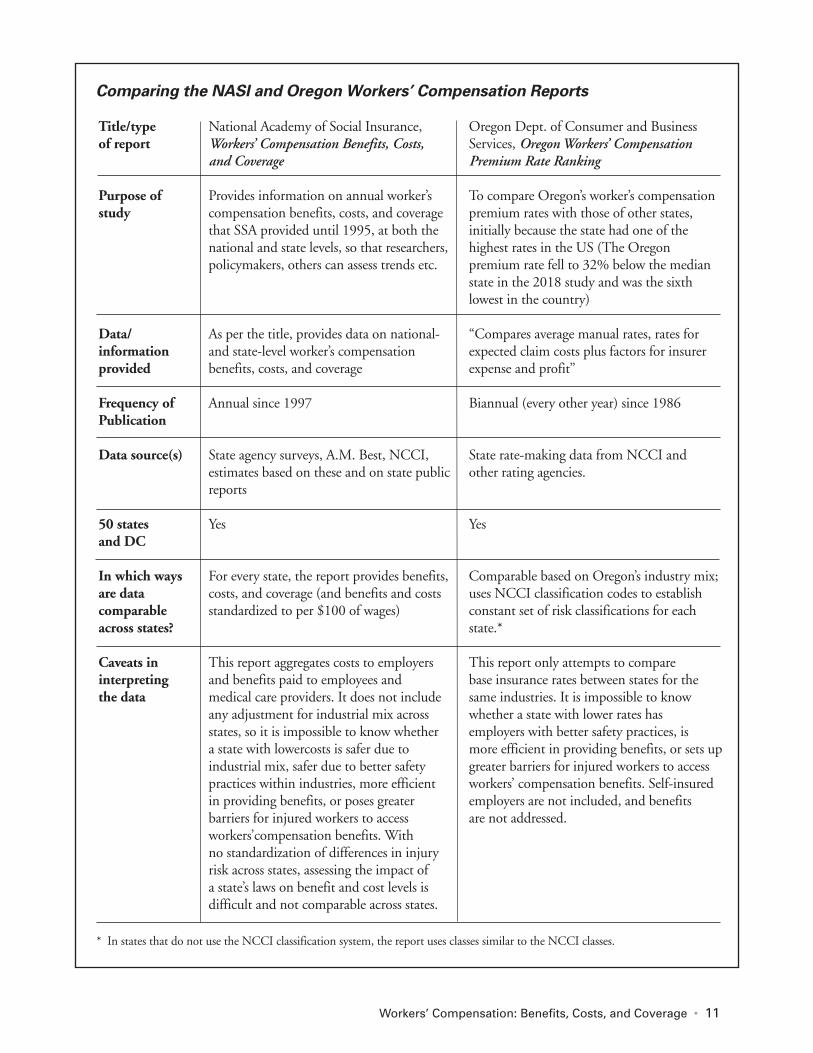
Comparing the NASI and Oregon Workers’ Compensation Reports
Title/type National Academy of Social Insurance, Oregon Dept. of Consumer and Business of report Workers’ Compensation Benefits, Costs, Services, Oregon Workers’ Compensation
and Coverage Premium Rate Ranking
Purpose of Provides information on annual worker’s To compare Oregon’s worker’s compensation study compensation benefits, costs, and coverage premium rates with those of other states,
that SSA provided until 1995, at both the initially because the state had one of the national and state levels, so that researchers, highest rates in the US (The Oregon policymakers, others can assess trends etc. premium rate fell to 32% below the median
state in the 2018 study and was the sixth lowest in the country)
Data/ As per the title, provides data on national- “Compares average manual rates, rates for information and state-level worker’s compensation expected claim costs plus factors for insurer provided benefits, costs, and coverage expense and profit” Frequency of Annual since 1997 Biannual (every other year) since 1986 Publication Data source(s) State agency surveys, A.M. Best, NCCI, State rate-making data from NCCI and
estimates based on these and on state public other rating agencies. reports
50 states Yes Yes and DC In which ways For every state, the report provides benefits, Comparable based on Oregon’s industry mix;are data costs, and coverage (and benefits and costs uses NCCI classification codes to establish comparable standardized to per $100 of wages) constant set of risk classifications for each across states? state.* Caveats in This report aggregates costs to employers This report only attempts to compare interpreting and benefits paid to employees and base insurance rates between states for the the data medical care providers. It does not include same industries. It is impossible to know
any adjustment for industrial mix across whether a state with lower rates has states, so it is impossible to know whether employers with better safety practices, is a state with lowercosts is safer due to more efficient in providing benefits, or sets upindustrial mix, safer due to better safety greater barriers for injured workers to access practices within industries, more efficient workers’ compensation benefits. Self-insured in providing benefits, or poses greater employers are not included, and benefits barriers for injured workers to access are not addressed. workers’compensation benefits. With no standardization of differences in injury risk across states, assessing the impact of a state’s laws on benefit and cost levels is difficult and not comparable across states.
* In states that do not use the NCCI classification system, the report uses classes similar to the NCCI classes.

proportion to the state’s UI-covered wages to obtain total workers’ compensation covered wages. In Texas, where coverage is optional for employers, we apply the proportion of jobs in firms that opt in to work-ers’ compensation to the UI base. The Academy’s methodology may undercount the actual number of jobs (and amount of wages) cov-ered because some employers that are not required to carry workers’ compensation coverage do so anyway. For example, self-employed persons are not typically required to carry unemployment or workers’ com-pensation insurance, but, in some states, those persons may voluntarily elect to be covered. Likewise, in states with exemptions for small firms, some of those small firms may voluntarily purchase workers’ compensation insurance. On the other hand, our methodology may overesti-mate the number of jobs (and wages) covered because some employers who are required to carry state’s workers’ compensation insurance do not do so. Every state has a program to detect and penalize employers who fail to report or cover jobs under state labor statutes, but no definitive national study has documented the extent of noncompliance. (For more details on the Academy’s methods for estimat-ing coverage, refer to Appendix A.)
National Estimates of Covered Employment and Wages
In 2017, workers’ compensation covered an estimat-ed 140.4 million U.S. jobs, a 1.4 percent increase from the previous year (Table 2). Covered wages totaled $7.8 trillion, an increase of 4.8 percent from 2016 (Table 2). Covered employment and wages have increased steadily since 2010, but the rate of increase has fluctuated across those years. Between 2013 and 2017, covered non-federal employment increased by an estimated nearly 10 million jobs, or 7.7 percent (Table 3). Covered non-federal wages increased much more substantially, by $1.25 trillion or 19.9 percent (Table 4). Overall, in 2017, workers’ compensation coverage extended to an estimated 97.5 percent of all non-federal jobs covered by unemployment insurance (Table A.1), and 86.8 percent of all jobs in the U.S. (Table A.2).28 In contrast to the trend in the non-federal sector, coverage in the federal workers’ compensation pro-gram grew by just 1.1 percent between 2013 and 2017, adding 32,000 jobs (Table 3). This was due to a combination of a decline in covered jobs of 0.5 percent between 2013 and 2015 and a rebound of 1.7 percent from 2015 to 2017. With respect to covered wages, federal workers gained ground by 6.3 percent from 2013 to 2015, and by 5.0 percent from 2015-2017, for a total of an 11.6 percent increase over the study period (Table 4). State Estimates of Covered Employment and Wages
Between 2013 and 2017, all states except Alaska, North Dakota, West Virginia, and Wyoming experi-enced an increase in the number of jobs covered by workers’ compensation (Table 3). Alaska experienced an increase in covered jobs from 2013 to 2015
12 NATIONAL ACADEMY OF SOCIAL INSURANCE
While the rates of increase have fluctuated in recent years, covered employment and wages have both increased steadily since 2010. From
2013-2017, covered non-federal employment increased by about 10 million jobs, or 7.7 percent.
28 According to unpublished estimates provided by the BLS, 3.6 percent of civilian (non-federal) workers represented by the BLS
National Compensation Survey (NCS) were employed in establishments reporting zero annual workers’ compensation costs in March 2018 (DOL, 2019). Civilian workers are those employed in private industry or state and local governments. Excluded from private industry are the self-employed and farm and private household workers. Federal government workers are excluded from the public sector. The private industry series and the state and local government series provide data for the two sectors separately. The Academy’s estimate of legally required workers’ compensation coverage is 97.5 percent of all non-federal UI covered jobs in 2017, slightly above NCS estimates.

Workers’ Compensation: Benefits, Costs, and Coverage • 1313 NATIONAL ACADEMY OF SOCIAL INSURANCE
Table 2
Workers' Compensation Covered Jobs and Covered Wages, 1997-2017
Covered Workers Covered Wages Year (thousands) Percent Change (billions) Percent Change
1997 118,145 2.9 3,591 7.6
1998 121,485 2.8 3,885 8.2
1999 124,349 2.4 4,151 6.8
2000 127,141 2.2 4,495 8.3
2001 126,972 -0.1 4,604 2.4
2002 125,603 -1.1 4,615 0.2
2003 124,685 -0.7 4,717 2.2
2004 125,878 1.0 4,953 5.0
2005 128,158 1.8 5,213 5.3
2006 130,339 1.7 5,544 6.3
2007 131,734 1.1 5,857 5.6
2008 130,643 -0.8 5,954 1.7
2009 124,856 -4.4 5,675 -4.7
2010 124,638 -0.2 5,834 2.8
2011 125,876 1.0 6,058 3.8
2012 127,916 1.6 6,335 4.6
2013 130,561 2.1 6,509 2.8
2014 133,081 1.9 6,840 5.1
2015 136,001 2.2 7,206 5.4
2016 138,459 1.8 7,432 3.1
2017 140,397 1.4 7,785 4.8
Source: National Academy of Social Insurance estimates. See Appendix A for more details.

14 NATIONAL ACADEMY OF SOCIAL INSURANCE
Tab
le 3
W
orke
rs' C
ompe
nsat
ion
Cov
ered
Job
s by
Sta
te, 2
013-
2017
Num
ber
of Jo
bs (i
n th
ousa
nds)
Per
cent
Cha
nge
Ran
king
Stat
e20
1320
1420
1520
16 2
017
2013
-201
5 2
015-
2017
2013
-201
7
Ala
bam
a1,
717
1,73
71,
765
1,79
01,
811
2.8
2.6
5.5
27
Ala
ska
313
315
317
311
307
1.2
-3.1
-1.9
48
Ari
zona
2,43
12,
485
2,55
52,
625
2,69
25.
15.
410
.711
Ark
ansa
s1,
098
1,10
91,
129
1,14
41,
153
2.8
2.1
5.0
32
Cal
iforn
ia15
,139
15,5
6716
,051
16,4
7116
,775
6.0
4.5
10.8
10
Col
orad
o2,
271
2,35
32,
428
2,48
52,
542
6.9
4.7
12.0
6
Con
nect
icut
1,62
31,
636
1,64
51,
649
1,65
21.
40.
41.
845
Del
awar
e40
741
742
743
243
55.
01.
97.
017
Dis
tric
t of C
olum
bia
519
532
545
556
565
5.1
3.5
8.8
15
Flor
ida
7,04
57,
278
7,56
17,
827
8,00
67.
35.
913
.63
Geo
rgia
3,73
73,
849
3,96
84,
077
4,15
96.
24.
811
.37
Haw
aii
583
593
605
614
621
3.7
2.6
6.4
20
Idah
o61
863
465
267
569
45.
56.
412
.25
Illin
ois
5,59
05,
669
5,75
45,
801
5,84
02.
91.
54.
535
Indi
ana
2,79
92,
842
2,89
22,
936
2,96
73.
32.
66.
022
Iow
a1,
464
1,48
31,
497
1,50
61,
506
2.2
0.6
2.8
42
Kan
sas
1,30
31,
322
1,33
21,
335
1,33
52.
20.
32.
543
Ken
tuck
y1,
738
1,76
51,
794
1,82
01,
833
3.2
2.2
5.5
25
Loui
siana
1,85
81,
889
1,89
61,
873
1,87
22.
1-1
.30.
847
Mai
ne56
957
357
858
559
11.
62.
13.
838
Mar
ylan
d2,
384
2,40
62,
443
2,47
72,
503
2.5
2.4
5.0
30
Mas
sach
uset
ts3,
244
3,31
53,
382
3,44
83,
497
4.3
3.4
7.8
16
Mic
higa
n3,
944
4,01
54,
085
4,16
44,
217
3.6
3.2
6.9
18
Min
neso
ta2,
643
2,68
22,
727
2,76
52,
805
3.2
2.9
6.1
21
Miss
issi
ppi
1,01
81,
027
1,04
11,
052
1,05
62.
31.
43.
739
(1=l
arge
st p
erce
nt in
crea
se,
2013
-201
7)
Workers’ Compensation: Benefits, Costs, and Coverage • 15
Miss
ouri
2,46
72,
496
2,54
12,
578
2,60
23.
02.
45.
526
Mon
tana
421
424
432
438
442
2.7
2.4
5.1
28
Neb
rask
a90
591
893
194
094
42.
91.
44.
336
Nev
ada
1,14
01,
182
1,22
41,
262
1,30
47.
46.
514
.41
New
Ham
pshi
re61
161
962
964
064
63.
02.
65.
723
New
Jers
ey3,
769
3,79
33,
841
3,90
53,
957
1.9
3.0
5.0
31
New
Mex
ico
738
746
755
756
759
2.4
0.5
2.9
41
New
Yor
k8,
549
8,71
08,
878
9,01
59,
137
3.8
2.9
6.9
19
Nor
th C
arol
ina
3,81
43,
899
4,00
24,
099
4,16
84.
94.
19.
314
Nor
th D
akot
a41
443
242
440
440
12.
4-5
.5-3
.250
Ohi
o5,
033
5,10
85,
182
5,24
25,
286
2.9
2.0
5.0
29
Okl
ahom
a1,
502
1,52
71,
538
1,51
81,
523
2.3
-0.9
1.4
46
Ore
gon
1,65
11,
699
1,76
01,
813
1,85
56.
55.
412
.34
Penn
sylv
ania
5,48
25,
529
5,57
65,
621
5,68
21.
71.
93.
640
Rho
de Is
land
445
452
459
462
466
3.0
1.5
4.6
34
Sout
h C
arol
ina
1,75
51,
804
1,85
81,
904
1,94
15.
94.
410
.612
Sout
h D
akot
a38
939
540
040
440
62.
81.
54.
337
Tenn
esse
e2,
550
2,60
72,
677
2,74
52,
787
5.0
4.1
9.3
13
Texa
s8,
678
8,90
39,
238
9,47
29,
642
6.5
4.4
11.1
9
Uta
h1,
216
1,25
31,
301
1,34
81,
390
7.0
6.8
14.3
2
Ver
mon
t29
229
529
829
830
01.
80.
72.
544
Vir
gini
a3,
400
3,41
63,
490
3,54
33,
590
2.7
2.9
5.6
24
Was
hing
ton
2,88
92,
972
3,04
93,
141
3,21
55.
55.
511
.38
Wes
t Vir
gini
a68
067
767
266
065
9-1
.1-1
.9-3
.049
Wis
cons
in2,
671
2,70
82,
742
2,77
52,
797
2.7
2.0
4.7
33
Wyo
min
g27
227
727
526
426
21.
2-4
.8-3
.751
Tota
l Non
-Fed
eral
127,
790
130,
337
133,
244
135,
666
137,
594
4.3
3.3
7.7
Fede
ral E
mpl
oyee
s2,
771
2,74
42,
756
2,79
32,
803
-0.5
1.7
1.1
TO
TA
L13
0,56
113
3,08
113
6,00
113
8,45
914
0,39
74.
23.
27.
5
Sour
ce: N
atio
nal A
cade
my
of S
ocia
l Ins
uran
ce e
stim
ates
. See
App
endi
x A
for
mor
e de
tails
.
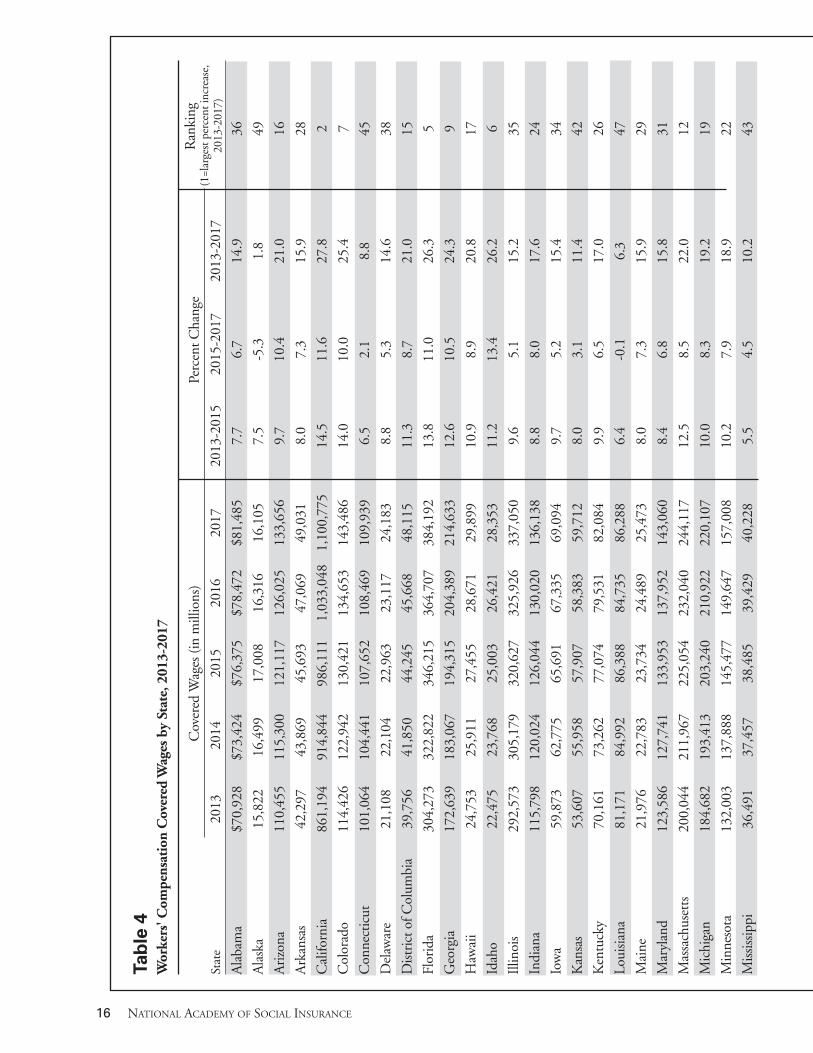
16 NATIONAL ACADEMY OF SOCIAL INSURANCE
Tab
le 4
W
orke
rs' C
ompe
nsat
ion
Cov
ered
Wag
es b
y St
ate,
201
3-20
17
Cov
ered
Wag
es (i
n m
illio
ns)
P
erce
nt C
hang
e R
anki
ng
Stat
e20
13 2
014
2015
2016
2017
2013
-201
5
2015
-201
720
13-2
017
Ala
bam
a$7
0,92
8$7
3,42
4$7
6,37
5$7
8,47
2$8
1,48
57.
76.
714
.936
Ala
ska
15,8
2216
,499
17,0
0816
,316
16,1
057.
5-5
.31.
849
Ari
zona
110,
455
115,
300
121,
117
126,
025
133,
656
9.7
10.4
21.0
16
Ark
ansa
s42
,297
43,8
6945
,693
47,0
6949
,031
8.0
7.3
15.9
28
Cal
iforn
ia86
1,19
491
4,84
498
6,11
11,
033,
048
1,10
0,77
514
.511
.627
.82
Col
orad
o11
4,42
612
2,94
213
0,42
113
4,65
314
3,48
614
.010
.025
.47
Con
nect
icut
101,
064
104,
441
107,
652
108,
469
109,
939
6.5
2.1
8.8
45
Del
awar
e21
,108
22,1
0422
,963
23,1
1724
,183
8.8
5.3
14.6
38
Dis
tric
t of C
olum
bia
39,7
5641
,850
44,2
4545
,668
48,1
1511
.38.
721
.015
Flor
ida
304,
273
322,
822
346,
215
364,
707
384,
192
13.8
11.0
26.3
5
Geo
rgia
172,
639
183,
067
194,
315
204,
389
214,
633
12.6
10.5
24.3
9
Haw
aii
24,7
5325
,911
27,4
5528
,671
29,8
9910
.98.
920
.817
Idah
o22
,475
23,7
6825
,003
26,4
2128
,353
11.2
13.4
26.2
6
Illin
ois
292,
573
305,
179
320,
627
325,
926
337,
050
9.6
5.1
15.2
35
Indi
ana
115,
798
120,
024
126,
044
130,
020
136,
138
8.8
8.0
17.6
24
Iow
a59
,873
62,7
7565
,691
67,3
3569
,094
9.7
5.2
15.4
34
Kan
sas
53,6
0755
,958
57,9
0758
,383
59,7
128.
03.
111
.442
Ken
tuck
y70
,161
73,2
6277
,074
79,5
3182
,084
9.9
6.5
17.0
26
Loui
sian
a81
,171
84,9
9286
,388
84,7
3586
,288
6.4
-0.1
6.3
47
Mai
ne21
,976
22,7
8323
,734
24,4
8925
,473
8.0
7.3
15.9
29
Mar
ylan
d12
3,58
612
7,74
113
3,95
313
7,95
214
3,06
08.
46.
815
.831
Mas
sach
uset
ts20
0,04
421
1,96
722
5,05
423
2,04
024
4,11
712
.58.
522
.012
Mic
higa
n18
4,68
219
3,41
320
3,24
021
0,92
222
0,10
710
.08.
319
.219
Min
neso
ta13
2,00
313
7,88
814
5,47
714
9,64
715
7,00
810
.27.
918
.922
Miss
issip
pi36
,491
37,4
5738
,485
39,4
2940
,228
5.5
4.5
10.2
43
(1=l
arge
st p
erce
nt in
crea
se,
2013
-201
7)
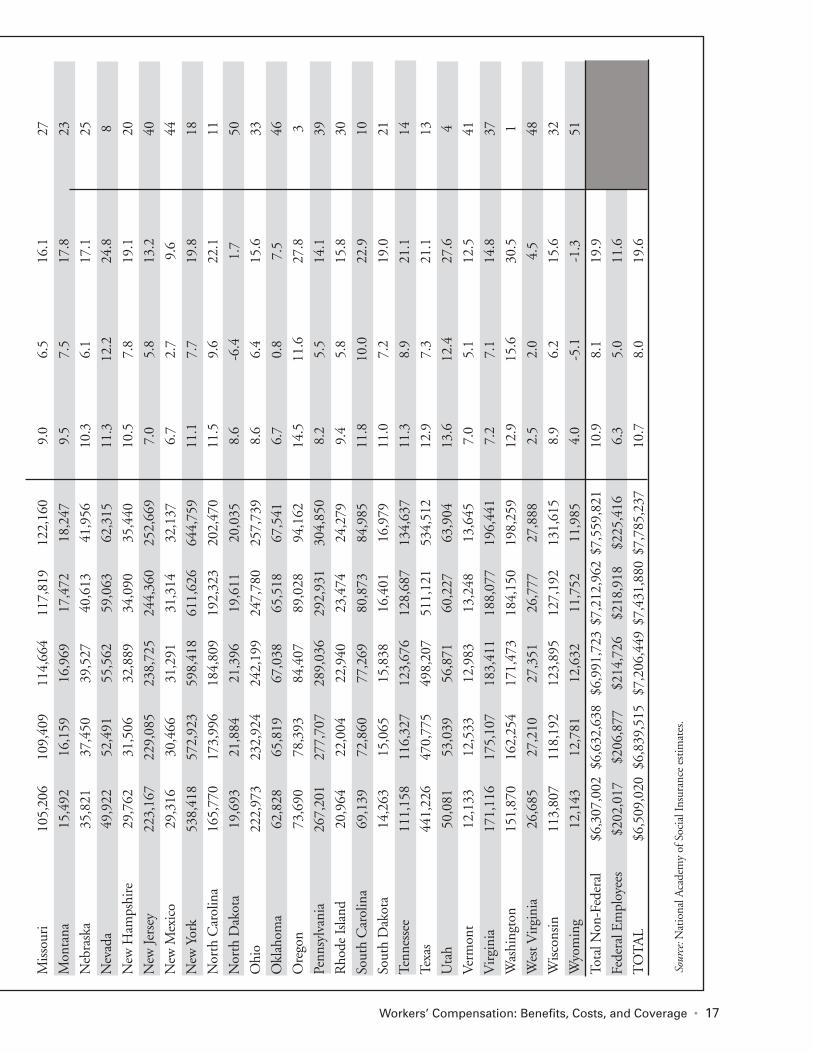
Workers’ Compensation: Benefits, Costs, and Coverage • 17
Miss
ouri
105,
206
109,
409
114,
664
117,
819
122,
160
9.0
6.5
16.1
27
Mon
tana
15,4
9216
,159
16,9
6917
,472
18,2
479.
57.
517
.823
Neb
rask
a35
,821
37,4
5039
,527
40,6
1341
,956
10.3
6.1
17.1
25
Nev
ada
49,9
2252
,491
55,5
6259
,063
62,3
1511
.312
.224
.88
New
Ham
pshi
re29
,762
31,5
0632
,889
34,0
9035
,440
10.5
7.8
19.1
20
New
Jers
ey22
3,16
722
9,08
523
8,72
524
4,36
025
2,66
97.
05.
813
.240
New
Mex
ico
29,3
1630
,466
31,2
9131
,314
32,1
376.
72.
79.
644
New
Yor
k53
8,41
857
2,92
359
8,41
861
1,62
664
4,75
911
.17.
719
.818
Nor
th C
arol
ina
165,
770
173,
996
184,
809
192,
323
202,
470
11.5
9.6
22.1
11
Nor
th D
akot
a19
,693
21,8
8421
,396
19,6
1120
,035
8.6
-6.4
1.7
50
Ohi
o22
2,97
323
2,92
424
2,19
924
7,78
025
7,73
98.
66.
415
.633
Okl
ahom
a62
,828
65,8
1967
,038
65,5
1867
,541
6.7
0.8
7.5
46
Ore
gon
73,6
9078
,393
84,4
0789
,028
94,1
6214
.511
.627
.83
Penn
sylv
ania
267,
201
277,
707
289,
036
292,
931
304,
850
8.2
5.5
14.1
39
Rho
de Is
land
20,9
6422
,004
22,9
4023
,474
24,2
799.
45.
815
.830
Sout
h C
arol
ina
69,1
3972
,860
77,2
6980
,873
84,9
8511
.810
.022
.910
Sout
h D
akot
a14
,263
15,0
6515
,838
16,4
0116
,979
11.0
7.2
19.0
21
Tenn
esse
e11
1,15
811
6,32
712
3,67
612
8,68
713
4,63
711
.38.
921
.114
Texa
s44
1,22
647
0,77
549
8,20
751
1,12
153
4,51
212
.97.
321
.113
Uta
h50
,081
53,0
3956
,871
60,2
2763
,904
13.6
12.4
27.6
4
Ver
mon
t12
,133
12,5
3312
,983
13,2
4813
,645
7.0
5.1
12.5
41
Vir
gini
a17
1,11
617
5,10
718
3,41
118
8,07
719
6,44
17.
27.
114
.837
Was
hing
ton
151,
870
162,
254
171,
473
184,
150
198,
259
12.9
15.6
30.5
1
Wes
t Vir
gini
a26
,685
27,2
1027
,351
26,7
7727
,888
2.5
2.0
4.5
48
Wisc
onsin
113,
807
118,
192
123,
895
127,
192
131,
615
8.9
6.2
15.6
32
Wyo
min
g12
,143
12,7
8112
,632
11,7
5211
,985
4.0
-5.1
-1.3
51
Tota
l Non
-Fed
eral
$6,3
07,0
02$6
,632
,638
$6,9
91,7
23$7
,212
,962
$7,5
59,8
2110
.98.
119
.9
Fede
ral E
mpl
oyee
s$2
02,0
17$2
06,8
77$2
14,7
26$2
18,9
18$2
25,4
166.
35.
011
.6
TO
TA
L$6
,509
,020
$6,8
39,5
15$7
,206
,449
$7,4
31,8
80$7
,785
,237
10.7
8.0
19.6
So
urce
: Nat
iona
l Aca
dem
y of
Soc
ial I
nsur
ance
est
imat
es.
18 NATIONAL ACADEMY OF SOCIAL INSURANCE
coupled with a larger decrease in the following two years, yielding a net decrease. Similarly, North Dakota’s large decrease in covered jobs between 2015 and 2017 (of 5.5%) much more than offset the 2.4% 2013-2015 increase, rendering it 50th of 51 jurisdictions in terms of growth in covered jobs. The three states with the largest percentage gains in covered employment were Nevada (14.4%), Utah (14.3%), and Florida (13.6%).
Covered wages largely parallel the trend in covered jobs (covered wages must grow more quickly than covered jobs unless there is no wage growth in the economy at all). The across-the-board increases in both largely represent the continuing improvement in the economy over the analysis period. Indeed, Wyoming was the only state to experience a decrease in covered wages over this period (of 1.3%) with all other states seeing modest-to-substantial increases. The vast majority of states – 43 – experienced increases in covered wages of more than 10 percent. Four West Coast states – Washington, California, Oregon, and Utah – experienced the greatest increases (30.5%, 27.8%, 27.8%, and 27.6%). States with the smallest increases include North Dakota (1.7%), Alaska (1.8%), and West Virginia (4.5%).
Workers’ Compensation Benefits Paid Data Sources and Methods for Estimating Benefits Paid
This section describes the primary data sources that we use to estimate workers’ compensation benefits nationally and for each state. A detailed, state-by-state explanation of how the benefit estimates in this report are produced is available in Sources and Methods: A Companion to Workers’ Compensation: Benefits, Costs, and Coverage 2017, on the Academy’s website (www.nasi.org) The Academy’s estimates of workers’ compensation benefits paid are based on three main data sources: 1) data from a questionnaire on workers’ compensa-tion benefits and costs, distributed annually by the Academy to state agencies overseeing workers’ com-pensation programs; 2) data purchased from A.M. Best, a private company that specializes in collecting insurance data and rating insurance companies; and 3) data from the National Council on Compensation Insurance (NCCI). The data from state agencies, A.M. Best, and NCCI allow us to piece together estimates of workers’ compensation benefits paid by private insurance carriers, state funds, and self-insured employers. The U.S. Department of Labor provides data on benefits paid through federal programs.29
Academy questionnaire. The primary source of data on benefits paid to injured workers is the responses of state workers’ compensation agencies to the Academy’s annual questionnaire. The questionnaire is designed to collect information on amounts of medical and cash benefits paid in a calendar year, as well as benefits paid through special funds, second injury funds, and guaranty funds. This year, we received responses from at least one agency or orga-nization in 37 out of 51 jurisdictions. States vary in their ability to provide complete data on benefits paid. One of the most common report-ing problems relates to benefits paid by self-insured employers. If a state does not report self-insured ben-
29 Note that while, in previous reports, Table 5 reports benefits paid by insurers, this report uses the term payer instead. We made this
change to clarify that states can be either employers or insurers, depending on the context, and that the federal government is a payer, but not an insurer, with respect to WC. That is, it pays benefits but does not insure other entities.
Between 2013 and 2017, almost every state experienced
increases in workers’ compensation covered employment, and
even greater percentage increases in covered wages.
Workers’ Compensation: Benefits, Costs, and Coverage • 19
efits, benefits are imputed using one of two methods. The first method utilizes historical self-insured bene-fits paid in the particular state, if available, along with information on the ratio of self-insured benefit payments to total benefits paid in states where the data are available to control for trends in self-insured benefit payments over time. If historical data are not available for the specific state we are estimating, we rely on a second method that utilizes covered wages in that state and the ratio of self-insured benefits to wages in states where the data are available. Among the states that did not directly reply to the survey, some published annual reports from which we could obtain the workers’ compensation informa-tion normally included in the questionnaire. For some states, we obtained information on benefits paid through special funds, second injury funds, or guaranty funds from data on the websites of the state workers’ compensation agency. A.M. Best data. The A.M. Best data supplement the state survey data in cases where the survey data are incomplete, missing, or determined to be incorrect. The A.M. Best data used for this report provide information on benefits paid in each state for 2013 through 2017 (A.M. Best, 2019). The data include information for all private carriers in every state and for 16 of the 22 state funds. The A.M. Best data do not include information about benefits paid by the other six state funds, by self-insured employers, by employers under deductible policies, or by special funds.30
NCCI data. NCCI is the primary source of data on medical benefits in the 38 states in which it is licensed (NCCI, 2019). In states where NCCI data are not available, estimates of medical benefits are based on report from the states. In cases where state data are incomplete and NCCI is licensed, NCCI is also a source for data on reimbursements paid through deductible policies and for amounts of cov-
ered wages for employers insured by private insurers or a competitive state fund. Estimating deductibles. The availability of deductible policies varies by state.31 Among the states that allow deductible policies, a few can pro-vide us with complete information on deductible policies, but most cannot. For states that provide information on deductibles, we rely on the survey data alone, or together with data from A.M. Best, to estimate amounts paid for the deductibles. For states that do not include deductibles in the survey, we rely on NCCI data on manual equivalent premiums, together with data from A.M. Best to estimate deductible payments.32 See Sources and Methods 2017 on the Academy’s website for a detailed description of the methods used to estimate deductibles. Benefits paid. The Academy’s estimates of workers’ compensation benefits in this report reflect amounts paid for work-related injuries and illnesses in calen-dar year 2017 regardless of when those injuries occurred. This measure of benefits is commonly used in reporting data on social insurance programs, pri-vate employee benefits, and other income security programs. Benefits incurred. A different measure, accident year incurred losses (or accident year incurred bene-fits) is the common reporting measure for private workers’ compensation insurers and some state funds. Incurred benefits measure the total expected benefits associated with injuries that occur in a par-ticular year, regardless of whether the benefits are paid in that year or future years. The two measures, accident year benefits paid and accident year benefits incurred, reveal important but different information. For a discussion of the relative merits of each mea-sure, refer to the Addendum, Benefits Paid vs. Benefits Incurred.
30 A.M. Best does not provided data on the four exclusive state funds (Ohio, North Dakota, Washington, and Wyoming), the state
fund in South Carolina that only provides benefits to government workers, or the state fund in West Virginia that discontinued in 2006, but was still paying benefits on roughly 11,000 claims in 2017.
31 Deductible policies are not allowed in the four states with exclusive state funds (Ohio, North Dakota, Washington, and Wyoming), or in Wisconsin. Five states (California, New York, Oregon, Pennsylvania, and Rhode Island) do not allow deductible policies in the competitive state funds.
32 Accurately estimating high-deductible policies is particularly challenging. The Academy notes that numbers in this report may not fully capture either the benefits or costs, and is working on better methodology for the latter.
20 NATIONAL ACADEMY OF SOCIAL INSURANCE
National Estimates of Benefits Paid
Total benefits paid. Table 5 shows workers’ com-pensation benefits paid by each type of payer (private insurer, state fund, self-insured, federal government) from 1997 to 2017. Altogether, workers’ compensa-tion payers paid about $62 billion in benefits in 2017, a 0.15 percent decrease from the total paid in 2016. Private carriers were the largest single payer category, followed by self-insured employers, state funds, and the federal government.
Benefits by type of payer. In 2017, private insurers continued to dominate the workers’ compensation insurance market, with 55.5 percent of all coverage and $34.4 billion in benefits paid. Self-insured employers were the next largest payer, with 24.6 per-cent of all coverage and $15.3 billion in benefits paid. State funds paid $8.8 billion (14.3%) and the federal government the remaining $3.5 billion (5.6%) of all coverage. (Table 5) Over the last two decades, the workers’ compensa-tion insurance market has shifted away from coverage by state funds and toward coverage by pri-vate insurers. As shown in Table 5, private insurance carriers increased their share of benefits paid by 3.9 percentage points between 1997 and 2017, while the share of benefits paid by state funds declined by nearly three percentage points.33
Over the same period, there has been fairly little change in the share of workers’ compensation bene-fits paid by self-insured employers or the federal government. Self-insured employers accounted for 24.6 percent of total benefits paid, and the federal government for 5.6 percent in 2017.34 Deductibles. Employers who have workers’ compen-sation policies with deductibles must reimburse their insurer for benefits paid up to the deductible amount. Part of the benefit payments that are attrib-uted to private insurers and state funds in Table 5 are thus paid by employers, as is depicted in Table 7. In 2017, employers paid $10.7 billion in benefits under deductible policies, or 17.3 percent of total benefits paid (Table 6). The vast majority of benefits paid under deductible provisions are by employers covered through private insurers (97.2% of total deductibles paid in 2017), as opposed to deductibles paid by employers covered through a state fund (2.8% of total). The share of benefits paid by employers under deductible provisions increased by 53.2 percent between 1997 and 2007, and by anoth-er 18.6 percent between 2007 and 2017. Employers who have policies with deductibles are, in effect, self-insured up to the amount of the deductible.35 If we allocate the amount of benefits paid under deductibles to self-insurance (instead of to private carriers as in Table 5) we obtain a more accurate picture of the share of the workers’ compen-sation market for which employers are assuming primary financial risk. Table 7 shows the share of
The $62 billion in total workers’ compensation benefits paid in 2017 represent a 0.15 percent decrease from 2016. This decline continues a trend that has been consistent across the last four years studied
in this report.
33 The decline in the relative importance of state funds in recent years largely reflects the decline in coverage of the California State
Fund (which accounted for 50 percent of the California workers’ compensation insurance market in 2004 but only 10 percent more recently) and, to a lesser extent, the dissolution of funds in West Virginia (in 2009), Arizona (in 2012), and Utah (in 2017).
34 The self-insured share fluctuated slightly at the turn of the century, but never fell below 21.6 percent, and it has decreased by only 0.1 percentage points over the twenty year period in Table 5. While the federal government share is down 1 percentage point since 1997, since 1999 it has remained steady between 6.2 percent and 5.6 percent.
35 Deductible policies may be written in a variety of ways, and the maximum amount may represent a specified number of injuries and the corresponding benefits paid, or a specified amount of the aggregate benefits paid.
Over the last two decades, the workers’ compensation insurance
market has shifted away from coverage by state funds in favor of
coverage by private insurers.
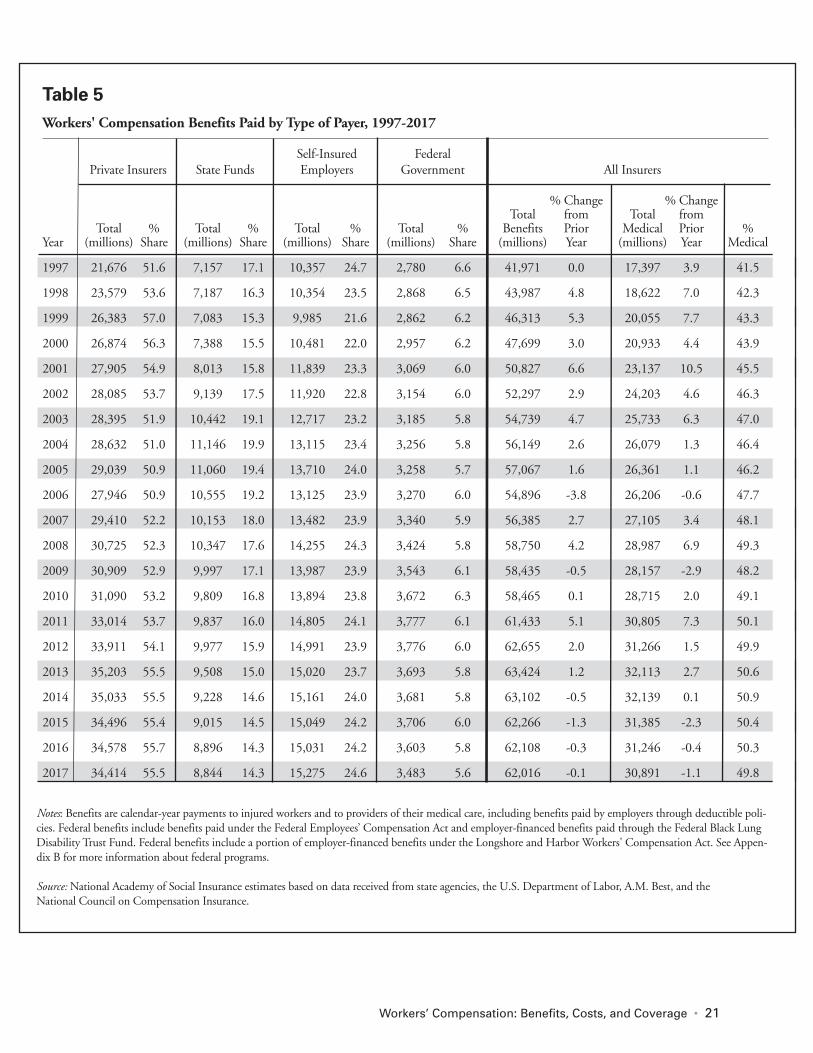
Workers’ Compensation: Benefits, Costs, and Coverage • 21
Table 5
Workers' Compensation Benefits Paid by Type of Payer, 1997-2017
Self-Insured Federal Private Insurers State Funds Employers Government All Insurers
% Change % Change
Total from Total from Total % Total % Total % Total % Benefits Prior Medical Prior %
Year (millions) Share (millions) Share (millions) Share (millions) Share (millions) Year (millions) Year Medical
1997 21,676 51.6 7,157 17.1 10,357 24.7 2,780 6.6 41,971 0.0 17,397 3.9 41.5
1998 23,579 53.6 7,187 16.3 10,354 23.5 2,868 6.5 43,987 4.8 18,622 7.0 42.3
1999 26,383 57.0 7,083 15.3 9,985 21.6 2,862 6.2 46,313 5.3 20,055 7.7 43.3
2000 26,874 56.3 7,388 15.5 10,481 22.0 2,957 6.2 47,699 3.0 20,933 4.4 43.9
2001 27,905 54.9 8,013 15.8 11,839 23.3 3,069 6.0 50,827 6.6 23,137 10.5 45.5
2002 28,085 53.7 9,139 17.5 11,920 22.8 3,154 6.0 52,297 2.9 24,203 4.6 46.3
2003 28,395 51.9 10,442 19.1 12,717 23.2 3,185 5.8 54,739 4.7 25,733 6.3 47.0
2004 28,632 51.0 11,146 19.9 13,115 23.4 3,256 5.8 56,149 2.6 26,079 1.3 46.4
2005 29,039 50.9 11,060 19.4 13,710 24.0 3,258 5.7 57,067 1.6 26,361 1.1 46.2
2006 27,946 50.9 10,555 19.2 13,125 23.9 3,270 6.0 54,896 -3.8 26,206 -0.6 47.7
2007 29,410 52.2 10,153 18.0 13,482 23.9 3,340 5.9 56,385 2.7 27,105 3.4 48.1
2008 30,725 52.3 10,347 17.6 14,255 24.3 3,424 5.8 58,750 4.2 28,987 6.9 49.3
2009 30,909 52.9 9,997 17.1 13,987 23.9 3,543 6.1 58,435 -0.5 28,157 -2.9 48.2
2010 31,090 53.2 9,809 16.8 13,894 23.8 3,672 6.3 58,465 0.1 28,715 2.0 49.1
2011 33,014 53.7 9,837 16.0 14,805 24.1 3,777 6.1 61,433 5.1 30,805 7.3 50.1
2012 33,911 54.1 9,977 15.9 14,991 23.9 3,776 6.0 62,655 2.0 31,266 1.5 49.9
2013 35,203 55.5 9,508 15.0 15,020 23.7 3,693 5.8 63,424 1.2 32,113 2.7 50.6
2014 35,033 55.5 9,228 14.6 15,161 24.0 3,681 5.8 63,102 -0.5 32,139 0.1 50.9
2015 34,496 55.4 9,015 14.5 15,049 24.2 3,706 6.0 62,266 -1.3 31,385 -2.3 50.4
2016 34,578 55.7 8,896 14.3 15,031 24.2 3,603 5.8 62,108 -0.3 31,246 -0.4 50.3
2017 34,414 55.5 8,844 14.3 15,275 24.6 3,483 5.6 62,016 -0.1 30,891 -1.1 49.8
Notes: Benefits are calendar-year payments to injured workers and to providers of their medical care, including benefits paid by employers through deductible poli-cies. Federal benefits include benefits paid under the Federal Employees’ Compensation Act and employer-financed benefits paid through the Federal Black Lung Disability Trust Fund. Federal benefits include a portion of employer-financed benefits under the Longshore and Harbor Workers' Compensation Act. See Appen-dix B for more information about federal programs. Source: National Academy of Social Insurance estimates based on data received from state agencies, the U.S. Department of Labor, A.M. Best, and the National Council on Compensation Insurance.
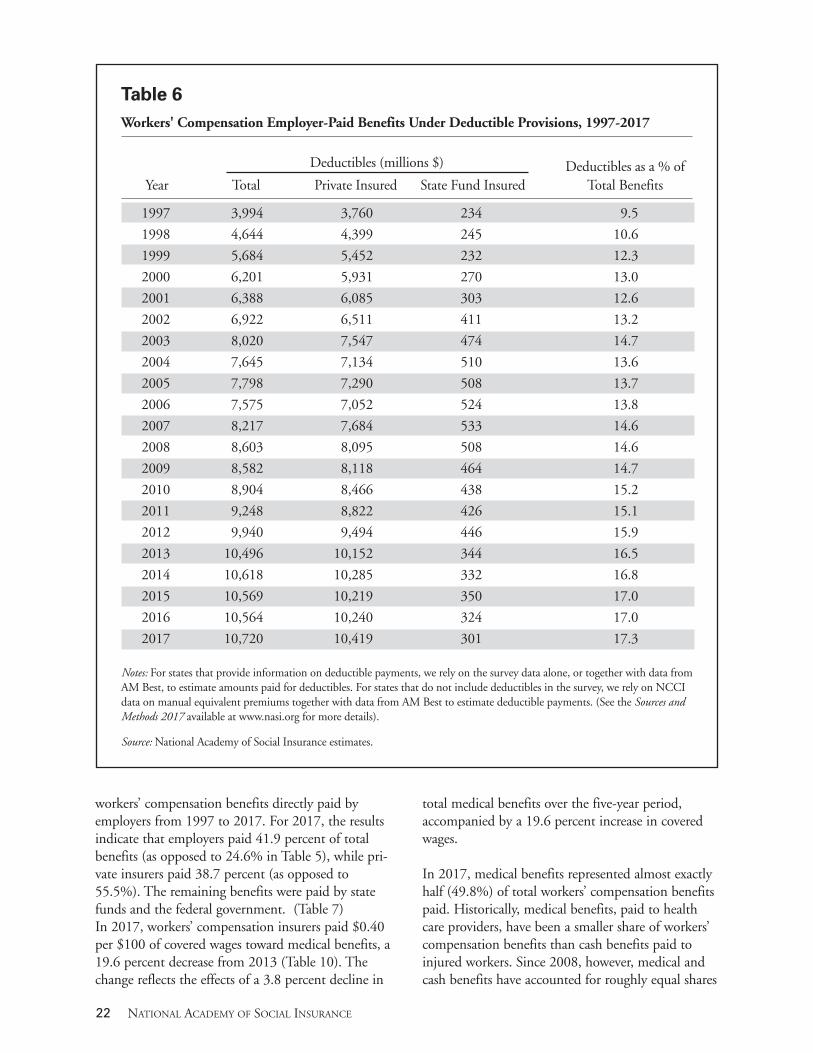
22 NATIONAL ACADEMY OF SOCIAL INSURANCE
workers’ compensation benefits directly paid by employers from 1997 to 2017. For 2017, the results indicate that employers paid 41.9 percent of total benefits (as opposed to 24.6% in Table 5), while pri-vate insurers paid 38.7 percent (as opposed to 55.5%). The remaining benefits were paid by state funds and the federal government. (Table 7) In 2017, workers’ compensation insurers paid $0.40 per $100 of covered wages toward medical benefits, a 19.6 percent decrease from 2013 (Table 10). The change reflects the effects of a 3.8 percent decline in
total medical benefits over the five-year period, accompanied by a 19.6 percent increase in covered wages. In 2017, medical benefits represented almost exactly half (49.8%) of total workers’ compensation benefits paid. Historically, medical benefits, paid to health care providers, have been a smaller share of workers’ compensation benefits than cash benefits paid to injured workers. Since 2008, however, medical and cash benefits have accounted for roughly equal shares
Table 6
Workers' Compensation Employer-Paid Benefits Under Deductible Provisions, 1997-2017
Deductibles (millions $) Deductibles as a % of Year Total Private Insured State Fund Insured Total Benefits
1997 3,994 3,760 234 9.5
1998 4,644 4,399 245 10.6
1999 5,684 5,452 232 12.3
2000 6,201 5,931 270 13.0
2001 6,388 6,085 303 12.6
2002 6,922 6,511 411 13.2
2003 8,020 7,547 474 14.7
2004 7,645 7,134 510 13.6
2005 7,798 7,290 508 13.7
2006 7,575 7,052 524 13.8
2007 8,217 7,684 533 14.6
2008 8,603 8,095 508 14.6
2009 8,582 8,118 464 14.7
2010 8,904 8,466 438 15.2
2011 9,248 8,822 426 15.1
2012 9,940 9,494 446 15.9
2013 10,496 10,152 344 16.5
2014 10,618 10,285 332 16.8
2015 10,569 10,219 350 17.0
2016 10,564 10,240 324 17.0
2017 10,720 10,419 301 17.3 Notes: For states that provide information on deductible payments, we rely on the survey data alone, or together with data from AM Best, to estimate amounts paid for deductibles. For states that do not include deductibles in the survey, we rely on NCCI data on manual equivalent premiums together with data from AM Best to estimate deductible payments. (See the Sources and Methods 2017 available at www.nasi.org for more details).
Source: National Academy of Social Insurance estimates.
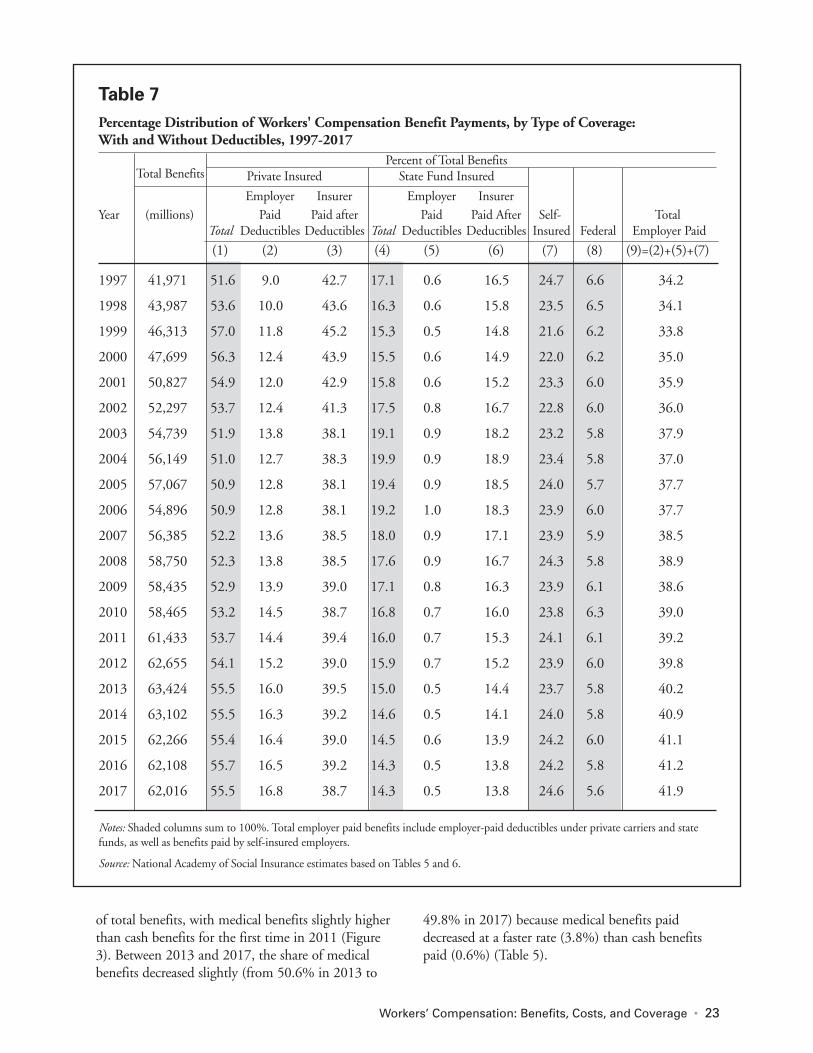
of total benefits, with medical benefits slightly higher than cash benefits for the first time in 2011 (Figure 3). Between 2013 and 2017, the share of medical benefits decreased slightly (from 50.6% in 2013 to
49.8% in 2017) because medical benefits paid decreased at a faster rate (3.8%) than cash benefits paid (0.6%) (Table 5).
Workers’ Compensation: Benefits, Costs, and Coverage • 23
Table 7
Percentage Distribution of Workers' Compensation Benefit Payments, by Type of Coverage: With and Without Deductibles, 1997-2017
Total Benefits Percent of Total Benefits
Private Insured State Fund Insured Employer Insurer Employer Insurer
Year (millions) Paid Paid after Paid Paid After Self- Total Total Deductibles Deductibles Total Deductibles Deductibles Insured Federal Employer Paid
(1) (2) (3) (4) (5) (6) (7) (8) (9)=(2)+(5)+(7)
1997 41,971 51.6 9.0 42.7 17.1 0.6 16.5 24.7 6.6 34.2
1998 43,987 53.6 10.0 43.6 16.3 0.6 15.8 23.5 6.5 34.1
1999 46,313 57.0 11.8 45.2 15.3 0.5 14.8 21.6 6.2 33.8
2000 47,699 56.3 12.4 43.9 15.5 0.6 14.9 22.0 6.2 35.0
2001 50,827 54.9 12.0 42.9 15.8 0.6 15.2 23.3 6.0 35.9
2002 52,297 53.7 12.4 41.3 17.5 0.8 16.7 22.8 6.0 36.0
2003 54,739 51.9 13.8 38.1 19.1 0.9 18.2 23.2 5.8 37.9
2004 56,149 51.0 12.7 38.3 19.9 0.9 18.9 23.4 5.8 37.0
2005 57,067 50.9 12.8 38.1 19.4 0.9 18.5 24.0 5.7 37.7
2006 54,896 50.9 12.8 38.1 19.2 1.0 18.3 23.9 6.0 37.7
2007 56,385 52.2 13.6 38.5 18.0 0.9 17.1 23.9 5.9 38.5
2008 58,750 52.3 13.8 38.5 17.6 0.9 16.7 24.3 5.8 38.9
2009 58,435 52.9 13.9 39.0 17.1 0.8 16.3 23.9 6.1 38.6
2010 58,465 53.2 14.5 38.7 16.8 0.7 16.0 23.8 6.3 39.0
2011 61,433 53.7 14.4 39.4 16.0 0.7 15.3 24.1 6.1 39.2
2012 62,655 54.1 15.2 39.0 15.9 0.7 15.2 23.9 6.0 39.8
2013 63,424 55.5 16.0 39.5 15.0 0.5 14.4 23.7 5.8 40.2
2014 63,102 55.5 16.3 39.2 14.6 0.5 14.1 24.0 5.8 40.9
2015 62,266 55.4 16.4 39.0 14.5 0.6 13.9 24.2 6.0 41.1
2016 62,108 55.7 16.5 39.2 14.3 0.5 13.8 24.2 5.8 41.2
2017 62,016 55.5 16.8 38.7 14.3 0.5 13.8 24.6 5.6 41.9
Notes: Shaded columns sum to 100%. Total employer paid benefits include employer-paid deductibles under private carriers and state funds, as well as benefits paid by self-insured employers. Source: National Academy of Social Insurance estimates based on Tables 5 and 6.
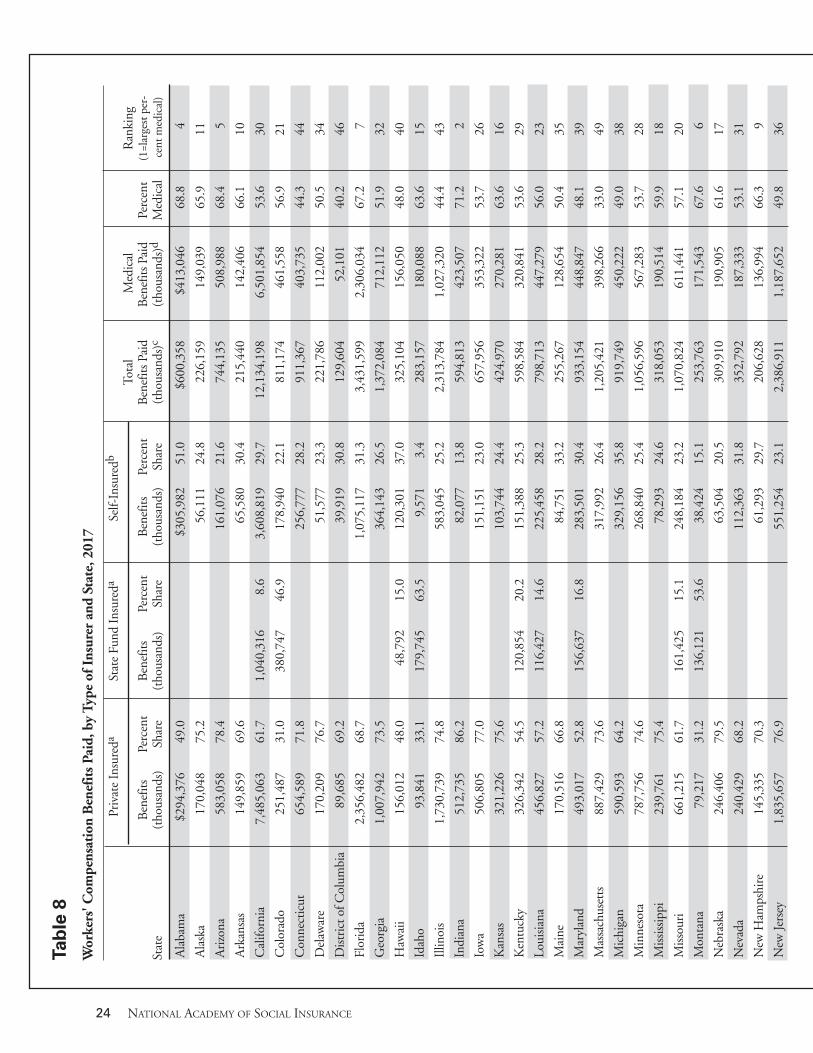
24 NATIONAL ACADEMY OF SOCIAL INSURANCE
Tab
le 8
Wor
kers
' Com
pens
atio
n B
enef
its
Paid
, by
Type
of I
nsur
er a
nd S
tate
, 201
7
Priv
ate
Insu
reda
Stat
e Fu
nd In
sure
daSe
lf-In
sure
db
T
otal
Med
ical
Ran
king
B
enef
itsPe
rcen
tB
enef
itsPe
rcen
tB
enef
itsPe
rcen
tB
enef
its P
aid
Ben
efits
Pai
d Pe
rcen
t(1
=lar
gest
per
-
Stat
e(t
hous
ands
)Sh
are
(tho
usan
ds)
Shar
e(t
hous
ands
)Sh
are
(tho
usan
ds)c
(tho
usan
ds)d
Med
ical
cen
t med
ical
)
Ala
bam
a$2
94,3
7649
.0
$3
05,9
8251
.0$6
00,3
58$4
13,0
4668
.84
Ala
ska
170,
048
75.2
56,1
1124
.822
6,15
914
9,03
965
.911
Ari
zona
583,
058
78.4
161,
076
21.6
744,
135
508,
988
68.4
5
Ark
ansa
s14
9,85
969
.6
65
,580
30.4
215,
440
142,
406
66.1
10
Cal
iforn
ia7,
485,
063
61.7
1,04
0,31
68.
63,
608,
819
29.7
12,1
34,1
986,
501,
854
53.6
30
Col
orad
o25
1,48
731
.038
0,74
746
.917
8,94
022
.181
1,17
446
1,55
856
.921
Con
nect
icut
654,
589
71.8
256,
777
28.2
911,
367
403,
735
44.3
44
Del
awar
e17
0,20
976
.7
51
,577
23.3
221,
786
112,
002
50.5
34
Dist
rict
of C
olum
bia
89,6
8569
.2
39
,919
30.8
129,
604
52,1
0140
.246
Flor
ida
2,35
6,48
268
.7
1,
075,
117
31.3
3,43
1,59
92,
306,
034
67.2
7
Geo
rgia
1,00
7,94
273
.5
36
4,14
326
.51,
372,
084
712,
112
51.9
32
Haw
aii
156,
012
48.0
48,7
9215
.012
0,30
137
.032
5,10
415
6,05
048
.040
Idah
o93
,841
33.1
179,
745
63.5
9,57
13.
428
3,15
718
0,08
863
.615
Illin
ois
1,73
0,73
974
.8
58
3,04
525
.22,
313,
784
1,02
7,32
044
.443
Indi
ana
512,
735
86.2
82,0
7713
.859
4,81
342
3,50
771
.22
Iow
a50
6,80
577
.0
15
1,15
123
.065
7,95
635
3,32
253
.726
Kan
sas
321,
226
75.6
103,
744
24.4
424,
970
270,
281
63.6
16
Ken
tuck
y32
6,34
254
.512
0,85
420
.215
1,38
825
.359
8,58
432
0,84
153
.629
Loui
sian
a45
6,82
757
.211
6,42
714
.622
5,45
828
.279
8,71
344
7,27
956
.023
Mai
ne17
0,51
666
.8
84
,751
33.2
255,
267
128,
654
50.4
35
Mar
ylan
d49
3,01
752
.815
6,63
716
.828
3,50
130
.493
3,15
444
8,84
748
.139
Mas
sach
uset
ts88
7,42
973
.6
31
7,99
226
.41,
205,
421
398,
266
33.0
49
Mic
higa
n59
0,59
364
.2
32
9,15
635
.891
9,74
945
0,22
249
.038
Min
neso
ta78
7,75
674
.6
26
8,84
025
.41,
056,
596
567,
283
53.7
28
Miss
issip
pi23
9,76
175
.4
78
,293
24.6
318,
053
190,
514
59.9
18
Miss
ouri
661,
215
61.7
161,
425
15.1
248,
184
23.2
1,07
0,82
461
1,44
157
.120
Mon
tana
79,2
1731
.213
6,12
153
.638
,424
15.1
253,
763
171,
543
67.6
6
Neb
rask
a24
6,40
679
.5
63
,504
20.5
309,
910
190,
905
61.6
17
Nev
ada
240,
429
68.2
112,
363
31.8
352,
792
187,
333
53.1
31
New
Ham
pshi
re14
5,33
570
.3
61
,293
29.7
206,
628
136,
994
66.3
9
New
Jers
ey1,
835,
657
76.9
551,
254
23.1
2,38
6,91
11,
187,
652
49.8
36
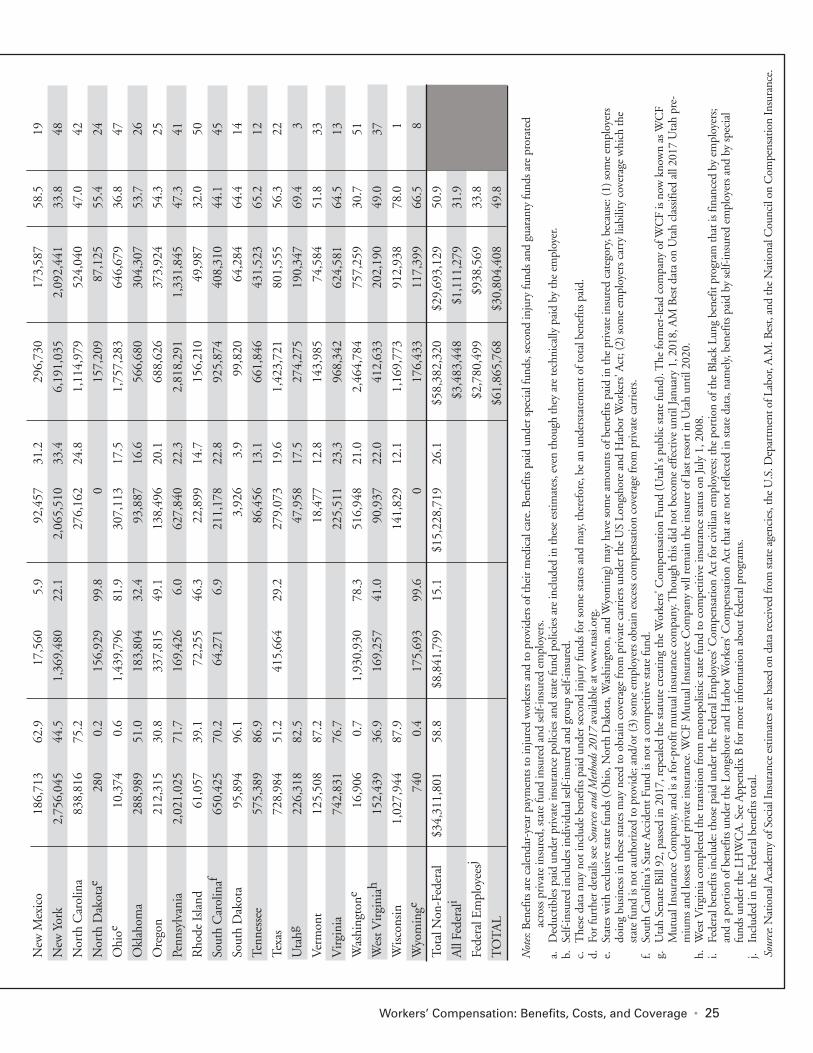
Workers’ Compensation: Benefits, Costs, and Coverage • 25
New
Mex
ico
186,
713
62.9
17,5
605.
992
,457
31.2
296,
730
173,
587
58.5
19
New
Yor
k2,
756,
045
44.5
1,36
9,48
022
.12,
065,
510
33.4
6,19
1,03
52,
092,
441
33.8
48
Nor
th C
arol
ina
838,
816
75.2
276,
162
24.8
1,11
4,97
952
4,04
047
.042
Nor
th D
akot
ae28
00.
215
6,92
999
.80
15
7,20
987
,125
55.4
24
Ohi
oe10
,374
0.6
1,43
9,79
681
.930
7,11
317
.51,
757,
283
646,
679
36.8
47
Okl
ahom
a28
8,98
951
.018
3,80
432
.493
,887
16.6
566,
680
304,
307
53.7
26
Ore
gon
212,
315
30.8
337,
815
49.1
138,
496
20.1
688,
626
373,
924
54.3
25
Penn
sylv
ania
2,02
1,02
571
.716
9,42
66.
062
7,84
022
.32,
818,
291
1,33
1,84
547
.341
Rho
de Is
land
61,0
5739
.172
,255
46.3
22,8
9914
.715
6,21
049
,987
32.0
50
Sout
h C
arol
inaf
650,
425
70.2
64,2
716.
921
1,17
822
.892
5,87
440
8,31
044
.145
Sout
h D
akot
a95
,894
96.1
3,92
63.
999
,820
64,2
8464
.414
Tenn
esse
e57
5,38
986
.9
86
,456
13.1
661,
846
431,
523
65.2
12
Texa
s72
8,98
451
.241
5,66
429
.227
9,07
319
.61,
423,
721
801,
555
56.3
22
Uta
hg22
6,31
882
.5
47
,958
17.5
274,
275
190,
347
69.4
3
Ver
mon
t12
5,50
887
.2
18
,477
12.8
143,
985
74,5
8451
.833
Vir
gini
a74
2,83
176
.7
22
5,51
123
.396
8,34
262
4,58
164
.513
Was
hing
tone
16,9
060.
71,
930,
930
78.3
516,
948
21.0
2,46
4,78
475
7,25
930
.751
Wes
t Vir
gini
ah15
2,43
936
.916
9,25
741
.090
,937
22.0
412,
633
202,
190
49.0
37
Wisc
onsin
1,02
7,94
487
.9
14
1,82
912
.11,
169,
773
912,
938
78.0
1
Wyo
min
ge74
00.
417
5,69
399
.60
17
6,43
311
7,39
966
.58
Tota
l Non
-Fed
eral
$3
4,31
1,80
158
.8$8
,841
,799
15.1
$15,
228,
719
26.1
$58,
382,
320
$29,
693,
129
50.9
All
Fede
rali
$3,4
83,4
48$1
,111
,279
31.9
Fede
ral E
mpl
oyee
sj
$2
,780
,499
$938
,569
33.8
TO
TA
L
$6
1,86
5,76
8$3
0,80
4,40
849
.8
Not
es: B
enef
its a
re c
alen
dar-
year
pay
men
ts to
inju
red
wor
kers
and
to p
rovi
ders
of t
heir
med
ical
car
e. B
enef
its p
aid
unde
r sp
ecia
l fun
ds, s
econ
d in
jury
fund
s and
gua
rant
y fu
nds a
re p
rora
ted
ac
ross
pri
vate
insu
red,
stat
e fu
nd in
sure
d an
d se
lf-in
sure
d em
ploy
ers.
a.D
educ
tible
s pai
d un
der
priv
ate
insu
ranc
e po
licie
s and
stat
e fu
nd p
olic
ies a
re in
clud
ed in
thes
e es
timat
es, e
ven
thou
gh th
ey a
re te
chni
cally
pai
d by
the
empl
oyer
. b.
Se
lf-in
sure
d in
clud
es in
divi
dual
self-
insu
red
and
grou
p se
lf-in
sure
d.
c.T
hese
dat
a m
ay n
ot in
clud
e be
nefit
s pai
d un
der
seco
nd in
jury
fund
s for
som
e st
ates
and
may
, the
refo
re, b
e an
und
erst
atem
ent o
f tot
al b
enef
its p
aid.
d.
Fo
r fu
rthe
r de
tails
see
Sour
ces a
nd M
etho
ds 2
017
avai
labl
e at
ww
w.n
asi.o
rg.
e.
St
ates
with
exc
lusiv
e st
ate
fund
s (O
hio,
Nor
th D
akot
a, W
ashi
ngto
n, a
nd W
yom
ing)
may
hav
e so
me
amou
nts o
f ben
efits
pai
d in
the
priv
ate
insu
red
cate
gory
, bec
ause
: (1)
som
e em
ploy
ers
doin
g bu
sine
ss in
thes
e st
ates
may
nee
d to
obt
ain
cove
rage
from
pri
vate
car
rier
s und
er th
e U
S Lo
ngsh
ore
and
Har
bor W
orke
rs' A
ct; (
2) so
me
empl
oyer
s car
ry li
abili
ty c
over
age
whi
ch th
e st
ate
fund
is n
ot a
utho
rize
d to
pro
vide
; and
/or
(3) s
ome
empl
oyer
s obt
ain
exce
ss c
ompe
nsat
ion
cove
rage
from
pri
vate
car
rier
s.
f.
Sout
h C
arol
ina'
s Sta
te A
ccid
ent F
und
is no
t a c
ompe
titiv
e st
ate
fund
. g.
U
tah
Sena
te B
ill 9
2, p
asse
d in
201
7, re
peal
ed th
e st
atut
e cr
eatin
g th
e W
orke
rs' C
ompe
nsat
ion
Fund
(Uta
h's p
ublic
stat
e fu
nd).
The
form
er-le
ad c
ompa
ny o
f WC
F is
now
kno
wn
as W
CF
Mut
ual I
nsur
ance
Com
pany
, and
is a
for-
prof
it m
utua
l ins
uran
ce c
ompa
ny. T
houg
h th
is di
d no
t bec
ome
effe
ctiv
e un
til Ja
nuar
y 1,
201
8, A
M B
est d
ata
on U
tah
clas
sifie
d al
l 201
7 U
tah
pre-
miu
ms a
nd lo
sses
und
er p
riva
te in
sura
nce.
WC
F M
utua
l Ins
uran
ce C
ompa
ny w
ll re
mai
n th
e in
sure
r of
last
reso
rt in
Uta
h un
til 2
020.
h.
Wes
t Vir
gini
a co
mpl
eted
the
tran
sitio
n fr
om m
onop
olist
ic st
ate
fund
to c
ompe
titiv
e in
sura
nce
stat
us o
n Ju
ly 1
, 200
8.
i. Fe
dera
l ben
efits
incl
ude:
thos
e pa
id u
nder
the
Fede
ral E
mpl
oyee
s’ C
ompe
nsat
ion
Act
for
civi
lian
empl
oyee
s; th
e po
rtio
n of
the
Bla
ck L
ung
bene
fit p
rogr
am th
at is
fina
nced
by
empl
oyer
s; an
d a
port
ion
of b
enef
its u
nder
the
Long
shor
e an
d H
arbo
r Wor
kers
’ Com
pens
atio
n A
ct th
at a
re n
ot re
flect
ed in
stat
e da
ta, n
amel
y, b
enef
its p
aid
by se
lf-in
sure
d em
ploy
ers a
nd b
y sp
ecia
l fu
nds u
nder
the
LHW
CA
. See
App
endi
x B
for
mor
e in
form
atio
n ab
out f
eder
al p
rogr
ams.
j.
Incl
uded
in th
e Fe
dera
l ben
efits
tota
l. So
urce
: Nat
iona
l Aca
dem
y of
Soc
ial I
nsur
ance
est
imat
es a
re b
ased
on
data
rece
ived
from
stat
e ag
enci
es, t
he U
.S. D
epar
tmen
t of L
abor
, A.M
. Bes
t, an
d th
e N
atio
nal C
ounc
il on
Com
pens
atio
n In
sura
nce.
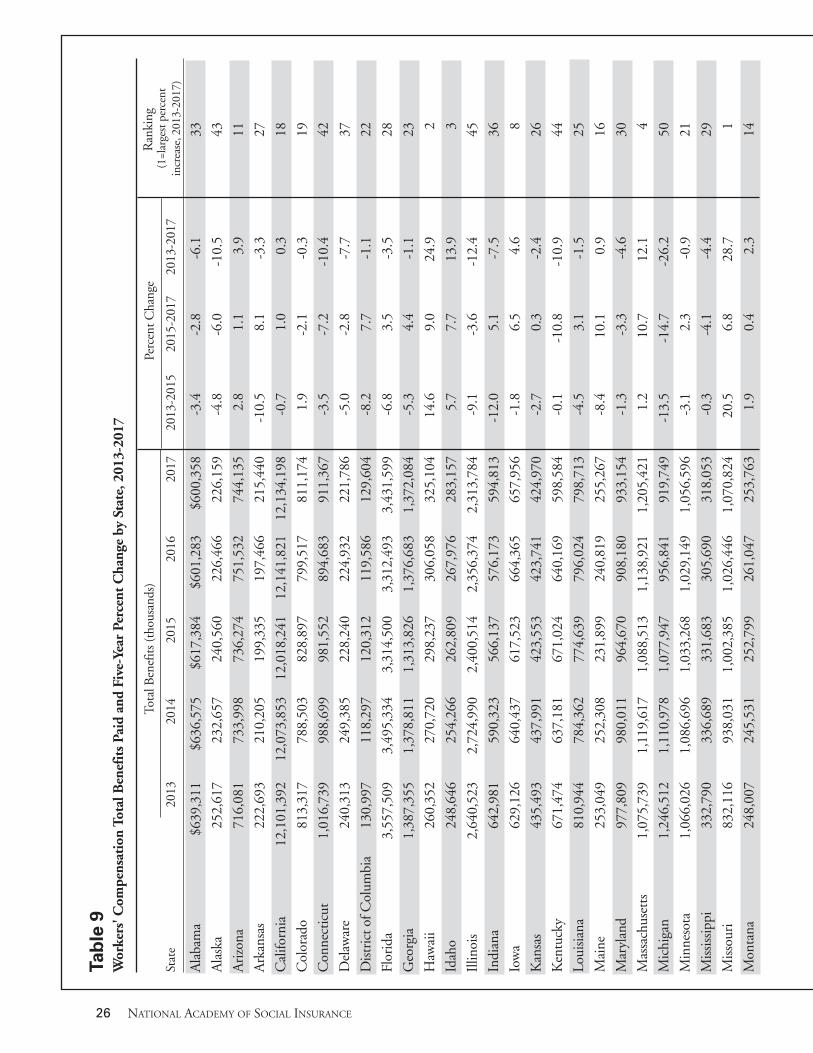
26 NATIONAL ACADEMY OF SOCIAL INSURANCE
Tab
le 9
W
orke
rs' C
ompe
nsat
ion
Tota
l Ben
efit
s Pa
id a
nd F
ive-
Year
Per
cent
Cha
nge
by S
tate
, 201
3-20
17
Perc
ent C
hang
eR
anki
ng
Stat
e20
1320
1420
1520
1620
17
2
013-
2015
201
5-20
17 2
013-
2017
Ala
bam
a$6
39,3
11$6
36,5
75$6
17,3
84$6
01,2
83$6
00,3
58-3
.4-2
.8-6
.133
Ala
ska
252,
617
232,
657
240,
560
226,
466
226,
159
-4.8
-6.0
-10.
543
Ari
zona
716,
081
733,
998
736,
274
751,
532
744,
135
2.8
1.1
3.9
11
Ark
ansa
s22
2,69
321
0,20
519
9,33
519
7,46
621
5,44
0-1
0.5
8.1
-3.3
27
Cal
iforn
ia12
,101
,392
12,0
73,8
5312
,018
,241
12,1
41,8
2112
,134
,198
-0.7
1.0
0.3
18
Col
orad
o81
3,31
778
8,50
382
8,89
779
9,51
781
1,17
41.
9-2
.1-0
.319
Con
nect
icut
1,01
6,73
998
8,69
998
1,55
289
4,68
391
1,36
7-3
.5-7
.2-1
0.4
42
Del
awar
e24
0,31
324
9,38
522
8,24
022
4,93
222
1,78
6-5
.0-2
.8-7
.737
Dist
rict
of C
olum
bia
130,
997
118,
297
120,
312
119,
586
129,
604
-8.2
7.7
-1.1
22
Flor
ida
3,55
7,50
93,
495,
334
3,31
4,50
03,
312,
493
3,43
1,59
9-6
.83.
5-3
.528
Geo
rgia
1,38
7,35
51,
378,
811
1,31
3,82
61,
376,
683
1,37
2,08
4-5
.34.
4-1
.123
Haw
aii
260,
352
270,
720
298,
237
306,
058
325,
104
14.6
9.0
24.9
2
Idah
o24
8,64
625
4,26
626
2,80
926
7,97
628
3,15
75.
77.
713
.93
Illin
ois
2,64
0,52
32,
724,
990
2,40
0,51
42,
356,
374
2,31
3,78
4-9
.1-3
.6-1
2.4
45
Indi
ana
642,
981
590,
323
566,
137
576,
173
594,
813
-12.
05.
1-7
.536
Iow
a62
9,12
664
0,43
761
7,52
366
4,36
565
7,95
6-1
.86.
54.
68
Kan
sas
435,
493
437,
991
423,
553
423,
741
424,
970
-2.7
0.3
-2.4
26
Ken
tuck
y67
1,47
463
7,18
167
1,02
464
0,16
959
8,58
4-0
.1-1
0.8
-10.
944
Loui
sian
a81
0,94
478
4,36
277
4,63
979
6,02
479
8,71
3-4
.53.
1-1
.525
Mai
ne25
3,04
925
2,30
823
1,89
924
0,81
925
5,26
7-8
.410
.10.
916
Mar
ylan
d97
7,80
998
0,01
196
4,67
090
8,18
093
3,15
4-1
.3-3
.3-4
.630
Mas
sach
uset
ts1,
075,
739
1,11
9,61
71,
088,
513
1,13
8,92
11,
205,
421
1.2
10.7
12.1
4
Mic
higa
n1,
246,
512
1,11
0,97
81,
077,
947
956,
841
919,
749
-13.
5-1
4.7
-26.
250
Min
neso
ta1,
066,
026
1,08
6,69
61,
033,
268
1,02
9,14
91,
056,
596
-3.1
2.3
-0.9
21
Mis
siss
ippi
332,
790
336,
689
331,
683
305,
690
318,
053
-0.3
-4.1
-4.4
29
Mis
sour
i83
2,11
693
8,03
11,
002,
385
1,02
6,44
61,
070,
824
20.5
6.8
28.7
1
Mon
tana
248,
007
245,
531
252,
799
261,
047
253,
763
1.9
0.4
2.3
14
Tota
l Ben
efits
(tho
usan
ds)
(1=l
arge
st p
erce
nt
incr
ease
, 201
3-20
17)
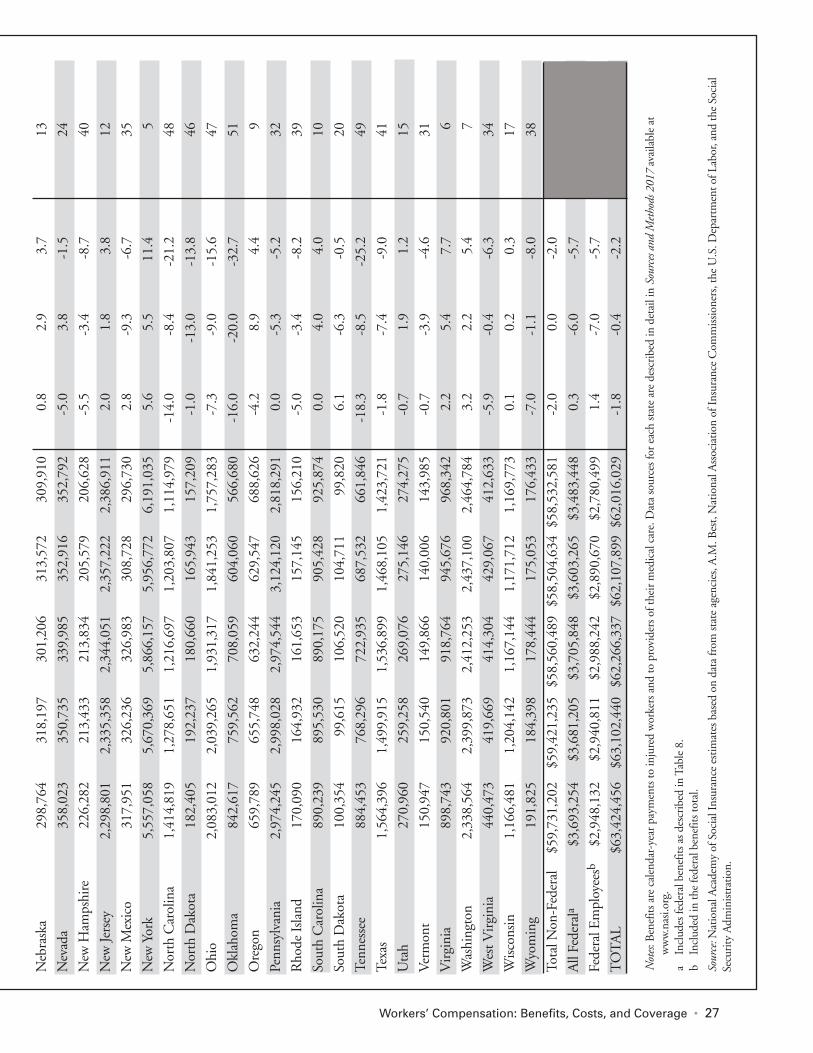
Workers’ Compensation: Benefits, Costs, and Coverage • 27
Neb
rask
a29
8,76
431
8,19
730
1,20
631
3,57
230
9,91
00.
82.
93.
713
Nev
ada
358,
023
350,
735
339,
985
352,
916
352,
792
-5.0
3.8
-1.5
24
New
Ham
pshi
re22
6,28
221
3,43
321
3,83
420
5,57
920
6,62
8-5
.5-3
.4-8
.740
New
Jers
ey2,
298,
801
2,33
5,35
82,
344,
051
2,35
7,22
22,
386,
911
2.0
1.8
3.8
12
New
Mex
ico
317,
951
326,
236
326,
983
308,
728
296,
730
2.8
-9.3
-6.7
35
New
Yor
k5,
557,
058
5,67
0,36
95,
866,
157
5,95
6,77
26,
191,
035
5.6
5.5
11.4
5
Nor
th C
arol
ina
1,41
4,81
91,
278,
651
1,21
6,69
71,
203,
807
1,11
4,97
9-1
4.0
-8.4
-21.
248
Nor
th D
akot
a18
2,40
519
2,23
718
0,66
016
5,94
315
7,20
9-1
.0-1
3.0
-13.
846
Ohi
o2,
083,
012
2,03
9,26
51,
931,
317
1,84
1,25
31,
757,
283
-7.3
-9.0
-15.
647
Okl
ahom
a84
2,61
775
9,56
270
8,05
960
4,06
056
6,68
0-1
6.0
-20.
0-3
2.7
51
Ore
gon
659,
789
655,
748
632,
244
629,
547
688,
626
-4.2
8.9
4.4
9
Penn
sylv
ania
2,97
4,24
52,
998,
028
2,97
4,54
43,
124,
120
2,81
8,29
10.
0-5
.3-5
.232
Rho
de Is
land
170,
090
164,
932
161,
653
157,
145
156,
210
-5.0
-3.4
-8.2
39
Sout
h C
arol
ina
890,
239
895,
530
890,
175
905,
428
925,
874
0.0
4.0
4.0
10
Sout
h D
akot
a10
0,35
499
,615
106,
520
104,
711
99,8
206.
1-6
.3-0
.520
Tenn
esse
e88
4,45
376
8,29
672
2,93
568
7,53
266
1,84
6-1
8.3
-8.5
-25.
249
Texa
s1,
564,
396
1,49
9,91
51,
536,
899
1,46
8,10
51,
423,
721
-1.8
-7.4
-9.0
41
Uta
h27
0,96
025
9,25
826
9,07
627
5,14
627
4,27
5-0
.71.
91.
215
Ver
mon
t15
0,94
715
0,54
014
9,86
614
0,00
614
3,98
5-0
.7-3
.9-4
.631
Vir
gini
a89
8,74
392
0,80
191
8,76
494
5,67
696
8,34
22.
25.
47.
76
Was
hing
ton
2,33
8,56
42,
399,
873
2,41
2,25
32,
437,
100
2,46
4,78
43.
22.
25.
47
Wes
t Vir
gini
a44
0,47
341
9,66
941
4,30
442
9,06
741
2,63
3-5
.9-0
.4-6
.334
Wisc
onsin
1,16
6,48
11,
204,
142
1,16
7,14
41,
171,
712
1,16
9,77
30.
10.
20.
317
Wyo
min
g19
1,82
518
4,39
817
8,44
417
5,05
317
6,43
3-7
.0-1
.1-8
.038
Tota
l Non
-Fed
eral
$59,
731,
202
$59,
421,
235
$58,
560,
489
$58,
504,
634
$58,
532,
581
-2.0
0.0
-2.0
All
Fede
rala
$3,6
93,2
54$3
,681
,205
$3,7
05,8
48$3
,603
,265
$3,4
83,4
480.
3-6
.0-5
.7
Fede
ral E
mpl
oyee
sb$2
,948
,132
$2,9
40,8
11$2
,988
,242
$2,8
90,6
70$2
,780
,499
1.4
-7.0
-5.7
TO
TA
L$6
3,42
4,45
6$6
3,10
2,44
0$6
2,26
6,33
7$6
2,10
7,89
9$6
2,01
6,02
9-1
.8-0
.4-2
.2
Not
es: B
enef
its a
re c
alen
dar-
year
pay
men
ts to
inju
red
wor
kers
and
to p
rovi
ders
of t
heir
med
ical
car
e. D
ata
sour
ces f
or e
ach
stat
e ar
e de
scri
bed
in d
etai
l in
Sour
ces a
nd M
etho
ds 2
017
avai
labl
e at
w
ww
.nas
i.org
.
a In
clud
es fe
dera
l ben
efits
as d
escr
ibed
in T
able
8.
b
Incl
uded
in th
e fe
dera
l ben
efits
tota
l.
So
urce
: Nat
iona
l Aca
dem
y of
Soc
ial I
nsur
ance
est
imat
es b
ased
on
data
from
stat
e ag
enci
es, A
.M. B
est,
Nat
iona
l Ass
ocia
tion
of In
sura
nce
Com
mis
sion
ers,
the
U.S
. Dep
artm
ent o
f Lab
or, a
nd th
e So
cial
Se
curi
ty A
dmin
istra
tion.
State Estimates of Benefits Paid in 2017
Benefits by type of insurer. Table 8 shows the shares of workers’ compensation benefits paid by each type of insurer in each state in 2017. The shares vary considerably across states for several reasons: not all states have a state fund; where state funds exist, their legal status varies; the incentives to self-insure vary across states; and two states (North Dakota and Wyoming) do not allow self-insurance.
North Dakota and Wyoming have exclusive state funds and do not allow self-insurance. In 2017, their state funds accounted for more than 99 percent of total workers’ compensation benefits paid (Table 8). Ohio and Washington have exclusive state funds but allow employers to self-insure. In 2017, their state funds accounted for approximately 80 percent of total benefits paid (81.9% and 78.3%, respectively). Among the other 17 states that have an active state fund, the share of benefits accounted for by the fund ranged from less than 10 percent (California, New Mexico, Pennsylvania, and South Carolina) to close to half in Colorado (46.9 percent), Oregon (49.1 percent), and Rhode Island (46.6 percent) and greater than 50 percent (Idaho and Montana). Among the states that do not have a state fund, pri-vate carriers typically accounted for between 70 and 80 percent of benefits paid in 2017, while self-insured employers accounted for 20 to 30 percent. Alabama is the exception, with self-insured employ-
ees covering just over half of benefits paid in 2017 (51 percent), by far the highest of any state, and private insurers paying the remaining 49 percent. Hawaii has the second-highest share of benefits paid by self-insured employers, at 37.0 percent in 2017. The converse is true in Indiana, South Dakota, Tennessee, Vermont, and Wisconsin, with private carriers accounting for more than 85 percent of benefits paid in 2017 (over 96 percent in South Dakota).36 There are several explanations for the tremendous variation in take-up rates for self- insurance across states: 1) Large employers are more likely to self-insure,
and some states (e.g., Michigan), have a disproportionate share of large employers relative to other states;
2) Financial incentives to self-insure vary across states due to differences in state workers’ com-pensation statutes;
3) Self-insurance and private insurance are substi-tutes. When workers’ compensation premium rates are rising in a state, employers tend to shift to self-insurance, while when premium rates are declining, they tend to shift to private insurance;
4) Measurement error may account for some of the observed variation in the share of benefits paid by self-insured employers, because our methods for estimating benefits paid under self-insurance vary across states, depending on state agencies’ responses to the Academy’s survey.
Medical benefits paid. Table 8 shows, for each state, the amount of medical benefits paid and medical benefits as a percent of total benefits. In 2017, the median share of medical benefits was 53.7 percent. The share of medical benefits was highest in Wisconsin (78.0%), followed by Indiana (71.2%), Utah (69.4%), and Alabama (68.8%). The share of medical benefits was lowest in Washington (30.7%), Rhode Island (32.0%), and Massachusetts (33.0%). Note that the share of medical benefits in a state can be high either because medical benefits are relatively high or because cash benefits are relatively low.
28 NATIONAL ACADEMY OF SOCIAL INSURANCE
Take-up rates for self-insurance vary widely across states. Among
the 49 jurisdictions that allow self-insurance, the share of benefits attributed to self-insured employers ranged from less than 4 percent (in Idaho and South Dakota) to greater
than 50 percent in 2017.
36 Private carrier workers’ compensation benefit payments occur in states with exclusive state funds for a few possible reasons. First,
some policies sold to employers provide multistate coverage whereas the exclusive state fund may be restricted to providing benefits only in the state where it operates. Second, the exclusive state fund may not be permitted to offer employers’ liability coverage, fed-eral LWHCA coverage, or excess coverage for authorized self-insurers.
Workers’ Compensation: Benefits, Costs, and Coverage • 29
State Trends in Benefits Paid
Table 9 shows total workers’ compensation benefits paid in each state in the years 2013 to 2017. Over the five-year period, benefits decreased in 34 jurisdic-tions (compared to 29 jurisdictions that experienced decreases from 2012 to 2016). The largest decreases were in Oklahoma (32.7%), Michigan (26.2%), and Tennessee (25.2%). In contrast, only 17 states expe-rienced increases in total workers’ compensation benefits. The states with the greatest increases were Missouri (28.7%), Hawaii (24.9%), Idaho (13.9%), and Massachusetts (12.1%). The within-state totals of workers’ compensation benefits paid vary from year to year for a number of reasons. Benefits change as within-state employment changes, although much of the impact occurs with a lag. Benefits also are affected by changes to a state’s legal system for processing claims, such as changes in statutory rules, legal decisions, administrative process-es, reporting requirements, and lags in recording results. Other factors that may explain within-state changes in benefits over time include: changes in the number of work-related injuries and illnesses; fluctua-tions in wage rates; changes in the mix of occupations/industries; changes in the costs and effec-tiveness of medical care (including changes to the medical fee schedule); changes to the indemnity ben-efit schedule; differences in the way stakeholders interact with the system over time (e.g., whether or not employees and/or employers have and exercise the right to choose a physician); changes in return-to-work and vocational rehabilitation efforts; and changes to coverage requirements (e.g. exclusions for small employers or agricultural employers). Benefits Per $100 of Covered Wages
Much of the interstate variation and intertemporal variation in benefit payments described above can be attributed to different trends in employment and wages across states. To control for differential trends in employment and wages over the time period cov-ered in this report, we construct a standardized measure of benefits, benefits per $100 of covered wages. Variations in the standardized measure of
benefits capture interstate differences in the factors described above (i.e., type and nature of injuries, quality of medical care, value of cash benefits, and return-to-work investments). We caution the reader that, due to the factors described above that are not taken into account in this report, the data on standardized benefits (bene-fits paid per $100 of covered wages) do not provide meaningful comparisons of the performance of state workers’ compensation systems. For example, stan-dardized benefits do not indicate the extent to which cash benefits compensate workers for their losses due to injury (i.e., benefit adequacy). Moreover, stan-dardized benefits could be high or low in a given state for a number of reasons completely unrelated to the adequacy of benefits that injured workers receive.37 For example, if a state has a disproportion-ate share of risky occupations (e.g., mining), and all else is held equal, standardized benefits will tend to be higher. If a state has high prices for medical care relative to the average wage rate, all else equal, standardized benefits will tend to be higher. Table 10 shows trends in medical benefits per $100 of covered wages in each state between 2013 and 2017. The national trend was a decrease of nearly 20 per-cent (19.6%) over this five-year period. Across this five-year period, medical benefits per $100 of cov-ered wages fell in 48 jurisdictions, with the largest percent decreases in Ohio (36.4%), North Carolina (33.9%), and Tennessee (32.9%). The only two states to see increases were Hawaii (15.9%) and Missouri (11.8%). Table 11 shows trends in cash benefits per $100 of covered wages in each state between 2013 and 2017. Nationally, this figure fell by 16.9 percent over the five years covered in the report. All but three states experienced decreases in standardized cash benefits of varying sizes. The states that experienced increases are Missouri (9.6%), Alaska (0.6%), and Wyoming (0.5%). Decreases ranged from as large as 47.2 per-cent in Michigan and 46.2 percent in Oklahoma, to as small as 1.5% in Delaware and 4.2% Wisconsin. Table 12 shows total benefits paid per $100 of covered wages by state from 2013 through 2017.
37 To provide meaningful comparisons of benefit adequacy, a study should compare the benefits that injured workers actually receive to
the wages they lose because of their occupational injuries or diseases. Such wage-loss studies have been conducted in several states (e.g., California, New Mexico, Oregon, Wisconsin, and Michigan), but the data for estimating wage losses are not available for most states. (See, e.g., May 2019 report on New York’s Workers’ Compensation system describing challenges to producing such a study for that state. Parrott and Martin 2019.) For benefit adequacy studies, see Hunt and Dillender (2017), Seabury et al. (2014), Boden et al. (2005), and Hunt (2004)
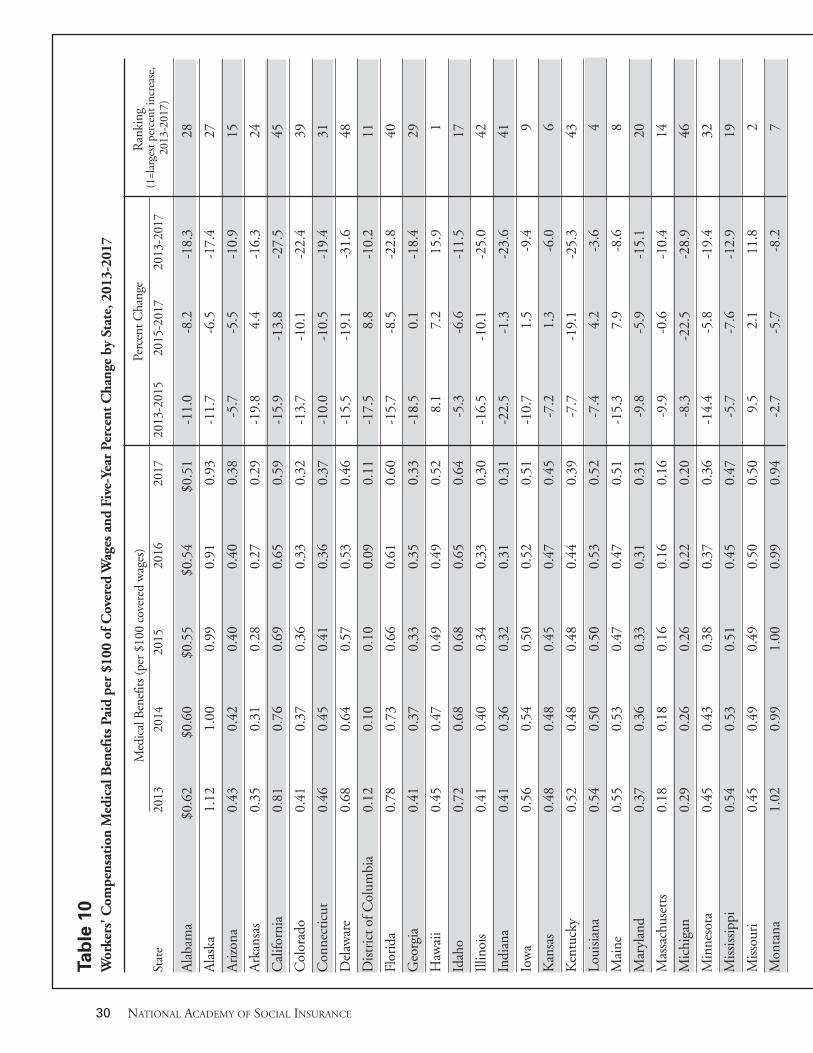
30 NATIONAL ACADEMY OF SOCIAL INSURANCE
Tab
le 1
0
Wor
kers
' Com
pens
atio
n M
edic
al B
enef
its
Paid
per
$10
0 of
Cov
ered
Wag
es a
nd F
ive-
Year
Per
cent
Cha
nge
by S
tate
, 201
3-20
17
Perc
ent C
hang
eR
anki
ng
Stat
e20
1320
1420
15
2016
20
17
2
013-
2015
201
5-20
17
201
3-20
17
Ala
bam
a$0
.62
$0.6
0$0
.55
$0.5
4$0
.51
-11.
0-8
.2-1
8.3
28
Ala
ska
1.12
1.00
0.99
0.91
0.93
-11.
7-6
.5-1
7.4
27
Ari
zona
0.43
0.42
0.40
0.40
0.38
-5.7
-5.5
-10.
915
Ark
ansa
s0.
350.
310.
280.
270.
29-1
9.8
4.4
-16.
324
Cal
iforn
ia0.
810.
760.
690.
650.
59-1
5.9
-13.
8-2
7.5
45
Col
orad
o0.
410.
370.
360.
330.
32-1
3.7
-10.
1-2
2.4
39
Con
nect
icut
0.46
0.45
0.41
0.36
0.37
-10.
0-1
0.5
-19.
431
Del
awar
e0.
680.
640.
570.
530.
46-1
5.5
-19.
1-3
1.6
48
Dist
rict
of C
olum
bia
0.12
0.10
0.10
0.09
0.11
-17.
58.
8-1
0.2
11
Flor
ida
0.78
0.73
0.66
0.61
0.60
-15.
7-8
.5-2
2.8
40
Geo
rgia
0.41
0.37
0.33
0.35
0.33
-18.
50.
1-1
8.4
29
Haw
aii
0.45
0.47
0.49
0.49
0.52
8.1
7.2
15.9
1
Idah
o0.
720.
680.
680.
650.
64-5
.3-6
.6-1
1.5
17
Illin
ois
0.41
0.40
0.34
0.33
0.30
-16.
5-1
0.1
-25.
042
Indi
ana
0.41
0.36
0.32
0.31
0.31
-22.
5-1
.3-2
3.6
41
Iow
a0.
560.
540.
500.
520.
51-1
0.7
1.5
-9.4
9
Kan
sas
0.48
0.48
0.45
0.47
0.45
-7.2
1.3
-6.0
6
Ken
tuck
y0.
520.
480.
480.
440.
39-7
.7-1
9.1
-25.
343
Loui
sian
a0.
540.
500.
500.
530.
52-7
.44.
2-3
.64
Mai
ne0.
550.
530.
470.
470.
51-1
5.3
7.9
-8.6
8
Mar
ylan
d0.
370.
360.
330.
310.
31-9
.8-5
.9-1
5.1
20
Mas
sach
uset
ts0.
180.
180.
160.
160.
16-9
.9-0
.6-1
0.4
14
Mic
higa
n0.
290.
260.
260.
220.
20-8
.3-2
2.5
-28.
946
Min
neso
ta0.
450.
430.
380.
370.
36-1
4.4
-5.8
-19.
432
Mis
siss
ippi
0.54
0.53
0.51
0.45
0.47
-5.7
-7.6
-12.
919
Mis
sour
i0.
450.
490.
490.
500.
509.
52.
111
.82
Mon
tana
1.02
0.99
1.00
0.99
0.94
-2.7
-5.7
-8.2
7
Med
ical
Ben
efits
(per
$10
0 co
vere
d w
ages
)(1
=lar
gest
per
cent
incr
ease
, 20
13-2
017 )
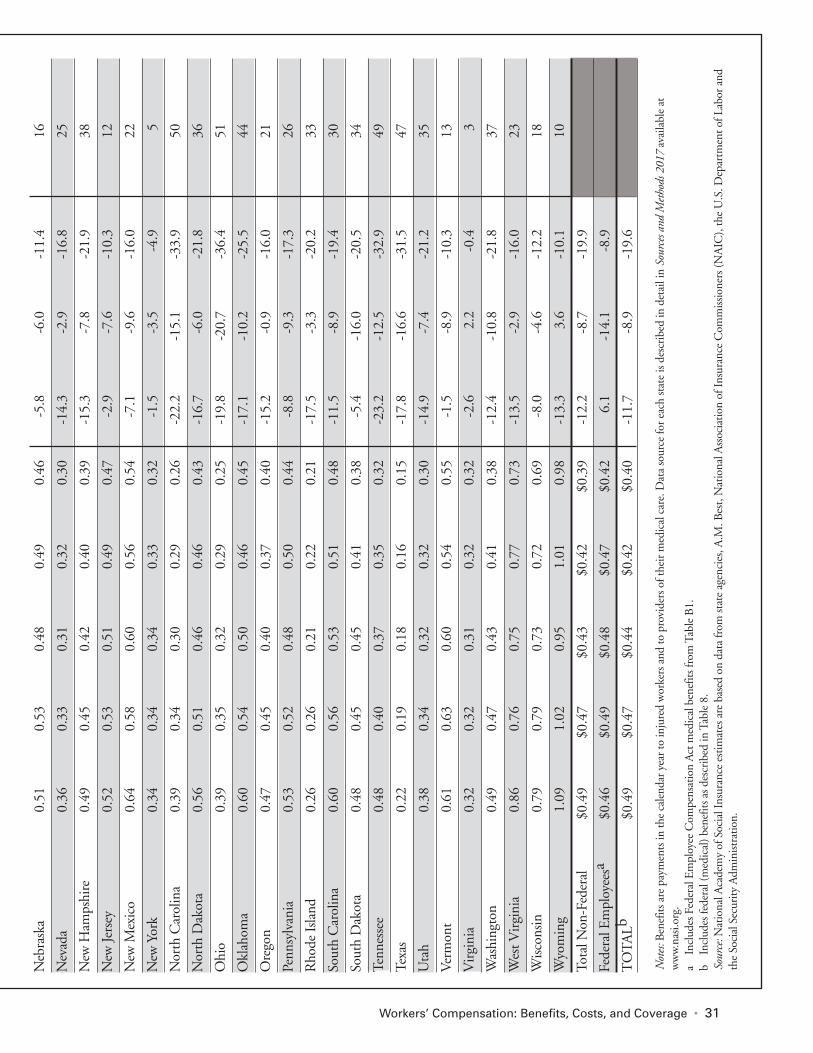
Workers’ Compensation: Benefits, Costs, and Coverage • 31
Neb
rask
a0.
510.
530.
480.
490.
46-5
.8-6
.0-1
1.4
16
Nev
ada
0.36
0.33
0.31
0.32
0.30
-14.
3-2
.9-1
6.8
25
New
Ham
pshi
re0.
490.
450.
420.
400.
39-1
5.3
-7.8
-21.
938
New
Jers
ey0.
520.
530.
510.
490.
47-2
.9-7
.6-1
0.3
12
New
Mex
ico
0.64
0.58
0.60
0.56
0.54
-7.1
-9.6
-16.
022
New
Yor
k0.
340.
340.
340.
330.
32-1
.5-3
.5-4
.95
Nor
th C
arol
ina
0.39
0.34
0.30
0.29
0.26
-22.
2-1
5.1
-33.
950
Nor
th D
akot
a0.
560.
510.
460.
460.
43-1
6.7
-6.0
-21.
836
Ohi
o0.
390.
350.
320.
290.
25-1
9.8
-20.
7-3
6.4
51
Okl
ahom
a0.
600.
540.
500.
460.
45-1
7.1
-10.
2-2
5.5
44
Ore
gon
0.47
0.45
0.40
0.37
0.40
-15.
2-0
.9-1
6.0
21
Penn
sylv
ania
0.53
0.52
0.48
0.50
0.44
-8.8
-9.3
-17.
326
Rho
de Is
land
0.26
0.26
0.21
0.22
0.21
-17.
5-3
.3-2
0.2
33
Sout
h C
arol
ina
0.60
0.56
0.53
0.51
0.48
-11.
5-8
.9-1
9.4
30
Sout
h D
akot
a0.
480.
450.
450.
410.
38-5
.4-1
6.0
-20.
534
Tenn
esse
e0.
480.
400.
370.
350.
32-2
3.2
-12.
5-3
2.9
49
Texa
s0.
220.
190.
180.
160.
15-1
7.8
-16.
6-3
1.5
47
Uta
h0.
380.
340.
320.
320.
30-1
4.9
-7.4
-21.
235
Ver
mon
t0.
610.
630.
600.
540.
55-1
.5-8
.9-1
0.3
13
Vir
gini
a0.
320.
320.
310.
320.
32-2
.62.
2-0
.43
Was
hing
ton
0.49
0.47
0.43
0.41
0.38
-12.
4-1
0.8
-21.
837
Wes
t Vir
gini
a0.
860.
760.
750.
770.
73-1
3.5
-2.9
-16.
023
Wisc
onsin
0.79
0.79
0.73
0.72
0.69
-8.0
-4.6
-12.
218
Wyo
min
g1.
091.
020.
951.
010.
98-1
3.3
3.6
-10.
110
Tota
l Non
-Fed
eral
$0
.49
$0.4
7$0
.43
$0.4
2$0
.39
-12.
2-8
.7-1
9.9
Fede
ral E
mpl
oyee
sa$0
.46
$0.4
9$0
.48
$0.4
7$0
.42
6.1
-14.
1-8
.9
TO
TA
Lb$0
.49
$0.4
7$0
.44
$0.4
2$0
.40
-11.
7-8
.9-1
9.6
N
otes
: Ben
efits
are
pay
men
ts in
the
cale
ndar
yea
r to
inju
red
wor
kers
and
to p
rovi
ders
of t
heir
med
ical
car
e. D
ata
sour
ce fo
r ea
ch st
ate
is de
scri
bed
in d
etai
l in
Sour
ces a
nd M
etho
ds 2
017
avai
labl
e at
w
ww
.nas
i.org
. a
Incl
udes
Fed
eral
Em
ploy
ee C
ompe
nsat
ion
Act
med
ical
ben
efits
from
Tab
le B
1.
b In
clud
es fe
dera
l (m
edic
al) b
enef
its a
s des
crib
ed in
Tab
le 8
. So
urce
: Nat
iona
l Aca
dem
y of
Soc
ial I
nsur
ance
est
imat
es a
re b
ased
on
data
from
stat
e ag
enci
es, A
.M. B
est,
Nat
iona
l Ass
ocia
tion
of In
sura
nce
Com
mis
sion
ers (
NA
IC),
the
U.S
. Dep
artm
ent o
f Lab
or a
nd
the
Soci
al S
ecur
ity A
dmin
istra
tion.
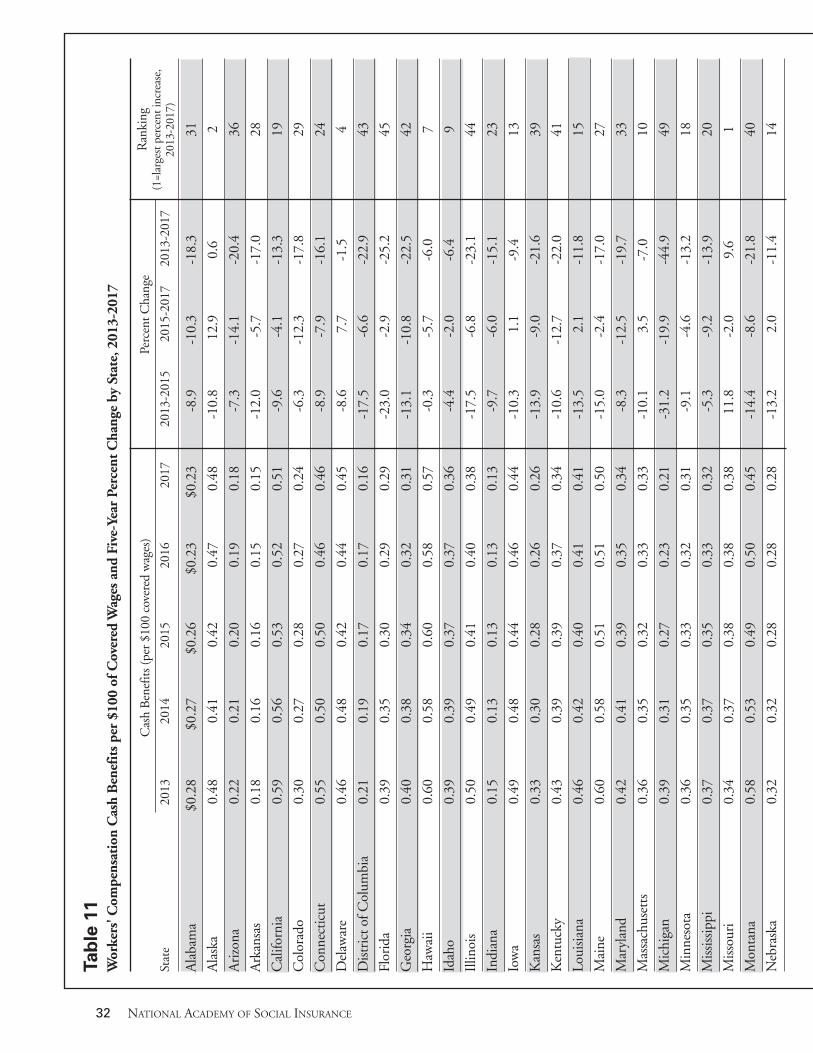
32 NATIONAL ACADEMY OF SOCIAL INSURANCE
Tab
le 1
1
Wor
kers
' Com
pens
atio
n C
ash
Ben
efit
s pe
r $1
00 o
f Cov
ered
Wag
es a
nd F
ive-
Year
Per
cent
Cha
nge
by S
tate
, 201
3-20
17
Pe
rcen
t Cha
nge
Ran
king
St
ate
2013
2014
2015
2016
2
017
2
013-
2015
20
15-2
017
2
013-
2017
Ala
bam
a$0
.28
$0.2
7$0
.26
$0.2
3$0
.23
-8.9
-10.
3-1
8.3
31
Ala
ska
0.48
0.41
0.42
0.47
0.48
-10.
812
.90.
62
Ari
zona
0.22
0.21
0.20
0.19
0.18
-7.3
-14.
1-2
0.4
36
Ark
ansa
s0.
180.
160.
160.
150.
15-1
2.0
-5.7
-17.
028
Cal
iforn
ia0.
590.
560.
530.
520.
51-9
.6-4
.1-1
3.3
19
Col
orad
o0.
300.
270.
280.
270.
24-6
.3-1
2.3
-17.
829
Con
nect
icut
0.55
0.50
0.50
0.46
0.46
-8.9
-7.9
-16.
124
Del
awar
e0.
460.
480.
420.
440.
45-8
.67.
7-1
.54
Dist
rict
of C
olum
bia
0.21
0.19
0.17
0.17
0.16
-17.
5-6
.6-2
2.9
43
Flor
ida
0.39
0.35
0.30
0.29
0.29
-23.
0-2
.9-2
5.2
45
Geo
rgia
0.40
0.38
0.34
0.32
0.31
-13.
1-1
0.8
-22.
542
Haw
aii
0.60
0.58
0.60
0.58
0.57
-0.3
-5.7
-6.0
7
Idah
o0.
390.
390.
370.
370.
36-4
.4-2
.0-6
.49
Illin
ois
0.50
0.49
0.41
0.40
0.38
-17.
5-6
.8-2
3.1
44
Indi
ana
0.15
0.13
0.13
0.13
0.13
-9.7
-6.0
-15.
123
Iow
a0.
490.
480.
440.
460.
44-1
0.3
1.1
-9.4
13
Kan
sas
0.33
0.30
0.28
0.26
0.26
-13.
9-9
.0-2
1.6
39
Ken
tuck
y0.
430.
390.
390.
370.
34-1
0.6
-12.
7-2
2.0
41
Loui
sian
a0.
460.
420.
400.
410.
41-1
3.5
2.1
-11.
815
Mai
ne0.
600.
580.
510.
510.
50-1
5.0
-2.4
-17.
027
Mar
ylan
d0.
420.
410.
390.
350.
34-8
.3-1
2.5
-19.
733
Mas
sach
uset
ts0.
360.
350.
320.
330.
33-1
0.1
3.5
-7.0
10
Mic
higa
n0.
390.
310.
270.
230.
21-3
1.2
-19.
9-4
4.9
49
Min
neso
ta0.
360.
350.
330.
320.
31-9
.1-4
.6-1
3.2
18
Mis
sissip
pi0.
370.
370.
350.
330.
32-5
.3-9
.2-1
3.9
20
Mis
sour
i0.
340.
370.
380.
380.
3811
.8-2
.09.
61
Mon
tana
0.58
0.53
0.49
0.50
0.45
-14.
4-8
.6-2
1.8
40
Neb
rask
a0.
320.
320.
280.
280.
28-1
3.2
2.0
-11.
414
Cas
h B
enef
its (p
er $
100
cove
red
wag
es)
(1=l
arge
st p
erce
nt in
crea
se,
2013
-201
7)
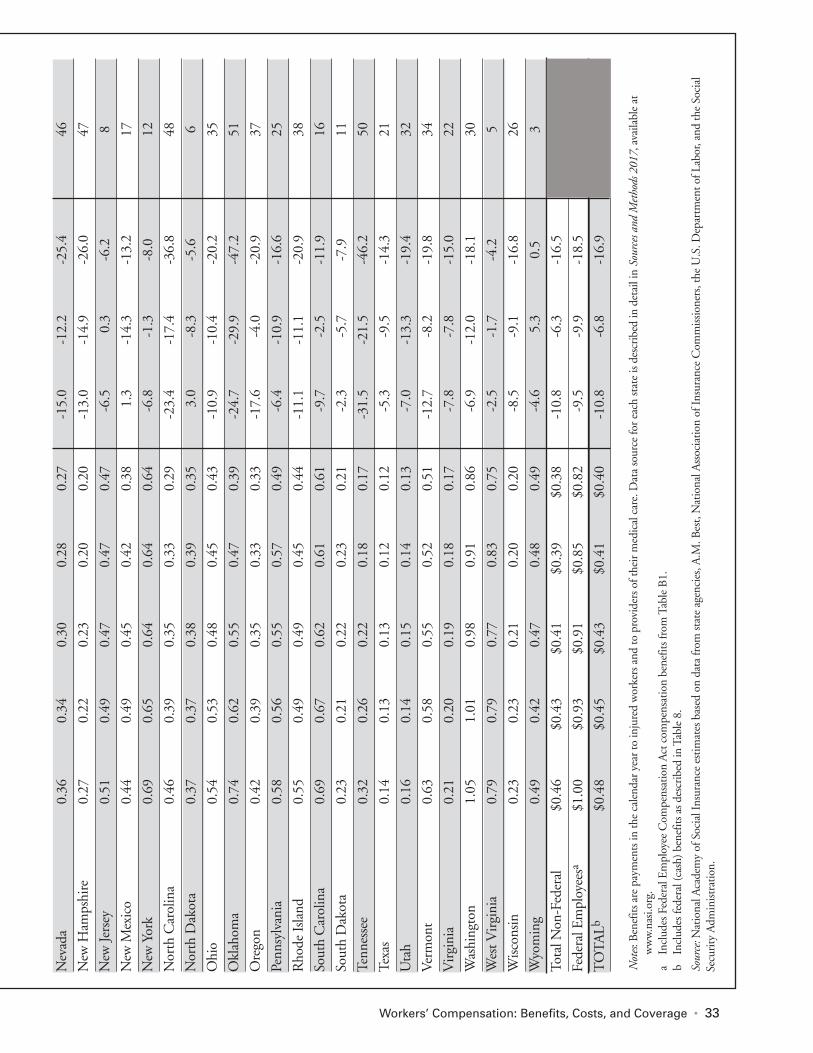
Workers’ Compensation: Benefits, Costs, and Coverage • 33
Nev
ada
0.36
0.34
0.30
0.28
0.27
-15.
0-1
2.2
-25.
446
New
Ham
pshi
re0.
270.
220.
230.
200.
20-1
3.0
-14.
9-2
6.0
47
New
Jers
ey0.
510.
490.
470.
470.
47-6
.50.
3-6
.28
New
Mex
ico
0.44
0.49
0.45
0.42
0.38
1.3
-14.
3-1
3.2
17
New
Yor
k0.
690.
650.
640.
640.
64-6
.8-1
.3-8
.012
Nor
th C
arol
ina
0.46
0.39
0.35
0.33
0.29
-23.
4-1
7.4
-36.
848
Nor
th D
akot
a0.
370.
370.
380.
390.
353.
0-8
.3-5
.66
Ohi
o0.
540.
530.
480.
450.
43-1
0.9
-10.
4-2
0.2
35
Okl
ahom
a0.
740.
620.
550.
470.
39-2
4.7
-29.
9-4
7.2
51
Ore
gon
0.42
0.39
0.35
0.33
0.33
-17.
6-4
.0-2
0.9
37
Penn
sylv
ania
0.58
0.56
0.55
0.57
0.49
-6.4
-10.
9-1
6.6
25
Rho
de Is
land
0.55
0.49
0.49
0.45
0.44
-11.
1-1
1.1
-20.
938
Sout
h C
arol
ina
0.69
0.67
0.62
0.61
0.61
-9.7
-2.5
-11.
916
Sout
h D
akot
a0.
230.
210.
220.
230.
21-2
.3-5
.7-7
.911
Tenn
esse
e0.
320.
260.
220.
180.
17-3
1.5
-21.
5-4
6.2
50
Texa
s0.
140.
130.
130.
120.
12-5
.3-9
.5-1
4.3
21
Uta
h0.
160.
140.
150.
140.
13-7
.0-1
3.3
-19.
432
Ver
mon
t0.
630.
580.
550.
520.
51-1
2.7
-8.2
-19.
834
Vir
gini
a0.
210.
200.
190.
180.
17-7
.8-7
.8-1
5.0
22
Was
hing
ton
1.05
1.01
0.98
0.91
0.86
-6.9
-12.
0-1
8.1
30
Wes
t Vir
gini
a0.
790.
790.
770.
830.
75-2
.5-1
.7-4
.25
Wisc
onsi
n0.
230.
230.
210.
200.
20-8
.5-9
.1-1
6.8
26
Wyo
min
g0.
490.
420.
470.
480.
49-4
.65.
30.
53
Tota
l Non
-Fed
eral
$0
.46
$0.4
3$0
.41
$0.3
9$0
.38
-10.
8-6
.3-1
6.5
Fede
ral E
mpl
oyee
sa$1
.00
$0.9
3$0
.91
$0.8
5$0
.82
-9.5
-9.9
-18.
5
TO
TA
Lb$0
.48
$0.4
5$0
.43
$0.4
1$0
.40
-10.
8-6
.8-1
6.9
N
otes
: Ben
efits
are
pay
men
ts in
the
cale
ndar
yea
r to
inju
red
wor
kers
and
to p
rovi
ders
of t
heir
med
ical
car
e. D
ata
sour
ce fo
r ea
ch st
ate
is de
scri
bed
in d
etai
l in
Sour
ces a
nd M
etho
ds 2
017,
ava
ilabl
e at
w
ww
.nas
i.org
.
a In
clud
es F
eder
al E
mpl
oyee
Com
pens
atio
n A
ct c
ompe
nsat
ion
bene
fits f
rom
Tab
le B
1.
b In
clud
es fe
dera
l (ca
sh) b
enef
its a
s des
crib
ed in
Tab
le 8
.
So
urce
: Nat
iona
l Aca
dem
y of
Soc
ial I
nsur
ance
est
imat
es b
ased
on
data
from
stat
e ag
enci
es, A
.M. B
est,
Nat
iona
l Ass
ocia
tion
of In
sura
nce
Com
mis
sion
ers,
the
U.S
. Dep
artm
ent o
f Lab
or, a
nd th
e So
cial
Se
curi
ty A
dmin
istra
tion.
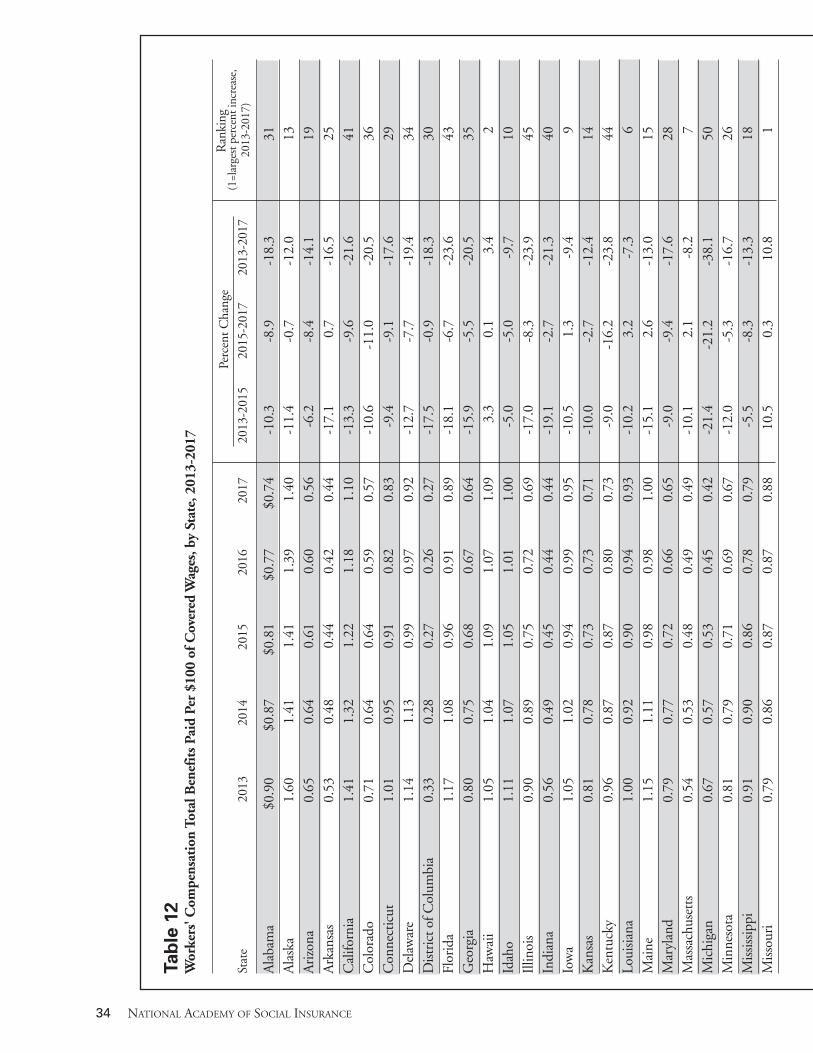
34 NATIONAL ACADEMY OF SOCIAL INSURANCE
Tab
le 1
2
Wor
kers
' Com
pens
atio
n To
tal B
enef
its
Paid
Per
$10
0 of
Cov
ered
Wag
es, b
y St
ate,
201
3-20
17
Per
cent
Cha
nge
Ran
king
St
ate
2013
2014
2015
2016
2017
201
3-20
1520
15-2
017
2013
-201
7
Ala
bam
a$0
.90
$0.8
7$0
.81
$0.7
7$0
.74
-10.
3-8
.9-1
8.3
31
Ala
ska
1.60
1.41
1.41
1.39
1.40
-11.
4-0
.7-1
2.0
13
Ari
zona
0.65
0.64
0.61
0.60
0.56
-6.2
-8.4
-14.
119
A
rkan
sas
0.53
0.48
0.44
0.42
0.44
-17.
10.
7-1
6.5
25
Cal
iforn
ia1.
411.
321.
221.
181.
10-1
3.3
-9.6
-21.
641
C
olor
ado
0.71
0.64
0.64
0.59
0.57
-10.
6-1
1.0
-20.
536
C
onne
ctic
ut1.
010.
950.
910.
820.
83-9
.4-9
.1-1
7.6
29
Del
awar
e1.
141.
130.
990.
970.
92-1
2.7
-7.7
-19.
434
D
istr
ict o
f Col
umbi
a0.
330.
280.
270.
260.
27-1
7.5
-0.9
-18.
330
Fl
orid
a1.
171.
080.
960.
910.
89-1
8.1
-6.7
-23.
643
G
eorg
ia0.
800.
750.
680.
670.
64-1
5.9
-5.5
-20.
535
H
awai
i1.
051.
041.
091.
071.
093.
30.
13.
42
Idah
o1.
111.
071.
051.
011.
00-5
.0-5
.0-9
.710
Ill
inoi
s0.
900.
890.
750.
720.
69-1
7.0
-8.3
-23.
945
In
dian
a0.
560.
490.
450.
440.
44-1
9.1
-2.7
-21.
340
Io
wa
1.05
1.02
0.94
0.99
0.95
-10.
51.
3-9
.49
Kan
sas
0.81
0.78
0.73
0.73
0.71
-10.
0-2
.7-1
2.4
14
Ken
tuck
y0.
960.
870.
870.
800.
73-9
.0-1
6.2
-23.
844
Lo
uisia
na1.
000.
920.
900.
940.
93-1
0.2
3.2
-7.3
6 M
aine
1.15
1.11
0.98
0.98
1.00
-15.
12.
6-1
3.0
15
Mar
ylan
d0.
790.
770.
720.
660.
65-9
.0-9
.4-1
7.6
28
Mas
sach
uset
ts0.
540.
530.
480.
490.
49-1
0.1
2.1
-8.2
7 M
ichi
gan
0.67
0.57
0.53
0.45
0.42
-21.
4-2
1.2
-38.
150
M
inne
sota
0.81
0.79
0.71
0.69
0.67
-12.
0-5
.3-1
6.7
26
Miss
issip
pi0.
910.
900.
860.
780.
79-5
.5-8
.3-1
3.3
18
Miss
ouri
0.79
0.86
0.87
0.87
0.88
10.5
0.3
10.8
1
(1=l
arge
st p
erce
nt in
crea
se,
2013
-201
7)

Workers’ Compensation: Benefits, Costs, and Coverage • 35
Mon
tana
1.60
1.52
1.49
1.49
1.39
-6.9
-6.6
-13.
116
N
ebra
ska
0.83
0.85
0.76
0.77
0.74
-8.6
-3.1
-11.
412
N
evad
a0.
720.
670.
610.
600.
57-1
4.7
-7.5
-21.
139
N
ew H
amps
hire
0.76
0.68
0.65
0.60
0.58
-14.
5-1
0.3
-23.
342
N
ew Je
rsey
1.03
1.02
0.98
0.96
0.94
-4.7
-3.8
-8.3
8 N
ew M
exic
o1.
081.
071.
040.
990.
92-3
.7-1
1.6
-14.
920
N
ew Y
ork
1.03
0.99
0.98
0.97
0.96
-5.0
-2.0
-7.0
5 N
orth
Car
olin
a0.
850.
730.
660.
630.
55-2
2.9
-16.
4-3
5.5
48
Nor
th D
akot
a0.
930.
880.
840.
850.
78-8
.8-7
.1-1
5.3
22
Ohi
o0.
930.
880.
800.
740.
68-1
4.6
-14.
5-2
7.0
47
Okl
ahom
a1.
341.
151.
060.
920.
84-2
1.2
-20.
6-3
7.4
49
Ore
gon
0.90
0.84
0.75
0.71
0.73
-16.
3-2
.4-1
8.3
32
Penn
sylv
ania
1.11
1.08
1.03
1.07
0.92
-7.5
-10.
2-1
6.9
27
Rho
de Is
land
0.81
0.75
0.70
0.67
0.64
-13.
1-8
.7-2
0.7
38
Sout
h C
arol
ina
1.29
1.23
1.15
1.12
1.09
-10.
5-5
.4-1
5.4
23
Sout
h D
akot
a0.
700.
660.
670.
640.
59-4
.4-1
2.6
-16.
424
Te
nnes
see
0.80
0.66
0.58
0.53
0.49
-26.
5-1
5.9
-38.
251
Te
xas
0.35
0.32
0.31
0.29
0.27
-13.
0-1
3.7
-24.
946
U
tah
0.54
0.49
0.47
0.46
0.43
-12.
6-9
.3-2
0.7
37
Ver
mon
t1.
241.
201.
151.
061.
06-7
.2-8
.6-1
5.2
21
Vir
gini
a0.
530.
530.
500.
500.
49-4
.6-1
.6-6
.13
Was
hing
ton
1.54
1.48
1.41
1.32
1.24
-8.6
-11.
6-1
9.3
33
Wes
t Vir
gini
a1.
651.
541.
511.
601.
48-8
.2-2
.3-1
0.4
11
Wis
cons
in1.
021.
020.
940.
920.
89-8
.1-5
.7-1
3.3
17
Wyo
min
g1.
581.
441.
411.
491.
47-1
0.6
4.2
-6.8
4 To
tal N
on-F
eder
al$0
.95
$0.9
0$0
.84
$0.8
1$0
.77
-11.
6-7
.6-1
8.2
Fe
dera
l Em
ploy
ees
$1.4
6$1
.42
$1.3
9$1
.32
$1.2
3-4
.6-1
1.4
-15.
5
TO
TA
L$0
.97
$0.9
2$0
.86
$0.8
4$0
.80
-11.
3-7
.8-1
8.2
N
ote:
"Fe
dera
l Em
ploy
ees"
tota
l inc
lude
s onl
y w
orke
rs c
over
ed u
nder
the
Fede
ral E
mpl
oyee
s' C
ompe
nsat
ion
Act
.
Sour
ce: N
atio
nal A
cade
my
of S
ocia
l Ins
uran
ce e
stim
ates
.
Nationwide, benefits paid were $0.80 per $100 of covered wages in 2017, down $0.18, or 18.2 per-cent, from 2013. Benefits per $100 of covered wages decreased by $0.11 between 2013 and 2015, and by $0.07 from 2015 to 2017. As shown in Figure 1, standardized benefits have decreased by almost one third (32%) from the 20-year high of $1.17 per $100 of covered wages in 1997 to $0.80 in 2017.
Between 2013 and 2017, benefits per $100 of covered wages decreased in all but two jurisdictions: Missouri (up 10.8%) and Hawaii (3.4%). Thirty-one states experienced decreases of at least 15 percent, and eight states experienced decreases of 25 percent or more. State outliers. The largest percent decrease in stan-dardized benefits was in Tennessee (38.2%), followed closely by Michigan (38.1%), Oklahoma (37.4%), and North Carolina (35.5%). In any given year, some states may experience a major increase or decrease for the first time. In three of these states, however, the large decreases have been ongoing for the past few years and are attributable to the legislative changes described below. In 2013, Tennessee enacted a Workers’ Compensation Reform Act that took effect on January 1, 2014 (Tennessee Bureau of Workers Compensation, 2017). The legislation established a new administrative process for resolving claims, overseen by a new Court of Workers’ Compensation Claims and a Workers’ Compensation Appeals Board. Eligibility for benefits was restricted to cases in which work-related injuries were the primary cause of the workers’ current disability, and PPD benefit rates were reduced, although the maximum duration of PPD benefits was increased from 400 to
450 weeks. The legislation also adopted new medical treatment guidelines, which narrowed reimbursable treatment regimens to those explicitly listed in the guidelines. These reforms help explain the sharp declines in both cash and medical benefits per $100 of covered wages seen over the study period (of 46.2 and 32.9 percent, respectively). In 2011, Michigan enacted changes to its workers’ compensation laws that redefined disability and post-work capacity and made the criteria required to establish disability and/or wage loss more stringent. The law changed from defining “disability” as “a lim-itation of an employee’s wage earning capacity in work suitable to his or her qualifications and training resulting from a personal injury or work-related dis-ease” to occurring only “if a personal injury covered under this act results in the employee’s being unable to perform all jobs paying the maximum wages in work suitable to that employee’s qualifications and training, which includes work that may be per-formed using the employee’s transferable work skills.” (Michigan Legislature, 2011-2012 Legislative Session, HB 5002.) As a result, cash benefits declined by 44.9 percent, the third-largest decline in the country. (With standardized medical benefits also declining by 28.9 percent over the study period, a reduction that is not related to the legal changes described above, Michigan saw the second largest total decline in standardized benefits.38) As previously noted, an Oklahoma statute allowed certain employers in the state to opt out of workers’ compensation insurance from 2014 through part of 2016, when the statute was declared unconstitution-al. Oklahoma also implemented other significant changes to its workers’ compensation statutes during the study period. These revisions include: changes to provider reimbursement and medical fee schedules; reductions in permanent disability ratings for PPD and PTD claims by the amount of impairment determined to be pre-existing; reductions in both the maximum TTD benefit amount and duration; and adoption of a new administration system governed by a three-member Workers’ Compensation Commission.39 Overall in Oklahoma, standardized medical benefits declined by 25.5 percent and cash
36 NATIONAL ACADEMY OF SOCIAL INSURANCE
Nationwide, workers’ compensation benefits were $0.80 per $100 of
covered payroll in 2017, a decrease of more than a third from $1.26 in 1997.
38 It is possible that the 2011 changes either reduced claim volumes by weakening the financial incentive to claim, or that the disability
and work capacity changes led to previously compensable claims now falling outside of the system, but the data do not shed light on either of those potential explanations.
Workers’ Compensation: Benefits, Costs, and Coverage • 37
benefits by 47.2 percent over the study period. From 2015-2017, when these changes were fully imple-mented, standardized medical and cash benefits fell by 10.2 percent and 29.9 percent respectively. The decline in standardized benefits in North Carolina is not well understood. North Carolina House Bill 709 (passed in 2011) capped temporary total disability benefits at 500 weeks, and new reduced medical fee schedules became effective in 2015, but these changes do not appear substantial enough to explain the sizable decline in standardized benefits (NCCI ASB). The increase in standardized benefits in Missouri, which runs counter to virtually every other state, appears to be explained in large part by two charac-teristics that are unusual/unique to the state. First, Missouri is one of a shrinking number of states to have no fee schedule in place; the only medical cost containment strategy it has adopted is restricting the doctors that an injured worker can consult.40 Second, 2005 restrictions the state had enacted that sharply reduced funding for its Second Injury Fund led, over the subsequent years, to severe problems in paying injured workers that led the legislature to reverse course in 2013.41 Those changes sharply increased employer liability for injuries that had gone uncompensated for many years, likely explaining in part the notable increase in benefits over this study period.
The increases in Hawaii likely reflect increases in the fee schedule for medical services that were enacted in 2013. Cash Benefits by Type of Claim
The National Council on Compensation Insurance (NCCI) provides data on the relative incidence (or frequency) of each type of disability claim (tempo-rary total, permanent partial, and permanent total, as well as fatalities) as a proportion of the total number of cases receiving cash benefits and total benefits incurred (NCCI 2019a). Data are reported for each state’s “policy period,” which may or may not corre-spond to a calendar year. Data are available for the 38 states in which NCCI is licensed. Figures 4a and 4b display the data for 1996 to 2015, the most recent year available. Figure 4a shows the percentage of indemnity claims (claims involving cash benefits) attributed to each type of disability claim. Figure 4b shows the percent-age of total benefits attributed to each type of indemnity claim.42 The bulk of total benefits for workers’ compensation go to permanent disability claims, of which permanent partial disability claims are the most common.43 In 2015, temporary total disability (TTD) claims accounted for 61.5 percent of all indemnity claims, but only 33.2 percent of benefits incurred (Figures 4a & 4b). PPD claims accounted for 37.8 percent of indemnity claims, but 55.4 percent of benefits incurred.
39 Oklahoma Senate Bill 1062. In addition to the statutory changes that reduced compensation paid per claim, the number of workers’
compensation claims filed in Oklahoma declined dramatically after the legislative changes were implemented in 2014. (There were 7,935 claims filed in 2017, down over 45 percent from 2012 (Oklahoma Workers’ Compensation Commission, 2018). The decline is not due to a decline in employment – State employment rose by 2.6 percent between 2012 and 2017 (Oklahoma Employment Security Division, https://www.ok.gov/oesc/Labor_Market/Quarterly_Census_of_Employment_and_Wages/). The statutory changes also made some previously compensable injuries non-compensable, and there is anecdotal evidence that claimants or their attorneys may have foregone filing claims, including fraudulent claims that have been discouraged or weeded out by the statutory changes (Personal communication of Christopher McLaren with Stormy Moore, Director of Permitting Services, Oklahoma Work-ers’ Compensation Commission.)
40 Workers’ Compensation Research Institute index, 2018, Figure 2: Interstate Comparison of Priced Paid for Professional Services, WCRI MPI-WC in 36 States, 2018. The other three – Indiana, New Hampshire, and Wisconsin – are also non-fee schedule states.
41 David A. Lieb, “Missouri Senate Backs Bill to Bolster Second Injury Fund,” Insurance Journal. May 13, 2013. “More than a thou-sand disabled workers could finally begin receiving payments for their job-related injuries if the Missouri House gives final approval to legislation intended to replenish an insolvent state fund.”
42 In 2015, medical-only claims accounted for 75 percent of all workers’ compensation claims, but less than 10 percent of all benefits paid (NCCI, 2019a). Since 1999, there has been a gradual decline in the share of medical-only claims from 78.3 percent to the cur-rent 75.3 percent. On the other hand, the share of benefits paid for medical-only claims has increased from 6.2 percent in 1999 to 7.4 percent of overall benefits in 2015.
43 The NCCI typically classifies workers’ compensation claims into discrete types according to the most severe type of disability benefit received. For example, a permanent partial disability beneficiary has typically received temporary disability benefits until the point of maximum medical improvement, but the entire cost of cash benefits for the claim is ascribed to permanent partial disability.
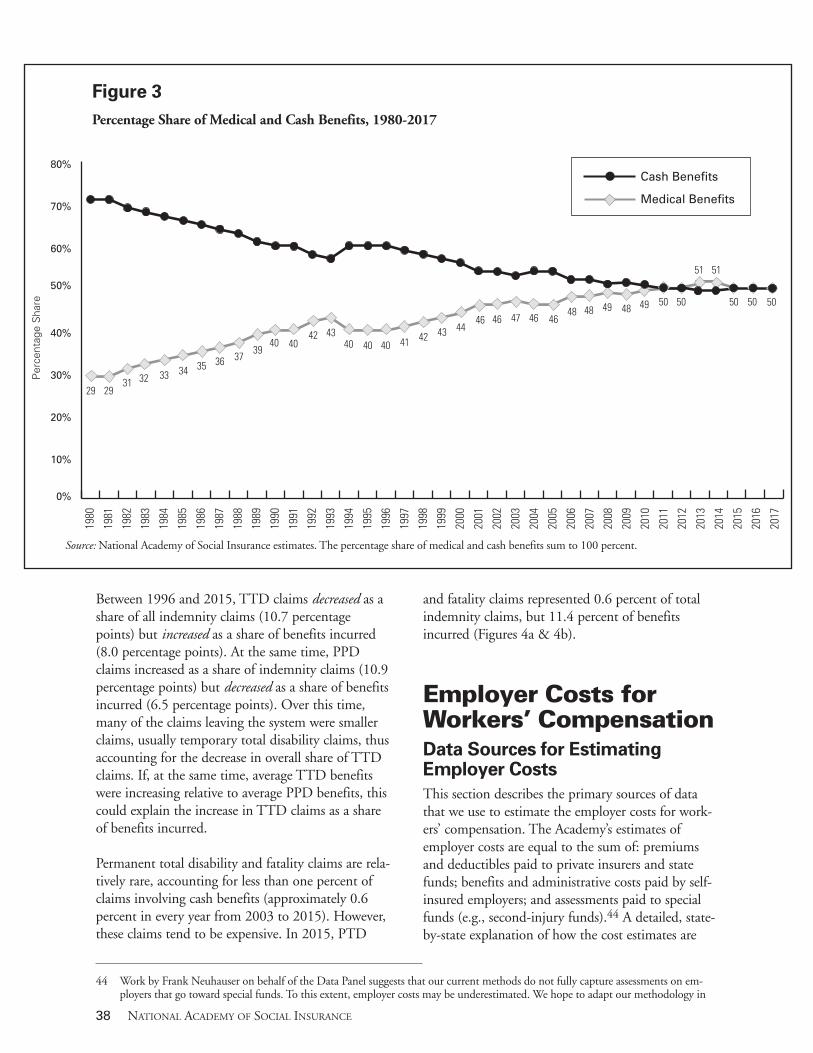
Between 1996 and 2015, TTD claims decreased as a share of all indemnity claims (10.7 percentage points) but increased as a share of benefits incurred (8.0 percentage points). At the same time, PPD claims increased as a share of indemnity claims (10.9 percentage points) but decreased as a share of benefits incurred (6.5 percentage points). Over this time, many of the claims leaving the system were smaller claims, usually temporary total disability claims, thus accounting for the decrease in overall share of TTD claims. If, at the same time, average TTD benefits were increasing relative to average PPD benefits, this could explain the increase in TTD claims as a share of benefits incurred. Permanent total disability and fatality claims are rela-tively rare, accounting for less than one percent of claims involving cash benefits (approximately 0.6 percent in every year from 2003 to 2015). However, these claims tend to be expensive. In 2015, PTD
and fatality claims represented 0.6 percent of total indemnity claims, but 11.4 percent of benefits incurred (Figures 4a & 4b).
Employer Costs for Workers’ Compensation Data Sources for Estimating Employer Costs
This section describes the primary sources of data that we use to estimate the employer costs for work-ers’ compensation. The Academy’s estimates of employer costs are equal to the sum of: premiums and deductibles paid to private insurers and state funds; benefits and administrative costs paid by self-insured employers; and assessments paid to special funds (e.g., second-injury funds).44 A detailed, state-by-state explanation of how the cost estimates are
38 NATIONAL ACADEMY OF SOCIAL INSURANCE
44 Work by Frank Neuhauser on behalf of the Data Panel suggests that our current methods do not fully capture assessments on em-
ployers that go toward special funds. To this extent, employer costs may be underestimated. We hope to adapt our methodology in
Figure 3
Percentage Share of Medical and Cash Benefits, 1980-2017
Source: National Academy of Social Insurance estimates. The percentage share of medical and cash benefits sum to 100 percent.
0%
10%
20%
30%
40%
50%
60%
70%
80%
1980
1981
1982
1983
1984
1985
1986
1987
1988
1989
1990
1991
1992
1993
1994
1995
1996
1997
1998
1999
2000
2001
2002
2003
2004
2005
2006
2007
2008
2009
2010
2011
2012
2013
2014
2015
2016
2017
4241404040
29
51
5049
51
48494848464646 4746
4443
2931 32 33 34 35 36 37
3940 40
42 43
5050 50 50
Per
cent
age
Sha
re
Cash Benefits
Medical Benefits
Workers’ Compensation: Benefits, Costs, and Coverage • 39
produced is provided in Sources and Methods: A Companion to Workers’ Compensation Benefits, Costs, and Coverage, 2017, available on the Academy’s website. The primary sources of cost data are the state surveys, A.M. Best, and NCCI. The Academy’s methods for estimating employer costs vary according to the employer’s source of workers’ compensation coverage. For employers pur-chasing insurance from private carriers or state funds, the costs of workers’ compensation in any year equals the sum of premiums paid in that year plus reimbursements paid to the insurer under deductible provisions. For self-insured employers, workers’ compensation costs include medical and cash benefits paid during the calendar year, plus the administrative costs of providing those benefits. Administrative costs include the direct costs of managing claims, as well as expenditures for litigation, cost containment (e.g., utilization review, treatment guidelines) taxes, licens-es, and fees. Self-insured employers generally do not report the administrative costs of workers’ compensa-tion separately from the costs of administering other employee benefit programs, so the costs associated with administering workers’ compensation must be estimated. The National Association of Insurance Commissioners reports the ratio of administrative costs to total benefits paid for private insurers who report to them (NAIC, 2019). To estimate adminis-trative costs for self-insured employers, we assume that the ratio of administrative costs to total benefits paid is the same for self-insured employers as it is for private insurers.45 For the federal employee workers’ compensation program, employer costs are benefits paid plus administrative costs, as reported by the U.S. Department of Labor (DOL, 2019). The Academy’s estimates of employer costs also include estimates of assessments for special funds,
second-injury funds, and guaranty funds. Employer assessments for special funds or second-injury funds are estimates from the assessment rates a state applies either to premiums or losses (benefits paid). State assessment rates are provided either by state agencies or by NCCI. Assessments for insurance guaranty funds are paid by insurers, so these are included in reported premiums. The fact that data on employer costs must be com-piled from a variety of sources imposes some limitations on the report. First, there may be some direct workers’ compensation costs not captured in the estimates. We may, for example, be missing some unreported expenditures, such as those for legal or case management services. Second, our estimates are limited to the monetary costs of work-related injuries and illnesses paid by employers. The esti-mates do not include the costs borne by employers who pay injured workers’ full salaries during periods of light duty or other post-injury job accommoda-tions. Some of this payment is a loss to the employer because of the reduced productivity of the worker(s) being accommodated. Finally, our estimates do not include the costs imposed on workers, families, and society in the form of pain and suffering, uncompen-sated lost wages, and unreimbursed medical costs. These costs are beyond the scope of this report.
National Estimates of Employer Costs
Table 13 shows employer costs for workers’ compen-sation by type of coverage for 1997 through 2017. In 2017, total employer costs were $97.4 billion, an increase of 0.4 percent since 2016, and of 9.1 percent since 2013. This increase in employer costs is largely explained by trends in employment and wages over the study period. Controlling for growth in employment and wages, employer costs actually decreased by $0.12 per $100 of covered wages (8.8%) between 2013
future reports to more adequately incorporate employer assessment costs in each state. (Neuhauser estimated a total discrepancy of $3.5 billion—almost 4 percent of total non-federal costs—for 2016, but his methods have not yet been replicated for other years studied.).
45 Private insurers face some cost factors, such as commissions, profit allowances, and taxes on premiums that self-insurers do not face. NAIC estimates of administrative costs are equal to the amount spent on direct defense and cost containment expenses plus taxes, li-censes, and fees, divided by direct losses paid (for more detail see Sources and Methods 2017). NAIC’s estimate of administrative costs is based on the experience of private insurers. Other reports have found higher administrative overhead costs as a percent of total premiums compared to those reported by NAIC (e.g., Neuhauser et al., 2010).
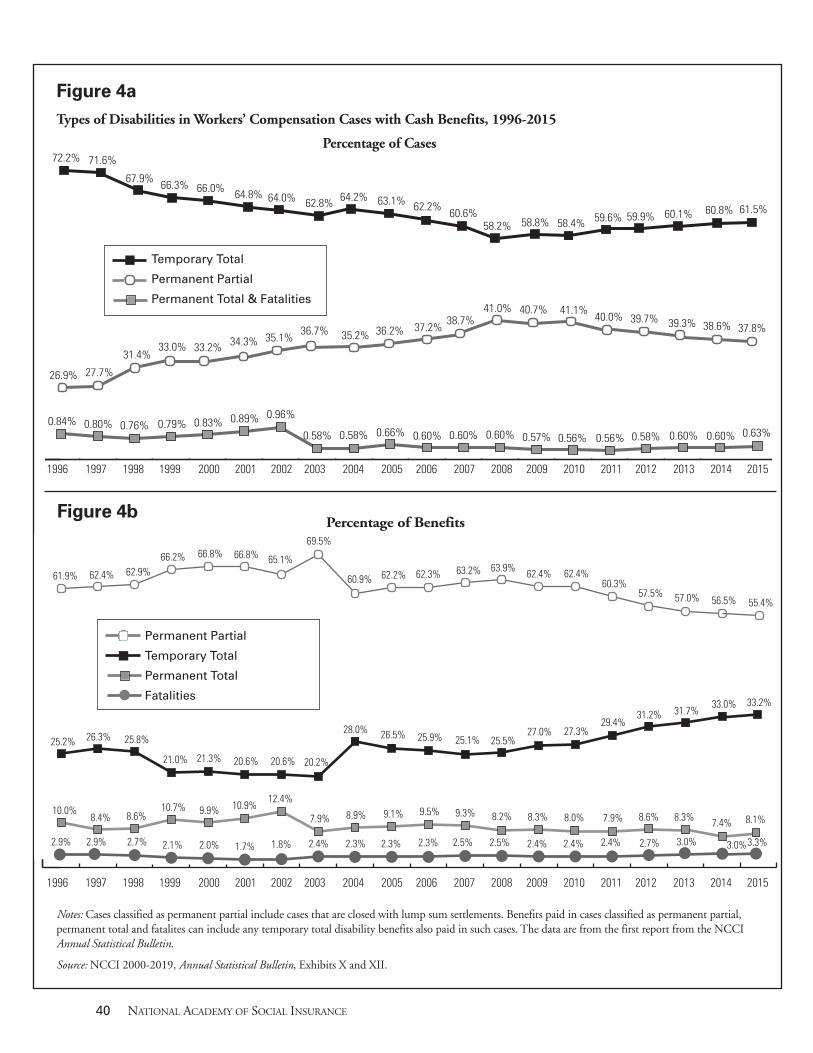
Figure 4a
Types of Disabilities in Workers’ Compensation Cases with Cash Benefits, 1996-2015
Percentage of Cases
Figure 4b
0.84%0.58% 0.60%0.56%0.56%0.57%0.60%0.60% 0.60%0.66%0.58%
0.80% 0.76% 0.79% 0.83% 0.89% 0.96%
0.58% 0.63%0.60%
72.2% 71.6%
67.9% 66.3%64.0% 62.8% 62.2%
66.0% 64.8% 64.2% 63.1%60.6%
58.2% 58.4%58.8%60.1%59.6%
27.7%
31.4%
36.7% 36.2% 37.2%35.1%
33.0%
38.7%41.0%
40.0%40.7%
38.6%39.7%
26.9%
33.2% 34.3% 35.2%
60.8%
39.3%
59.9%
41.1%
61.5%
37.8%
Percentage of Benefits
Notes: Cases classified as permanent partial include cases that are closed with lump sum settlements. Benefits paid in cases classified as permanent partial, permanent total and fatalites can include any temporary total disability benefits also paid in such cases. The data are from the first report from the NCCI Annual Statistical Bulletin.
Source: NCCI 2000-2019, Annual Statistical Bulletin, Exhibits X and XII.
Temporary Total
Permanent Partial
Permanent Total & Fatalities
1996 1997 1998 1999 2000 2001 2002 2003 2004 2005 2006 2007 2008 2009 2010 2011 2012 2013 2014 2015
61.9% 62.4% 62.9%66.2% 66.8% 65.1%
60.9% 62.2%
69.5%
63.9%62.3%60.3%
21.0%
25.2%
20.6%
25.1%28.0%
31.2%
21.3%
10.0%
57.0% 56.5%
26.3% 25.8%
9.5%12.4%
8.4% 8.6% 9.3%10.7% 9.9%
66.8%63.2% 62.4%
57.5%
20.2%20.6%
27.0%26.5% 25.9% 25.5%27.3%
29.4%31.7%
33.0%
10.9%7.9% 8.9% 9.1%
3.0% 3.0%
62.4%
2.9% 2.9% 2.7% 2.1% 2.0% 1.7% 1.8% 2.4% 2.3% 2.3% 2.5% 2.5% 2.4% 2.4% 2.4%2.3% 2.7%
8.2% 8.3% 8.0% 7.9% 8.6% 8.3% 7.4%
55.4%
33.2%
8.1%
3.3%
Permanent Partial
Temporary Total
Permanent Total
Fatalities
40 NATIONAL ACADEMY OF SOCIAL INSURANCE
1996 1997 1998 1999 2000 2001 2002 2003 2004 2005 2006 2007 2008 2009 2010 2011 2012 2013 2014 2015
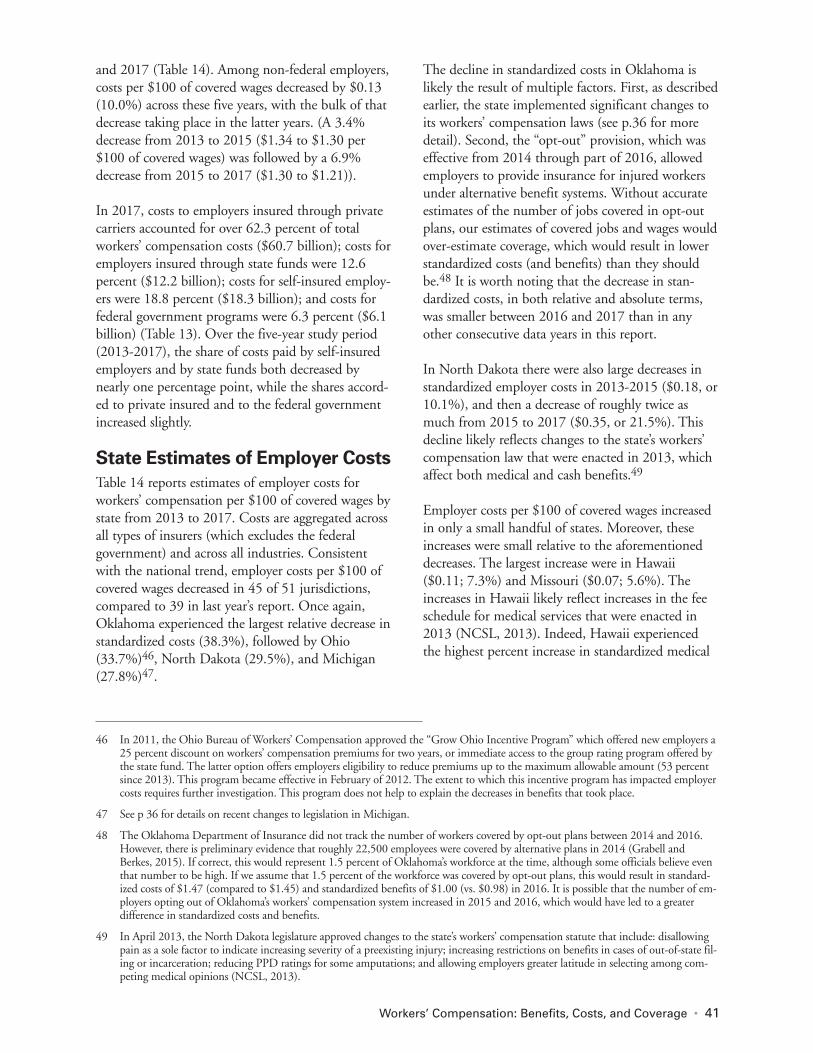
Workers’ Compensation: Benefits, Costs, and Coverage • 41
and 2017 (Table 14). Among non-federal employers, costs per $100 of covered wages decreased by $0.13 (10.0%) across these five years, with the bulk of that decrease taking place in the latter years. (A 3.4% decrease from 2013 to 2015 ($1.34 to $1.30 per $100 of covered wages) was followed by a 6.9% decrease from 2015 to 2017 ($1.30 to $1.21)). In 2017, costs to employers insured through private carriers accounted for over 62.3 percent of total workers’ compensation costs ($60.7 billion); costs for employers insured through state funds were 12.6 percent ($12.2 billion); costs for self-insured employ-ers were 18.8 percent ($18.3 billion); and costs for federal government programs were 6.3 percent ($6.1 billion) (Table 13). Over the five-year study period (2013-2017), the share of costs paid by self-insured employers and by state funds both decreased by nearly one percentage point, while the shares accord-ed to private insured and to the federal government increased slightly. State Estimates of Employer Costs
Table 14 reports estimates of employer costs for workers’ compensation per $100 of covered wages by state from 2013 to 2017. Costs are aggregated across all types of insurers (which excludes the federal government) and across all industries. Consistent with the national trend, employer costs per $100 of covered wages decreased in 45 of 51 jurisdictions, compared to 39 in last year’s report. Once again, Oklahoma experienced the largest relative decrease in standardized costs (38.3%), followed by Ohio (33.7%)46, North Dakota (29.5%), and Michigan (27.8%)47.
The decline in standardized costs in Oklahoma is likely the result of multiple factors. First, as described earlier, the state implemented significant changes to its workers’ compensation laws (see p.36 for more detail). Second, the “opt-out” provision, which was effective from 2014 through part of 2016, allowed employers to provide insurance for injured workers under alternative benefit systems. Without accurate estimates of the number of jobs covered in opt-out plans, our estimates of covered jobs and wages would over-estimate coverage, which would result in lower standardized costs (and benefits) than they should be.48 It is worth noting that the decrease in stan-dardized costs, in both relative and absolute terms, was smaller between 2016 and 2017 than in any other consecutive data years in this report. In North Dakota there were also large decreases in standardized employer costs in 2013-2015 ($0.18, or 10.1%), and then a decrease of roughly twice as much from 2015 to 2017 ($0.35, or 21.5%). This decline likely reflects changes to the state’s workers’ compensation law that were enacted in 2013, which affect both medical and cash benefits.49 Employer costs per $100 of covered wages increased in only a small handful of states. Moreover, these increases were small relative to the aforementioned decreases. The largest increase were in Hawaii ($0.11; 7.3%) and Missouri ($0.07; 5.6%). The increases in Hawaii likely reflect increases in the fee schedule for medical services that were enacted in 2013 (NCSL, 2013). Indeed, Hawaii experienced the highest percent increase in standardized medical
46 In 2011, the Ohio Bureau of Workers’ Compensation approved the “Grow Ohio Incentive Program” which offered new employers a
25 percent discount on workers’ compensation premiums for two years, or immediate access to the group rating program offered by the state fund. The latter option offers employers eligibility to reduce premiums up to the maximum allowable amount (53 percent since 2013). This program became effective in February of 2012. The extent to which this incentive program has impacted employer costs requires further investigation. This program does not help to explain the decreases in benefits that took place.
47 See p 36 for details on recent changes to legislation in Michigan.
48 The Oklahoma Department of Insurance did not track the number of workers covered by opt-out plans between 2014 and 2016. However, there is preliminary evidence that roughly 22,500 employees were covered by alternative plans in 2014 (Grabell and Berkes, 2015). If correct, this would represent 1.5 percent of Oklahoma’s workforce at the time, although some officials believe even that number to be high. If we assume that 1.5 percent of the workforce was covered by opt-out plans, this would result in standard-ized costs of $1.47 (compared to $1.45) and standardized benefits of $1.00 (vs. $0.98) in 2016. It is possible that the number of em-ployers opting out of Oklahoma’s workers’ compensation system increased in 2015 and 2016, which would have led to a greater difference in standardized costs and benefits.
49 In April 2013, the North Dakota legislature approved changes to the state’s workers’ compensation statute that include: disallowing pain as a sole factor to indicate increasing severity of a preexisting injury; increasing restrictions on benefits in cases of out-of-state fil-ing or incarceration; reducing PPD ratings for some amputations; and allowing employers greater latitude in selecting among com-peting medical opinions (NCSL, 2013).
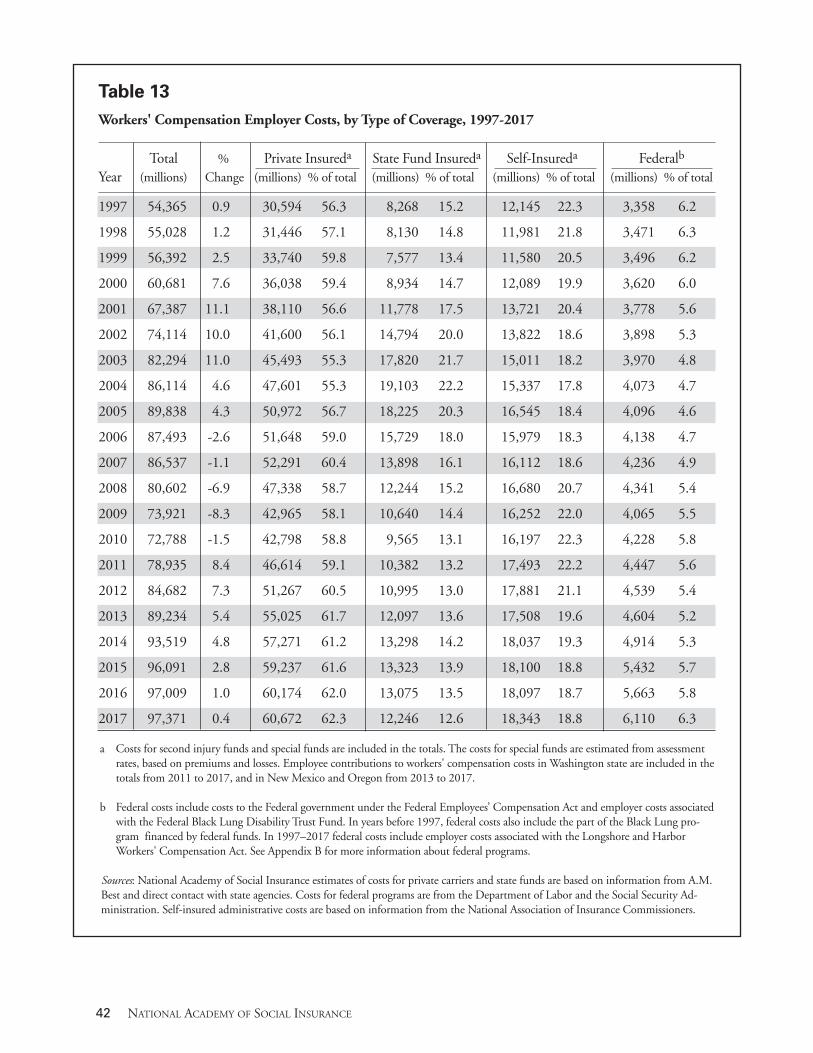
42 NATIONAL ACADEMY OF SOCIAL INSURANCE
Table 13
Workers' Compensation Employer Costs, by Type of Coverage, 1997-2017
Total % Private Insureda State Fund Insureda Self-Insureda Federalb Year (millions) Change (millions) % of total (millions) % of total (millions) % of total (millions) % of total
1997 54,365 0.9 30,594 56.3 8,268 15.2 12,145 22.3 3,358 6.2
1998 55,028 1.2 31,446 57.1 8,130 14.8 11,981 21.8 3,471 6.3
1999 56,392 2.5 33,740 59.8 7,577 13.4 11,580 20.5 3,496 6.2
2000 60,681 7.6 36,038 59.4 8,934 14.7 12,089 19.9 3,620 6.0
2001 67,387 11.1 38,110 56.6 11,778 17.5 13,721 20.4 3,778 5.6
2002 74,114 10.0 41,600 56.1 14,794 20.0 13,822 18.6 3,898 5.3
2003 82,294 11.0 45,493 55.3 17,820 21.7 15,011 18.2 3,970 4.8
2004 86,114 4.6 47,601 55.3 19,103 22.2 15,337 17.8 4,073 4.7
2005 89,838 4.3 50,972 56.7 18,225 20.3 16,545 18.4 4,096 4.6
2006 87,493 -2.6 51,648 59.0 15,729 18.0 15,979 18.3 4,138 4.7
2007 86,537 -1.1 52,291 60.4 13,898 16.1 16,112 18.6 4,236 4.9
2008 80,602 -6.9 47,338 58.7 12,244 15.2 16,680 20.7 4,341 5.4
2009 73,921 -8.3 42,965 58.1 10,640 14.4 16,252 22.0 4,065 5.5
2010 72,788 -1.5 42,798 58.8 9,565 13.1 16,197 22.3 4,228 5.8
2011 78,935 8.4 46,614 59.1 10,382 13.2 17,493 22.2 4,447 5.6
2012 84,682 7.3 51,267 60.5 10,995 13.0 17,881 21.1 4,539 5.4
2013 89,234 5.4 55,025 61.7 12,097 13.6 17,508 19.6 4,604 5.2
2014 93,519 4.8 57,271 61.2 13,298 14.2 18,037 19.3 4,914 5.3
2015 96,091 2.8 59,237 61.6 13,323 13.9 18,100 18.8 5,432 5.7
2016 97,009 1.0 60,174 62.0 13,075 13.5 18,097 18.7 5,663 5.8
2017 97,371 0.4 60,672 62.3 12,246 12.6 18,343 18.8 6,110 6.3 a Costs for second injury funds and special funds are included in the totals. The costs for special funds are estimated from assessment
rates, based on premiums and losses. Employee contributions to workers' compensation costs in Washington state are included in the totals from 2011 to 2017, and in New Mexico and Oregon from 2013 to 2017.
b Federal costs include costs to the Federal government under the Federal Employees’ Compensation Act and employer costs associated
with the Federal Black Lung Disability Trust Fund. In years before 1997, federal costs also include the part of the Black Lung pro-gram financed by federal funds. In 1997–2017 federal costs include employer costs associated with the Longshore and Harbor Workers' Compensation Act. See Appendix B for more information about federal programs.
Sources: National Academy of Social Insurance estimates of costs for private carriers and state funds are based on information from A.M. Best and direct contact with state agencies. Costs for federal programs are from the Department of Labor and the Social Security Ad-ministration. Self-insured administrative costs are based on information from the National Association of Insurance Commissioners.
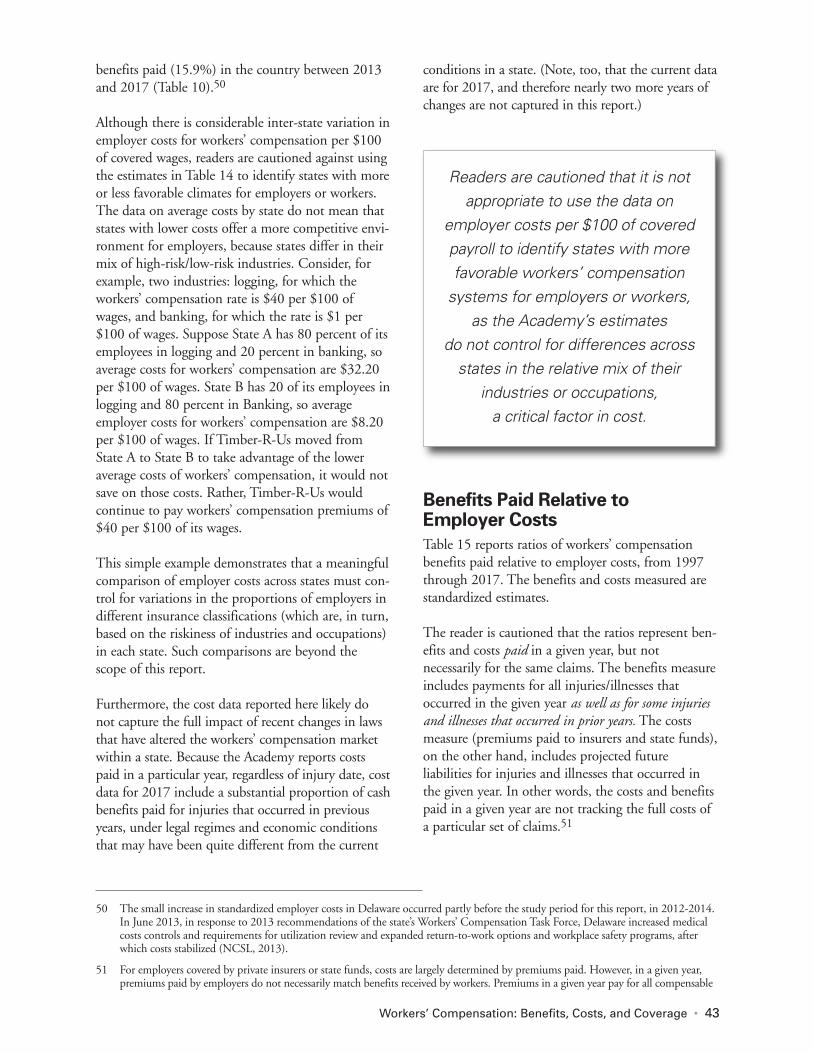
Workers’ Compensation: Benefits, Costs, and Coverage • 43
benefits paid (15.9%) in the country between 2013 and 2017 (Table 10).50 Although there is considerable inter-state variation in employer costs for workers’ compensation per $100 of covered wages, readers are cautioned against using the estimates in Table 14 to identify states with more or less favorable climates for employers or workers. The data on average costs by state do not mean that states with lower costs offer a more competitive envi-ronment for employers, because states differ in their mix of high-risk/low-risk industries. Consider, for example, two industries: logging, for which the workers’ compensation rate is $40 per $100 of wages, and banking, for which the rate is $1 per $100 of wages. Suppose State A has 80 percent of its employees in logging and 20 percent in banking, so average costs for workers’ compensation are $32.20 per $100 of wages. State B has 20 of its employees in logging and 80 percent in Banking, so average employer costs for workers’ compensation are $8.20 per $100 of wages. If Timber-R-Us moved from State A to State B to take advantage of the lower average costs of workers’ compensation, it would not save on those costs. Rather, Timber-R-Us would continue to pay workers’ compensation premiums of $40 per $100 of its wages. This simple example demonstrates that a meaningful comparison of employer costs across states must con-trol for variations in the proportions of employers in different insurance classifications (which are, in turn, based on the riskiness of industries and occupations) in each state. Such comparisons are beyond the scope of this report. Furthermore, the cost data reported here likely do not capture the full impact of recent changes in laws that have altered the workers’ compensation market within a state. Because the Academy reports costs paid in a particular year, regardless of injury date, cost data for 2017 include a substantial proportion of cash benefits paid for injuries that occurred in previous years, under legal regimes and economic conditions that may have been quite different from the current
conditions in a state. (Note, too, that the current data are for 2017, and therefore nearly two more years of changes are not captured in this report.)
Benefits Paid Relative to Employer Costs
Table 15 reports ratios of workers’ compensation benefits paid relative to employer costs, from 1997 through 2017. The benefits and costs measured are standardized estimates. The reader is cautioned that the ratios represent ben-efits and costs paid in a given year, but not necessarily for the same claims. The benefits measure includes payments for all injuries/illnesses that occurred in the given year as well as for some injuries and illnesses that occurred in prior years. The costs measure (premiums paid to insurers and state funds), on the other hand, includes projected future liabilities for injuries and illnesses that occurred in the given year. In other words, the costs and benefits paid in a given year are not tracking the full costs of a particular set of claims.51
50 The small increase in standardized employer costs in Delaware occurred partly before the study period for this report, in 2012-2014.
In June 2013, in response to 2013 recommendations of the state’s Workers’ Compensation Task Force, Delaware increased medical costs controls and requirements for utilization review and expanded return-to-work options and workplace safety programs, after which costs stabilized (NCSL, 2013).
51 For employers covered by private insurers or state funds, costs are largely determined by premiums paid. However, in a given year, premiums paid by employers do not necessarily match benefits received by workers. Premiums in a given year pay for all compensable
Readers are cautioned that it is not appropriate to use the data on
employer costs per $100 of covered payroll to identify states with more favorable workers’ compensation
systems for employers or workers, as the Academy’s estimates
do not control for differences across states in the relative mix of their
industries or occupations, a critical factor in cost.
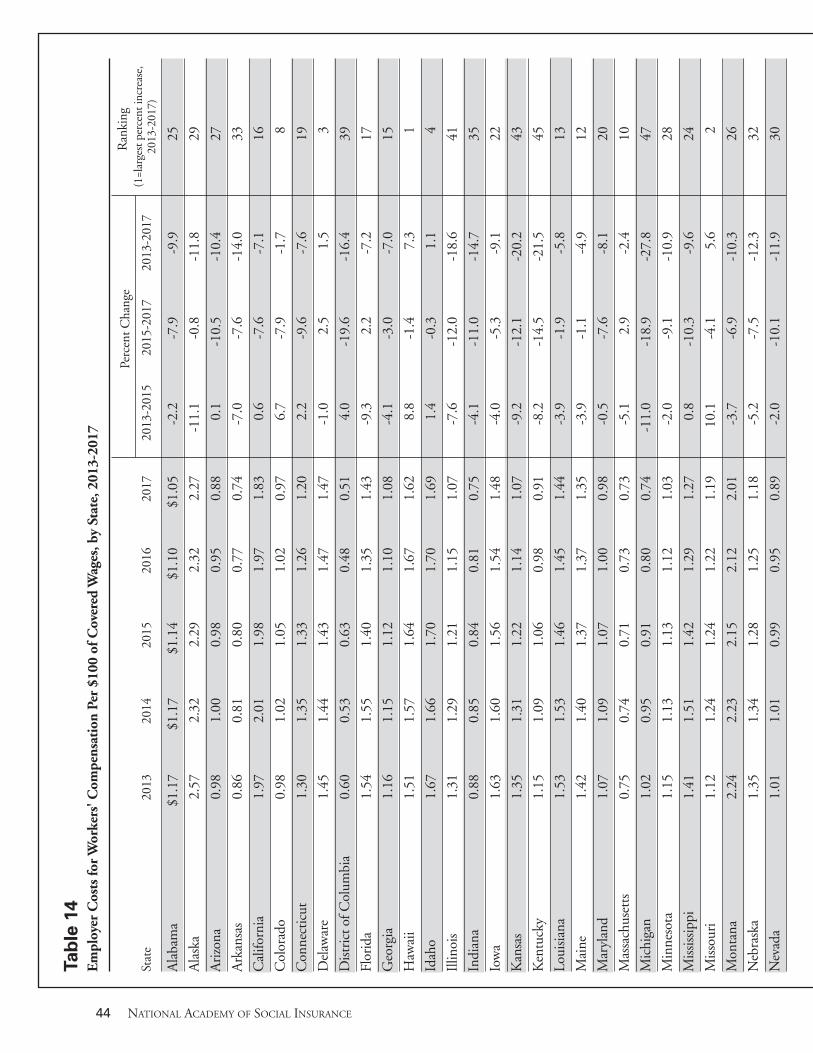
44 NATIONAL ACADEMY OF SOCIAL INSURANCE
Tab
le 1
4
Em
ploy
er C
osts
for
Wor
kers
' Com
pens
atio
n Pe
r $1
00 o
f Cov
ered
Wag
es, b
y St
ate,
201
3-20
17
Per
cent
Cha
nge
R
anki
ng
Stat
e20
1320
1420
1520
1620
17 2
013-
2015
2015
-201
720
13-2
017
Ala
bam
a$1
.17
$1.1
7$1
.14
$1.1
0$1
.05
-2.2
-7.9
-9.9
25
Ala
ska
2.57
2.32
2.29
2.32
2.27
-11.
1-0
.8-1
1.8
29
Ari
zona
0.98
1.00
0.98
0.95
0.88
0.1
-10.
5-1
0.4
27
Ark
ansa
s0.
860.
810.
800.
770.
74-7
.0-7
.6-1
4.0
33
Cal
iforn
ia1.
972.
011.
981.
971.
830.
6-7
.6-7
.116
Col
orad
o0.
981.
021.
051.
020.
976.
7-7
.9-1
.78
Con
nect
icut
1.30
1.35
1.33
1.26
1.20
2.2
-9.6
-7.6
19
Del
awar
e1.
451.
441.
431.
471.
47-1
.02.
51.
53
Dis
tric
t of C
olum
bia
0.60
0.53
0.63
0.48
0.51
4.0
-19.
6-1
6.4
39
Flor
ida
1.54
1.55
1.40
1.35
1.43
-9.3
2.2
-7.2
17
Geo
rgia
1.16
1.15
1.12
1.10
1.08
-4.1
-3.0
-7.0
15
Haw
aii
1.51
1.57
1.64
1.67
1.62
8.8
-1.4
7.3
1
Idah
o1.
671.
661.
701.
701.
691.
4-0
.31.
14
Illin
ois
1.31
1.29
1.21
1.15
1.07
-7.6
-12.
0-1
8.6
41
Indi
ana
0.88
0.85
0.84
0.81
0.75
-4.1
-11.
0-1
4.7
35
Iow
a1.
631.
601.
561.
541.
48-4
.0-5
.3-9
.122
Kan
sas
1.35
1.31
1.22
1.14
1.07
-9.2
-12.
1-2
0.2
43
Ken
tuck
y1.
151.
091.
060.
980.
91-8
.2-1
4.5
-21.
545
Loui
siana
1.53
1.53
1.46
1.45
1.44
-3.9
-1.9
-5.8
13
Mai
ne1.
421.
401.
371.
371.
35-3
.9-1
.1-4
.912
Mar
ylan
d1.
071.
091.
071.
000.
98-0
.5-7
.6-8
.120
Mas
sach
uset
ts0.
750.
740.
710.
730.
73-5
.12.
9-2
.410
Mic
higa
n1.
020.
950.
910.
800.
74-1
1.0
-18.
9-2
7.8
47
Min
neso
ta1.
151.
131.
131.
121.
03-2
.0-9
.1-1
0.9
28
Miss
issi
ppi
1.41
1.51
1.42
1.29
1.27
0.8
-10.
3-9
.624
Miss
ouri
1.12
1.24
1.24
1.22
1.19
10.1
-4.1
5.6
2
Mon
tana
2.24
2.23
2.15
2.12
2.01
-3.7
-6.9
-10.
326
Neb
rask
a1.
351.
341.
281.
251.
18-5
.2-7
.5-1
2.3
32
Nev
ada
1.01
1.01
0.99
0.95
0.89
-2.0
-10.
1-1
1.9
30
(1=l
arge
st p
erce
nt in
crea
se,
2013
-201
7)
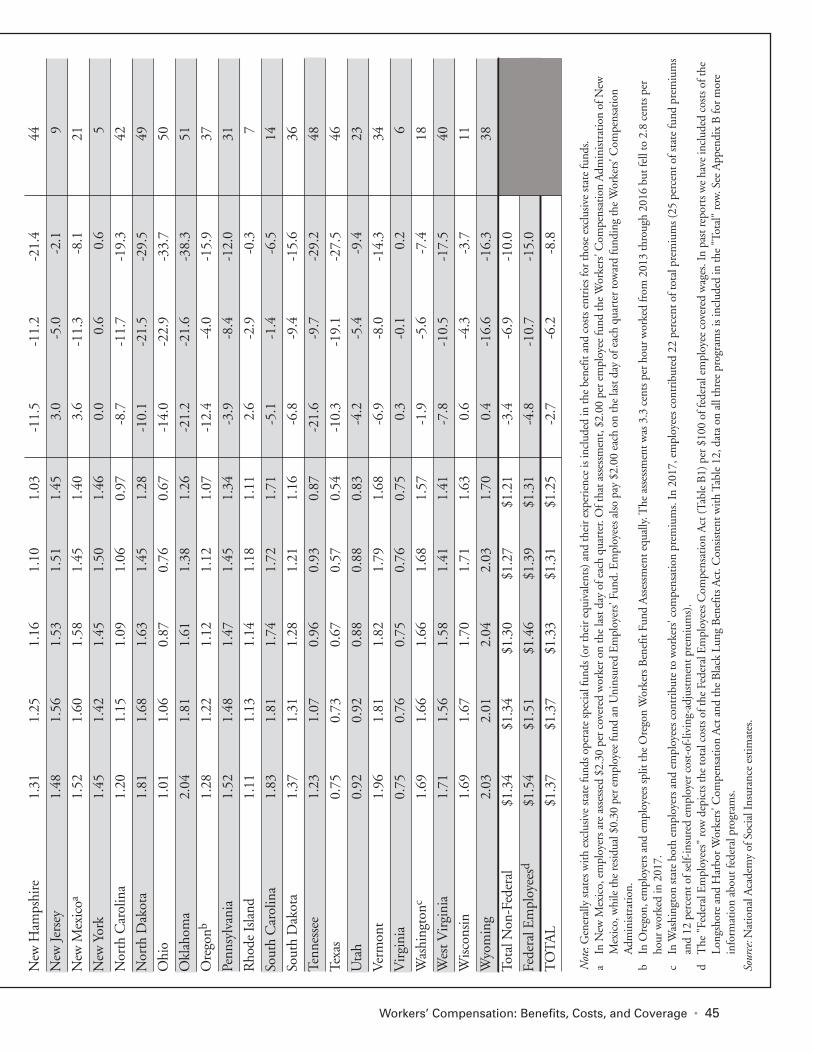
Workers’ Compensation: Benefits, Costs, and Coverage • 45
New
Ham
pshi
re1.
311.
251.
161.
101.
03-1
1.5
-11.
2-2
1.4
44
New
Jers
ey1.
481.
561.
531.
511.
453.
0-5
.0-2
.19
New
Mex
icoa
1.52
1.60
1.58
1.45
1.40
3.6
-11.
3-8
.121
New
Yor
k1.
451.
421.
451.
501.
460.
00.
60.
65
Nor
th C
arol
ina
1.20
1.15
1.09
1.06
0.97
-8.7
-11.
7-1
9.3
42
Nor
th D
akot
a1.
811.
681.
631.
451.
28-1
0.1
-21.
5-2
9.5
49
Ohi
o1.
011.
060.
870.
760.
67-1
4.0
-22.
9-3
3.7
50
Okl
ahom
a2.
041.
811.
611.
381.
26-2
1.2
-21.
6-3
8.3
51
Ore
gonb
1.28
1.22
1.12
1.12
1.07
-12.
4-4
.0-1
5.9
37
Penn
sylv
ania
1.52
1.48
1.47
1.45
1.34
-3.9
-8.4
-12.
031
Rho
de Is
land
1.11
1.13
1.14
1.18
1.11
2.6
-2.9
-0.3
7
Sout
h C
arol
ina
1.83
1.81
1.74
1.72
1.71
-5.1
-1.4
-6.5
14
Sout
h D
akot
a1.
371.
311.
281.
211.
16-6
.8-9
.4-1
5.6
36
Tenn
esse
e1.
231.
070.
960.
930.
87-2
1.6
-9.7
-29.
248
Texa
s0.
750.
730.
670.
570.
54-1
0.3
-19.
1-2
7.5
46
Uta
h0.
920.
920.
880.
880.
83-4
.2-5
.4-9
.423
Ver
mon
t1.
961.
811.
821.
791.
68-6
.9-8
.0-1
4.3
34
Vir
gini
a0.
750.
760.
750.
760.
750.
3-0
.10.
26
Was
hing
tonc
1.69
1.66
1.66
1.68
1.57
-1.9
-5.6
-7.4
18
Wes
t Vir
gini
a1.
711.
561.
581.
411.
41-7
.8-1
0.5
-17.
540
Wis
cons
in1.
691.
671.
701.
711.
630.
6-4
.3-3
.711
Wyo
min
g2.
032.
012.
042.
031.
700.
4-1
6.6
-16.
338
Tota
l Non
-Fed
eral
$1
.34
$1.3
4$1
.30
$1.2
7$1
.21
-3.4
-6.9
-10.
0
Fede
ral E
mpl
oyee
sd$1
.54
$1.5
1$1
.46
$1.3
9$1
.31
-4.8
-10.
7-1
5.0
TO
TA
L$1
.37
$1.3
7$1
.33
$1.3
1$1
.25
-2.7
-6.2
-8.8
N
ote:
Gen
eral
ly st
ates
with
exc
lusiv
e st
ate
fund
s ope
rate
spec
ial f
unds
(or
thei
r eq
uiva
lent
s) a
nd th
eir
expe
rien
ce is
incl
uded
in th
e be
nefit
and
cos
ts e
ntri
es fo
r th
ose
excl
usiv
e st
ate
fund
s.
aIn
New
Mex
ico,
em
ploy
ers a
re a
sses
sed
$2.3
0 pe
r co
vere
d w
orke
r on
the
last
day
of e
ach
quar
ter.
Of t
hat a
sses
smen
t, $2
.00
per
empl
oyee
fund
the
Wor
kers
' Com
pens
atio
n A
dmin
istr
atio
n of
New
M
exic
o, w
hile
the
resid
ual $
0.30
per
em
ploy
ee fu
nd a
n U
nins
ured
Em
ploy
ers'
Fund
. Em
ploy
ees a
lso p
ay $
2.00
eac
h on
the
last
day
of e
ach
quar
ter
tow
ard
fund
ing
the
Wor
kers
' Com
pens
atio
n
Adm
inist
ratio
n.
bIn
Ore
gon,
em
ploy
ers a
nd e
mpl
oyee
s spl
it th
e O
rego
n W
orke
rs B
enef
it Fu
nd A
sses
smen
t equ
ally
. The
ass
essm
ent w
as 3
.3 c
ents
per
hou
r w
orke
d fr
om 2
013
thro
ugh
2016
but
fell
to 2
.8 c
ents
per
ho
ur w
orke
d in
201
7.
cIn
Was
hing
ton
stat
e bo
th e
mpl
oyer
s and
em
ploy
ees c
ontr
ibut
e to
wor
kers
' com
pens
atio
n pr
emiu
ms.
In 2
017,
em
ploy
ees c
ontr
ibut
ed 2
2 pe
rcen
t of t
otal
pre
miu
ms (
25 p
erce
nt o
f sta
te fu
nd p
rem
ium
s an
d 12
per
cent
of s
elf-
insu
red
empl
oyer
cos
t-of
-livi
ng-a
djus
tmen
t pre
miu
ms)
. d
The
"Fe
dera
l Em
ploy
ees"
row
dep
icts
the
tota
l cos
ts o
f the
Fed
eral
Em
ploy
ees C
ompe
nsat
ion
Act
(Ta
ble
B1)
per
$10
0 of
fede
ral e
mpl
oyee
cov
ered
wag
es. I
n pa
st re
port
s we
have
incl
uded
cos
ts o
f the
Lo
ngsh
ore
and
Har
bor W
orke
rs' C
ompe
nsat
ion
Act
and
the
Bla
ck L
ung
Ben
efits
Act
. Con
siste
nt w
ith T
able
12,
dat
a on
all
thre
e pr
ogra
ms i
s inc
lude
d in
the
"Tot
al"
row
. See
App
endi
x B
for
mor
e
info
rmat
ion
abou
t fed
eral
pro
gram
s.
Sour
ce: N
atio
nal A
cade
my
of S
ocia
l Ins
uran
ce e
stim
ates
.
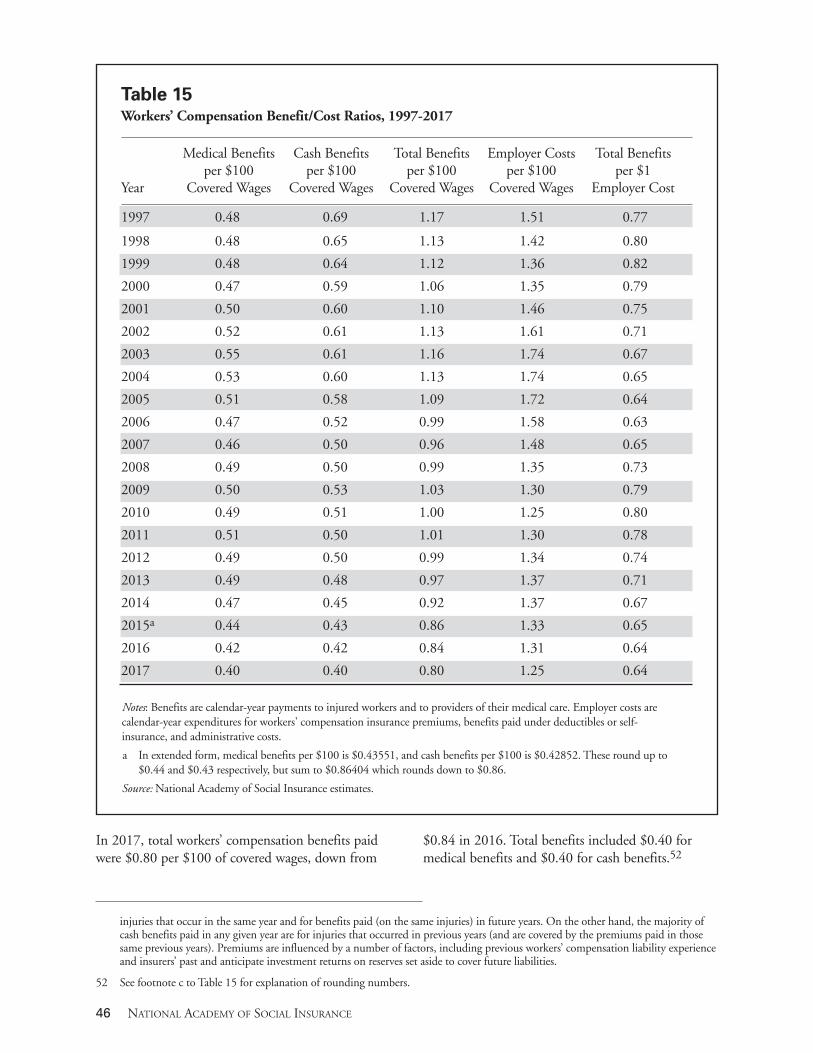
In 2017, total workers’ compensation benefits paid were $0.80 per $100 of covered wages, down from
$0.84 in 2016. Total benefits included $0.40 for medical benefits and $0.40 for cash benefits.52
46 NATIONAL ACADEMY OF SOCIAL INSURANCE
Table 15 Workers’ Compensation Benefit/Cost Ratios, 1997-2017
Medical Benefits Cash Benefits Total Benefits Employer Costs Total Benefits per $100 per $100 per $100 per $100 per $1
Year Covered Wages Covered Wages Covered Wages Covered Wages Employer Cost
1997 0.48 0.69 1.17 1.51 0.77
1998 0.48 0.65 1.13 1.42 0.80
1999 0.48 0.64 1.12 1.36 0.82
2000 0.47 0.59 1.06 1.35 0.79
2001 0.50 0.60 1.10 1.46 0.75
2002 0.52 0.61 1.13 1.61 0.71
2003 0.55 0.61 1.16 1.74 0.67
2004 0.53 0.60 1.13 1.74 0.65
2005 0.51 0.58 1.09 1.72 0.64
2006 0.47 0.52 0.99 1.58 0.63
2007 0.46 0.50 0.96 1.48 0.65
2008 0.49 0.50 0.99 1.35 0.73
2009 0.50 0.53 1.03 1.30 0.79
2010 0.49 0.51 1.00 1.25 0.80
2011 0.51 0.50 1.01 1.30 0.78
2012 0.49 0.50 0.99 1.34 0.74
2013 0.49 0.48 0.97 1.37 0.71
2014 0.47 0.45 0.92 1.37 0.67
2015a 0.44 0.43 0.86 1.33 0.65
2016 0.42 0.42 0.84 1.31 0.64
2017 0.40 0.40 0.80 1.25 0.64
Notes: Benefits are calendar-year payments to injured workers and to providers of their medical care. Employer costs are calendar-year expenditures for workers' compensation insurance premiums, benefits paid under deductibles or self- insurance, and administrative costs.
a In extended form, medical benefits per $100 is $0.43551, and cash benefits per $100 is $0.42852. These round up to $0.44 and $0.43 respectively, but sum to $0.86404 which rounds down to $0.86.
Source: National Academy of Social Insurance estimates.
injuries that occur in the same year and for benefits paid (on the same injuries) in future years. On the other hand, the majority of cash benefits paid in any given year are for injuries that occurred in previous years (and are covered by the premiums paid in those same previous years). Premiums are influenced by a number of factors, including previous workers’ compensation liability experience and insurers’ past and anticipate investment returns on reserves set aside to cover future liabilities.
52 See footnote c to Table 15 for explanation of rounding numbers.
Workers’ Compensation: Benefits, Costs, and Coverage • 47
Employer costs were $1.25 per $100 of covered wages. As shown in Figure 1, these are the lowest levels of both standardized costs and benefits in the past 38 years of data (though costs were as low in 2010). The benefit/cost ratio for 2017 was $0.64 meaning that, on average, $0.64 of benefits were paid to injured workers for every dollar of employer costs. Employer costs for workers’ compensation exceed benefits paid (i.e., the benefit/cost ratio is less than one) because some part of employer costs go to administrative expenses and profits for workers’ com-pensation insurers. In addition, employer premiums must account for future inflation in medical costs. That is, employers are paying up front for the costs of current claims that will be paid in future years. Finally, the costs of workers’ compensation insurance include a risk premium to compensate for the expected variation in costs from year to year. The benefit/cost ratio varies from year to year for a number of reasons, including: 1) changes in the pro-portion of costs of administrative expenses; 2) changes in the underwriting results of the workers’ compensation industry, as measured by the overall operating ratio; 3) insurers use a greater (or smaller) portion of their returns on investments, rather than premiums, to defray all or part of their workers’ compensation costs; 4) the expected number/severity of workplace injuries increases or decreases; 5) any changes in the proportion of workplace injuries that result in filed and compensated claims; and 6) the time lag between changes in employer costs (premi-ums collected) and changes in benefits paid varies. The benefit/cost ratio in 2017 (0.64) continued to be at its lowest point since 2006. The ratio increased by $0.13 per $100 of covered wages between 2007 and 2011, then declined by $0.14 between 2011 and 2017. These trends are typical of changes in workers’ compensation benefits and costs in response to changes in the economy. In periods of recession, employer premiums decrease more rapidly than ben-efits (because premiums reflect expected future liabilities for current injuries), so the benefit/cost ratio increases. In periods of expansion, the opposite is true.
Part of the declining ratio of benefits to costs between 2013 and 2017 might be explained by the increasingly favorable underwriting results for the workers’ compensation insurance industry between 2013 and 2017. The most comprehensive measure of underwriting results is the overall operating ratio, which is calculated as (1) the total of all insurance company expenditures (2) minus investment income (3) as a percentage of premiums. The lower the over-all operating ratio, the more favorable are the underwriting results for the workers’ compensation insurance industry (Brandenburg et al, 2017). Between 2013 and 2017, the overall operating ratio for the workers’ compensation insurance industry declined from 83.1 to 77.7 (Brandenburg 2019, Table 1), which represented a 6.5 percent improve-ment in underwriting results for workers’ compensation insurance companies during these four years. To put the 2017 results in an historical context, the 77.7 overall operating ratio represented the best underwriting results for the workers’ com-pensation insurance industry since the NAIC data series began in 1976. In other words, workers’ com-pensation has been an increasingly profitable line of business for private insurers. Estimates of Employer Costs from Other Sources
The Academy’s estimates compared
to Bureau of Labor Statistics (BLS)
estimates.
The BLS publishes a quarterly report on Employer costs for Employee Compensation (DOL, 2019a). Estimates are derived from a representative sample of establishments in the private sector, state and local governments. Costs are reported for five benefit cate-gories (paid leave, supplemented pay, insurance, retirement and savings, and legally required benefits) per employee hour worked. Workers’ compensation benefits are included within the legally required ben-efits category. The purpose of the BLS report is to provide average estimate of employer costs per hour worked, inclusive of wages, salaries, and employee benefits.53
53 Burton (2015) uses data from the BLS survey to calculate employer costs for workers’ compensation per $100 of covered payroll and
compares it with the Academy’s national estimates. This series, which is scheduled to be published by the National Institute of Occupational Safety and Health (NIOSH), is derived from different methods of data collection compared to the Academy.
48 NATIONAL ACADEMY OF SOCIAL INSURANCE
The purpose of the Academy’s report is quite differ-ent. The BLS collects data on a broad range of employee benefits, while this Academy report focuses on workers’ compensation. The Academy seeks to provide summary data on workers’ compensation benefits paid to workers and costs borne by employ-ers at the state and national levels. Our estimates of $61.9 billion in benefits paid and $97.2 billion in costs borne by employers in 2017 are the only data that answer questions about aggregate benefits and costs of workers’ compensation in the United States. The Academy’s estimates compared to
Oregon Rate Ranking estimates.
The Oregon Workers’ Compensation Rate Ranking study (Oregon Department of Consumer and Business Services, 2018) also provides estimates of employer costs for workers’ compensation. The study, conducted on a biennial basis by the state of Oregon, compares workers’ compensation premium rates across states for a standardized set of insurance classifications. The standardization is designed to fac-tor out differences in hazard mix (riskiness of industries) across states to provide a measure of inter-state differences in costs for comparable risk distributions.54 The standardized rates are based on the Oregon mix of insurance classifications, hence the rankings could be somewhat different if they were standardized based on another state. (See the table on p.11) Results of the Oregon study should not be compared to the estimates of employer costs reported here. Interstate differences in employer costs that appear in the Academy data are influenced in part by the dif-ferent risk profiles presented by each state’s economy, as well as by variations in self-insurance across states. The Oregon study reports rates for a constant set of
risk classifications across states, and does not include self-insured employers.55
Costs to Workers
In some states, a portion of the costs of workers’ compensation are directly paid by workers, as discussed in more detail in Appendix D. In Washington, for example, workers contribute directly to the insurance premiums for workers’ compensation through payroll deductions. In 2017, about 22.0 percent of the total costs of workers’ compensation in Washington were paid directly by workers.56 In some states, workers pay a portion of the costs for special workers’ compensation funds. In Oregon, for example, workers pay into the Workers’ Benefit Fund, which funds a benefit adjustment fund for long-term cases, return-to-work programs, and death benefits. New Mexico has a quarterly workers’ compensation assessment for each employee that goes toward funding the Workers’ Compensation Administration of New Mexico.57 Data in this report primarily covers the employer-paid portion of workers’ compensation, but New Mexico, Oregon, and Washington explicitly require employee contributions and are thus included in our estimates.58 In addition, workers bear considerable costs that are outside the workers’ compensation system, such as the portion of lost wages that are not replaced by workers’ compensation benefits. Most workers’ compensation statutes provide for weekly benefits that are two-thirds of pre-injury wages. However, the statutes also include weekly maximum and minimum benefit amounts such that the mean replacement rate is less than the two-thirds nominal replacement rate.59 In addition, many states impose limits on the duration of permanent partial disability
54 The Oregon estimates are standardized on 50 out of 450 rate classifications.
55 Burton (2013) and Manley (2013) provide more extended discussions of the differences between the measures of employer costs from the Academy and Oregon studies.
56 Employees contributed 25.0 percent of state fund premiums and paid half of the cost-of-living adjustment premium for self-insured employees in 2017, which accounted for 10.9 percent of self-insured workers’ compensation costs.
57 See footnote 14 or footnote a to Table 14 for details about New Mexico’s assessment.
58 See Appendix D for details on these programs.
59 A study assessing ten-year losses and replacement rates in five states find that rates were far below the two-thirds ideal, ranging from a high of 46% in New Mexico to a low of just 29% in Wisconsin, with the other three states, California (37%), Washington (41%), and Oregon (42%) in between. Reville, R. T., L. I. Boden, J. Biddle and C. Mardesich (2001). “An evaluation of New Mexico work-ers’ compensation permanent partial disability and return to work.” Santa Monica, CA, Rand Institute for Civil Justice.

benefits (so that benefits may cease while workers are still experiencing lost earnings from a workplace
injury or illness). The limits on duration further reduce the real replacement rate of cash benefits.60
Workers’ Compensation: Benefits, Costs, and Coverage • 49
60 Seabury et al. (2014) estimated earnings losses for New Mexico workers’ compensation claimants injured from 1994-2000. On average,
workers lost 15% of earnings in the 10 years after injury; workers’ compensation replaced 16% of earnings losses for the average worker.
Table 16 Fatal Occupational Injuries - All and Private Industry, 1997-2017
Number of Fatal Injuries Fatal Injury Incidence Rates
Year All Wage & Salary Workers All Wage & Salary Workers
1997 6,218 4,959 4.7 4.1
1998 6,026 4,782 4.5 3.9
1999 6,023 4,884 4.5 3.9
2000 5,915 4,731 4.3 3.7
2001a 5,900 4,770 4.3 3.8
2002 5,534 4,481 4.0 3.5
2003 5,575 4,405 4.0 3.4
2004 5,764 4,587 4.1 3.5
2005 5,734 4,592 4.0 3.5
2006 5,840 4,808 4.2 3.6
2007b 5,657 4,613 4.0 3.5
2008 5,214 4,183 3.7 3.2
2009 4,551 3,448 3.5 2.8
2010 4,690 3,651 3.6 3.0
2011 4,693 3,642 3.5 2.9
2012 4,628 3,571 3.4 2.8
2013 4,585 3,635 3.3 2.8
2014 4,821 3,728 3.4 2.8
2015 4,836 3,751 3.4 2.8
2016 5,190 4,098 3.6 3.0
2017 5,147 4,069 3.5 2.9 Note: Wage & Salary workers includes individuals employed in private industry or government, but excludes individuals who are self-employed. a 2001 totals exclude fatalities from the September 11 terrorist attacks. b Prior to 2007, fatal injury rates represented the number of fatal occupational injuries per 100,000 employed workers. These
rates measure the risk of fatal injury for those employed during a given period of time, regardless of hours worked. Starting in 2007, the BLS adopted a new methodology to calculate fataly injury rates based on the number of hours worked. Hours-based rates measure fatal injury risk based on the average employment and average hours worked during a given period of time. Hours-based fatal injury rates are considered more accurate and should not be directly compared to employment-based rates.
Source: U.S. Department of Labor (2018).

50 NATIONAL ACADEMY OF SOCIAL INSURANCE
Workers also bear costs in the form of waiting periods. A waiting period is the time a worker must wait after experiencing a work-related injury before he or she can begin collecting cash benefits. All but three states (Hawaii, Rhode Island, and Oklahoma) have provisions to pay retroactive benefits to cover the waiting period for more serious (longer duration) lost-time injuries. In most states the retroactive peri-od is between 7 and 21 days (1-3 weeks), but Alaska and New Mexico require workers to wait 28 days (close to a month), and Nebraska’s retroactive period is 42 days (see Appendix Table C). Waiting periods may result in lost wages or partial wage replacement if either 1) a worker is injured for fewer days than the waiting period and, thus, does not qualify for cash benefits, or 2) a worker is out of work for more days than the waiting period, but fewer days than the retroactive period. In these cases, the uncompen-sated time loss attributable to the waiting period constitutes a cost to the worker. The financial costs of uncompensated waiting periods are not routinely tracked or reported by individual states, however, and are therefore extremely difficult to collect and tabulate. Some injured workers may incur costs because they have income that is not covered by workers’ com-pensation at all. For example, workers holding multiple jobs may not be compensated for lost earn-ings from a second or subsequent job. Many states also have rules excluding certain types of income (e.g., overtime or shift differentials) from coverage. Other costs to workers may include losses of fringe benefits that occur during periods of injury-related work absence; loss of home production attributable to a work-related injury or illness; and loss of employer contributions to health insurance premi-ums (unless the worker is also on leave under the Family and Medical Leave Act, or the employer’s insurance plan allows continued participation during periods of injury-related work absence). Refer to Leigh and Marcin (2012) for estimates of how the costs of work-related injuries are allocated among insurers, government payers, and injured workers. Disputed claims are responsible for significant costs to injured workers (and employers). Workers often
hire attorneys to represent them in claims disputes; attorney fees can siphon off 20 percent or more of the cash benefit of their clients. Insured employers are represented by their insurance carrier in legal proceedings, although there are also unreimbursed costs to employers, such as reduced productivity related to injured workers’ disability and the cost of time off work for managers and other witnesses to participate in hearings. Studies comparing lost earnings with workers’ com-pensation benefits show that the proportion of lost earnings replaced by workers’ compensation benefits is smaller than can be explained by statutory provi-sions. This suggests that conclusions drawn only from statutory provisions overestimate the extent of workers’ injury-related lost earnings replaced by workers’ compensation benefits. (See footnotes 39, 56, and 57.) Finally, a large portion of costs borne by workers are for work-related injuries and illnesses that never result in a successful workers’ compensation claim. Occupational illnesses in particular are frequently uncompensated (see, e.g., Boden and Ozonoff, 2008; Fan et al., 2006; Roseman et al., 2006; and Spieler, 2017).
Incidence of Workplace Injuries and Workers’ Compensation Claims Incidence of Work-Related Injuries
Fatal injuries. The BLS collects information on work-related injuries that result in a worker’s death from the National Census of Fatal Occupational Injuries (DOL 2018). According to the BLS data, 5,147 fatal work-related injuries occurred in 2017, a decrease of 0.8 percent from 2016, marking the reversal of an upward trend in fatalities that began in 2013 (Table 16). Over the 20-year period from 1997-2017, total workplace fatalities declined by roughly 17 percent, and the fatality rate (controlling for employment) declined by approximately 25 per-cent.61
61 Prior to 2007, BLS fatal injury rates represented the number of fatal occupational injuries per 100,000 employed workers. Since
then, the incidence rate accounts for the total number of hours worked by all employees during the calendar year. Incidence rates are reported on a full-time equivalent basis (one FTE worker is defined as 2,000 hours worked per year). Rates before and after 2007 are therefore not strictly comparable, and the 25 percent reduction is an approximation.
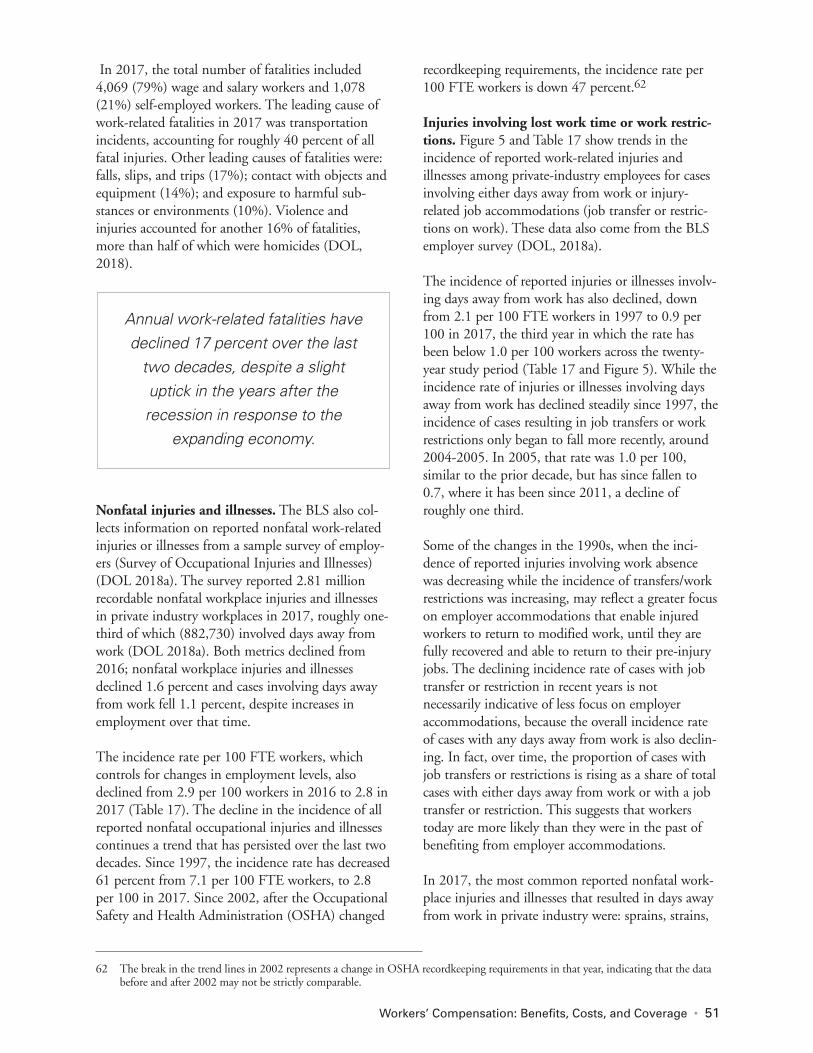
Workers’ Compensation: Benefits, Costs, and Coverage • 51
In 2017, the total number of fatalities included 4,069 (79%) wage and salary workers and 1,078 (21%) self-employed workers. The leading cause of work-related fatalities in 2017 was transportation incidents, accounting for roughly 40 percent of all fatal injuries. Other leading causes of fatalities were: falls, slips, and trips (17%); contact with objects and equipment (14%); and exposure to harmful sub-stances or environments (10%). Violence and injuries accounted for another 16% of fatalities, more than half of which were homicides (DOL, 2018).
Nonfatal injuries and illnesses. The BLS also col-lects information on reported nonfatal work-related injuries or illnesses from a sample survey of employ-ers (Survey of Occupational Injuries and Illnesses) (DOL 2018a). The survey reported 2.81 million recordable nonfatal workplace injuries and illnesses in private industry workplaces in 2017, roughly one-third of which (882,730) involved days away from work (DOL 2018a). Both metrics declined from 2016; nonfatal workplace injuries and illnesses declined 1.6 percent and cases involving days away from work fell 1.1 percent, despite increases in employment over that time. The incidence rate per 100 FTE workers, which controls for changes in employment levels, also declined from 2.9 per 100 workers in 2016 to 2.8 in 2017 (Table 17). The decline in the incidence of all reported nonfatal occupational injuries and illnesses continues a trend that has persisted over the last two decades. Since 1997, the incidence rate has decreased 61 percent from 7.1 per 100 FTE workers, to 2.8 per 100 in 2017. Since 2002, after the Occupational Safety and Health Administration (OSHA) changed
recordkeeping requirements, the incidence rate per 100 FTE workers is down 47 percent.62
Injuries involving lost work time or work restric-tions. Figure 5 and Table 17 show trends in the incidence of reported work-related injuries and illnesses among private-industry employees for cases involving either days away from work or injury- related job accommodations (job transfer or restric-tions on work). These data also come from the BLS employer survey (DOL, 2018a). The incidence of reported injuries or illnesses involv-ing days away from work has also declined, down from 2.1 per 100 FTE workers in 1997 to 0.9 per 100 in 2017, the third year in which the rate has been below 1.0 per 100 workers across the twenty-year study period (Table 17 and Figure 5). While the incidence rate of injuries or illnesses involving days away from work has declined steadily since 1997, the incidence of cases resulting in job transfers or work restrictions only began to fall more recently, around 2004-2005. In 2005, that rate was 1.0 per 100, similar to the prior decade, but has since fallen to 0.7, where it has been since 2011, a decline of roughly one third. Some of the changes in the 1990s, when the inci-dence of reported injuries involving work absence was decreasing while the incidence of transfers/work restrictions was increasing, may reflect a greater focus on employer accommodations that enable injured workers to return to modified work, until they are fully recovered and able to return to their pre-injury jobs. The declining incidence rate of cases with job transfer or restriction in recent years is not necessarily indicative of less focus on employer accommodations, because the overall incidence rate of cases with any days away from work is also declin-ing. In fact, over time, the proportion of cases with job transfers or restrictions is rising as a share of total cases with either days away from work or with a job transfer or restriction. This suggests that workers today are more likely than they were in the past of benefiting from employer accommodations. In 2017, the most common reported nonfatal work-place injuries and illnesses that resulted in days away from work in private industry were: sprains, strains,
Annual work-related fatalities have declined 17 percent over the last
two decades, despite a slight uptick in the years after the recession in response to the
expanding economy.
62 The break in the trend lines in 2002 represents a change in OSHA recordkeeping requirements in that year, indicating that the data
before and after 2002 may not be strictly comparable.
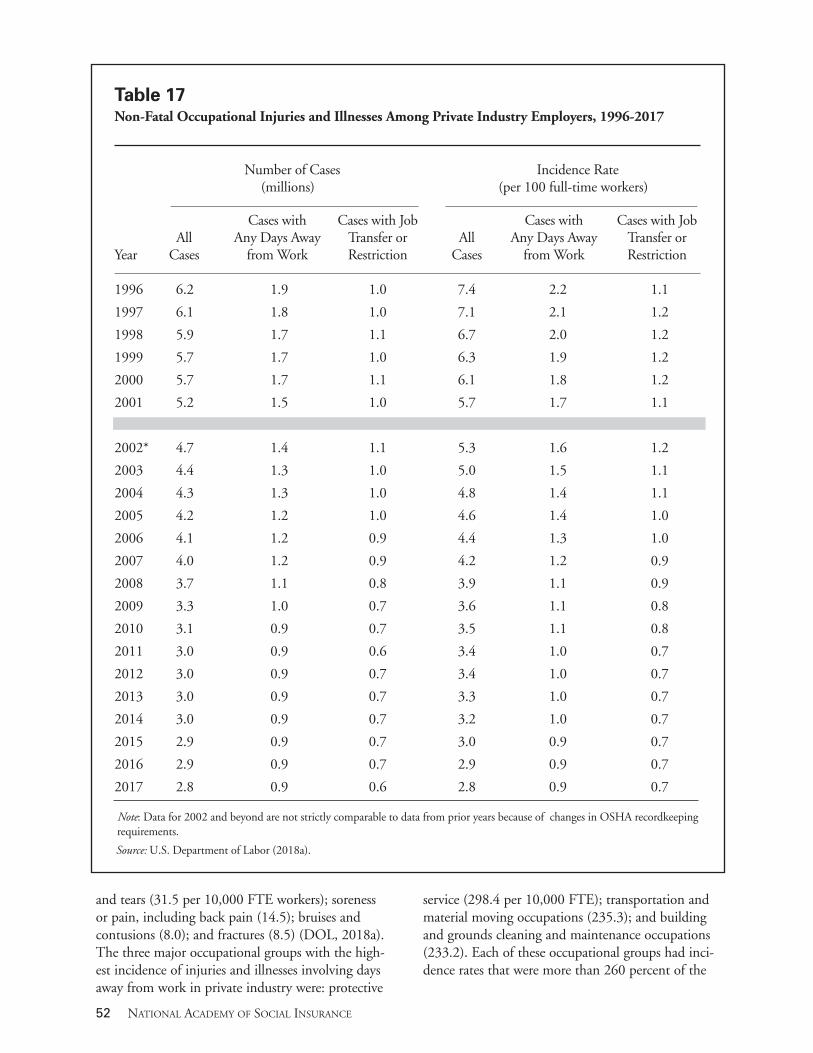
52 NATIONAL ACADEMY OF SOCIAL INSURANCE
and tears (31.5 per 10,000 FTE workers); soreness or pain, including back pain (14.5); bruises and contusions (8.0); and fractures (8.5) (DOL, 2018a). The three major occupational groups with the high-est incidence of injuries and illnesses involving days away from work in private industry were: protective
service (298.4 per 10,000 FTE); transportation and material moving occupations (235.3); and building and grounds cleaning and maintenance occupations (233.2). Each of these occupational groups had inci-dence rates that were more than 260 percent of the
Table 17 Non-Fatal Occupational Injuries and Illnesses Among Private Industry Employers, 1996-2017
Number of Cases Incidence Rate (millions) (per 100 full-time workers)
Cases with Cases with Job Cases with Cases with Job All Any Days Away Transfer or All Any Days Away Transfer or
Year Cases from Work Restriction Cases from Work Restriction
1996 6.2 1.9 1.0 7.4 2.2 1.1
1997 6.1 1.8 1.0 7.1 2.1 1.2
1998 5.9 1.7 1.1 6.7 2.0 1.2
1999 5.7 1.7 1.0 6.3 1.9 1.2
2000 5.7 1.7 1.1 6.1 1.8 1.2
2001 5.2 1.5 1.0 5.7 1.7 1.1
2002* 4.7 1.4 1.1 5.3 1.6 1.2
2003 4.4 1.3 1.0 5.0 1.5 1.1
2004 4.3 1.3 1.0 4.8 1.4 1.1
2005 4.2 1.2 1.0 4.6 1.4 1.0
2006 4.1 1.2 0.9 4.4 1.3 1.0
2007 4.0 1.2 0.9 4.2 1.2 0.9
2008 3.7 1.1 0.8 3.9 1.1 0.9
2009 3.3 1.0 0.7 3.6 1.1 0.8
2010 3.1 0.9 0.7 3.5 1.1 0.8
2011 3.0 0.9 0.6 3.4 1.0 0.7
2012 3.0 0.9 0.7 3.4 1.0 0.7
2013 3.0 0.9 0.7 3.3 1.0 0.7
2014 3.0 0.9 0.7 3.2 1.0 0.7
2015 2.9 0.9 0.7 3.0 0.9 0.7
2016 2.9 0.9 0.7 2.9 0.9 0.7
2017 2.8 0.9 0.6 2.8 0.9 0.7 Note: Data for 2002 and beyond are not strictly comparable to data from prior years because of changes in OSHA recordkeeping requirements.
Source: U.S. Department of Labor (2018a).
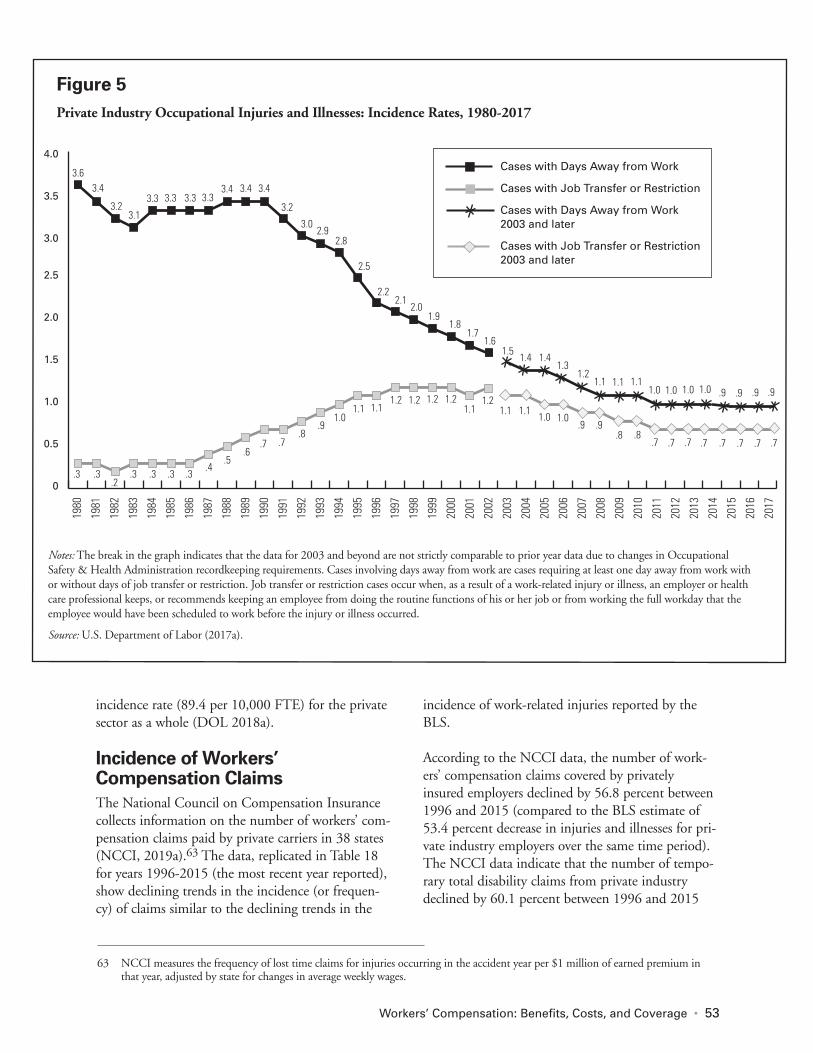
Workers’ Compensation: Benefits, Costs, and Coverage • 53
incidence rate (89.4 per 10,000 FTE) for the private sector as a whole (DOL 2018a). Incidence of Workers’ Compensation Claims
The National Council on Compensation Insurance collects information on the number of workers’ com-pensation claims paid by private carriers in 38 states (NCCI, 2019a).63 The data, replicated in Table 18 for years 1996-2015 (the most recent year reported), show declining trends in the incidence (or frequen-cy) of claims similar to the declining trends in the
incidence of work-related injuries reported by the BLS. According to the NCCI data, the number of work-ers’ compensation claims covered by privately insured employers declined by 56.8 percent between 1996 and 2015 (compared to the BLS estimate of 53.4 percent decrease in injuries and illnesses for pri-vate industry employers over the same time period). The NCCI data indicate that the number of tempo-rary total disability claims from private industry declined by 60.1 percent between 1996 and 2015
Figure 5
Private Industry Occupational Injuries and Illnesses: Incidence Rates, 1980-2017
Notes: The break in the graph indicates that the data for 2003 and beyond are not strictly comparable to prior year data due to changes in Occupational Safety & Health Administration recordkeeping requirements. Cases involving days away from work are cases requiring at least one day away from work with or without days of job transfer or restriction. Job transfer or restriction cases occur when, as a result of a work-related injury or illness, an employer or health care professional keeps, or recommends keeping an employee from doing the routine functions of his or her job or from working the full workday that the employee would have been scheduled to work before the injury or illness occurred.
Source: U.S. Department of Labor (2017a).
Cases with Days Away from Work
Cases with Job Transfer or Restriction
Cases with Days Away from Work 2003 and later
Cases with Job Transfer or Restriction 2003 and later
63 NCCI measures the frequency of lost time claims for injuries occurring in the accident year per $1 million of earned premium in
that year, adjusted by state for changes in average weekly wages.
0
0.5
1.0
1.5
2.0
2.5
3.0
3.5
4.0
1980
1981
1982
1983
1984
1985
1986
1987
1988
1989
1990
1991
1992
1993
1994
1995
1996
1997
1998
1999
2000
2001
2002
2003
2004
2005
2006
2007
2008
2009
2010
2011
2012
2013
2014
2015
2016
2017
3.63.4
3.23.1
3.3 3.3 3.3 3.33.4 3.4 3.4
3.2
3.02.9
2.8
2.5
2.22.1
2.01.9
1.81.7
1.61.5
1.4 1.41.3
1.21.1 1.1 1.1
1.0 1.0 1.0 .9
.8
1.0
.7 .7 .7 .7.8
.9.91.0
1.11.11.11.21.21.21.2
1.11.11.0
.7.8
.9
.7.6
.5.4
.3.2
.3.3.3.3.3
1.0
.7
1.2.9
.7
.9
.7
.9
.7
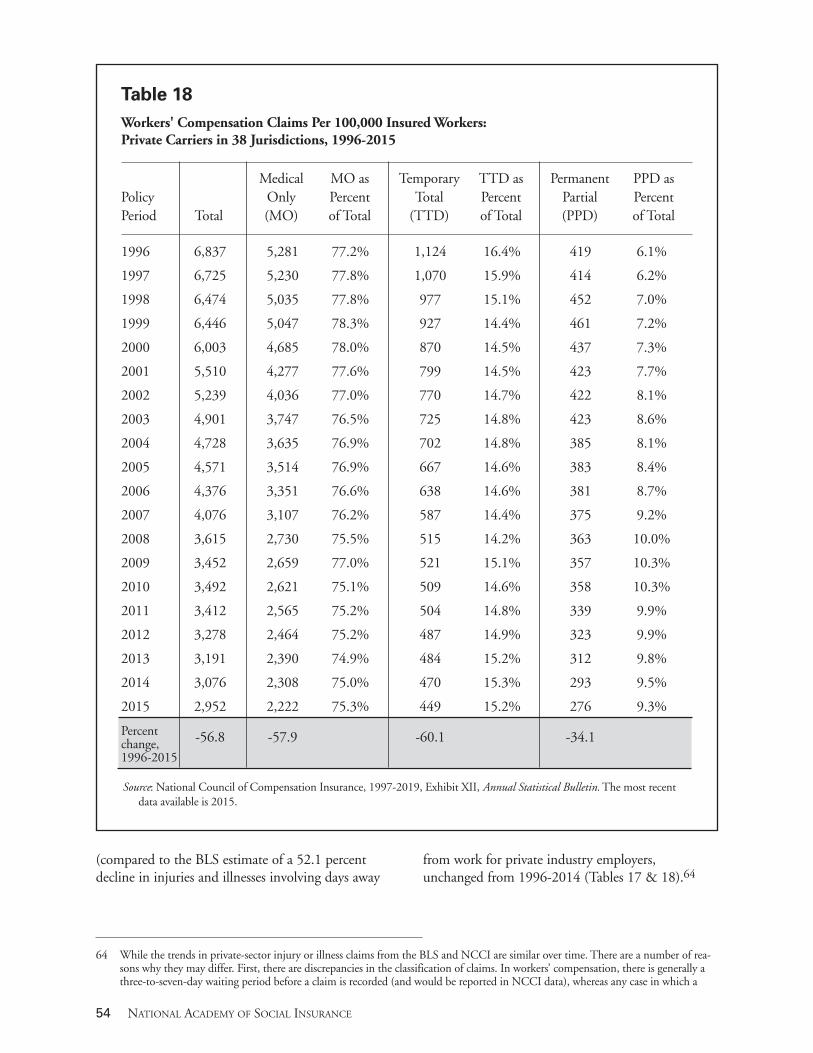
54 NATIONAL ACADEMY OF SOCIAL INSURANCE
(compared to the BLS estimate of a 52.1 percent decline in injuries and illnesses involving days away
from work for private industry employers, unchanged from 1996-2014 (Tables 17 & 18).64
Table 18
Workers' Compensation Claims Per 100,000 Insured Workers: Private Carriers in 38 Jurisdictions, 1996-2015
Medical MO as Temporary TTD as Permanent PPD as Policy Only Percent Total Percent Partial Percent Period Total (MO) of Total (TTD) of Total (PPD) of Total
1996 6,837 5,281 77.2% 1,124 16.4% 419 6.1%
1997 6,725 5,230 77.8% 1,070 15.9% 414 6.2%
1998 6,474 5,035 77.8% 977 15.1% 452 7.0%
1999 6,446 5,047 78.3% 927 14.4% 461 7.2%
2000 6,003 4,685 78.0% 870 14.5% 437 7.3%
2001 5,510 4,277 77.6% 799 14.5% 423 7.7%
2002 5,239 4,036 77.0% 770 14.7% 422 8.1%
2003 4,901 3,747 76.5% 725 14.8% 423 8.6%
2004 4,728 3,635 76.9% 702 14.8% 385 8.1%
2005 4,571 3,514 76.9% 667 14.6% 383 8.4%
2006 4,376 3,351 76.6% 638 14.6% 381 8.7%
2007 4,076 3,107 76.2% 587 14.4% 375 9.2%
2008 3,615 2,730 75.5% 515 14.2% 363 10.0%
2009 3,452 2,659 77.0% 521 15.1% 357 10.3%
2010 3,492 2,621 75.1% 509 14.6% 358 10.3%
2011 3,412 2,565 75.2% 504 14.8% 339 9.9%
2012 3,278 2,464 75.2% 487 14.9% 323 9.9%
2013 3,191 2,390 74.9% 484 15.2% 312 9.8%
2014 3,076 2,308 75.0% 470 15.3% 293 9.5%
2015 2,952 2,222 75.3% 449 15.2% 276 9.3%
Percent -56.8 -57.9 -60.1 -34.1 change, 1996-2015 Source: National Council of Compensation Insurance, 1997-2019, Exhibit XII, Annual Statistical Bulletin. The most recent
data available is 2015.
64 While the trends in private-sector injury or illness claims from the BLS and NCCI are similar over time. There are a number of rea-
sons why they may differ. First, there are discrepancies in the classification of claims. In workers’ compensation, there is generally a three-to-seven-day waiting period before a claim is recorded (and would be reported in NCCI data), whereas any case in which a
Workers’ Compensation: Benefits, Costs, and Coverage • 55
The reader is cautioned that injury rates that have been extrapolated from workers’ compensation claims data may not be wholly accurate because key stakeholders have incentives to under-report or over-report occupational injuries and illnesses.65 There is also evidence that changes in workers’ compensation laws and procedures since 1990 have made it more difficult for workers to file claims, resulting in reduc-tions in reported injury and claim rates (Ruser and Boden 2003, Guo and Burton 2010). There are many reasons to suspect under-reporting on the part of workers, employers, and/or medical providers. Workers may not report injuries for one or more of several reasons: they do not know that the injury is covered by workers’ compensation; they believe that filing for benefits would be too time-consuming, difficult, or stressful; they believe that the injury is something to be expected as part of their job; or they fear employer retaliation (Galizzi et al., 2010; Pransky et al., 1999; Strunin and Boden, 2004). Employers may fail to report injuries because: their recordkeeping is faulty; they want to maintain a superior safety record to protect their experience rate; or they are unaware that an injury is covered by workers’ compensation (Azaroff et al., 2002; Lashuay and Harrison, 2006; and Wuellner and Phipps, 2018). Medical providers may fail to report injuries and illnesses that take time to develop, such as carpal tunnel syndrome, noise-induced hearing loss, and lung diseases like silicosis, because they are unaware of the workplace connection.66 There are also incentives for workers and/or medical providers to over-report injuries or illnesses as work-related. The 100 percent coverage of medical costs under workers’ compensation creates incentives for both groups to identify a work-related cause when the etiology of an injury or illness is uncertain.
Workers have incentives to report an injury as work-related because there are no deductibles or co-payments for health care. They may also receive more generous cash benefits from workers’ compen-sation than from a private disability plan or state unemployment insurance. With respect to providers, there is evidence that soft-tissue conditions are more likely to be classified as work-related in states with higher workers’ compen-sation physician reimbursement rates (Fomenko and Gruber, 2016). The trend towards capitated payment systems in health care also influences medical provider incentives. One study found that an increase in capitation payments under group health plans led to an increase in the number of soft-tissue conditions that were labeled work-related and paid by workers’ compensation (Victor et al., 2015).
Addendum Other Benefits Available to Disabled Workers
The primary purpose of this report is to describe trends in workers’ compensation benefits, costs, and coverage with respect to two key stakeholder groups: the injured workers who receive benefits and the employers who pay for them. Workers’ compensa-tion cash benefits, however, can be supplemented by other sources of income for injured workers, and workers’ compensation medical benefits can also be augmented health care provided by other programs. This addendum describes the major disability sup-port programs that interact with workers’ compensation, namely: temporary sick leave, short- and long-term disability benefits, retirement benefits, Social Security Disability Insurance, and Medicare.
worker misses at least one day away from work is classified as a “days away from work” (DAFW) case by OSHA and reflect as such in BLS published data. Second, the BLS and NCCI cover different jurisdictions – the BLS covers injuries and illnesses across the entire U.S., whereas NCCI only records workers’ compensation claims for private insurers and competitive state funds in 38 jurisdictions. And even in these jurisdictions, NCCI does not record any workers’ compensation claims that occurred at self-insured firms. Third, there is evidence that some employers do not comply with OSH recordkeeping or Survey of Occupational Injuries and Illness re-porting instructions, leading to underreporting of workers’ compensation-eligible claims in BLS data (Rappin et al., 2016).
65 See Azaroff et al. (2002), Spieler and Burton (2012), and OSHA (2015) for reviews of studies on the reporting of work-related injuries and illnesses.
66 Studies have typically shown much less reporting of these types of conditions as work-related as is suggested by their prevalence in medical data (Stanbury et al., 1995; Biddle et al., 1998; Morse et al., 1998; Milton et al., 1998; DOL, 2008). According to a GAO report, some health care providers say that they have been pressured to provide less treatment than they believe is warranted in order to avoid the need to report an injury or illness as work-related (GAO), 2009).

56 NATIONAL ACADEMY OF SOCIAL INSURANCE
Sick Leave. Sick leave is a common form of wage replacement for short-term absences from work due to illnesses or injuries unrelated to work. About 68 percent of all private-sector employees had access to some type of paid sick leave in 2017, provided through their employer or a private short-term dis-ability plan (DOL, 2017c). Sick leave typically pays 100 percent of wages for a number of days depend-ing on the worker’s job tenure and hours worked. Employers or union contracts can provide for con-tinuation of wages during the waiting period (three to seven days) of their workers’ compensation dis-ability claim. Paid sick leave is often utilized to cover work absences associated with minor work-related injuries. Compared to filing a claim for workers’ compensa-tion temporary disability benefits, sick leave is administratively much easier for workers to access and employers to administer. For employers, the workers’ compensation option has reporting require-ments and negative impacts on premium rates that are not part of paid sick leave. For workers, the deci-sion to report and pursue a workers’ compensation claim involves a lower wage replacement rate and a minimum three-day wage penalty (unless they also apply for paid sick leave).67 These factors all provide incentives for employers and injured workers to rely on other programs (such as health insurance and paid sick leave) for compensation. Short-term disability benefits. Five states (California, Hawaii, New Jersey, New York, and Rhode Island) have Temporary Disability Insurance (TDI) programs, also known as State Disability Insurance (SDI) or paid medical leave, that provide short- to medium-term disability insurance for employees. In these five states, TDI is a statutory program that provides partial wage replacement for workers taking time off to recover from a non- work-related injury or illness, or from pregnancy (Glynn et al, 2017). And some private employers offer short-term disability insurance to their workers even in states in which such insurance is not required. About 39 percent of private industry work-ers had access to short-term disability insurance through one of these mechanisms in 2017, and 38 percent were covered (DOL, 2018c). Typically,
workers must have a specified amount of past employment or earnings to qualify for benefits, and benefits replace about half of the worker’s prior earnings. In general, workers receiving workers’ compensation benefits are not eligible to simultane-ously receive these types of short-term disability benefits. There are also short-term disability plans that cover periods of work absence longer than the available paid sick leave, but shorter than required to qualify for long-term disability benefits. In addition, there are state and municipal short-term disability benefit programs for public employees (particularly for police and firefighters) that coordinate with workers’ compensation programs or, in some cases, are an alternative to workers’ compensation. Long-term disability insurance. Long-term disability insurance covered 32 percent of private-sector employees in 2017 (DOL, 2017c). Such coverage is most common among relatively high-paying management, professional, and related occupations. About 54 percent of workers in management and professional-related occupations were covered by long-term disability plans as of 2017, compared to 33 percent of workers in sales and office occupations and 14 percent of workers in service occupations (DOL 2018c). Long-term disability insurance is also sold in individual policies, typically to high-earning professionals. Individual policies are not included in the coverage statistics reported to the DOL. Long-term disability benefits are usually paid after a waiting period of three to six months or after short-term disability benefits end. Long-term disability insurance is generally designed to replace 60 percent of earnings, although replacement rates of 50 or 66 percent are also common. Almost all long-term dis-ability insurance is coordinated with Social Security Disability Insurance (SSDI) and workers’ compensa-tion. That is, private long-term disability benefits are reduced dollar-for-dollar by the amount of Social Security or workers’ compensation benefits received. If Social Security benefits replace 40 percent of a worker’s prior earnings, for example, a long-term disability benefit that replaces 60 percent of earnings
67 Workers’ compensation typically replaces two-thirds of a worker’s pre-injury wages before tax up to a maximum, but these benefits
are not taxed. A useful wage-replacement comparison is workers’ compensation benefits and post-tax wages.
Workers’ Compensation: Benefits, Costs, and Coverage • 57
would pay the balance to achieve a 60 percent wage replacement. Retirement benefits. Retirement benefits may also be available to workers who become disabled because of a work-related injury or illness. Most defined-ben-efit pension plans have some disability provision; benefits may be available at the time of disability or may continue to accrue until retirement age. Defined-contribution pension plans will often make funds in an employee’s account available without penalty if the worker becomes disabled, but these plans do not have the insurance features of defined-benefit pensions or disability insurance. Federal disability programs. Social Security Disability Insurance (SSDI) and Medicare provide cash and medical benefits, respectively, to workers who become disabled and unable to work prior to normal retirement age. SSDI benefits are available to workers with disabilities whether or not the disability results from a work-related injury, but the eligibility rules for SSDI differ from the rules for workers’ compensation. Workers are eligible for workers’ compensation bene-fits from their first day of employment, while eligibility for SSDI requires workers to have a history of contributions to the Social Security system.68 Workers’ compensation cash benefits begin after a few days of work absence, while SSDI benefits begin only after a five-month waiting period. Workers’
compensation provides benefits for both short- and long-term disabilities and for partial as well as total disabilities. SSDI benefits are paid only to workers who have long-term impairments that preclude gain-ful employment that is suitable for the worker by virtue of their training and expertise. Medicare pays health care costs for persons who receive SSDI benefits after an additional 24-month waiting period (or 29 months after the onset of dis-ability). Medicare covers all medical conditions, whether or not the primary disability is work-related. In 2017, workers’ compensation benefits paid (cash benefits plus medical payments) totaled $62.0 bil-lion. SSDI paid $142.7 billion in wage replacement benefits to disabled persons and their dependents, and Medicare paid $99.2 billion for medical care for disabled persons under age 65, for a total of $241.9 billion (SSA, 2018; CMS, 2019). Dual beneficiaries. If a worker becomes eligible for both SSDI and workers’ compensation cash benefits, one or both programs will reduce benefits to ensure that the payments to beneficiaries do not exceed allowable limits based on the worker’s past earn-ings.69 The Social Security Amendments of 1965 require that SSDI benefits be reduced (or “offset”) such that the combined total of workers’ compensa-tion and SSDI benefits does not exceed 80 percent of the worker’s prior earnings.70 The offset provision affects 35 states; 15 states that had established reverse-offset laws prior to the 1965 legislation received exemptions.71 In reverse-offset states,
68 To qualify for SSDI, individuals must meet two different earnings tests: 1) a recent work test, based on age at the time of disability;
and 2) a duration of work test. Generally, workers must have earned at least 20 work credits in the 10 years immediately before be-coming disabled, although younger workers may qualify with fewer credits.
69 The interaction between workers’ compensation and SSDI is complex. Studies have investigated the impact of changes to workers’ compensation programs on SSDI outcomes using aggregate data and found mixed results (e.g. Guo and Burton, 2012; McInerney and Simon, 2012). While the potential impact and magnitude of changes in workers’ compensation on SSDI is unclear, studies using individual-level data have found evidence that work-related injuries are a significant source of disability later in life (e.g., Reville and Schoeni, 2004; O’Leary et al., 2012). Burton and Guo (2016) examine the relationship between SSDI and workers’ compensa-tion programs in detail and provide a number of policy options aimed at improve the interaction between the two.
70 The cap remains at 80 percent of the worker’s average earnings before disability except that, in the relatively few cases when Social Security disability benefits for the worker and dependents exceed 80 percent of prior earnings, the benefits are not reduced below the Social Security amount. This cap also applies to coordination between SSDI and other public disability benefits derived from jobs not covered by Social Security, such as state or local government jobs where the governmental employer has chosen not to cover its employees under Social Security. The portion of workers’ compensation benefits that offset (reduce) SSDI benefits are subject to fed-eral income tax (IRC section 86(d)(3)).
71 States with reverse offset laws for some or all types of workers’ compensation benefits are: Alaska, California, Colorado, Florida, Louisiana, Minnesota, Montana, Nevada, New Jersey, New York, North Dakota, Ohio, Oregon, Washington, and Wisconsin. Cali-fornia’s reverse offset laws apply only to workers’ compensation benefits paid through the Subsequent Injuries Fund and Industrial Disability Leave. In addition, there are reverse offset rules for other types of public disability benefits in Hawaii, Illinois, New Jersey, and New York (SSA Program Operations Manual System, DI 52105.0001). Legislation in 1981 eliminated states’ option to adopt reverse offset laws.
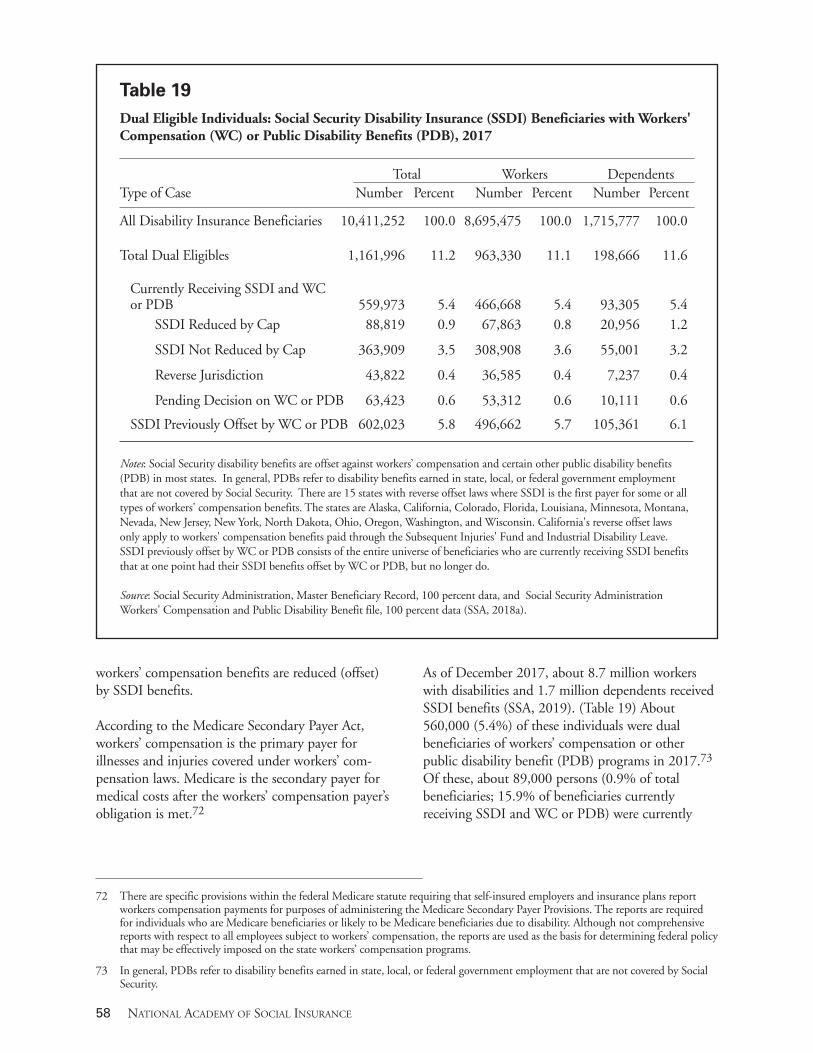
58 NATIONAL ACADEMY OF SOCIAL INSURANCE
workers’ compensation benefits are reduced (offset) by SSDI benefits. According to the Medicare Secondary Payer Act, workers’ compensation is the primary payer for illnesses and injuries covered under workers’ com-pensation laws. Medicare is the secondary payer for medical costs after the workers’ compensation payer’s obligation is met.72
As of December 2017, about 8.7 million workers with disabilities and 1.7 million dependents received SSDI benefits (SSA, 2019). (Table 19) About 560,000 (5.4%) of these individuals were dual beneficiaries of workers’ compensation or other public disability benefit (PDB) programs in 2017.73 Of these, about 89,000 persons (0.9% of total beneficiaries; 15.9% of beneficiaries currently receiving SSDI and WC or PDB) were currently
72 There are specific provisions within the federal Medicare statute requiring that self-insured employers and insurance plans report
workers compensation payments for purposes of administering the Medicare Secondary Payer Provisions. The reports are required for individuals who are Medicare beneficiaries or likely to be Medicare beneficiaries due to disability. Although not comprehensive reports with respect to all employees subject to workers’ compensation, the reports are used as the basis for determining federal policy that may be effectively imposed on the state workers’ compensation programs.
73 In general, PDBs refer to disability benefits earned in state, local, or federal government employment that are not covered by Social Security.
Table 19
Dual Eligible Individuals: Social Security Disability Insurance (SSDI) Beneficiaries with Workers' Compensation (WC) or Public Disability Benefits (PDB), 2017
Total Workers Dependents Type of Case Number Percent Number Percent Number Percent
All Disability Insurance Beneficiaries 10,411,252 100.0 8,695,475 100.0 1,715,777 100.0
Total Dual Eligibles 1,161,996 11.2 963,330 11.1 198,666 11.6
Currently Receiving SSDI and WC or PDB 559,973 5.4 466,668 5.4 93,305 5.4 SSDI Reduced by Cap 88,819 0.9 67,863 0.8 20,956 1.2
SSDI Not Reduced by Cap 363,909 3.5 308,908 3.6 55,001 3.2
Reverse Jurisdiction 43,822 0.4 36,585 0.4 7,237 0.4
Pending Decision on WC or PDB 63,423 0.6 53,312 0.6 10,111 0.6
SSDI Previously Offset by WC or PDB 602,023 5.8 496,662 5.7 105,361 6.1
Notes: Social Security disability benefits are offset against workers’ compensation and certain other public disability benefits (PDB) in most states. In general, PDBs refer to disability benefits earned in state, local, or federal government employment that are not covered by Social Security. There are 15 states with reverse offset laws where SSDI is the first payer for some or all types of workers' compensation benefits. The states are Alaska, California, Colorado, Florida, Louisiana, Minnesota, Montana, Nevada, New Jersey, New York, North Dakota, Ohio, Oregon, Washington, and Wisconsin. California's reverse offset laws only apply to workers' compensation benefits paid through the Subsequent Injuries' Fund and Industrial Disability Leave. SSDI previously offset by WC or PDB consists of the entire universe of beneficiaries who are currently receiving SSDI benefits that at one point had their SSDI benefits offset by WC or PDB, but no longer do. Source: Social Security Administration, Master Beneficiary Record, 100 percent data, and Social Security Administration Workers' Compensation and Public Disability Benefit file, 100 percent data (SSA, 2018a).
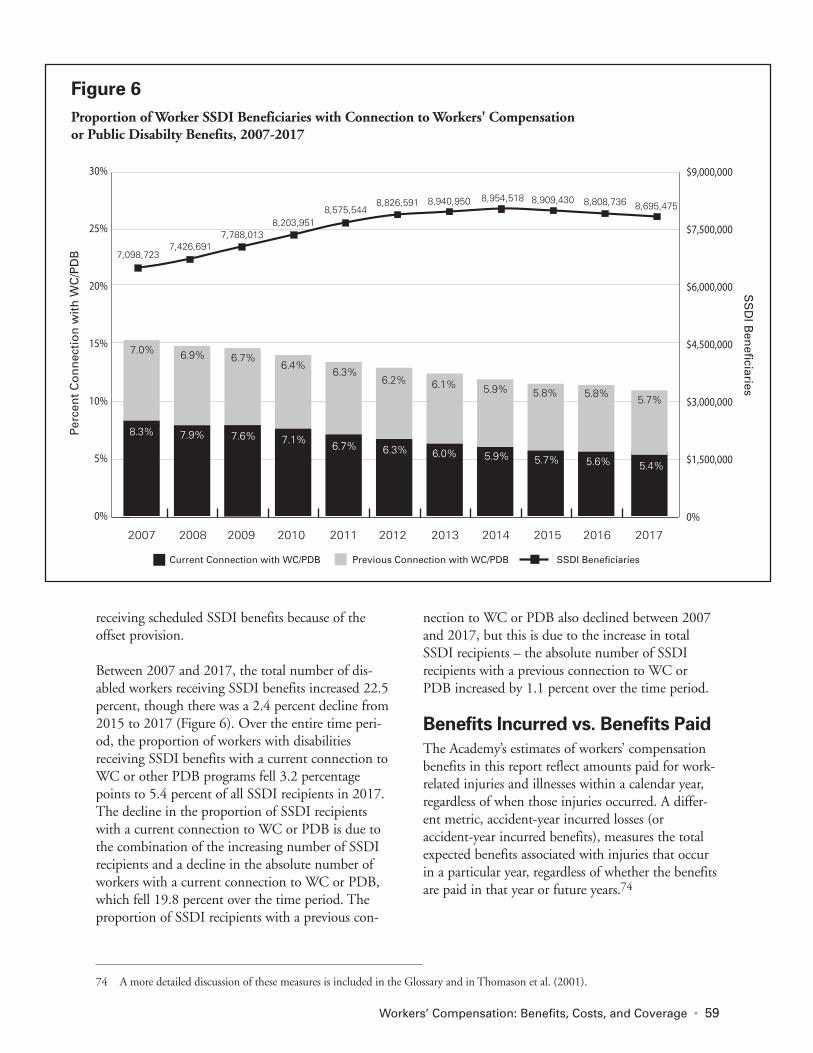
receiving scheduled SSDI benefits because of the offset provision. Between 2007 and 2017, the total number of dis-abled workers receiving SSDI benefits increased 22.5 percent, though there was a 2.4 percent decline from 2015 to 2017 (Figure 6). Over the entire time peri-od, the proportion of workers with disabilities receiving SSDI benefits with a current connection to WC or other PDB programs fell 3.2 percentage points to 5.4 percent of all SSDI recipients in 2017. The decline in the proportion of SSDI recipients with a current connection to WC or PDB is due to the combination of the increasing number of SSDI recipients and a decline in the absolute number of workers with a current connection to WC or PDB, which fell 19.8 percent over the time period. The proportion of SSDI recipients with a previous con-
nection to WC or PDB also declined between 2007 and 2017, but this is due to the increase in total SSDI recipients – the absolute number of SSDI recipients with a previous connection to WC or PDB increased by 1.1 percent over the time period. Benefits Incurred vs. Benefits Paid
The Academy’s estimates of workers’ compensation benefits in this report reflect amounts paid for work-related injuries and illnesses within a calendar year, regardless of when those injuries occurred. A differ-ent metric, accident-year incurred losses (or accident-year incurred benefits), measures the total expected benefits associated with injuries that occur in a particular year, regardless of whether the benefits are paid in that year or future years.74
Workers’ Compensation: Benefits, Costs, and Coverage • 59
Figure 6
Proportion of Worker SSDI Beneficiaries with Connection to Workers' Compensation or Public Disabilty Benefits, 2007-2017
0%
5%
10%
15%
20%
25%
30%
2007 2008 2009 2010 2011 2012 2013 2014 2015 2016 2017
7,098,7237,426,691
7,788,0138,203,951
8,575,5448,826,591 8,940,950 8,954,518 8,909,430 8,808,736
Per
cen
t C
on
nec
tio
n w
ith
WC
/PD
BS
SD
I Ben
eficiaries
Current Connection with WC/PDB Previous Connection with WC/PDB SSDI Beneficiaries
0%
$1,500,000
$3,000,000
$4,500,000
$6,000,000
$7,500,000
$9,000,000
8,695,475
7.0% 6.9% 6.7%6.4%
6.3%6.2% 6.1% 5.9% 5.8% 5.8%
8.3% 7.9% 7.6% 7.1% 6.7% 6.3% 6.0% 5.9% 5.7% 5.6% 5.4%
5.7%
74 A more detailed discussion of these measures is included in the Glossary and in Thomason et al. (2001).
For the purpose of setting insurance premiums, it is vital to estimate the incurred benefits the premiums are required to cover. When an employer purchases workers’ compensation insurance for a particular period, the premiums are designed to cover current and future liabilities for all injuries that occur during the period covered by the policy. NCCI and state rating bureaus use trends in accident-year (or policy-year) incurred benefits to help determine their rates. Benefits incurred are also more appropriate for poli-cy purposes than benefits paid. For example, if a state lowers benefits or tightens compensability rules for new injuries as of a given date, benefits would be expected to decline in the future. The policy change will show up immediately in estimates of incurred benefits but will be observed more slowly in mea-sures of paid benefits, because paid benefits also include benefits for injuries occurring in years prior to (and unaffected by) the policy change. Notwithstanding the advantages of tracking benefits incurred, there are also a number of disadvantages. It
takes many years before the estimated losses associated with injuries occurring in a given year are reliable and stable, whereas benefits paid are known and fixed for any given reporting period. Further, using incurred-loss data instead of paid losses may have some advantages for setting actuarial reserves and rate making, but it has the disadvantage of not being readily available from state agencies, self-insured employers, many state funds, or from federal workers’ compensation programs. Nor are incurred losses from different sources useful to aggregate with-out an understanding of how the incurred losses were estimated by each source. Finally, data on incurred benefits do not include benefits paid by employers under large-deductible policies, benefits paid by employers insured under monopolistic state funds, or benefits paid in states with a rating bureau. For these reasons, the Academy relies on calendar-year benefits paid to provide the most accurate and consistent estimates of state-by-state and national workers’ compensation payments.
60 NATIONAL ACADEMY OF SOCIAL INSURANCE
Workers’ Compensation: Benefits, Costs, and Coverage • 61
Accident Year: The year in which an injury occurred, or the year of onset or manifestation of an illness. Accident Year Incurred Benefits: Benefits associated with all injuries and illnesses occurring in the accident year, regardless of the years in which the benefits are paid. (Also known as calendar accident year incurred benefits.) Black Lung Benefits: See: Coal Mine Health and Safety Act. BLS: The Bureau of Labor Statistics (BLS) in the U.S. Department of Labor is a statistical agency that collects, processes, analyzes, and disseminates statistical data about the labor market. For more information, visit www.bls.gov. Calendar Year Paid Benefits: Benefits paid during a calendar year regardless of when the injury or illness occurred. Coal Mine Health and Safety Act: The Coal Mine Health and Safety Act (Public Law 91-173) was enacted in 1969 and provides black lung benefits to coal miners disabled as a result of exposure to coal dust and to their survivors. Combined Ratio After Dividends. The combined ratio after policy holder dividends is a measure of the profitability of an insurer. The ratio equals the sum of losses, loss adjustment expenses, underwriting expenses, and dividends to policyholders, divided by net premiums. The ratio is expressed as a percent. (See: Overall Operating Ratio.) Compromise and Release (C&R) Agreement: An agreement to settle a workers’ compensation case. State laws vary as to the nature of these releases, but there are typically three elements to a C&R agree-ment: a compromise between the worker’s claim and the employer’s offer concerning the amount of cash and/or medical benefits to be paid; the payment of the compromised amount in a fixed amount (com-monly called a “lump sum” but which may or may not be paid to the claimant at once); and the release of the employer from further liability. Unless it was “full and final”, the release may allow for reopening medical or indemnity payments under specific conditions.
Covered Employment: The Academy’s coverage data include jobs in firms that are required to be covered by workers’ compensation programs. A more inclusive measure of covered employment would also include jobs in firms that voluntarily elect coverage. A less inclusive measure of covered employment would exclude workers who are legally required to be covered by workers’ compensation programs who actually are not covered. Deductibles: Under deductible policies written by private carriers or state funds, the insurer is responsible for paying all the workers’ compensation benefits, but employers are responsible for reimburs-ing the insurer for those benefits up to a specified deductible amount. Deductibles may be written into an insurance policy on a per injury basis, or an aggregate basis, or a combination of a per injury basis with an aggregate cap. Defense Base Act: The Defense Base Act (DBA-42 U.S.C. §§ 1651-54) is a federal law extending the Longshore and Harbor Workers’ Compensation Act (33 U.S.C. §§ 901-50), passed in 1941 and amended later, to persons: (1) employed by private employers at U.S. defense bases overseas; (2) employed under a public work contract with the United States performed outside the U.S.; (3) employed under a contract with the United States, for work performed outside the U.S. under the Foreign Assistance Act; or (4) employed by an American contractor providing welfare or similar services outside the United States for the benefit of the Armed Services. DI: Disability insurance from the Social Security program. See: SSDI. Disability: A loss of functional capacity associated with a health condition. Experience Rating: An insurance policy is experi-ence rated if insurance premiums reflect the relative risk of loss of the insured. There are two levels of experience rating in workers’ compensation. Manual rates (or pure premiums) are developed for each insurance classification (category of work) in a state based on previous benefit payments by all firms operating in that classification. Firm-level experience rating compares an employer’s loss experience to the
Glossary
62 NATIONAL ACADEMY OF SOCIAL INSURANCE
average losses of other firms in the same insurance classification. An experience modification is devel-oped and applied to the premium of firms which are large enough for the insured’s experience to be a reli-able indicator of benefit costs in the future. FECA: The Federal Employees’ Compensation Act (FECA) Public Law (103-3 or 5 U.S.C. §§ 8101-52), enacted in 1916, provides workers’ compensation coverage to U.S. federal civilian and postal workers around the world for work-related injuries and occupational diseases. FELA: The Federal Employers’ Liability Act (FELA 45 U.S.C. § 51 et seq.), enacted in 1908, gives railroad workers engaged in interstate commerce an action in negligence against their employer in the event of work-related injuries or occupational diseases. Guaranty Fund: A guaranty fund is a special state-based fund that assumes all or part of the liability for workers’ compensation benefits provided to a worker when the employer or insurance carrier legally responsible for those benefits is unable to make pay-ments. Guaranty funds for private insurance carriers (all states with private carriers have these) and for self-insuring employers (less than half the states have these) are always separate funds. Both types are financed by assessments on insurers or self-insured employers, respectively. Group Self-Insurance: A special form of self- insurance that is available to groups of employers, which is only available in a little over half of the states. This is similar to a mutual insurance company and, as such, is closely regulated. IAIABC: The International Association of Industrial Accident Boards and Commissions (IAIABC) is the organization representing workers’ compensation agencies in the United States, Canada, and other nations and territories. For more information, visit www.iaiabc.org. Impairment: An impairment is an anatomical or functional abnormality or loss resulting from an injury or disease. The impairment can be physical or mental. Incurred Losses (or Incurred Benefits): Benefits paid to the valuation date plus liabilities for future
benefits for injuries that occurred in a specified period, such as an accident year. Jones Act: The Jones Act is Section 27 of the Merchant Marine Act (P.L. 66-261), passed in 1920, which extends the provision of the Federal Employers’ Liability Act to qualifying sailors (individuals assigned to a vessel or fleet that operates in navigable waters, meaning waterways capable of being used for interstate or foreign commerce). LHWCA: The Longshore and Harbor Workers’ Compensation Act (LHWCA 33 U.S.C. §§ 901-50), enacted in 1927, requires employers to provide workers’ compensation protection for longshore, harbor, and other maritime workers. See: Defense Base Act (DBA). Loss Adjustment Expenses: Salaries and fees paid to insurance adjusters, as well as other expenses incurred from adjusting claims. Losses: A flexible term that can be applied in several ways: Paid benefits, incurred benefits, fully devel-oped benefits, and possibly including incurred but not reported benefits. Manual Equivalent Premium (MEP): A firm’s pay-roll multiplied by the approved rate for the firm’s insurance classification code. The manual equivalent premium represents an employer’s costs for workers’ compensation without adjustment for schedule rating, deductible credits, or experience rating. NAIC: The National Association of Insurance Commissioners (NAIC) is the national organization of chief insurance regulators in each state, the District of Columbia, and five U.S. territories. It assists state insurance regulators, individually and collectively, to achieve insurance regulatory goals. For more information, visit www.naic.org. NCCI: The National Council on Compensation Insurance, Inc. (NCCI) is a national organization that assists private carriers and insurance commis-sioners in collecting statistical information for pricing workers’ compensation coverage in 38 states. For more information, visit www.ncci.com. No-fault: A liability rule that, in workers’ compensa-tion, holds the employer fully liable for medical costs
Workers’ Compensation: Benefits, Costs, and Coverage • 63
and compensation for injury-related work absences, without proof of negligence or culpability. Overall Operating Ratio: The combined ratio after dividends minus net investment gain/loss and other income, as a percent of net premium. OSHA: The OSH Act created the Occupational Safety and Health Administration (OSHA) within the U.S. Department of Labor. OSHA is responsible for promulgating standards, inspecting workplaces for compliance, and prosecuting violations. OSH Act: The Occupational Safety and Health Act (OSH Act Public Law 91-596) is a federal law enact-ed in 1970 that establishes and enforces workplace safety and health rules for nearly all private-sector employers. Paid Losses (or Paid Benefits): Benefits paid during a specified period, such as a calendar year, regardless of when the injury or disease occurred. Permanent Partial Disability (PPD): A disability that, although permanent, does not completely limit a person’s ability to work. A statutory benefit award is paid for qualifying injuries. Permanent Total Disability (PTD): A permanent disability that is deemed by law to preclude material levels of employment. Residual Market: The mechanism used to provide insurance for employers who are unable to purchase insurance in the voluntary private market. In some jurisdictions, the state fund is the “insurer of last resort” and serves the function of the residual mar-ket. In others, there is a separate pool financed by assessments of private insurers, which is also known as an assigned risk pool. Schedule Rating: A debit and credit plan that recog-nizes variations in the hazard-causing features of an individual risk. Second Injury Fund: A second injury fund is a spe-cial fund that assumes all or part of the liability for workers’ compensation benefits provided to a worker because of the combined effects of a work-related injury or disease with a preexisting medical condi-tion. The second injury fund pays costs associated
with the prior condition to encourage employers to hire injured workers who want to return to work. Self-insurance: Self-insurance is a state-regulated arrangement in which the employer assumes respon-sibility for the payment of workers’ compensation benefits to the firm’s employees with workplace injuries or diseases. Most employers do not self-insure but instead purchase workers’ compensation insurance from a private carrier or state fund. SSA: The U.S. Social Security Administration (SSA) administers the Social Security program, which pays retirement, disability, and survivors’ benefits to work-ers and their families, and the federal Supplemental Security Income program, which provides income support benefits to low-income, aged, and disabled individuals. For more information, visit www.ssa.gov. SSDI: Social Security Disability Insurance (SSDI) pays benefits to insured workers who sustain severe, long-term work disabilities due to any cause. See: DI. Temporary Partial Disability (TPD): A temporary disability that does not completely limit a person’s ability to work. Temporary Total Disability (TTD): A disability that temporarily precludes a person from performing the pre-injury job or another job at the employer that the worker could have performed prior to the injury. Unemployment Insurance (UI): Federal/state pro-gram that provides cash benefits to workers who become unemployed through no fault of their own and who meet certain eligibility criteria set by the states. U.S. Census County Business Patterns (CBP): County Business Patterns is an annual series that provides subnational economic data by industry. CBP basic data items are extracted from the Business Register (BR), a database of all known single and multi-establishment employer companies maintained and updated by the U.S. Census Bureau. U.S. DOL: The U.S. Department of Labor adminis-ters a variety of federal labor laws including those that guarantee workers’ rights to safe and healthy working conditions, a minimum hourly wage and
64 NATIONAL ACADEMY OF SOCIAL INSURANCE
overtime pay, freedom from employment discrimina-tion, unemployment insurance, and other income support. For more information, visit www.dol.gov. WC: Workers’ compensation. A social insurance program established by statute that is mandatory for most employers, and that provides cash and medical benefits for covered work-related injuries and illnesses. WCRI: The Workers’ Compensation Research Institute (WCRI) is a research organization provid-ing information about public policy issues involving
workers’ compensation systems. For more informa-tion, visit www.wcrinet.org Work-Related Injury/Illness: An injury or illness caused by activities related to the workplace. The usual legal test for “work-related” is “arising out of and in the course of employment.” However, the definition of a work-related injury or disease that is compensable under a state’s workers’ compensation program can be quite complex and varies across states.
Workers’ Compensation: Benefits, Costs, and Coverage • 65
The basis for the NASI estimates of workers’ com-pensation coverage is the number of jobs in each state which are covered by unemployment insurance (UI) (DOL, 2018b). Jobs which are not required to be covered by UI include: some farm and domestic jobs which pay less than a threshold amount; some state and local jobs (such as elected positions); jobs in some nonprofit organizations (such as religious organizations, for whom coverage is optional in some states); jobs held by self-employed persons or unpaid family workers; and railroad jobs (which are covered under a separate unemployment insurance program.) Railroad jobs are also covered under a separate workers’ compensation program (see Appendix B). All U.S. employers who are required to pay unem-ployment taxes must report quarterly data to their state employment security agencies regarding their jobs and wages covered by unemployment insurance. These employer reports are the basis for statistical reports prepared by the U.S. Bureau of Labor Statistics, known as the ES-202 data. These data are a census of the universe of U.S. jobs which are covered by unemployment insurance (DOL, 2017). Key assumptions underlying the Academy’s estimates of workers’ compensation coverage, shown in Table A, are: (1) Jobs which are not reported as covered by UI
are assumed not to be covered by workers’ com-pensation.
(2) Jobs which are reported to be covered by UI are assumed to be covered by workers’ compensa-tion as well, except in the following cases:
(a) Jobs in small firms (which are required to be covered by unemployment insurance in every state) are assumed to be not covered by workers’ compensation if the state law
exempts small firms from mandatory work-ers’ compensation coverage.
(b) Jobs in agricultural industries (which may or may not be covered by UI) are assumed to be not covered by workers’ compensation if the state law exempts agricultural employers from mandatory workers’ compensation coverage.
(c) Jobs in Texas, where workers’ compensation coverage is elective for almost all employers, require a different calculation. For Texas, we base our coverage estimates on periodic sur-veys conducted by the Texas Department of Insurance Workers’ Compensation Research and Evaluation Group (TDI, 2017).
(3) All federal jobs are covered by workers’ com-pensation, regardless of the state in which they are located.
Small Firm Exemptions. Private firms with fewer than three employees are exempt from mandatory workers’ compensation coverage in five states: Arkansas, Georgia, New Mexico, North Carolina, and Virginia. Firms with fewer than four employees are exempt in two states: Florida and South Carolina. Firms with fewer than five employees are exempt from mandatory coverage in four states: Alabama, Mississippi, Missouri, and Tennessee75. The Academy assumes that jobs are not covered by work-ers’ compensation if they are in a small firm that meets the specific exemption requirements in one of these states. To estimate the number of jobs affected by the small firm exemptions, we use data from the U.S. Census Statistics of Small Businesses (SUSB). The SUSB is
Appendix A: Coverage Estimates
75 In previous reports we have reported Michigan, Oklahoma, West Virginia, and Wisconsin as having small business exemptions of 3, 5, 3, and 3 respectively. Further research has revealed that: in Michigan, “all private employers regularly employing 1 or more em-ployees 35 hours or more per week for 13 weeks or longer during the preceding 52 weeks” must carry workers’ compensation (per Michigan.gov); in Oklahoma, the exemption applies only to employers who employ five or fewer of their relatives by blood or mar-riage (we assume this number to be negligible) (85A Okl. St. § 2(18)(b)(5); in West Virginia, employers with fewer than 3 “intermit-tent” employees who work fewer than 11 days in a quarter are exempt (we assume this number to be negligible) (W. Va. Code § 23-2-1); and in Wisconsin, employers with less than 3 employees who are “paid wages of $500 or more in any calendar quarter” must have coverage (we assume the number of employers with 1 or 2 employees being paid less than $500 in any quarter to be negli-gible) (Wis. Stat. § 102.04.1(b)2).
66 NATIONAL ACADEMY OF SOCIAL INSURANCE
an annual data series that reports national and state-level employment by enterprise size and industry.76 These data identify the number of jobs in firms with fewer than five employees. For the five states with workers’ compensation exemptions for firms with fewer than five employees, we directly apply the fraction of jobs in these small firms as reported by the SUSB to the number of UI-covered jobs to calculate the number of jobs affected by the exemption. In 2016 (the most recent year the data are available), these proportions were: Alabama, 4.3 percent; Mississippi, 4.6 percent; Missouri, 4.9 percent; and Tennessee, 3.6 percent (Census SUSB, 2017). For the states that exempt firms with fewer than three or four workers, the SUSB proportions of jobs in small firms (fewer than five employees) must be adjusted downward to correspond to the workers’ compensation cutoff in each state. We use national data on small firms from the U.S. Census Bureau (2005) to make the adjustments. The data indicate that, among those jobs reported to be in small firms by the SUSB (2017), 71.8 percent are in firms with fewer than four employees and 43.9 percent are in firms with fewer than three employees. For the five states that exempt firms with fewer than three workers, the proportions of jobs in small firms were reported to be: Arkansas, 4.7 percent; Georgia, 4.5 percent; New Mexico, 5.1 percent; North Carolina, 4.4 percent; and Virginia, 4.4 percent (Census SUSB, 2017). These proportions are adjust-ed by a factor of 43.9 percent to estimate the proportion of jobs in exempt firms. For example, the proportion of Arkansas jobs in firms with fewer than three employees was estimated to be 2.0 percent (4.66% x 43.9%). For the two states that exempt firms with fewer than four workers, the proportions of jobs in small firms were: Florida, 5.6 percent, and South Carolina, 4.5
percent. These proportions were adjusted by a factor of 71.8 percent to estimate the proportion of jobs in exempt firms. For South Carolina, the proportion of jobs in firms with fewer than four employees was estimated to be 3.3 percent (4.53% x 71.8%). The adjusted ratios were applied to the total number of UI-covered jobs in each state to calculate the number of exempt jobs. In total, we estimated that 902,000 jobs were excluded from workers’ compen-sation coverage in 2017 because of small-firm exemptions from mandatory coverage. Agricultural Exemptions. We assume that agricul-tural jobs are excluded from workers’ compensation coverage if they are in a state where agricultural jobs are exempt from mandatory coverage. Only 14 juris-dictions have no exemption for agricultural jobs: Alaska, Arizona, California, Connecticut, District of Columbia, Hawaii, Idaho, Massachusetts, New Hampshire, New Jersey, Ohio, Oregon, Washington and Wyoming.77 In states with agricultural exemp-tions, we identify the number of agricultural jobs using the Quarterly Census of Employment and Wages (DOL, 2017a). The Quarterly Census pro-vides estimates of total employment by state and industry using North American Industry Classification System (NAICS) codes. We estimated that 437,952 jobs were excluded from workers’ com-pensation in 2017 because of state agricultural exemptions. Texas. In Texas, where workers’ compensation cover-age is elective for almost all employers, the Academy’s estimate of coverage is based on periodic surveys conducted by the Texas Department of Insurance Workers’ Compensation Research and Evaluation Group (TDI, 2017). Their most recent survey estimated that 82 percent of private-sector jobs were covered by workers’ compensation in 2017. We applied this ratio to all UI-covered jobs in Texas (other than federal government jobs, which were not included in the Texas surveys) to determine the total number of jobs covered by workers’ com-
76 Through 2017, the Academy’s report relied on the Census County Business Patterns (CBP) to estimate small firm employment.
However, the CBP only measures employment at establishments, which refers to a single physical location where business is con-ducted. The SUSB publishes data on the number of establishments and the number of firms, which is a more appropriate measure for our purposes because workers’ compensation coverage exemptions are based on the size of the firm, not the size of a particular es-tablishment. The differences in employment between the SUSB and the CBP are small. Previous estimates were updated in 2018 using the SUSB for consistency.
77 Washington also has an exemption for agricultural workers, but it is limited to some family members of family-owned operations. RCW 51.12.020 – employments excluded include “…Any child under eighteen years of age employed by his or her parents in agri-cultural activities on the family farm…”
Workers’ Compensation: Benefits, Costs, and Coverage • 67
78 We start by subtracting the number of multiple jobholders from total employment as reported by the CPS to get the number of
workers with only one job (DOL, 2018e). Next, we use data from the Integrated Public Use Microdata Series of the CPS (IPUMS-CPS, 2018) to identify the distribution of multiple jobholders based on whether they have two, three, or four or more jobs. Using this distribution, we expand the number of multiple jobholders to get the total number of jobs held by multiple jobholders. Using this approach, we calculate total jobs as: Total Jobs = (Total Employment – Multiple Jobholders) + Multiple Jobholders*[(2*% Two Jobs) + (3*% Three Jobs) + (4*% Four or More Jobs)].
This approach differs slightly from what was used in the 2015 data. Last year’s measure was calculated using total employment from the CPS, expanded by the distribution of multiple jobholders as: Total Jobs = Total Employment*[(% One Job) + (2*% Two Jobs) + (3*% Three Jobs) + (4*% Four or More Jobs)]. The key difference in our updated approach is that we use the total number of multi-ple jobholders as reported by the CPS, instead of only relying on the distribution of jobholders as reported in the IPUMS to estimate the number of multiple jobholders. The differences between the two approaches are small. The approach we used this year minimizes the impact of weighting estimates to achieve population level totals. All of the estimates in Table A.2 have been updated to reflect the update.
79 The BLS reports that 4.9 percent of the U.S. employed workforce held more than one job in 2017.
pensation. In 2017, we estimated that 2.1 million jobs in Texas were not covered by workers’ compensation. Employed Workforce Coverage Estimates. The workers’ compensation coverage estimates described above are an estimate of the proportion of UI- covered jobs that are also covered by workers’ com-pensation. However, there are a number of jobs that are not covered by either UI or workers’ compensa-tion. To develop an estimate of the proportion of all jobs in the economy that are covered by workers’ compensation, not just UI-covered jobs, we rely on data from the Current Population Survey (CPS). The CPS reports total employment in the country – which was 153.3 million in 2017 (DOL, 2018d). However, the CPS is a household survey that questions individuals about their employment, and provides an estimate of the total number of employed workers. The Quarterly Census of Employment and Wages (QCEW), on the other hand, is an employer-based survey that tracks jobs. Some individuals have multiple jobs, so comparing the number of workers’ compensation covered jobs to the total number of employed workers in the pop-ulation may overestimate the overall workers’ compensation coverage rate. To improve this esti-mate, we used the Integrated Public Use Microdata
Series of the CPS (IPUMS-CPS, 2018) to identify the distribution of employed individuals with one, two, three, four or more jobs. Using that distribu-tion of multiple jobholders, combined with the number of employed workers and multiple jobhold-ers, we expanded total employment to develop an estimate of the total number of jobs in the econo-my.78, 79 This measure allowed us to calculate the percentage of total jobs among the employed work-force that are covered by workers’ compensation using a consistent unit of measure in the numerator and denominator: jobs. As Table A.2 shows, workers’ compensation covered 86.8 percent of the total jobs in the economy in 2017. Since 2013, the proportion of total jobs cov-ered by workers’ compensation remained relatively stable, with a slight increase of 0.7 percentage points. This slight increase occurred because growth in the number of workers’ compensation covered jobs has outpaced growth in total employment and total jobs in the economy. Between 2013 and 2017, total employment and total jobs increased 6.5 and 6.6 percent respectively, while workers’ compensation covered jobs increased 7.5 percent. The number of multiple-job holders as reported by the CPS increased to 7.6 million in 2017, up 7.8 percent since 2013 and almost reaching a pre-recession high of 7.7 million in 2007 (DOL, 2018d).
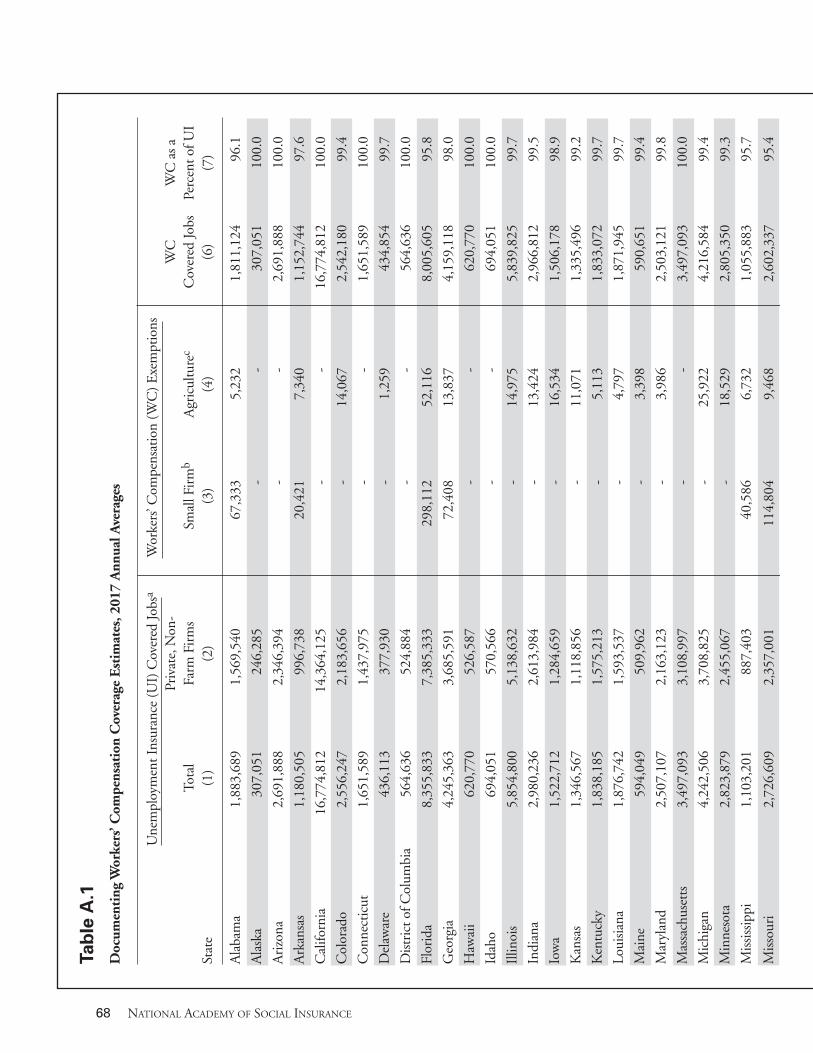
68 NATIONAL ACADEMY OF SOCIAL INSURANCE
Tab
le A
.1
Doc
umen
ting
Wor
kers
’ Com
pens
atio
n C
over
age
Est
imat
es, 2
017
Ann
ual A
vera
ges
U
nem
ploy
men
t Ins
uran
ce (U
I) C
over
ed Jo
bsa
W
orke
rs’ C
ompe
nsat
ion
(WC
) Exe
mpt
ions
Pr
ivat
e, N
on-
WC
W
C a
s a
Tota
lFa
rm F
irm
sSm
all F
irm
bA
gric
ultu
rec
Cov
ered
Jobs
Perc
ent o
f UI
Stat
e(1
)(2
)(3
)(4
)(6
)(7
)
Ala
bam
a
1
,883
,689
1
,569
,540
6
7,33
3
5,23
2
1
,811
,124
96.1
Ala
ska
3
07,0
51
2
46,2
85
-
-
3
07,0
51
100
.0
Ari
zona
2,6
91,8
88
2,3
46,3
94
-
-
2,6
91,8
88
100
.0
Ark
ansa
s
1
,180
,505
996
,738
2
0,42
1
7,34
0
1
,152
,744
97.6
Cal
iforn
ia
16
,774
,812
14
,364
,125
-
-
16
,774
,812
1
00.0
Col
orad
o
2
,556
,247
2
,183
,656
-
14,
067
2,5
42,1
80
99
.4
Con
nect
icut
1,6
51,5
89
1,4
37,9
75
-
-
1,6
51,5
89
100
.0
Del
awar
e
436
,113
377
,930
-
1,
259
4
34,8
54
99
.7
Dis
tric
t of C
olum
bia
5
64,6
36
5
24,8
84
-
-
5
64,6
36
100
.0
Flor
ida
8,3
55,8
33
7,3
85,3
33
2
98,1
12
52,
116
8,0
05,6
05
95
.8
Geo
rgia
4,2
45,3
63
3,6
85,5
91
72,
408
13,
837
4,1
59,1
18
98
.0
Haw
aii
6
20,7
70
5
26,5
87
-
-
6
20,7
70
100
.0
Idah
o
694
,051
570
,566
-
-
694
,051
1
00.0
Illin
ois
5,8
54,8
00
5,1
38,6
32
-
1
4,97
5
5
,839
,825
99.7
Indi
ana
2,9
80,2
36
2,6
13,9
84
-
1
3,42
4
2
,966
,812
99.5
Iow
a
1
,522
,712
1
,284
,659
-
16,
534
1,5
06,1
78
98
.9
Kan
sas
1,3
46,5
67
1,1
18,8
56
-
1
1,07
1
1
,335
,496
99.2
Ken
tuck
y
1
,838
,185
1
,575
,213
-
5,
113
1,8
33,0
72
99
.7
Loui
sian
a
1
,876
,742
1
,593
,537
-
4,
797
1,8
71,9
45
99
.7
Mai
ne
594
,049
509
,962
-
3,
398
5
90,6
51
99
.4
Mar
ylan
d
2
,507
,107
2
,163
,123
-
3,
986
2,5
03,1
21
99
.8
Mas
sach
uset
ts
3
,497
,093
3
,108
,997
-
-
3
,497
,093
1
00.0
Mic
higa
n
4
,242
,506
3
,708
,825
-
25,
922
4,2
16,5
84
99
.4
Min
neso
ta
2
,823
,879
2
,455
,067
-
18,
529
2,8
05,3
50
99
.3
Mis
siss
ippi
1,1
03,2
01
8
87,4
03
40,
586
6,
732
1,0
55,8
83
95
.7
Mis
sour
i
2
,726
,609
2
,357
,001
114
,804
9,46
8
2
,602
,337
95.4
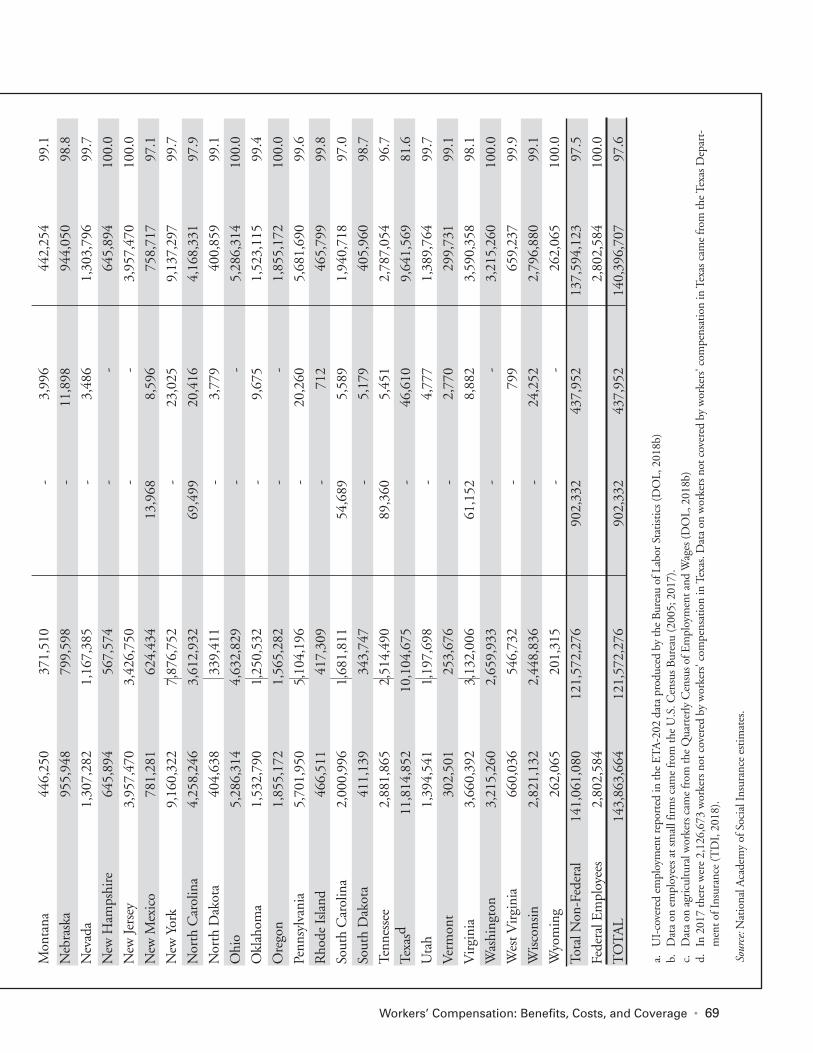
Workers’ Compensation: Benefits, Costs, and Coverage • 69
Mon
tana
4
46,2
50
3
71,5
10
-
3,99
6
442
,254
99.1
Neb
rask
a
955
,948
799
,598
-
11,
898
9
44,0
50
98
.8
Nev
ada
1,3
07,2
82
1,1
67,3
85
-
3,48
6
1
,303
,796
99.7
New
Ham
pshi
re
645
,894
567
,574
-
-
645
,894
1
00.0
New
Jers
ey
3
,957
,470
3
,426
,750
-
-
3
,957
,470
1
00.0
New
Mex
ico
7
81,2
81
6
24,4
34
13,
968
8,
596
7
58,7
17
97
.1
New
Yor
k
9
,160
,322
7
,876
,752
-
23,
025
9,1
37,2
97
99
.7
Nor
th C
arol
ina
4,2
58,2
46
3,6
12,9
32
69,
499
20,
416
4,1
68,3
31
97
.9
Nor
th D
akot
a
404
,638
339
,411
-
3,
779
4
00,8
59
99
.1
Ohi
o
5
,286
,314
4
,632
,829
-
-
5
,286
,314
1
00.0
Okl
ahom
a
1
,532
,790
1
,250
,532
-
9,
675
1,5
23,1
15
99
.4
Ore
gon
1,8
55,1
72
1,5
65,2
82
-
-
1,8
55,1
72
100
.0
Penn
sylv
ania
5,7
01,9
50
5,1
04,1
96
-
2
0,26
0
5
,681
,690
99.6
Rho
de Is
land
4
66,5
11
4
17,3
09
-
71
2
465
,799
99.8
Sout
h C
arol
ina
2,0
00,9
96
1,6
81,8
11
54,
689
5,
589
1,9
40,7
18
97
.0
Sout
h D
akot
a
411
,139
343
,747
-
5,
179
4
05,9
60
98
.7
Tenn
esse
e
2
,881
,865
2
,514
,490
8
9,36
0
5,45
1
2
,787
,054
96.7
Texa
sd
11
,814
,852
10
,104
,675
-
46,
610
9,6
41,5
69
81
.6
Uta
h
1
,394
,541
1
,197
,698
-
4,
777
1,3
89,7
64
99
.7
Ver
mon
t
302
,501
253
,676
-
2,
770
2
99,7
31
99
.1
Vir
gini
a
3
,660
,392
3
,132
,006
6
1,15
2
8,88
2
3
,590
,358
98.1
Was
hing
ton
3,2
15,2
60
2,6
59,9
33
-
-
3,2
15,2
60
100
.0
Wes
t Vir
gini
a
660
,036
546
,732
-
799
6
59,2
37
99
.9
Wis
cons
in
2
,821
,132
2
,448
,836
-
24,
252
2,7
96,8
80
99
.1
Wyo
min
g
262
,065
201
,315
-
-
262
,065
1
00.0
Tota
l Non
-Fed
eral
1
41,0
61,0
80
1
21,5
72,2
76
9
02,3
32
4
37,9
52
1
37,5
94,1
23
97
.5
Fede
ral E
mpl
oyee
s
2
,802
,584
2,8
02,5
84
100
.0
TO
TA
L
143
,863
,664
121
,572
,276
902
,332
437
,952
140
,396
,707
97.6
a.
UI-
cove
red
empl
oym
ent r
epor
ted
in th
e E
TA
-202
dat
a pr
oduc
ed b
y th
e B
urea
u of
Lab
or S
tatis
tics (
DO
L, 2
018b
) b.
D
ata
on e
mpl
oyee
s at s
mal
l fir
ms c
ame
from
the
U.S
. Cen
sus B
urea
u (2
005;
201
7).
c.
Dat
a on
agr
icul
tura
l wor
kers
cam
e fr
om th
e Q
uart
erly
Cen
sus o
f Em
ploy
men
t and
Wag
es (D
OL,
201
8b)
d.
In 2
017
ther
e w
ere
2,12
6,67
3 w
orke
rs n
ot c
over
ed b
y w
orke
rs' c
ompe
nsat
ion
in T
exas
. Dat
a on
wor
kers
not
cov
ered
by
wor
kers
' com
pens
atio
n in
Tex
as c
ame
from
the
Texa
s Dep
art-
men
t of I
nsur
ance
(T
DI,
201
8).
Sour
ce: N
atio
nal A
cade
my
of S
ocia
l Ins
uran
ce e
stim
ates
.
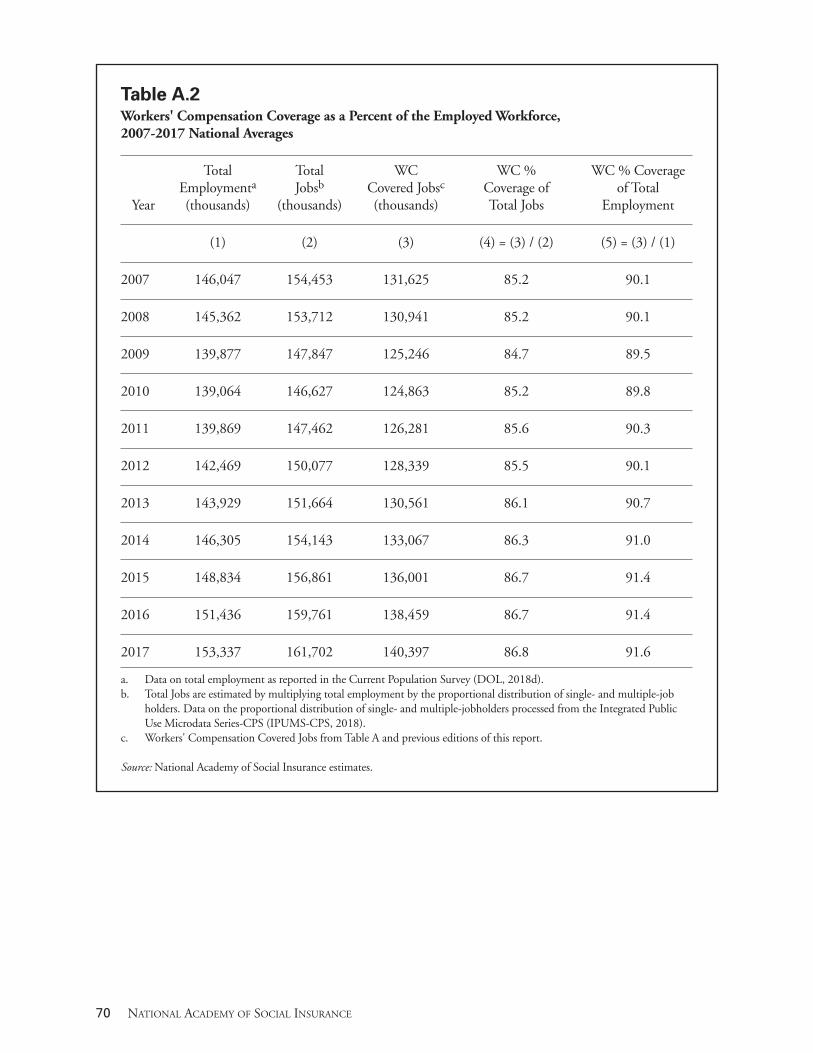
70 NATIONAL ACADEMY OF SOCIAL INSURANCE
Table A.2 Workers' Compensation Coverage as a Percent of the Employed Workforce, 2007-2017 National Averages
Total Total WC WC % WC % Coverage Employmenta Jobsb Covered Jobsc Coverage of of Total
Year (thousands) (thousands) (thousands) Total Jobs Employment
(1) (2) (3) (4) = (3) / (2) (5) = (3) / (1)
2007 146,047 154,453 131,625 85.2 90.1
2008 145,362 153,712 130,941 85.2 90.1
2009 139,877 147,847 125,246 84.7 89.5
2010 139,064 146,627 124,863 85.2 89.8
2011 139,869 147,462 126,281 85.6 90.3
2012 142,469 150,077 128,339 85.5 90.1
2013 143,929 151,664 130,561 86.1 90.7
2014 146,305 154,143 133,067 86.3 91.0
2015 148,834 156,861 136,001 86.7 91.4
2016 151,436 159,761 138,459 86.7 91.4
2017 153,337 161,702 140,397 86.8 91.6
a. Data on total employment as reported in the Current Population Survey (DOL, 2018d). b. Total Jobs are estimated by multiplying total employment by the proportional distribution of single- and multiple-job
holders. Data on the proportional distribution of single- and multiple-jobholders processed from the Integrated Public Use Microdata Series-CPS (IPUMS-CPS, 2018).
c. Workers' Compensation Covered Jobs from Table A and previous editions of this report.
Source: National Academy of Social Insurance estimates.
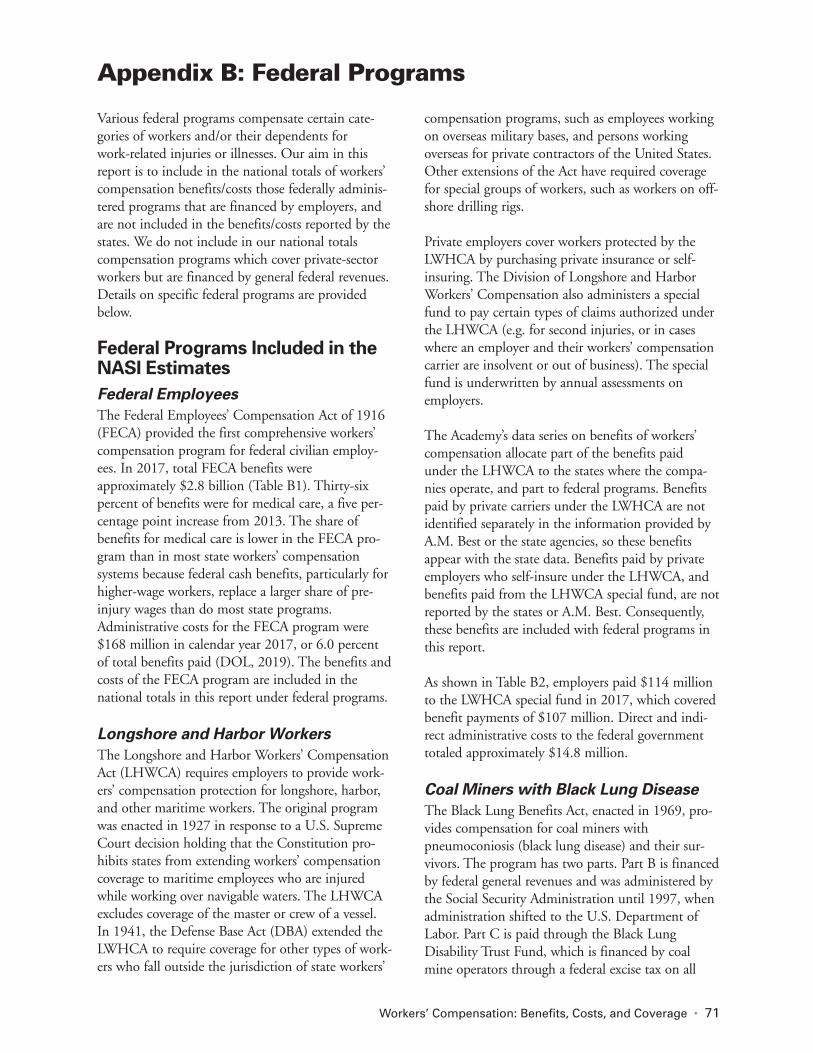
Workers’ Compensation: Benefits, Costs, and Coverage • 71
Various federal programs compensate certain cate-gories of workers and/or their dependents for work-related injuries or illnesses. Our aim in this report is to include in the national totals of workers’ compensation benefits/costs those federally adminis-tered programs that are financed by employers, and are not included in the benefits/costs reported by the states. We do not include in our national totals compensation programs which cover private-sector workers but are financed by general federal revenues. Details on specific federal programs are provided below. Federal Programs Included in the NASI Estimates
Federal Employees
The Federal Employees’ Compensation Act of 1916 (FECA) provided the first comprehensive workers’ compensation program for federal civilian employ-ees. In 2017, total FECA benefits were approximately $2.8 billion (Table B1). Thirty-six percent of benefits were for medical care, a five per-centage point increase from 2013. The share of benefits for medical care is lower in the FECA pro-gram than in most state workers’ compensation systems because federal cash benefits, particularly for higher-wage workers, replace a larger share of pre-injury wages than do most state programs. Administrative costs for the FECA program were $168 million in calendar year 2017, or 6.0 percent of total benefits paid (DOL, 2019). The benefits and costs of the FECA program are included in the national totals in this report under federal programs. Longshore and Harbor Workers
The Longshore and Harbor Workers’ Compensation Act (LHWCA) requires employers to provide work-ers’ compensation protection for longshore, harbor, and other maritime workers. The original program was enacted in 1927 in response to a U.S. Supreme Court decision holding that the Constitution pro-hibits states from extending workers’ compensation coverage to maritime employees who are injured while working over navigable waters. The LHWCA excludes coverage of the master or crew of a vessel. In 1941, the Defense Base Act (DBA) extended the LWHCA to require coverage for other types of work-ers who fall outside the jurisdiction of state workers’
compensation programs, such as employees working on overseas military bases, and persons working overseas for private contractors of the United States. Other extensions of the Act have required coverage for special groups of workers, such as workers on off-shore drilling rigs. Private employers cover workers protected by the LWHCA by purchasing private insurance or self-insuring. The Division of Longshore and Harbor Workers’ Compensation also administers a special fund to pay certain types of claims authorized under the LHWCA (e.g. for second injuries, or in cases where an employer and their workers’ compensation carrier are insolvent or out of business). The special fund is underwritten by annual assessments on employers. The Academy’s data series on benefits of workers’ compensation allocate part of the benefits paid under the LHWCA to the states where the compa-nies operate, and part to federal programs. Benefits paid by private carriers under the LWHCA are not identified separately in the information provided by A.M. Best or the state agencies, so these benefits appear with the state data. Benefits paid by private employers who self-insure under the LHWCA, and benefits paid from the LHWCA special fund, are not reported by the states or A.M. Best. Consequently, these benefits are included with federal programs in this report. As shown in Table B2, employers paid $114 million to the LWHCA special fund in 2017, which covered benefit payments of $107 million. Direct and indi-rect administrative costs to the federal government totaled approximately $14.8 million. Coal Miners with Black Lung Disease
The Black Lung Benefits Act, enacted in 1969, pro-vides compensation for coal miners with pneumoconiosis (black lung disease) and their sur-vivors. The program has two parts. Part B is financed by federal general revenues and was administered by the Social Security Administration until 1997, when administration shifted to the U.S. Department of Labor. Part C is paid through the Black Lung Disability Trust Fund, which is financed by coal mine operators through a federal excise tax on all
Appendix B: Federal Programs
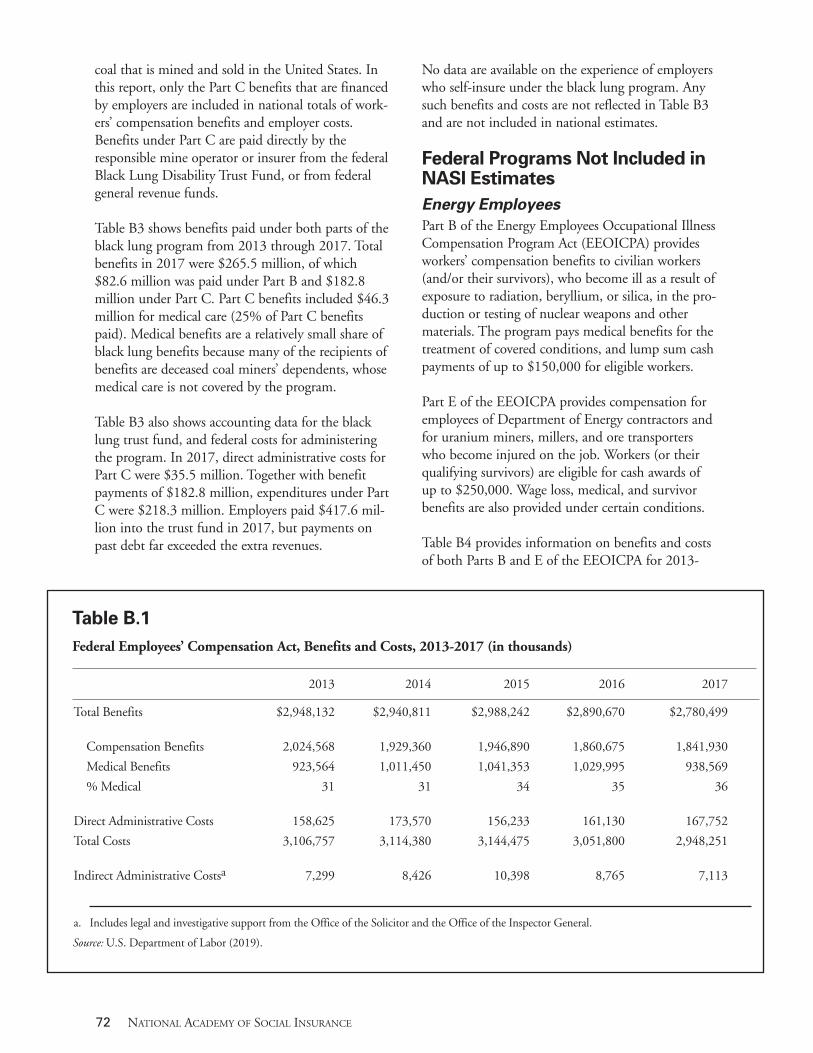
72 NATIONAL ACADEMY OF SOCIAL INSURANCE
coal that is mined and sold in the United States. In this report, only the Part C benefits that are financed by employers are included in national totals of work-ers’ compensation benefits and employer costs. Benefits under Part C are paid directly by the responsible mine operator or insurer from the federal Black Lung Disability Trust Fund, or from federal general revenue funds. Table B3 shows benefits paid under both parts of the black lung program from 2013 through 2017. Total benefits in 2017 were $265.5 million, of which $82.6 million was paid under Part B and $182.8 million under Part C. Part C benefits included $46.3 million for medical care (25% of Part C benefits paid). Medical benefits are a relatively small share of black lung benefits because many of the recipients of benefits are deceased coal miners’ dependents, whose medical care is not covered by the program. Table B3 also shows accounting data for the black lung trust fund, and federal costs for administering the program. In 2017, direct administrative costs for Part C were $35.5 million. Together with benefit payments of $182.8 million, expenditures under Part C were $218.3 million. Employers paid $417.6 mil-lion into the trust fund in 2017, but payments on past debt far exceeded the extra revenues.
No data are available on the experience of employers who self-insure under the black lung program. Any such benefits and costs are not reflected in Table B3 and are not included in national estimates. Federal Programs Not Included in NASI Estimates
Energy Employees
Part B of the Energy Employees Occupational Illness Compensation Program Act (EEOICPA) provides workers’ compensation benefits to civilian workers (and/or their survivors), who become ill as a result of exposure to radiation, beryllium, or silica, in the pro-duction or testing of nuclear weapons and other materials. The program pays medical benefits for the treatment of covered conditions, and lump sum cash payments of up to $150,000 for eligible workers. Part E of the EEOICPA provides compensation for employees of Department of Energy contractors and for uranium miners, millers, and ore transporters who become injured on the job. Workers (or their qualifying survivors) are eligible for cash awards of up to $250,000. Wage loss, medical, and survivor benefits are also provided under certain conditions. Table B4 provides information on benefits and costs of both Parts B and E of the EEOICPA for 2013-
Table B.1
Federal Employees’ Compensation Act, Benefits and Costs, 2013-2017 (in thousands)
2013 2014 2015 2016 2017
Total Benefits $2,948,132 $2,940,811 $2,988,242 $2,890,670 $2,780,499 Compensation Benefits 2,024,568 1,929,360 1,946,890 1,860,675 1,841,930
Medical Benefits 923,564 1,011,450 1,041,353 1,029,995 938,569
% Medical 31 31 34 35 36 Direct Administrative Costs 158,625 173,570 156,233 161,130 167,752
Total Costs 3,106,757 3,114,380 3,144,475 3,051,800 2,948,251 Indirect Administrative Costsa 7,299 8,426 10,398 8,765 7,113
a. Includes legal and investigative support from the Office of the Solicitor and the Office of the Inspector General.
Source: U.S. Department of Labor (2019).
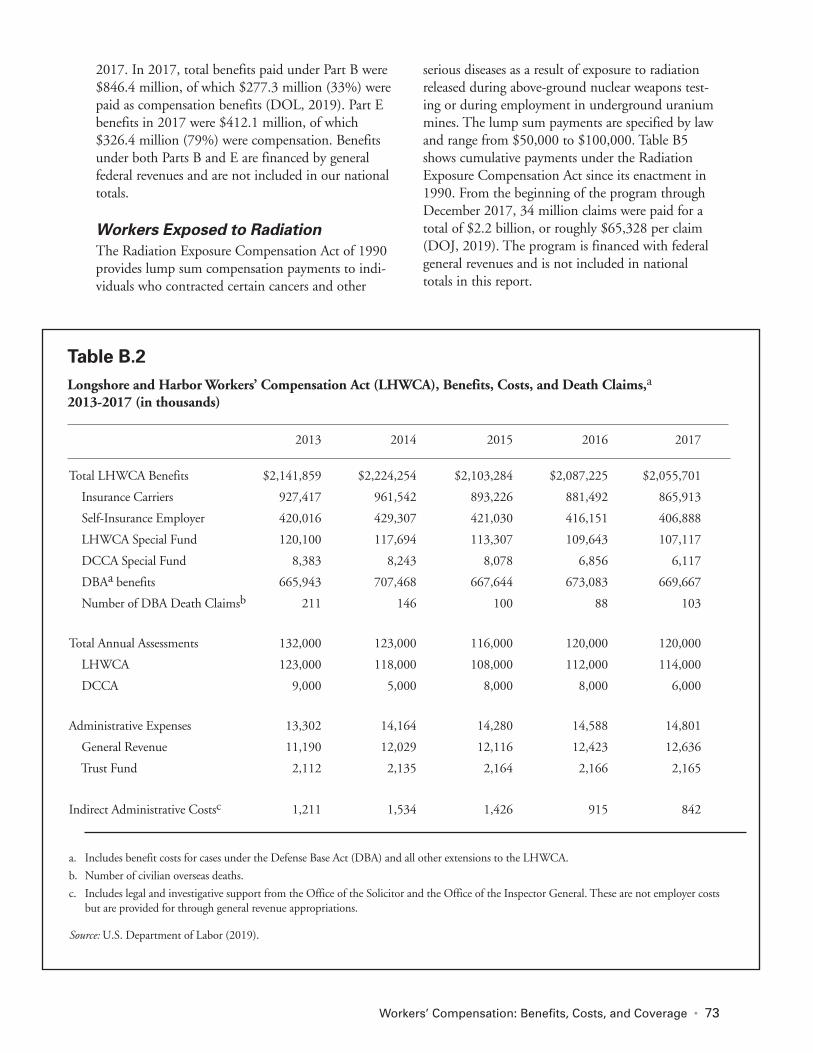
Workers’ Compensation: Benefits, Costs, and Coverage • 73
2017. In 2017, total benefits paid under Part B were $846.4 million, of which $277.3 million (33%) were paid as compensation benefits (DOL, 2019). Part E benefits in 2017 were $412.1 million, of which $326.4 million (79%) were compensation. Benefits under both Parts B and E are financed by general federal revenues and are not included in our national totals. Workers Exposed to Radiation
The Radiation Exposure Compensation Act of 1990 provides lump sum compensation payments to indi-viduals who contracted certain cancers and other
serious diseases as a result of exposure to radiation released during above-ground nuclear weapons test-ing or during employment in underground uranium mines. The lump sum payments are specified by law and range from $50,000 to $100,000. Table B5 shows cumulative payments under the Radiation Exposure Compensation Act since its enactment in 1990. From the beginning of the program through December 2017, 34 million claims were paid for a total of $2.2 billion, or roughly $65,328 per claim (DOJ, 2019). The program is financed with federal general revenues and is not included in national totals in this report.
Table B.2
Longshore and Harbor Workers’ Compensation Act (LHWCA), Benefits, Costs, and Death Claims,a 2013-2017 (in thousands)
2013 2014 2015 2016 2017
Total LHWCA Benefits $2,141,859 $2,224,254 $2,103,284 $2,087,225 $2,055,701
Insurance Carriers 927,417 961,542 893,226 881,492 865,913
Self-Insurance Employer 420,016 429,307 421,030 416,151 406,888
LHWCA Special Fund 120,100 117,694 113,307 109,643 107,117
DCCA Special Fund 8,383 8,243 8,078 6,856 6,117
DBAa benefits 665,943 707,468 667,644 673,083 669,667
Number of DBA Death Claimsb 211 146 100 88 103
Total Annual Assessments 132,000 123,000 116,000 120,000 120,000
LHWCA 123,000 118,000 108,000 112,000 114,000
DCCA 9,000 5,000 8,000 8,000 6,000
Administrative Expenses 13,302 14,164 14,280 14,588 14,801
General Revenue 11,190 12,029 12,116 12,423 12,636
Trust Fund 2,112 2,135 2,164 2,166 2,165
Indirect Administrative Costsc 1,211 1,534 1,426 915 842
a. Includes benefit costs for cases under the Defense Base Act (DBA) and all other extensions to the LHWCA.
b. Number of civilian overseas deaths.
c. Includes legal and investigative support from the Office of the Solicitor and the Office of the Inspector General. These are not employer costs but are provided for through general revenue appropriations.
Source: U.S. Department of Labor (2019).
74 NATIONAL ACADEMY OF SOCIAL INSURANCE
Veterans of Military Service
U.S. military personnel are covered by the federal veterans’ compensation program of the Department of Veterans Affairs. The program provides cash bene-fits to veterans who sustain total or partial disabilities while on active duty. Table B6 shows the number of recipients, and the value of cash benefits paid, in fis-cal year 2017. As shown in Table B6, 4.55 million veterans were receiving monthly compensation pay-ments for service-connected disabilities in 2017. Of these, 62.0 percent of veterans had a disability rating of 30 percent or more. Total monthly payments for
disabled veterans and their dependents were $5.8 bil-lion in 2017, or about $70.0 billion for the year (VA, 2018). Hence, annual cash benefits paid under the veterans’ compensation program in 2017 were almost double the cash benefits paid under all other workers’ compensation programs (Table 1). Because it is so large, covers such a high proportion of serious injuries, and provides medical care through an entirely separate health care system, we do not include the veterans’ compensation program in the national totals we estimate for regular workers’ com-pensation programs.
Table B.3
Black Lung Benefits Act, Benefits and Costs, 2013-2017 (in thousands)
2013 2014 2015 2016 2017
Total Benefits $337,282 $312,814 $287,841 $278,596 $265,474
Part C Compensation 162,410 148,926 141,290 143,212 136,508
Part C Medical Benefits 34,213 36,224 33,900 36,733 46,320
Part B Compensation 140,659 127,664 112,651 98,651 82,646
Total Direct Administrative Costs 35,950 35,408 36,020 38,201 40,564
Part C (DOL) 31,085 30,633 31,198 33,236 35,472
Part B (SSA) 4,865 4,775 4,822 4,964 5,093
Trust Fund Advances from U.S. Treasurya 424,750 518,250 666,250 1,003,750 1,438,750 Bond Paymentsb 457,542 477,757 498,739 528,293 405,392 Interest Payments on Past Advancesc 261,128 549,181 1,037,392 1,335,288 2,015,732 Coal Tax Revenues Received by the
Black Lung Trust Fund 512,866 573,694 524,230 436,889 417,628 Indirect Administrative Costsd 24,661 25,489 28,972 29,430 30,608 a Advance of funds required when Trust Fund expenses exceed tax revenues received in a given year. Under the Emergency Economic Stabiliza-
tion Act of 2008 (EESA), total Trust Fund debt (cumulative advances) at the end of 2008 was converted to zero coupon bonds that are re-payable to the U.S. Treasury on an annual basis.
b Repayment of bond principal and interest on principal debt as required by the Trust Fund debt restructuring portion of the EESA.
c The amount shown is the repayment of one-year obligations of the Trust Fund, which include the previous year's advances from the U.S. Trea-sury and applicable interest due on those advances, as required under the EESA.
d Includes legal and investigative support from the Office of the Solicitor and the Office of the Inspector General, services provided by the De-partment of the Treasury, and costs for the Office of Administrative Law Judges (OALJ) and the Benefits Review Board (BRB). OALJ and BRB costs are not included for any other program but cannot be separately identified for Coal Mine Workers' Compensation.
Source: U.S. Department of Labor (2019).
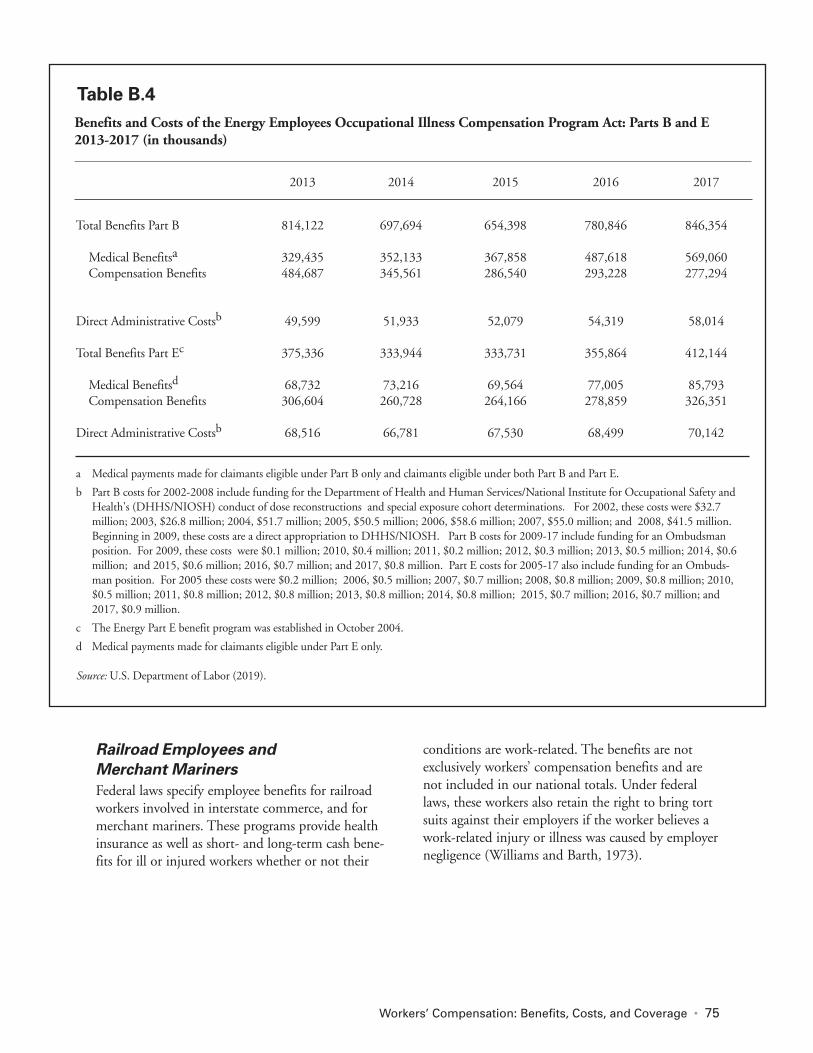
Workers’ Compensation: Benefits, Costs, and Coverage • 75
Railroad Employees and
Merchant Mariners
Federal laws specify employee benefits for railroad workers involved in interstate commerce, and for merchant mariners. These programs provide health insurance as well as short- and long-term cash bene-fits for ill or injured workers whether or not their
conditions are work-related. The benefits are not exclusively workers’ compensation benefits and are not included in our national totals. Under federal laws, these workers also retain the right to bring tort suits against their employers if the worker believes a work-related injury or illness was caused by employer negligence (Williams and Barth, 1973).
Table B.4
Benefits and Costs of the Energy Employees Occupational Illness Compensation Program Act: Parts B and E 2013-2017 (in thousands)
2013 2014 2015 2016 2017
Total Benefits Part B 814,122 697,694 654,398 780,846 846,354 Medical Benefitsa 329,435 352,133 367,858 487,618 569,060 Compensation Benefits 484,687 345,561 286,540 293,228 277,294 Direct Administrative Costsb 49,599 51,933 52,079 54,319 58,014 Total Benefits Part Ec 375,336 333,944 333,731 355,864 412,144 Medical Benefitsd 68,732 73,216 69,564 77,005 85,793 Compensation Benefits 306,604 260,728 264,166 278,859 326,351 Direct Administrative Costsb 68,516 66,781 67,530 68,499 70,142
a Medical payments made for claimants eligible under Part B only and claimants eligible under both Part B and Part E.
b Part B costs for 2002-2008 include funding for the Department of Health and Human Services/National Institute for Occupational Safety and Health's (DHHS/NIOSH) conduct of dose reconstructions and special exposure cohort determinations. For 2002, these costs were $32.7 million; 2003, $26.8 million; 2004, $51.7 million; 2005, $50.5 million; 2006, $58.6 million; 2007, $55.0 million; and 2008, $41.5 million. Beginning in 2009, these costs are a direct appropriation to DHHS/NIOSH. Part B costs for 2009-17 include funding for an Ombudsman position. For 2009, these costs were $0.1 million; 2010, $0.4 million; 2011, $0.2 million; 2012, $0.3 million; 2013, $0.5 million; 2014, $0.6 million; and 2015, $0.6 million; 2016, $0.7 million; and 2017, $0.8 million. Part E costs for 2005-17 also include funding for an Ombuds-man position. For 2005 these costs were $0.2 million; 2006, $0.5 million; 2007, $0.7 million; 2008, $0.8 million; 2009, $0.8 million; 2010, $0.5 million; 2011, $0.8 million; 2012, $0.8 million; 2013, $0.8 million; 2014, $0.8 million; 2015, $0.7 million; 2016, $0.7 million; and 2017, $0.9 million.
c The Energy Part E benefit program was established in October 2004.
d Medical payments made for claimants eligible under Part E only. Source: U.S. Department of Labor (2019).
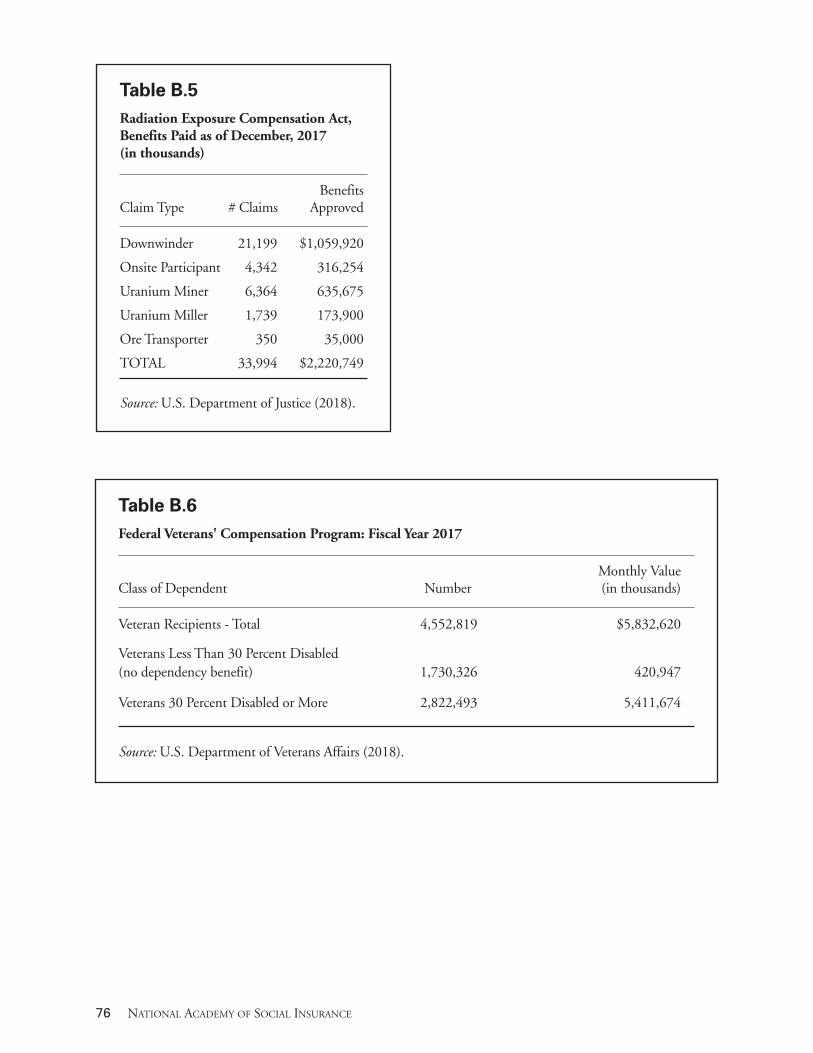
76 NATIONAL ACADEMY OF SOCIAL INSURANCE
Table B.5
Radiation Exposure Compensation Act, Benefits Paid as of December, 2017 (in thousands)
Benefits Claim Type # Claims Approved
Downwinder 21,199 $1,059,920
Onsite Participant 4,342 316,254
Uranium Miner 6,364 635,675
Uranium Miller 1,739 173,900
Ore Transporter 350 35,000
TOTAL 33,994 $2,220,749 Source: U.S. Department of Justice (2018).
Table B.6
Federal Veterans' Compensation Program: Fiscal Year 2017
Monthly Value Class of Dependent Number (in thousands)
Veteran Recipients - Total 4,552,819 $5,832,620
Veterans Less Than 30 Percent Disabled (no dependency benefit) 1,730,326 420,947
Veterans 30 Percent Disabled or More 2,822,493 5,411,674 Source: U.S. Department of Veterans Affairs (2018).
Workers’ Compensation: Benefits, Costs, and Coverage • 77
Table C identifies the parameters that determine workers’ compensation benefits under the current laws in each jurisdiction. The benefit parameters defined in this table include the following:
■ The waiting period before a worker becomes eligible for cash benefits.
■ The retroactive period when a worker becomes eligible for compensation for the waiting period.
■ The minimum and maximum weekly benefit payments for temporary total disability.
■ The maximum duration of temporary total disability benefits.
■ The maximum weekly benefit and benefit limitations for permanent partial disability.
■ The maximum weekly benefit and benefit limitations for permanent total disability.
■ The maximum weekly benefit and benefit limitations for death benefits.
Appendix C: Workers’ Compensation under State Laws
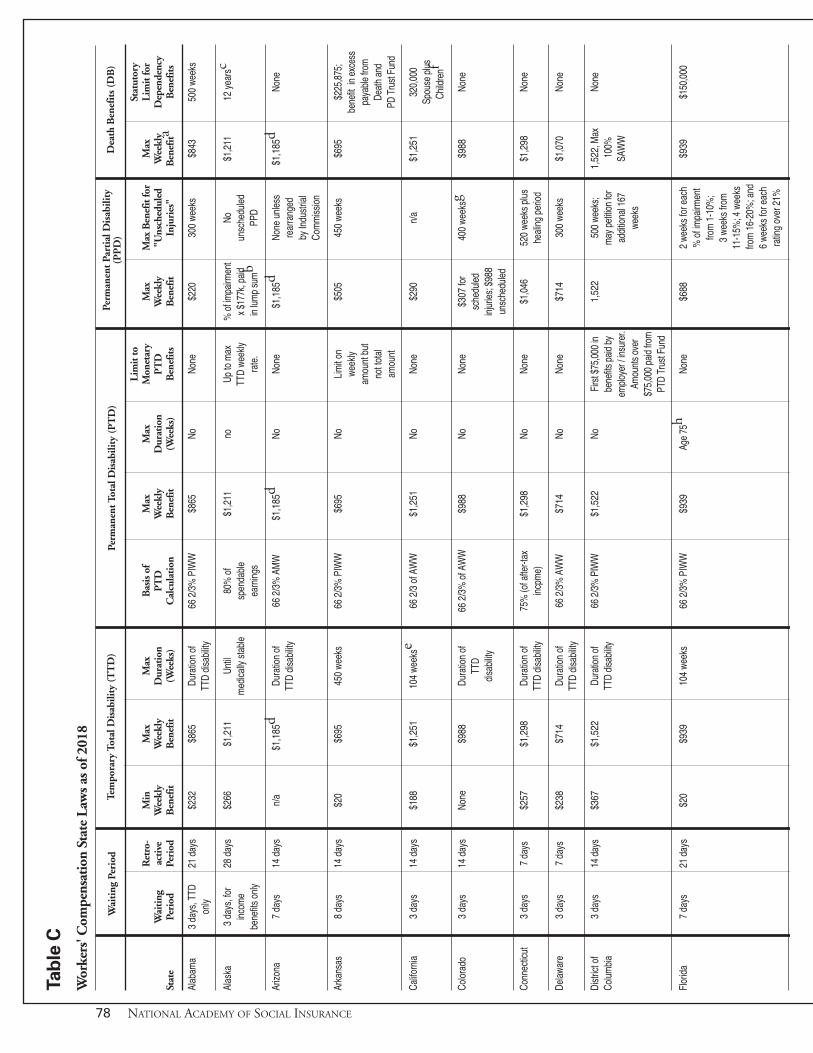
78 NATIONAL ACADEMY OF SOCIAL INSURANCE
Tab
le C
Wor
kers
' Com
pens
atio
n St
ate
Law
s as
of 2
018
Lim
it to
St
atut
ory
Ret
ro-
Min
Max
Max
Bas
is o
fM
axM
axM
onet
ary
Max
Max
Ben
efit
for
Max
Lim
it fo
r W
aiti
ngac
tive
Wee
kly
Wee
kly
Dur
atio
nP
TD
Wee
kly
Dur
atio
n P
TD
Wee
kly
"Uns
ched
uled
Wee
kly
Dep
ende
ncy
Stat
ePe
riod
Peri
odB
enef
itB
enef
it(W
eeks
)C
alcu
lati
onB
enef
it(W
eeks
)B
enef
its
Ben
efit
Inju
ries
"B
enef
ita
Ben
efit
s
Alab
ama
3 da
ys, T
TD21
day
s$2
32$8
65Du
ratio
n of
66
2/3
% P
IWW
$865
NoNo
ne$2
2030
0 we
eks
$843
500
week
s on
lyTT
D di
sabi
lity
Alas
ka3
days
, for
28 d
ays
$266
$1,2
11Un
til80
% o
f $1
,211
noUp
to m
ax
% o
f impa
irmen
t No
$1,2
1112
yea
rsc
inco
me
med
ically
sta
ble
spen
dabl
e TT
D we
ekly
x $1
77k,
pai
dun
sche
dule
d be
nefit
s on
lyea
rnin
gsra
te.
in lu
mp
sumb
PPD
Arizo
na7
days
14
day
sn/
a$1
,185
dDu
ratio
n of
66
2/3
% A
MW
$1,1
85d
NoNo
ne$1
,185
d No
ne u
nles
s $1
,185
dNo
ne
TTD
disa
bility
re
arra
nged
by In
dust
rial
Com
miss
ion
Arka
nsas
8 da
ys14
day
s$2
0$6
9545
0 we
eks
66 2
/3%
PIW
W
$695
NoLi
mit
on
$505
450
week
s$6
95$2
25,8
75;
week
lybe
nefit
in e
xces
s am
ount
but
paya
ble
from
no
t tot
alDe
ath
and
amou
ntPD
Tru
st F
und
Califo
rnia
3 da
ys14
day
s$1
88$1
,251
104
week
se66
2/3
of A
WW
$1,2
51No
None
$290
n/a
$1,2
5132
0,00
0
Spou
se p
lus
Child
renf
Colo
rado
3 da
ys
14 d
ays
None
$988
Dura
tion
of
66 2
/3%
of A
WW
$988
No
None
$307
for
400
week
sg$9
88No
ne
TTD
sche
dule
d
disa
bility
inju
ries;
$98
8
unsc
hedu
led
Conn
ectic
ut3
days
7 da
ys$2
57$1
,298
Dura
tion
of
75%
(of a
fter-t
ax
$1,2
98No
None
$1,0
4652
0 we
eks
plus
$1,2
98No
ne
TTD
disa
bility
incp
me)
heal
ing
perio
d
Dela
ware
3 da
ys7
days
$2
38$7
14Du
ratio
n of
66 2
/3%
AW
W$7
14No
None
$714
300
week
s$1
,070
None
TT
D di
sabi
lity
Dist
rict o
f 3
days
14 d
ays
$367
$1,5
22Du
ratio
n of
66 2
/3%
PIW
W$1
,522
NoFi
rst $
75,0
00 in
1,52
250
0 we
eks;
1,
522,
Max
None
Co
lum
bia
TTD
disa
bility
bene
fits p
aid
bym
ay p
etitio
n fo
r 1
00%
em
ploy
er /
insu
rer.
addi
tiona
l 167
SA
WW
Am
ount
s ov
er
week
s $7
5,00
0 pa
id fr
om
PTD
Trus
t Fun
d
Flor
ida
7 da
ys21
day
s$2
0 $9
3910
4 we
eks
66 2
/3%
PIW
W$9
39Ag
e 75
hNo
ne$6
882
week
s fo
r eac
h$9
39$1
50,0
00
% o
f im
pairm
ent
fro
m 1
-10%
;
3 we
eks
from
11-1
5%; 4
wee
ks
from
16-
20%
; and
6
week
s fo
r eac
h ra
ting
over
21%
Dea
th B
enef
its
(DB
)Pe
rman
ent P
arti
al D
isab
ility
(P
PD
)Pe
rman
ent T
otal
Dis
abili
ty (
PT
D)
Tem
pora
ry T
otal
Dis
abili
ty (
TT
D)
Wai
ting
Per
iod
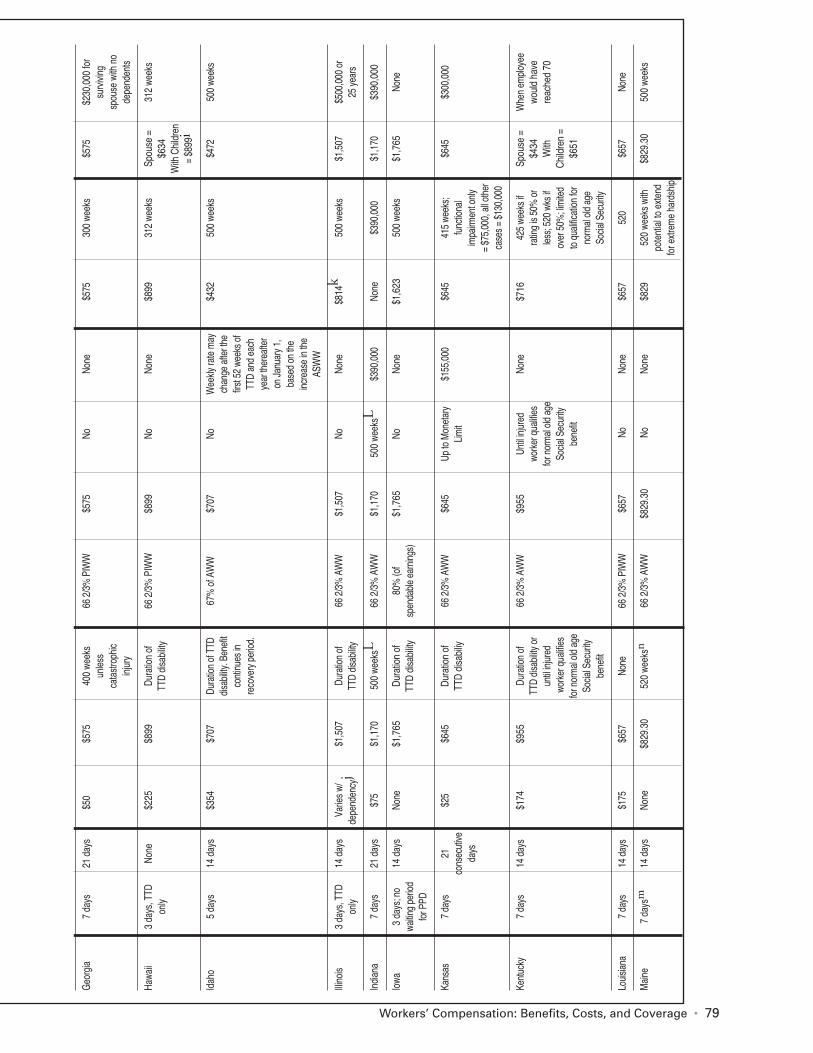
Workers’ Compensation: Benefits, Costs, and Coverage • 79
Geo
rgia
7 da
ys21
day
s$5
0$5
7540
0 we
eks
66 2
/3%
PIW
W$5
75No
None
$575
300
week
s$5
75$2
30,0
00 fo
r un
less
su
rvivi
ng
cata
stro
phic
spou
se w
ith n
o
inju
ryde
pend
ents
Hawa
ii3
days
, TTD
No
ne$2
25$8
99Du
ratio
n of
66
2/3
% P
IWW
$899
NoNo
ne$8
9931
2 we
eks
Spou
se =
312
week
s on
lyTT
D di
sabi
lity$6
34
With
Chi
ldre
n =
$899
i
Idah
o5
days
14 d
ays
$354
$707
Dura
tion
of T
TD
67%
of A
WW
$707
NoW
eekly
rate
may
$432
500
week
s$4
7250
0 we
eks
disa
bility
. Ben
efit
chan
ge a
fter t
heco
ntin
ues
in
first
52
week
s of
reco
very
per
iod.
TTD
and
each
ye
ar th
erea
fter
on J
anua
ry 1
, ba
sed
on th
e in
crea
se in
the
AS
WW
Illino
is3
days
, TTD
14 d
ays
Varie
s w/
$1,5
07Du
ratio
n of
66
2/3
% A
WW
$1,5
07No
None
$814
k50
0 we
eks
$1,5
07$5
00,0
00 o
r on
lyde
pend
ency
jTT
D di
sabi
lity25
yea
rs
Indi
ana
7 da
ys21
day
s$7
5$1
,170
500
week
sL66
2/3
% A
WW
$1,1
7050
0 we
eksL
$390
,000
None
$390
,000
$1,1
70$3
90,0
00
Iowa
3 da
ys; n
o 14
day
sNo
ne$1
,765
Dur
atio
n of
80
% (o
f $1
,765
NoNo
ne$1
,623
500
week
s$1
,765
None
waitin
g pe
riod
TTD
disa
bility
sp
enda
ble
earn
ings
) fo
r PPD
Kans
as7
days
21
$2
5$6
45D
urat
ion
of66
2/3
% A
WW
$645
Up to
Mon
etar
y $1
55,0
00$6
4541
5 we
eks;
$6
45$3
00,0
00
cons
ecut
iveTT
D d
isabi
liyLi
mit
func
tiona
l da
ysim
pairm
ent o
nly
=
$75,
000,
all o
ther
ca
ses
= $1
30,0
00
Kent
ucky
7 da
ys14
day
s$ 1
74$9
55Du
ratio
n of
66
2/3
% A
WW
$955
Until
inju
red
None
$716
425
week
s if
Spou
se =
Whe
n em
ploy
eeTT
D di
sabi
lity o
r wo
rker
qua
lifies
ratin
g is
50%
or
$434
w
ould
hav
e
until
inju
red
for n
orm
al o
ld a
ge
less
; 520
wks
ifW
ithre
ache
d 70
w
orke
r qua
lifies
So
cial S
ecur
ityov
er 5
0%; li
mite
dC
hild
ren
=
for n
orm
al o
ld a
ge
bene
fitto
qua
lifica
tion
for
$651
So
cial S
ecur
ity
norm
al o
ld a
ge
bene
fitSo
cial S
ecur
ity
Loui
siana
7 da
ys14
day
s$1
75$6
57No
ne66
2/3
% P
IWW
$657
NoNo
ne$6
5752
0$6
57No
ne
Mai
ne7
days
m14
day
sNo
ne$8
29.3
052
0 we
eksn
66 2
/3%
AW
W$8
29.3
0No
None
$829
520
week
s wi
th
$829
.30
500
week
s po
tent
ial t
o ex
tend
fo
r ext
rem
e ha
rdsh
ip
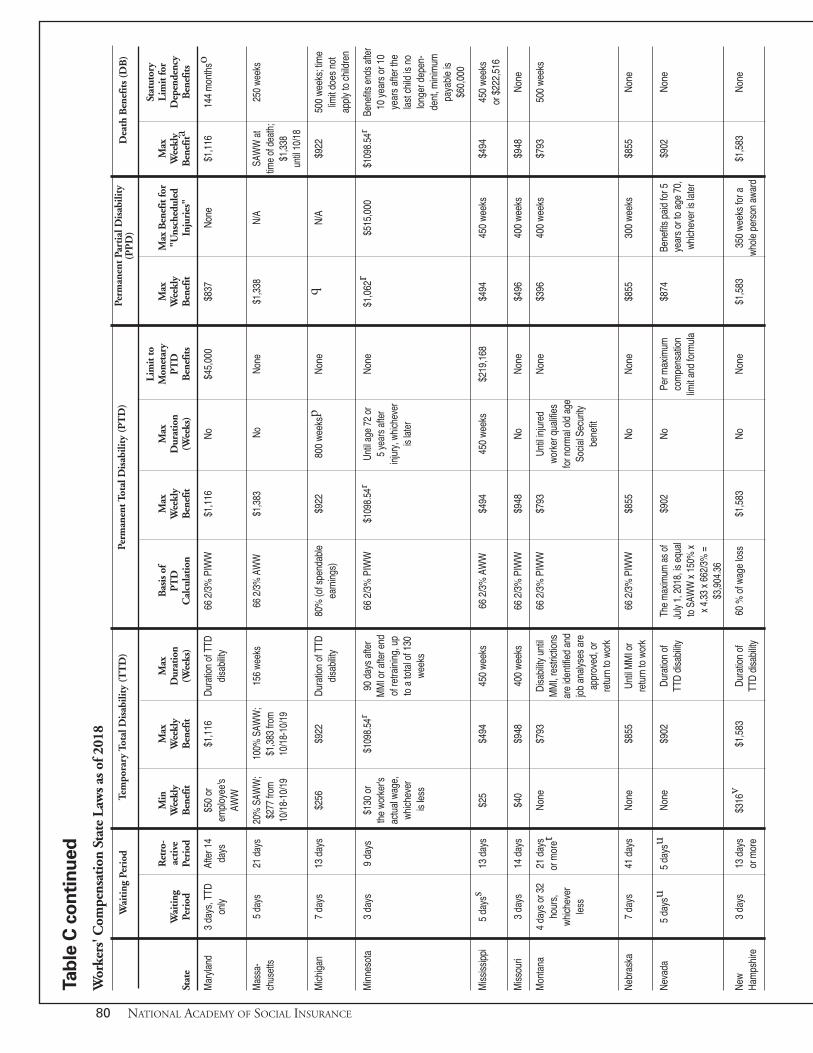
80 NATIONAL ACADEMY OF SOCIAL INSURANCE
Tab
le C
co
nti
nu
ed
Wor
kers
' Com
pens
atio
n St
ate
Law
s as
of 2
018
Lim
it to
St
atut
ory
Ret
ro-
Min
Max
Max
Bas
is o
fM
axM
axM
onet
ary
Max
Max
Ben
efit
for
Max
Lim
it fo
r W
aiti
ngac
tive
Wee
kly
Wee
kly
Dur
atio
nP
TD
Wee
kly
Dur
atio
n P
TD
Wee
kly
"Uns
ched
uled
Wee
kly
Dep
ende
ncy
Stat
ePe
riod
Peri
odB
enef
itB
enef
it(W
eeks
)C
alcu
lati
onB
enef
it(W
eeks
)B
enef
its
Ben
efit
Inju
ries
"B
enef
ita
Ben
efit
s
Mar
yland
3 da
ys, T
TD
Afte
r 14
$50
or
$1,1
16D
urat
ion
of T
TD
66 2
/3%
PIW
W$1
,116
No
$45,
000
$837
Non
e$1
,116
144
mon
thso
on
lyda
ysem
ploy
ee's
disa
bility
AW
W
Mas
sa-
5 da
ys21
day
s20
% S
AWW
;
100%
SAW
W;
156
week
s66
2/3
% A
WW
$1
,383
NoNo
ne$1
,338
N/A
SAW
W a
t25
0 we
eks
chus
etts
$277
from
$1
,383
from
tim
e of
dea
th;
10/1
8-10
/19
10/1
8-10
/19
$1,3
38
until
10/1
8
Mich
igan
7 da
ys13
day
s$2
56$9
22D
urat
ion
of T
TD
80%
(of s
pend
able
$9
2280
0 w
eeks
pN
one
qN
/A$9
2250
0 w
eeks
; tim
e di
sabi
lityea
rnin
gs)
limit
does
not
ap
ply
to c
hild
ren
Min
neso
ta3
days
9 da
ys$1
30 o
r $1
098.
54r
90 d
ays
afte
r 66
2/3
% P
IWW
$109
8.54
rUn
til ag
e 72
or
Non
e$1
,062
r$5
15,0
00$1
098.
54r
Bene
fits
ends
afte
r th
e w
orke
r'sM
MI o
r afte
r end
5 ye
ars
afte
r10
yea
rs o
r 10
ac
tual
wag
e,of
retra
inin
g, u
pin
jury
, whi
chev
erye
ars
afte
r the
w
hich
ever
to a
tota
l of 1
30is
late
rla
st c
hild
is n
o is
less
wee
kslo
nger
dep
en-
dent
, min
imum
pa
yabl
e is
$6
0,00
0
Miss
issip
pi5
days
s13
day
s$2
5$4
9445
0 w
eeks
66 2
/3%
AW
W$4
9445
0 w
eeks
$219
,168
$494
450
wee
ks$4
9445
0 w
eeks
or
$22
2,51
6
Miss
ouri
3 da
ys14
day
s$4
0$9
4840
0 w
eeks
66 2
/3%
PIW
W
$948
No
Non
e$4
9640
0 w
eeks
$948
Non
e
Mon
tana
4 da
ys o
r 32
21 d
ays
Non
e$7
93D
isabi
lity u
ntil
66 2
/3%
PIW
W$7
93U
ntil i
njur
ed
Non
e$3
9640
0 w
eeks
$793
500
wee
ks
hour
s,
or m
oret
MM
I, re
stric
tions
wor
ker q
ualifi
es
whi
chev
er
are
iden
tifie
d an
d fo
r nor
mal
old
age
less
job
anal
yses
are
So
cial S
ecur
ity
appr
oved
, or
bene
fit
retu
rn to
wor
k
Neb
rask
a7
days
41 d
ays
Non
e $8
55U
ntil M
MI o
r 66
2/3
% P
IWW
$855
No
Non
e$8
5530
0 w
eeks
$855
Non
e re
turn
to w
ork
Nev
ada
5 da
ysu
5 da
ysu
Non
e$9
02D
urat
ion
of
The
max
imum
as
of
$902
No
Per m
axim
um
$874
Bene
fits
paid
for 5
$9
02N
one
TTD
disa
bility
July
1, 2
018,
is e
qual
com
pens
atio
n y
ears
or t
o ag
e 70
, to
SAW
W x
150
% x
limit
and
form
ula
whi
chev
er is
late
r x
4.3
3 x
662/
3% =
$3
,904
.36
New
3
days
13 d
ays
$316
v$1
,583
Dur
atio
n of
60
% o
f wag
e lo
ss$1
,583
No
Non
e$1
,583
350
wee
ks fo
r a$1
,583
Non
e H
amps
hire
or m
ore
TTD
disa
bility
who
le p
erso
n aw
ard
Dea
th B
enef
its
(DB
)Pe
rman
ent P
arti
al D
isab
ility
(P
PD
)Pe
rman
ent T
otal
Dis
abili
ty (
PT
D)
Tem
pora
ry T
otal
Dis
abili
ty (
TT
D)
Wai
ting
Per
iod
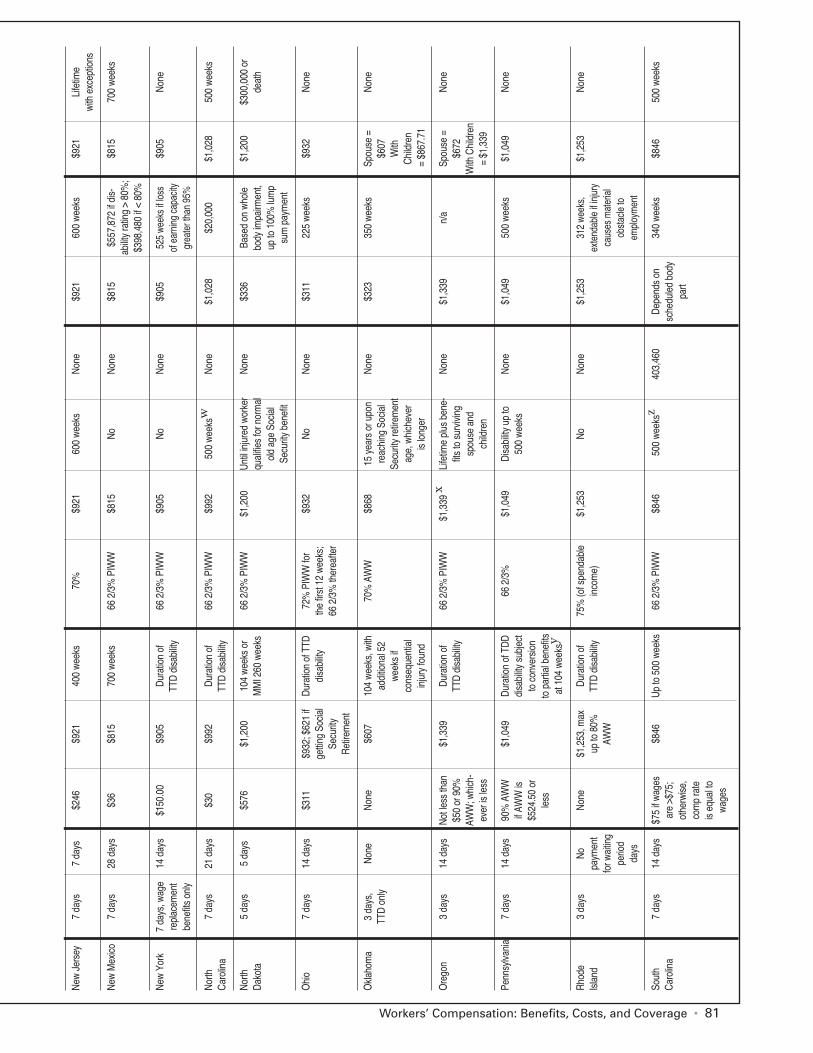
Workers’ Compensation: Benefits, Costs, and Coverage • 81
New
Jer
sey
7 da
ys7
days
$246
$921
400
wee
ks70
%$9
2160
0 w
eeks
Non
e$9
2160
0 w
eeks
$921
Life
time
w
ith e
xcep
tions
New
Mex
ico7
days
28 d
ays
$36
$815
700
wee
ks66
2/3
% P
IWW
$815
No
Non
e$8
15$5
57,8
72 if
dis-
$815
700
wee
ks
abilit
y ra
ting
> 80
%;
$398
,480
if <
80%
New
Yor
k7
days
, wag
e 14
day
s$1
50.0
0$9
05D
urat
ion
of
66 2
/3%
PIW
W$9
05N
oN
one
$905
525
week
s if
loss
$905
Non
e re
plac
emen
t TT
D d
isabi
lityof
ear
ning
cap
acity
be
nefit
s on
lygr
eate
r tha
n 95
%
Nor
th
7 da
ys21
day
s$3
0$9
92D
urat
ion
of
66 2
/3%
PIW
W$9
9250
0 w
eeks
w
Non
e$1
,028
$20,
000
$1,0
2850
0 w
eeks
C
arol
ina
TTD
disa
bility
Nor
th
5 da
ys5
days
$576
$1,2
0010
4 w
eeks
or
66 2
/3%
PIW
W$1
,200
Unt
il inj
ured
wor
ker
Non
e$3
36Ba
sed
on w
hole
$1,2
00$3
00,0
00 o
r D
akot
aM
MI 2
60 w
eeks
qual
ifies
for n
orm
al
body
impa
irmen
t,de
ath
old
age
Socia
l
up to
100
% lu
mp
Secu
rity
bene
fitsu
m p
aym
ent
Ohi
o7
days
14 d
ays
$311
$932
; $62
1 if
Dur
atio
n of
TTD
72%
PIW
W fo
r $9
32N
oN
one
$311
225
wee
ks$9
32N
one
getti
ng S
ocia
l di
sabi
lityth
e fir
st 1
2 w
eeks
; Se
curit
y66
2/3
% th
erea
fter
Ret
irem
ent
Okla
hom
a3
days
, N
one
Non
e$6
0710
4 w
eeks
, with
70
% A
WW
$868
15 y
ears
or u
pon
Non
e$3
2335
0 w
eeks
Spou
se =
Non
e TT
D o
nly
addi
tiona
l 52
reac
hing
Soc
ial
$607
w
eeks
if
Secu
rity
retir
emen
t W
ith
cons
eque
ntia
lag
e, w
hich
ever
C
hild
ren
inju
ry fo
und
is lo
nger
= $
867.
71
Ore
gon
3 da
ys14
day
sN
ot le
ss th
an$1
,339
Dur
atio
n of
66
2/3
% P
IWW
$1,3
39 x
Life
time
plus
ben
e-N
one
$1,3
39n/
aSp
ouse
=
Non
e $5
0 or
90%
TT
D d
isabi
lityfit
s to
sur
vivin
g $6
72
AWW
; whi
ch-
spou
se a
nd
With
Chi
ldre
n ev
er is
less
child
ren
= $1
,339
Penn
sylva
nia
7 da
ys14
day
s90
% A
WW
$1,0
49D
urat
ion
of T
DD
66 2
/3%
$1,0
49D
isabi
lity u
p to
N
one
$1,0
4950
0 w
eeks
$1,0
49N
one
if AW
W is
disa
bility
sub
ject
50
0 w
eeks
$5
24.5
0 or
to c
onve
rsio
n le
ssto
par
tial b
enef
its
at 1
04 w
eeks
y
Rho
de
3 da
ysN
o N
one
$1,2
53, m
axD
urat
ion
of
75%
(of s
pend
able
$1
,253
No
Non
e$1
,253
312
week
s,$1
,253
Non
e Is
land
paym
ent
up to
80%
TT
D d
isabi
lityin
com
e)ex
tend
able
if in
jury
fo
r wai
ting
AWW
caus
es m
ater
ial
perio
d ob
stac
le to
da
ysem
ploy
men
t
Sout
h 7
days
14 d
ays
$75
if w
ages
$846
Up
to 5
00 w
eeks
66 2
/3%
PIW
W$8
46 5
00 w
eeks
z40
3,46
0D
epen
ds o
n 34
0 w
eeks
$846
500
wee
ks
Car
olin
a ar
e >$
75;
sche
dule
d bo
dy
othe
rwise
, pa
rt co
mp
rate
is eq
ual t
o
wag
es
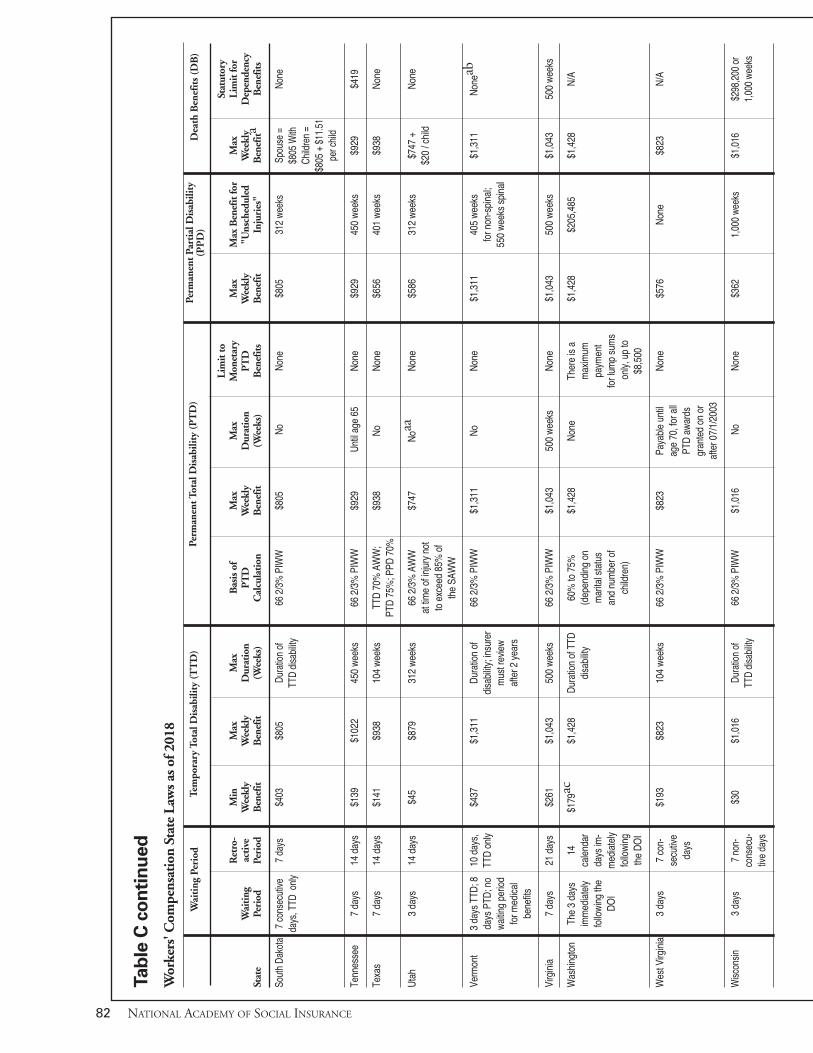
82 NATIONAL ACADEMY OF SOCIAL INSURANCE
Tab
le C
co
nti
nu
ed
Wor
kers
' Com
pens
atio
n St
ate
Law
s as
of 2
018
Lim
it to
St
atut
ory
Ret
ro-
Min
Max
Max
Bas
is o
fM
axM
axM
onet
ary
Max
Max
Ben
efit
for
Max
Lim
it fo
r W
aiti
ngac
tive
Wee
kly
Wee
kly
Dur
atio
nP
TD
Wee
kly
Dur
atio
n P
TD
Wee
kly
"Uns
ched
uled
Wee
kly
Dep
ende
ncy
Stat
ePe
riod
Peri
odB
enef
itB
enef
it(W
eeks
)C
alcu
lati
onB
enef
it(W
eeks
)B
enef
its
Ben
efit
Inju
ries
"B
enef
ita
Ben
efit
s
Sout
h Da
kota
7 co
nsec
utive
7
days
$403
$805
Dura
tion
of
66 2
/3%
PIW
W$8
05No
None
$805
312
week
sSp
ouse
=
None
da
ys, T
TD o
nly
TTD
disa
bility
$805
With
Child
ren
= $8
05 +
$11
.51
per c
hild
Tenn
esse
e7
days
14 d
ays
$139
$102
245
0 w
eeks
66 2
/3%
PIW
W$9
29U
ntil a
ge 6
5N
one
$929
450
wee
ks$9
29$4
19
Texa
s7
days
14 d
ays
$141
$938
104
wee
ksTT
D 7
0% A
WW
; $9
38N
oN
one
$656
401
wee
ks$9
38N
one
PTD
75%
; PPD
70%
Uta
h3
days
14 d
ays
$45
$879
312
wee
ks66
2/3
% A
WW
$747
Noa
aN
one
$586
312
wee
ks$7
47 +
Non
e at
tim
e of
inju
ry n
ot
$20
/ chi
ld
to e
xcee
d 85
% o
f th
e SA
WW
Verm
ont
3 da
ys T
TD; 8
10 d
ays,
$4
37$1
,311
Dur
atio
n of
66
2/3
% P
IWW
$1,3
11N
oN
one
$1,3
1140
5 w
eeks
$1
,311
Non
eab
days
PTD
; no
TTD
onl
ydi
sabi
lity; i
nsur
erfo
r non
-spi
nal;
wai
ting
perio
d m
ust r
evie
w
550
wee
ks s
pina
l fo
r med
ical
afte
r 2 y
ears
be
nefit
s
Virg
inia
7 da
ys21
day
s$2
61$1
,043
500
wee
ks66
2/3
% P
IWW
$1,0
4350
0 w
eeks
Non
e$1
,043
500
wee
ks$1
,043
500
wee
ks
Was
hing
ton
The
3 da
ys14
$179
ac$1
,428
Dur
atio
n of
TTD
60%
to 7
5%$1
,428
Non
eTh
ere
is a
$1,4
28$2
05,4
85$1
,428
N/A
imm
edia
tely
cale
ndar
disa
bility
(d
epen
ding
on
max
imum
fo
llow
ing
the
days
im-
mar
ital s
tatu
spa
ymen
t D
OI
med
iate
ly
and
num
ber o
f fo
r lum
p su
ms
follo
win
gch
ildre
n) o
nly,
up
to
th
e D
OI
$8,5
00
Wes
t Virg
inia
3 da
ys7
con-
$193
$823
104
wee
ks66
2/3
% P
IWW
$823
Paya
ble
until
Non
e$5
76N
one
$823
N/A
se
cutiv
e ag
e 70
, for
all
days
PTD
aw
ards
gr
ante
d on
or
afte
r 07/
1/20
03
Wisc
onsin
3 da
ys7
non-
$30
$1,0
16Du
ratio
n of
66
2/3
% P
IWW
$1,0
16No
None
$362
1,00
0 we
eks
$1,0
16$2
98,2
00 o
r co
nsec
u-
TTD
disa
bility
1,00
0 we
eks
tive
days
Dea
th B
enef
its
(DB
)Pe
rman
ent P
arti
al D
isab
ility
(P
PD
)Pe
rman
ent T
otal
Dis
abili
ty (
PT
D)
Tem
pora
ry T
otal
Dis
abili
ty (
TT
D)
Wai
ting
Per
iod
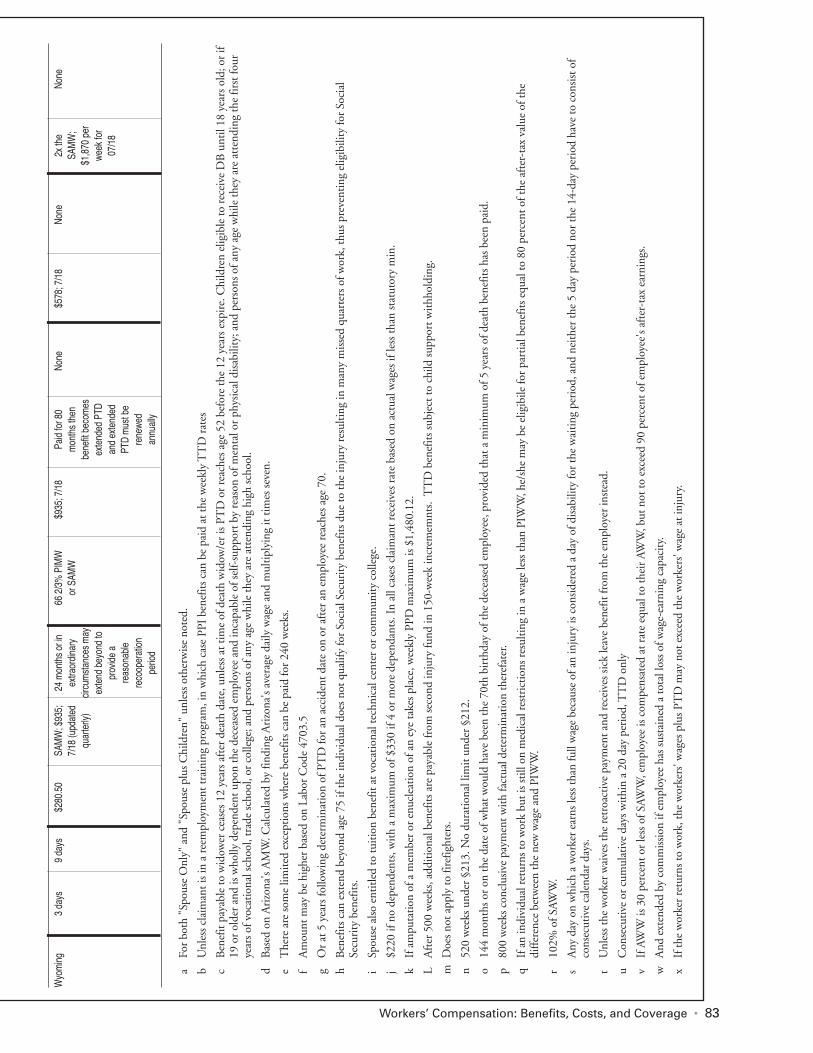
Workers’ Compensation: Benefits, Costs, and Coverage • 83
Wyo
min
g3
days
9 da
ys$2
80.5
0SA
MW
; $93
5;
24 m
onth
s or
in
66 2
/3%
PIM
W
$93
5; 7
/18
Paid
for 8
0 No
ne$5
78; 7
/18
None
2x th
e No
ne
7/18
(upd
ated
ex
traor
dina
ry
or S
AMW
mon
ths
then
SA
MW
; qu
arte
rly)
circu
mst
ance
s m
ay
bene
fit b
ecom
es
$1,8
70 p
er
exte
nd b
eyon
d to
ex
tend
ed P
TD
week
for
pr
ovid
e a
and
exte
nded
07
/18
reas
onab
le
PTD
mus
t be
re
coop
erat
ion
rene
wed
pe
riod
annu
ally
aFo
r bo
th "
Spou
se O
nly"
and
"Sp
ouse
plu
s C
hild
ren"
unl
ess
othe
rwis
e no
ted.
bU
nles
s cl
aim
ant i
s in
a r
eem
ploy
men
t tra
inin
g pr
ogra
m, i
n w
hich
cas
e PP
I be
nefit
s ca
n be
pai
d at
the
wee
kly
TT
D r
ates
cB
enef
it pa
yabl
e to
wid
ower
cea
ses
12 y
ears
aft
er d
eath
dat
e, u
nles
s at
tim
e of
dea
th w
idow
/er
is P
TD
or
reac
hes
age
52 b
efor
e th
e 12
yea
rs e
xpir
e. C
hild
ren
elig
ible
to r
ecei
ve D
B u
ntil
18 y
ears
old
; or
if 19
or
olde
r an
d is
who
lly d
epen
dent
upo
n th
e de
ceas
ed e
mpl
oyee
and
inca
pabl
e of
sel
f-su
ppor
t by
reas
on o
f men
tal o
r ph
ysic
al d
isab
ility
; and
per
sons
of a
ny a
ge w
hile
they
are
att
endi
ng th
e fir
st fo
ur
year
s of
voc
atio
nal s
choo
l, tr
ade
scho
ol, o
r co
llege
; and
per
sons
of a
ny a
ge w
hile
they
are
att
endi
ng h
igh
scho
ol.
dB
ased
on
Ari
zona
's A
MW
. Cal
cula
ted
by fi
ndin
g A
rizo
na's
aver
age
daily
wag
e an
d m
ultip
lyin
g it
times
sev
en.
eT
here
are
som
e lim
ited
exce
ptio
ns w
here
ben
efits
can
be
paid
for
240
wee
ks.
fA
mou
nt m
ay b
e hi
gher
bas
ed o
n La
bor
Cod
e 47
03.5
gO
r at
5 y
ears
follo
win
g de
term
inat
ion
of P
TD
for
an a
ccid
ent d
ate
on o
r af
ter
an e
mpl
oyee
rea
ches
age
70.
hB
enef
its c
an e
xten
d be
yond
age
75
if th
e in
divi
dual
doe
s no
t qua
lify
for
Soci
al S
ecur
ity b
enef
its d
ue to
the
inju
ry r
esul
ting
in m
any
mis
sed
quar
ters
of w
ork,
thus
pre
vent
ing
elig
ibili
ty fo
r So
cial
Se
curi
ty b
enef
its.
iSp
ouse
also
ent
itled
to tu
ition
ben
efit
at v
ocat
iona
l tec
hnic
al c
ente
r or
com
mun
ity c
olle
ge.
j$2
20 if
no
depe
nden
ts, w
ith a
max
imum
of $
330
if 4
or m
ore
depe
ndan
ts. I
n al
l cas
es c
laim
ant r
ecei
ves
rate
bas
ed o
n ac
tual
wag
es if
less
than
sta
tuto
ry m
in.
kIf
am
puta
tion
of a
mem
ber
or e
nucl
eatio
n of
an
eye
take
s pl
ace,
wee
kly
PPD
max
imum
is $
1,48
0.12
.
LA
fter
500
wee
ks, a
dditi
onal
ben
efits
are
pay
able
from
sec
ond
inju
ry fu
nd in
150
-wee
k in
crem
emnt
s. T
TD
ben
efits
sub
ject
to c
hild
sup
port
with
hold
ing.
mD
oes
not a
pply
to fi
refig
hter
s.
n52
0 w
eeks
und
er §
213.
No
dura
tiona
l lim
it un
der
§212
.
o14
4 m
onth
s or
on
the
date
of w
hat w
ould
hav
e be
en th
e 70
th b
irth
day
of th
e de
ceas
ed e
mpl
oyee
, pro
vide
d th
at a
min
imum
of 5
yea
rs o
f dea
th b
enef
its h
as b
een
paid
.
p80
0 w
eeks
con
clus
ive
paym
ent w
ith fa
ctua
l det
erm
inat
ion
ther
efat
er.
qIf
an
indi
vidu
al r
etur
ns to
wor
k bu
t is
still
on
med
ical
res
tric
tions
res
ultin
g in
a w
age
less
than
PIW
W, h
e/sh
e m
ay b
e el
igib
ile fo
r pa
rtia
l ben
efits
equ
al to
80
perc
ent o
f the
aft
er-t
ax v
alue
of t
he
diff
eren
ce b
etw
een
the
new
wag
e an
d PI
WW
.
r10
2% o
f SAW
W.
sA
ny d
ay o
n w
hich
a w
orke
r ea
rns
less
than
full
wag
e be
caus
e of
an
inju
ry is
con
side
red
a da
y of
dis
abili
ty fo
r th
e w
aitin
g pe
riod
, and
nei
ther
the
5 da
y pe
riod
nor
the
14-d
ay p
erio
d ha
ve to
con
sist
of
cons
ecut
ive
cale
ndar
day
s.
tU
nles
s th
e w
orke
r w
aive
s th
e re
troa
ctiv
e pa
ymen
t and
rec
eive
s si
ck le
ave
bene
fit fr
om th
e em
ploy
er in
stea
d.
uC
onse
cutiv
e or
cum
ulat
ive
days
with
in a
20
day
peri
od, T
TD
onl
y
vIf
AW
W is
30
perc
ent o
r le
ss o
f SAW
W, e
mpl
oyee
is c
ompe
nsat
ed a
t rat
e eq
ual t
o th
eir
AWW
, but
not
to e
xcee
d 90
per
cent
of e
mpl
oyee
's af
ter-
tax
earn
ings
.
wA
nd e
xten
ded
by c
omm
issi
on if
em
ploy
ee h
as s
usta
ined
a to
tal l
oss
of w
age-
earn
ing
capa
city
.
xIf
the
wor
ker
retu
rns
to w
ork,
the
wor
kers
' wag
es p
lus
PTD
may
not
exc
eed
the
wor
kers
' wag
e at
inju
ry.
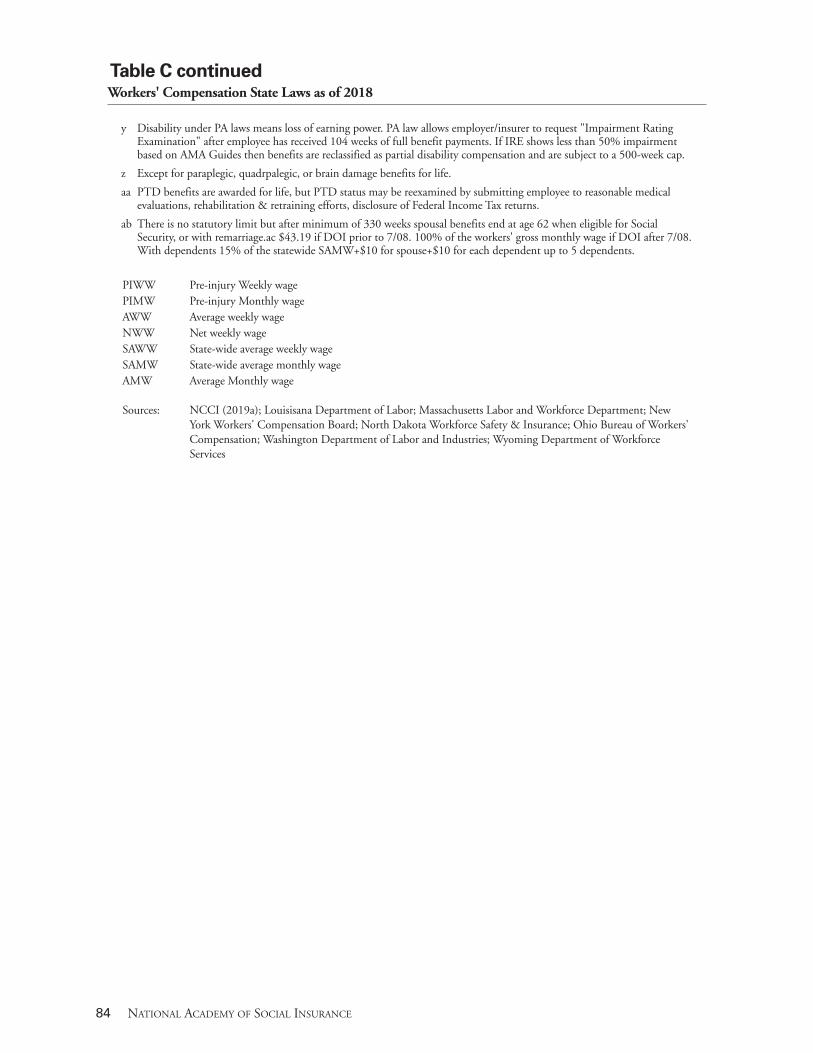
84 NATIONAL ACADEMY OF SOCIAL INSURANCE
Table C continued Workers' Compensation State Laws as of 2018
y Disability under PA laws means loss of earning power. PA law allows employer/insurer to request "Impairment Rating
Examination" after employee has received 104 weeks of full benefit payments. If IRE shows less than 50% impairment based on AMA Guides then benefits are reclassified as partial disability compensation and are subject to a 500-week cap.
z Except for paraplegic, quadrpalegic, or brain damage benefits for life.
aa PTD benefits are awarded for life, but PTD status may be reexamined by submitting employee to reasonable medical evaluations, rehabilitation & retraining efforts, disclosure of Federal Income Tax returns.
ab There is no statutory limit but after minimum of 330 weeks spousal benefits end at age 62 when eligible for Social Security, or with remarriage.ac $43.19 if DOI prior to 7/08. 100% of the workers' gross monthly wage if DOI after 7/08. With dependents 15% of the statewide SAMW+$10 for spouse+$10 for each dependent up to 5 dependents.
PIWW Pre-injury Weekly wage PIMW Pre-injury Monthly wage AWW Average weekly wage NWW Net weekly wage SAWW State-wide average weekly wage SAMW State-wide average monthly wage AMW Average Monthly wage Sources: NCCI (2019a); Louisisana Department of Labor; Massachusetts Labor and Workforce Department; New
York Workers' Compensation Board; North Dakota Workforce Safety & Insurance; Ohio Bureau of Workers' Compensation; Washington Department of Labor and Industries; Wyoming Department of Workforce Services
In most states, the direct costs of workers’ compensa-tion programs are paid by employers either by purchasing insurance from private carriers or state funds or by self-insuring employers paying the costs directly. In three states, however, a portion of the direct costs of workers’ compensation is paid by employees. States Where Costs Are Paid by Employees
New Mexico applies a per capita assessment based on employment on the last day of the quarter. Since 2004, the quarterly workers’ compensation fee is $4.30 per covered worker, which is split between employers and employees. The employers’ share is $2.30 per covered worker and the employees’ share is $2.00. Most of the total fee ($4.00 — $2.00 from employers and $2.00 from employees) is now used primarily to fund the operation of the New Mexico Workers’ Compensation Administration. (Funds from General Revenue previously paid for these administrative costs.) The additional $0.30 per covered worker is paid by employers to fund the Workers’ Compensation Uninsured Employers Fund. Oregon assesses employers and employees for the Workers Benefit Fund, which pays monthly cost-of-living increases for workers. Between April of 2013 and 2016, the Oregon Workers Benefit Fund Assessment was 3.3 cents per hour worked – employ-ers paid 1.65 cents and workers paid 1.65 cents per hour. In 2017, the assessment fell to 2.8 cents per hour worked—1.4 cents per hour for each party. Washington employees pay part of the workers’ compensation premium costs through payroll deductions. These deductions go toward state fund medical benefits and cost-of-living adjustments for the Supplemental Pension Fund. In 2017, employees contributed 25.0 percent of state fund premiums and paid half of the cost-of-living adjustment premium for the aforementioned fund.
Treatment of the Costs Paid by Employees in Past Reports Prior to this year, costs paid by workers in Washington were included as costs of the program, but not the costs paid by workers in New Mexico and Oregon.80 There are four reasons why all payments by workers to a workers’ compensation program should be included as costs of the program.
(1) To provide results that are consistent among all states;
(2) To provide a more accurate measure of the costs of workers’ compensation programs;
(3) The benefits received by injured workers who paid for part of the costs of workers’ compensa-tion in New Mexico and Oregon are included in the NASI data for those states, and it is mis-leading to include the benefits but not the costs;
(4) Most labor economists recognize the distinction between the nominal incidence of the costs of a program and the actual incidence. For example, most employers bear the nominal incidence of workers’ compensation insurance because the premiums are paid by those employers. However, a substantial portion of the actual cost of workers’ compensation is paid by work-ers in the form of lower wages than the workers would have received in the absence of workers’ compensation. A review of the theory and empirical findings by Chelius and Burton (1994, 26) reached this conclusion: “a substan-tial portion of workers’ compensation costs (and even, according to some estimates, all of the costs) are shifted onto workers. [emphasis in original]” While the degree of cost shifting to workers may have changed to some degree since the 1990s, the general notion that the assessing the costs of a program by focusing solely on the nominal share paid by employers is still an invalid and misleading approach.81
Workers’ Compensation: Benefits, Costs, and Coverage • 85
Appendix D: Workers’ Compensation Costs Paid by Employees
80 McLaren, Baldwin, and Boden (2018) a note in Table 13. Workers’ Compensation Cost by Type of Insurer, 1996-2016 indicates
that “Employee contributions to workers’ compensation costs in Washington state are included in the total from 2011 to 2016.”
81 Leigh et al. (2009) is another study that concludes workers pay a substantial portion of workers’ compensation program costs indi-rectly in the form of lower wages.
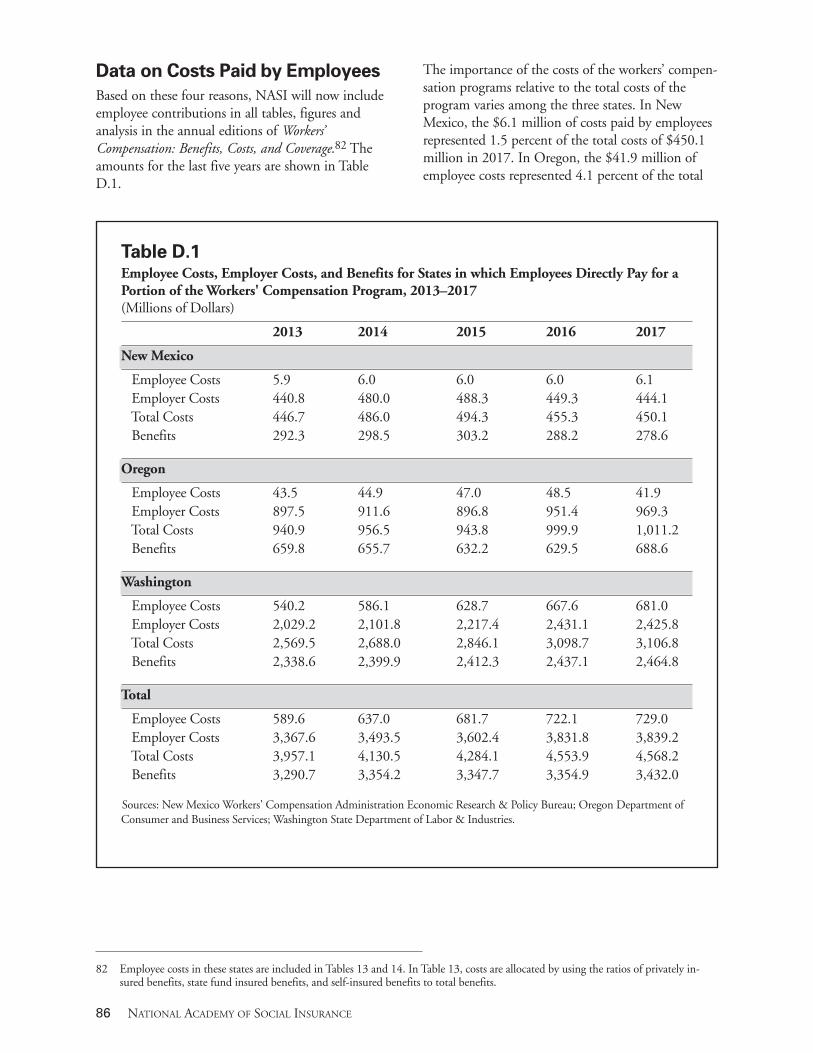
86 NATIONAL ACADEMY OF SOCIAL INSURANCE
Data on Costs Paid by Employees
Based on these four reasons, NASI will now include employee contributions in all tables, figures and analysis in the annual editions of Workers’ Compensation: Benefits, Costs, and Coverage.82 The amounts for the last five years are shown in Table D.1.
The importance of the costs of the workers’ compen-sation programs relative to the total costs of the program varies among the three states. In New Mexico, the $6.1 million of costs paid by employees represented 1.5 percent of the total costs of $450.1 million in 2017. In Oregon, the $41.9 million of employee costs represented 4.1 percent of the total
Table D.1 Employee Costs, Employer Costs, and Benefits for States in which Employees Directly Pay for a Portion of the Workers' Compensation Program, 2013–2017 (Millions of Dollars)
2013 2014 2015 2016 2017
New Mexico
Employee Costs 5.9 6.0 6.0 6.0 6.1 Employer Costs 440.8 480.0 488.3 449.3 444.1 Total Costs 446.7 486.0 494.3 455.3 450.1 Benefits 292.3 298.5 303.2 288.2 278.6
Oregon
Employee Costs 43.5 44.9 47.0 48.5 41.9 Employer Costs 897.5 911.6 896.8 951.4 969.3 Total Costs 940.9 956.5 943.8 999.9 1,011.2 Benefits 659.8 655.7 632.2 629.5 688.6
Washington
Employee Costs 540.2 586.1 628.7 667.6 681.0 Employer Costs 2,029.2 2,101.8 2,217.4 2,431.1 2,425.8 Total Costs 2,569.5 2,688.0 2,846.1 3,098.7 3,106.8 Benefits 2,338.6 2,399.9 2,412.3 2,437.1 2,464.8
Total
Employee Costs 589.6 637.0 681.7 722.1 729.0 Employer Costs 3,367.6 3,493.5 3,602.4 3,831.8 3,839.2 Total Costs 3,957.1 4,130.5 4,284.1 4,553.9 4,568.2 Benefits 3,290.7 3,354.2 3,347.7 3,354.9 3,432.0 Sources: New Mexico Workers' Compensation Administration Economic Research & Policy Bureau; Oregon Department of Consumer and Business Services; Washington State Department of Labor & Industries.
82 Employee costs in these states are included in Tables 13 and 14. In Table 13, costs are allocated by using the ratios of privately in-
sured benefits, state fund insured benefits, and self-insured benefits to total benefits.
Workers’ Compensation: Benefits, Costs, and Coverage • 87
costs of $1,011.2 million for the workers’ compensa-tion program in 2017. In Washington, the employee contributions were much more significant. The costs paid by employees of $681 million represented 21.9 percent of the total costs of $3,106.8 million in Washington in 2017. For the three states in combination, employee contributions of $729 mil-lion were 16.0 percent of total costs in 2017. From a
national perspective, the total costs of all U.S. workers’ compensation programs were $97,371 million, as show in Table 13, of which employee contribution in the three states of $729 million represented only 0.7% of the national total. Nonetheless, the inclusion of the costs of the program paid by employees provides a more accurate measure of the magnitude of the program.
88 NATIONAL ACADEMY OF SOCIAL INSURANCE
A.M. Best. 2019. Private Data Request. Oldwick, NJ: A.M. Best.
Azaroff, Lenore S., Charles Levenstein, and David Wegman. 2002. “Occupational Injury and Illness Surveillance: Conceptual Filters Explain Underreporting.” American Journal of Public Health 92 (9): 1421-1429.
Barth, Peter, and Michael Niss. 1999. Permanent Partial Disability Benefits: Interstate Differences. Cambridge, MA: Workers Compensation Research Institute.
Berkowitz, Edward D., and Monroe Berkowitz. 1985. “Challenges to workers’ compensation: An historical analy-sis.” Workers’ Compensation Benefits: Adequacy, Equity, and Efficiency (1985): 158-179.
Biddle, Jeff, Karen Roberts, Kenneth D. Rosenman, and Edward M. Welch. 1998. “What Percentage of Workers with Work-Related Illness Receive Workers’ Compensation Benefits?” Journal of Occupational and Environmental Medicine 40 (4): 325 – 331.
Boden, Leslie I., Robert T. Reville, and Jeff Biddle. 2005. “The Adequacy of Workers’ Compensation Cash Benefits.” Workplace Injuries and Diseases: Prevention and Compensation—Essays in Honor of Terry Thomason, W.E. Upjohn Institute for Employment Research: 37-68.
Boden, Leslie I., and Al Ozonoff. 2008. “Capture-Recapture Estimates of Nonfatal Workplace Injuries and Illnesses.” Annals of Epidemiology, 18 (6): 500-506.
Burton, John F., Jr. 2008. “Workers’ Compensation Cash Benefits: Part Two: Cash Benefit Systems and Criteria for Evaluation.” Workers Compensation Policy Review 8 (6): 1331.
———. 2013. “Workers’ Compensations Costs for Employers, National and State Data.” Workers’ Compensation Resources Research Report 6:3-26.
———. 2015. “Workers Compensation Costs for Employers: 1986-2014.” Workers’ Compensation Resources Research Report 10: 1-23.
Burton, John F., Jr. 2017. Chapter 20: Workers’ Compensation, in Employment Law: Cases and Materials, Sixth Edition. Willborn Steven L., Stewart J. Schwab, John F. Burton Jr., and Gillian L. L. Lester. Carolina Academic Press. Durham, NC.
Burton, John F., Jr. and Daniel J.B. Mitchell. 2003. “Employee Benefits and Social Insurance: The Welfare Side of Employee Relations.” Industrial Relations to Human Resources and Beyond, Bruce E. Kaufman, Richard A. Beaumont, and Roy B. Helfgot (Eds.) Armond, NY: M.E. Sharpe.
Burton, John F., Jr. and Xuguang (Steve) Guo. 2016. “Improving the Interaction Between the SSDI and Workers’ Compensation Programs,” SSDI Solutions: Ideas to Strengthen the Social Security Disability Insurance Programs,
Jim McCrery and Earl Pomeroy (Eds.). West Conshohocken, PA: Infinity Publishing.
Centers for Medicare & Medicaid Services (CMS). 2019. Private data request.
Chelius, James R. and John F. Burton, Jr. 1994. “Who Actually Pays for Workers’ Compensation? The Empirical Evidence.” Workers’ Compensation Monitor, Vol. 7, No.6 (November/December): 20-27.
Clayton, Ann. 2004. “Workers’ Compensation: A Background for Social Security Professionals.” Social Security Bulletin 65 (4): 715.
Duff, Michael C. 2018. “Wyoming’s Strange Workers’ Compensation Non-Relationship with Walmart.” Workers’ Compensation Law Prof Blog. Accessed July 6, 2018. Retrieved from: https://workerscompprof.com/2018/06/18/wyomings-strange-workers-compensation-non-relationship-with-walmart-workers-compensation-law-prof-blog/.
Duff, Michael C. 2019. Wyoming Workers’ Compensation: A Treatise of Wyoming Workers’ Compensation Law. (Forthcoming).
Fan, Zihong Joyce, David K. Bonauto, Michael P. Foley, and Barbara A. Silverstein. 2006. “Underreporting of Work-Related Injury or Illness to Workers’ Compensation: Individual and Industry Factors.” Journal of Occupational and Environmental Medicine, 48 (9): 914-922.
Fishback, Price V., and Shawn Everett Kantor. 1996. “The Adoption of Workers’ Compensation in the United States, 1900-1930.” NBER Working Paper Series 5840.
Fomenko, Olesya, and Jonathan Gruber. 2016. “Do Higher Fee Schedules Increase the Number of Workers’ Compensation Cases?” Cambridge, MA: Workers Compensation Research Institute WC-16-21.
Galizzi, Monica, Petra Miesmaa, Laura Punnett, Craig Slatin, and PHASE. 2010. “Injured Workers’ Underreporting in the Health Care Industry.” Industrial Relations 49:22-42.
Glynn, Sarah Jane, Alexandra L. Bradley, and Benjamin W. Veghte. 2017. Paid Family and Medical Leave Programs: State Pathways an Design Options. Washington, DC: National Academy of Social Insurance.
Grabell, Michael, and Howard Berkes. 2015. “The Demolition of Workers’ Comp.” ProPublica.
Guo, X. S. and J. F. Burton. 2010. “Workers’ compensation: recent developments in moral hazard and benefit payments.” Industrial & Labor Relations Review 63(2)
Guo, Xuguang (Steve), and John F. Burton, Jr. 2012. “The Growth in Applications for Social Security Disability Insurance: A Spillover Effect from Workers’ Compensation.” Social Security Bulletin 72(3): 69-88.
References
Hunt, H. Allan. 2004. Adequacy of Earnings Replacement in Workers’ Compensation Programs. Washington DC: National Academy of Social Insurance and W.E. Upjohn Institute for Employment Research.
Hunt, H. Allen and Marcus Dillender. 2017. Workers’ Compensation: Analysis for its Second Century. W. E. Upjohn Institute. Kalamazoo, MI.
Integrated Public Use Microdata Series – Current Population Survey (IPUMS-CPS). 2019. Current Population Survey Data for Social, Economic and Health Research.
Krohm, Gregory C. 2011. “Wisconsin’s Role in Pioneering Workers’ Compensation.” In Reflections on the History and Development of Workers’ Compensation in the United States, Gregory C. Krohm (Ed), 185-93. Madison, WI: International Association of Industrial Accident Boards and Commissions.
Lashuay, Nan, and Robert Harrison. 2006. “Barriers to Occupational Health Services for Low-Wage Workers in California.” Commission on Health and Safety and Workers’ Compensation, California Department of Industrial Relations.
Leigh, J. Paul, Steven Markowitz, Marianne Fahs, and Philip Landrigan. 2000. Costs of Occupational Injuries and Illnesses. Ann Arbor, MI: The University of Michigan Press.
Leigh, J. Paul, and James P. Marcin. 2012. “Workers’ Compensation Benefits and Shifting Costs for Occupational Injury and Illness.” Journal of Environmental Medicine 54:4): 445-450.
Manley, Mike. 2013. “Comments on Workers’ Compensation Costs for Employers: National and State Data.” Workers’ Compensation Resources Research Report, Supplement 6: 3-5.
McInerney, Melissa, and Kosali Simon. 2012. “The Effect of State Workers’ Compensation Program Changes on the Use of Federal Social Security Disability Insurance.” Industrial Relations 51(1): 1-177.
Milton, Donald K., Gina M. Solomon, Richard A. Rosiello, and Robert F. Herrick. 1998. “Risk and Incidence of Asthma Attributable to Occupational Exposure among HMO Members.” American Journal of Industrial Medicine 33: 110.
Morse, Timothy F., Charles Dillon, Nicholas Warren, Charles Levenstein and Andrew Warren. 1998. “The Economic and Social Consequences of Work-Related Musculoskeletal Disorders: The Connecticut Upper Extremity Surveillance Project (CUSP).” International Journal of Occupational & Environmental Health 4: 209-216.
National Association of Insurance Commissioners (NAIC). 2019. Statistical Compilation of Annual Statement Information for Property/Casualty Insurance Companies in 2017. Kansas City, MO: NAIC- Similar publications for the years 1999-2017.
National Conference of State Legislatures (NCSL). 2013. 2013 Workers Compensation Enacted Legislation. Washington, DC: NCSL.
National Council on Compensation Insurance, Inc. (NCCI). 2019. Private Data Request. Boca Raton, FL: NCCI.
———. 2019a. Annual Statistical Bulletin, ed. 2019. Boca Raton, FL: NCCI. Similar publications for the years 1997-2018.
Neuhauser, Frank, Jasjeet Sekhon, Mark Priven, Rena David, Nicola Wells, Christine Baker, and Jon Stiles. 2010. “Integration of Occupational Medical Care into Health Insurance: An Answer to Financing Universal Coverage?” U.C. Berkeley Institute for the Study of Societal Issues Working Paper. Berkeley, CA.
Occupational Safety & Health Administration (OSHA). 2015. Adding Inequality to Injury: The Costs of Failing to Protect Workers on the Job. U.S. Department of Labor, OSHA.
O’Leary, Paul, Leslie I. Boden, Seth A. Seabury, Al, Ozonoff, and Ethan Scherer. 2012. “Workplace Injuries and the Take-Up of Social Security Disability Benefits.” Social Security Bulletin 72(3): 1- 17
Oklahoma Workers’ Compensation Commission 2018. State of Oklahoma Workers’ Compensation Commission 2017 Annual Report. Oklahoma City, OK.
Oregon Department of Consumer and Business Services. 2018. Oregon Workers’ Compensation Premium Rate Rankings: Calendar Year 2018. Central Services Division, Information and Research Section.
Parrott, James and Nicholas B. Martin. 2019. Time for a Real Look at How the New York State Workers’ Compensation System Treats Workers. The New School, Center for New York City Affairs. New York, NY.
Pransky, Glenn, Terry Snyder, Allard Dembe, and Jay Himmelstein. 1999. “Under Reporting of Work Related Disorders in the Workplace: A Case Study and Review of the Literature.” Ergonomics 42: 171-182.
Qiu, Yue and Michael Grabell. 2015. “Workers’ Compensation Reforms by State,” ProPublica. March.
Rappin, Christina L., Sara E. Wuellner, and David K. Bonauto. 2016. “Employer Reasons for Failing to Report Eligible Workers’ Compensation Claims in the BLS Survey of Occupational Injuries and Illnesses.” American Journal of Industrial Medicine 59 (5): 343-356.
Reville, Robert T., Leslie I. Boden, J. Biddle and C. Mardesich. 2001. An Evaluation of New Mexico Workers’ Compensation Permanent Partial Disability and Return to Work. Rand Institute for Civil Justice, Santa Monica, CA.
Reville, Robert T., and Robert F. Schoeni. 2004. “The Fraction of Disability Caused at Work.” Social Security Bulletin 65(4): 31-37.
Rosenman, Kenneth D., Alice Kalush, Mary Jo Reilly, Joseph C. Reeves, Mathew J. Reeves, and Luo Zhehui. 2006. “How Much Work-Related Injury and Illness is Missed by the Current National Surveillance System?” Journal of Occupational and Environmental Medicine 48 (4): 357-365.
Workers’ Compensation: Benefits, Costs, and Coverage • 89
Ruser, John William and Leslie I. Boden. 2003. “Workers’ Compensation ‘Reforms,’ Choice of Medical Care Provider, and Reported Workplace Injuries.” Review of Economics and Statistics 85(4):923-929, February.
Seabury, Seth A., Ethan Scherer, Paul O’Leary, Al Ozonoff, and Leslie I. Boden. 2014. “Using Linked Federal and State Data to Study the Adequacy of Workers’ Compensation Benefits.” American Journal of Industrial Medicine 57 (10): 1165-1173.
Social Security Administration (SSA). 2018. Office of Research, Evaluation, and Statistics. Annual Statistical Supplement, 2017. Washington, DC: SSA
———. 2018a. The 2017 Annual Report of the Board of Trustees of the Federal Old Age and Survivors Insurance and Disability Insurance Trust Funds. Washington, DC: SSA.
———. 2019. Unpublished Data from the Office of Disability. Baltimore, MD:SSA.
Somers, Herman Miles and Anne Ramsay Somers. 1954. Workmen’s Compensation: Prevention, Insurance, and Rehabilitation of Occupational Disability. Wiley Press.
Spieler, Emily A., and John F. Burton, Jr. 2012. “The Lack of Correspondence between Work Related Disability and Receipt of Workers’ Compensation Benefits.” American Journal of Industrial Medicine 55: 487-505.
Spieler, Emily A. 2017. “(Re)assessing the Grand Bargain: Compensation for Work Injuries in the United States, 1900-2017.” Rutgers University Law Review 69:891-1014.
Stanbury, Martha, Patrick Joyce, and Howard Kipen. 1995. “Silicosis and Workers’ Compensation in New Jersey.” Journal of Occupational Environmental Medicine 37:1342-1347.
Strunin, Lee, and Leslie I. Boden. 2004. “The Workers’ Compensation System: Worker Friend or Foe?” American Journal of Industrial Medicine 45 (4):338-345.
Tennessee Bureau of Workers’ Compensation. 2017. Annual Report to the General Assembly of the State of Tennessee on the Impact of the 2013 Workers’ Compensation Reform Act. Nashville, TN: Tennessee Bureau of Workers’ Compensation.
Texas Department of Insurance (TDI). 2018. Employer Participation in the Texas Workers’ Compensation System: 2018 Estimates. Dallas, TX: Texas Department of Insurance Workers’ Compensation Research and Evaluation Group.
Thomason, Terry, Timothy P. Schmidle, and John F. Burton, Jr. 2001. Workers’ Compensation: Benefits, Costs, and Safety under Alternative Insurance Arrangements. Kalamazoo, MI: W.E. Upjohn Institute for Employment Research.
U.S. Census Bureau. 2005. The Number of Firms and Establishments, Employment, Annual Payroll, and Receipts in 1997 by Industry and Employment Size of Enterprise. Washington, DC: U.S. Census Bureau.
———. 2017. Statistics of U.S. Business (SUSB), 2015. Washington, DC: U.S. Census Bureau.
U.S. Department of Justice (DOJ). 2019. Radiation Exposure Compensation Act. Washington, DC: U.S. DOJ.
U.S. Department of Labor (DOL). 2008. An Interim Report to Congress on Occupational Diseases. Assistant Secretary for Policy Evaluation and Research. Washington, DC.
———.2018. Bureau of Labor Statistics. National Census of Fatal Occupational Injuries in 2017. Washington, DC: U.S. DOL.
———. 2018a. Bureau of Labor Statistics. Survey of Occupational Injuries and Illnesses, 2017. Washington, DC: U.S. DOL.
———. 2018b. Bureau of Labor Statistics. Quarterly Census of Employment and Wages. Washington, DC: U.S. DOL.
———. 2018c. Bureau of Labor Statistics. National Compensation Survey: Employee Benefits in the United States, March 2018. Washington, DC: U.S. DOL.
———. 2018d. Bureau of Labor Statistics. Current Population Survey. Washington, DC: U.S. DOL.
———. 2019. Private Data request from the Office of Workers’ Compensation Program. U.S. DOL.
———. 2019a. Bureau of Labor Statistics. Employer Costs for Employee Compensation – March 2019. USDL-19-0944. Washington, DC: U.S. DOL.
U.S. Department of Veterans Affairs (VA): Veterans Benefit Administration. 2018. Annual Benefits Report, Fiscal Year 2017. Washington, DC: U.S. Department of Veterans Affairs.
U.S. Government Accountability Office (GAO). 2009. Enhancing OSHA’s Records Audit Process Could Improve the Accuracy of Worker Injury and Illness Data. Washington, DC: GAO-10-10.
Victor, R. A. and L. L. .Carrubba. 2010. “Workers’ com-pensation: where have we come from,” Cambridge, MA, Workers Compensation Research Institute: 215-234
Victor, Richard A., Olesya Fomenko, and Jonathon Gruber. 2015. Will the Affordable Care Act Shift Claims to Workers’ Compensation Payors? Cambridge, MA: Workers Compensation Research Institute WC-15-26.
Wuellner, Sara, and Polly Phipps. 2018. “Employer knowl-edge of federal requirements for recording work?related injuries and illnesses: Implications for occupational injury surveillance data.” American Journal of Industrial Medicine 61.5: 422-435.
Willborn, Steven L., Steward J. Schwab, John F. Burton, Jr., and Gillian L. L. Lester. 2017. Employment Law: Cases and Materials (Sixth Edition). Durham, NC: Carolina Academic Press.
Williams, C. Arthur, and Peter S. Barth. 1973. Compendium on Workmen’s Compensation. Washington, DC: National Commission on State Workmen’s Compensation Laws.
90 NATIONAL ACADEMY OF SOCIAL INSURANCE

www.nasi.org ISBN: 978-1-7328883-1-9