Embed Size (px)
Citation preview

Workforce Education Financial Aid and
Student Access and Retention
A Report to the Washington State Legislature
November 2006
Workforce Training and Education Coordinating Board

Workforce Education Financial Aid and Student Access and Retention Executive Summary Introduction The 2006 Washington Legislature included a proviso in the supplemental budget directing the Workforce Training and Education Coordinating Board (Workforce Board) to conduct a study of financial aid for workforce education students. The budget proviso requests that the Workforce Board study: • Barriers to student access and completion of workforce education programs. • The funding gap between available workforce education aid and the financial needs of
students. • Consolidating and simplifying the delivery of workforce education aid. The purpose of study is to assist the Legislature in achieving the goal of easier access and increased retention for workforce education students.1
Summary of Findings and Recommendations
Barriers to Student Access and Completion: The below factors stand out as the most common important barriers to student access and completion (roughly in rank order of significance). Among these, financial issues are by far the most frequent barriers.
• Financial costs of tuition, fees, and living expenses. • Lack of information about training opportunities and financial aid. • Child care. • Time involved and location of training opportunities. • Academic preparation.
Actions to Reduce Barriers to Student Access and Completion
• Increase financial aid. • Provide more accessible and comprehensive information about training
opportunities and financial aid. • Provide comprehensive support services, including child care, tutoring, and
transportation assistance. • Provide more convenient training opportunities, such as on the job training.
1 Although the term “workforce education” is not defined in the budget proviso, discussions with legislators and staff indicated that the primary focus for the study should be community or technical college occupational (or vocational) skills training.
ii

• Integrate Adult Basic Education/English as a Second Language and developmental education with workforce education.
• Create more modularized programs. Traditional Financial Assistance for Workforce Education Students
• During the 2004-2005 school year, there were 31,369 workforce education
students with financial need; this was about 45 percent of the 69,916 students enrolled in workforce education. Of those with need, the median need was about $9,000. The total amount of need among all students was almost $278 million.
• Just over 24,500 workforce education students received some form of traditional
student financial aid during 2004-2005. Among students receiving aid, the median amount per student was $4,225; the total amount of traditional aid received by all workforce education students was approximately $126.3 million.
• After taking into account traditional financial aid programs, there were still over
27,000 workforce education students with over $150 million in unmet need during 2004-2005. The median amount of unmet need among these students was just under $5,000.
Financial Assistance through Workforce Development Programs
• The eight workforce development programs that contribute the most to financial assistance for workforce education students at community and technical colleges contributed an estimated $55 million during 2004-2005. (This does not include support services, the amount of which is not known.)
• Taking into account financial assistance through workforce development
programs ($55 million), and financial assistance from traditional student aid programs ($126 million), an estimated $97 million in unmet need remained for workforce education students in 2004-2005.
Consolidating and Simplifying the Delivery of Workforce Education Aid
• Federal requirements prevent the state from commingling funds from federally funded programs in a single pot of money for workforce education aid. The funds must be used for the populations and services intended by Congress, and fiscal agents must track program funds separately.
• The state may consolidate the administration of programs into fewer agencies;
however, there are certain obstacles that would have to be overcome in order to maintain customer service.
• Federal law and rules for Workforce Investment Act (WIA) Title I, WIA Title III (the
Employment Service), Trade Adjustment Assistance, and Trade Readjustment
iii

Allowance require these programs to provide services through a system (called WorkSource in Washington) of one-stop centers and affiliates selected and overseen by local elected officials and bodies (called Workforce Development Councils (WDCs) in Washington). This leads to a variety of local administrative entities and structures. Four states have circumvented this system of local flexibility by creating a single statewide area, the legality of which is under challenge.
• Several steps can be taken, short of program consolidation, to improve
coordination and simplify the delivery of Workforce Education Aid. Recommendations 1. Cover tuition costs for the 13th year for workforce education students who earn less
than the Washington median family income. 2. Expand the Opportunity Grant program so that financial assistance and support
services are available to more low-income workforce education students at community and technical colleges and trainees in apprenticeship programs.
3. Co-locate more WorkSource centers and establish more affiliate sites on community
and technical college campuses. 4. Explore a “Navigation 102” model of comprehensive guidance to pilot in community
and technical colleges workforce education programs and WorkSource centers. 5. Make more part-time students eligible for the State Need Grant. 6. Provide bridge money up front to low-income students. 7. Continue to provide WIA Title I resources to help student retention. 8. Expand use of the Food Stamps Education and Training program. 9. Expand Integrated Basic and Skills Training programs to all community and technical
colleges. 10. Increase community and technical college efforts to develop more one-year
certificated workforce education programs. 11. The Higher Education Coordinating Board, State Board for Community and Technical
Colleges, Employment Security Department, and the WDCs should work together to develop a website that provides information about traditional and non-traditional student financial assistance, including support services.
12. The Employment Security Department and Workforce Development Council directors
should work with WorkSource Partner programs toward integrated, not co-mingled, budgets for WorkSource centers.
iv

Workforce Education Financial Aid And Student Access and Retention Introduction The 2006 Washington Legislature included a proviso in the supplemental budget directing the Workforce Training and Education Coordinating Board (Workforce Board) to conduct a study of financial aid for workforce education students. The budget proviso requests that the Workforce Board study: • Barriers to student access and completion of workforce education programs. • The funding gap between available workforce education aid and the financial needs
of students. • Consolidating and simplifying the delivery of workforce education aid. The purpose of this study is to assist the Legislature in achieving the goal of easier access and increased retention for workforce education students.2
I. Barriers to Student Access and Completion of Workforce Education Programs In order to study barriers to student access and completion, the Workforce Board conducted the following study components: 1. A review of recent literature on community and technical college access and
retention. 2. An electronic mail survey of community and technical college staff, with 306
respondents. 3. An electronic mail survey of WorkSource staff, with 374 respondents. 4. A telephone survey of WorkSource registrants, with 232 respondents. 5. A telephone survey of secondary career and technical education (CTE) completers,
with 236 respondents. 6. A telephone survey of community and technical college students, with 218
respondents. This section of the report discusses the findings of each of these components of the study. Overall, the findings demonstrate the overriding importance of financial assistance to support student access and retention. 2 Although the term “workforce education” is not defined in the budget proviso, discussions with legislators and staff indicated that the primary focus for the study should be community or technical college occupational (or vocational) skills training.
1

Literature Review In recent years, there have been a number of national studies on how to help low-income adults access and complete postsecondary training at community and technical colleges.3 The national studies conclude that there are financial, support service, and programmatic issues around increasing student access and retention. Financial issues include assistance with tuition and fees, and the every day costs of living—food, housing, transportation, etc.—while attending school. Child care is also a common financial burden for parents, especially single parents. Particular financial aid issues for low-income adults include the unavailability of financial aid for part-time students and for courses that do not provide college-level credit. Many low-income adults attend school only part-time while working, and traditional college financial aid programs are generally unavailable for students enrolled in fewer than six credits worth of classes. Many low-income adults also need pre-college level courses in adult basic skills before enrolling in college-level course work. Traditional financial aid programs are generally unavailable for pre-college level classes. In addition to financial aid, the literature suggests that there are other support services that students need in order to access and complete postsecondary training. Among the most important are career and academic guidance and counseling, mentoring, tutoring, and job placement assistance. Finally, there are also programmatic steps that colleges can take to improve access and completion. These steps include: 1) grant credit for prior learning so students do not have to take time (and money) to repeat things they already know; 2) integrate adult basic skills education and workforce training; 3) offer contextualized learning for academic course; 4) offer training at worksites; 5) break courses into modularized chunks so students can “stop in” and “stop out” as needed; 6) accelerate learning—compressing class hours into as few days as possible; and 7) build programs along career pathways with strong links to employers. Many of these steps are designed to fit the busy lives of working adults and to offer learning in a context that fits their interests and needs. Many of these steps will also help provide an economic payoff as quickly as possible. Although the focus of this report is on workforce education at community and technical colleges, it should be noted that many of the above issues around financial aid and support services also pertain to apprenticeship training.4 In addition to the above issues,
3 See Duke, Martinson, and Strawn, “Wising Up: How Government Can Partner with Business to Increase Skills and Advance Low-Wage Workers,” Center for Law and Social Policy, April 2006; Dougherty, Reid, and Nienhusser, “State Policies to Achieve the Dream in Five States: An Audit of State Policies to Aid Student Access to and Success in Community Colleges in the First Five Achieving the Dream States,” Community College Research Center, Columbia University, February 2006; Liebowitz and Taylor, “Breaking Through: Helping Low-Skilled Adults Enter and Succeed in College and Careers,” Jobs for the Future and National Council for Workforce Education, November 2004. Lingenfelter and Voorhees, “Adult Learners and State Policy,” State Higher Education Executive Officers and Council for Adult and Experiential Learning, February 2003. 4 See Office of Port JOBS and Worker Center, “Building Opportunities Initiative: Findings and Recommendations,” January 1999.
2

preapprenticeship programs that prepare adults to enter formal apprenticeship programs are generally supported by “soft” funds, and, therefore, often lack stability over time. Other steps to overcome barriers to apprenticeship training include better connections between preapprenticeship programs and formal apprenticeship programs, and addressing the persistence of cultural issues that can still take the form of hazing of women and people of color. Views of Staff The Workforce Board surveyed WorkSource and community and technical college staff in order to obtain their views concerning the barriers to student access and retention. The surveys were conducted by e-mail during the summer of 2006. There were 374 WorkSource staff responses, and 306 responses from the community and technical colleges. The views of WorkSource and community and technical college staff were generally very consistent.5
Staff responded that by far the most frequent barriers that prevent people from enrolling in workforce education programs are lack of financial resources for tuition and living expenses. Following financial resources, the most frequent barriers are career planning and child care. Other frequent barriers are: training programs not being available in the area or at a convenient time, lack of preparation for coursework, and time constraints. We also asked staff about barriers to student completion. Financial needs for living expenses were cited as the most frequent barrier by both WorkSource and community and technical college staff. Other frequent barriers include: not being prepared for coursework, time constraints, child care, and tuition. Finally, we asked community and technical college staff about certain programmatic elements discussed by the literature. A range of 64 to 75 percent of staff agreed that the following factors create barriers to student success at their college: • There are not enough short-term training programs with immediate economic
payoff in the labor market. • Workforce training programs are too often not linked together to promote career
ladders. • Developmental (remedial) education programs are separate from workforce
education programs. • Adult Basic Education (ABE) and English as a Second Language (ESL) programs are
separate from workforce education programs. Community and technical college staff agree that the below actions would result in increased student success:
5 See the Appendix for all tables of the results.
3

Figure 1 Action to Improve Student Access and Retention
Percentage of Community and Technical College Staff who Agree
Actions
Strongly Agree
Agree
Disagree
Strongly Disagree
Providing comprehensive support services, including child care, transportation assistance, career counseling, academic advising, and assistance with obtaining financial aid.
75%
22%
3%
0%
Linking training programs together to help create career pathways.
45%
51%
4%
1%
Linking student services with workforce education programs.
48% 44% 6% 2%
Tying training program curriculum more closely with industry skill standards.
44%
46%
8%
2%
Linking developmental education programs with workforce education programs.
43%
44%
10%
3%
Modularizing programs to create multiple entry and exit points.
45% 41% 13% 2%
Integrating Adult Basic Education/English as a Second Language with workforce education programs.
41%
45%
12%
2%
Accelerating curriculum to help students learn faster and complete programs in shorter timeframes.
20%
33%
39%
8%
Views of Potential Participants In order to obtain the views of potential training participants about barriers to access, the Workforce Board contracted with the Social and Economic Sciences Research Center (SESRC) of Washington State University. SESRC conducted a telephone survey of individuals who had registered with WorkSource but who did not have postsecondary training, and individuals who had completed secondary CTE but who also did not have postsecondary training. Both of these populations seem likely sources of potential participants in postsecondary training if barriers to enrollment could be removed. Consistent with the literature and staff perceptions, the potential participants responded that the inability to afford tuition and fees is the most common barrier. Other barriers include time constraints from work, the need for more information about courses and programs, and family responsibilities.
4

Asked what would help them get into a community and technical college program, the potential participants cited many factors. The most frequently cited were programs to get skills to the college level, having a single place to get information on training opportunities, opportunities to get training while on the job, and more financial aid and information about financial aid. WorkSource
Registrants High School CTE
Students Programs to get skills to college level 96% N/a
Programs that don't require diploma 75% N/a
One place for info about training opportunities 91% 87%
Opportunities to learn on the job 87% 90%
Info about which courses to take 84% 82%
Financial aid 87% 87%
Info about programs in area 83% 84%
Info about financial aid 82% 82%
Info about working in a particular field 80% 79%
More conveniently scheduled classes 73% 82%
Info about what to expect 77% 73%
More conveniently located classes 71% 82%
Shorter programs 73% 78%
Info about job prospects 67% 77%
Academic assistance or tutoring 52% 40%
Transportation to class 47% 34%
Child care 48% 27%
Elder care 26% 18%
English translation services 13% 10%
Figure 2 What Would Help Potential Program Participants Get Into College
Percentage of Potential Participants who Agree
Views of Students who do not Finish In order to gain greater insights into retention issues, SESRC also surveyed community and technical college workforce education students who left before receiving a credential. The students surveyed fall into two categories: those who left college before completing 45 credits (typical number of credits earned by a full-time student during one school year); and students who completed 45 credits or more but who did not obtain a credential. SESRC interviewed 218 students. Among workforce education students who left college before completing 45 credits, the most common reasons for leaving were: the inability to afford tuition and fees (41 percent), time constraints from work (39 percent), starting a new job (32 percent), and class times and/or location was not convenient (28 percent). Among students leaving with 45 credits or more, but not a credential, the most common reasons were: starting a new job (45 percent), time constraints from work (41 percent), family responsibilities (39 percent), and already having learned all they needed from the program (35 percent). SESRC also asked the former students what would help them to have stayed in school. As shown in the below figure, common reasons included financial aid, better
5
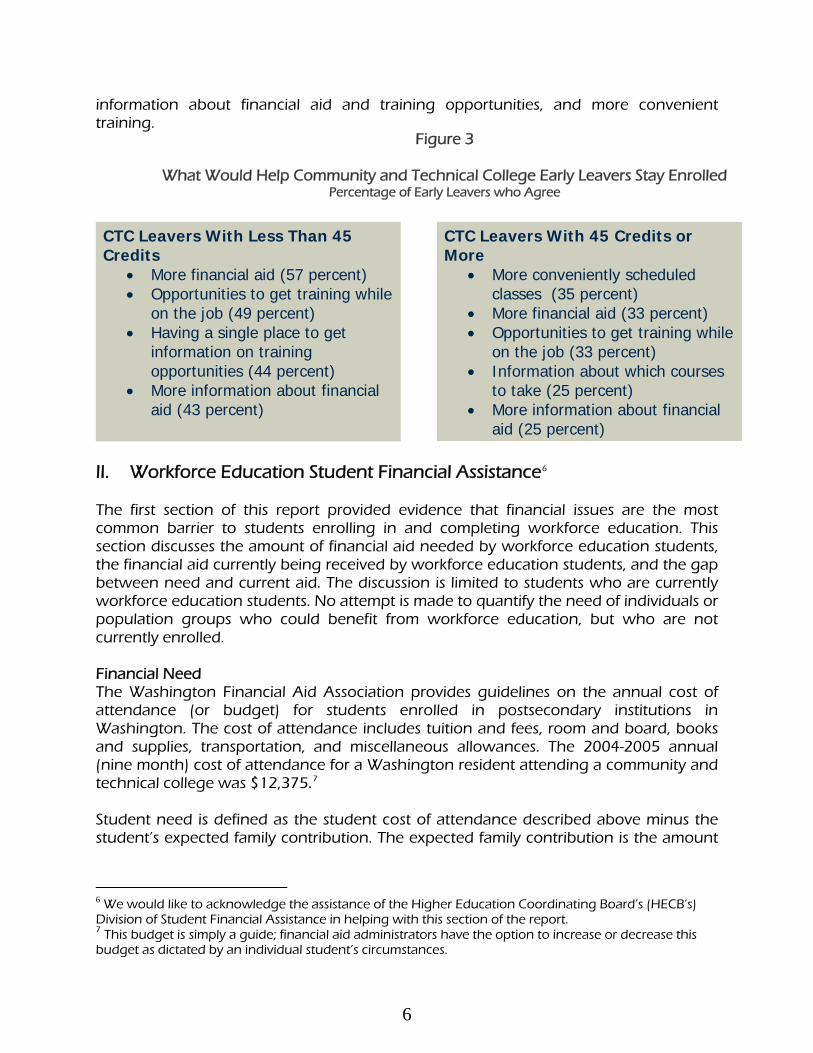
information about financial aid and training opportunities, and more convenient training.
Figure 3
What Would Help Community and Technical College Early Leavers Stay Enrolled Percentage of Early Leavers who Agree
CTC Leavers With Less Than 45 Credits
• More financial aid (57 percent) • Opportunities to get training while
on the job (49 percent) • Having a single place to get
information on training opportunities (44 percent)
• More information about financial aid (43 percent)
CTC Leavers With 45 Credits or More
• More conveniently scheduled classes (35 percent)
• More financial aid (33 percent) • Opportunities to get training while
on the job (33 percent) • Information about which courses
to take (25 percent) • More information about financial
aid (25 percent)
II. Workforce Education Student Financial Assistance6
The first section of this report provided evidence that financial issues are the most common barrier to students enrolling in and completing workforce education. This section discusses the amount of financial aid needed by workforce education students, the financial aid currently being received by workforce education students, and the gap between need and current aid. The discussion is limited to students who are currently workforce education students. No attempt is made to quantify the need of individuals or population groups who could benefit from workforce education, but who are not currently enrolled. Financial Need The Washington Financial Aid Association provides guidelines on the annual cost of attendance (or budget) for students enrolled in postsecondary institutions in Washington. The cost of attendance includes tuition and fees, room and board, books and supplies, transportation, and miscellaneous allowances. The 2004-2005 annual (nine month) cost of attendance for a Washington resident attending a community and technical college was $12,375.7
Student need is defined as the student cost of attendance described above minus the student’s expected family contribution. The expected family contribution is the amount
6 We would like to acknowledge the assistance of the Higher Education Coordinating Board’s (HECB’s) Division of Student Financial Assistance in helping with this section of the report. 7 This budget is simply a guide; financial aid administrators have the option to increase or decrease this budget as dictated by an individual student’s circumstances.
6

that the student and/or their family (if the student is a dependent) is expected to contribute towards their educational expenses given their family circumstances. It is important to note that information is available only for students who applied for financial aid—students who completed the Free Application for Federal Student Aid form. There are a variety of reasons why a student might not apply for financial aid. Students who did not apply might have had sufficient resources to not require aid, they may have lacked information about aid or how to apply for aid, or there might have been some other reason—such as being too late to apply. Figure 4 presents information on the number of workforce education students with financial need (once expected family contribution is taken into account), the total need, and the amount of need per student. Based upon the available data, during the 2004-2005 school year there were 31,369 workforce education students with financial need; this is about 45 percent of the 69,916 students enrolled in workforce education.8 Of those with need, the median need was about $9,000. The total need among all students was almost $278 million.
Figure 4 Workforce Education Student Need
in 2004-2005 Number of Students with Need
Total Amount of Need
Median Amount of Need Per Student
31,369
$277,616,514
$8,820
Traditional Financial Assistance How much financial assistance is provided to meet the $278 million in documented financial need? To answer this question, the analysis is broken down into two major parts: traditional student financial aid programs administered by the Higher Education Coordinating Board (HECB) and other financial assistance available through workforce development programs. The large majority of workforce education students with documented financial need do receive some form of traditional student financial aid. As presented in the next figure, during 2004-2005, 86 percent of the students with need received some form of traditional student financial aid. The figure also shows the percent of students who received each type of aid.
8 Workforce Board staff analysis based upon HECB and SBCTC data.
7

Figure 5 Percentage of Workforce Education Students Receiving Traditional Student Financial
Aid in 2004-2005 by Type of Aid All Students Students with Need N = 69,916 N=31,369 Received Any Type of Aid 39% 86% Received Grant/Scholarship/Waiver 35% 77% Received Work Study 4% 9% Received Loan 15% 33% Received Grant/Scholarship/Waiver Only 21% 47% Received Work Study Only 0% 0% Received Loan Only 4% 8% Received Federal Grant/Scholarship 26% 57% Received State Grant/Scholarship/Waiver 20% 45% Received Worker Retraining/Workforce Training Grant
5% 12%
Received WorkFirst Grant 2% 5% Received Institution Grant/Scholarship/Waiver 9% 19% Received Local Grant/Scholarship 3% 6% Received WorkFirst Work Study 0% 1% Received Work Study, not WorkFirst Work Study
4% 9%
Received Loan 15% 33% The next figure presents the number workforce education students receiving aid and the amount of aid by major category of aid. Some students received more than one type of aid. In total, 24,571 workforce education students received some form of traditional student financial aid during 2004-2005. Among students receiving aid, the median amount per student was $4,225, the total amount of traditional aid received by all workforce education students was $126,264,880.
Figure 6 Number and Amounts of Traditional Financial Aid Receipt in 2004-2005 Among
Workforce Education Students by Type of Aid Number
Received Aid
Total Amount of Aid Received
Median Amount of Aid Received
Per Recipient Federal Grant/Scholarship 17,934 $44,579,230 $2,455 State Grant/Scholarship/Waiver 13,998 $23,437,117 $1,659 Institution Grant/Scholarship/Waiver
5,958 $6,481,035 $750
Local Grant/Scholarship 1,905 $2,705,507 $1,000 Work Study 2,725 $6,234,950 $1,966 Loan 10,249 $42,837,020 $3,669 Total 24,571 $126,264,880 $4,225
8

Traditional forms of student financial aid are insufficient to meet the financial needs of students. Figure 7 shows that considering all forms of traditional aid, including loans, there were still over 27,000 workforce education students with over $150 million in unmet need during 2004-2005. The median amount of unmet need among these students was just under $5,000. These figures take into account the expected contribution from students and their families.
Figure 7 Workforce Education Student Unmet Need in 2004-2005 After Traditional Student
Aid Number
With Unmet Need
Total Amount of Unmet
Need
Median Amount of
Unmet Need Per Student with Unmet
Need Need, Before Aid 31,369 $277,616,514 $8,820 Unmet Need, After Grant/Scholarship/Waiver
30,652 $200,413,625 $6,314
Unmet Need, After Grants & Work Study
30,550 $194,178,675 $6,158
Unmet Need, After Grants, Work Study, and Loans
27,424 $151,351,654 $4,921
Financial Assistance Through Workforce Development Programs There are 18 programs that are defined as part of the workforce development system by either state statute or executive order. These programs provide a wide variety of services for the purpose of helping people become employed or attain a better job. Examples of these services include providing labor market information, career counseling, instruction in preparing a résumé, providing adaptive technology for people with a disability, instruction in basic skills, support services, and information on job openings. Among the services provided by some of the programs is financial assistance for program participants enrolled in postsecondary training. The analysis here includes assistance in the form of direct help with the cost of tuition or fees, and income stipends that recipients may use to help defray costs associated with training, including living expenses.9
The Workforce Board contracted with Social Policy Research (SPR) Associates out of Oakland, California to analyze the student financial assistance available through eight 9 Many of these programs also assist participants in training with the cost of support services—such as child care or transportation. The precise amount of workforce program expenditures on support services for participants in training, however, is not known. Also not known is the exact amount of financial assistant that goes to program participants attending a community and technical college, as opposed to a private career school or other training provider. Each program, however, is able to estimate the percentage of their student financial assistance that goes to community and technical college workforce education students.
9

workforce programs. These are the eight workforce programs that we believe provide the largest amounts of student assistance. The eight programs are: • Workforce Investment Act (WIA) Adult Program • WIA Dislocated Worker Program • Trade Adjustment Assistance (TAA) • Trade Readjustment Allowance (TRA) • Temporary Assistance to Needy Families (TANF) WorkFirst Program • Training Benefits Program • Worker Retraining Program • Division of Vocational Rehabilitation (DVR) at the Department of Social and Health
Services (DSHS) This section of the report presents the numbers on the financial assistance that these programs provide to workforce education students.10
Figure 8 shows the amount of financial aid and number of program participants receiving aid funded by each of these eight workforce programs. Included in the figure are total program expenditures and number of participants for each program. The total expenditures are just that, the total amount of money expended on all staff and services, such as those listed earlier, not just training. The figures for financial aid include direct expenditures for tuition or fees and income stipends that are available because the program participant is in training. For example, included are extended unemployment insurance (UI) benefits that are available only to individuals who are in training, but not included are TANF benefits that are available whether or not individuals are in training or engaged in other activities that fulfill TANF work requirements. The columns with numbers of participants include some duplicative counts, since individuals are frequently served by more than one program. The last column shows the estimated amount of the student financial assistance that goes to workforce education students at community and technical colleges. These eight workforce development programs contribute about $55 million a year to defray the cost of attending workforce education, not including help with support services.
10 For more information on these programs, see the Workforce Board’s Workforce Development Directory at: http://www.wtb.wa.gov/Documents/wrkforcedirectory.pdf.
10

Figure 8
Annual Workforce Program Expenditures on Workforce Education Student Financial Assistance
Total Program Expenditures—
All Services
Total Number of Program
Participants
Total Student Financial
Assistance
Number of Participants Receiving Student
Financial Assistance
Estimated Number
Receiving Assistance to Attend
CTC Workforce Education
Estimated Financial
Assistance for CTC
Workforce Education Students
WIA Adult11
$33,861,655
7,141
$3,755,384
1,941
1,360
$2.3 m
WIA Dislocated Workers11
$46,219,822
9,887
$8,031,518
4,014
3,000
$5.2 m
TAA $15,766,258 5,715 $12,157,884 4,858 3,900 $9.7 m
TRA $17,942,329 96212 $17,772,329 962 700 $13.3 m
WorkFirst $56,000,000 125,000 est.
$3,077,44413
3,974 3,974 $3.1 m
Worker Retraining
$34,231,464 16,356 $10,682,000 7,422 6,755 $8.2 m
Training Benefits
$14,600,000 2,482 $13,100,000 2,482 1,900 $9.8 m
Vocational Rehab.
$55,932,489 11,905 $6,025,087 1,773 900 $3.0 m
Total14 $274,554,017 180,000 $74,601,646 27,426 22,489 $54.6 m Earlier, Figure 7 showed that workforce education students at community and technical colleges had about $151 million in unmet need after taking into account the aid received through traditional student aid programs. Taking into account the approximately $55 million received in financial assistance from workforce development programs, this leaves about $97 million in annual unmet need, as shown in Figure 9.
11 WIA requires that other sources of financial assistance be used before WIA. This helps explain what may seem like a relatively small percentage of program funds that are expended on financial assistance. The count of WIA participants includes only the five percent of WorkSource participants who register for intensive or training services funded by WIA. 12 There were 962 participants already counted as TAA and not included in total. 13 This amount does not include expenditures for contracted classes. It includes tuition assistance of WorkFirst participants enrolled in GF-S funded classes. 14 The total number of individuals include duplicated counts due to individuals enrolling in more than one program.
11
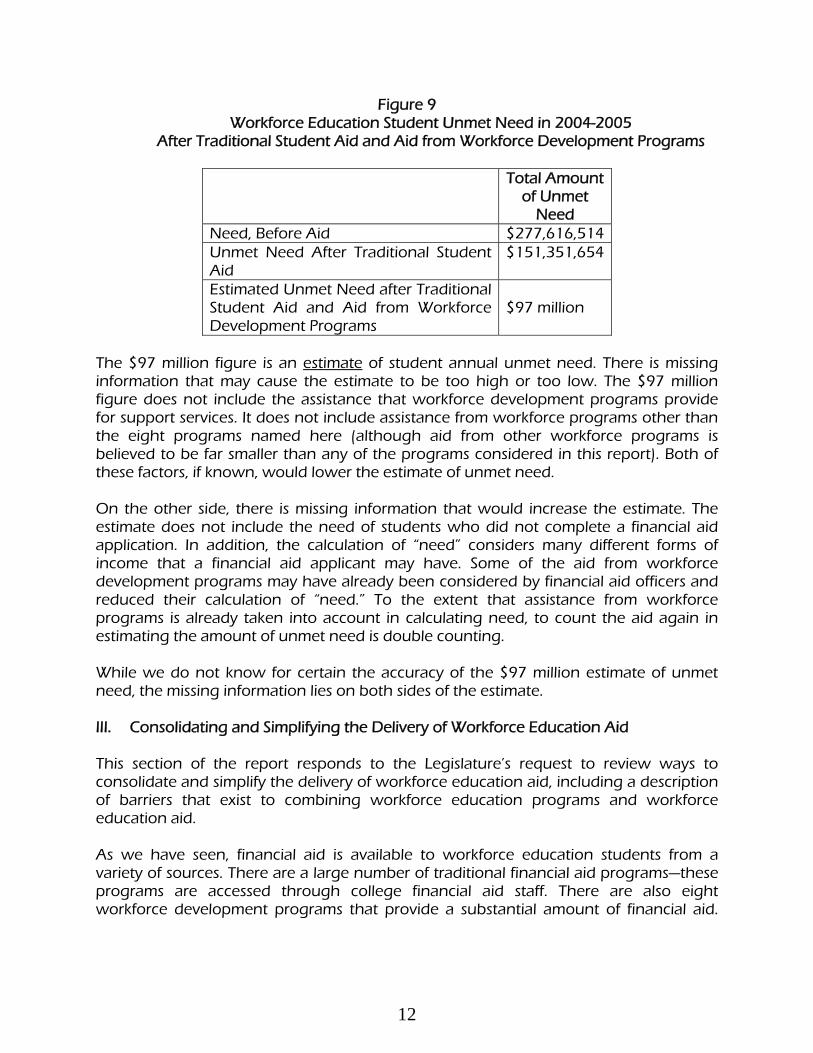
Figure 9 Workforce Education Student Unmet Need in 2004-2005
After Traditional Student Aid and Aid from Workforce Development Programs
Total Amount of Unmet
Need Need, Before Aid $277,616,514 Unmet Need After Traditional Student Aid
$151,351,654
Estimated Unmet Need after Traditional Student Aid and Aid from Workforce Development Programs
$97 million
The $97 million figure is an estimate of student annual unmet need. There is missing information that may cause the estimate to be too high or too low. The $97 million figure does not include the assistance that workforce development programs provide for support services. It does not include assistance from workforce programs other than the eight programs named here (although aid from other workforce programs is believed to be far smaller than any of the programs considered in this report). Both of these factors, if known, would lower the estimate of unmet need. On the other side, there is missing information that would increase the estimate. The estimate does not include the need of students who did not complete a financial aid application. In addition, the calculation of “need” considers many different forms of income that a financial aid applicant may have. Some of the aid from workforce development programs may have already been considered by financial aid officers and reduced their calculation of “need.” To the extent that assistance from workforce programs is already taken into account in calculating need, to count the aid again in estimating the amount of unmet need is double counting. While we do not know for certain the accuracy of the $97 million estimate of unmet need, the missing information lies on both sides of the estimate. III. Consolidating and Simplifying the Delivery of Workforce Education Aid This section of the report responds to the Legislature’s request to review ways to consolidate and simplify the delivery of workforce education aid, including a description of barriers that exist to combining workforce education programs and workforce education aid. As we have seen, financial aid is available to workforce education students from a variety of sources. There are a large number of traditional financial aid programs—these programs are accessed through college financial aid staff. There are also eight workforce development programs that provide a substantial amount of financial aid.
12

Students and potential students access these sources of aid through workforce program staff. WorkSource centers provide access to at least six of these workforce programs.15
There is mixed evidence on the extent to which the current delivery of workforce education student financial aid is a barrier to student access. SPR conducted interviews with program staff at WorkSource centers and community and technical colleges. SPR concluded:
In most cases, the WorkSource and education staff that we interviewed indicated that there are no major problems in coordinating financial aid. Most of the respondents said that information coordination between the WorkSource and vendors (community and technical colleges in particular) is excellent, particularly in the smaller cities and rural areas in our sample. For example, in Port Angeles, where all training is done by the local community college, a committee of partners reviews individual training plans. Staff at several WorkSource sites in urban areas also indicated that coordination with community and technical colleges and other vendors is good, but there are still substantial gap in their knowledge of various financial aid options. These staff indicated that more information, including having an updated list of available sources of funding, would be helpful in planning training with clients. (“Consolidating Workforce Financial Aid, Final Report,” Social Policy Research Associates, September 7, 2006, p. 15.)
SPR also interviewed program participants. Based on these interviews SPR reported:
Most of the participants that we interviewed found the process of obtaining financial aid relatively smooth, and most indicated that they have relatively few difficulties in navigating the system; however, a few participants did not know what is potentially available. For customers in other programs [other than TAA], several did indicate considerable difficulty with accessing information on the variety of program funding, and with the need to consult multiple agencies. (“Consolidating Workforce Financial Aid, Final Report,” Social Policy Research Associates, September 7, 2006, p. 16.)
The survey findings in the first section of this report of potential students and students who left community and technical colleges before receiving a credential, provide evidence that better information about financial aid would reduce one of the barriers to accessing workforce education. For example, 43 percent of community and technical college students who left college before completing 45 credits responded that more information about financial aid would have helped them stay enrolled. Over 80 percent of secondary CTE students and over 80 percent of WorkSource registrants responded that information about financial aid would help them enroll in college training.
15 The following programs are required by state policy or federal law to participate in one-stop centers: WIA Adult, WIA Dislocated Workers, TAA, Vocational Rehabilitation, WorkFirst, and the Worker Retraining Program.
13

Program Consolidation: Options and Barriers The Legislature requested that the Workforce Board examine the barriers to combining workforce education aid from workforce education programs. The review is to include barriers in “state or federal statutes, rules, or regulations, and the relief that may be available through federal waivers.” Federal law prohibits the commingling of federal funds. U.S. Office of Management and Budget Circular A-133, applying to state and local government grantees, prohibits such grantees from commingling funds. Funds must be spent for the specific purposes and programs for which Congress appropriated the money. As a result, the state cannot simply put federal funds from different workforce development programs into a single pot and manage the funds without an auditable trail of how the money from each program is used, and that money must be used as required by the specific program’s authorizing statutes and regulations. The state can, however, place the state administration of federally funded workforce development programs into one or more agencies at the state’s discretion. The state agency or agencies must still administer the funds as required by federal law—meeting requirements, such as eligibility requirements, that are different for each program, and tracking the funds by program. Eligibility requirements cannot be waived. The following are some of the major program characteristics that affect the ability of a state to consolidate program administration and funding into a single agency. WIA Titles I and III: WIA Title I authorizes employment and training services for disadvantaged youth and adults, and dislocated workers. WIA Title III (Wagner-Peyser) authorizes the Employment Service. In Washington, the Employment Security Department (ESD) is the administrative and fiscal agent at the state level for both WIA Titles I and III. A major barrier to the state consolidating the administration of WIA Titles I and III funds is that federal law requires WIA Title I and III services to be delivered through a system of one-stop centers that are governed at the local level. WIA gives local Workforce Investment Boards (known as Workforce Development Councils (WDCs) in Washington) the authority to select and oversee one-stop center operators in their local geographic area in cooperation with their local elected officials. The state cannot tell WDCs and local elected officials who they must choose to operate one-stop centers in their area. Local areas have chosen a variety of organizations to operate one-stop centers. In some areas in Washington, WDCs operate one-stop centers; in other areas ESD operates the centers. In other parts of the nation, community and technical colleges operate one-stop centers; and there are other options that are being implemented around the nation. The only way for a state to negate this local discretion is for the governor to decide that the state as a whole will serve as a single local area. Under 20CFR 661.300(f), four states have been granted U.S. Department of Labor (DOL) waivers permitting the state to operate as a single statewide regional planning area using its state Workforce
14

Investment Board to carry out the requirements of local area councils. The four states are Alaska, Idaho, Indiana, and Utah. Affected local areas have challenged the legality of this action. DOL has sided with the governors. Short of this step, local WDCs and local elected officials must play the major role in administering WIA Titles I and III at the local level. In any event, WIA Titles I and III services must be delivered through comprehensive one-stop centers that provide access to 14 federally-funded programs. As a result, the agency or agencies that administer WIA Titles I and III must provide the services through one-stops. For a single state agency to assume full administration of WIA Titles I and III, from the state level down to the local level, would require the same state agency to play this broader role and become the local one-stop operator throughout the state. The majority of the services provided through the one-stop system are what WIA refers to as “core” or “intensive” services, not actual occupational skills training. Examples of core and intensive services include assessments, labor market information, counseling, and various forms of job search assistance, including information on job openings. Fewer than 5 percent of the one-stop participants receive training.16
WIA Title I requires that training funds be allocated to participants through Individual Training Accounts (ITAs) which are a form of voucher. (WIA 134(c)(1); 134(c)(4)(F); 134(d)(4)) Participants may use their ITA at any training program on the Eligible Training Provider List for the state. Washington’s list, as required by WIA, includes a variety of providers—community and technical colleges, private career schools, and four-year colleges and universities. The state and the WDCs cannot restrict training funded by WIA to only one type of provider. The purpose of ITAs is to provide customers with market choice. The state and local areas cannot mandate that the same agency that administers WIA Title I must also provide the training. And if the operator of a one-stop center was one type of training provider—such as a community and technical college—the provider would need to be careful not to unduly influence participant choices as to their training provider. WIA Title I funds are divided into three funding streams to serve youth, adults, and dislocated workers. The federal prohibition on commingling of funds applies generally to the three streams; however, there are some exceptions. Eighteen states have obtained waivers allowing the transfer of up to 100 percent of the funds between the adult and dislocated worker funding streams. Nine other states have obtained waivers allowing the transfer of between 30 and 50 percent. Also, it might be noted, 15 percent of WIA Title I funds set-a-side for state administration and statewide activities are fungible across the three funding streams. Trade Adjustment Assistance (TAA) and Trade Readjustment Allowances (TRA): TAA and TRA serve manufacturing sector workers who have lost their jobs due to increased imports or plant relocation as certified by DOL. TAA provides employment and training services, paying for a substantial amount of training for dislocated workers. TRA
16 The largest number of WorkSource one-stop participants are served by WIA Title III, the Employment Service. This program is not included in the tables on financial aid, since it does not provide financial aid.
15

provides an extra 26 weeks of UI benefits to TAA certified workers who have exhausted regular and extended UI benefits, and 52 weeks for workers in retraining, 78 weeks if remedial training is required. TRA, therefore, is a source of significant financial assistance for dislocated workers enrolled in workforce education. At the state level, ESD is the administrative and fiscal agent. Dislocated workers apply for assistance at local WorkSource one-stop centers. TAA is a federally required partner program in the one-stop system and DOL expects TAA services to be linked to other one-stop employment and training services. TAA has relatively few staff resources for services such as assessment, counseling, or placement, and, therefore, DOL encourages the co-enrollment of TAA participants in WIA Title I for what are referred to as “intensive” services. The federally required ties between TAA, WIA Title I, and one-stop, and TRA’s link to TAA, makes it administratively cumbersome for a state to utilize different agencies for the administration of these programs. Training Benefits Program: The Training Benefits Program is a state program providing additional weeks of UI benefits to dislocated workers who are in retraining. ESD is the state administrative and fiscal agent. As set forth in state statute, the Training Benefits program is closely linked to the UI system at the state and local levels, and the WDCs at the local level. The funding source is the UI trust fund administered by ESD, and ESD pays the benefits. ESD is responsible for notifying workers of their eligibility. Eligible participants must be: terminated from employment, eligible for UI benefits, or have exhausted benefits, and unlikely to return to employment in the occupation or industry because of a diminishing demand for skills in that occupation or industry. The statute requires that the retraining must be in a demand occupation, and assigns the WDCs the lead responsibility for determining which occupations are in demand in their local labor market. The training programs must be on the state Eligible Training Provider List maintained by the Workforce Board (also used for WIA Title I and TAA), and includes community and technical colleges and private career schools. Given these basic features of the Training Benefits Program it would require a basic rewrite of the state statute for any agency other than ESD to administer the program, especially due to the program’s close connection to the UI Trust Fund and Benefit system. Worker Retraining Program: State statutes authorize the Worker Retraining Program to fund enrollment slots and support services for dislocated and other unemployed workers in retraining community and technical colleges and private career schools. Support services include “Training Completion Aid” stipends to workers who have exhausted their UI benefits. The State Board for Community and Technical Colleges (SBCTC) is the state administrative and fiscal agent. The source of funds is State General Funds.
16

The state Worker Retraining Program and the federal WIA Title I Dislocated Worker Program, as well as the federal TAA and TRA programs are closely interrelated. Many of the program participants are co-enrolled and receive services from more than one program. For example, frequently the state share of the enrollment costs for dislocated workers attending a community and technical college is covered through the Worker Retraining Program, while tuition costs are covered through WIA Title I or TAA. Frequently, WorkSource staff conduct the initial intake, assessment, and counseling of laid-off workers, who then enroll in a college in a slot funded through the Worker Retraining Program. Since the state created the Worker Retraining Program in 1993, program staff at the local level have worked out ways to coordinate their efforts. SPR’s report concludes:
To a large extent, major actors within the workforce training system in Washington, particularly WorkSource center programs and community and technical colleges, already closely coordinate program offerings at the local level. The principal coordination methods is co-enrollment, and at many of the sites we visited, committees comprised of WorkSource programs and educational institutions already regularly coordinated activities including financial aid reviews for individual cases and strategic planning.
This is particularly true between clusters of programs targeting similar populations, such as dislocated workers served under TAA, WIA dislocated workers, Training Benefits, and Worker Retraining. (“Consolidating Workforce Financial Aid, Final Report,” Social Policy Research Associates {SPR}, September 7, 2006, pp. 17-18.)
WorkFirst: The state allocates a portion of its TANF funds to SBCTC for basic skills instruction and workforce education for TANF recipients and other low income working parents. SBCTC allocates most of these funds to colleges for contracted courses. SBCTC allocates approximately $3.1 million in the form of financial assistance to students enrolled in regular workforce education classes. Federal law allows states considerable flexibility in the allocation of TANF funds, and state law allows the Governor considerable flexibility in Washington. Vocational Rehabilitation: Vocational Rehabilitation is a federally and state-funded program administered by the Division of Vocational Rehabilitation (DVR), which is part of the Department of Social and Health Services (DSHS). DVR serves individuals with physical or mental disabilities that make it difficult to get a job or keep a job that matches skills, potential, and interest. DVR provides a wide range of services including assessment, counseling, physical and mental restoration services (including corrective surgery), job search and placement assistance, and training. Because DVR has insufficient resources to serve all eligible customers, it is currently under an “Order of Selection” and must serve only individuals with the most severe disabilities. In part to enable other people with disabilities to receive services, DVR has
17

worked closely with the WorkSource system to make WorkSource services accessible to people with disabilities. DVR also coordinates closely with DSHS divisions responsible for mental health and developmental disabilities, as approximately 75 percent of DVR’s customers have developmental or mental health disabilities. The importance of coordination with these other divisions of DSHS is an obstacle to the consolidation of DVR with other agencies administering workforce development programs. General Considerations Regarding Consolidation: In its analysis of the options for program consolidation, SPR concludes:
Most importantly, DOL-funded programs, particularly as they are structured under current legislation, all emphasize that training services are to be regarded as only one option among a package of integrated re-employment services. Under WIA specifically, customers are currently expected to test the labor market through labor exchange, job-search skill enhancement, and other one-stop services before considering training as an option. WIA legislation also indicates that the determination of eligibility for training must be delivered through a one-stop system. Because of the emphasis on customer choice of vendor, any administrator of training services would need to be perceived as neutral brokers to ensure that customers would retain choices, including those available outside of the community and technical college system. TAA program must meet a series of criteria including a requirement that the participant lacks marketable skills to gain employment. Although community and technical colleges could potentially provide documentations of compliance with these requirements, the costs of establishing the capacity to do so might outweigh potential benefits. (SPR, Final Report, pp. 22-23.)
SPR may overstate the necessity of DOL program participants spending substantial time in other services before training, but SPR’s analysis points out that there are major differences in the core functions of the community and technical colleges’ workforce education and the DOL-funded programs administered through ESD and WorkSource. The core function of workforce education is, obviously, training. The core functions of the DOL-funded programs are assessment, counseling, support services, and various forms of job search assistance, and these programs help to pay for training, but do not directly provide training. The vast majority of WorkSource participants (over 95 percent) receive other services and not training. For either the community and technical colleges or WorkSource to take on the functions of the other, in addition to their current core functions, would require very substantial changes and additions in mission, staffing and skills. Simplifying the Delivery of Workforce Education Aid: In their report, SPR makes two suggestions for simplifying the delivery of Workforce Education Aid, short of program consolidation: co-location of community and technical college and WorkSource staff, and a web-based system of information on financial aid.17
17 See SPR, Final Report, pp. 20-21.
18

One promising practice for increased program integration is emerging at North Seattle Community College where WorkSource staff are being located on the college campus with the support of state dollars. SPR’s report points out that, “In several instances, we found that co-location of community college staff at the WorkSource and out-stationing of WorkSource staff at community colleges is already increasing the flow and exchange of knowledge on financial aid options.” SPR indicates that such co-location is a very promising practice that could be more widely implemented. SPR also commends improved use of information technology in order to make information about financial aid more widely available and easily accessible: “In all the sites we visited, locals were supportive of the idea of having a more complete and easily accessible state database that would provide customers with more complete information about financial aid options. Several respondents indicated that an interactive web-based system could be used by workforce and education staff as well as customers to provide information about themselves and potential program eligibility.” Such a system could provide information on training and financial aid options to customers and make a preliminary determination of financial aid eligibility. IV. Recommendations This final section of the report presents the recommendations of the Workforce Board. The Legislature requested that the Workforce Board provide “recommendations for increasing participation and completion rates for workforce education programs,” and “recommendations for consolidating and simplifying the delivery of state-funded and federally funded workforce education programs and workforce education aid offered to students in this state, with a goal of achieving easier access to postsecondary education for students.” Based upon the research for this report, and the Board’s review of the workforce development system conducted for Governor Gregoire, the Workforce Board offers the following recommendations: 1. Cover tuition costs for the 13th year for workforce education students who earn less than the Washington median family income. As this report shows, financial costs are the major barrier to students accessing and completing workforce education. Recent research by SBCTC shows the importance of at least one year of postsecondary training and a credential in order for students to be able to obtain a family-wage job. One year and a credential is a tipping point to success. By covering the cost of tuition for one year for workforce education students, the state would enable more Washingtonians to achieve this tipping point. Research also shows that the provision of financial aid has the greatest effect on enrollment for low-income individuals and first generation college students, so the proposal would provide the greatest benefit to those segments of the population who have not been part of the economic mainstream.
19

2. Expand the Opportunity Grant program so that financial assistance and support services are available to more low-income workforce education students at community and technical colleges and trainees in apprenticeship programs. The 2006 Legislature created the Opportunity Grant program to provide tuition assistance and support services such as child care, transportation, counseling, and tutoring to workforce education students at community and technical colleges. This program should be expanded in order to improve access and retention for more workforce education students. If tuition costs are covered for the first year of workforce education, as recommended above, then the opportunity grants could focus on other forms of financial aid and support services during that initial year. 3. Co-locate WorkSource centers and establish affiliate sites on more community and technical college campuses. The state should explore funding for the co-location of WorkSource staff on additional community and technical college campuses, including some complete centers and more affiliate sites. At the same time, the community and technical colleges should co-locate staff at WorkSource centers in order to, among other things, increase WorkSource participant access to information about traditional student financial aid. 4. Explore a “Navigation 102” model of comprehensive guidance to pilot in community and technical colleges workforce education programs and WorkSource centers. A significant barrier to student access and retention is easy access to good information—information about career opportunities and the education and training programs that are available to achieve those opportunities; and information about financial aid—both traditional forms of student financial assistance and financial assistance and support services available through workforce development programs. In order to improve student information, the postsecondary system should take a lesson from secondary education—the Navigation system of guidance—and work with WDCs to explore a Navigation 102 version for postsecondary education. 5. Make more part-time students eligible for the State Need Grant. Students taking less than six credits are not eligible for the State Need Grant. Many low-income adults, however, are unable to juggle six credits of classes on top of a low-wage job and family obligations. Low-income workers should be eligible for financial aid even if they are going to school part time. Currently the state is piloting a program to provide aid to part-time students. The pilot will provide useful lessons on how to administer the expansion of aid to more part-time students. 6. Provide bridge money up front to low-income students. Low-income individuals often need funds up front to pay tuition and other costs related to training. They cannot afford to wait to be reimbursed. Tacoma-Pierce County WDC’s
20

innovative Career Coach Program is an example of what can be done. Career Coach uses WIA funds to provide up front tuition and support services for low-income workers in the health care industry and health care employers later reimburse program costs. 7. Continue to provide WIA Title I resources to help student retention. WIA Title I funds are frequently used to help low-income students stay in school through the provision of support services. WDCs should continue their efforts to make sure that they are providing appropriate levels of WIA resources to assist low-income students stay in and complete postsecondary training. 8. Expand use of the Food Stamps Education and Training program. Another source of funds for access and retention services is the federal Food Stamps Education and Training 50/50 Program (FS E&T). FS E&T provides dollar-for-dollar matching funds for every non-federal workforce development dollar spent on any food stamp recipient who is not receiving TANF. In Washington, DSHS is the designated administrative agency for the program. The Governor should mandate that participating agencies aggressively seek and utilize this relatively new source of funding. The first Washington pilot project was implemented in King County and began on October 1, 2005, with a partnership of South Seattle Community College, Goodwill, Port JOBS, Seattle Jobs Initiative, YWCA, ESD, and DSHS Region 4. During the first six months, the pilot served 438 participants. Twenty percent of the participants have obtained a job. The project team and FS E&T pilot partners recommend a measured expansion of the pilot project, a two-stage process beginning October 1, 2006, and running until September 30, 2007. The state should then expand the use of FS E&T based upon the lessons learned from the pilot. 9. Expand Integrated Basic Education and Skills Training (I-BEST) programs to all community and technical colleges. Workforce Board and national research shows that for most adults, basic skills education by itself does not improve student earnings. If, however, adult basic skills students manage to also obtain occupational skills training, their results resemble the strong results that are typical of students in workforce education programs. Most adult basic skills students, however, attend for a short time only and do not go on to other forms of postsecondary training. In order to remedy this situation, SBCTC has developed the I-BEST program. I-BEST combines basic and occupational skills training by having both types of instructors in the classroom.
21

10. Increase community and technical college efforts to develop more one year certificated workforce education programs. As stated above, SBCTC research shows that obtaining one year of postsecondary training and a credential is the tipping point to achieving economic independence. The national literature also shows that short-term programs are useful for access and completion for low-income workers who do not have the time for an associate degree or longer program. The surveys conducted for this review, however, reveal that a barrier to postsecondary access and completion is that there are not enough one-year certificated programs available. To remedy this situation, SBCTC should work with the colleges to develop more one-year certificated programs, and the state should recognize and support the continuing role of private career schools in providing workforce training at this level. 11. The HECB, SBCTC, ESD, and the WDCs should work together to develop a website that provides information about traditional and non-traditional student financial assistance, including support services. A final step that would make information on financial assistance more available would be the creation of a one-stop website that would contain information about traditional and nontraditional student financial assistance—assistance available through workforce development programs. 12. ESD and the WDC directors should work with WorkSource Partner programs toward integrated, not co-mingled, budgets for WorkSource centers. ESD and WDCs will begin by piloting the concept of an integrated budget, working in coordination with partner agencies. They will develop a model by which they and partner programs agree to an integrated, not co-mingled, budget that can be used by one-stop operators to better manage services and results for customers.
22

Appendices A:
Access and Completion of Workforce Education Programs: Program Staff Survey –Preliminary Results
B: Barriers to Access and Completion of Training
23

Access and Completion of Workforce Education Programs: Program Staff Survey
Preliminary Results
Karen Pyle
Workforce Training and Education Coordinating Board
August 3, 2006

Survey Background
Survey Purpose: To ask staff who work directly with students and job seekers about their views on barriers to access and completion of workforce education programs in our state.
Conducted over the internet, by Workforce Board staff, during June 26 to July 13.
Email invitations to take the survey sent to nearly all WorkSource Center and Affiliate staff and Community and Technical College (CTC) staff.
Complete responses were received from 374 WorkSource staff and 306 CTC staff.

WorkSource Respondents: Type of Job
20%
74%
4%2%
Supervisor/Manager
Frontline staff
Clerical/Administrative
Other

WorkSource Respondents: WDA of Employment
20
5231
1936
2548
17
2535
1929
0 10 20 30 40 50 60
Olympic
Pacific Mountain
Northwest
Snohomish
Seattle-King
Tacoma-Pierce
Southwest Washington
North Central
South Central
Eastern Washington Partnership
Benton-Franklin
Spokane Area
Number of Respondents

CTC Respondents: Type of Job
0% 5% 10% 15% 20% 25% 30%
Emp Counselor/CaseMgr/Disability Spec
Career Counselor/AcademicAdvisor
Professional-TechnicalProgram Instructor
Other CTC Instructor
ProgramAdministrator/Coordinator
VP/Director/Dean
Administrative Assistant

CTC Respondents: Direct contact with jobseekers or students
0%
10%
20%
30%
40%
50%
60%
70%
Daily Several Timesa Week
Several Timesa Month
Once a Month Rarely/None

Access Barrier Question 1: In your experience, how often do you see the following types of factors prevent people from enrolling in an occupational training program?
Access barriers:Lack of personal financial resources for living expenses.Lack of personal financial resources for tuition, fees, and books.Lack of career planning or career goals.Lack of affordable transportation.Lack of childcare that meets needs of student.Time constraints from family and/or work obligations.Training program desired/needed not available at a convenient time or location.Not eligible for traditional financial aid for postsecondary education.Not getting information about or help with applying for traditional financial aid.Not getting information about or help with applying for financial resources for workforce training such as WIA, training benefits.Language or cultural barriers.

WorkSource Staff: Access Barrier Question 1 Results-Access barriers seen very often or often
0%10%20%30%40%50%60%70%80%90%
Financia
l-livin
g exp
ense
sFina
ncial-tu
ition
Caree
r plan
ning
Afforda
ble tr
ansp
ortat
ionChil
dcare
issu
esTim
e cons
traint
s
Classes
not a
vaila
ble-tim
e/loca
tion
Not eli
gible
for tr
ad. f
inanc
ial aid
Infor
mation
/help
trad.
finan
cial a
id
Infor
mation
/help
workfo
rce fu
nding
Lang
uage
/cultu
ral

CTC Staff: Access Barrier Question 1 Results-Access barriers seen very often or often
0%10%20%30%40%50%60%70%80%90%
Financia
l-tuitio
n
Financia
l-livin
g exp
ense
sChil
dcare
issu
esCar
eer p
lannin
g
Not eli
gible
for tr
ad. f
inanc
ial aid
Time co
nstra
ints
Afforda
ble tr
ansp
ortat
ion
Lang
uage
/cultu
ral
Classes
not a
vaila
ble-tim
e/loca
tion
Infor
mation
/help-
wor
kforce
fund
ing
Infor
mation
/help-
trad
. finan
cial a
id

Access Barrier Question 2: In general, what two barriers to enrolling in workforce/occupational training programs do you see most often?
WorkSource Staff Results—Percent of respondents wholisted the following types of barriers as seen most often
Financial Constraints 62%
Training programs not available in
the area or at a convenient time 21%
Personal or family issues 17%
Lack of preparation for coursework
or work readiness 17%

Access Barrier Question 2: In general, what two barriers to enrolling in workforce/occupational training programs do you see most often?
CTC Staff Results—Percent of respondents wholisted the following types of barriers as seen most often
Financial Constraints 72%
Lack of preparation for coursework or work readiness 24%
Time constraints 18%
Personal or family issues 15%
Training programs not available in
the area or at a convenient time 15%

Completion Barrier Question 1: In your experience, how often do you see the following factors cause people to leave their training program before completion?
Completion barriers:Not enough financial resources to pay for tuition, fees and supplies.Not enough financial resources for living expenses.Unemployment Insurance benefits end.Leave to return to old job.Student receives enough training to get a new job.Lack of affordable transportation.Childcare issues.Time constraints from family and/or work obligations.Student does not receive needed academic support services such as advising and tutoring.Student is not adequately prepared for coursework.Classes not available at convenient times or locations.Training program curriculum does not meet student expectations or needs.Training program quality does not meet student expectations or needs.Health problems of student.Language or cultural barriers.
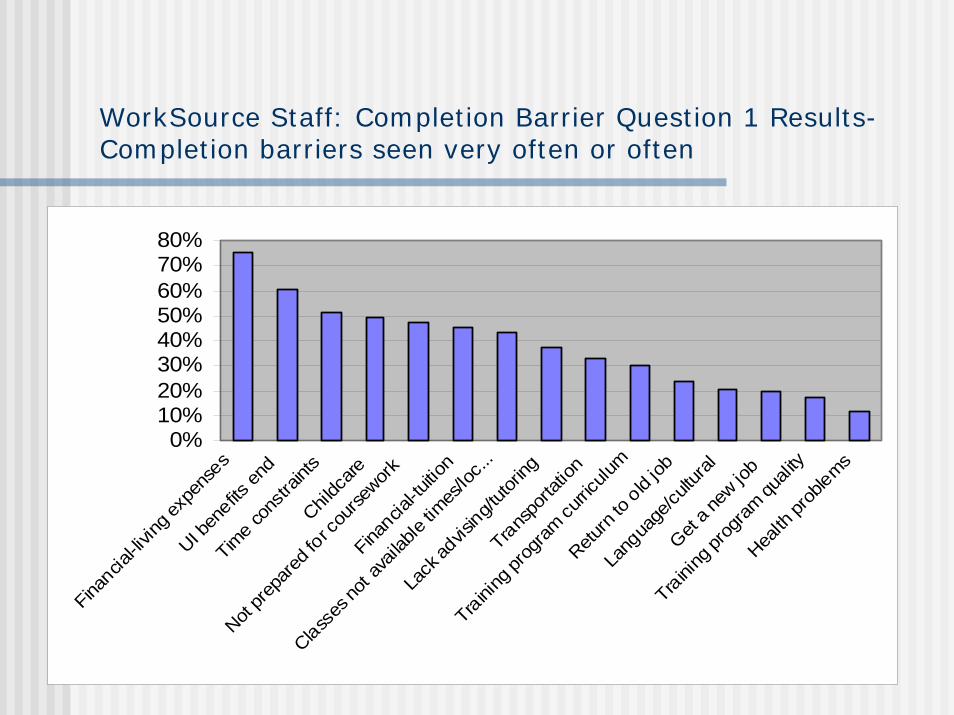
WorkSource Staff: Completion Barrier Question 1 Results-Completion barriers seen very often or often
0%10%20%30%40%50%60%70%80%
Financia
l-livin
g exp
ense
s
UI ben
efits en
d
Time co
nstra
ints
Childc
are
Not pr
epar
ed fo
r cou
rsewor
k
Financia
l-tuitio
n
Classes
not a
vaila
ble tim
es/lo
c...
Lack
advis
ing/tuto
ring
Trans
porta
tion
Training
prog
ram cu
rriculu
m
Return
to o
ld job
Lang
uage
/cultu
ral
Get a n
ew jo
b
Training
prog
ram qu
ality
Health
prob
lems

CTC Staff: Completion Barrier Question 1 Results-Completion barriers seen very often or often
0%10%20%30%40%50%60%70%80%90%
Financia
l-livin
g exp
ense
s
Not pre
pared
for c
ourse
work
Time co
nstra
ints
Financia
l-tuitio
n
Childc
are is
sues
UI ben
efits en
d
Classes
not a
vaila
ble tim
es/lo
c...
Get a n
ew jo
b
Lack
advis
ing/tuto
ring
Lang
uage
/cultu
ral
Health
prob
lems
Transpo
rtatio
n
Return
to old
job
Training
prog
ram cu
rriculu
m
Training
prog
ram qu
ality

Completion Barrier Question 2: In general, what two reasons for leaving workforce/occupational training programs, before completion, do you see most often?
Percent of respondents who listed the following types of barriers as seen most often
WorkSource CTC
Financial constraints 87% 81%
Personal or family issues 45% 34%
Lack of preparation 16% 20%
Time constraints 13% 15%

CTC Staff Only: To what extent do you agree that the following factors create barriers to student success at your college?
BarriersStrongly Agree Agree Disagree
Strongly Disagree
There are not enough short-term training programs with immediate economic payoff in the labor market.
31% 44% 23% 2%
Workforce training programs are too often not linked together to promote career ladders.
26% 45% 26% 3%
Developmental education programs are separate from workforce education programs.
23% 42% 28% 6%
ABE and ESL programs are separate from workforce education programs.
22% 42% 30% 6%
There are workforce training programs that do not result in college credit.
12% 35% 45% 8%

CTC Staff Only: To what extent do you agree that doing one or more of the following actions would result in increased student success at your college?
ActionsStrongly
Agree Agree DisagreeStrongly Disagree
Providing comprehensive support services, including childcare, transportation assistance, career counseling, academic advising, and assistance with obtaining financial aid.
75% 22% 3% 0%
Linking training programs together to help create career pathways.
45% 51% 4% 1%
Linking student services with workforce education programs.
48% 44% 6% 2%
Tying training program curriculum more closely with industry skill standards.
44% 46% 8% 2%
Linking developmental education programs with workforce education programs.
43% 44% 10% 3%
Modularizing programs to create multiple entry and exit points.
45% 41% 13% 2%
Integrating ABE/ESL with workforce education programs. 41% 45% 12% 2%
Accelerating curriculum to help students learn faster and complete programs in shorter timeframes.
20% 33% 39% 8%

1
Barriers to Access & Completion of Training
Paul SternDave Pavelchek
Washington State UniversitySocial & Economic Sciences Research Center
Puget Sound Division
360-586-9292http://www.sesrc.wsu.edu/k12
[email protected]@wsu.edu

2
Overview:Key Research Questions
• What are the barriers to enrolling in a vocational degree or certificate program?
• What are the barriers to completing a vocational degree or certificate program?

3
Overview:Populations Surveyed
• Individuals who registered with Worksource and who didn’t have any post-secondary training
• Individuals who completed a high school vocational program and earned a high school diploma
• Individuals who left a community or technical college vocational program before earning a degree or certificate

4
Overview: Survey Implementation
• Contact information that had been provided for Workforce Training Results was used for this survey
• The survey instrument was developed in collaboration with WTECB staff
• Calls were made July 5-17, 2006

5
Worksource Participants Comparing the Sample and Population by Ethnicity
4%10% 14%
4%
61%
7%3% 4%
16%
3%
72%
1%0%
25%
50%
75%
100%
Asian Black Hispanic AmericanIndian
White Other/Multi
PopulationSample

6
Labor Force Statusof Survey Respondent
70%87% 90%
67%
0%
20%
40%
60%
80%
100%
Worksource High School Voc CTC leavers with45 credits or
more
CTC leavers withless than 45
credits
Not in labor force
Discouraged
Looking for work
Employed

7
Household Incomeof Survey Respondent
63%49%
37% 37%
27%35%
30% 31%
0%
20%
40%
60%
80%
100%
Worksource High School Voc CTC leavers with45 credits or
more
CTC leavers withless than 45
credits
Over 100k$75 to $100k$50 to $75k$25 to $50kLess than $25k

8
Reasons for Not Enrolling in Training Programs
0%
20%
40%
60%
80%
100%
not aff
ord tui
tion an
d fees
other f
amily
respon
sibilitie
s
not en
ough in
fo abou
t cours
es
need in
fo abou
t progr
ams in
area
time c
onstrai
nts fro
m work
classe
s not c
onveni
ent
not en
ough in
fo abou
t job p
rospec
ts
not en
ough in
fo abou
t financ
ial aid
too much
paper
work
lack o
f afford
able tr
anspor
tation
child c
are
not pre
pared
for cou
rse de
mands
health
related
proble
ms
no lon
ger int
ereste
d in the
field
Worksource (N=51)HS Voc (N=51)

9
Reasons for Not Enrolling in Training Programs
HS Voc CompletersUnable to afford tuition and fees (70%)
Time constraints from work (54%)
Need more information about programs in local area (40%)
Family responsibilities interfered (37%)
Worksource RegistrantsUnable to afford tuition and fees (66%)
Need more information about courses I should take (57%)
Need more information about programs in local area (40%)
Family responsibilities interfered (51%)

10
What Would Help Potential Program Participants Get Into College
0%
20%
40%
60%
80%
100%
progra
ms to ge
t skills
to colle
ge lev
el
progra
ms that d
on't re
quire d
iploma
one pla
ce for
info ab
out tra
ining o
pps
opportu
nities
to lear
n on th
e job
info ab
out whic
h cour
ses to
take
financi
al aid
Info ab
out pro
grams in
area
info ab
out fin
ancial
aid
info ab
out work
ing in
a parti
cular f
ield
more co
nvenie
ntly sc
hedule
d clas
ses
Info ab
out what
to exp
ect
more co
nvenie
ntly loc
ated c
lasses
shorter
progra
ms
Info ab
out job
prospe
cts
academ
ic assi
stance
or tuto
ring
transpo
rtation
to cla
sschi
ld care
elder c
are
English
transl
ation s
ervice
s
Worksource (N=92)HS Voc (N=91)

11
What Would Help Potential Program Participants Get Into College
HS Voc CompletersOpportunities to get training while on the job (90%)
Having a single place to get information on training opportunities (87%)
More financial aid (87%)
Information about programs in the local area (84%)
Worksource RegistrantsPrograms to get skills to the college level (96%)
Having a single place to get information on training opportunities (91%)
More financial aid (87%)
Opportunities to get training while on the job (87%)

12
Reasons CTC Exiters Left Their Vocational Program
0%
20%
40%
60%
80%
100%
time c
onstrai
nts fro
m work
started
new job
or retu
rned to
old job
other f
amily
respon
sibilitie
s
not aff
ord tui
tion an
d fees
learne
d all y
ou nee
ded
classe
s not c
onveni
ent
health
related
proble
ms
dissat
isfied
with qua
lity of
instruc
tion
no lon
ger int
ereste
d in the
field
not pre
pared
for cou
rse de
mands
progra
m did no
t meet
expec
tations
child c
are
didn't
fit in w
ith oth
ers
lack o
f afford
able tr
anspor
tation
CTC leavers with less than 45 credits (N=116)CTC leavers with 45 credits or more (N=49)

13
Reasons Most CTC ExitersLeft Their Vocational Program
CTC Leavers with 45 Credits or MoreStarted new job or returned to old job (45%)
Time constraints from work (41%)
Family responsibilities interfered (39%)
I had learned all I needed from the program (35%)
CTC Leavers with Less than 45 CreditsUnable to afford tuition and fees (41%)
Time constraints from work (39%)
Started new job or returned to old job (32%)
Class times and/or location was not convenient (28%)

14
What Would Help CTCExiters Stay Enrolled
0%
20%
40%
60%
80%
100%
financi
al aid
opportu
nities
to lear
n on th
e job
more co
nvenie
ntly sc
hedule
d clas
sesinfo
about
financ
ial aid
info ab
out whic
h cour
ses to
take
single
place
for info
on tra
ining o
ppssho
rter pro
grams
more co
nvenie
ntly loc
ated c
lasses
academ
ic assi
stance
or tuto
ringchi
ld care
transpo
rtation
to cla
sseld
er care
English
transl
ation s
ervice
s
CTC leavers with less than 45 credits (N=115)CTC leavers with 45 credits or more (N=48)

15
What Would Help CTCExiters Stay Enrolled
CTC Leavers with Less than 45 CreditsMore financial aid (57%)
Opportunities to get training while on the job (49%)
Having a single place to get information on training opportunities (44%)
More information about financial aid (43%)
CTC Leavers with 45 Credits or MoreMore conveniently scheduled classes (35%)
More financial aid (33%)
Opportunities to get training while on the job (33%)
Information about which courses to take (25%)
More information about financial aid (25%)

16
Questions? Comments?