Embed Size (px)
Citation preview

Workforce Profiling Statistics
2007 - 2008
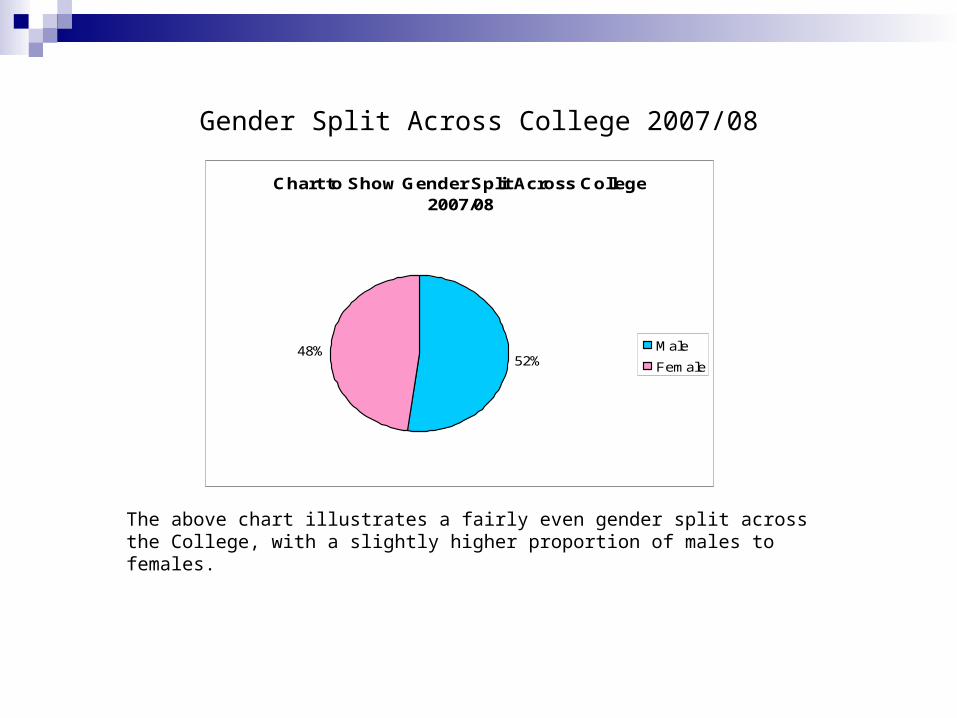
Gender Split Across College 2007/08
Chart to Show Gender Split Across College 2007/08
52%48% Male
Female
The above chart illustrates a fairly even gender split across the College, with a slightly higher proportion of males to females.

Gender of Split Across Academic and Support Functions 2007/08
Chart to Show Gender Balance within Academic and Support Functions 2007/08
43
68
57
32
0
20
40
60
80
100
120
Support Academic
Per
cen
tag
e
% Female
% Male
•The above chart highlights a fairly even gender split across the support function, with a slightly higher proportion of females employed during 2007/08.
•In relation to females in academic roles, the proportion is currently at 32%, which is an increase on the two previous academic years.
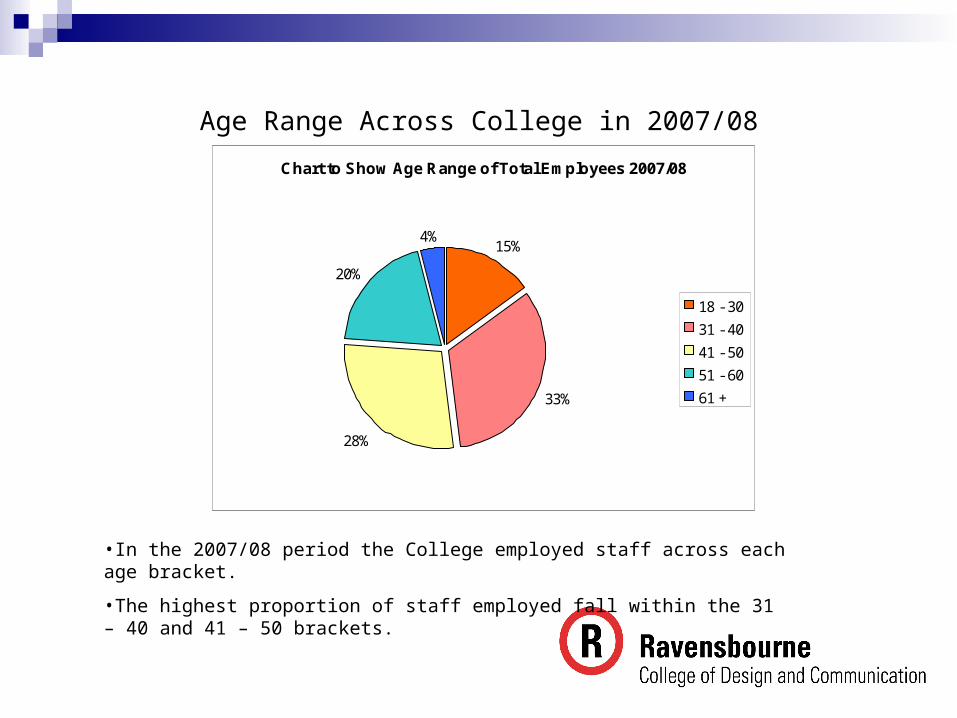
Age Range Across College in 2007/08
Chart to Show Age Range of Total Employees 2007/08
15%
33%
28%
20%
4%
18 - 30
31 - 40
41 - 50
51 - 60
61 +
•In the 2007/08 period the College employed staff across each age bracket.
•The highest proportion of staff employed fall within the 31 – 40 and 41 – 50 brackets.
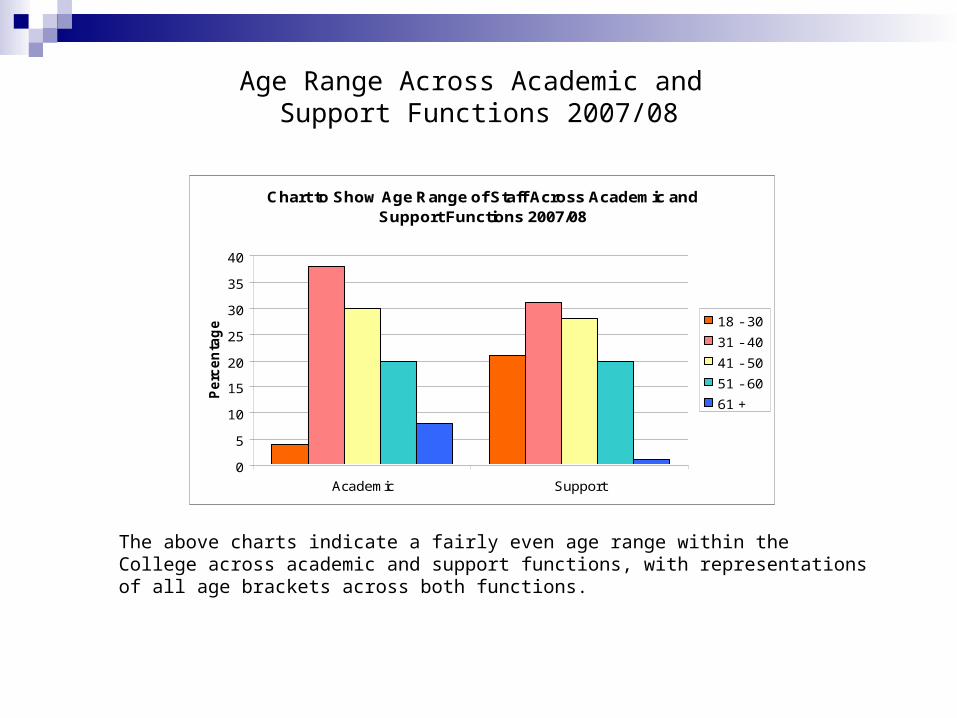
Age Range Across Academic and Support Functions 2007/08
Chart to Show Age Range of Staff Across Academic and Support Functions 2007/08
0
5
10
15
20
25
30
35
40
Academic Support
Pe
rce
nta
ge 18 - 30
31 - 40
41 - 50
51 - 60
61 +
The above charts indicate a fairly even age range within the College across academic and support functions, with representations of all age brackets across both functions.

Staff with Declared Disability 2007/08
•In 2007/08, 7% of total staff employed at the College had a declared disability.
•This remained at the same level as the last academic year 2006/07.
Chart to Show Percentage of Total Staff with Declared Disability 2007/08
7%
93%
Declared Disabled
Not Known to beDisabled
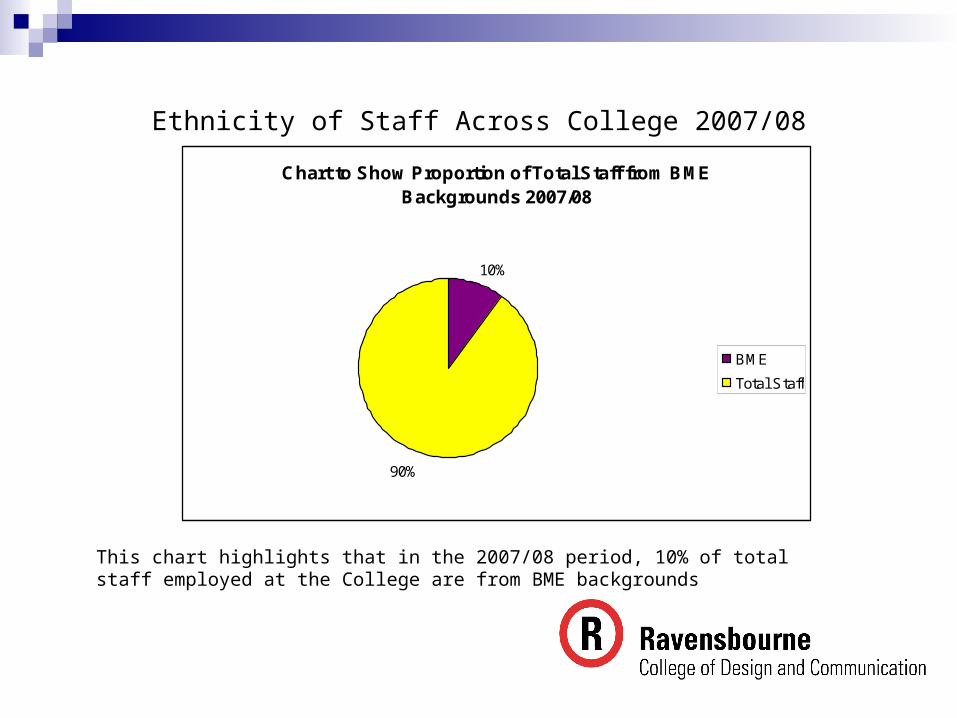
Ethnicity of Staff Across College 2007/08
This chart highlights that in the 2007/08 period, 10% of total staff employed at the College are from BME backgrounds
Chart to Show Proportion of Total Staff from BME Backgrounds 2007/08
10%
90%
BME
Total Staff

Ethnicity of Staff in 2007/08 – Academic or Support Function
Chart to Show Breakdown of where BME Staff are employed across the College 2007/08
36%
64%
Academic
Support
•A breakdown by academic and support function indicates that more BME staff are employed within support roles.
•However, when calculated in relation to total numbers of support and total numbers of academic staff, those from BME backgrounds make up 10% of each function respectively (see next slide).
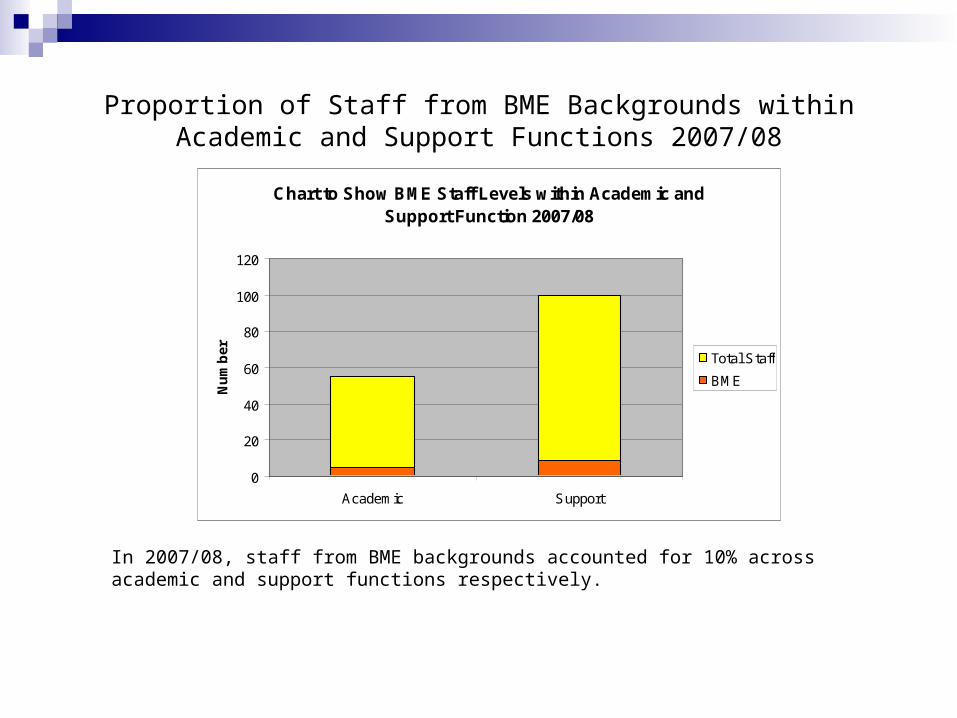
Proportion of Staff from BME Backgrounds withinAcademic and Support Functions 2007/08
Chart to Show BME Staff Levels within Academic and Support Function 2007/08
0
20
40
60
80
100
120
Academic Support
Nu
mb
er Total Staff
BME
In 2007/08, staff from BME backgrounds accounted for 10% across academic and support functions respectively.

Full Time / Fractional Staff Across College 2007/08
Chart to Show Employment Type Across College 2007/08
74%
26%
Full Time
Fractional
The above chart illustrates the split of employment type across College in 2007/08.
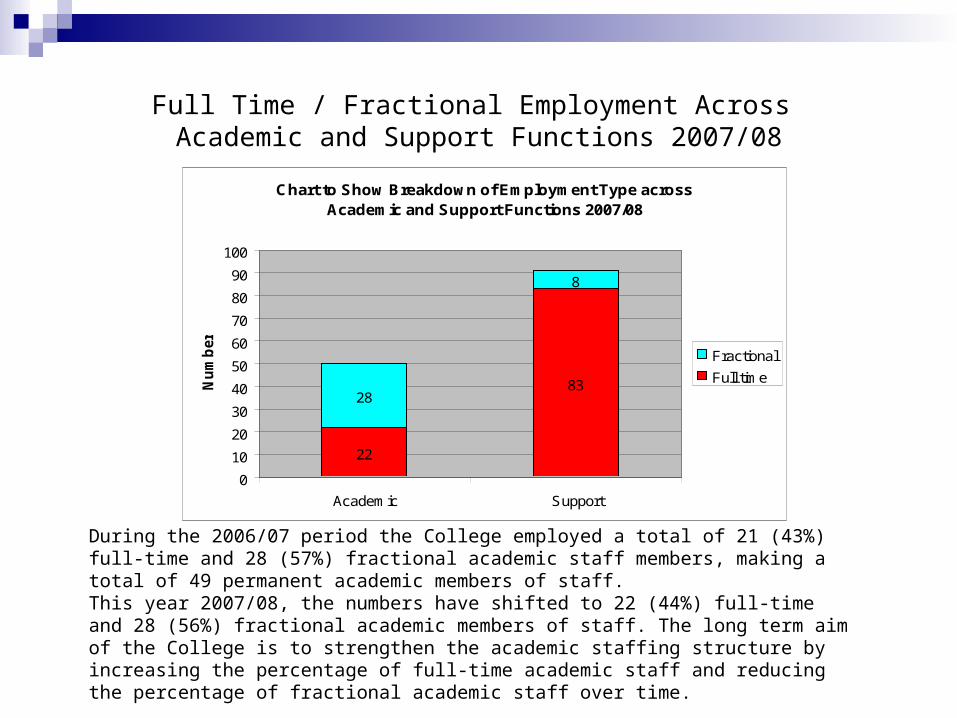
Full Time / Fractional Employment Across Academic and Support Functions 2007/08
Chart to Show Breakdown of Employment Type across Academic and Support Functions 2007/08
22
8328
8
0
10
20
30
40
50
60
70
80
90
100
Academic Support
Nu
mb
er
Fractional
Full time
During the 2006/07 period the College employed a total of 21 (43%) full-time and 28 (57%) fractional academic staff members, making a total of 49 permanent academic members of staff.This year 2007/08, the numbers have shifted to 22 (44%) full-time and 28 (56%) fractional academic members of staff. The long term aim of the College is to strengthen the academic staffing structure by increasing the percentage of full-time academic staff and reducing the percentage of fractional academic staff over time.

Leavers in 2007/08
The reasons for leaving as given during the exit interview process are detailed in the above chart, the main three being employment with another HEI in the UK (20%), redundancy (17%) and private industry/commerce in the UK (17%). The College aims to reduce turnover to a maximum of 10% in the lead up to relocation.
Chart to Show Reasons for Leaving During 2007/08
20%
3%
7%
17%
3%10%
7%
7%
3%
3%
3%
17%
Another HEI in UK
Not known
Mutual
Private industry/commerce in UK
Ill health
Other education institution in the UK
Other education institution in anoverseas countryExpiry of Fixed Term Contract
Self - employed in UK
Retirement
Freelance / Consultancy
Redundancy
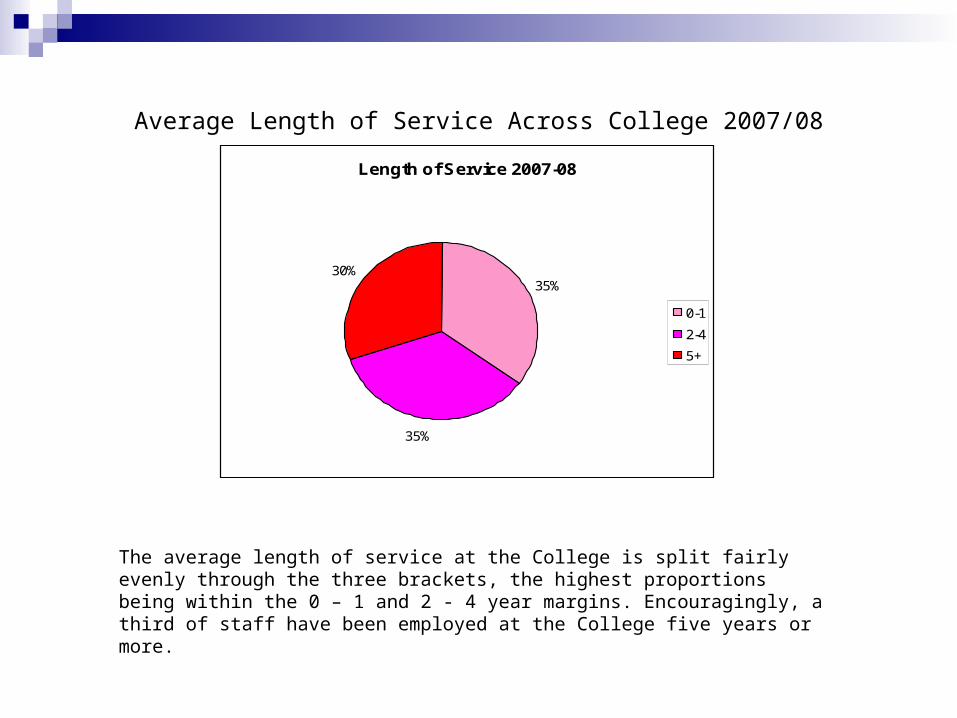
Average Length of Service Across College 2007/08
Length of Service 2007-08
35%
35%
30%
0-1
2-4
5+
The average length of service at the College is split fairly evenly through the three brackets, the highest proportions being within the 0 – 1 and 2 - 4 year margins. Encouragingly, a third of staff have been employed at the College five years or more.
Comparison of Workforce Profiling Statistics
1997 - 2008

Gender Split Across College 1997 - 2008
•Since 2002-03 the College has, through its HR Strategy, set challenging targets to increase the number of female staff employed, with particular relevance to academic staffing. •The data contained in the chart suggests that the College has been making steady progress to achieve the increase in the overall totals. •The chart illustrates a levelling off in equality of staff numbers by gender, with the percentage split over the last two academic years being almost identical.•In relation to females in academic roles, the proportion is currently at 32%, which is a 1% increase on last year and a 2% increase on 2005-06. More detailed statistical breakdown by gender can be found in the Gender Equality Scheme Review 2007.
Chart Illustrating Gender Balance Across College 1997 - 2008
0
10
20
30
40
50
60
70
1997 - 98 1998 - 99 1999 -2000
2000 - 01 2001 - 02 2002 - 03 2003 - 04 2004 - 05 2005 - 06 2006 - 07 2007 - 08
Perc
en
tag
e
Male
Female

Age Range of Employees 1997 - 2008
•The chart above illustrates the steady increase in headcount within the College, and the changes in headcount within the different age brackets.
•The notable increase has been in staff numbers in the 31 – 40 age range from 1997 – 2007. From 2005-06 to 2006-07 the number of staff in this age bracket has risen by 5%. This decreased this academic year, mainly due to a slight increase in turnover.
•Overall, the numbers of staff in all five age brackets is at a steady ratio.
Chart to Show Age Range of Employees 1997 - 2008
0
10
20
30
40
50
60
1997 -98
1998 -99
1999 -2000
2000 -01
2001 -02
2002 -03
2003 -04
2004 -05
2005 -06
2006 -07
2007-08
Nu
mb
er
18 - 30
31 - 40
41 - 50
51 - 60
61 +
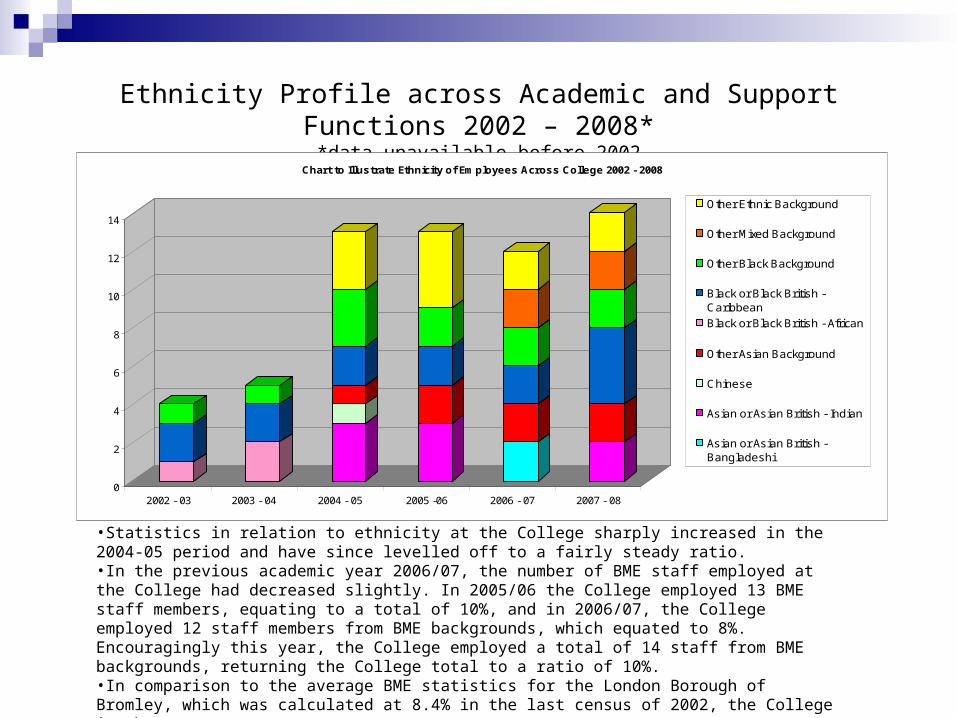
Ethnicity Profile across Academic and Support Functions 2002 – 2008**data unavailable before 2002
•Statistics in relation to ethnicity at the College sharply increased in the 2004-05 period and have since levelled off to a fairly steady ratio. •In the previous academic year 2006/07, the number of BME staff employed at the College had decreased slightly. In 2005/06 the College employed 13 BME staff members, equating to a total of 10%, and in 2006/07, the College employed 12 staff members from BME backgrounds, which equated to 8%. Encouragingly this year, the College employed a total of 14 staff from BME backgrounds, returning the College total to a ratio of 10%. •In comparison to the average BME statistics for the London Borough of Bromley, which was calculated at 8.4% in the last census of 2002, the College is above average.
0
2
4
6
8
10
12
14
2002 - 03 2003 - 04 2004 - 05 2005 -06 2006 - 07 2007 - 08
Chart to Illustrate Ethnicity of Employees Across College 2002 - 2008
Other Ethnic Background
Other Mixed Background
Other Black Background
Black or Black British -Caribbean
Black or Black British - African
Other Asian Background
Chinese
Asian or Asian British - Indian
Asian or Asian British -Bangladeshi
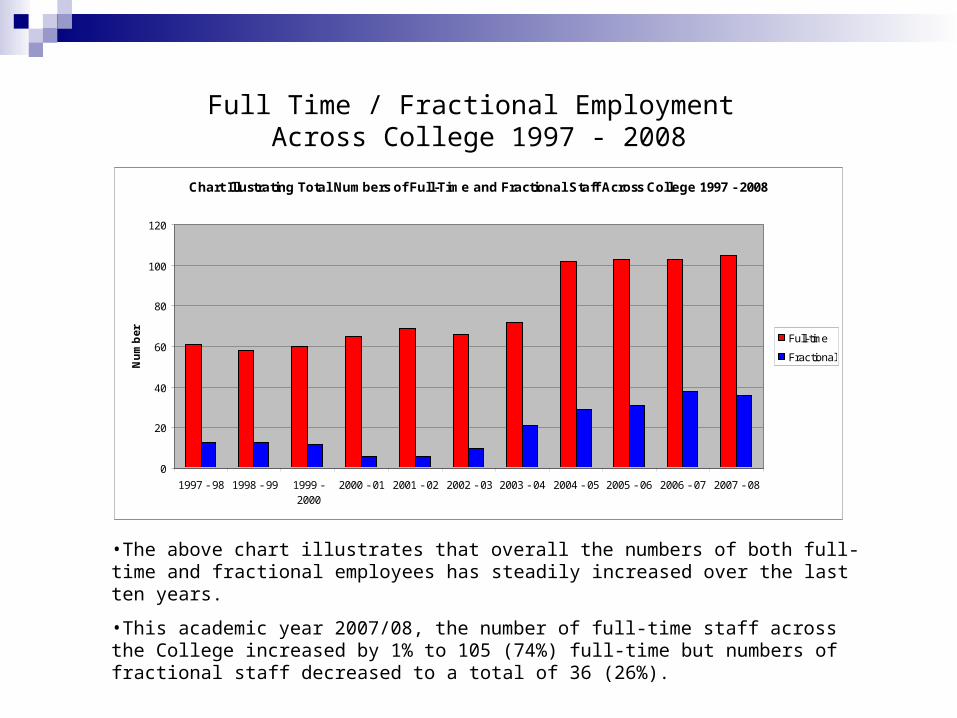
Full Time / Fractional Employment Across College 1997 - 2008
•The above chart illustrates that overall the numbers of both full-time and fractional employees has steadily increased over the last ten years.
•This academic year 2007/08, the number of full-time staff across the College increased by 1% to 105 (74%) full-time but numbers of fractional staff decreased to a total of 36 (26%).
Chart Illustrating Total Numbers of Full-Time and Fractional Staff Across College 1997 - 2008
0
20
40
60
80
100
120
1997 - 98 1998 - 99 1999 -2000
2000 - 01 2001 - 02 2002 - 03 2003 - 04 2004 - 05 2005 - 06 2006 - 07 2007 - 08
Nu
mb
er Full-time
Fractional

Staff With Declared Disability Across College 2002 – 2008*
*data unavailable before 2002
• The number of staff with a declared disability has remained steady at 7% in 2007/08, following on from 2006/07, where there was an increase on all previous years’ total of 0%.
• This is a significant increase and highlights a response to the continued efforts the College is making to attract disabled candidates and encourage existing disabled staff to declare their disability
Chart to show Numbers of Disabled Staff at the College
0 50 100 150
2002 - 03
2003 - 04
2004 - 05
2005 - 06
2006 - 07
2007 - 08
Nu
mb
er
Not Known to be Disabled
Declared Disabled
New Starters and Leavers 1997 - 2008
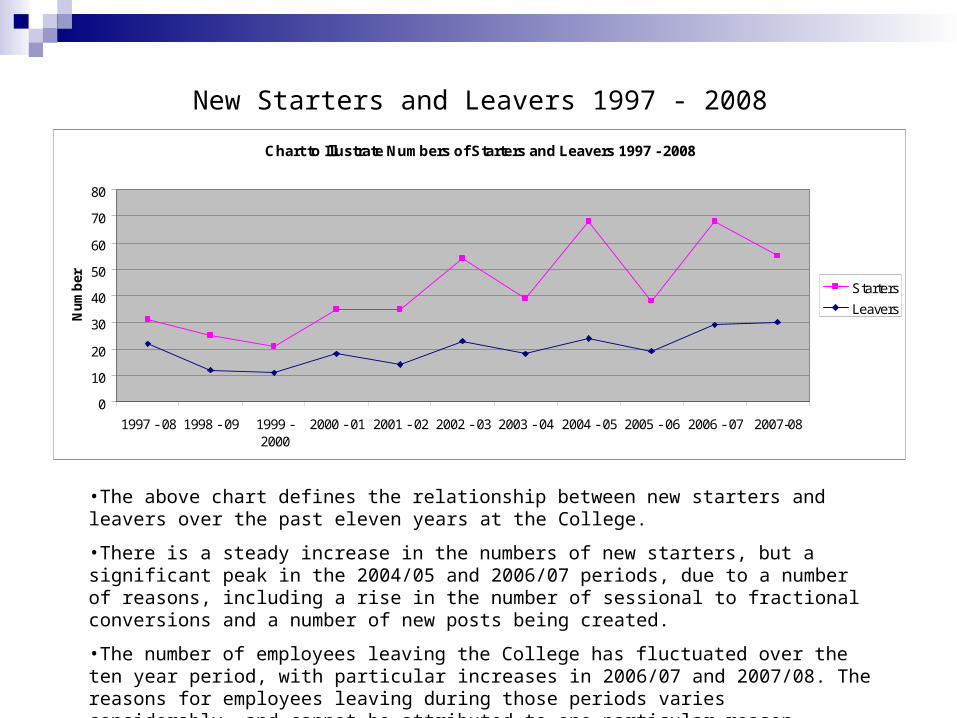
•The above chart defines the relationship between new starters and leavers over the past eleven years at the College.
•There is a steady increase in the numbers of new starters, but a significant peak in the 2004/05 and 2006/07 periods, due to a number of reasons, including a rise in the number of sessional to fractional conversions and a number of new posts being created.
•The number of employees leaving the College has fluctuated over the ten year period, with particular increases in 2006/07 and 2007/08. The reasons for employees leaving during those periods varies considerably, and cannot be attributed to one particular reason.
Chart to Illustrate Numbers of Starters and Leavers 1997 - 2008
0
10
20
30
40
50
60
70
80
1997 - 08 1998 - 09 1999 -2000
2000 - 01 2001 - 02 2002 - 03 2003 - 04 2004 - 05 2005 - 06 2006 - 07 2007-08
Nu
mb
er
Starters
Leavers

Turnover of Staff 1997 - 2008
•The chart illustrates that turnover within the College over the eleven year period of 1997 to 2008 has been steady, showing little fluctuation in response to new starters and leavers.
•The number of total staff was at an almost constant level until 2002/03, when the number of employees increased almost two-fold over a three year period from 76 to 131 employees (an increase of 42%). This continued until 2005/06, when the numbers, although still rising, began to level off to the current total of 141 permanent staff members.
•There has been a slight increase in turnover this academic year 2007/08 compared to 2006/07 (from 20% to 21%) , however this does not match the highest level seen in 2002/03 of 34%.
Chart to Show the Relationship Between Total Staff, Leavers and Turnover 1997 - 2008
0
20
40
60
80
100
120
140
160
1997 -08
1998 -09
1999 -2000
2000 -01
2001 -02
2002 -03
2003 -04
2004 -05
2005 -06
2006-07
2007-08
Nu
mb
er
Total Staff
Leavers
Turnover (%)