Embed Size (px)
Citation preview

BOURNEMOUTH UNIVERSITY
WORKING CAPITAL MANAGEMENT AND
PROFITABILTY OF UK FIRMS: A CONTINGENCY
THEORY APPROACH
ISHMAEL TINGBANI
(MBA, CBMBA, MCIB, BA)
A Thesis Submitted in Partial Fulfilment of the Requirements of Bournemouth
University for the Degree Of
Doctor of Philosophy
January 2015

2
COPYRIGHT
This copy of the thesis has been supplied on condition that anyone who consults it is
understood to recognise that its copyright rests with the author and due acknowledgement
must always be made of the use of any material contained in, or derived from, this thesis.
3
ABSTRACT
While the direct impact of working capital management (WCM) and its components
(accounts receivable in days (AR), accounts payable in days (AP) and inventory holding
period (INV)) on firms’ profitability has been examined in the previous literature, the
underlying channels of influence have remained largely unexplored. This study adopts a
contingency theory approach to investigate the relationship between WCM and
profitability controlling for selected corporate governance and company characteristics.
The study has three main objectives. The first objective is to determine the relationship
between working capital management and its components (AR, AP and INV) and
profitability as per extant research. The second objective of the research is to determine
whether the effect of working capital management on profitability of UK firms is
contingent on the interaction of environmental (E), resource (R) and management (M)
variables. The final objective is to determine whether the effect of the components of
working capital management (AR, AP and INV) on profitability of UK firms is contingent
on the interaction of ERM variables. These three objectives were met by the use of a panel
data methodology on a series of interactive models. The data for the study is based on the
annual financial reports of 225 London Stock Exchange listed firms for the period 2001-
2011.
In terms of the first objective, the study found a significant relationship between WCM
and two of its components (AR and AP) and profitability. However, no relationship was
found between WCM component (INV) and profitability. In terms of the second objective,
the results indicate that the effect of WCM on profitability is significantly moderated by
the interaction with ERM variables of the firm. Finally, the results of the third objective

4
indicate that the effect of WCM components (AR, AP and INV) on profitability is
significantly moderated by the interaction with ERM of the firm.
In terms of the control variables, the study found a statistically significant relationship
between the corporate governance factors (Chief Executive Officer (CEO) tenure and
board size) and profitability. On the other hand, company specific characteristics variables
(company size, financial leverage, assets tangibility liquidity ratio, cash flow and sales
growth) were also found to have statistically significant effect on the profitability of firms.
On the basis of this, the study concludes that firms can maximise the benefits and minimise
the cost of investment in working capital by aligning their working capital management
policies with their environment and also arrange their resources internally to support such
alignment as postulated in the contingency framework as any misalignment could
significantly affect the firms’ performance. As a result, the study suggests the need for
policy makers to match organisational resources with opportunities and threats in the
general business environment in order to improve their financial performance.
5
TABLE OF CONTENTS
COPYRIGHT 2
LIST OF TABLES 9
ACKNOWLEDGEMENTS 10
DECLARATION 11
DEDICATION 12
LIST OF ABBREVIATIONS AND ACRONYMS 14
1. CHAPTER ONE 17
OBJECTIVES AND OVERVIEW OF THE RESEARCH
1.1 INTRODUCTION 17
1.2 MOTIVATION AND NEED FOR THE STUDY 19
1.3 AIMS AND OBJECTIVES OF THE RESEARCH 20
1.4 SUMMARY OF RESEARCH METHODOLOGY 21
1.5 MAIN FINDINGS 22
1.6 CONTRIBUTIONS OF THE RESEARCH 25
1.7 OUTLINE OF THE RESEARCH 27
2. CHAPTER TWO 31
TRENDS AND DEVELOPMENTS IN WORKING CAPITAL MANAGEMENT IN
UK
2.1 INTRODUCTION 31
2.2 WORKING CAPITAL AND THE LATE PAYMENT PROBLEM IN THE UK 31
2.3 CONCLUSION / SUMMARY 43

6
3. CHAPTER THREE 45
LITERATURE REVIEW
3.1 INTRODUCTION 45
3.2 THE RELATIONSHIP BETWEEN WORKING CAPITAL MANAGEMENT AND
PROFITABILITY 46
3.3 CONTROL VARIABLES 66
3.4 SUMMARY OF PREVIOUS RESEARCH 76
3.5 LIMITATION OF EXISTING RESEARCH AND NEED FOR FURTHER RESEARCH 84
3.6 SUMMARY AND CONCLUSION 86
4. CHAPTER FOUR 87
TOWARDS A CONTINGENCY THEORY OF WORKING CAPITAL MANAGEMENT
4.1 INTRODUCTION 87
4.2 CONTINGENCY THEORY FRAMEWORK 87
4.3 THE CONCEPT OF FIT AND MISFIT IN CONTINGENCY MODELS 90
4.4 CONCLUSION 96
5. CHAPTER FIVE 97
HYPOTHESES DEVELOPMENT
5.1 INTRODUCTION 97
5.2 WORKING CAPITAL MANAGEMENT AND PROFITABILITY 98
5.3 WORKING CAPITAL MANAGEMENT, ORGANISATIONAL CONTINGENCIES AND
PROFITABILITY 93
5.4 CONTROL VARIABLES AND PROFITABILITY 116
7
CHAPTER SIX 131
RESEARCH METHODOLOGY
6.1 INTRODUCTION 131
6.2 DATA DESCRIPTION AND SAMPLE SELECTION 131
6.3 DATA ANALYSIS METHODS 142
6.4 CONCLUSION 156
7. CHAPTER SEVEN 158
RESULTS OF THE RELATIONSHIP BETWEEN WORKING CAPITAL
MANAGEMENT AND PROFITABLITY
7.1 INTRODUCTION 158
7.2 DESCRIPTIVE STATISTICS 158
7.3 CORRELATION ANALYSIS 162
7.4 MULTIPLE REGRESSION RESULTS 166
7.5 DISCUSSION 172
7.6 CONCLUSION 158
8. CHAPTER EIGHT 176
RESULTS ON THE RELATIONSHIP BETWEEN WORKING CAPITAL
MANAGEMENT AND PROFITABLITY: THE CONTINGENCY THEORY
APPRACH
8.1 INTRODUCTION 176
8.WORKING CAPITAL MANAGEMENT, CONTINGENCY VARIABLES AND
PROFITABILITY 176
8.3 DISCUSSION 181
8.4 ROBUSTNESS TESTS 186
8.5 CONCLUSION 195
9. CHAPTER NINE 197

8
9.1 INTRODUCTION 197
9.2 RESEARCHOBJECTIVES 197
9.3 RESEARCH METHODOLOGY AND METHODS 198
9.4 RECOMMENDATION/POLICYIMPLICATIONS 199
9.5 CONTRIBUTION TO KNOWLEDGE 203
9.6 LIMITATIONS OF THE RESEARCH 205
9.7 FURTHER RESEARCH 208

9
LIST OF TABLES
Table 1 Summary Of Content Analysis Of Previous
Studies On The Relationship Between
Working Capital Management And
Profitability
52
Table 2 A Chart Showing A Multidimensional
Contingency Model
115
Table 3 Summary Of Variables And Hypothesis
Signs
150
Table 4 Assumption Of Quantitative Research
Paradigms
163
Table 5 Summary of the Sample Selection Procedure 165
Table 6 Definition Of Variables Included In The
Regression Models
171
Table 7
Descriptive Statistics For All Continuous
Variable Adopted In Estimating The
Relationship Between Working Capital, Its
Contingencies And Profitability
188
Table 8 Correlations Matrix For All Continuous
Variable Adopted In Estimating The
Relationship Between Working Capital, Its
Contingencies And Profitability
193
Table 9 Regression Results Of The Relation Between
Working Capital Management And
Profitability
197
Table 10
Regression Results Of The Relationship
Between Working Capital Management, Its
Contingencies And Profitability
202
Table 11
Robustness Results Of The Relationship
Between Working Capital Management And
Profitability Using Cash Flow Constraint As
A Criteria
209
Table 12
Robustness Results Of The Relationship
Between Working Capital Management And
Profitability Using Cash Flow Constraint As
A Criteria
213
Table 13
Robustness Results Of The Relationship
Between Working Capital Management,
Organisational Contingencies And
Profitability Using Cash Flow Constraint As
A Criteria
216

10
ACKNOWLEDGEMENTS
I would have not been able to complete my dissertation without the guidance and patience
of the following people. It is to them that I render my sincere gratitude.
I would like to express my deepest gratitude to my advisor Associate Professor Venancio
Tauringana and Dr. Suranjita Mukherjee who undertook to act as my supervisors despite
their many other academic and professional commitments. Their wisdom, knowledge and
commitment to the highest standards inspired and motivated me. I also wish to thank
Associate Professor George Filis and Professor Jens Holscher for their positive feedback
on my transfer viva. Much thanks and gratitude goes to Professor Allan Webster, Professor
Jenny Piesse , Professor Andy Mullineux and all students at the department of accounting,
economics and finance in Bournemouth university for their constructive feedback during
the annual 2012/2013 and 2013/2014 postgraduate research conference. Am so grateful
to the graduate school of Bournemouth university for its funding support to Copenhagen
and Paris to present my PhD work to a wider international audience.
My sincere thanks go to my lovely wife Joyce M Tingbani without whom this effort would
have been worth nothing. Her love, support and constant patience have taught me so much
about sacrifice, discipline compromise and hope during hard times. Am so grateful to my
son Jaden Samoya Tingbani who was born during PhD days and spends much time with
mummy to allow me to focus. I am deeply sorry son for the time we spent apart.
I would also like to thank my parents Leonard S. Tingbani and Grace Ewuntomah for
investing so much in my education to get to this level of my career. Am richly grateful
even though daddy you departed so soon. You have always supported, encouraged and

11
believed in me, in all my endeavours. May you soul rest in perfect peace. To my three
lovely sisters, Maria Tingbani, Fatahia Tingbani and Falila Tingbani, I thank you for your
constant support, encouragement and prayers during my studies. I also wish to thank my
lovely cousin Anita Takura Tingbani of Nottingham University for taking time to proof
read this thesis. Very much grateful.

12
DECLARATION
This thesis is submitted in fulfilment of the requirements for the degree of Doctor of
Philosophy (Finance) at the Bournemouth University, United Kingdom. I declare that this
thesis is based on my original work except for quotations and citations which have been
duly acknowledged. I also declare that this thesis has not been previously or concurrently
submitted, either in whole or in part, for any other qualification at the Bournemouth
University or other institutions.
Ishmael Tingbani
January 2015

13
DEDICATION
I dedicate this dissertation to my lovely wife Joyce M Tingbani and son Jaden Samoya
Tingbani for their continuous support, encouragement and constant love throughout my
life.

14
LIST OF ABBREVIATIONS AND ACRONYMS
AIC Akaike Criterion
AMEDEUS Analyse Major Databases From European Sources
AP Average Days Payables Period
APERM Interaction Of Environmental Resource And
Management Variables With Account Payables Period
AR Average Days Receivable Period
ARERM Interaction Of Environmental Resource And
Management Variables With Account Receivable
Period
ATAN Assets Tangibility
BA Bachelor Of Arts
Bodsize Board Size
BSE Bombay Stock Exchange
CA Current Assets
CL Current Liabilities
CCC Cash Conversion Cycle
CMBA Chartered Banker Master Of Business Administration
CERM Interaction Of Environmental Resource And
Management Variables With Cash Conversion Cycle
CEO Chief Executive Officer
CFL Cash Flow
CMRC Credit Management Research Centre
CR Liquidity Ratio
DSO Days Sales Outstanding
E Environmental Variable
EBIT Earnings Before Interest And Tax
EU European Union
EOQ Economic Order Quantity
FE Fixed Effects
FIRMSIZE Company Size

15
GLS Generalised Least Square
GMM Generalized Method Of Moments
I Industry
INV Average Inventory Holding Period
INVERM Interaction Of Environmental Resource And
Management Variables With Average Inventory
Holding Period
ISE Istanbul Stock Exchange
IOD Institute Of Directors
JSE Japanese Stock Exchange
JIT Just-In-Time
KSE Karachi Stock Exchange
LSE London Stock Exchange
LEV Financial Leverage
M Management Variables
MCIB Member Of Chartered Institute Of Bankers
MBA Master In Business Administration
NSE Nairobi Stock Exchange
NYSE New York Stock Exchange
OBS Observations
OLS Ordinary Least Square
OTC Over-The-Counter
PI Profitability Index
PHD Doctor Of Philosophy
POH Pecking Order Hypothesis
RBV Resource-Based View
R&D Research And Development
POT Pecking Order Theory
R Resource Variables
RE Random Effect

16
ROA Return On Assets
ROE Return On Equity
S Sales
SGRTH Growth Opportunity
SCP Structure-Conduct-Performance
SMEs Small And Medium Enterprises
TA Total Asset
Tenure CEO Tenure
TFA Total Fixed Assets
TD Total Debt
TO Turnover
TSE Tokyo Stock Exchange
UK United Kingdom
US United States
USA United States Of America
WCM Working Capital Management

17
CHAPTER ONE
OBJECTIVES AND OVERVIEW OF THE RESEARCH
1.1 INTRODUCTION
Working capital management (WCM) is a significant area of financial management and its
administration impacts on the firm’s profitability, risk and consequently its value (Deloof,
2003). Firms can choose between the relative benefits of two basic types of strategies for
net working capital management: aggressive financing policy where firms minimise their
working capital investment with a low level of current assets as a percentage of total assets
or alternatively, a conservative financing policy, where it uses more long-term debt and
capital and less current liabilities (Afza and Nazir, 2007; Dong and Su, 2010). Under the
first view, higher working capital levels allow firms to increase their sales and obtain
greater discounts for early payments (Deloof, 2003) which may increase firms’ value
(Baños-Caballero et al., 2013). For example, if the firm adopts an aggressive WCM policy,
a reduction in the investment in working capital will result in minimising the amount of
inventory and accounts receivable. Minimising inventory means that storage and insurance
costs will be reduced, thus increasing profitability. Keeping accounts receivable to a
minimum will also increase profitability as these funds can either earn interest or be
invested elsewhere.
With the conservative policy, higher working capital levels need to be financed and,
consequently, firms face additional financing expenses that increase their probability of
going bankrupt (Kieschnick et al., 2009). The strategy could lead to an increase in the
investment in working capital. A conservative working capital management strategy is
aimed at stimulating sales through increased inventory levels and trade receivables in order

18
to increase profitability (Tauringana and Afrifa, 2013). This is because an increase in
inventories can prevent production disruptions (Garcia-Teruel and Martinez-Solano, 2007),
reduce the risk of stock-out (Deloof, 2003), reduce supply costs and price fluctuations
(Blinder and Maccini, 1991). Also an increase in accounts receivable can increase sales as
it allows customers time to pay (Long et al., 1993; Deloof and Jegers, 1996), reduce the
information asymmetry between the buyer and the seller, and can be an inexpensive source
of credit for customers (Peterson and Rajan, 1997; Deloof, 2003). Consequently, firms
need to evaluate the trade-off between expected profitability and risk before deciding the
optimal level of investment in current assets (Garcia-Teruel and Martinez-Solano, 2007).
Firms can minimise risk and increase profitability by understanding the importance of
working capital management. Evidence from Wilson (2008) demonstrates the importance
of working capital management to UK firms. The provision of credit among firms in the
UK has been a prevalent practice and exists as long as business-to-business trade exists. It
is estimated that about 80 per cent of business-to-business transactions are on credit
(Wilson, 2008). According to Wilson and Summers (2002), “trade credit in the UK
exceeds the primary money supply by an average factor of 1.5 and represents one of the
most important forms of financing ...…. [exceeding] the business lending of the entire
banking system’’ (Lee and Stowe, 1993, p. 285). According to Manager (2009), £26 billion
is currently owed by their customers of British businesses making trade debtors one of the
riskiest assets UK firms are likely to have (Paul and Wilson, 2006; Peel et al., 2000; Pike et
al., 1998). Given these characteristics, it is perhaps unsurprising that the efficient
management of working capital and good credit management practice have been stressed
as being pivotal to the health and performance of firms in the UK (Peel et al., 2000). The
focus of this study is to contribute to current debate on the relationship between working

19
capital and profitability among companies listed on the main market of the London Stock
Exchange (LSE).
1.2 MOTIVATION AND NEED FOR THE STUDY
The study has the following motivations. First, the focus of current studies has traditionally
been on estimating direct relationship between working capital management and
profitability without focusing on the interactive impact of internal and external
environment in which firms operate. Consequently, the study explores whether the
relationship between working capital on profitability may be contingent on the interaction
of external and internal characteristics of the firm. It acknowledges the view that working
capital management may have an impact on profitability as established by extant studies
(Shin and Soenen, 1998; Deloof, 2003; García-Teruel and Martínez-Solano, 2007), but
argues that such a relationship may be constrained by environment, resources and
management variables, as proposed in the contingency theory framework.
Second, our knowledge and understanding of the working capital management policies
among large firms in the UK is currently inadequate in view of the fact that late payment
and working capital management has been identified as the primary source of business
failures. The few existing studies (Howorth and Westhead, 2003; Tauringana and Afrifa,
2013) that have investigated this area have primarily focused on smaller firms. The reason
for this is often associated with the fact that smaller firms lack access to external finance
(Whited, 1992; Fazzari and Peterson, 1993; Peterson and Rajan, 1997) and rely heavily on
working capital management as a vital source of finance (Padachi, 2006). However
according to Deloof (2003), the management of working capital for large firms is equally
important since most large firms tend to have a large amount of cash invested in working
capital, as well as substantial amounts of short-term payables, as a source of financing.

20
Third, the conflicting results of the existing literature on the relationship between working
capital management and profitability also motivated this study. While some studies suggest
a positive relationship (Dong and Su; 2010; Mathuva, 2010) between working capital
management variables and profitability, others advocate a negative association (see,
Deloof, 2003; García-Teruel and Martínez-Solano, 2007; Falope and Ajilore, 2009).
Different researchers also give varying explanation for the direction of the association
between WCM and profitability. In the light of this evidence, the study seeks to contribute
to existing knowledge on the relationship between working capital management and
profitability.
1.3 AIM AND OBJECTIVES OF THE RESEARCH
The main aim of the study is to investigate whether the relationship between WCM and
profitability is contingent on the environment, resources and management of the firm. This
is consistent with the contingency theoretical framework and other empirical research
devoted to the analysis of working capital management and profitability. The aim will be
met by the following objectives:
1. To determine whether there is a relationship between aggregate working capital
management and its components (accounts receivable in days, accounts payable in
days and inventory days) and profitability as per extant research.
2. To determine whether the effect of working capital management on profitability is
contingent on the interaction of environmental, resource and management variables
of UK firms.
3. To determine whether the effect of the components of working capital management
(accounts payables in days, accounts receivables in days, and inventory held in
21
days) on profitability is contingent on the interaction of environmental, resource
and management variables of UK firms.
1.4 SUMMARY OF RESEARCH METHODOLOGY
The data for the study is based on the annual financial reports of 225 London Stock
Exchange listed firms for the period 2001-2011. The choice of the sample was guided by
two conditions. First, companies must have financial data for the period 2001-2011. This
period covers the entire period of the old and new UK late payment of Commercial Debts
(Interest) Act 1998, which is from 1st of January 2000 to 31st of December 2011. Second,
financial firms such as banks and insurance firms, were excluded due to their different
accounting requirements (e.g. Mangena and Tauringan, 2008), financial characteristics
and investment in working capital (Falope and Ajilore, 2009). The two criteria were
necessary to allow for easy comparability with similar studies and to permit the use of
balanced panel data, which has the advantage of more degrees of freedom and less
multicollinearity among variables (Gujarati, 2003)
The main dependent variable of the study is return on assets (ROA). It has been adopted
as a measure of profitability because it has more desirable distributional properties than
other accounting measures, such as return on equity (Core et al., 2006) and also allows
easy comparability with similar studies (e.g., Deloof, 2003; Tauringana and Afrifa, 2013;
Lazaridis and Tryfonidis, 2006). The study has two sets of independent variables. The first
set of independent variables include the traditional WCM (measured by cash conversion
cycle) and its components (accounts payable in days, accounts receivable in days and
inventory held in days) adopted by previous studies (Garcia-Teruel and Martinez-Solano,
2007, Tauringana and Afrifa, 2013). The second set of variables includes the set of
contingent variables. These variables moderate the relationship between working capital

22
management and profitability. These contingencies are classified into three components by
Luthan and Steward (1977): Environmental (E); Resources (R) and Management (M)
variables of the firm. The control variables employed in this study are divided into two
involving corporate governance variables and company characteristics variables. The
corporate governance variables include: Chief Executive Officer (CEO) tenure and board
size while company specific characteristics variables include: company size, asset
tangibility, financial leverage, liquidity ratio and sales growth.
1.5 MAIN FINDINGS
The findings of the study accomplish the three main objectives set out for the study. The
first objective was to determine the relationship between WCM and its components (AR,
AP, and INV) and profitability as per extant research. The evidence from the study
indicates a significantly negative relationship between WCM and profitability. This
supports the argument made by some previous studies (Deloof, 2003; Banos-Caballero et
al., 2013) that by minimising the investment in working capital, firms could enhance
profitability due to the lower cost of financing and less reliance on external finance
(Banos-Caballero, et al., 2013); reduced administrative costs (Mian and Smith, 1992) and
less debt defaults (Cheng and Pike, 2003). The study also found a significantly negative
relationship between accounts receivable (AR) and profitability. This evidence is
consistent with studies of Deloof (2003); Lazaridis and Tryfonidis (2006); Padachi (2006);
Garcia-Teruel and Martinez-Solano (2007) that a lower (AR) period improves companies’
profitability because it frees up cash, which could be used to make payment of bills on
time in order to enjoy early payment discounts and also helps the company to avoid the
costly need of borrowing to fund investment in customers.
On the other hand, results of the study on the relationship between accounts payables (AP)
and profitability rather found a significantly positive relationship. The evidence suggests

23
that through early payments of credit, firms are able to enhance their profitability through
reduce transactional cost (Ferris 1981; Emery, 1987), enhance discount for early payment
(Petersen and Rajan, 1997, 1994; Mian and Smith, 1992; Brennan et al., 1988; Schwartz
and Whitcomb, 1979) and reduce information asymmetry between buyers and sellers
(Smith, 1987; Long et al., 1993; Pike et al., 2005).
Finally, evidence from the study also suggests a negative but insignificant relationship
between inventory holding period and profitability. On the basis of the evidence above, the
study concludes that by recovering receipts from credit sales quickly whiles speeding up
cash disbursements, companies could maximise their profitability. This result is consistent
with prior studies that have looked into the relationship between working capital
management and company profitability.
With respect to the second and third objective, the study estimated the relationship between
working capital, its contingencies and profitability by interacting each component of
working capital (AR, AP and INV) with environmental (E), resource (R) and management
(M) variables as postulated in the contingency theory framework. In terms of the second
objective, the study finds that the interaction of the main traditional measure of working
capital (i.e., cash conversion cycle (CCC)) and organisation contingencies (environmental,
resources and management factors) positively moderates the relationship between working
capital management and profitability. On the other hand, when results of objective one was
compared to the second, the study finds the relationship between working capital
management and profitability to be better enhanced with the introduction of each
interactive term. Against this evidence, the study suggests that the impact of working
capital management on profitability of UK firms is modified and constraint by
organisational contingencies (environmental, resource and management) variables of the
firm. Therefore, the study suggests that a firm could maximise the benefit of pursuing a

24
lower cash conversion cycle (lower cost of financing and less reliance on external finance,
reduced administrative costs and less debt defaults) by aligning the strategy with the
environment and supporting such an alignment with resource and management capability.
However, in the third objective, the study also documented that the relationship accounts
receivables (AR) and profitability is positively moderated by interaction of accounts
receivables a (AR) and organisation contingencies (ERM) factors. In terms of accounts
payables (AP), the study documented significantly positive relationship between
profitability and the interaction of accounts payables (AP) and organisation contingencies
(ERM) factors. The findings also confirm the hypothesis that the interaction of
environmental, resources and management factors significantly moderates the relationship
between accounts payables and profitability.
Finally, the study found a positive and significant relationship between profitability and
the interaction of inventory level (INV) and organisation contingencies (environmental,
resources and management factors). However, when the findings of the study in objective
one was compared to results of objective two, the study finds the relationship between
working capital management and profitability to be better enhanced with the introduction
of each interactive term. Against this evidence, the study suggests that the impact of
working capital management on profitability of UK firms is modified and constrained by
organisational contingencies (environmental, resource and management) variables of the
firm. On the basis of this, the study concludes that firm can maximise the benefits and
minimise the cost of investment in working capital by aligning their working capital
management policies with their environment and also arrange their resources internally to
support such alignment as postulated in the contingency framework as any misalignment
could significantly affect the firms’ performance. As a result, the study suggests the need

25
for policy makers to match organisational resources with opportunities and threats in the
general business environment in order to improve their financial performance.
1.6 CONTRIBUTION OF THE RESEARCH
The research makes a number of contributions to existing research. The most important
contribution is the provision of evidence, for the first time, that the effect of WCM and its
components (AR, AP and INV) on profitability is significantly moderated by the
interaction of ERM. Although existing research (e.g., Deloof, 2003; Tauringana and Afrifa,
2013) have made a number of both theoretical and empirical contributions on the
relationship between WCM, its components (AR, AP and INV) and profitability, they
have not investigated whether the relationship may be contingent on organisational
contingencies (environment, resources and management) of the firm as postulated by
contingency theory. This is because a number of studies indicate that firms change their
policy over time as they adjust to the demands of their environment (Ambrosini et al.,
2009; Rueda-Manzanares et al., 2008) and their resources (Mol and Wijnberg, 2011) and
management capabilities (Luo et al., 2013) in order to positively influence performance.
The other significant contribution of the research is that it demonstrates that the impact of
(INV) and (AP) on firms’ profitability changes under different conditions. Like other
previous studies (Rajeev, 2008; Tauringana and Afrifa, 2013), the study found that WCM
component (INV) does not drive the profitability of many firms. However, when ERM
variables were taken into account, the results show that INV had a significant impact on
profitability. Similarly, while WCM component (AP) does have a significant direct effect
on profitability, the results show that when ERM variables are taken into account, AP does
not have a significant impact on profitability. This suggests that the impact of (INV) and
(AP) on firms’ profitability needs to be understood in the context of firm-specific
26
characteristics. This will help managers identify the conditions under which firms are more
effective as decision-making groups and which contingencies enhance or constrain firms’
ability to enhance profitability through investment in working capital. For instance,
Sprague and Wacker (1996) contend that a firm’s inventory is controlled rather than
managed in order to drive the practice and performance of firms. The rational is that
inventory management is not generally treated as a critical or strategic activity for firms
because it constitutes part of the businesses strategic objectives.
According to their evidence, firms need to control their inventory by formulating detailed
set of activities surrounding the order practices of individual inventory items taking into
context the firm-specific characteristics which Luthans and Steward (1977) classified as
environmental, resource and management factors. On the other hand, since (AP)
constitutes a significant portion of firms’ current assets used as a source of short-term
financing for companies (Garcia-Teruel and Martinez-Solano, 2010) firms need to
efficiently management rather than controlled (AP) to enhance their profitability.
Finally, the study also contributes to the limited research evidence on the relationship
between WCM and its components (AR, AP and INV) profitability in UK where current
knowledge and understanding is limited in view of the fact that late payment problems has
been identified as a source of business failure. The few existing studies (Howorth and
Westhead, 2003; Tauringana and Afrifa, 2013) that have investigated this area have
primarily focused on smaller firms. The current research therefore contributes by proving
evidence of the effect of WCM and its components (AR, AP and INV) based on large
listed UK firms. The results in respect of large companies may be different to those
reported in respect of smaller companies given that Wilison (2008) suggests that large
firms tend to use their market power to exploit their ‘dominant’ positions as buyers in
27
competitive supply markets by taking ‘extended’ trade credit and thus leveraging their own
profit and cash-flow.
1.7 OUTLINE OF THE RESEARCH
The thesis is composed of nine chapters and is structured as follows: Chapter two examines
the recent developments and trends in working capital management in the UK. It
acknowledges that many UK businesses have failed because of poor credit management
and the main source of this problem is in late payment among businesses in the UK. The
chapter is presented in two sections. The first section provides extensive discussion on the
nature of the working capital and late payment problem, it reviews the causes of the
problem and the various policy interventions instituted by the government and policy
makers. The final section provides a summary of the chapter.
Chapter three presents the literature review of the study. It reviews empirical literature on
the relationship between working capital management, its components and profitability.
The rationale is to determine whether there is any consistency in the findings of the impact
of working capital on firm profitability. It starts with the discussion of how working capital
management, its components (accounts receivable (AR), accounts payable (AP) and
inventory management (INV)) affects profitability differently. This is followed by a
discussion of the influence of other control variables found to influence the relationship,
then a summary of the results of previous empirical studies, limitation of current research
and final summary and conclusion of the chapter.
Chapter four reviews the main theoretical underpinnings of the relationship between
working capital management, its contingencies and profitability. It adopts the contingency
theory to explain the relationship between working capital management, its contingencies

28
and performance. The framework enabled prior identification of the relevant research
questions and the independent variables to direct the study.
Chapter five of the study translates both the theoretical and empirical studies discussed in
chapter four on the relationship between working capital management, its contingencies
and profitability into testable hypotheses. The first four hypotheses determine the direct
relationship between working capital management (WCM), its components (AR, AP and
INV) and profitability as determined by previous studies. The objective is to isolate the
impact of WCM, its components (AR, AP and INV) on profitability in order to determine
if the impact may be caused by multiple contingent factors as postulated in the contingency
framework. The second four hypotheses are developed to determine whether the impact of
WCM and its components (AR, AP and INV) on profitability is constrained by the
interaction of contingent factors as postulated in the contingency framework in chapter
five. The four hypotheses developed, however estimate the importance of these contingent
variables in investigating the relationship between WCM and its components (AR, AP and
INV) on profitability. In the final section, eight set of hypotheses tests the influence of
other control variables on firms’ profitability. These control variables are divided into
company characteristics variables and corporate governance variables.
The methodology of the thesis is presented in chapter six. The chapter provides a detailed
description of the data and methodology adopted, rational for the choice of data and
methodology. It starts with a description of the data and procedure for sample selection, the
various variables employed in establishing the hypotheses. This is followed by a discussion
on the tools used for data analysis.
Chapter seven presents empirical results on the study on the relationship between working
capital management, its contingencies and profitability. It presents empirical results of the
29
sixteen hypotheses formulated in the first and second part of chapter five using the
methodological framework presented in chapter six. The chapter presents the empirical
evidence of the direct relationship between WCM and its components (AR, AP and INV)
on profitability whiles controlling for selected corporate governance and company
characteristics as examined by most previous studies. Its objective is to isolate the impact
of WCM and its components (AR, AP and INV) on profitability in order to determine if
the impact may be caused by multiple contingent factors as postulated in the contingency
framework.
In chapter eight, the study presents empirical evidence of the relationship between working
capital management, its contingencies and profitability. The chapter is divided into two
major sections. The first section investigates the relationship between working capital
management and profitability using the contingency theory framework. It presents
empirical results of the last four hypotheses developed to determine whether the impact of
working capital management on profitability is constrained by the interaction of contingent
factors as postulated in the contingency framework in chapter five. In the final section, a
further analysis of the relationship between working capital management, its components
and profitability was estimated to enhance the robustness of the results. Following the
work of Baños-Caballero et al. (2013), the study sample was divided into two, based on the
cash flow composition of firms. Firms with a cash flow above the sample median are
assumed to be less likely to lack cash flow, whiles firms with a cash flow below the sample
median are assumed to suffer from a lack of cash flow. The study used the akaike criterion
(AIC) as a decision criterion for the best fit models.
Chapter nine presents a final summary and conclusion of the thesis. It provides a summary
of the research objective, methodology and techniques adopted for the study. It also

30
summarises the policy implication, contribution as well as the main limitations and
potential insight for future research and improvements of the study.
31
2 CHAPTER TWO
TRENDS AND DEVELOPMENTS IN WORKING CAPITAL MANAGEMENT IN
UK
2.1 INTRODUCTION
This chapter presents a discussion on recent trends and development of working capital
management on the profitability of firms in the UK. Indeed it is acknowledged that many
UK businesses have failed because of poor credit management and working capital
management (Perrin, 1998; Summers and Wilson, 2000) and it’s evident that the main
source of this problem is in late payment among most UK firms. According to Wilson
(2008), when payments are overdue and the payment date becomes uncertain, then, the
financing costs, and management time involved in chasing payments and financing the
delay can seriously erode the profitability and strain business relationships between the
firm, its bankers and suppliers. The rest of this chapter is organised as follows: Section 2.2
provides and discusses extensive review on working capital and late payment problem in
UK. It reviews the causes of the problem and some of the policy interventions aimed at
tackling the ‘late payment problem’. Finally, section 2.3 summaries the chapter.
2.2 WORKING CAPITAL AND THE LATE PAYMENT PROBLEM IN UK
2.2.1 Working Capital Developments in UK
Efficient working capital management has been identified as a vital component to the
success and survival of firms (Peel et al., 2000; Tauringana and Afrifa, 2013). The
provision of credit among firms in the UK has been a widespread practice and exists as
long as business-to-business trade exist. However, research indicates that due to the high
cost of external finance (Whited, 1992; Fazzari and Petersen, 1993; Petersen and Rajan,
32
1997) some firms rely heavily on WCM as a source of finance (Padachi, 2006). According
to Lee and Stowe (1993), “trade credit is one of the most important forms of financing
...…. [exceeding] the business lending of the entire banking system”. Petersen and Rajan
(1994) argue that firms will use trade credit when cheaper sources of finance are exhausted
which, it has been argued, could be an indicator of credit rationing (Wilson et al., 1996).
The situation according to Wilson (2008) tend to be pronounced during periods of tight
monetary conditions as most firms tend to bear the brunt of the credit squeeze as most
financial institutions are not in the position to offer credit. As a result most firms fill this
transitory financing gap through increased trade credit supply from larger businesses that
are not as subject to credit rationing. Riskier companies increased their use of trade credit
as a substitute for bank credit, whiles failing firms and firms in financial distress supply
more credit as a means of trying to secure sales and take more credit from the supply base
as bank credit becomes restricted (Wilson, 2008).
Working capital management is important to firms because it involves a trade-off between
risk and profitability (Smith, 1980). Nasir and Afza (2009) contend that firms can
minimise risk and increase profitability by understanding the importance of working
capital. Recent studies (Tauringana and Afrifa, 2013) and recent policy initiatives on
working capital management in UK (such as the Late Payment of Commercial Debts
(Interest) Act 1998, amended in 2000 and 2002) have demonstrated the importance of the
working capital management and its components on firms’ value in UK (Baños-Caballero
et al., 2013; Wilson, 2008; Paul and Boden, 2008; Tauringana and Afrifa, 2013). Empirical
evidence by Wilson (2008) suggests that unsecured trade credit constitutes significant
proportion of balance sheets of most UK businesses. It constitutes about 80 per cent of
business-to-business transactions in UK (Peel et al., 2000). According to Pike and Cheng
(2001), accounts receivables constitutes 19% of total assets of large companies in the UK

33
and over 30% in small/medium–size firms in the UK (Wilson et al., 1995). Wilson and
Summers (2002) suggest that in the UK, trade credit has been estimated to exceed the
primary money supply by an average factor of 1.5, whilst in the USA trade credit supply
‘‘represented approximately 2.5 times the combined value of all new public debt and
primary equity issue during a year.
Furthermore, trade debtors also play a key role in the cash conversion cycle of firms in the
UK. Aaronson et al. (2004) reported that 60.8 per cent of firms had outstanding credit
from suppliers. According to Manager (2009), £26 billion is currently owned by their
customers of British business making trade debtors one of the most riskiest assets UK
firms are likely to have (Paul and Wilson, 2006; Peel et al., 2000; Pike et al., 1998). In a
similar report by Wilson (2008), stocks and flows of trade credit was found to be twice the
size of those for bank credit (Wilson, 2008) with limited companies’ debtors exceeded £53
billion constituting up to 45 per cent of their total assets (65 per cent of current assets).
However, within industry sectors, according to Wilson’s report, the trade debtor share of
assets was remarkably stable over the time period 1997-2006 while trade creditors were
generally rising over the same period. It was also found that transport, hotels and
restaurants sector to the largest share of the assets with a relatively low levels of trade
debtors while business services and agriculture had a relatively high levels of trade
creditors. Typically, between 40-75% of total liabilities and up to 84% of current liabilities
were made up of trade creditors. Empirical evidence of Tauringana and Afrifa (2013) also
supports this evidence. They found trade debtors to be the most important working capital
component among British firms.
Against this backdrop, the management of trade credit positions of firms in the UK is very
critical. According to Paul and Boden (2008), the management of trade credit is of
relevance importance for effective risk management and corporate value particularly larger

34
UK companies giving that most larger companies invest significantly in accounts
receivables (Pike and Cheng, 2001). It is suggested by Paul and Boden (2008) that firms
are in the position to extend their trade credit, when the rewards in delaying the receipt of
payment for goods outweigh inherent risk of delaying the payment of goods.
According to Wilson et al. (1995), firms that invest in more sophisticated credit
management practices and give more importance to ‘‘front-end’’ credit management (i.e.
risk assessment) display lower debtor days, fewer bad debts and, consequently better cash-
flows. One of such sophisticated credit management practices adopted by most large UK
firms and firms with seasonal trading according to Pike and Cheng (2001) is the use of
direct debit arrangement. They argue that such methods give rise to shorter debtor and days
overdue. Empirical evidence of Pike and Cheng (2001) also reports that most firms place a
high priority on reducing trade credit risk. They argue that customer characteristics such as
strong customer relations and product/service quality helps to reduce default risk among
firms.
Despite the above evidence, research (e.g., Paul, 2004; Peel et al., 2000; Peel and Wilson,
1996) also suggests that most UK companies prioritise cash flow and inventory
management. Empirical evidence from (Paul and Wilson, 2006; Pike and Cheng, 1996)
suggests a significant drop on inventory levels as compared to firms’ debtors which is
reported to have doubled over the last decade (Paul and Boden, 2008).
2.2.2 Late Payment Problem in UK
Late payment of trade credit is described as an extension of the demand for trade credit. It
is often linked with suppliers and customers relative power positions (particularly when
customers assumes a monopolistic or oligopolistic position), markets competitiveness,
changes in payment technologies and customer concentration disruptions (Paul and
35
Wilson, 2006). Prior to a sale, business suppliers often agree credit terms with their
customers including the expected payment period which vary in relation to product
characteristics, customer characteristics and location, trading relationships, market
structure and the relative bargaining strength of suppliers and buyers (Wilson, 2008).
Often, payments are made after the agreed credit periods. Consequently, payments made
after the agreed due date of payments is referred to as late payment.
Late payment still remains a major problem for many UK firms in spite of all the various
measures and legislations (such as the Late Payment of Commercial Debts (Interest) Act
1998, amended in 2000 and 2002) taken by the UK government (Paul and Boden, 2008). It
is estimated to cost the UK economy over £20 billion a year (Accountancy, 2007). In a
2011 report by the Federation for Small Business (FSB), over 4,000 businesses failed in
2008 as a direct result of late payment and it costs UK businesses £180 million in debt
interest charges. The report found that the private sector to be the worse culprit 77%
particularly the manufacturing and construction industries. It also found that a significant
section of the public sector (local government and Government department) failing to pay
promptly. Peel et al. (2000) investigated the relationship between late payment and firm
size. Evidence from their study finds that large firms to be the worst offenders of late
payment. Pike and Cheng (2001) also found a strong correlation between the size of the
firm and late payment problem with smaller companies experiencing the longest payment
delay. The European Commission (Europa, 2009) reports that SMEs are owed twice as
much trade credit as they themselves owe to large businesses.
In the same vain, value over the period 1997-2007, the UK Credit Management Research
Centre (CMRC) quarterly, reports a constant mean value for the late payment index which
by implication meant no systematic change in the payment behaviour among sample firms.
However, the CMRC quarterly survey finds that over the period, the average overdue

36
period ranges from 17-22 days with both small and large firms reporting payment delays
22 and 8 days respectively. According to CMRC and Intrum Justitia research on credit
management among the UK and other European countries, most British firms had 34 days
and 18 days average credit and overdue payment periods respectively. This according to
the report makes British firms the worst performers in terms of credit management among
northern European countries. In an attempt to determine the impact of the late payment
problem among businesses in the UK, CMRC found 52% of firms adversely affected by
late payments with large firms been the worst offenders of paying late.
2.2.3 Causes of Late Payment Problem in UK
Late payment is cause by a number of factors: First, weak financial and working capital
management practices. Wilson et al. (1995) also identified poor credit management
practices as one of the underlying causes of late payment problem in the UK. Wilson
(2008) argues that when businesses become uncertain on the timings of future payments of
trade credit granted, the management of cash flow becomes a serious problem. He found
that the situation even become worsens for sole proprietors as their focus and time become
shifted away from the firms’ core business strategy to chasing payments. According to
Wilson (2008), when slow payment progresses to protracted default and bad debt the
whole viability and survival of the business can be at risk. Pike et al. (1998) suggest that
firms with very poor credit management often tend to suffer from late payment problem
and vice versa. Paul and Boden (2008) also suggest that scale and magnitude of the late
payment problem in the UK could be attributed to the inefficiency in both management and
the regulatory frame work to institutionalised pragmatic policies to combat the problem.
Second, poor business practices, inefficient credit management and unclear credit terms
(Paul, 2004). According to Paul (2004), firms with more ad hoc credit management
37
practices under no clear terms usually tend to have increase bad debt and usually poor
credit control processes as compared to those with efficient credit management processes.
Third, the quality of products and customer service. Previous studies (e.g., Wilson, 2008;
Pike and Cheng, 2001) attribute late payment of firms to product quality and the level of
customer service offered by firms as unsatisfied customers will withhold their payments
(Paul et al., 2012).
Fourth, economic conditions. Wilson (2008) relates late payment to economic condition
surrounding firms. He argued that during period of economic down turn, the level of bad
debt increases since customers of trade credit struggle to survive. This, therefore, puts an
inordinate level of risk to suppliers of trade credit. As a result firms in financial distress in
order to alleviate their own cash-flow problems tend to stretch their creditors. Thus, firms
that have difficulty raising finance face the problem of balancing cash inflows–outflows
and late payment is both a cause and effect of this problem (Howorth and Wilson, 1999).
Garcia-Teruel and Martinez-Solano (2010) also suggest that in spite of the cost attached to
paying late, most firms still see it as much cheaper compared to bank loans renegotiation.
On the other hand, Howorth and Reber (2003) attributed the habitual late payment on trade
credit among UK businesses to difficulties firms face in obtaining finance and also lack of
financial stability for habitual late payers. Evidence of their study found a strong evidence
of a financing demand for habitual late payment, a positive relationship between habitual
late payment and difficulty obtaining bank finance and late payment by debtors. Finally,
the relative power positions of suppliers and customers. Paul and Wilson (2006) attributed
the relative power positions of suppliers and customers (especially where the customer is
in a monopolistic or oligopolistic position), competitiveness of markets, disruption
38
associated with changes in payment technologies and customer concentration to late
payment.
2.2.1 Government Legislation
2.2.1.1 Late Payment of Commercial Debts (Interest) Act
On the basis of the above evidence presented, preferred legislations and government
interventions were set in place to encourage companies to pay within the agreed terms and
possibly change payment behaviour by creating a level ‘‘paying’’ field (sic) (see Wilson,
2008). The arguments put forward by various lobbing groups centred on whether the
interventions of the government through legislation or simply efficient financial and credit
management practice was a prerequisite to bring about change and ameliorate the problem
faced by most UK firms alleviate the problems. For example, the Institute of Directors
(IOD, 1993) argued that small firms are not the ‘helpless victims’ of the late payer but that
the majority of overdue debtors can be reduced by improved business practices and
internal credit management. Also, another vociferous lobbing group to mitigate the effects
of late payment on the smaller firm sector was the Forum for Private Business (FPB), a
representative of a large section of small UK businesses (Gray, 1997a). However, their
policy prescription was the statutory imposition of interest on late payment by debtors.
The rational of the proposed interest charge was to deter late payers and also to
compensate suppliers in times of late payment. The provision according to HMSO (1998),
would bind all firms to pay promptly and also create a level playing field in payment
behaviour among firms (Wilson, 2008). On the other hand, a number of contrary
arguments were made against the proposed statutory interest charge. According to Wilson
(2008), since trade credit is often used a competitive tool and a means to build
relationships, the imposition of statutory interest for late payment would not very efficient.

39
This is because suppliers may wish to retain the flexibility to vary (informally) credit terms
for specific customers so as to meet competition and customers may value the freedom to
negotiate payment periods with their suppliers as financial circumstances dictate (Gray,
1997b).
More so, the imposition of statutory interest could also deprive most firms, which are
unable to obtain finance from other sources such as financial institutions (Peterson and
Rajan, 1995), a key source of short term finance. Cosh and Hughes (1994) suggest that
financially distressed firms and firms which unable to obtain alternative source of finance
from the main traditional financial institutions, tend to use trade credit as a source of
finance. According to Wilson (2008), some firms extend credit in order to win business
and establish reputation in the market. Against this backdrop, Wilson (2008) suggests that
most firms are reluctant to impose interest penalties on customers for fear of losing
business to competitors with more financial resource to absorb some late payments.
In 1997, the elected Labour Government in an attempt to combat the problem of late
payment problem considered a number of policy interventions as listed above. In order to
‘improve the payment culture’ among UK firms, the government published a Green Paper
in 1997 which spell out how the government was going to achieve this objective. A
number of responses were also taken from the relevant parties in order to objectively deal
with the issue. The late payment of Commercial Debts (interest) Act was proposed and by
summer of 1998, the proposal was drafted into a Bill which gave business the right to
claim interest on late payment of commercial debt. The rational was to encourage firms to
agree their own contractual terms giving a right to interest if bills are paid late. The
legislation would, therefore, give precedence to contractually agreed provisions. However,
the Bill contained provisions to prevent parties to a contract "contracting out" of the
legislation by setting excessively low rates of interest on late payments, by extending credit
40
terms excessively or by any other terms which result in no substantial remedy for late
payment. The provisions would apply a test of "reasonableness" to such terms (Wilson,
2008).
The proposed Bill was in ‘phased’ in three stages. In the first phase of the proposal, only
small firms had the right to claim interest on late payment of commercial debt from larger
firms and other public sector organisations. After two years of the implementation of the
first phase of the Bill, the right was extended for small firms to claim interest on late
payment of commercial debt from all enterprises and the public sector. Finally, after
another two years the right was open to all firms and organisations to charge interest on
late payment of commercial debt from other firms in the UK. However, Parliament was
given the opportunity to debate the phasing proposals when the clause giving the order-
making power was discussed.
In the proposal, few issues were clarified. One issue was the definition of ‘late payment’. It
was clearly stated that when payment is received after the expiring date of the contractually
agreed credit period; or the credit period in accordance with trade custom and practice or in
the course of dealing between the parties; or the default credit period defined in the
legislation then the payment is considered ‘late’.
Another issue was the test for smallness’ of firms. Two out of three criteria test for
‘smallness’ was defined in the Green Paper according to section 247 of the Companies Act
2006. However, it became apparent that to take that test out of its context (i.e. filing
accounts in respect of a completed year by companies incorporated in the United
Kingdom) and use it in another would lead to difficulties of proof.
On the basis of this, it was further proposed that the legislation redefine a company as
being “small” when it has its full time employees not more than 50. The proposed

41
legislation was further extended to be implemented across the UK and to any commercial
contracts, including imports and exports, written under the law of part of the UK, except
where there is no significant connection between the contract and that part of the UK, and,
but for the choice of law, the applicable law would be a foreign law (Wilson, 2008).
According to Wilson (2008), the when the choice of law is a foreign law, the Bill would
apply if, but for that choice of law, the applicable law would have been a law of part of the
UK and there was no significant connection between the contract and any country other
than that part of the UK. However, there was no minimum level set below which a claim
for interest could not be made. Based on the results of the Green paper, it was proposed
that creditors could freely determine on which debts to make a claim for interest.
On the other hand, the Bill identified a 30 day default credit period starting from when the
invoice of payment for the delivery of goods and services when in the contract no credit
period was defined. In terms of the rate of interest, the legislation proposed a +4% rate of
interest which equated banks average lending margin to smaller firms in the UK. As a
result, small firms were charged for term lending and agreed overdrafts. Instead of the
proposed +4% rate of interest, a base rate of + 8% was proposed by the Bank of England.
Furthermore, the separation and assignment of interest proposed by the Government
allowed the separation of interest and the assignment of the interest on the debt.
After several debates and amendments on the Bill, it was finally implemented in several
stages and later amended in line with the EU late payment directives. The new legislation
was named as the Late Payment of Commercial Debts (Interest) Act 1998. The new Act
entitles firms to claim a statutory right to interest on late payment of trade debts. This was,
however, phased over four year period. It introduced the first stage in November 1998, the
second stage in 2000 and finally the last stage in 2002. In the first phase, smaller firms had
the right claim interest on late payment of commercial debt from larger firms and other

42
public sector organisations. The right was extended for small firms to claim interest of 8%
on late payment of commercial debt from all enterprises and the public sector at an interest
at 8% above the existing Base Rate on debts in the second phase. In the final phase, right
was open to all firms and organisations to charge interest on late payment of commercial
debt from other firms in the UK. The Legislation had been revised to bring it into line with
the EU directive.
2.2.4.2 EU Directive 2000/35/EC on Late Payment
The European parliament and the Council on combating late payment in commercial
transactions published on 8 August 2000 the Official Journal L 200, page 35. However, the
directives came into force on 8 August 2002 for the then 15 Member States (and the three
States of the European Economic Area); on 1 May 2004 for another 10 European countries
and in 1 January 2007 for Bulgaria and Romania. Its focus was to bring member states into
line in terms of all payments made as remuneration for commercial transactions. This was
as a result of the payment system gap between the free circulation of goods and services on
the one hand and the timely receipt of the corresponding payments on the other. The EU
found this gap from the various surveys which found that at that time that about 21% of
businesses had their exports increased if payments delays were shortened. However, the
Commission felt this Internal Market imbalances were necessary to be corrected as the
wide variations were shown to exist between the payment performances in the Member
States. Surveys by Grant Thornton in 2000 showed that in six Member States, more than
40% of invoices are still unpaid after 60 days.
43
In an attempt to combat the late payment of commercial transactions, the European
parliament instituted a number of measures and directives which were published on 8
August 2000.These directives came into effect two years after they were published for the
then 15 Member States (and the three States of the European Economic Area). Later, 10
Member States were included in May, 2004 and in January 2007; it was expanded to
include Romania and Bulgaria. The rational was to harmonise and ensure that payment
behaviour among member states are in line with all payments made as remuneration for
commercial transactions (Wilson, 2008). This was as a result of the payment system gap
between the free circulation of goods and services on the one hand and the timely receipt
of the corresponding payments on the other.
As a result the commission designed these directives to remedy the situation based on
Article 95 (ex-100a) of the EC Treaty due to the close link with the free circulation of
goods and services. The legislation excluded: all contracts made before 7 August 2002;
claims for interest of less than €5 and transactions with consumers or debts that are subject
to other laws (e.g., insolvency proceedings) (Wilson, 2008). According to the directives,
statutory interest automatically becomes payable 30 days after the date of receipt of the
invoice or the date of receipt of the goods or services except only when the date or period
for payment, and/or any penalty rate, have been fixed in the contract.
2.3 CONCLUSION
The objective of this study was to provide an overview of the importance of working
capital management and late payment problems in UK, as recent policy interventions
aimed at tackling the ‘late payment problem’ do not appear to have been informed by
much empirical and / or theoretical research. The chapter was structured into four sections.
Section 2.2 provided and discussed extensive review on working capital and late payment

44
problem in UK. It reviews the causes of the problem and some of the policy interventions
aimed at tackling the ‘late payment problem’. In section 2.3 presented summary of the
chapter.
45
3 CHAPTER THREE
LITERATURE REVIEW
3.1 INTRODUCTION
The impact of working capital management (WCM) and its components (AR, AP and
INV) on companies’ profitability has been a focus of much empirical research because
working capital investment affects firm’s profitability, risk and consequently its value
(Smith, 1987). Previous studies on the impact of WCM on firms’ profitability could be
classified into two competing views of working capital investment (Baños-Caballero et al.,
2013). Under one view, higher working capital levels allow firms to increase their sales
and obtain greater discounts for early payments (Deloof, 2003) and, hence, may increase
firms’ value. Alternatively, higher working capital levels need to be financed and
consequently, firms face additional financing expenses that increase their probability of
going bankrupt (Baños-Caballero et al., 2013).
This chapter reviews literature on the relationship between working capital management
and profitability. It discusses the interrelationship between the individual components of
working capital and corporate profitability. The rationale is to determine whether there is
any consistency in the findings of the impact of working capital on firm profitability. The
discussion starts with how the individual components of working capital (accounts
receivable, accounts payable and inventory management) affect working capital
management and profitability differently. This is followed by the discussion of the
influence of other control variables found to influence the relationship between WCM on
profitability by previous studies. These variables have been included in the study in order

46
to prevent any possibility of omitted bias (see Bartov et al., 2000). They include: corporate
governance and firm characteristics variables. Corporate governance variables include:
board size and Chief Executive Officer (CEO) tenure while firms’ characteristics include:
company size, asset tangibility, financial leverage, liquidity ratio and industry
classification (see, Chittenden et al., 1996; Majumdar, 1997; Kakani and Kaul, 2002;
Caesar and Homes, 2003; Inmyxai and Takahashi, 2010).
The rest of the chapter is structured as follows. Section 3.2 presents a discussion on the
relationship between of WCM and profitability by previous studies on the relationship
between working capital management and profitability. Section 3.3 identifies the impact of
other control variables identified by previous researchers as relevant variables in
influencing the relationship between working capital management and profitability. A
summary of the results of previous empirical studies is presented in section 3.4. Section 3.5
presents the limitation of current research. Finally, there is summary and conclusion.
3.2 THE RELATIONSHIP BETWEEN WORKING CAPITAL MANAGEMENT,
ITS COMPONENTS AND PROFITABILITY
Working capital is an important tool for growth and profitability for corporations because
it affects the company’s risk, return, and firm’s value. The cash conversion cycle (CCC)
has been the main traditional measure adopted by previous studies (Soenen 1993; Deloof
2003; Garcia-Teruel and Martinez-Solano 2007; Banos-Caballero et al., 2010) to measure
working capital management of a firm. It is decomposed into three components, (i.e.
inventory management, accounts receivable management and accounts payable
management). In order to better understand the relationship between working capital
management and profitability, Afrifa (2013) suggests that we decompose the individual
components of working capital management separately as the various components of
working capital management affects profitability differently. On the basis of this argument,

47
the various individual component of working capital management are discussed separately
in order to delineate their individual effects on firms’ profitability.
3.2.1 Working capital management and Profitability
Empirical studies relating to working capital management and profitability have been
carried out in different environments. Most of these empirical studies support the
traditional belief about working capital and profitability which suggest that reducing
working capital investment would positively affect the profitability of firm (aggressive
policy) by reducing the proportion of current assets in total assets (Garcia-Teruel and
Martinez-Solano, 2007). Previous studies (e.g., Deloof, 2003; Falope and Ajilore, 2009;
Garcia-Teruel and Martinez-Solano, 2007) have adopted cash conversion cycle (CCC) as
the traditional measure for WCM. It measures the time lag between expenditure for the
purchase of raw materials and the collection of sales of finished goods. Soenen (1993)
asserts that the length of the CCC determines the firm’s profitability. Firms with a longer
cash conversion cycle are able to stimulate sales (Banos-Caballero et al., 2010), prevent
production interruptions, strengthen a firm’s long term relationship with their customers
(Ng et al., 1999), influence the acquisition of merchandise at times of low demand (Emery
1987), allows customers time to pay (Long at al., 1993; Deloof and Jegers, 1996), reduces
the information asymmetry between buyer and seller (Smith, 1987). Longer cash
conversion cycle can help customers to differentiate between products (Shipley and Davis,
1991; Deloof and Jegers, 1996), can be used as an effective price cut (Brennan et al., 1988;
Peterson and Rajan, 1997), and strengthens long-term supplier/customer relationships
(Wilner, 2000).
Empirical work of Martinez-Sola et al. (2013) support the argument that when firms relax
their credit period, firms are able to reduce the storage costs of the excess inventories

48
accumulated which could also improve their profitability. Other studies (eg. Gill et al.,
2010; Raheman et al., 2010; and Sharma and Kumar 2011) also found a positive
association between working capital management and profitability.
Contrary to the above evidence, a number of studies (Deloof, 2003; Banos-Caballero et al.,
2013) have demonstrated that firms with shorter cash conversion cycle tend to have higher
profitability. It has also been argued that firms with a shorter cash conversion cycle are
able to maximise profitability due to their ability to internally generate funds, which could
reduce their reliance on external finance which often turns to be expensive (Autukaite and
Molay, 2011; Banos-Caballero et al., 2013). According to Luo et al. (2009), firms with
shorter cash conversion cycle free up more funds, which are invested in growth projects,
thereby allowing them to rely less on external financial market, resulting in a lower cost of
capital and thus improving their profit margins. Following this line of thinking, Autukaite
and Molay (2011), contend that, through effective working capital management, firms are
able to reduce their reliance on external financing, lower their financing cost and enjoy
financial flexibility. According to them, effective working capital management puts firms
in a better position to attract cheaper funding from both shareholders and lenders since it
tends to improve risk profile of most firms. Ganessan (2007) suggests that reducing the
investment in working capital leads to less need for financing and less cost of capital,
which increases the cash available to shareholders. Deloof (2003) found a significant
negative relation between profitability measured by gross operating income and cash
conversion cycle, as well as the number of day’s accounts receivable and inventories. He
suggested that more profitable companies pay their bills faster. With faster payments,
companies are able to utilise the discounts offered by the suppliers. Deloof (2003) further
suggested that managers can create value for their shareholders by reducing the number of
day’s accounts receivable and inventories to a reasonable minimum.
49
However, other empirical evidences have shown that firms with shorter cash conversion
cycle tend to have higher profitability. For example, Lazaridis and Tryfonidis (2006) argue
that the longer a company delays its payments to suppliers, the higher the level of WC
levels it reserves and uses in order to increase profitability. However, an attempt to demand
more credit from suppliers may reduce profitability as the firm may lose out on the
discounts, which can exceed 20 per cent depending on the discount rate and discount
period granted (Ng et. al., 1999; Wilner, 2000). In another study, Garcia-Teruel and
Martinez-Solano (2007) on a panel of 8872 small to medium–size enterprises in Spain, also
found a significant negative relation between an SME’s profitability and the number of
day’s accounts receivable and days of inventory. They suggested that managers can create
value by shortening the cash conversion cycle as it increases the cash flow available to a
company, which can be used to run the day-to-day operations of a company. Banos-
Cabellero et al. (2013) contend that a company could reduce their dependence on outside
financing, lower their financing cost and enjoy financial flexibility with a shortening the
cash conversion cycle.
3.2.2 Accounts Receivables and Profitability
Accounts receivables can be seen as short-term loans to customers given by the supplying
firm. According to Peel et al. (2000), trade credit involves supplying goods and services on
a deferred payment basis, which gives customers time to pay. It results in a delay between
the delivery of goods and the provision of services by a supplier and payment for them
(Garcia-Teruel and Martinez-Solano, 2010). Empirical evidence (Banos–Caballero et al.,
2013; Garcia-Teruel and Martinez-Solano, 2010a; Peel et al., 2000) demonstrates that a
company’s profitability is significantly affected by its accounts receivable policy.
However, the nature of the relationship between accounts receivable level and firm
profitability depends on the particular receivables policy adopted by a firm (Garcia-Teruel

50
and Martinez-Solano, 2007; Afrifa, 2013; Tauringana and Afrifa, 2013); and firms can
pursue a conservative or aggressive receivables policy (Weinraub and Visscher, 1998;
Nazir and Afza, 2009).
An aggressive receivables policy will lead to reductions in the accounts receivable period.
A reduction in accounts receivable period may increase profitability because it will
increase the cash flow available to a company, which can help companies to make timely
payments to their obligation and avoid the prospect of running out of cash, which could
lead to bankruptcy (Couderc, 2006). Arena and Julio (2010) argue that cash holding acts as
a buffer between cash flows and debt obligation and potentially reduces the costs of
financial distress. The availability of cash will help companies to make timely payments to
its obligation and avoid the prospect of running out of cash, which could lead to
bankruptcy. This supports Ferris (1981) transactional cost theory on trade credit.
According to the theory, firms are able to enhanced operational efficiency through a
reduction in transactional cost by reducing their accounts receivable period. Other similar
studies (such as Petersen and Rajan, 1997; Nelson, 2002; Banerjee et al., 2007;
Bhattacharya, 2008) have argued that a reduction in accounts receivable period enhances
firms’ profitability through reduction in transactional cost of paying bills (Peterson and
Rajan, 1997). Similarly, a number of empirical evidence on the effect of accounts
receivable management on firm profitability supports these arguments. For instance,
Deloof (2003) found a significantly negative relation between accounts receivable and
profitability on a sample of selected Belgian firms. He attributed this negative relationship
to the fact that most customers tend to require more time to assess the quality of products
they buy from firms with declining profitability.
In a similar study, Garcia-Teruel and Martinez-Solano (2007) used a panel of 8872
Spanish small and medium–size enterprises to investigate the impact of working capital
51
management on SME profitability. Evidence of their study reveals a significantly negative
relation between an SME’s profitability and the number of day’s accounts receivable. On
the basis of this evidence they suggested that managers can create value by reducing the
number of days for which their accounts are outstanding. This is because of the high cost
associated with investment in working capital.
Raheman and Nasr (2007) in their research on the effect of working capital management
on firm’s profitability on selected sample of 94 Pakistani firms listed on Karachi Stock
Exchange for the period 1999-2004 found a significantly negative relationship between
accounts receivables and profitability. They concluded that firms should focus on
managing their cash and accounts receivables in order to increase their profitability since
shorter agreed payment terms helps firms to separate their payment cycle from the
purchase cycle. This according to them makes the arrangement to pay more convenient and
immediate. According to Schwartz (1974), companies are able to plan and manage their
financial resources better when they are able to have a fixed payment period and also able
to separate their payments from purchases. Stowe and Gehr (1985) contend that companies
are also able to reduce the risk of monetary theft and increase their profitability through
separation of payments from purchases.
Empirical evidence of Bhattacharya (2008), demonstrates that firms are able to use their
trade receivables policy as an effective cost saving tool to enhance their profitability.
According to him, firms are able to use trade credit as an effective price cut tool during
period of severs demand fluctuation. Firms also tend to tighten their trade receivables
policy when there is a rise in sales. This is consistent with empirical evidence of Long et al
(1993). According to Long et al (1993), variable demand companies tend to offer more
extended credit period as compared to companies with stable demand.

52
On the other hand, Tauringana and Afrifa (2013) in their study on the relative importance
of working capital management and its components on SMEs profitability in the UK found
the management of accounts receivable (AR) to be the most important working capital
management component for SMEs profitability. Tauringana and Afrifa (2013) attributed
these findings to the fact that most SMEs have limited access to finance in the capital
market as a result, they tend to rather prioritise AR as a source of cash flow to their
operational needs. On the basis of such evidence they concluded that by reducing the
accounts receivable and payment period, firms could enjoy the advantage of holding a
positive cash flow holding, which tends to enhance their profitability. Some of these
advantages include: reducing the cost of financial distress, taking advantage of positive
speculation and growth opportunities, meeting the day to day operational expense and also
providing insurance against shortfalls in cash. Samiloglu and Demirgunes (2008), Sen and
Oruc (2009), Nobanee and Alitajjar (2009b) and Dong and Su (2010) have also reported
similar results on the relationship between accounts receivable period and profitability.
A firm can also adopt a conservative strategy to its receivables policy by increasing its
investment in working capital. Emery (1987) contends that the rationale for extending
trade credit among firms is often driven purely by the need for firms to achieve higher
profitability through enhanced operational flexibility. According to Smith (1987), delayed
payment facilitates exchange by allowing the necessary time for customers to verify the
quality of the product before paying. This helps reduce the level of information asymmetry
between the buyer and the seller. Empirical evidence of Long et al. (1993) supports this
argument. Evidence of their study reveals that smaller firms and firms with goods whose
quality requires longer assessment tend to have a longer trade credit period since some of
the buyers especially the new ones have little knowledge about the quality of the product.
This evidence has also been supported by Garcia-Teruel and Martínez-Solano (2010). They

53
also argued that smaller and younger firms give more trade credit, since their customers do
not have any reasons to trust that the quality of their products. Therefore, according to Pike
et al. (2005), through product quality guarantee, firms are able to reduce the information
asymmetries between a buyer and a seller. This according to Bastos and Pindado (2007),
facilitates future sales of the product and profitability for the firm since it helps eliminate
any future contentions of the product as customers are allowed the product before any
future payments are made. Customers also have the opportunity to avoid payment and
return the product to the supplier if they are unsatisfied with its quality.
Empirical evidence of Garcia-Teruel and Martinez-Solano (2010a) suggest that product
quality guarantee also saves both the buyer and seller the time and cost of going through
cash refund in a case where the buyer returns the product due to the non-payment.
Ramachandran and Janakiraman (2009) on the relationship between WCM efficiency and
company profitability on a sample of 30 companies listed on the Bombay Stock Exchange
from 1997/8 to 2005/6, found a significantly positive relationship between a firm’s
working capital and its profitability. However they concluded that most profitable firms
extend the number of day’s accounts receivables as a way of enticing their customers to
purchase more of the product/ service which in the long run improves their profitability.
This evidence is consistent with the product differentiation theory. According to the
product-differentiation theory of trade credit, firms use accounts receivables like any other
sales-promotion tool to increase sales and profitability (Nadiri, 1969; Blazenko and
Vandezande, 2003). Accounts receivables, according to the theory are used as a sales tool
to differentiate the company’s product from its competitors (Nadiri, 1969; Blazenko and
Vandezande, 2003) so that consumers prefer to buy that firm’s products rather than a
competitor’s. Various studies (e.g., Nadiri, 1969; Shipley and Davis, 1991; Deloof and
Jegers, 1996; Blazenko and Vandezande, 2003), have suggested that through extended
54
accounts receivables policy, most companies are able to convince their customers that their
products are worth the value of their money.
Also, empirical evidence of Brennan et al. (1998), Mian and Smith (1992) demonstrates
that some firms use extended accounts payable as a price discrimination tool to enhance
profitability. This may depend on whether the firm delays or gives discount to its
customers. Smith (1992) identified two ways of implementing price discrimination to
firms. The first is allowing a delay in payment and second is by giving a discount in
payment, which can be seen as a price reduction. This theory of price discrimination is
empirically tested by Petersen and Rajan (1997). They found that firms with a high profit
margin benefits when they raise their sales. Through granting more trade credit, a firm is
able to raise their sales. This is beneficial for firms with high profit margins, because the
profits of this raising of sales surpass the costs of granting trade credit (Petersen and Rajan,
1997; Garcia-Teruel and Martínez-Solano, 2010). Garcia-Teruel and Martinez-Solano
(2010a) suggests that a customer will end up paying a lower price when given an extended
credit period compared to those with a shorter payment period.
According to Petersen and Rajan (1994) and Bhattacharya (2008), through price
discrimination, firms are able to improve their profitability through high implicit rate of
interest charges on high-risk customers who find it difficult to obtain credit from financial
institutions. Despite the high implicit rate of interest, most firms consider trade credit as a
cheaper source of finance (Petersen and Rajan, 1994) and hence it is often much attractive
to customers with high-risk profiles. Empirical evidence of Banerjee et al. (2007) confirms
Petersen and Rajan (1994) findings. On the basis of such evidence, Banerjee et al. (2007)
concluded that some companies prefer to price discriminate their trade credit in order to
assist high risk customers reduce their short term financing needs. This improves their
profitability through high implicit rate of interest charges. On the contrary, Afrifa (2013)
55
argues that the firm tend to jeopardise their profitability when they design their trade credit
policies aimed at providing short-term financing assistance to high-risk customers since
they mostly have a greater propensity to default risk.
Empirical evidence of Emery (1987) suggests that, through the extension trade receivables,
firms are able to avoid regulatory and market restrictions, which enhances their
profitability. According to Emery (1987), in a highly competitive market, firms are able to
intrinsically violate price restrictions and other retaliated effects from other competitors in
the market through trade credit extension. Evidence of Bhattacharya (2008) and Petersen
and Rajan (1997) reveal that companies that pursue price discrimination using trade credit
tend to have improved price-cost margins which lead to higher profitability.
Extension of accounts receivables may also improve a firm’s profitability through the
reduction in operating and transaction costs (Ferris, 1981). By relaxing the credit period
according to Garcia-Teruel and Martinez-Solano (2010), companies are able to reduce the
storage costs of the excess inventories accumulated. This argument has been justified by
Martinez-Sola et al. (2013) who found that managers can improve profitability by
increasing investment in accounts receivables, which is consistent with Hill et al. (2010)
and the theoretical models presented by Kim and Atkins (1978), Sartoris and Hill (1981).
3.2.3 Accounts payable and Profitability
Trade payables represent an important source of short term funds for most firms (Garcia-
Teruel and Martinez-Solano, 2010; Mian and Smith, 1992; Ng et al., 1999; Wilner, 2000).
Peterson and Rajan (1997) stress that trade payables is the single most important source of
short term external finance for firms in the United States (US) representing about 35 per
cent of medium sized US firms. In the UK, it constitutes about 41 per cent of the total debt
for medium size firms and 20 per cent of their liabilities (Garcia-Teruel and Martinez-

56
Solano, 2010). According to Marinez-Sola et al. (2013), firms tend to have an optimal
accounts payable policy due to the existence of market imperfection. This they argued
could affect the firms’ accounts payable decision and firms’ value. However, trade payable
has benefits and costs to firms (Nadiri, 1969; Deloof, 2003; Banos-Caballero et al., 2013).
Accounts payable helps to enhance operational efficiency (Ferris, 1981) and profitability
through the reduction of transactional cost. Ferris (1981) postulates that delaying accounts
payable bring down exchange costs. Other similar studies (Petersen and Rajan, 1997;
Nelson, 2002; Banerjee et al., 2007; Bhattacharya, 2008) also argue that by delaying
payments, firms are able to increase their profitability through reduce transactional costs of
paying bills (Peterson and Rajan, 1997). It also allows companies to accumulate amounts
owing and pay them at a periodic interval according to the credit period agreement, such as
monthly or quarterly according to Ferris (1981). This helps companies to overcome
financial constraint (Schwartz, 1974; Pike and Cheng, 2001) and improve profitability.
Mathuva (2010) in a study on the influence of WCM components on corporate profitability
on a sample of 30 companies listed on the Nairobi Stock Exchange (NSE) for the period
1993 to 2008 found a positive and highly significant association between accounts payable
period and profitability in both the pooled ordinary least square (OLS) and fixed effect
(FE) regression models. He argued that firms could increase their profitability by having a
longer payable period as they take advantage and use suppliers’ credit for their working
capital needs. He further suggested that the availability of the cash flow generated through
delayed payment may also lead to an increase in investment of accounts receivable and
inventory day held which may lead to higher profitability as firms are also able to reduce
their transactional cost of paying bills.
Empirical evidence of Falope and Ajilore (2009) on a selected sample of 50 listed
companies on the Nigerian Stock Exchange for the period 1996-2005, supports the

57
argument that firms could also increase their profitability by having a longer payable
period since it helps firms to strengthen long-term relationships with their customers. This
is consistent with previous studies (Ng et al., 1999; Wilner, 2000).
Accounts payable also enhances the buyer’s opportunism from financially distressed
suppliers (Petersen and Rajan, 1997; Wilner, 2000) which helps them to improve their
profitability. According to the financial distress theory, companies in financial distress
often face the challenge of effectively following their credit polices due to their weakening
bargaining position. Banerjee et al. (2007) suggests that customer power over supplier
arises whereby the customer is relatively large as compared to the supplier such that the
business of the customer forms a major part of supplier’s revenue. As a result customers
are able to exploit the bargaining advantage from their suppliers by obtaining concessions
in times when the suppliers are in financial distress (Wilner, 2000). Boissay and Gropp
(2007) suggest that in order to overcome the distress from liquidity shortages (shocks),
firms tend to take up relatively longer payable period to pass on one fourth of the shock to
their suppliers. This according them enhances profitability among these firms. According
to Nilsen (2002), during period of economic down turn; some firms substitute the reduction
in credit from financial institution for trade credit. Therefore trade credit is used by as a
source of “financing of last resort” by very constrained firms (Petersen and Rajan, 1997).
Empirical evidence of Raheman et al. (2010) on the relationship between WCM
components and corporate profitability of manufacturing sector in Pakistan for the period
between 1998 and 2007, covering 204 companies listed on the KSE suggests that
lengthening the payment period increases profitability. They argue that with a longer
payable period, firms are able to manage and control the quality of the items purchased
which helps to reduce the level of the information asymmetry between (Smith, 1987; Long
et al., 1993; Pike et al., 2005) and moral hazard problems between the buyer and seller.

58
This is especially relevant for products or services that take longer to verify (Smith, 1987).
Bastos and Pindado (2007) suggest that lengthening the payment period signals product
quality which facilitates future sales of the product since it helps eliminate any future
contentions of the product as customers are allowed the product before any future
payments are made. It also gives customers the opportunity to avoid the time and cost of
going through cash refund in a case where the buyer returns the product due to product
quality (Garcia-Teruel and Martinez-Solano, 2010a).
Bougheas et al. (2009) also developed a model in which, they demonstrated that in a
financial market without bank loans, an increase in production will require lengthening the
payment period for any given level of liquidity. A higher production is associated with a
higher production cost, which for a given (insufficient) amount of liquidity, implies that
the firm will need to take longer payment period. So a longer payment period works as an
alternative means to finance production (Ferrando and Mulier, 2013). As a result, some
companies rely more on their suppliers than financial institutions for credit to finance their
daily operations (Kohler et al., 2000). Therefore the ability of the firms to offer maximum
extended payment period to their customers depends on their accessibility to credit from
the financial market (Cuñat, 2007). Fisman and Love (2003) extend the analysis to link
accounts payable substitutability for institutional financing to the overall development of
the financial sector. Evidence from their study reveals that industries that use more
accounts payable grow relatively faster in countries with poorly developed financial
markets. Previous studies (Schwartz, 1974; Emery, 1984; Garcia-Teruel and Martinez-
Solano, 2010a) suggest that firms with adequate access to credit from the financial markets
are in a better position to act as intermediaries by borrowing from financial institutions and
lending it to clients in the form of accounts payable. Antov and Atasanova (2007) on the
other hand argues that, the use of trade credit also creates better conditions to obtain

59
institutional loans and also contribute to lower total borrowing costs. Most firms often tend
to use their suppliers and accounts payables as either third-party guarantees or security to
secure institutional loans from financial institutions (Miwa and Ramseyer, 2005).
On the contrary delaying accounts payable could incur credit management cost to the
buyer (Cheng and Pike, 2003), which eventually affects the firms’ profitability. According
to Bougheas et al. (2009) and Garcia-Teruel and Martinez-Solano (2010b) firms in an
attempt to reduce the various cost associated with making the payments, trade credit
information and monitoring tend to relax their credit period which invariably is transferred
to the buyer in the form of additional administrative costs (Mian and Smith, 1992) due to
the costly credit management activities. This inevitably affects the profitability of the
buyer. According to Ng et al. (1999), the transaction costs associated with making the
payments, trade credit information and monitoring are incurred when informational
asymmetries between buyer and seller are present.
Garcia-Teruel and Martınez-Solano (2010) argue that firms risk losing their profitability
when they over-invest in accounts payable due to the high cost of investment in current
assets which sometimes also signal acceptance of late-paying customers. It may also
involve bearing the credit risk which may have negative effects on profitability and
liquidity because of debt defaults (Cheng and Pike, 2003).
Ng et al. (1999) argued that firms that wait longer before settling their supplies often tend
to lose discounts for early payment. This sometimes affects their profitability as the
amount of cash discount can sometimes be substantial leading to some firms facing a high
opportunity cost due to the loss of discount and the high inherent cost involved in credit
period. Therefore, the decision to accept or request for credit period results in an inherent
cost to a company, which diminishes profitability. According to Deloof and Jegers (1999),
60
through early payments, firms tend to forgo cash discount usually offered by suppliers
which often tend to be a substantial amount (Ng et al., 1999). For instance, Ng et al. (1999)
found that a credit term of 2/10 net 30 could define an implicit interest rate of 43.9 per cent
to the buyer.
Tauringana and Afrifa (2013) in their work on a sample of listed SMEs in the UK found
the management of accounts payable (AP) to be important for SMEs profitability
management. They suggested that by reducing the accounts payment period, firms could
enhance their profitability. However they further argued that in working capital
management, SMEs are better off focusing on accounts payable management if firms want
to enjoy the advantage of holding a positive cash flow holding. This includes: reducing the
cost of financial distress, taking advantage of positive speculation and growth
opportunities, meeting the day to day operational expense and also providing insurance
against shortfalls in cash.
On the contrary, some group of studies on the relationship between working capital
management and profitability found a negative association between accounts payable
period and profitability. For example, Garcia-Teruel and Martınez-Solano (2010) argue
that firms risk losing their profitability when they over-invest in accounts payable due to
the high cost of investment in current assets which sometimes also signal acceptance of
late-paying customers. Besides, if the cash discount and the credit period granted by the
firm are not competitive compared to firms in the same industry, this can have negative
effects on the value of the firm.
In another study, Garcia-Teruel and Martinez-Solano (2007) adopted a panel of small to
medium–size enterprises in Spain to find a significantly negative relation between an
SME’s profitability and the number of day’s accounts receivable and days of inventory.

61
They suggested that managers can create value by reducing the number of days for which
their accounts are outstanding. Samiloglu and Demirgunes (2008) analysed the effect of
WCM on company profitability of a sample of companies consisting of Istanbul Stock
Exchange (ISE) listed manufacturing companies for the period of 1998 to 2007. Their
conclusion was that the negative relationship between accounts receivable period and
profitability may be due to the fact that customers want more time to assess the quality of
products they buy from companies with declining profitability.
3.2.4 Inventory management and Profitability
Inventory as a component of Working Capital Management (WCM) is very important to
the profitability of firms (Koumanakos, 2008). Under perfect conditions, firms will not
have to keep inventory (Mathuva, 2013) as they will be required to produce in exact
quantities to satisfy sales demand. However, due to imperfections companies are forced to
keep inventory in order to safeguard any eventualities. Existing studies (e.g., Gill et al.,
2010; Ching et al., 2011; Eroglu and Hofer, 2011a) have demonstrated that a firm’s
profitability is affected by the amount of inventory held. Eroglu and Hofer (2011b) suggest
that firms manage inventory in an anticipation of enhancing profitability. Firms could
adopt two main inventory management strategies: the aggressive inventory management
strategy, where a lower amount of inventory is held or the conservative inventory
management strategy where a higher level of inventory is maintained (Garcia-Teruel and
Martinez-Solano, 2007; Nazir and Afza, 2009; Weinraub and Visscher, 1998). According
to Tauringana and Afrifa (2013), the type of inventory management strategies chosen
could either increase or decrease the profitability of a firm, depending on the availability of
resources including expertise, technology, finance.

62
A number of studies (Nazir and Afza, 2009; Weinraub and Visscher, 1998) have suggested
that a reduction in inventory through the aggressive strategy may increase profitability.
This is because a decrease in inventory will lead to the reduction in the various cost
associated with the holding of inventory. The theoretical basis of this evidence is
embedded in the Just-In-Time (JIT) theory of inventory management which regards the
holding of inventory in any form as a waste because it does not add value to the product
(Bhattacharya, 2008; Morgan, 1991). As a result, the theory suggests the need for the firm
to hold zero inventory level and only orders for materials when they are necessary to
manufacture the products. This avoids the cost of holding inventory, which allows
companies to enjoy higher profitability. Zero inventory holding periods will mean that the
company only order for materials needed to manufacture the specific product. This,
however, allows the company to avoid any extra cost of holding the inventory (Hsieh and
Kleiner, 1992).
According to Younies et al. (2007), the best way to successfully implement such a system
is through developing a strong buyer-supplier relationship. Previous studies (Johnson,
1986; Giffi et al., 1990; Schaffer and Themson 1992; Sohal et al., 1993; Balakrishnan et
al., 1996; Ahmad and Pletcher, 2004) have demonstrated that some companies have
successfully benefited significantly in terms of cost savings and profitability after
successfully implemented the JIT system.
Empirical evidence of Johnson (1986) suggested that Hewlett-Packard and General Motors
had their inventory cost reduced by more than 50 per cent and from $8 billion to just $2
billion respectively. Dong and Su (2010) in their study on the relationship between
working capital management and profitability among Vietnamese firms found a
significantly negative relationship between inventory in number of days and profitability.
They suggested that by holding high amount of inventory, firms profitability is reduced

63
due to the holding cost (e.g., security cost, rent, heating, obsolesce and theft) of the
inventory. Mathuva (2013) had similar evidence and further suggested that firms should
focus on minimising their inventory level since high inventory level consumes space and
creates financial burden to firms. According to Drury (2000), the opportunity to reduce
overheads and capital employed can be achieved through inventory reduction.
In a similar study, Banos -Caballero et al. (2010) suggest that lower level of inventory may
increase profitability because the funds not tied up in inventory can be deposited in the
bank to earn interest or invested elsewhere. According to Deloof (2003), managers can
create value for their shareholders by reducing the number of inventories days to a
reasonable minimum. This prevents the firm from seeking short-term credit in order to
finance the investment in inventory. Other studies (Boute et al., 2004; Chen et al., 2005;
Shah and Shin, 2007) found a significantly negative relationship between inventory in
number of days and profitability.
Contrary to the above evidence, the conservative working capital management strategy
suggests that an additional investment in working capital stimulates profitability through
increased sales (Deloof, 2003). The theoretical basis for this strategy is derived from the
precautionary, speculative and transactional motive theory of holding inventory. The
precautionary motive theory of holding inventory suggests that, companies keep inventory
as a precaution against situation of stock out (Christiano and Fitzgerald, 1989; Wen, 2003).
According to Bhattacharya (2008), the situation of stock out not only drives customers to
other competitors but also leaves a bad name for the company. Lack of inventory will drive
both current and potential customers away to competitors which will have a negative
impact on profitability. The theory predicts a higher profitability as a result of an increase
in inventory because of the uncertainty in the lead-time of delivery (Modigliani, 1957).
Compared to any other theories explaining inventory behaviour, Wen (2003) suggests that
64
the theory of stock avoidance holds more truth. Empirical evidence of Gill et al. (2010) on
the relationship between working capital management among American firms suggested a
high level of inventory averts trading interruptions, which could contribute to profit
maximisation for firms due its inherit cost.
On the other hand, speculative motive theory of inventory holding, firms hold inventory
with the sole purpose of achieving higher profitability through future abnormal future
profit (Christiano and Fistzgerald, 1989). The theory suggests that firms often hold
inventory with the expectations of taking advantage of higher future price changes of the
products. Some companies may even hoard their inventories to reap abnormal profit if they
anticipate a future rise in prices of their products. In such circumstances, the cost of
holding inventory is often being compensated for by the future expected rise in prices of
the products.
Empirical evidence of Hill and Sartoris (1992) suggests that, the condition of holding
higher inventory with the expectation to take advantage of higher future price changes
works more effective under inflationary conditions. For instance, according to Morgan
(1991), in the late 1970’s and early 1980’s, some companies were motivated by the rapid
inflationary pressures to stock up their inventories early before prices rose so as to take
advantage of any future abnormal future profit. Blazenko and Vandezande (2003) also
found a significantly positive coefficient on gross margin regressed as a determinant of
finished goods inventories in their study on the effects of stock out avoidance and market
competition on corporate holding of finished goods inventories. They argue that firms are
more inclined to hold inventory with the expectations of taking advantage of higher future
price changes of the products if the potential for profit is greater. This argument is
consistent to the speculative motive theory of holding inventory.

65
Finally, under the transactional cost motive of holding inventory, companies hold
inventory to satisfy the expected demand of the goods or services of the company.
According to the theory, management envisage the future sales demand and hence keep
inventory to meet the said demand. According to Bhattacharya (2008), some companies
also keep inventory for display or demonstration purposes since some customers often
prefer to examine the product before placing any order. This could result in an increase in
profitability as there will be product samples available for inspection, thereby enticing
customers to purchase.
Modigliani (1957) suggests that some companies keep inventory for the purpose of
meeting the cost of procurement. He argued that due to the economies of bulk
procurement, some companies tend to hold inventories very often. For instance, a company
could benefit from bulk purchase through quantity discount from its suppliers. It could also
save the company some money in terms of transportation cost. It will also save the
company from the fixed cost of ordering including placing and processing orders (Afrifa,
2013). Mehta (1974) found a relation between inventory procurement and rate of sales.
Results of the Mehta (1974) study suggest that as the rate of sales rises, inventory also
increases. Mehta therefore argues that companies should be willing to buy in bulk at the
same rate of increase in sales. Afrifa (2013) also suggested the need for companies to
employ some mathematical formulas such as economic order quantity (EOQ) to be able to
purchase quantities that achieves the dual purposes of reducing both ordering cost and
holding cost.
Previous studies (e.g., Padachi, 2006; Nobanee, 2009) all support the relevance of
transactional cost theory of inventory holding in maximising profitability for firms.
Evidence from these studies suggest that firms keep a high level of inventory in order to
satisfy the expected demand of production (Bhattacharya, 2008) which in the long run
66
improves the firms profitability. On the other and, Vastag and Whybark (2005) found no
significant relationship between inventory turnover and profitability. Similarly, Demeter
(2003) and Tunc and Gupta (1993) showed that inventory turnover did not affect return on
sales and level of sales respectively. Also, Padachi (2006) in a study on a sample of small
manufacturing firms in Mauritius during 1998 to 2003 did not find any significant
relationship between inventory holding period and profitability.
3.3 CONTROL VARIABLES
Apart from working capital management, there are other variables that have been found to
influence profitability of firms such as corporate governance and company characteristics.
These control variables are discussed below.
3.1.1 Corporate Governance and Profitability
3.1.1.1 Board Size
Ntim (2013) contends that conformance and performance are the two most important
strategic functions of a corporate board. According to the study, a company’s board has the
responsibility to monitor, ensure compliance, discipline and also that the interests of
shareholders is pursued by managers. It has the responsibility to provide expert advice to
the CEO and access to critical information and resources (Jensen, 1993; Jensen and
Meckling, 1976) to ensure profitability.
Empirical studies (e.g., Yermack, 1996; Mak and Yuanto, 2003; Anderson et al., 2004;
Guest, 2009) on the relationship between board size and profitability have demonstrated
that a firm’s performance measured by profitability is affected by the size of a company’s
board. A number of studies (reviewed below) appear to support the view of a negative
relation between board size and corporate profitability. According to Ntim (2013), as the

67
board size increases, there is always the tendency for directors to engage in free-riding and
shirking of responsibilities also leading to lower managerial monitoring and performance.
Over time, larger boards tend to become inefficient and are unable to facilitate key board
functions effective due to coordination and communication problems as it becomes more
difficult to arrange board meetings and reach consensus, which eventually leads to slower
and less-efficient decision-making (Jensen, 1993; Lipton and Lorsch, 1992).
Guest (2009) investigated the impact of board size on the performance of 2,746 listed
companies in UK over 1981-2002 and document a strong negative relationship between
board size and three different measures of performance (performance Tobin’s Q and share
returns). Similar studies (e.g., Cheng , 2008; Coles et al., 2008) also found a significant
negative relationship between board size and the performance. Loderer and Peyer (2002)
documented a significantly negative impact on Tobin’s Q (although not on profitability)
while Conyon and Peck (1998) find a significant negative effect of board size on both
market to book value and profitability among 481 listed UK firms.
On the other hand, a number of studies (e.g., Uadiale, 2010; Adams and Mehran, 2003;
Mangena et al., 2010; Kajola et al., 2008) also document a positive relationship between
board size and performance measured by profitability. The theoretical argument to support
these findings suggest that companies with large board size are able to enjoy a lot of
valuable advice from a large number of board members (Dalton and Dalton, 2005).
According to Lehn et al. (2004), larger boards have the advantage of enjoying a large
amount of collective information which is also valuable for the monitoring function of the
board.
Many directors mean that there will be diversity of specialisation, which can enhance the
decision-making processes within the company. The diversity of specialisation could help
68
companies to secure critical resources and also reduce environmental uncertainties
(Goodstein et al., 1994). Furthermore, it makes it easier to create committees within the
company for the effective execution of duties and responsibilities (Bathula, 2008). These
communities are able to sub-divide the duties and responsibilities on the lines of
specialisation and expertise so as to ensure effectiveness and efficiency, which may
maximise profitability. Previous researchers (e.g., Uadiale, 2010; Adams and Mehran,
2003; Mangena et al., 2010; Kajola et al., 2008) have also found a positive relationship
between profitability and company board size.
3.3.1.1 Chief Executive Officer (CEO) Tenure
CEO tenure is an important component to organisational performance and executive
leadership. However, the association between CEO tenure and performance is theoretically
and empirically shared by many studies (Miller and Shamsie, 2001). It is argued that CEOs
that spent a long time in their post often resort to empire building. A CEO with a lengthy
time in a company will become more comfortable and will use his or her power and
knowledge gained to seek their own interest at the expense of profitability. It may also lead
to CEO entrenchment. This entrenchment results from the fact that a long tenured CEO
may dominate the board, which will lead them to pursue costly projects that can jeopardise
a company’s profitability. Shen (2003) maintain that CEOs spent a lot of time to achieve
success in their work and that the ability of a CEO will increase with time. It means that
their increased ability will have a positive influence on profitability. As suggest by Gabarro
(1987), new CEOs normally require one or two years to acquire the needed task knowledge
to be able to take major decisions. Also, as a CEO stays in an office for long, it helps him
or her to acquire company specific knowledge that helps to maximise profitability. Shen
(2003) argues that CEOs continue to accumulate task knowledge and also sharpen their
leadership skills with time. Longer tenured CEOs are motivated to improve profitability
69
because they have the benefit of seeing the results of decisions taken (Kyereboah-
Coleman, 2007b).
Another profitability enhancement of longer CEO tenure is that it leads to lower
monitoring cost, which may show in improved profitability. Due to the unproven abilities
of New CEOs, they tend to be closely watched by management. This results in substantial
monitoring cost at the expense of profitability. On the contrary it is shown that because
new CEOs are keenly watched, it actually propels them to achieve higher profitability.
This higher performance stems from the fear of been dismissed, because research has
shown that CEO dismissal is acute during the first five years in office (Shen and Cannella,
2002). Bergh (2001) finds a significantly positive relationship between CEO tenure and
profitability.
On the other hand, it is argued that a CEO that has spent a long time at his or her post will
resort to empire building. A CEO with such a lengthy time in a company will become more
comfortable and will use his or her power and knowledge gained to seek his or her own
interest at the expense of profitability. It may also lead to CEO entrenchment. This
entrenchment results from the fact that a long tenured CEO may dominate the board, which
will lead him or her to pursue costly projects that can jeopardise a company’s profitability.
He or she may also use such power and domination to ask for higher compensation
package at the expense of profitability (Hill and Phan, 1991; Allgood and Farrell, 2003).
Hermalin and Weisback (1998) developed a model, which proved CEO domination over
the board, as a result of long tenure. This model predicted that board independence actually
declines over the course of a CEO’s tenure. A long tenured CEO may have the opportunity
to influence the selection of directors (Zajac and Westphal, 1996). This opportunity will
offer him or her advantage of choosing directors who are sympathetic, which will afford

70
him or her ability to exert own influence and discretion that may minimise profitability.
Another negative effect of longer CEO tenure stems from the fact that it results in the
board becoming more relaxed and less vigilant in monitoring the CEO (Lorsch and
MacIver, 1989; Coles et al., 2001), which may decrease profitability. Empirical studies by
Hambrick et al. (1993) and Farooque et al. (2007) found a significantly negative
relationship between CEO tenure and performance.
3.3.2 Company Characteristics and Profitability
3.3.2.1 Company Size
Haniffa and Hudaib (2006) suggest that firm size may be related to firm performance.
Large firms can exploit economies of scale and scope and thus being more efficient
compared to small firms. According to Hardwick (1997), larger companies tend to enjoy
economies of scale in the form of operating cost and the cost of innovation, which reduce
the unit cost of production leading to increase profitability. Shepherd (1986) also suggested
that company size determines its bargaining power. Thus companies with superior
bargaining power, tend to me more profitable as such companies are able to influence their
trading relationship in terms of the amount of credit granted, terms of payment, quality of
the products and even the means of delivery. It is, however, suggested that larger firms
tend to have superior bargaining power over their suppliers and often tend to dictate the
amount of credit granted, terms of payment and the quality of the suppliers’ product. This,
however, helps these firms to be more profitable. In addition, small firms may have less
power than large firms; hence they may find it difficult to compete with the large firms
particularly in highly competitive markets ( Majumdar, 1997) since larger firms have more
advanced and sophisticated marketing skills, research capabilities and product
development experience, which together form the foundation higher profitability (Dewar
and Dutton, 1986).

71
According to Yang and Chen (2009), larger firms have preferential treatment over smaller
firms in terms of cost of credit from financial institutions, a pool of qualified human capital
and are able to achieve greater strategic diversification over their smaller counterparts.
This according to them makes larger firms less prone to failure and also assists them in
exploring other profitable ventures which improves profitability. Besides they have the
monetary resources to recruit highly skilled personnel to propel their strategic objectives.
Current research (Majumdar, 1997; Inmyxai and Takahashi, 2010; Kakani and Kaul,
2002) on the relationship between firms’ profitability and size all found a positive
relationship suggesting that larger firms tend to be more profitable than smaller firms.
Empirical work of (Mathuva, 2010; Padachi, 2006) confirm this argument.
3.3.2.2 Financial Leverage
The financial leverage has a significant effect on companies’ profitability (Ruland and
Zhou, 2005). The presence of debt in the capital structure raises the pressure on managers
to perform (Akintoye, 2008). Other studies (e.g., Higgins, 1977; Miller, 1977; Dhaliwal et
al., 2005) have argued that firm’s financial leverage affects the cost of capital which
ultimately affects stock prices and profitability of firms. According to some studies (e.g.,
Kim, 1997; Sheel, 1994; Sunder and Myers, 1999; Titman and Wessles, 1988; Upneja and
Dalbor, 2001), firms need to strike a trade-off between the financial cost of borrowing and
their interest tax shields when formulating decisions on the firms’ capital structure.
Sunder and Myers (1999) contend that firms with lower debt ratio often tend to be more
profitable contrary to the prediction of the trade-off theory. Dann (1981) and James (1987)
attribute the abnormal positive returns of firms to leverage increasing events (stock
repurchases or debt-for-equity exchanges) than leverage – decreasing events (stock
issuing). According to Titman and Wessels (1988), since firms with lower levels of

72
leverage tend to use their earnings before seeking capital outside, they tend to be more
profitable. According to Wald (1999), profitability, which is the most significant
determinant of firms’ financial leverage, negatively affects the debt to asset ratios in the
heteroskedastic Tobit regression model. Dimitrov and Jain (2005) found a negative
association between financial leverage and profitability. Mathuva (2010) included financial
leverage as one of the control variables in establishing the influence of WCM components
on corporate profitability. The results showed a negative association between financial
leverage and profitability. Samiloglu and Demirgunes (2008) introduced company size and
financial leverage as control variables when they investigated the effect of WCM on firm
profitability in Turkey. The results indicated a significantl negative association between
financial leverage and profitability. In a study by Christopher and Kamalavalli (2009) on
the sensitivity of profitability to WCM among 63 Indian corporate hospitals also found a
negative effect of financial leverage on profitability. However, Padachi (2006) also found a
negative association between leverage and firms profitability.
3.3.2.3 Liquidity Ratio
The level of liquidity within a company may greatly influence profitability. A company
that has more liquidity may have the capability of extending more credit to its customers.
High liquidity may also hinder a company’s profitability (Ng and Baek, 2007). Boermans
and Wiilbrands (2011) contend that a firm’s profitability is significantly influenced by its
level of liquidity since the availability of liquidity allows the firm to meet its short term
obligations on time and also take up profitable ventures. A company that has more
liquidity may have the capability of extending more credit to its customers. The offering of
credit may increase sales because it can entice customers to buy more, which will
maximise profitability (Garcia-Teruel and Martinez-Solano, 2010c; Gill et al., 2010). The
level of liquidity within a company can help avoid the use of costly external finance. A

73
considerable evidence exist to suggest that internally generated finance is cheaper than
external finance because of the problems of information asymmetry, which manifest itself
in the form of adverse selection and moral hazard (Myers and Majluf, 1984; Brito and
Mello, 1995). The liquidity of a company may be an indication that a company is forgoing
the benefits of investing in profitable opportunities. High liquidity may also result in
managers misappropriating the funds of the company.
According to Jensen (1986), mangers have incentives to increase the free cash flow of their
companies because it is probably the only one asset they can freely control. Damodaran
(2005) argue that managers have their own agenda to pursue and that cash provides them
with the ammunitions to fund these pursuits. In addition, Lartey et al. (2013) argue that
holding a significant amount of liquid assets negatively affects the firms profitability as it
impose an opportunity cost on the bank given their low return relative to other assets. In
summary, it can be argued that a high level of liquidity may decrease profitability.
Tauringana and Afrifa (2013) found a negative association between liquidity and
profitability. Bourke (1989) suggests a positive relationship between liquid assets and
profitability in their study on 90 European, North American and Australian.
3.3.2.4 Asset Tangibility
Another important determinant of profitability is tangibility of the firm’s assets (Campello,
2005). Bhagat et al. (2005) suggest that companies with fewer tangible assets face
information asymmetry, when communicating their value to outside investors as a result
they are likely to face financial constraints. This in effect affects their profitability (Baños-
Caballero et al., 2013). Asset tangibility offers credibility to investors’ threat to take the
firm to bankruptcy court and/or to dismiss its management team, affecting incentives to

74
perform (Campello, 2005). According to Hart (1995), non-human assets help in holding a
relationship together.
Braun (2003) maintains that tangible assets are those that would more easily shift to the
investor’s control when the relationship breaks down. For most external financers, the best
way to guarantee safe lending is through the provision of security which in most case for
firms, tangible assets which could be reposes in an event non-payment of the credit.
Research by Haris and Robinson (2001) found a negative relationship between firms’
profitability and tangible assets. On the basis of this evidence, they argued that firms need
higher proportion of intangible assets such as human capital in order to use the resources
with maximum effectiveness since intangible assets such as human capital, R&D,
organisational capital and goodwill can help the firm to create new products and processes
(Teece and Pisano, 1998). Empirical evidence of Onaolapo and Kajola (2010) also found a
negative association between asset tangibility and profitability. Deloof (2003) found a
positive association between asset tangibility and profitability.
3.3.2.5 Cash flow
Cash flow is also very important to companies because it allows them to pay bills on time.
The availability of cash flow may improve corporate profitability by reducing the
transaction costs of raising funds (Peterson and Rajan, 1997). With available cash flow
holdings, firms can afford lengthy cash conversion cycle, which can improve company
profitability by increasing sales (Deloof, 2003). It is also argued that cash flow availability
allows a company to extend more credit to customers, which may entice them to purchase
more, even in times of low demand (Emery, 1987). The availability of cash flow may also
lead to an increase in investment in accounts receivable and inventory days held, which
75
could enhance higher profitability through reduction in the transactional cost of paying
bills.
Ferris (1981) suggests that larger inventories can reduce supply and collection cost on the
firm as both suppliers and customers in the long run work towards better time management
for delivery / payment to optimise both inventory and cash levels (Paul and Boden, 2008).
For instance, a buyer might prefer to pay his debt monthly instead of immediate payment
cycle from the delivery schedule (Peterson and Rajan, 1997). Firms are able to reduce the
cost of warehousing particularly when the customer has the ability to carry the inventory
Similarly, with available cash holdings, firms could take advantage of available discounts
of buying in bulk, which may reduce the procurement cost of production and the cost of
sales of the product, which will reduce the overall price of the product leading to more
profitability.
3.3.2.6 Growth opportunities
Growth opportunities could also affect the firm’s profitability, as has been shown in
various studies (Deloof, 2003; Shin and Soenen, 1998). It is generally accepted that stock
returns reflect the company's growth opportunities. As is often argued, growth looks like a
necessary ingredient for corporate profitability and the creation of shareholder value (Shin
and Soenen, 1998). Deloof (2003) found positive association between growth opportunity
and profitability.
3.3.2.7 Industry classification
Many theoretical perspectives have long recognised the importance of industry
membership for company profitability (Rumelt, 1991; McGahan and Porter, 1997; Short et
al., 2007). For example, it has been found that companies belonging to the same industry
exhibit similar profitability profiles whilst those in different industries exhibit different
76
profit margin. According to Porter (1980), the differences in profitability levels of
companies within an industry depends on the bargaining power between the suppler and
customer. In an industry with few suppliers, but many customers, suppliers may enjoy
enhanced profitability by dictating to customers; such as determining the price of the
products and even the terms of credit to be offered.
On the other hand, an industry with many suppliers, but few customers may see
profitability plummeting because customers tend to dictate the terms of engagement.
Profitability level of companies within an industry may be impaired if there are not enough
entry barriers available. Also, the availability of substitute products may negatively affect
profitability because it will reduce the market share of companies within an industry. The
level of competition within an industry may also impair upon companies profitability.
Intense competition may cause profitability to drop because of the level of infighting.
However, companies in a low competitive industry may boost profitability because they
can take initiatives without retaliation from other companies. It is suggested that the
industry belonging explains between 17 per cent and 20 per cent of profitability variance
(Schmalansee, 1985; Wernerfelt and Montgomery, 1988; Rumelt, 1991).
3.4 SUMMARY OF PREVIOUS RESEARCH
Table 1.1 below summarises content analysis of previous studies on working capital
management. The table has been divided into six columns, with column one detailing the
author(s) name and year of publication, column two shows the country of study, column
three indicates the aim and the main methods used, column four shows the sample size,
column five reports the variables adopted for the study and finally, column six records the
outcome of each study.

77
Table 1.1. Summary of content analysis of previous studies on the relationship between working capital management and profitability
Author(s) Year Country Aim and Main method Sample Variable Main finding:
negative(-)
positive(+)
Jose et al.
(1996)
America
Relationships between profitability and WCM in a
large sample of firms;
Correlation and regression analyses
2718 CCC
_
Wang (2002)
Japan/Taiwan Working capital management and profitability
Regression analyses (Cross-sectional regression)
1555
Cash conversion cycle
Sales growth
_
+
Deloof
(2003)
Belgium
WCM and the profitability of Belgian firms
Statistical analyses Correlation and regression analyses
1009
Accounts receivable
Inventories
Accounts payable
Cash conversion cycle
Log of sales
Sales growth
Financial debt
Fixed financial assets
_
_
_
_
+
+
+
_
+

78
Amir Shah and
Sana
(2006)
Pakistani
WCM and the profitability of Oil and Gas sector of
Pakistan
Correlation Regression analyses
7
Gross operating income
Accounts receivable
Accounts payable
Inventories
_
_
_
_
Lazaridis and
Tryfonidis
(2006)
Athens
Relationship between WCM and the profitability
Regression analysis
131
Debtors control period
Cash conversion cycle
period
Payment control period
Inventory control
Financial debt
Fixed financial assets
_
_
_
_
+
_
Garcia-Teruel and Martinez-
Solano
(2007)
Spain
WCM and the profitability of Spanish SMEs Statistical
analyse
Correlation and regression analyses
8872
Accounts receivable
Accounts payable
Inventory control period
Cash conversion cycle
Firm size
Sales growth
Leverage
_
_
_
_
+
+
_
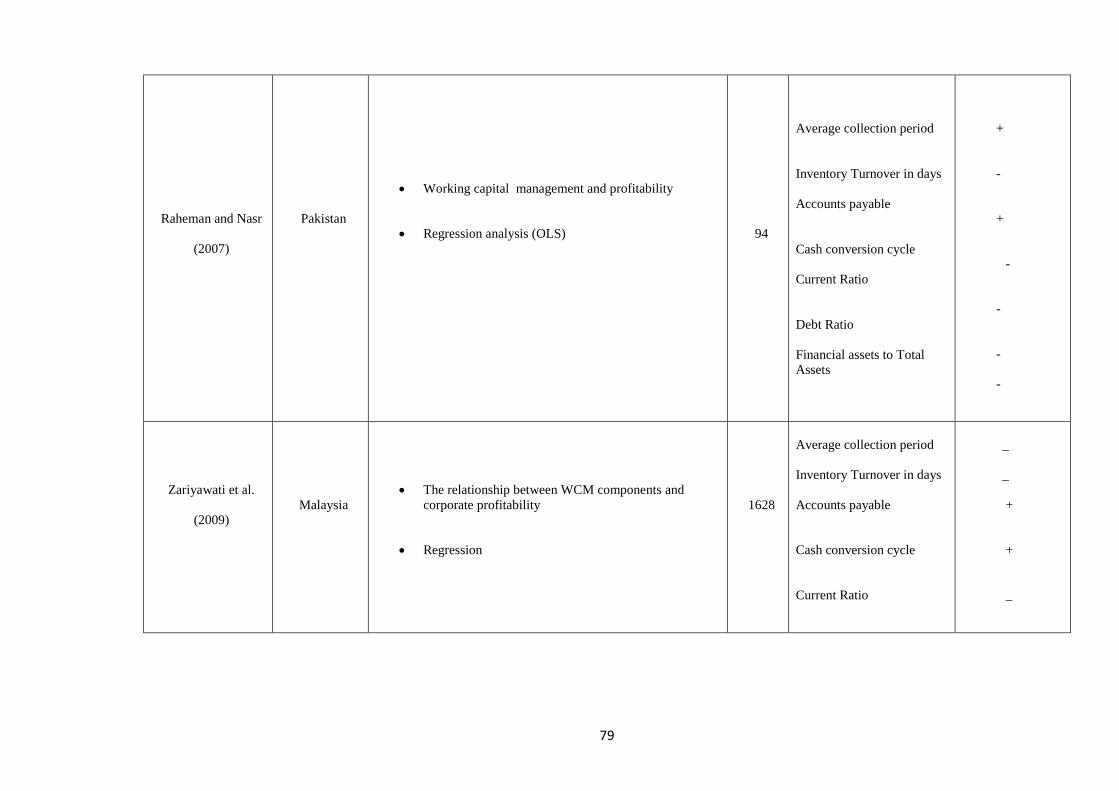
79
Raheman and Nasr
(2007)
Pakistan
Working capital management and profitability
Regression analysis (OLS)
94
Average collection period
Inventory Turnover in days
Accounts payable
Cash conversion cycle
Current Ratio
Debt Ratio
Financial assets to Total Assets
+
-
+
-
-
- -
Zariyawati et al.
(2009)
Malaysia
The relationship between WCM components and
corporate profitability
Regression
1628
Average collection period
Inventory Turnover in days
Accounts payable
Cash conversion cycle
Current Ratio
_ _
+
+
_

80
Abuzayed
(2012)
Jordon
Working capital management and firms’ performance
in emerging Markets
Fixed Effect Regression
93
Average collection period
Inventory Turnover in days
Accounts payable
Cash conversion cycle
Current Ratio
Debt Ratio
Firmsize
+
+
+
-
+
+
+
Falope and Ajilore
(2009)
Nigeria
WCM and the profitability of a sample Nigerian firms
Pooled regression
50
Average collection period
Inventory Turnover in days
Accounts payable
Cash conversion cycle
Current Ratio
Debt Ratio Firm size
Sales growth
_
_
+
_
+
+
+
+
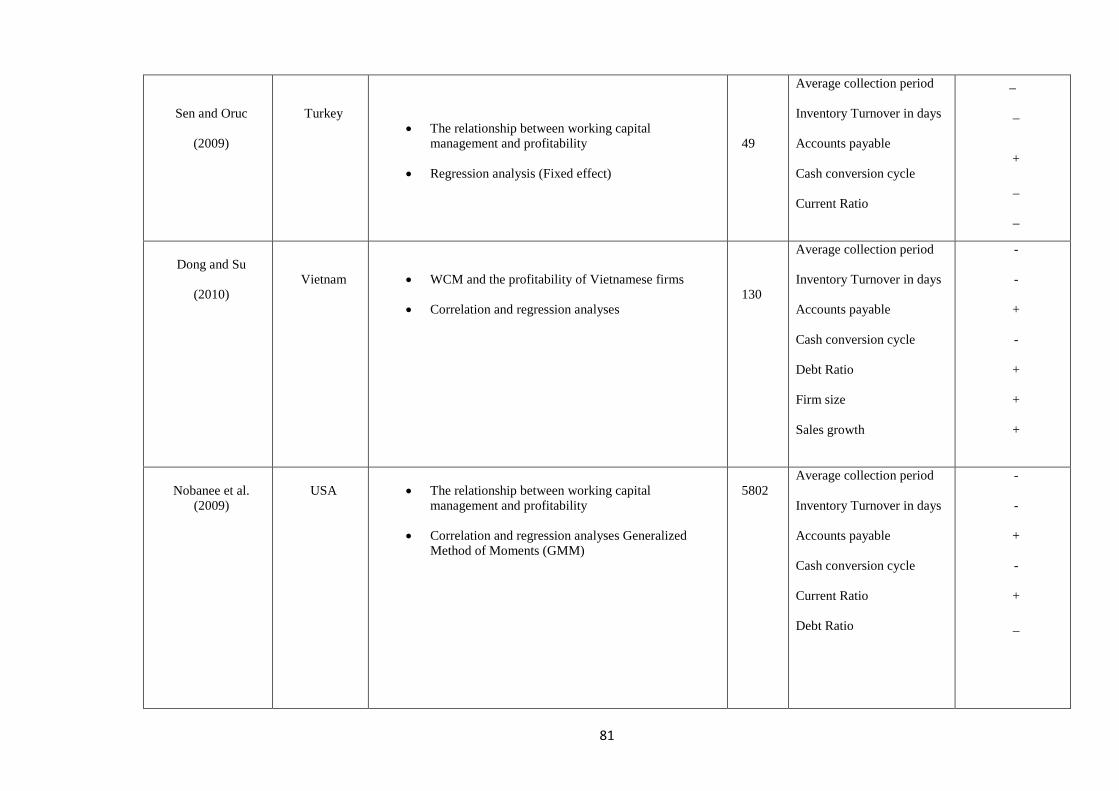
81
Sen and Oruc
(2009)
Turkey
The relationship between working capital management and profitability
Regression analysis (Fixed effect)
49
Average collection period
Inventory Turnover in days
Accounts payable
Cash conversion cycle
Current Ratio
_
_
+
_
_
Dong and Su
(2010)
Vietnam
WCM and the profitability of Vietnamese firms
Correlation and regression analyses
130
Average collection period Inventory Turnover in days Accounts payable
Cash conversion cycle Debt Ratio Firm size
Sales growth
- -
+
-
+
+
+
Nobanee et al. (2009)
USA
The relationship between working capital management and profitability
Correlation and regression analyses Generalized Method of Moments (GMM)
5802
Average collection period
Inventory Turnover in days Accounts payable Cash conversion cycle
Current Ratio Debt Ratio
-
-
+ -
+
_
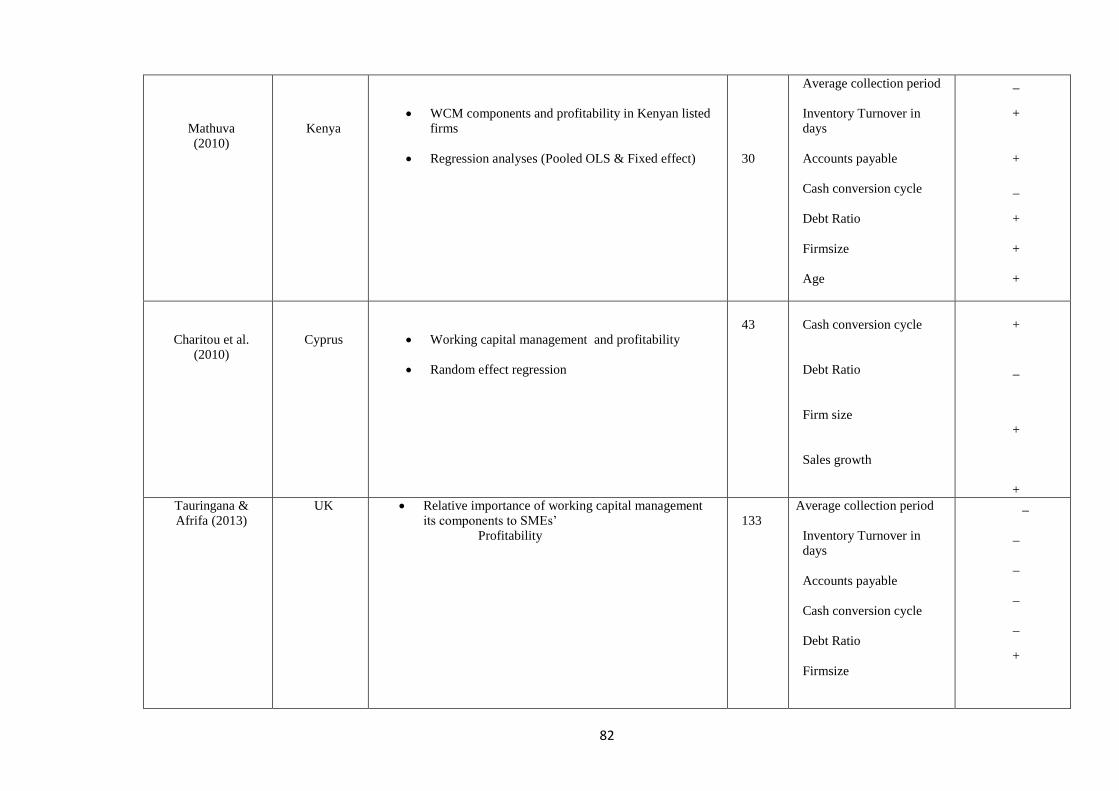
82
Mathuva (2010)
Kenya
WCM components and profitability in Kenyan listed firms
Regression analyses (Pooled OLS & Fixed effect)
30
Average collection period Inventory Turnover in days
Accounts payable Cash conversion cycle Debt Ratio
Firmsize Age
_ +
+
_
+
+
+
Charitou et al.
(2010)
Cyprus
Working capital management and profitability
Random effect regression
43
Cash conversion cycle Debt Ratio
Firm size Sales growth
+
_
+
+
Tauringana & Afrifa (2013)
UK Relative importance of working capital management its components to SMEs’
Profitability
133
Average collection period Inventory Turnover in days
Accounts payable Cash conversion cycle Debt Ratio
Firmsize
_
_
_
_
_
+

83
Banos-Caballero et
al.
(2013)
UK Working capital management, corporate performance
and financial constraint
Regression and two-step generalized
method of moments (GMM)
258 Net trade cycle
Leverage Ratio
Firm size
Sales growth
_
+
_
+

84
3.5 LIMITATIONS OF EXISTING RESEARCH AND NEED FOR FURTHER
RESEARCH
One of the major limitations of existing research, which warrant the need for further
research, is that existing studies (e.g., Shin and Soenen, 1998; Deloof, 2003; Martinez-Sola
et al., 2013; Tauringana and Afrifa, 2013) have made a number of both theoretical and
empirical contributions on the relationship between working capital management (WCM)
and profitability without considering the potential dynamic effects. Existing research has
not investigated whether the effect of WCM and its components (AR, AP and INV) on
profitability may be contingent on organisational contingencies (environment, resources
and management) of the firm as postulated by contingency theory.
A number of studies indicate that firms change their policy over time as they adjust to the
demands of their environment (Ambrosini et al., 2009; Rueda-Manzanares et al., 2008) and
their resource (Mol and Wijnberg, 2011) and management capabilities (Luo et al., 2013) in
order to positively influence profitability. For example, according to the structure-conduct-
performance (SCP) model, the degree of concentration in an industry determines firm
behavior and profitability. This is because higher concentration enables collusion between
firms, which leads to higher profits. It has also been suggested that exogenous
characteristics, such as industry concentration often results in barriers to entry for new
firms and enables established firms to share industry profits (Porter, 1980). According to
evidence from the resource based value theory of the firm, performance differentials are
produced by resource heterogeneity among competing firms (Peteraf, 1993; Hoopes et al.,
2003). Moreover, it has also been suggested that firm profitability depends on internal

85
matters such as its management policy, which also depends on the structural characteristics
of the industry, stakeholders and size (Spanos et al., 2004; Darnall, 2009).
Also, one of other major limitations of existing research is the conflicting result. While
some studies suggest that high level of working capital may improve profitability by
stimulating sales (Banos-Caballero et al., 2010), preventing production interruptions
(Tauringana and Afrifa, 2013), strengthening long-term relationships with customers (Ng
et al., 1999), and influencing the acquisition of merchandise at times of low demand
(Emery, 1987), others advocate that minimising the investment in working capital may
result in higher profitability (Deloof, 2003; Banos-Caballero et al., 2013) because of lack
of finance in general and the expensive nature of external finance in particular (Banos-
Caballero et al., 2013). Autukaite and Molay (2011) argue that effective WCM leads to a
reduction in a firm’s risk, which attracts cheaper financing from both shareholders and
lenders. Ganesan (2007) asserts that reducing the requirement in working capital reduces
the need for financing and cost of capital, so increasing the cash available to shareholders.
The varying explanation for the direction of the association between WCM and
profitability suggests that an optimal working capital level may exist at which the
profitability of the firm is maximised (Banos-Caballero et al., 2012) and therefore there is
need for further research.
The current research is also limited because research evidence on the relationship between
WCM and profitability in UK, where current knowledge and understanding is limited in
view of the fact that late payment problems have been identified as a main source of
business failure (Wilson, 2008). The few existing studies (Howorth and Westhead, 2003;
Tauringana and Afrifa, 2013) that have investigated this area have primarily focused on
smaller firms. The relationship between WCM and profitability may differ among large
UK listed companies since Wilson (2008) suggests that large firms tend to use their market

86
power to exploit their ‘dominant’ positions as buyers in competitive supply markets by
taking ‘extended’ trade credit and thus leveraging their own profit and cash-flow.
3.6 SUMMARY AND CONCLUSION
This chapter examined the relationship between WCM and profitability. It presented the
interrelationship between working capital, its components and corporate profitability. The
rationale was to demonstrate how the lack of consistency from present empirical evidence
of the impact of working capital on firm profitability has necessitated the need for new
evidence. It started with the discussion of how WCM (measured by CCC) and its
components (AR, AP and INV) affect profitability of the firms. This was followed a
discussion of how WCM (measured by CCC) and its individual components (AR, AP and
INV) affect profitability of the firms. These variables have been included in the study in
order to prevent any possibility of omitted bias (see Bartov et al., 2000)
87
4 CHAPTER FOUR
TOWARDS A CONTINGENCY THEORY OF WORKING CAPITAL
MANAGEMENT
4.1 INTRODUCTION
This chapter reviews the theoretical underpinnings of the relationship between working
capital management, its contingencies and profitability. It adopts the contingency theory as
leading theoretical framework to enable prior identification of the main research questions
and independent variables to direct the research. The rest of the chapter is structured as
follows. Section 4.2 explores the various theories under the contingency theory. Section
4.3 examines the concept of fit and misfit in contingency models. A final conclusion of the
study is presented in section 4.4.
4.2 CONTINGENCY THEORY FRAMEWORK
The contingency theory gains its roots from the functional sociological theory perspective
of organisational structure, which offers cogent explanations on the interrelationships
among organisational sub-systems as well as between the organisational system and its
environment (Fridman and Ostman, 1989). According to the theory, no single type of
organisational strategy is equally applicable to all organisation s (Islam and Hu, 2012), in
other words, according to Scott and Cole (2000), there is no one best way to design an
organisation within the contingency framework. Flyn et al. (2010), suggests that it is the
environment that organisation s operate that shapes their structures and processes.
According to the theory, organisations need to adopt their systems and structures to be
congruent with the various contingencies or circumstances of their external environment in
order to enhance profitability. In other words, according to Burrell and Morgan (1979), the
more an organisation is able to deal with the demands of the environment organisation

88
interact with, the better the performance. Therefore organisation performance depends on
the extent to which the strategy that it seeks to pursue is aligned with the demands of its
environment (Flyn et al., 2010). Such an alignment between profitability and strategy is
described in earlier studies (Van de Van and Drazin, 1985; Venkatraman and Prescott,
1990; Milgrom and Roberts, 1995) as “fit” in the literature of strategic management. It is
interpreted as the interactive effect of organisational structural variables on profitability
(Van de Ven and Ferry, 1980). When a firm’s structural variable fits at a level that is equal
to its organisational contingencies, profitability is enhanced and vice versa (Donaldson,
2001). The better the fit, the more effective the organisation becomes (Zona et al., 2012).
Various theoretical and empirical studies on board management (Mangena, et al., 2012;
Zona et al., 2012), accounting systems (Waterhouse and Tiessen, 1978) and marketing
(Zeithaml and Zeithaml, 1988) have adopted the contingency framework. The framework
in recent years maintained its popularity with many studies focusing on the use of common
contingency variables – such as environment, technology, size, structure, strategy and
national culture (Chenhall, 2003). Donaldson (2001) categorised these contingencies
except size into organisational tasks and named these tasks as task uncertainty and task
interdependence, which along with size became the underlying contingencies in the
literature of structural contingency. He further argued that each organisation varies
depending on the level of these contingency factors and on corresponding structural
variables. For instance, as size increases, so is the fitting structure more bureaucratic (i.e.,
has many departments, many hierarchical levels, high specialisation, high formalisation,
and low centralization). Therefore as task uncertainty increases, the fitting structure
becomes less formalised and more decentralized - it also features structures to coordinate
between functional departments such as project teams. Also as diversification increases, so
is the fitting structure divisionalised, which raises the degree of bureaucratic structuring.

89
Hence, he concluded that the greater the diversification, the more autonomous the divisions
and the smaller the corporate central office. He also suggested that divisionalisation needs
to fit the priority given to innovation vs. cost reduction. Matrix structures, of various types,
fit intermediate levels of diversification. Overall, large size and diversification raise the
required degree of bureaucratization, with task uncertainty causing some variations to it
(Donaldson, 2001).
Luthans and Steward (1977) identified organisational contingencies as environmental,
resources and management variables of the firm. Environmental variables according to
Churchman (1968), affect the organisation , but are beyond the direct or positive control of
the organisation 's resource managers. They are usually considered as "givens" or
independent variables that shape the organisation’s structures and processes (Flynn et al.,
2010). Porter (1980) and Duncan (1972) identified industrial structural characteristics as a
main determinant of firms’ profitability. According to Porter (1980), industrial
characteristics such as industry concentration often results in barriers to entry for new
firms and enabled established firms to share in industry profits (Bain, 1956). Besides it sets
set bounds on the strategies and performance of firms that give rise to industry specific
differences in profitability.
Resource variables are tangible and intangible factors over which management has more
direct control and on which it operates to produce desired changes in the organisation al
system or its environmental supra-system (Churchman, 1968). A firm’s unique resources
are key factors in its profitability. According to the resource based value of the firm, the
unique resources accumulated over time are difficult and costly to emulate, as a result they
contribute to superior profitability for firms (Demsetz, 1973). High performing firms are
able to maintain at least a portion of their competitive advantage over a period of time
since the source of their advantage is ambiguous, exclusive, costly and/ or difficult to
90
emulate (Demsetz, 1973). Grant (1991) identified firm age, firm size and financial
resources such as cash flow as some of the key profitability related resources of the firm.
Management variables refer to those concepts and techniques expressed in policies,
practices and procedures used by the manager to operate on available resource variables in
defining and accomplishing system objectives (Luthans and Steward, 1977). Many other
theoretical and empirical studies on corporate board functioning and effectiveness have
adopted the contingency theory. Empirical findings by Mangena et al. (2012) support the
argument that corporate governance affects profitability. Zona et al. (2012) justified the
relevance of the contingency hypothesis in corporate governance. Forbes and Milliken
(1999) suggest that effective functioning of a board changes in line with the organisational
context. Nicholson and Kiel (2003) in an attempt to investigate the impact of board capital
(social, structural and human) on board roles, board effectiveness and firm performance,
developed a contingency model for corporate boards. Wincent et al. (2010) on the other
hand found a correlation between board features (such as diversity and interlocking
directorates) and increased innovation.
4.3 THE CONCEPT OF FIT AND MISFIT IN CONTINGENCY MODELS
The concept of fit of an organisational structure is the heart of the contingency theory. It
suggests that a company is considered fit when it is structured and position to do well in its
activities. On the contrary, misfit is the deviation from the ideal fit. According to Miles
and Snow (1984), fit is described as the state or process by which an organisation is able to
align its strategy with its environment and also arrange internal resources to support such
an alignment. They referred to such an alignment mechanism as a strategy and the internal
arrangement as organisational structure and management process since it is very difficult to
tightly integrate these major components in a changing environment for every organisation.

91
On the basis of this, they argued that organisations should always strive for rather than
accomplishing perfect fit condition.
Many studies (e.g., Burton et al., 2000) have also delved into the concept of fit by using it
to illuminate how organisational strategy affects organisational performance. In as early as
the 1960s, Chandler (1962) proposed the strategy – structure fit proposition whilst later on,
Lawrence and Lorsch (1967) developed the “environment – structure” fit proposition in
their study of the plastics, food products and container industry firms. Woodward (1965)
observed fit between the firm’s technology and the firm’s structure.
Van de Ven and Drazin (1985) in their study developed a major conceptual statement
about fit which has guided current studies on the concept. They integrated a fit of multiple
organisational structural variables to a contingency in their analysis using three concepts
(selection, interaction, and systems). These three approaches were considered as mutually
exclusive and provided complementary information about company behaviour. Selection
approach suggests that for companies to be able to survive or become effective they must
adapt to characterisation of their organisational context in terms of the way they operate
and how they are structured. In other words the firm’s behaviour is determined by
environmental, resource and management capability of the firms. Most early studies on
contingency research adopted this approach to investigate the relationship between
organisational design and organisational context rather than their impact on profitability.
For instance, Dewar and Hage (1978) adopted the framework size, technology, complexity,
and structural differentiation. They found that the most important determinant of structural
differentiation in division of labour is the scope of the organisational tasks, technological
dimension and not organisational size. Freeman (1973) on the other hand found strong
evidence of the relationship between the various characteristics of technology and structure
in the organisation when they adopted the selection approach. However, they failed to
92
investigate whether the different types of technology and organisational structural tasks
were effective.
The second approach to contingency theory by Van de Ven and Drazin (1985) is based on
the alternative notion that none of context, structure, or control alone should affect
profitability; it is the fit among them that affects profitability. Fit is interpreted as an
interaction effect of organisational structure and context on profitability (Khandwalla,
1977; Van de Ven and Ferry, 1980). This is obtained by estimating the total effect of each
of the components after a given level of fit. Darnel (2009) suggests that the sum of the
coefficients of the individual context and structural variables and their interaction term
reflects the total effect of these variables on profitability. Burton et al. (2000) argued that
in determining the total fit, both the coefficients of the interaction terms and the sum of the
coefficients of the individual variables and their interaction terms should be significant.
Finally, the systems approach unlike the previous two approaches search for how the
various patterns of contextual and structural variables influence profitability. According to
Van de Ven and Drazin (1985), the understanding of context-structure-performance
relationships can only advance by addressing simultaneously the many contingencies,
structural alternatives, and performance criteria that must be considered holistically to
understand organisational design. In order to achieve this; the systems approach advocates
the need to use multivariate analysis to examine the patterns of consistency among the
dimensions of organisational context, structure and performance. The consistency analysis
in the systems approach uses the central concept of ‘Fit’ as being the “internal consistency
of multiple contingencies and multiple structural characteristics, it affects performance
characteristics” (Drazin and Van de Ven, 1985). Various studies have adopted the systems
approach to estimate the relationship between organisational context, structure and
performance. For instance, Pennings (1987) analysed simultaneously, a fit on a list of
93
multiple contingencies and multiple organisational structural variables. Keller (1994) on
the other hand extended the study by adopting fit of an organisational structural variable to
multiple contingencies.
Kraft et al. (1995) on the other hand investigated the dynamics of fit on different aspects of
performance such as social cost vs. financial performance. Burton et al. (2000)
conceptualised the concept of fit as a line of iso-performance. According to their model,
they argued that a fit of organisational structure to a low level of the contingency (e.g.,
small size) produces the same performance as a fit of organisational structure to a high
level of the contingency (e.g., large size). Evidence from their study found that firms with
either or both situational and contingency misfits have lower performance increases than
firms without misfits. According to them, a firm may not obtain increased performance
from the elimination of misfits piecemeal, but will obtain significant nonlinear positive
increases when misfits are fixed within a holistic or systems approach.
Donaldson (2001) also proposed a line of hetero-performance to conceptualised fit.
Empirical evidence from Donaldson (2001) reveals that firms in fit position tend to have
high performance, which leads them to increase their contingencies, such as size and
diversification, which in the long run leads them to a misfit position and lower
performance. According to him, the ensuing crisis of low performance causes these firms
to adopt a new structure that fits the new levels of their contingencies, thereby restoring fit
and performance. Donaldson (2001) went further to argue that the extent to which a firm
in a misfit could trigger structural change of restoring fit and performance depends on
other causes of performance that interact with it in misfit. Some of these other causes
(include disinvestment and debt) could offset or reinforce the depressive impact of the
misfit on performance. The set of causes of organisational performance and their effects on
organisational growth and adaptation have been formalized into a new organisational

94
theory called organisational portfolio theory (see Donaldson, 1999). Therefore he
concluded that firms are incentivised to change their level of contingencies so as to
maximise profitability.
4.3.1 Multidimensional Contingency Model
The multidimensional contingency model is a systems model, which incorporates
simultaneously, multidimensional concepts of fit. Many studies (e.g., Burton and Obel,
1998; Burton et al., 2000; Baligh et al., 1996) have argued that various multidimensional
concepts, such as environment, leadership preference and strategy need to be incorporated
simultaneously in order to enhance fit, which is measured as effectiveness , efficiencies
and viability of the company. On the other hand, a company is in misfit when it performs
less due to the misalignment.
A key example of a typical multidimensional model developed by Burton et al. (2000) is
shown in Table 2 below. The model incorporates the traditional contingency variables
namely: strategy, environment, size and technology to develop simultaneous fit among the
various dimensions. Additionally, four categories of fit were identified in the model,
namely: design parameter fit, situational fit, contingency fit and total fit. Design parameter
fit occurs when there internal consistencies among the various structural dimensions.
According to Burton et al. (2000), situational contingency fit requires congruence among
the design situation of factors. A typical example of a situational contingency fit of a firm
will be a case where the firm’s strategy, management processes, resources and
environment aligned. Therefore in an environment with high uncertainty, firms with
defender strategy could potentially face a misfit as a defender strategy works well in a
more certain and stable environment (Miles and Snow, 1978). Also, Burton and Obel
(1998) suggest that firms could face potential misfit if they practice a defender strategy in a

95
developmental climate since a developmental climate fits well with a more exploratory
strategy of e.g., a prospector. Therefore according to the situational fit, each condition has
what is required in a fit preposition to enhance high performance.
Contingency fit on the other hand, occurs when there is fit between a given set of
contingent variables and multiple variables in an organisational design. The contingency fit
relates the situational factors to the structural configuration and the properties. For
instance, if the leadership style of a company is characterized by high micro involvement
by top managers and a high decentralisation could lead to a potential misfit according to
Burton et al. (2000). This is because, high micro involvement implies leaders wanting to be
involved in management details which is not compatible with high decentralisation since it
could generate conflict as lower managers see the top management as meddling and
intrusion. Such a conflict could create non-productivity and yield lower performance. On
the basis of this, Burton et al. (2000)’s preposition of fit is that with low micro involvement
by top management should be matched with high decentralisation.
Another scenario of a potential misfit companies could face in terms of decentralisation is
environment. For instance, a highly centralised company operating in a highly uncertain
business environment is likely to face a potential misfit due to the level of information and
decision overload on top management. Top management may face the problem of not
getting the relevant information to make good decisions. Therefore Burton et al. (2000)
suggests that in order for companies not to suffer from information and decision overload
in a highly uncertain business environment, large companies need to have a highly
decentralized management structure. Burton et al. (2000) also suggested that firms could
face a misfit if its strategy is not well aligned with its structure. For instance, a company
with a highly formalised structure is likely to face potential misfit if it has a prospective
strategy. This is because a prospective strategy calls for flexibility, where a high

96
formalisation is likely to restrict and impede the requisite variation in action for a
prospector, thus a misfit.
Finally total fit requires the realisation of all the three fit criteria without any misfit (Burton
and Obel, 1998). Each may be important individually, but they may depend on each other,
so the effect of obtaining a fit in one dimension may be hampered by the other according to
Burton et.al (2000). Guided by these evidences and argument presented above by Van and
Drazin (1985), this study adopts the systems approach to examine the patterns of
consistency among a list of multiple contingencies, different components of working
capital and how they affect profitability at different levels of interaction.
4.4 CONCLUSION
Given that the objective of this study is to investigate the relationship between working
capital management, its contingencies and profitability, this chapter has explored the main
theoretical framework to explain this association. It adopted the contingency theory as
leading theoretical framework to enable prior identification of the main research questions
and independent variables to direct the research. Based on Donaldson, (2001) framework
of analysis on the theory, three main elements have been identified as the theory’s core
paradigm: (1) there is an association between contingency and the organisational structure;
(2) contingency impacts the organisational structure; and (3) there is a fit of some level of
the structural variable to each level of the contingency, where high fit leads to
effectiveness and low fit leads to ineffectiveness. The framework started with structural
contingency theory of organisation where it established a theoretical linkage between
organisational structure, its contingencies and performance. This was followed by a
discussion on the concept of fit and misfit in contingency models, where high fit leads to
effectiveness and low fit leads to ineffectiveness.

97
5 CHAPTER FIVE
HYPOTHESES DEVELOPMENT
5.1 INTRODUCTION
This chapter translates both the theoretical and empirical studies discussed in chapter four
and five on the relationship between working capital management, its contingencies and
profitability into testable hypotheses. The chapter is composed of sixteen hypotheses. The
first four determines the relationship between working capital management, its components
and profitability, as determined by previous studies. Its objective is to isolate the impact of
working capital management on profitability in order to determine if the impact may be
caused by multiple contingent factors, as postulated in the contingency framework. In the
second part of the section, four hypotheses are developed to determine whether the impact
of working capital management and its components on profitability is constrained by the
interaction of contingent factors as postulated in the contingency framework in chapter
five. Finally, the last eight hypotheses are developed to estimate the impact of other
variables found relevant by previous studies to influence the relationship between working
capital management on profitability.
The rest of the chapter is structured as follows: Section 5.2 discusses the hypotheses for the
impact of working capital management (CCC) and its components (AR, AP and INV) on
profitability. Section 5.3 presents various hypotheses on whether the relationship between
working capital management (CCC), its components (AR, AP and INV) on profitability is
moderated by the interaction of ERM factors of the firm. Section 5.4 examines the impact
of control variables on the relationship between working capital management on
profitability. This section is in two parts, the first part examines the corporate governance
98
related variables whilst the second section incorporates company characteristics in
estimating the relationship. A final conclusion of the chapter is presented in section 5.5
draws a conclusion for the chapter with a further summary presented in table 3.
5.2 WORKING CAPITAL MANAGEMENT AND PROFITABILITY
5.2.1 Working capital management
Previous studies (Deloof, 2003; Falope and Ajilore, 2009; Garcia-Teruel and Martinez-
Solano, 2007) have adopted CCC as the traditional measure for working capital
management. It measures the time lag between expenditure for the purchase of raw
materials and the collection of sales of finished goods. Soenen (1993) asserts that the
length of the CCC determines the firm’s profitability. Firms with a longer cash conversion
cycle often take a longer time to settle its suppliers than the collection of sales of finished
goods from its customers and vice versa.
On the other hand, it has also be argued that firms with a shorter cash conversion cycle are
able to maximise profitability due to their ability to internally generate funds which could
reduce their reliance on external finance which often tends to be expensive (Autukaite and
Molay, 2011; Banos-Caballero et al., 2013). In such an event, firms are able to finance
their current assets with suppliers’ credit, thereby avoiding the need for short-term loan,
which can be very expensive and inaccessible to some firms’ particularly smaller firms
(Nobanee, 2009). A lower cash conversion cycle is also an indication of the firms’
efficacy in the use of its working capital. It demonstrates how quickly they firm is able to
convert its inventory into sales and how fast its able to recover receipts from credit sales
whiles slowing down its cash disbursements (Nobanee, 2009). This helps to improve
profitability for the firm. A number of empirical studies have supported this argument that
firms with a shorter cash conversion cycle are able to maximise their profitability. In a

99
study by Mathuva (2010), cash conversion cycle was found to be negatively associated
with profitability. This suggests that firms could maximise profitability by reducing their
cash conversion cycle. García-Teruel and Martínez-Solano (2007), Falope and Ajilore
(2009), Dong and Su (2010) have all reported that shorter cash conversion cycle improves
profitability.
Similarly, firms’ profitability could also be reduced with a shorter cash conversion cycle.
Some customers could be deterred from patronising the product of their suppliers with an
aggressive working capital management strategy. This is because most firms use trade
credit to determine the ‘reputation’ and financial health of the company (Peel et al., 2000).
Therefore by offering an extended cash conversion cycle, a company is able to convince
customers that its products offer more value for money and that more benefits can be
derived from patronising the products or services (Nadiri, 1969; Shipley and Davis, 1991;
Deloof and Jegers, 1996; Blazenko and Vandezande, 2003). As a result, selling to
customers on immediate cash payment basis or collecting amount owned as quickly as
possible may deter customers from patronising the company’s products. It may also
involves negative effects such as default risk (Shi and Zhang, 2010), late payment (Pike
and Cheng, 2001) and transaction cost of converting receivables into cash (Kim and
Atkins, 1978), which may damage a firm’s profitability (Martinez-Sola et al., 2013;
Sartoris and Hill, 1983). A lengthy cash conversion cycle may improve company
profitability by increasing sales (Deloof, 2003).
In the same vein, having more inventories in stock means those customers will always
have what they want; this may lead to higher sales and improve profitability. Also, a
lengthy cash conversion cycle means that the company will pay suppliers upfront. This has
the advantage of improving the profitability of the company because of the cash discount
to be enjoyed. Also, delaying payments to suppliers may impair profitability of companies

100
because of the lost saving on cash discount available. However, paying suppliers
immediately upon purchases and extending more credit period to customers may require
the company to seek extra funding. But these extra funds will represent a cost to the
company because of the interest payment involved.
Empirical work of Martinez-Sola et al. (2013), support the argument that when firms relax
their credit period, they are able to reduce the storage costs of the excess inventories
accumulated which could also improve their profitability. A number of empirical studies
(see, Nobanee et al., 2010; Uyar, 2009; Wang, 2002; Zariyawati et al., 2009; Lazaridis and
Tryfonidis, 2006; Garcia-Teruel and Martinez-Solano, 2007) have also supported this
argument. On the contrary, Padachi (2006), Dong and Su (2010), Sen and Oruc (2009),
Raheman et al. (2010) found a positive association between cash conversion cycle and
profitability. On the basis of the enormous advantages that a shorter cash conversion cycle
brings to the firm based on the above theoretical arguments, the following hypothesis is
postulated:
H1 THERE IS A SIGNIFICANT NEGATIVE RELATIONSHIP BETWEEN CASH
CONVERSION CYCLE AND PROFITABILITY.
5.2.2 Accounts Receivables
Accounts receivables can be seen as short-term loans to customers given by the supplying
firm. It represents investment in working capital of firms (Martinez-Sola et al., 2013) and
acts as a source of finance to the buyer (Lee and Stowe, 1993). By allowing customers time
to pay, firms assume the position of financial institutions (Jain, 2001) because the time gap
between purchase of goods and/or services and payment offer a source of finance to
customers (Berger and Udell, 1998; Danielson and Scott, 2004).
101
The firms profitability is significantly affected by its accounts receivable policy (Banos –
Caballero et al., 2013; Garcia-Teruel and Martinez-Solano, 2010a; Peel et al., 2000). It is
found that firms with very long accounts receivables days usually take a considerable
amount of time to receive payment from its customers than their peers with a shorter days
accounts receivables. According to the product differentiation theory of trade credit,
accounts receivable can be used like any other sales promotional tool to increase sales and
profitability (Nadiri, 1969; Blazenko and Vandezande, 2003). According to this theory,
accounts receivable is used to differentiate a company’s product from that of competitors
(Nadiri, 1969; Blazenko and Vandezande, 2003). By offering trade credit, a company is
able to convince customers that its products offer more value for money and that more
benefits can be derived from patronising the products or services (Nadiri, 1969; Shipley
and Davis, 1991; Deloof and Jegers, 1996; Blazenko and Vandezande, 2003). Therefore,
managers can maximise firm profitability through product price and trade credit. Garcia-
Teruel and Martinez-Solano (2010a) found that companies are able to stimulate sales with
an increase level of accounts receivable. By extending the number of day’s accounts
receivables, companies are able to entice their customers to purchase more of the product/
service which in the long run improve its profitability. It also serve as quality guarantee to
customers (Smith, 1987; Pike and Cheng, 2001). By delaying payment, customers are able
to use the period between purchase and payment to check for the quality of the goods
and/or services.
Accounts receivables may increase profitability because of the implicit interest rates
involved (Emery, 1984). The granting of trade credit may also improve a firm’s
profitability through the reduction in operating and transaction costs (Ferris, 1981). By
relaxing the credit period according to Garcia-Teruel and Martinez-Solano (2010),
companies are able to reduce the storage costs of the excess inventories accumulated. This
102
argument has been justified by Martinez-Sola et al. (2013) who found that managers can
improve profitability by increasing investment in accounts receivables, which is consistent
with Hill et al. (2012) and the theoretical models presented by Kim and Atkins (1978);
Sartoris and Hill (1981) and Sartoris et al. (1983). Also, previous researches (such as
Nobanee, 2009; Ramachandran and Janakiraman, 2009) found positive relationship
between accounts receivable period and profitability.
On the contrary, a high investment in accounts involves negative effects, such as default
risk (Shi and Zhang, 2010); late payment (Pike and Cheng, 2001) and transaction cost of
converting receivables into cash (Kim and Atkins, 1978), which may damage a firm’s
profitability (Martinez-Sola et al., 2013; Sartoris and Hill, 1983). The problem of adverse
selection could cause a company to offer credit to a customer with a poor credit history,
which may end up as bad debt and therefore dwindle profitability. According to Cheng and
Pike (2003), by maintaining a high a level of trade credit, companies tend to finance the
buyers’ inventory and also bearing the credit risk. This may affect its profitability
maximisation.
Most empirical research on the effect of accounts receivable management on firm
performance has supported these arguments. Deloof (2003) found a significantly negative
relation between accounts receivable and profitability, arguing that customers want more
time to access the quality of products they buy from firms with declining profitability.
Other researchers (such as Raheman and Nasr, 2007; Nobanee and AlHajjar, 2009a;
Garcia-Teruel and Martinez-Solano, 2007; Sen and Oruc, 2009; Dong and Su, 2010) all
found a significantly negative relationship between WCM and profitability, therefore
concluded that the collection policy of a firm has a significant effect on profitability,
implying that the increase or decrease in accounts receivable will significantly affect
profitability of firms. Based on the above literature, the following hypothesis is formulated:
103
H2: THERE IS A SIGNIFICANT NEGATIVE RELATIONSHIP BETWEEN
ACCOUNTS RECEIVABLE PERIOD AND PROFITABILITY.
5.2.3 Accounts Payables
Accounts payable represents an important source of short-term funds for most firms
(Berger and Udell, 1998; Deloof and Jegers, 1999; Wilner, 2000; Garcia-Teruel and
Martinez-Solano, 2010a). It constitutes a significant portion of firms’ current assets used as
a source of short-term financing for companies (Garcia-Teruel and Martinez-Solano,
2010a). Current studies on the relationship between accounts payables and profitability
have found a significant relationship. A lot of reasons can be used to support these
findings. It is argued that firms with a longer payables day’s period wait longer before
settling their supplies while those firms with a shorter payables days period settle their bills
within a shorter period of time. Ng et al. (1999) argued that firms that wait longer before
settling their supplies often tend to lose discount for early payment. This sometimes affects
their profitability as the amount of cash discount can sometimes be substantial leading to
some firms facing a high opportunity cost due to the loss of discount and the high inherent
cost involved in credit period. On the basis of this, the decision to accept or request for
credit period results in an inherent cost to a company, which diminishes profitability.
Previous studies of Padachi (2006); Deloof (2003); Garcia-Teruel and Martinez-Solano
(2010b); Lazaridis and Tryfonidis (2006) and Nobanee (2009), all found a negative
association between accounts payable period and profitability.
On the other hand, it was also argued that firms could also increase their profitability by
having a longer payable period. It is found that a longer credit period results in a reduction
in transaction cost (Ferris 1981; Emery, 1987; Petersen and Rajan, 1997), thereby
increasing profitability for firms. The availability of the cash flow generated through delay

104
payment may also lead to an increase in investment of accounts receivable and inventory
day held which may lead to higher profitability as firms are also able to reduce their
transactional cost of paying bills according to Ferris (1981). Ferris (1981) suggests that
larger inventories can reduce supply and collection cost on the firm as both suppliers and
customers in the long run work towards better time management for delivery / payment to
optimise both inventory and cash levels (Paul and Boden, 2008). It also allows companies
to accumulate amounts owing and pay them at a period interval according to the credit
period agreement, such as monthly or quarterly. This helps companies to overcome
financial constraint (Schwartz, 1974; Pike and Cheng, 2001).
Mathuva (2010) found a positive and highly significant association between accounts
payable period and profitability. He suggested that firms could enhance their profitability
when they take advantage and use suppliers’ credit for working capital needs. Other studies
(e.g., Falope and Ajilore, 2009; Vishnani and Shah, 2007; Raheman et al., 2010; Sen and
Oruc, 2009; Dong and Su, 2010) found similar results. Due to the inherent benefits
associated with longer accounts payable period among firms, the following hypothesis is
formulated:
H3: THERE IS A SIGNIFICANT POSITIVE RELATIONSHIP BETWEEN ACCOUNTS
PAYABLE PERIOD AND PROFITABILITY.
5.2.3 Inventory Holding Period
Inventory as a component of Working Capital Management (WCM) is very important to
the profitability of firms (Koumanakos, 2008). Existing studies (Gill et al., 2010; Ching et
al., 2011) have also demonstrated that a firm’s profitability is affected by the amount of
inventory held. Firms with lower inventory held demonstrates how quickly they are able
to dispose of their inventory, whiles a higher inventory demonstrates how slowly the

105
inventory held is dispose of. Deloof (2003) argues that inventory management involves a
trade-off between sales and costs. High inventory helps firms to make high sales (Deloof,
2003; Gill et al., 2010). It also helps to prevent trading interruptions caused by stock-out in
the production process resulting in loss of client business (Mathuva, 2010; Deloof, 2003;
Gill et al., 2010; Falope and Ajilore, 2009). Lack of inventory can also result in poor
customer service as customers may not be adequately served, forcing both current and
prospective customers to take their business elsewhere (Koumanakos, 2008). The
availability of inventory will also improve company profitability because it will prevent the
company rushing into making emergency buying. Emergency buying normally costs
higher than normal purchase because it is usually unarranged. At the same time it may also
cause defections in the production line, which may negatively affect profitability because
the company may be unable to get the required standard of quality due to the urgency of
the purchase.
According to Gill et al. (2010), a high level of inventory averts trading interruptions which
could contribute to profit maximisation for firms. A stock out situation can have a major
downward impact on profitability because of its associated cost. For example, having no
stock will damage the reputation of the company; this may cause both current and future
customers to take their businesses elsewhere. It will also increase the cost of production
without a corresponding increase in revenue because of idle time situation. This will
eventually increase the cost of the goods of the company and decrease the profit margin,
thereby reducing profitability. However, too much of inventory could have detrimental
effect on the profitability of firms. This is because large inventories will mean that money
is locked up in working capital, which could have been used to generate additional income
to the firm. According to Falope and Ajilore (2009), firms that invest heavily in inventory
can suffer reduced profitability. Inventory consumes physical space which increases the

106
warehouse cost of rent (Koumanakos, 2008). Also too much of inventory may increase the
possibility of damage, spoilage or loss of stock of inventory. Excess inventory may also
increase the cost of insurance premium and also increase the cost of security expenses. All
these inventories related costs will create a financial burden to the firm, which may
adversely affect the level of profitability. According to Koumanakos (2008), excessive
inventory frequently compensates for sloppy and inefficient management, poor forecasting,
haphazard scheduling and inadequate attention to process and procedures. Having a high
level of inventory may also rescue a company from price fluctuations (Blinder and
Maccini, 1991). Previous researches such as (Mathuva, 2010; Padachi, 2006; Nobanee,
2009; Christopher and Kamalavalli, 2009; Nobanee and Alitajjar, 2009b) found a positive
relationship between inventory holding period and profitability.
On the contrary, it is argued that a firm’s profitability could be reduced when it holds high
amount of inventory. This is because maintaining a high level of inventory represents
amount of the companies’ money locked up on the inventory. This may result in a sub-
optimisation of financial resources as the opportunity cost of investing the funds on
profitable projects to enhance the firms’ profitability is forgone. Besides, the lock up of
capital in inventory may push the firm to seek alternative source of short-term finance
which may increase its cost of financing thereby reducing its profitability. Also, the
associated holding cost (e.g. security cost, rent, heating, obsolesce and theft) of the
inventory could reduce the firms profitability. Drury (2000), contend that through
aggressive reduction in inventory levels, firms are able to minimise overhead costs and
cost of capital employed. This according to existing studies (Nazir and Afza, 2009;
Weinraub and Visscher, 1998) enhances firms’ profitability. Banos-Cabellero et al. (2013),
suggests that firms with low level of inventory could enhance their profitability through the
107
opportunity cost of investing excess funds not tied up in inventory into profitable
investments.
The have been mixed empirical results on the relationship between firm’ profitability and
inventory control. For instance, a significantly positive relationship was found by Eroglu
and Hofer (2011b); Gill et al. 2010 and Mathuva (2010). Other studies (Garcia-Teruel and
Martinez-Solano, 2007; Deloof, 2003 and Falope and Ajilore, 2009) found a significantly
negative association. However, since high level of inventory is the associated holding cost
(e.g. security cost, rent, heating, obsolesce, theft) to firms, the following hypothesis is
formulated:
H4: THERE IS A SIGNIFICANT NEGATIVE RELATIONSHIP BETWEEN
INVENTORY HOLDING PERIOD AND PROFITABILITY.
5.3 WORKING CAPITAL MANAGEMENT, ORGANISATIONAL
CONTINGENCIES (ENVIRONMENTAL, RESOURCE AND
MANAGEMENT FACTORS)
The importance of environment to firm profitability is evident by the differences in product
and market structure of firms (Jose et al., 1996). The logic behind this is that, firms
operating at relatively higher productivity levels have competitive advantages over less
productive competitors which are reflected in their profitability. Besides, since different
industries have different risk profile and competition intensity, companies belonging to
different industries will have varied levels of profitability. For instance, it has been found
that companies belonging to the same industry exhibit similar profitability profile but
profitability differences exist between companies from different industries. According
Porter (1980), industrial characteristics such as industry concentration often results in
barriers to entry for new firms and enabled established firms to share in industry profits

108
(Bain, 1956). Besides it sets set bounds on the strategies and profitability of firms that give
rise to industry specific differences in profitability.
Many theoretical perspectives have long recognised the importance of industry
membership for company profitability (Rumelt, 1991; McGahan and Porter, 1997; Short et
al., 2007). For example, it has been found that companies belonging to the same industry
exhibit similar profitability profile, but profitability differences exist between companies of
different industries. According to Porter (1980), the differences in profitability level of
companies within an industry also depends on the bargaining power between the suppler
and customer. In an industry with few suppliers but many customers, suppliers may enjoy
enhanced profitability by dictating to customers; such as determining the price of the
products and even the terms of credit to be offered. On the other hand, an industry with
many suppliers but few customers may see profitability plummeting because customers
will be dictating the terms of engagement. The current and future profitability level of
companies within an industry may be impaired if there are not enough entry barriers
available. Also, the availability of substitute products may negatively affect profitability
because it will reduce the market share of companies within an industry. The level of
competition within an industry may also affect the profitability of companies. Intense
competition may cause profitability to drop because of the level of infighting. However,
companies in a low competitive industry may boost profitability because they can take
initiatives without retaliation from other companies. It is suggested that the industry
belonging explains between 17 per cent and 20 per cent of profitability variance
(Schmalansee, 1985; Wernerfelt and Montgomery, 1988; Rumelt, 1991).
Against this backdrop, the environment has an influence on the relationship between
WCM and profitability of companies. Several earlier studies have focused their analyses
on differences in working capital management across industries (Hawawini et al., 1986;

109
Filbeck and Krueger, 2005). Smith (1987) and Ng et al. (1999) suggested a wide variation
in credit terms across industries, but little variation within industries. Later, Niskanen and
Niskanen (2006) also demonstrated differences in the levels of accounts receivable and
accounts payable between industries. Nonetheless, economic conditions and industry
sector/market in which firms operate also influence working capital management decisions
among firms. For instance, during periods of economic down turn, businesses bear the
brunt of the credit squeeze, as a result, companies, tend to offer even more generous credit
terms to win business. Fast growing firms or those operating in competitive markets are
more likely to offer additional credit to extend their market share; in tend, they might be
expected to demand more credit from their suppliers to create equilibrium in their cash
conversion cycle (Paul and Boden, 2011). By investing in working capital, firms are able
to make higher profitability through enhanced operational efficiencies.
Companies are able to reduce the cost of transactions between them, which may lead to
increase in profitability (Petersen and Rajan, 1997). It also helps to differentiate their
product from that of competitors (Deloof and Jegers, 1996) and also signals confidence in
product quality and of long-term market presence therefore acting as an implicit warranty
to customers (Paul and Boden, 2011; Petersen and Rajan, 1997). Similarly, a stock out
situation will have significant effect on a company’s profitability because a company
without stock may lose its goodwill (Bhattacharya, 2008). It also drives both current and
potential customers away to competitors. On the contrary, an increase in inventory holding
period could also lead to reduction in profitability through inventory holding costs such as
warehouse storage costs, insurance costs, cost of spoilage, theft of inventory etc. A
reduction in accounts receivable period may also increase profitability because it will
increase the cash flow available to a company, which can be used to run the day-to-day
operations of a company. Based on this empirical insight, firms will need to have an
110
optimal working capital level that balances cost and benefit in order to maximize their
value.
Notwithstanding this, firm’s unique resources also play a key role in its profitability.
According to the resource based value of the firm, firm’s unique resources accumulated
over time are difficult and costly to emulate, as a result they contribute to superior
profitability for firms (Demsetz, 1973). Grant (1991) identified firm age, firm size and
financial resources such as cash flow as some of the key performance related resources of
the firm. The age of a company denotes its number of years in existence. It is found by
(Bertrand and Mullainathan, 2003; Loderer and Waelchli, 2010) to be one of the main
determinant of company profitability. Its association with profitability can be attributed to
a number of reasons. First, success in new product development will lead to younger
companies enjoying increased profitability. Normally, new entrants enter the market with
new inventions that catch the attention of the market and thereby increase profitability. On
the contrary, older companies may have had all their inventions exhausted and therefore
unable to increase profitability. Second, the profitability of older companies may decline
due to competitive pressures from new entrants. Increase in the number of new entrants
will shrink the market share of existing companies as they compete for their own market
share, which will cause a reduction in existing companies’ profitability. This may result in
higher unit cost of products because of the reduction in the number of units produced.
Another cause for the decline in older companies’ profitability is obsolete assets. Older
companies may be forced to continue operating with obsolete equipment due to high
investment made in those machines. Due to the rapid technological changes in the business
environment equipment easily become outmoded that reduces their productive power,
thereby causing a reduction in the overall company profitability. Barron et al. (1994) argue
that older companies are prone to suffer from a ‘liability of obsolescence’ due to their

111
inability to fit in well to the changing environment. Research has also shown that
investment in R&D declines as companies grow older (Loderer and Waelchli, 2010). R&D
is the driving force in companies as it helps companies to explore new avenues, which
helps increases profitability. Therefore, a reduction in R&D will result in a reduction in
older companies’ profitability. The reason for the reduction in older companies’ R&D as
argued by Bertrand and Mullainathan (2003) may be that they are now pursuing quieter life
because the desire to succeed may be minimal. Both the lifecycle and competitive market
view also hold that the rate of profitability declines over the life of a firm because of
imitators. A research by Majumdar (1997) found that even though older firms are more
productive, they are less profitable. Boeker (1997) and Szulanski (1996) contend that older
companies suffer from non-learning processes, blindness and conservatism, which cause
poor profitability.
On the other hand, other researchers have also argued for a reduction in the profitability of
younger companies. Firstly, younger companies are mostly inexperienced in their
newfound market, which limits their ability to generate higher profitability. A company
that has just entered a market may have to undergo the learning curve in order to grasp the
practices and procedures within the market. The period of learning curve incurs mistakes,
which results in the inefficient use of materials and other resources, thereby reducing the
overall profitability of companies. For example, Sorensen and Stuart (2000) argue that
young companies may lack detailed information about their business, other companies and
the environments until they become active in the market. On the contrary, older companies
are more experienced, have enjoyed the benefits of learning and not prone to the effects of
newness (Stinchcombe 1965), which results in superior profitability. Older companies may
also enjoy superior profitability because of their established contacts with customers, and
easier access to resources (Coad et al., 2010). A younger company may also incur higher
112
cost structure in the form of sunk cost, which may affect its profitability. A younger
company may have to invest heavily in fixed assets and personnel in order to be able to
start operating. A research by Majumdar (1997) and Mathuva (2010) also found a positive
relationship between company age and profitability. A younger company may have to
invest heavily in fixed assets and personnel in order to be able to start operating.
Athanasoglou et al. (2005) suggested that older firms become more profitable than new
and growing firms because of their ability to establish reputation in the market and also
their ability to build long term relationship with their customers. In working capital
management, this relationship is very beneficial to both parties particularly in optimal
pricing, lending and renegotiations strategies (Peterson and Rajan, 1994, 1995, and 1997;
Ng et al., 1999). The long term relationship build overtime by older firms with their
customers help them to gather valuable quickly information about customers’ financial
health through their payment patterns and their ability to take advantage of any discounts
offered for early payment (Paul and Boden, 2008). This helps prevent the risk of default
which eventually erodes their profit margins. Older companies may also enjoy superior
profitability because older firms can get external financing more easily and under better
conditions (Berger and Udell, 1998), and also able to better work towards a better time
management for delivery / payment to optimise both inventory and cash levels (Paul and
Boden, 2008).
On the contrary, Szulanski (1996) argues that older companies suffer from non-learning
processes, blindness and conservatism, which cause poor profitability. Barron et al. (1994)
also argue that mature firms often have high chances of suffering from obsolescence and
senescence due their inability to fit well in the changing business environment due their
inflexible rule, routines and organisational structure. According to Loderer and Waelchli
(2010), as companies expand their investment in R&D declines. This often translates in

113
low in profitability for older firms since they are not able to explore new avenues in the
market through R&D (Bertrand and Mullainathan, 2003). Also, companies with available
cash flow may take advantage of the cash to make bulk purchases which may reduce the
procurement cost of production. The bulk purchase cost savings will also result in a
decrease in the cost of sales of the product, which will reduce the overall price of the
product leading to more profitability (Ng et al., 1999; Wilner, 2000).
The availability of cash flow may also lead to an increase in investment of accounts
receivable. A company with available cash flow may be in a better position to offer
generous credit offers to customers. An increase in the investment of account receivable
may lead to higher profitability. This is because, companies offer trade credit to allow
customers the necessary time to be able to verify the extent of the quality of the product
(Smith, 1987). Many other theoretical and empirical studies support the argument that
efficient management of the firm cash flow significantly affects profitability. According to
the Agency theory, good governance enhances firms’ value (Jensen and Meckling, 1976).
Ntim (2013) suggests that firms with better corporate governance standards tend to be
associated with higher market valuation since such firms are able to improve managerial
monitoring and decision making as well as a reduction in expropriation and wastage from
managers (Renders et al., 2010). It is argued by Ntim et al. (2012a) that firms with
concentrated ownership tend to face a less active market for managerial and corporate
control which significantly affects their profitability. According to Maherbe and Segal
(2003), firms are able to reduce political cost as well as have access to greater resources
which could be translated into improved operating performance and market valuation when
the comply with the stakeholder corporate governance provisions.
Zona et al. (2012) justified the relevance of the contingency hypothesis in corporate
governance. One of the key corporate governance management variables adopted by most

114
studies (Wincent et al., 2010; Nicholson and Kiel, 2003) in the contingency framework is
corporate board of directors. This is attributed to the fact that effective functioning of a
board changes in line with the organisational context as (Forbes and Milliken, 1999).
Nicholson and Kiel (2003) in an attempt of investigate the impact of board capital (social,
structural and human) on board roles, board effectiveness and firm performance developed
a contingency model for corporate boards. Zona et al. (2012) asserts that the effects of
board characteristics on firm innovation need to be evaluated with reference to contingency
variables. Therefore according to Guest (2009), it is important to investigate the central
role played by a company’s board of directors when investigating the impact of corporate
governance on firms’ value since they have the strategic functions of monitoring and
advising (Raheja, 2005; Adams and Ferriera, 2007) the board on key strategic issues.
According to Ntim (2012), the board has the responsibility to monitor, ensure compliance,
discipline and also that the interests of shareholders is pursue by managers. It also
according to him has the responsibility to provide expect advice to the CEO and access to
critical information and resources (Jensen, 1993; Jensen and Meckling, 1976) to ensure
performance. This is often performed by both outsiders and insiders who tend to bring
valuable expertise and important connections to the board especially outside directors
(Fama and Jensen, 1983). Raheja (2005) suggests that compared to insiders, outsiders tend
to be more independent, more efficient in monitoring firms activities but less informed
about the firm-specific information for the board.
On the contrary, according to Raheja (2005), insiders are an important source of firm-
specific information for the board, but may have distorted objectives due to private benefits
and lack of independence from the CEO. However is argued by (Lipton and Lorsch, 1992;
Jensen, 1993) that relationship between board size and firms value to be a u-shaped. Thus
initially, larger boards are able to facilitate the key function of the board but with time,

115
problems of communication and coordination declines board effectiveness and
performance.
A number of empirical evidence (Gompers et al., 2003; Cremers and Nair, 2005; Ntim,
2013; Mangena et al., 2012; Bebchuk et al., 2009) on the relationship between corporate
governance and firms’ value has been carried out. Evidence from these studies supports the
argument that corporate governance affects firms’ value. For instance, Ntim (2013) in his
study on relationship between corporate governance and firms’ value on a sample of South
African firms found a significantly positive association between a composite CG index and
firm value suggesting that good corporate governance significantly improves firms’ value.
Similar results have been found by Bebchuk et al. (2009); Cremers and Nair (2005);
Gompers et al. (2003) on a sample of some selected American firms. Renders et al. (2010)
after controlling for both endogeneity and sample selection bias also found a positive
association between CG and firm value in a sample of European firms. Dalton et al. (2005)
found a positive relationship between board size and firms’ value. On the basis of such
evidence they argued that larger boards are able to facilitate this key function of having
greater collective information to ensure higher profitability. Ntim et al. (2012) found
similar evidence and went further to suggests that compared to smaller boards, larger
boards have the advantage of improved monitoring and greater opportunities to secure
critical business resources to enhance firms’ value. This is contrary to the evidence of
Guest (2009) who argued that there is greater free-riding resulting in low profitability
among larger firms. On the basis of this, the following hypothesis is formulated:
H5: FIRMS’ ENVIRONMENTAL, RESOURCES AND MANAGEMENT FACTORS
SIGNIFICANTLY MODERATE THE RELATIONSHIP BETWEEN ACCOUNTS
RECEIVABLES AND PROFITABILITY.

116
H6: FIRMS’ ENVIRONMENTAL, RESOURCES AND MANAGEMENT FACTORS
SIGNIFICANTLY MODERATE THE RELATIONSHIP BETWEEN ACCOUNTS
PAYABLES AND PROFITABILITY.
H7: FIRMS’ ENVIRONMENTAL, RESOURCES AND MANAGEMENT FACTORS
SIGNIFICANTLY MODERATE THE RELATIONSHIP BETWEEN INVENTORY
HOLDING PERIOD AND PROFITABILITY.
H8: FIRMS’ ENVIRONMENTAL, RESOURCES AND MANAGEMENT FACTORS
SIGNIFICANTLY MODERATE THE RELATIONSHIP BETWEEN CASH
CONVERSION CYCLE AND PROFITABILITY.
5.4 CONTROL VARIABLES AND PROFITABILITY
5.4.1 Corporate Governance and Profitability
5.4.1.1 Chief Executive Officer (CEO) Tenure
CEO tenure is an important component to company profitability and executive leadership.
It is argued that a CEO that has spent a long time at his or her post will resort to empire
building. A CEO with such a lengthy time in a company will become more comfortable
and will use his or her power and knowledge gained to seek his or her own interest at the
expense of profitability. It may also lead to CEO entrenchment. This entrenchment results
from the fact that a long tenured CEO may dominate the board, which will lead him or her
to pursue costly projects that can jeopardise a company’s profitability. Empirical evidence
of Farooque et al. (2007) suggests that the longer a CEO serves, the more the firm-
employee dynamic improves. But an extended term strengthens customer ties only for a
time, after which the relationship weakens and the company’s profitability diminishes, no
117
matter how united and committed the workforce is. Luo et al. (2013) associated this to the
learning life style of CEOs. At early stages, new CEOs seek information from diverse
sources (internal and external) in order to accumulated knowledge so as to enhance their
profitability. However, with time they tend to relay more on internal sources for
information as growing less attuned to market conditions. This in a long run diminishes the
profitability of the company.
The number of years that a CEO has been in the realm of affairs will significantly affect
company profitability. On the negative side, it is argued that a CEO who has spent a long
time at his or her post will resort to empire building. A CEO with such a lengthy time in a
company will become more comfortable and will use his or her power and knowledge
gained to seek his or her own interest at the expense of profitability. It may also lead to
CEO entrenchment. This entrenchment results from the fact that a long tenured CEO may
dominate the board, which will lead him or her to pursue costly projects that can jeopardise
a company’s profitability. He or she may also use such power and domination to ask for
higher compensation package at the expense of profitability (Hill and Phan, 1991; Allgood
and Farrell, 2003). The domination of CEO over the board due to longer tenure is proved
by a model developed by Hermalin and Weisback (1998). This model predicted that board
independence actually declines over the course of a CEO’s tenure. A long tenured CEO
may have the opportunity to influence the selection of directors (Zajac and Westphal,
1996). This opportunity will offer him or her advantage of choosing directors who are
sympathetic, which will afford him or her ability to exert own influence and discretion that
may minimise profitability. Another negative effect of longer CEO tenure stems from the
fact that it results in the board becoming more relaxed and less vigilant in monitoring the
CEO (Lorsch and MacIver, 1989; Coles et al., 2001), which may decrease profitability.
Once the board has gained the trust of the CEO they reduce their monitoring effectiveness,
118
but this may give a course for CEOs to start pursuing their own interest that impair
profitability.
Farooque et al. (2007) did a study on the link between CEO tenure and profitability and
found a negative association. On the other hand there are arguments that suggest that a
longer tenured CEO leads to higher company profitability. It is argued that since new
CEOs may require some time to adopt into their new role through learning, their
profitability may therefore be improved with time that will enhance profitability. Shen
(2003) maintain that CEOs spent a lot of time to achieve the success of their work and that
the ability of a CEO will increase with time. It means that their increased ability will have
a positive influence on profitability. As suggest by Gabarro (1987), new CEOs normally
require one or two years to acquire the needed task knowledge to be able to take major
decisions. Also, as a CEO stays in an office for long, it helps him or her to acquire
company specific knowledge that helps to maximise profitability. Shen (2003) argues that
CEOs continue to accumulate task knowledge and also sharpen their leadership skills with
time. Longer tenured CEOs are motivated to improve profitability because they have the
benefit of seeing the results of their decision taken (Kyereboah-Coleman, 2007b).
Another profitability enhancement of longer CEO tenure is that it leads to lower
monitoring cost, which may show in improved profitability. New CEOs because of their
unproven abilities are watched closely. This results in substantial monitoring cost at the
expense of profitability. However, on the contrary it is shown that because new CEOs are
keenly watched, it actually propels them to achieve higher performance. This higher
performance stems from the fear of been dismissed, because research has shown that CEO
dismissal is acute during the first five years in office (Shen and Cannella, 2002). A positive
association between CEO tenure and profitability was found by Agrawal and Knoeber
(1996). Based on the above literature, the following hypotheses are formulated:
119
H9 THERE IS A SIGNIFICANT POSITIVE RELATIONSHIP BETWEEN CHIEF EXECUTIVE
OFFICER (CEO) TENURE AND PROFITABILITY.
5.4.1.2 Board size
Current studies (Jensen, 1993; Yermack, 1996; Mak and Yuanto, 2003; Anderson et al.,
2004) have found a relationship between the size of a company’s board and its
profitability. These studies can be categorised into two schools of thought. In the first it has
been found that smaller board sizes do improve profitability of many companies.
According to previous studies of (e.g., Lipton and Lorsch, 1992; Yermack, 1996;
Eisenberg et al., 1998), smaller company board size enhances easy coordination and
interaction between the board members and the CEO. This helps to improve board
efficiency and profitability. Besides, it helps improve cohesiveness within the directors on
the board which allows quick decision making among members as compared to those
companies with larger board size. Less time spent at board meetings could reduce the time
cost per each director leading to reducing the overall cost of the company and improved
profitability. More so, smaller boards have the advantage of an accelerated cross
communication between board members, the CEO and other members of the company.
This however, could improve the profitability of the company. Furthermore, according to
research by Kyereboah-Coleman (2007a) and Shakir (2008), smaller boards often prevent
the possibility of free riding behaviour by some directors. According to Bathula (2008),
most companies with smaller boards are able to improve their performance because they
are able to avoid factions and conflict often prevalent on larger boards. Such conflicts
usually results into unnecessary waste of resources and time leading a fall in profit for
affected firms. Previous studies of Yermack (1996); Liang and Li (1999); Vafeas (1999)
and Dahya et al. (2008) have all found a negatively significant relationship between
company board size and profitability.

120
On the contrary, evidence by Pfeffer (1972), Klein (1998), Dehaene et al. (2001) and Coles
et al. (2008) suggest a positive relationship between company’s profitability and its board
size. Against this back drop it is argued that the larger board size, better the profitability of
the company. The theoretical argument to support this argument suggests that companies
with large board size are able to enjoy a lot of valuable advice from a large number of
board members (Dalton and Dalton, 2005). According to Van den Berghe and Levrau
(2004), expanding the number of directors provides an increased pool of expertise. Many
directors mean that there will be diversity of specialisation, which can enhance the
decision-making processes within the company. The diversity of specialisation could help
companies to secure critical resources and also reduce environmental uncertainties
(Goodstein et al., 1994). Furthermore, it makes it easier to create committees within the
company for the effective execution of duties and responsibilities (Bathula, 2008). These
communities are able to sub-divide the duties and responsibilities on the lines of
specialisation and expertise so as to ensure effectiveness and efficiency, which may
maximise profitability. More so, there is also greater monitoring ability on management
(Klein, 1998; Adam and Mehran, 2003; Coles et al., 2008) among companies with larger
board size. Since a bigger board size creates the room for a large number of directors to
oversee different activities of management simultaneously.
Also, with a large board size, the possibility of CEO dominance and influence is greatly
minimal. It makes it difficult for the CEO to influence the decision of the board due to its
size. This helps to minimise CEO domination and pursuant of personal interest thereby
leading to profitability. According to Shakir (2008), larger board size improves
performance due to its ability to bring on board a diversity of individuals in terms of
gender and nationality. Different nationalities will bring on board diversities of cultures
and morals and different standpoints of looking at things, which may help improve
121
performance for the company. Previous researchers (Uadiale, 2010; Mangena et al., 2012;
Kajola et al., 2008) have found a positive relationship between profitability and company
board size. On the basis of this evidence, the following hypothesis is formulated:
H10 THERE IS A SIGNIFICANTLY POSITIVE RELATIONSHIP BETWEEN
COMPANY BOARD SIZE AND PROFITABILITY.
5.4.2 Company Characteristics and Profitability
5.4.2.1 Company Size
The size of a company is maintained by Serrasqueiro and Nunes (2008) to be one of the
most fundamental determinants of a company’s profitability. Haniffa and Hudaib (2006)
suggest that firm size may be related to firm profitability. Current studies (Baumol, 1959;
Punnose, 2008) have also postulated a significant relationship between the size of a
company and its profitability.
According to previous by Singh and Whittington (1975), Serrasqueiro and Nunes (2008),
larger firms are profitable that smaller firms because larger firms usually enjoy economics
of scale and a higher negotiation power over their clients and suppliers (Serrasqueiro and
Nunes, 2008; Singh and Whittington, 1975). Larger firms tend to enjoy economics of scale
in the form of operating cost and the cost of innovation (Hardwick, 1997). Thus as the
number of units produce increases, the price per unit drops. These benefits tend to reduce
the unit cost of production leading to increase profitability. Shepherd (1986) also suggested
that company size is determines it bargaining power. Thus companies with superior
bargaining power, tend to me more profitable as such companies are able to influence their
trading relationship in terms of the amount of credit granted, the terms of payment, quality
of the products and even the means of delivery. It is however suggested that larger firms
122
tend to have superior bargaining power over their suppliers and often tend to dictate the
amount of credit granted, terms of payment and the quality of the suppliers’ product. This
however, helps these firms to be more profitable. In addition, small firms may have less
power than large firms; hence they may find it difficult to compete with the large firms
particularly in highly competitive markets (Majumdar, 1997) since larger firms have more
advanced and sophisticated marketing skills, research capabilities and product
development experience, which together form the foundation higher profitability (Dewar
and Dutton, 1986). Cabral and Mata (2003) also suggested that larger firms are more
profitable that smaller firms due to their easy access to finance from financial institutions.
This is because larger firms often tend to be less likely to default on the credit agreement
and are also less likely to fail. Besides larger firms are able to provide the required assets to
use as collateral in order to secure the necessary credit to make very pertinent investments,
which maximises profitability.
On the other hand, according to Yang and Chen (2009), larger firms have preferential
treatment over smaller firms in terms of cost of credit from financial institutions, a pool of
qualified human capital and are able to achieve greater strategic diversification over their
smaller counterparts which makes larger firms less prone to failure and also assist them in
exploring other profitable ventures which improves profitability. Besides, they have the
monetary resources to recruit highly skilled personnel to propel their strategic objectives.
Current empirical research (e.g., Majumdar, 1997; Inmyxai and Takahashi, 2010; Kakani
and Kaul, 2002) on the relationship between firms profitability and its size have all found a
positive relationship which suggests that larger firms tend to be more profitable than
smaller firms.
According to Symeou (2010), small firms exhibit certain characteristics which can
counterbalance the handicaps attributed to their smallness. They suffer less from the
123
agency problem (Pi and Timme, 1993; Goddard et al., 2005) and are characterised by more
flexible non-hierarchical structures, which may be the appropriate organisational forms in
changing business environments (Yang and Chen, 2009). Since smaller firms are mostly
managed and owned by close relatives, the possibility of management pursuing their own
interest rather than the interest of their owners is very minimal. Such a relationship helps to
minimise agency cost of monitoring by management and misappropriation of funds leading
to improved profitability. Also, smaller firms tend to be more flexible than larger firms.
They have the ability to change and adapt to the business environment which helps them to
be profitable. Empirical work of Hansen and Wernerfelt (1989) on the relationship
between company size and profitability found a significantly negative relationship. On the
basis of this theoretical and empirical evidence, the following hypothesis is postulated:
H11 THERE IS A SIGNIFICANT NEGATIVE RELATIONSHIP BETWEEN COMPANY
SIZE AND PROFITABILITY.
5.4.2.2 Asset Tangibility
Another important determinant of profitability is tangibility of the firm’s assets (Campello,
2005). According to Campello (2005), when assets are more tangible, they are easy to
verify and repossess in an event of liquidation. Research by Haris and Robinson (2001)
found a negative relationship between firms’ profitability and its tangible assets. On the
basis of this evidence, they argued that firms need higher proportion of intangible assets
such as human capital in order to use the resources with maximum effectiveness since
intangible assets such as human capital, R&D, organisational capital and goodwill can
helps the firm to create new products and processes (Teece and Pisano, 1998). Empirical
evidence of Onaolapo and Kajola (2010) also found a negative association between asset
tangibility and company profitability.
124
On the contrary, Braun (2003) has also demonstrated that companies with tangible assets
obtain more finance from suppliers and banks at a low rate of interest. Asset tangibility
lends credibility to investors’ threat to take the firm to bankruptcy court and/or to dismiss
its management team, affecting incentives to perform (Campello, 2005). According to Hart
(1995) non-human assets help in holding a relationship together. Braun (2003) maintains
that tangible assets are those that would more easily shift to the investor’s control when the
relationship breaks down. For most external financers, the best way to guaranteed safe
lending is through the provision of security which in most case for firms, tangible assets
which could be reposes in an event non-payment of the credit. As a result some firms use
tangible assets as collateral to secure external funds. Because of its ability to hold
financing contracts together, external financiers are more willing to accept a reduced cost
of finance. This reduction in the cost of finance because of asset tangibility means that
such companies will make savings on their interest payments, which can improve
profitability. For smaller firms this is seldom the case. Most external financers hardly grant
external finance to SMEs because of their lack of tangible assets. On the basis of this
evidence, the following hypothesis is postulated:
H12 THERE IS A SIGNIFICANT POSITIVE RELATIONSHIP BETWEEN ASSET
TANGIBILITY AND PROFITABILITY.
5.4.2. 3 Financial Leverage
Financial leverage significantly affects firms profitability (see Ruland and Zhou, 2005;
Onaolapo and Kajola, 2010; Akinlo and Asaolu, 2012; Ojo, 2012). According to previous
studies, financial leverage affects cost of capital, ultimately influencing firms’ profitability
and stock prices (Higgins, 1977; Miller, 1977; Myers, 1984; Sheel, 1994). In a survey by
Hittle et al. (1992) on 500 largest Over-The-Counter (OTC) firms, it was found that 11%

125
of sample firms had adopted targeted capital structure. However, when both taxes for
corporate and equity holders were considered at the same time, financial leverage appeared
not to bring significant benefits to the investors at the end (Myers, 2001). It is argued that,
the presence of debt in the capital structure raises the pressure on managers to perform
(Weill, 2003; Akintoye, 2008; Boodhoo, 2009). The presence of debt means that managers
must work harder in order to be able to service the debt. The onus to perform will therefore
be on the managers as non- performance may cause debt holders to force the company to
liquidate, which will result in managers losing their jobs. It is argued that debt financing
provides better incentives for managers to perform because they aim to avoid the personal
costs of bankruptcy. Another influencing factor of debt financing on managers is the fact
that it eliminates the moral hazard behaviour by reducing the free cash flow at the disposal
of managers (Jensen, 1986). According to Sunder and Myers (1999), most profitable firms
in many industries often have a tax shield and the lowest debt ratio, which benefits debt
financing and improvement of the company profitability (Modigliani and Miller, 1963).
Dann (1981) and James (1987) also noted that large positive abnormal returns for a firm’s
stockholders are associated with leverage increasing events such as stock repurchases or
debt-for-equity exchanges. Bothwell et al. (1984) and Tirta (2006) postulated a positive
relationship between financial leverage and profitability.
Contrary to this evidence, it is also suggested that the presence of debt on a firm negatively
affects it profitability. According to Weill (2003), the presence of the debt widens the
agency cost problem of the firm as it tends to introduce a new dynamics to the principal-
agency relationship of the firm. Titman and Wessels (1988) observed that highly profitable
firms have lower levels of leverage than less profitable firms because they first use their
earnings before seeking outside capital. Similar findings were reported by Gu (1993),
Sheel (1994), Sunder and Myers (1999) and Wald (1999). According to Wald (1999),

126
profitability, which is the most significant determinant of firms’ financial leverage,
negatively affects the debt to asset ratios in the heteroskedasticity tobit regression model.
Sheel (1994) also supported the negative relationship between debt-to-asset ratio and non-
debt tax shield or/and between firm’s leverage behaviour and its past profitability.
Research by Kortweg (2004) and Dimitrov and Jain (2005) found a negative association
between financial leverage and profitability. On the basis of this evidence that the presence
of a debt negatively affects profitability, the following hypothesis is formulated:
H13 THERE IS A SIGNIFICANT NEGATIVE RELATIONSHIP BETWEEN
FINANCIAL LEVERAGE AND PROFITABILITY.
5.4.2. 4 Liquidity Ratio
The availability of liquidity may be an indication that a company is forgoing the benefits of
investing in profitable opportunities. Boermans and Wiilbrands (2011) argue that a firm’s
profitability is significantly influenced by its level of liquidity since the availability of
liquidity allows the firm to meet its short term obligations on time and also take up
profitable ventures. High liquidity may also hinder a company’s profitability (Hvide and
Moen, 2007; Ng and Baek, 2007). Tauringana and Afrifa (2013) found a negative
association between liquidity and profitability. The availability of liquidity may be an
indication that a company is forgoing the benefits of investing in profitable opportunities.
High liquidity may also result in managers misappropriating the funds of the company.
According to Jensen (1986), mangers have incentives to increase the free cash flow of their
companies because it is probably the only one asset they can freely control. Damodaran
(2005) argues that managers have their own agendas to pursue and that cash provides them
with the ammunitions to fund their pursuit. In sum, it can be argued that even though a

127
high level of liquidity may decrease profitability, its absence could be more dangerous to
firms
On the other hand, a company that has more liquidity may have the capability of extending
more credit to its customers. The offering of credit may increase sales because it can entice
customers to buy more, which will maximise profitability (Garcia-Teruel and Martinez-
Solano, 2010c; Gill et al., 2010). The level of liquidity within a company can help avoid
the use of costly external finance. There is enormous evidence to suggest that internally
generated finance is cheaper than external finance because of the problems of information
asymmetry, which manifest itself in the form of adverse selection and moral hazard (Myers
and Majluf, 1984; Brito and Mello, 1995). On the basis of this argument the following
hypothesis is formulated:
H14 THERE IS A SIGNIFICANT POSITIVE RELATIONSHIP BETWEEN LIQUIDITY
RATIO AND PROFITABILITY.
5.4.2. 5 Cash flow
It is argued that the availability of cash flow leads to higher investment in working capital
(Banos-Caballeroet al., 2013). The availability of cash flow leads to higher investment in
working capital (Banos-Caballero et al., 2013) and profitability (Autukaite and Molay,
2011). An increase in working capital implies that more cash is invested in working capital
and thus reduces cash flows. Firms with significant working capital requirements will find
that their working capital grows as they do, and this working capital growth will reduce
their cash flows.
With available cash flow holdings, firms are able lengthy their cash conversion cycle,
which can improve company profitability by increasing sales (Deloof, 2003). It is also
128
argued that cash flow availability allows a company to extent more credit to customers,
which may entice them to purchase more, even in times of low demand. The availability of
cash flow may also lead to an increase in investment of accounts receivable and inventory
day held which may lead to higher profitability as firms are also able to reduce their
transactional cost of paying bills according to Ferris (1981). Ferris (1981), suggests that
larger inventories can reduce supply and collection cost on the firm as both suppliers and
customers in the long run work towards better time management for delivery / payment to
optimise both inventory and cash levels (Paul and Boden, 2008). For instance, a buyer
might prefer to pay his debt monthly instead of immediate payment cycle from the delivery
schedule (Peterson and Rajan, 1997). Firms are able to reduce the cost of warehousing
particularly when the customer has the ability to carry the inventory. Similarly, with
available cash holdings, firms could take advantage of available discounts of buying in
bulk purchase, which may reduce the procurement cost of production and the cost of sales
of the product, which will reduce the overall price of the product leading to more
profitability. According to Banos-Caballero et al. (2013), firms with enough cash flow
take advantage of suppliers’ cash discount by paying immediately for supplies. On the
basis of this argument the following hypothesis is formulated:
H15 THERE IS A SIGNIFICANT POSITIVE RELATIONSHIP BETWEEN CASH FLOW
AND PROFITABILITY.
5.4.2. 6 Growth opportunities
A number of studies (e.g., Deloof, 2003; Shin and Soenen, 1998) demonstrate the
importance of growth opportunity to firms’ profitability. It is generally accepted that stock
returns reflect the company's growth opportunities. As is often argued, growth looks like a
necessary ingredient for corporate profitability and the creation of shareholder value (Shin

129
and Soenen, 1998). Margaritis and Psillaki (2010) suggest that firms with low risk use
sales growth as an indicator of their future growth opportunity to substitute for high risk
(high return) investments which improves their profitability.
According to them, compared to high growth firms, low growth firms have fewer
opportunities to substitute low risk for high risk (high return) investments; as a result they
could improve their profitability by carrying more debt in their capital structure since they
incur low agency cost of debt. Deloof (2003) found positive association between growth
opportunity and profitability. On the basis of this argument the following hypothesis is
formulated:
H16 THERE IS A SIGNIFICANT POSITIVE RELATIONSHIP BETWEEN GROWTH
OPPORTUNITIES AND PROFITABILITY.
5.5 CONCLUSION
The chapter translated the various theoretical and empirical studies on the relationship
between working capital management and profitability into testable hypothesis. Sixteen
hypotheses were discussed. The first four hypotheses examine the relation between
working capital, its components (AR, AP and INV) and profitability as determined by most
previous studies. The rational of presenting these hypotheses is to determine if the
relationship between working capital management, its components (AR, AP and INV) and
profitability may vary according to each component. The chapter presented eight testable
hypotheses to determine whether the relations between working capital management, its
components (AR, AP and INV) and profitability was moderated by the interaction of
contingent factors (environment, resource and management) as postulated in the
contingency framework. The last four hypotheses were developed to determine the impact
of firm and corporate governance characteristics on firms’ profitability. These variables

130
have been found relevant by previous studies to influence the relationship between
working capital management on profitability.

131
CHAPTER SIX
6 RESEARCH METHODOLOGY
6.1 INTRODUCTION
This chapter describes the research method adopted to address the hypotheses formulated
in Chapter 5. The section provides a detailed description of the data methodology adopted,
rational for the choice of data and methodology. The remainder of the chapter is organised
as follows. Section 6.2 presents a description of the data and procedure for sample
selection. In this section, the various variables employed in establishing the hypotheses
used on the effect of WCM and its components on profitability of firms will be discussed.
Section 6.3 presents a discussion on the tool for data analysis, whilst section 6.4 concludes
the chapter.
6.2 DATA DESCRIPTION AND SAMPLE SELECTION
The population for the study is taken from listed companies on the main market of London
Stock Exchange (LSE) for the period 2001 to 2011. The choice of the period was
influenced by UK Late Payment of Commercial Debts (Interest) Act 1998, which was
subsequently amended to bring it into line with the EU Late 2002 Payment directive to
entitle firms a statutory right to claim interest on late payment of trade debts. In this
context, the data were extended to cover the period of the old and new late payment
legislation.
To arrive at the sample, the study excluded financial companies. Out of a total list of 1,339
companies listed on the main market of the London stock exchange (LSE) as from the
28th September, 2012, as detailed in step 1 of table 5, financial companies consisted of 583
firms, representing about 44 per cent of the overall listed companies. Among the 583 listed
132
firms were 37 banks, 1 convertible bonds, 17 company bonds, 47 debenture loans, 376
equity investment instruments, 53 general financials, 14 life insurance companies, 13 non-
life insurance companies, and 25 non-equity investment instruments. These financial
companies were excluded because financial companies have different accounting
regulations to non-financial companies (Deloof, 2003). Also financial services firms’
financial characteristics and investment in working capital are largely different from non-
financial companies (Falope and Ajilore, 2009). Furthermore, the exclusion of the financial
services companies allow for easy comparability with prior studies (e.g., Deloof, 2003;
Falope and Ajilore, 2009; Lazaridis and Tryfonidis, 2006). In the second step (step 2) of
table 5, the study segmented the rest of the 755 non-financial firms based on Gary et al.
(1995) industrial groupings since most of the firms were closely related and share similar
characteristics. Industry 1 = metals, building materials, and construction, industry 2 =
engineering, industry 3 = consumer goods and services and industry 4 = oil, chemicals, and
mining. These distributions are by economic sector. In all, industry 1 had 56 firms, 106 for
industry 2, 449 for industry 3 and 144 for industry 4.
Finally, to be included in the final sample, companies must have their financial statement
for the entire period under consideration, which is from 1st of January 2001 to 31st of
December 2011 inclusive. Companies with negative sales, negative assets, or missing
substantial yearly figures were also removed from the sample. The two criteria were
necessary to allow for easy comparability with similar studies and to permit the use of
balanced panel data, which has the advantage of more degrees of freedom and less
multicollinearity among variables (Gujarati, 2003). As a result of the strict application of
these two criteria the final sample was narrowed down to 225 companies which represent
30 per cent of the total number of non-financial companies listed on LSE as shown in step
3 of Table 5.
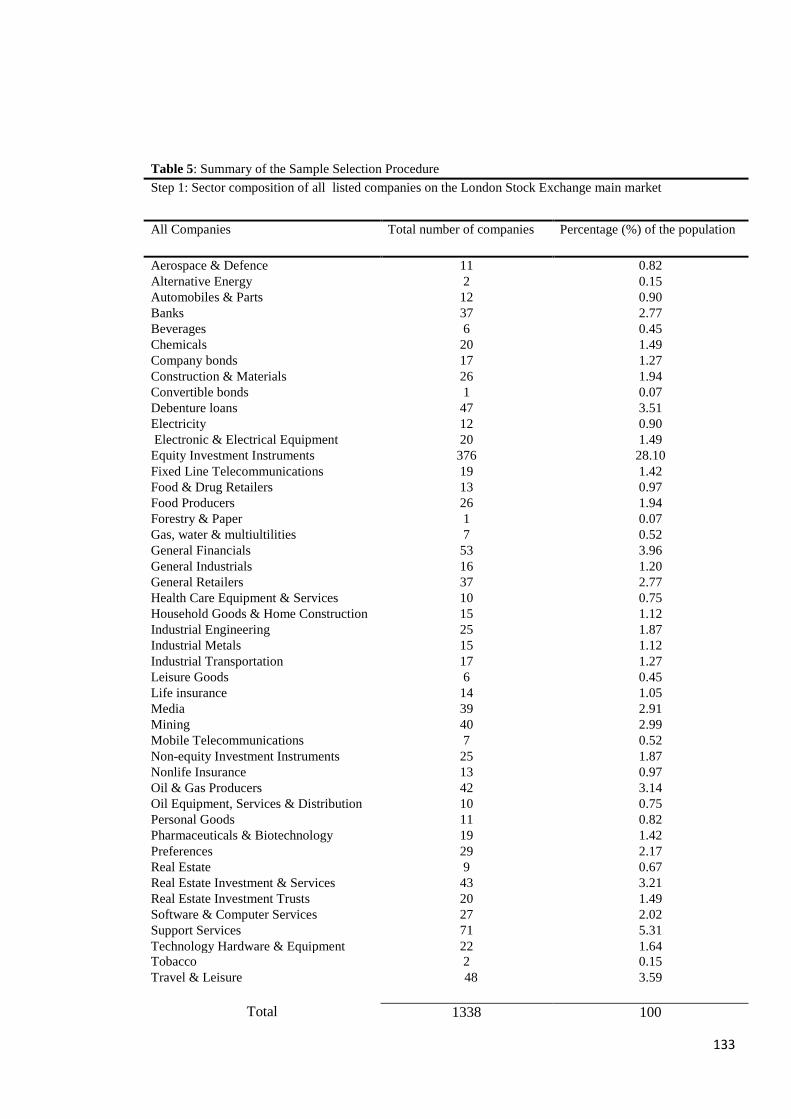
133
Table 5: Summary of the Sample Selection Procedure
Step 1: Sector composition of all listed companies on the London Stock Exchange main market
All Companies Total number of companies Percentage (%) of the population
Aerospace & Defence 11 0.82
Alternative Energy 2 0.15
Automobiles & Parts 12 0.90
Banks 37 2.77
Beverages 6 0.45
Chemicals 20 1.49
Company bonds 17 1.27
Construction & Materials 26 1.94
Convertible bonds 1 0.07
Debenture loans 47 3.51
Electricity 12 0.90
Electronic & Electrical Equipment 20 1.49
Equity Investment Instruments 376 28.10
Fixed Line Telecommunications 19 1.42
Food & Drug Retailers 13 0.97
Food Producers 26 1.94
Forestry & Paper 1 0.07
Gas, water & multiultilities 7 0.52
General Financials 53 3.96
General Industrials 16 1.20
General Retailers 37 2.77
Health Care Equipment & Services 10 0.75
Household Goods & Home Construction 15 1.12
Industrial Engineering 25 1.87
Industrial Metals 15 1.12
Industrial Transportation 17 1.27
Leisure Goods 6 0.45
Life insurance 14 1.05
Media 39 2.91
Mining 40 2.99
Mobile Telecommunications 7 0.52
Non-equity Investment Instruments 25 1.87
Nonlife Insurance 13 0.97
Oil & Gas Producers 42 3.14
Oil Equipment, Services & Distribution 10 0.75
Personal Goods 11 0.82
Pharmaceuticals & Biotechnology 19 1.42
Preferences 29 2.17
Real Estate 9 0.67
Real Estate Investment & Services 43 3.21
Real Estate Investment Trusts 20 1.49
Software & Computer Services 27 2.02
Support Services 71 5.31
Technology Hardware & Equipment 22 1.64
Tobacco 2 0.15
Travel & Leisure 48 3.59
Total
1338 100

134
Less
Banks 37
Convertible bonds 1
Company bonds 17
Debenture Loans 47
Equity investment 376
General Financials 53
Life Insurance 14
Non-life insurance 13
Non-equity Investment Instruments 25
Total Financial companies 583 43.57
Total Non-financial companies 755 56.43
Step 2: Industrial classification of all non-financial companies listed on the London Stock
Exchange (main market)
Industry 1
All Companies Total number of firms Percentage (%) of the
population
Construction Materials 26
Household Goods & Home
Construction
15
Industrial Metals 15
Total 56 14.04
Industry 2
Industrial Engineering 25
Technology Hardware & Equipment 22
General Industrials 16
Electronic & Electrical Equipment 20
Automobiles & Parts 12
Aerospace & Defence
Total
11
106 59.47
Industry 3
Beverages 6
Electricity 12

135
Step 3: Industrial classification of all non-financial companies listed with full data for the period
Industry Total number of firms Percentage (%) of the
population
Industry 1 45 20.00
Industry 2 36 16.00
Industry 3 116 51.56
Industry 4
28 12.44
Total 225 100
Total Non-financial companies listed
with full data for the period
225 29.80
Fixed Line Telecommunications 19
Food Producers 26
Gas, water & multiultilities 7
General Retailers 37
Health Care Equipment & Services 10
Industrial Transportation 17
Leisure Goods 6
Media 39
Mobile Telecommunications 7
Personal Goods 11
Preferences 29
Real Estate 9
Real Estate Investment & Services 43
Real Estate Investment Trusts 20
Software & Computer Services 27
Support Services 71
Forestry & Paper 1
Alternative Energy 2
Tobacco 2
Travel & Leisure 48
Total 449 59.47
Industry 4
Chemicals 20
Food & Drug Retailers 13
Mining 40
Oil & Gas Producers 42
Oil Equipment, Services & Distribution 10
Pharmaceuticals & Biotechnology 19
Total 144 19.07

136
This conforms to the proposed percentage guidance on a representative sample by Sekaran
(2000) of between 30 and 500. Field (2005) recommends that the most common rule of
thumb in regression analysis is 10 or 15 cases per each predictor in the model. Based on
the number of predictors to be used and the total population of listed companies on the
main market of London stock exchange, a sample size of 225 companies conforms to the
guidance.
6.2.1 Data and Sources
These companies were extracted from three data sources: Thompson one Analytics,
Analyse Major Databases from European Sources (AMEDEUS) and Boardex. Majority of
the database involving both accounting and financial performance figures and ratios were
extracted from Thompson one Analytics, Analyse Major Databases from European
Sources (AMEDEUS). This database contains both annual accounts and management
details of about 330,000 public and private companies in 41 European countries, including
UK. However, data on corporate governance variables, were also obtained from Boardex.
6.2.2 Dependent Variables
Various accounting measures of profitability have been adopted by several empirical
studies on the relationship between working capital management and profitability.
Tauringana and Afrifa (2013) on a sample of 133 small to medium–size enterprises in UK
used return on assets (ROA) as the measure of performance. Lazaridis and Tryfonidis
(2006) also employed gross operating profit as a measure of companies’ profitability.
Vishnani and Shah (2007) used return on capital employed to represent companies’
profitability. Garcia-Teruel and Martinez-Solano (2007) used Return On Assets (ROA),
whilst Velnampy and Niresh (2012) also used Return On Equity (ROE) as measures of
company profitability. However, in spite of their usage, accounting measures have been
137
criticised as measures that are easily manipulated by management (Mangena and
Tauringana, 2008) and as a result they are classified as poor indicators of profitability for
firms (Ross et al., 2002).
In spite of these criticisms, accounting based measures of company profitability have
widely been used in the WCM literature (Padachi et al., 2010; Hayajneh and Yassine,
2011; Mojtahedzadeh et al., 2011). ROA is used as an accounting measure of profitability
because it is an indicator of the performance of management with regard to the given
resources. Another reason for the use of ROA is its ability to remove size effects, therefore
allowing for inter-industry comparison (Lev and Sunder, 1979). Besides, ROA has more
desirable distributional properties than other accounting measures such as return on equity
(Core et al., 2006). Furthermore, its adoption allows easy comparability with similar
studies (e.g., Deloof, 2003; Tauringana and Afrifa, 2013). Saleem and Rehman (2011)
calculated ROA as profit before Tax (PBT) over total assets. Definitions of all continuous
variables adopted for the study are found in table 6.
6.2.3 Independent variables
The study has two sets of independent variables. The first set of independent variables
include the traditional WCM (measured by cash conversion cycle) and its components
(accounts payable in days, accounts receivable in days and inventory held in days) adopted
by previous studies (Deloof, 2003; Garcia-Teruel and Martinez-Solano, 2007; Tauringana
and Afrifa, 2013). The cash conversion cycle represents the average timing difference
between when a firm pays for its suppliers and the time it takes to recoup the amount
invested in debtors and inventory. It is calculated as (inventory held in days + accounts
receivable in days - accounts payable in days). Accounts receivable in days is the average
number of days the firm takes to collect receivables from customers. This is calculated by
138
dividing accounts receivables by sales multiplied by 365 days. Accounts payable in days
measures the average number of days it takes a firm to pay trade creditors. This is
computed by dividing accounts payables by cost of sales multiplied by 365 days. Finally,
inventory held in days measures the average number of days a company is holding the
inventory. It is calculated by dividing inventory by cost of sales multiplied by 365 days.
The second set of variables includes the set of contingent variables. These variables
moderate the relationship between working capital management, its components (AR, AP
and INV) and profitability. These contingencies are classified into three components by
Luthan and Steward (1977): Environmental (E), Resources (R) and Management (M)
variables of the firm. Environmental (E) variables include factors that affect the
organisation , but are beyond the direct or positive control of the organisation 's resource
managers Churchman (1968). Porter (1980) identified firms’ industrial structural
characteristics as a main determinant of firms’ profitability. Against this backdrop, the
study used industrial characteristics as a proxy for environmental variable. Industries were
categorised into four industrial characteristics based on Gary et al. (1995) industrial
groupings since most of the firms were closely related and share similar characteristics.
The study proxy 1 = Metals, building materials, and construction, 2 = Engineering, 3 =
Consumer goods and services and 4 = Oil, chemicals, and mining.

139
.Table 6. Definition of variables included in the regression models
Variables Acronym Measurement
Profitability measure
Return on total assets
ROA Earnings before interest and tax (EBIT) divided by its total assets (TA) at the end of the
financial year
Management variables M Concepts and techniques expressed in policies, practices and procedures used by the manager to
operate on available resource variables in defining and accomplishing system objectives (Luthans
and Stewards, 1977). This include it corporate governance and working capital policies
Board size Board size The total number of executive and non-executive members serving on the board of a company
Environmental Variables:
E These factors affect the organisation , but are beyond the direct or positive control of the
organisation 's resource managers Churchman (1968).
Industry I Collection of firms engaged in a particular kind of commercial activity
Industry dummy 1 1 Collection of Metals, Building materials and Construction firms
Industry dummy 2 2 Collection of Engineering Firms
Industry dummy 3 3 Collection of Consumer goods and Services firms
Industry dummy 4 4 Collection of Oil, Chemicals and Mining firms
Resource Variables R These are tangible and intangible factors over which management has more direct control and on
which it
operates to produce desired changes in the organisation al system or its environmental supra-
system
(Churchman,1968).
Cash flow CFL Log of Earnings before interest and tax (EBIT) plus depreciation (D)
Working Capital Management component
Inventory holding period INV The average number of days a company is holding the inventory. It is calculated by dividing
inventory by cost
of sales multiplied by 365 days
Average days Receivables AR The average number of days the firm takes to collect receivables from customers. This is
calculated by
dividing accounts receivables by sales multiplied by 365 days
Average days Payables AP The average number of days it takes a firm to pay trade creditors. This is computed by dividing
accounts payables by cost of sales multiplied by 365 days.
Cash Conversion Cycle CCC Cash Conversion Cycle is calculated as (INV+AR-AP), which represents the average timing
difference
between when a firm pays for its suppliers and the time it takes to recoup amount invested in
debtors and
inventory
Control variables
Firm size FIRMSI
ZE
The natural log of firm’s turnover (TO) at the end of the financial year
Financial Leverage LEV Ratio of total debt (TD) divided by capital (C) at the end of the financial year
CEO Tenure Tenure The Total number of years that the CEO has been in office
Liquidity Ratio CR Current assets (CA) divided by current liabilities (CL) at the end of the financial year
Assets tangibility
Growth opportunity
ATAN
SGRTH
The ratio of fixed assets (TFA) divided by total assets (TA) at the end of the financial year
The rate of increase in sales (S) of firms between periods. Current sales –previous sales /
previous sales

140
Resource (R) variables include those tangible and intangible factors over which
management has more direct control and on which it operates to produce desired changes
in the organisation al system or its environmental supra-system (Churchman, 1968). Grant
(1991) identified firms’ cash flow as a key profitability related to resources of the firm.
Firms’ cash flow is measured as the log of profit before interest and tax plus depreciation.
The study adopted firm’s cash flow as a proxy for the firm’s resource variable.
Management (M) variables includes those concepts and techniques expressed in policies,
practices and procedures used by the manager to operate on available resource variables in
defining and accomplishing system objectives (Luthans and Steward, 1977). Company’s
board size is one of the management variables that influence profitability (Dalton and
Dalton, 2005). Company’s board size is measured as the total number of executive and
non-executive members serving on the board of a company. Consequently, this study
adopted company’s board size as a proxy for management variable.
6.2.4 Control variables
The study includes other variables that may influence the effect of WCM on companies’
profitability. These variables have been included in the study in order to prevent any
possibility of omitted bias (see Bartov et al., 2000). Haniffa and Hudaib (2006) suggest
that firm size may be related to firm profitability. Small firms may have less power than
large firms; hence they may find it difficult to compete with the large firms particularly in
highly competitive markets (see Majumdar, 1997). Larger firms have more advanced and
sophisticated marketing skills, research capabilities and product development experience,
which together form the foundation of higher profitability (Dewar and Dutton, 1986). Firm
size is measured as the book value of total assets, which is logged to normalize the
variable. Mathuva (2010), found a positive relationship between firm size and profitability.

141
The financial leverage has a significant effect on companies’ profitability (Ruland and
Zhou, 2005). The presence of debt in the capital structure raises the pressure on managers
to perform (Akintoye, 2008). Dimitrov and Jain (2005) found a negative association
between financial leverage and profitability. Leverage (LEV) is measured as the ratio of
total debt divided by capital at the end of the financial year. The level of liquidity within a
company may greatly influence profitability. A company that has more liquidity may have
the capability of extending more credit to its customers. High liquidity may also hinder a
company’s profitability (Ng and Baek, 2007). Tauringana and Afrifa (2013) found a
negative association between liquidity and profitability. Liquidity ratio (CR) is measured
as current assets divided by current liabilities at the end of the financial year. Asset
tangibility is considered to be one of the major determinants of companies’ profitability as
argued by Onaolapo and Kajola (2010). Research by Braun (2003) has shown that
companies with tangible assets obtain more finance from suppliers and banks. Asset
tangibility (ATAN) is measured by the ratio of tangible fixed assets/total assets. Deloof
(2003) found a positive association between asset tangibility and profitability. Growth
opportunities could also affect the firm’s profitability, as has been shown in various
empirical studies (Deloof, 2003; Shin and Soenen, 1998). It is generally accepted that stock
returns reflect the company's growth opportunities. As is often argued, growth looks like a
necessary ingredient for corporate profitability and the creation of shareholder value (Shin
and Soenen, 1998). Growth opportunities (SGRTH) is measured by the ratio (sales1 -
sales0)/sales0. Deloof (2003) found positive association between growth opportunity and
profitability. Chief Executive Officer (CEO) tenure is a key management variable that
influences profitability (Farooque et al., 2007). CEO tenure is measured as the total
number of years a CEO has been in office.

142
6.3 DATA ANALYSIS METHODS
The aim of this section is to briefly explain the various methods that have been chosen to
analyse the financial data. According to Saunders et al. (2003) and Zikmund (2003), the
prime objective of undertaking any study is to provide information in order to help answer
the research question. In order to generate the relevant information, raw data is gathered,
which is then transformed with the aid of analytical methods to generate the relevant
information for decision making (see Davis, 1996). Zikmund (1997) identified three main
factors that guide the researcher in the choice of a particular statistical analysis in order to
arrive at the correct conclusions. These include: (1) the type of question to be answered;
(2) the number of variables and (3) the scale of measurement.
The objective of the study is to improve on the understanding of the relationship between
working capital, its components and profitability of firms. The central hypothesis is that
the interaction of environment, resources and management variables helps to explain
differences in profitability among firms. This connects with the contingency theoretical
framework and other empirical research devoted to the analysis of working capital
management and profitability. The three research objectives are re-stated as follows:
1. To determine whether there is a relation between working capital management, its
components (accounts receivable in days, accounts payable in days and Inventory
days) and profitability of UK firms as per extant research.
2. To determine whether the effect of working capital management on profitability is
contingent on the interaction of environmental, resource and management variables
of UK firms.
3. To determine whether the effect of the components of working capital management
(accounts payables in days, accounts receivables in days, and inventory held in

143
days) on profitability is contingent on the interaction of environmental, resource
and management variables of UK firms.
In order to achieve the above objectives, the study adopts descriptive statistics, bivariate
analysis and multivariate analysis.
6.3.1 Descriptive Statistics
Descriptive statistics is described as the starting point in any statistical analysis because it
helps in detecting any abnormalities in the data collected. As argued by Quartey (2003),
descriptive analysis is particularly useful because it is a holistic approach that gives
preliminary but useful characteristics of the data. In chapter eight of this research,
descriptive analysis including: calculation of the mean, standard deviation, maximum and
minimum values will be presented.
6.3.2 Bivariate Analysis
In order to test association among the variables, the study employs a bivariate analysis
(Zikmund, 2003). According to Zikmund (1997), bivariate analyses test the hypothesis that
the association between two or more variables differ. The measures of association on the
other hand refer to values designed to represent co-variation between variables. The study
adopts the Pearson’s correlation coefficient to estimate this association between the
individual variables. The Pearson’s correlation considers the joint variation in two
measures (Ghauri and Gronhaug, 2005). The test helps to determine the strength of the
relationship between two variables. The coefficient of correlation assumes the value
ranging from –1 to +1. A variable with coefficients closer to either –1 or +1 indicates a
stronger association (negative or positive) whilst a correlation coefficient of zero indicates
that the variables are unrelated. The study employs correlation matrix to examine whether
the inclusion of the various independent variables in the models will not create any

144
problems of multicollinearity among the models. The results of this analysis are presented
in chapter eight of the study.
6.3.3 Multivariate Analysis
Multivariate analysis is a statistical method that is used to simultaneously investigate two
or more variables (Zikmund, 2003). Although the bivariate correlation results may show
the relation among the individual variables, it fails to take into account each variable’s
correlation with all other explanatory variables. Multivariate analysis is employed because
of the inherently multidimentional nature of dependant variable(s). As a result the main
analysis of this study will be derived from appropriate multivariate models, estimated
using econometric analysis. Econometric analysis is the most popular method in studying
the impact of working capital management on profitability. The reasons for using
econometric analysis can be roughly summarised as follows. Firstly, it can determine
whether the independent variables explain a significant variation in the dependent variable.
Secondly, it can determine how much of the variation in the dependent variable can be
explained by the independent variables. Thirdly, it can control for other independent
variables when evaluating the contributions of a specific variable or set of variables. And
finally, it can predict the values of the dependent variable.
6.3.4 Econometric Analysis
The study adopts panel data analysis in order to investigate its primary research questions
on the relationship between working capital, its contingencies and profitability. The
technique sets out repeated observations over time on a cross section of firms, individuals,
countries etc. It involves time series observation of a number of individuals, firms,
countries etc. and following them over time. Panel data technique has two dimensions

145
(time series and cross section) which help to provide sufficient information about the data.
Panel data has a number of advantages over regular time-series or cross section studies.
Firstly, it controls for individual heterogeneity. Unlike time-series and cross section
techniques, panel data suggests that individual firms are heterogeneous and hence does not
run the risk of obtaining biased results (see Baltagi, 2005). Secondly, panel data provides
more informative data, adequate variability, less collinearity, more degrees of freedom and
more efficiency (Baltagi, 2005). Time-series studies are always suffered from
multicollinearity. For example, in a study carried out by Baltagi and Levin (1992) about
the demand for cigarettes in the USA for 46 states over the years of 1962-1992, there is
high collinearity between price and income in the aggregate time series for the USA. This
is less likely with a panel across American states since the cross-section dimension adds a
lot of variability, adding more informative data on price and income. In fact, the variation
in the data can be decomposed into variation between states of different sizes and
characteristics, and variation within states. The former variation is usually bigger. With
additional, more informative data one can produce more reliably.
Thirdly, panel data can better detect and measure effects that simply cannot be observed in
pure cross-section data (Hsiao, 2003). Panel data, is able to study the dynamics of
adjustment over time in a given set of data. Finally, panel data can be used, at least under
certain assumptions, to obtain consistent estimators in the presence of omitted variables
(Wooldridge, 2002). These omitted or unobserved variables are usually consigned to the
error term when using cross-section data. If these omitted or unobservable variables are
correlated with dependent variables, then ordinary least squares (OLS) will provide biased
estimates. This is a perennial problem faced by investigators who only have cross-section
data. If panel data were available on individuals over time, this may provide a solution to
the problem.

146
Despite the various advantages of using panel data analysis, it also has certain limitations.
Firstly, designing panel surveys as well as data collection and data management could be
very expensive and difficult. Secondly, measurement errors may arise because of faulty
responses due to unclear questions, memory errors, deliberate distortion of responses,
inappropriate informants, misreporting of responses and interviewer effects. Thirdly, there
is a selectivity problem including self-selectivity, non-response and attrition. However,
these limitations are associated with survey data. Since the data for this study are
secondary data it is considered the above mentioned limitations do not have serious impact
on the validity of this study.
A classical panel data regression is presented as follows:
(6.1)
= (6.2)
Where is dependent variable of the observation. The subscript i denotes the nth
company (i = 1... 225) which represents the cross section dimension whereas the subscript t
denotes the tth
year (t=1,...11) which also represents the time-series dimension. denotes
the idiosyncratic shocks and are vectors of the parameters to be estimated.
6.3.4.1 One Way Error Component Regression Model

147
Panel data regression differs from a regular time-series or cross section regression in that
the data allows the control of unobserved heterogeneity constant over time. Unlike the
Ordinary Least Square (OLS) regression, panel data regression utilizes a one-way error
component model which takes into consideration the individual effect of the disturbance
term. This is presented as follows:
= (6.3)
Where is the unobserved company effects (fixed effects) and the idiosyncratic
shocks and are vectors of the parameters to be estimated. However, since the two
components of are assumed to be independent of each other and since is not
dynamic across time but varies across individual companies, a two-way error component
model will be used for the study. This will take into consideration both the individual
effect and the time effect of the estimation. The two-way error component model is
presented as follows:
(6.4)
Where represents the any specific time effects
Two common specifications are developed to deal with such unobserved constant
individual effect ). These include Random effects and Fixed effects.
In the model
= (6.2)
= (6.3)

148
We assumed that average mean of the is zero. It is further important that and are
uncorrelated
= 0;
= 0
6.3.4.2 Fixed Effects (FE)
The formulation of the FE model assumes that differences across unit can be captured in
differences in the constant term (Greene, 2003). It is assumed in the FE model assumes
that the slope coefficients are constant for all firms, but the intercept varies across firms.
Therefore, in equation (6.3) is assumed to be a group-specific constant term which
assumed to have fixed parameters to be estimated. The FE specification assumes that the
individual effects of are correlated with the regressors:
= 0; ≠ 0.
Therefore, equation (6.2) can be rewritten as follows:
= (6.5)
= ≠
This clearly demonstrated that OLS and the Random Effect estimator are inconsistent and
biased.
In order to estimate using a separate intercept for each individual in the OLS model, then,
(6.6)

149
The transformed within- group model of the OLS estimator for the parameters could be
presented as follows:
(6.7)
Therefore, from the model, using the FE or within-group estimator, one can only estimate
the effects of the variables which change over time. Hence for the FE estimator to be
unbiased, in all the periods should not be correlated with the in all the periods.
s = 1,……, T, t=1, …,T
When this condition is satisfied by . An
advantage of FE is that there is no need to assume that the effects are independent of (εit)
because it allows the unobserved individual effects to be correlated with the included
variables. On the other hand, it has the disadvantage of not being able to estimate the effect
of any time invariant variable like location. Therefore, any time invariant variable is wiped
out by the deviations from means transformation. More so, the model suffers from a large
loss of degree of freedom because of estimating (N-1) extra parameters.
6.3.4.3 Random Effects (FE)
Unlike the fixed effects model where inferences are conditional on the particular cross-
sectional units sampled, an alternative formulation is the RE model. The model becomes
more efficient than FE estimator if it can be assumed that firm effects are randomly
distributed across firms. Baltagi (2008) suggests that loss of degrees of freedom can be
avoided when we assumed randomisation of . Under the RE assumptions, ( or

150
) is uncorrelated with Xit. Therefore, the generalised least squares (GLS)
estimator of Balestra and Nerlove (1966) can be used on the basis of consistent estimate of
Ω.
(∑
)
∑
(6.7)
However, the estimate could also be used for OLS with corrected standard of errors should
the assumption of the RE model hold. The estimator of the OLS could be given as follows:
(∑
)
∑
(6.8)
A consistent estimate of variance of the OLS estimator is given as follows under more
general conditions.
( ) (∑
)
∑
(∑
)
(6.9)
Where
Also, the between estimator could also be classified as another unbiased estimator. This is
the OLS estimator in the model.
=
∑
(6.10)

151
However, the RE has its advantages and disadvantages. One of its advantages is that it
enables the researcher to extract information from a weighted average of the within-group
and between-group estimators (Gyapong, 1986; Greene, 1997). On the other hand, on the
downside, Hsiao (2003) suggests that RE model requires the need to make assumptions
about the pattern of correlation between the effects and the included explanatory variables.
6.3.4.4 Relationship between Random Effects and Fixed Effects Estimators
On the transformed regression model, the estimator of RE could be estimated using OLS
(6.11)
Where is estimated as
√
Therefore as (
), RE estimator become equivalent to FE
estimator in the estimation. On the other hand, as (
⁄ ) RE becomes
equivalent to OLS estimator. As a result, in order to estimate the RE estimator using GLS
estimator, the ratio
is all that is required.

152
6.3.4.5 Empirical Studies
Based on the arguments above, the following panel data models below are used to estimate
the relationship between working capital, its contingencies and profitability. Panel data
technique has been adopted because as argued above, it has the advantage of more degrees
of freedom, less multicollinearity among the explanatory variables, improved efficiency of
econometric estimates (Begona, 1997) and above all controls for the unobservable
heterogeneity among the sample since they can be observed through time.
The first equation below (1), report a direct relationship between working capital and
profitability as estimated by previous studies of (Deloof, 2003; Tauringana and Afrifa,
2013) without any interactive effect, while the second (2), reports the relationship with the
introduction of the interactive term.
(6.12)
(6.13)
Where:
PERFORMANCE is the dependent variable which is measured using return on assets
(ROA); X variables include cash conversion cycle (CCC), accounts payable in days (AP),
accounts receivable in days (AR), inventory held in days (INV). Z represents control
variables (firm size, cash flow, gearing, assets tangibility, tenure, sales growth and
industry) that may influence companies’ performance. XZ represents the interactive term

153
(environmental, resource and management variables) with the main variables of working
capital management. is the unobserved company effects (fixed effects) and the
idiosyncratic shocks and are vectors of the parameters to be estimated. The
subscript i denotes the nth company (i = 1... 225), and the subscript t denotes the tth
year
(t=1,...11).
6.3.4.6 Hausman Test
The Hausman test examines whether there is significant correlation between the
unobserved individual-specific random effects and the regressors. In order words the test
examine whether the unobserved heterogeneity is correlated with the regressors. When
they are correlated, the FE estimator becomes consistent whiles the RE estimator becomes
inconsistent. On the other hand, if they are not correlated, both estimators become
consistent with FE more efficient. For instance, in an error component regression model, a
critical assumption is that = 0. This is of much relevance to the model given
that the disturbance term contains an individual effect of ) which is unobserved and
correlated with . Clearly, when ≠ 0, the OLS estimator becomes
inconsistent and biased for β. However, the transformation within takes off the disturbance
term contains an individual effect of ), leaving the within estimator consistent
and unbiased for
The estimation of the Hausman test is given by
[ ( )]
( )
RE is rejected when H is large as H ~ with k being the number of elements in .
Against this background, the study estimated the Hausman test. Evidence of the test
reveals that the regressors are uncorrelated with the unobserved heterogeneity in all the

154
models which suggests no significant difference the RE estimator and the FE estimator. As
a result, using STATA statistical software, the study adopted the RE estimator given that
the findings of the test supports this method.
6.3.5 Sensitivity Analysis
In order to reduce the risk of biased estimators from possible multicollinearity,
heteroscedasticity and serial correlation, the study carried out sensitivity analysis of the
regression models by adopting a correlation matrix for all the continuous variables for
possible presence of multicollinearity. The log transformation of both the dependent and
independent variables was undertaken in order to normalise the distribution of the data.
Because the data for this research is a cross-section of firms, two critical assumptions
associated with disturbance term in the error component model. Therefore in a classical
linear regression model, we assumed that mean of the disturbances is zero and variance of
the errors is constant .
E( ) = 0
var(
When both assumptions are violated, the estimations of the regression coefficients are still
unbiased and consistent, but not efficient (Baltagi, 2005). This is often referred to as
homoscedasticity. In order words heteroscedasticity occurs when the errors do not have a
constant variance. Heteroscedasticity arises when there is a wide range of the (X) variables
and when using grouped data. This is because, in this case each observation is an average
for a group and the groups are of different sizes (Greene, 2000). According to Baltagi
(2005), one approach to test for heteroscedasticity is to model these variances and/or
correlations. But this can be difficult, particularly for short time period, which is typical for
155
panel data. For instance, suppose that variable G t is related to the variance of the error
term.
var(
Suppose that the error variance is related to another variable
Where =
is the error term
Therefore
var( (
)
The practical approach is to accept the usual estimates, but to compute robust standard
errors correcting for the possible presence of heteroskedasticity and/or individual
autocorrelation. The advantage of using robust standard error is that it controls for both
heteroscedasticity and serial correlation which can pose problems in panel data (Lei, 2006).
Therefore, all models are estimated with robust standard error to take into account of
heteroscedasticity and serial correlation. The latter approach is the one adopted in the
subsequent studies. To test for heteroscedasticity, the Breusch-Pagan/Godfrey test was
used.
The presence of serial correlation indicates that the variables in the model violate the
assumptions of the regression (Anderson et al., 2007). To cater for serial correlation, the
Woodridge test for autocorrelation is employed. The presence of serial correlation
indicates that the variables in the model violate the assumptions of the regression

156
(Anderson et al., 2007). Since the data involves both cross section and time-series, it raises
the suspicion of the existence of serial correlation.
To more rigorously test the interaction hypothesis, the study performs further analyses on
the “goodness of fit” of each of the models using the akaike test criteria. Here the akaike
criterion (AIC) is a decision criterion is to strive for the lowest (arithmetic) value. The total
effect of each of the model will be estimated by taking the first derivative of the each of the
regression functions. The purpose of estimating these tests is to determine which of the
models best explains the relationship between working capital management and
profitability. To enhance the robustness of the results, the study performs further analysis
on the relationship between working capital management and profitability. This test allows
us to justify the results obtained by Hill et al. (2010) that investment in working capital
depends on internal financing capacity of firms. Following the work of Baños-Caballero et
al. (2013), the study divides the sample into two, based on the median of cash flow.
Therefore firms with a cash flow above the sample median are assumed to be less likely to
lack cash flow, whiles firms with a cash flow below the sample median are assumed to
suffer from a lack of cash flow (Baños-Caballero et al. 2013). The akaike criterion (AIC) is
used as a decision criterion for the best fit models.
6.4 CONCLUSION
This chapter provides a discussion on the research methodology adopted for the study. It
provided detailed discussion on the various methodologies adopted for the study,
description and justification of the choice of data and methodology. The study’s sample
consisted of 225 listed companies on the main market of London stock exchange for the
period 2001-2011. The choice of the period was guided by UK Late Payment of
Commercial Debts (Interest) Act 1998 which was amended in line with the EU Late 2002
157
Payment directive and now the new EU late payment directive in 2011. Two main types of
financial data were employed: financial and corporate governance variables. The financial
data variables were gathered mainly from Thompson one Analytics and Analyse Major
Databases from European Sources (AMEDEUS) whiles the corporate governance variables
data was obtained from Boardex. The remainder of this chapter was presented as follows:
Section 6.2 presented a description of the data and procedure for sample selection. In this
section, the various variables employed in establishing the hypotheses used on the effect of
WCM and its components on profitability of firms were discussed. Section 6.3 presented a
discussion on the tool for data analysis whilst section 6.4 concluded the chapter.

158
7 CHAPTER SEVEN
RESULTS ON THE RELATIONSHIP BETWEEN WORKING CAPITAL
MANAGEMENT AND PROFITABLITY
7.1 INTRODUCTION
This chapter presents empirical results on the relationship between working capital
management and profitability as examined by most previous studies. Its objective is to
isolate the impact of working capital management and its components on profitability in
order to determine if the impact may be caused by multiple contingent factors as postulated
by the contingency framework. It incorporates other control variables found relevant by
previous studies to influence the relationship between working capital management on
profitability. Overall, the chapter presents results of sixteen hypotheses formulated in
chapter seven using the methodological framework presented in chapter eight. The rest of
the chapter is structured as follows. Section 7.2 provides descriptive statistics of the study.
Section 7.3 presents the correlation analysis. Section 7.4 discusses the multiple regression
results whilst a final discussion and conclusion of the chapter is summary in section 7.5.
7.2 DESCRIPTIVE STATISTICS
Descriptive statistics of the independent and dependent variables are presented in Table 7.
This section is presented in four sub-sections. The first sub-section presents descriptive
statistics of the dependent variable of the study, whilst the second sub-section presents
analysis of the main explanatory variables. Finally, the last two sub-section presents
evidence of both the corporate governance and company characteristics variables.
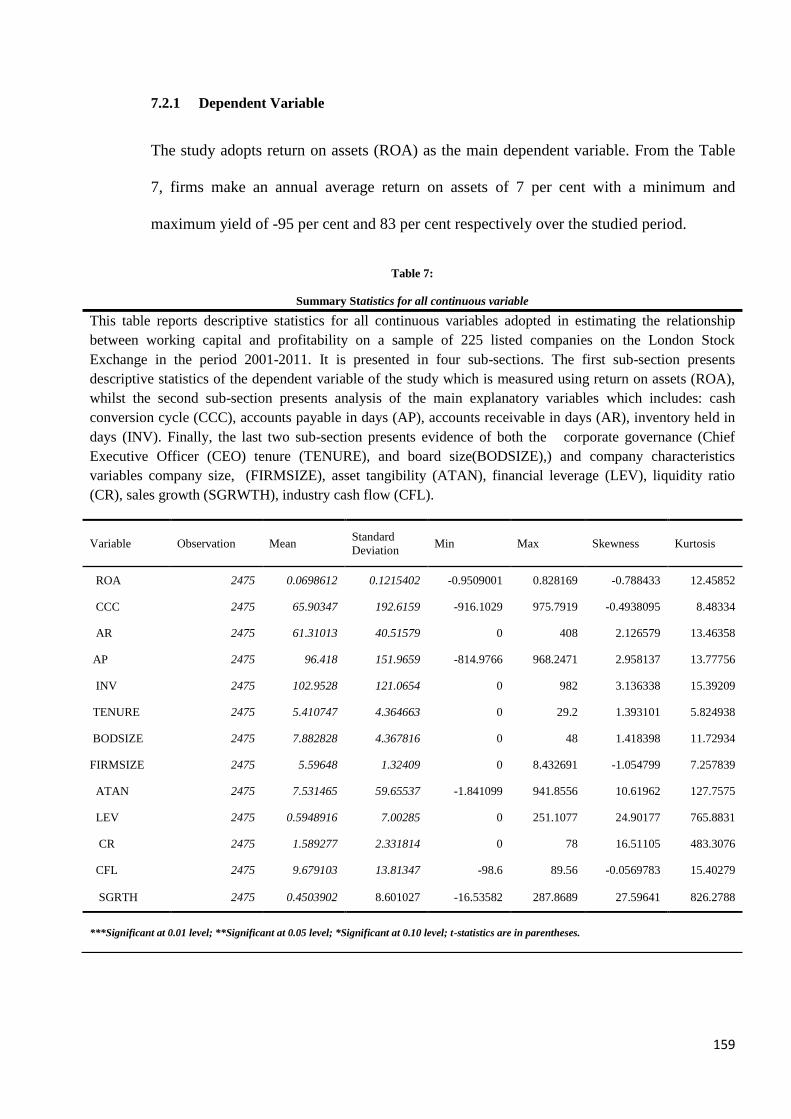
159
7.2.1 Dependent Variable
The study adopts return on assets (ROA) as the main dependent variable. From the Table
7, firms make an annual average return on assets of 7 per cent with a minimum and
maximum yield of -95 per cent and 83 per cent respectively over the studied period.
Table 7:
Summary Statistics for all continuous variable
This table reports descriptive statistics for all continuous variables adopted in estimating the relationship
between working capital and profitability on a sample of 225 listed companies on the London Stock
Exchange in the period 2001-2011. It is presented in four sub-sections. The first sub-section presents
descriptive statistics of the dependent variable of the study which is measured using return on assets (ROA),
whilst the second sub-section presents analysis of the main explanatory variables which includes: cash
conversion cycle (CCC), accounts payable in days (AP), accounts receivable in days (AR), inventory held in
days (INV). Finally, the last two sub-section presents evidence of both the corporate governance (Chief
Executive Officer (CEO) tenure (TENURE), and board size(BODSIZE),) and company characteristics
variables company size, (FIRMSIZE), asset tangibility (ATAN), financial leverage (LEV), liquidity ratio
(CR), sales growth (SGRWTH), industry cash flow (CFL).
Variable Observation Mean Standard
Deviation Min Max Skewness Kurtosis
ROA 2475 0.0698612 0.1215402 -0.9509001 0.828169 -0.788433 12.45852
CCC 2475 65.90347 192.6159 -916.1029 975.7919 -0.4938095 8.48334
AR 2475 61.31013 40.51579 0 408 2.126579 13.46358
AP 2475 96.418 151.9659 -814.9766 968.2471 2.958137 13.77756
INV 2475 102.9528 121.0654 0 982 3.136338 15.39209
TENURE 2475 5.410747 4.364663 0 29.2 1.393101 5.824938
BODSIZE 2475 7.882828 4.367816 0 48 1.418398 11.72934
FIRMSIZE 2475 5.59648 1.32409 0 8.432691 -1.054799 7.257839
ATAN 2475 7.531465 59.65537 -1.841099 941.8556 10.61962 127.7575
LEV 2475 0.5948916 7.00285 0 251.1077 24.90177 765.8831
CR 2475 1.589277 2.331814 0 78 16.51105 483.3076
CFL 2475 9.679103 13.81347 -98.6 89.56 -0.0569783 15.40279
SGRTH 2475 0.4503902 8.601027 -16.53582 287.8689 27.59641 826.2788
***Significant at 0.01 level; **Significant at 0.05 level; *Significant at 0.10 level; t-statistics are in parentheses.
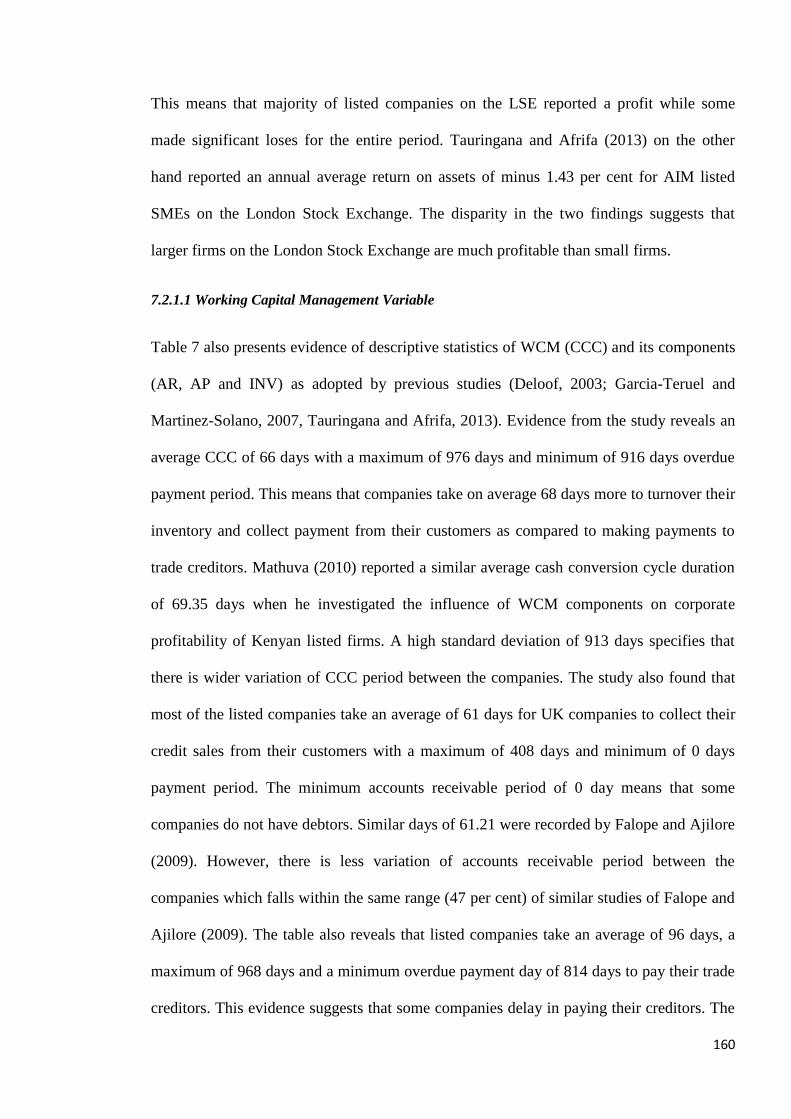
160
This means that majority of listed companies on the LSE reported a profit while some
made significant loses for the entire period. Tauringana and Afrifa (2013) on the other
hand reported an annual average return on assets of minus 1.43 per cent for AIM listed
SMEs on the London Stock Exchange. The disparity in the two findings suggests that
larger firms on the London Stock Exchange are much profitable than small firms.
7.2.1.1 Working Capital Management Variable
Table 7 also presents evidence of descriptive statistics of WCM (CCC) and its components
(AR, AP and INV) as adopted by previous studies (Deloof, 2003; Garcia-Teruel and
Martinez-Solano, 2007, Tauringana and Afrifa, 2013). Evidence from the study reveals an
average CCC of 66 days with a maximum of 976 days and minimum of 916 days overdue
payment period. This means that companies take on average 68 days more to turnover their
inventory and collect payment from their customers as compared to making payments to
trade creditors. Mathuva (2010) reported a similar average cash conversion cycle duration
of 69.35 days when he investigated the influence of WCM components on corporate
profitability of Kenyan listed firms. A high standard deviation of 913 days specifies that
there is wider variation of CCC period between the companies. The study also found that
most of the listed companies take an average of 61 days for UK companies to collect their
credit sales from their customers with a maximum of 408 days and minimum of 0 days
payment period. The minimum accounts receivable period of 0 day means that some
companies do not have debtors. Similar days of 61.21 were recorded by Falope and Ajilore
(2009). However, there is less variation of accounts receivable period between the
companies which falls within the same range (47 per cent) of similar studies of Falope and
Ajilore (2009). The table also reveals that listed companies take an average of 96 days, a
maximum of 968 days and a minimum overdue payment day of 814 days to pay their trade
creditors. This evidence suggests that some companies delay in paying their creditors. The

161
high standard deviation of 152 days is an indication of the wider variation in the accounts
payable period of sampled companies. The evidence confirms Wilson (2008) findings of
late payment problem among UK firms with large firms being the worse culprits due to
their long bureaucratic procedures for processing invoices. According to Wilson (2008),
larger firms take an average of over 74 days to settle their invoices whiles small and
medium firms take over 58 day. In spite of this, larger firms are still granted credit by
smaller firms because they are perceived as less risky clients than smaller buyers (Wilson,
2008).
In terms of inventory management, the study found that the average inventory holding
period is 102.95 days with a minimum and maximum holding period of 0 day and 982 days
respectively. A minimum inventory turnover of 0 demonstrates that some companies of the
study had no inventory and hence had no inventory hold period. It is also evident from the
study that sampled companies have a high variation of inventory turnover of 121 days.
7.2.2 Control Variables
7.2.2.1 Corporate Governance
Two corporate governance variables have also been presented in Table 7. Evidence from
the table reveals that the average CEO tenure of office among the sample companies is 5
years with a maximum of 29 years and a minimum of less than a year. The study found a
standard deviation of 4.36 per cent which is an indication of less variation CEO tenure of
office among sample companies. On the other hand, the study found the average board size
of sample companies to be 8 members with a maximum of 48 members.
7.2.2.1 Company Characteristics
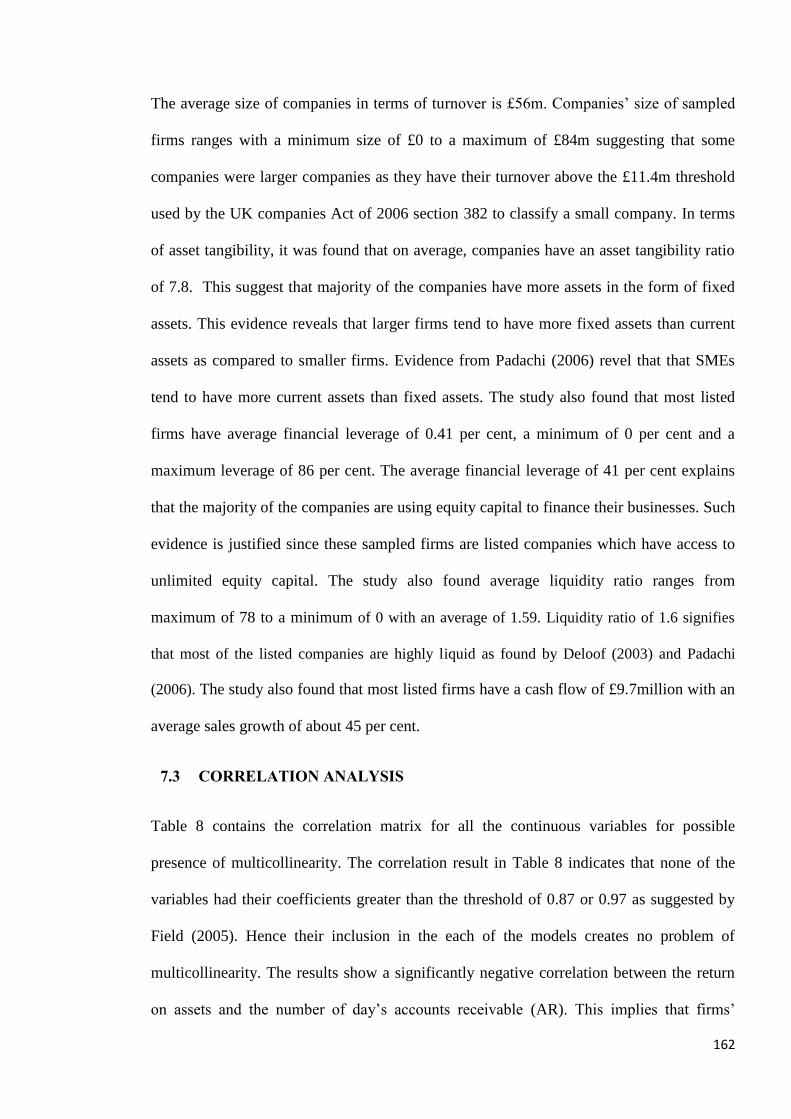
162
The average size of companies in terms of turnover is £56m. Companies’ size of sampled
firms ranges with a minimum size of £0 to a maximum of £84m suggesting that some
companies were larger companies as they have their turnover above the £11.4m threshold
used by the UK companies Act of 2006 section 382 to classify a small company. In terms
of asset tangibility, it was found that on average, companies have an asset tangibility ratio
of 7.8. This suggest that majority of the companies have more assets in the form of fixed
assets. This evidence reveals that larger firms tend to have more fixed assets than current
assets as compared to smaller firms. Evidence from Padachi (2006) revel that that SMEs
tend to have more current assets than fixed assets. The study also found that most listed
firms have average financial leverage of 0.41 per cent, a minimum of 0 per cent and a
maximum leverage of 86 per cent. The average financial leverage of 41 per cent explains
that the majority of the companies are using equity capital to finance their businesses. Such
evidence is justified since these sampled firms are listed companies which have access to
unlimited equity capital. The study also found average liquidity ratio ranges from
maximum of 78 to a minimum of 0 with an average of 1.59. Liquidity ratio of 1.6 signifies
that most of the listed companies are highly liquid as found by Deloof (2003) and Padachi
(2006). The study also found that most listed firms have a cash flow of £9.7million with an
average sales growth of about 45 per cent.
7.3 CORRELATION ANALYSIS
Table 8 contains the correlation matrix for all the continuous variables for possible
presence of multicollinearity. The correlation result in Table 8 indicates that none of the
variables had their coefficients greater than the threshold of 0.87 or 0.97 as suggested by
Field (2005). Hence their inclusion in the each of the models creates no problem of
multicollinearity. The results show a significantly negative correlation between the return
on assets and the number of day’s accounts receivable (AR). This implies that firms’
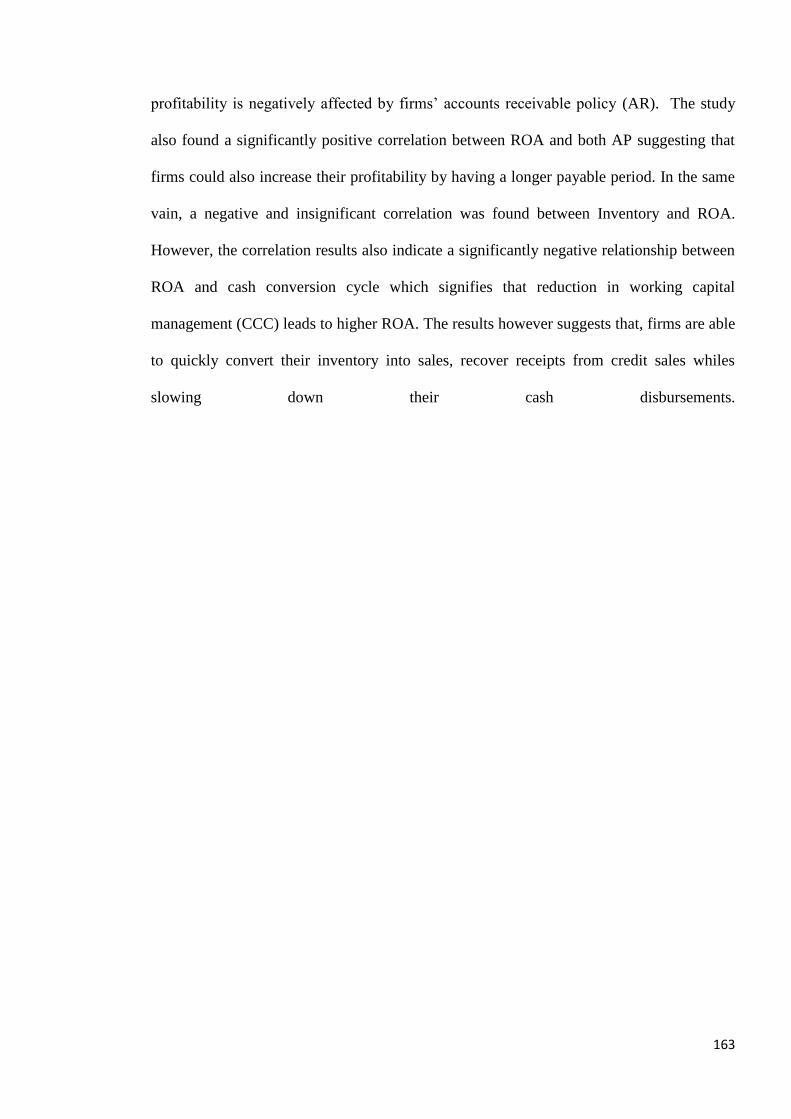
163
profitability is negatively affected by firms’ accounts receivable policy (AR). The study
also found a significantly positive correlation between ROA and both AP suggesting that
firms could also increase their profitability by having a longer payable period. In the same
vain, a negative and insignificant correlation was found between Inventory and ROA.
However, the correlation results also indicate a significantly negative relationship between
ROA and cash conversion cycle which signifies that reduction in working capital
management (CCC) leads to higher ROA. The results however suggests that, firms are able
to quickly convert their inventory into sales, recover receipts from credit sales whiles
slowing down their cash disbursements.
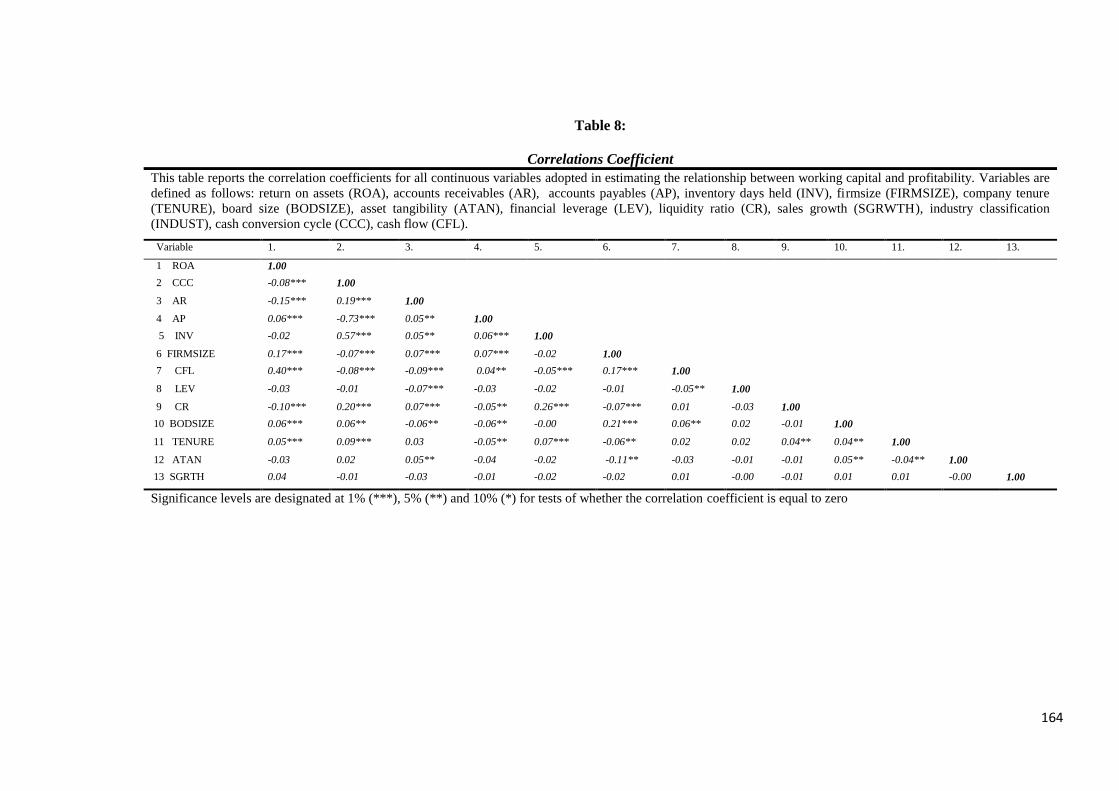
164
Table 8:
Correlations Coefficient
This table reports the correlation coefficients for all continuous variables adopted in estimating the relationship between working capital and profitability. Variables are
defined as follows: return on assets (ROA), accounts receivables (AR), accounts payables (AP), inventory days held (INV), firmsize (FIRMSIZE), company tenure
(TENURE), board size (BODSIZE), asset tangibility (ATAN), financial leverage (LEV), liquidity ratio (CR), sales growth (SGRWTH), industry classification
(INDUST), cash conversion cycle (CCC), cash flow (CFL).
Variable 1. 2. 3. 4. 5. 6. 7. 8. 9. 10. 11. 12. 13.
1 ROA 1.00
2 CCC -0.08*** 1.00
3 AR -0.15*** 0.19*** 1.00
4 AP 0.06*** -0.73*** 0.05** 1.00
5 INV -0.02 0.57*** 0.05** 0.06*** 1.00
6 FIRMSIZE 0.17*** -0.07*** 0.07*** 0.07*** -0.02 1.00
7 CFL 0.40*** -0.08*** -0.09*** 0.04** -0.05*** 0.17*** 1.00
8 LEV -0.03 -0.01 -0.07*** -0.03 -0.02 -0.01 -0.05** 1.00
9 CR -0.10*** 0.20*** 0.07*** -0.05** 0.26*** -0.07*** 0.01 -0.03 1.00
10 BODSIZE 0.06*** 0.06** -0.06** -0.06** -0.00 0.21*** 0.06** 0.02 -0.01 1.00
11 TENURE 0.05*** 0.09*** 0.03 -0.05** 0.07*** -0.06** 0.02 0.02 0.04** 0.04** 1.00
12 ATAN -0.03 0.02 0.05** -0.04 -0.02 -0.11** -0.03 -0.01 -0.01 0.05** -0.04** 1.00
13 SGRTH 0.04 -0.01 -0.03 -0.01 -0.02 -0.02 0.01 -0.00 -0.01 0.01 0.01 -0.00 1.00
Significance levels are designated at 1% (***), 5% (**) and 10% (*) for tests of whether the correlation coefficient is equal to zero
165
This however results in an increase in profitability for these firms as suggested by Nobanee
(2009). Among the independent variables, there are significant correlations among all the
four principal components of working capital management. There is a high and significant
correlation between CCC and the other two measures of WCM including INV (0.57) and
AP (-0.73) but not with AR. Because the combination of the other three components of
WCM including inventory holding period, accounts receivable period and accounts
payable period results in the calculation of the cash conversion cycle, each WCM variable
is therefore run separately with the control variables to avoid collinearity issues (see,
Padachi, 2006; Garcia-Teruel and Martinez-Solano, 2007; Mathuva, 2010).
Furthermore, evidence from table 8 found a significant relationship between ROA and the
two corporate governance variables. The results indicate a significant positive correlation
between these two variables (CEO tenure and board size). This result supports Dehaene et
al. (2001) and Coles et al. (2008) evidence on the importance of having a larger board size
for companies. It is suggested companies with larger boards are able to improve
profitability due to the large amount of valuable advice coming from a large pool of
expertise on the board (Dalton and Dalton, 2005). However, the relationship of ROA with
CEO tenure is significantly positive which point to the fact that longer tenure of CEOs
result in maximisation of profitability. The study also found a significant positive
relationship between CEO tenure and two components of working capital (cash conversion
cycle and inventory holding period). The study on the other hand found an insignificant
positive relationship between CEO tenure and Accounts payable period. It also found a
significantly negative relationship between CEO tenure and accounts receivables.
In terms of the WCM components, accounts receivable period and cash conversion cycle
are positive and significantly correlated with board size whilst accounts payable period
inventory holding period are negatively correlated with board size.
166
The study also found some significant correlation between ROA and company
characteristics. ROA is positively correlated with between firm size and cash flow but not
statistically significantly correlated with the rest of the company characteristics variables.
This means that the bigger the company the more profitable it becomes. This is because
larger companies usually enjoy economics of scale, a higher negotiation power over their
clients and suppliers (Serrasqueiro et al., 2008; Singh and Whittington, 1975), which
improves their profitability. Also firms with positive cash flow tend to be more profitable
that those with cash flow problems; this is because companies with available cash flow
may take advantage of the cash to make bulk purchases which may reduce the procurement
cost of production. There is a negatively significant correlation of ROA with liquidity ratio
and working capital requirement. This signifies that higher proportion of liquidity and
higher working capital requirement results in lower profitability. Although the bivariate
correlation results show the relation between working capital management and
profitability, it does not take into account each variable’s correlation with all other
explanatory variables. As a result the main analysis of this study will be derived from
appropriate multivariate models, estimated using panel data framework. The model has the
advantage of more degrees of freedom, less multicollinearity among the explanatory
variables, improved efficiency of econometric estimates (Begona, 1997) and above all
controls for the unobservable heterogeneity among the sample since they can be observed
through time.
7.4 MULTIPLE REGRESSION RESULTS
The study starts by replicating the results of previous studies (Deloof, 2003; Lazaridis and
Tryfonidis, 2006; Mathuva, 2010; Tauringana and Afrifa, 2013) in Table 9. The rationale
is to explore the relationship between WCM, its components and profitability without
interactive effect as demonstrated by previous studies. The results from the Hausman’s test

167
indicates the use of random effect (RE) and therefore the main balanced panel data results
are obtained by RE using STATA application version (11.2).
7.4.1 Working Capital Management Variables and Profitability
7.4.1.1 Working capital Management
The results of Model 1 present evidence of the relationship between WCM (CCC) and
profitability (ROA). Hypothesis H1 predicts that all other thing be held constant, there is a
significantly negative relationship between cash conversion cycle and profitability. The
study found a significantly negative relationship between cash conversion cycle (b= -
0.147, p<0.01) and ROA. Therefore H1 is supported. The results are consistent with
Lazaridis and Tryfonidis (2006), Garcia-Teruel and Martinez-Solano (2007), Dong and Su
(2010), but contradicts (Deloof, 2003; Ganesan, 2007; Samiloglu and Demirgunes, 2008).
7.4.1.1 Accounts Receivable Period
Therefore H2 is supported by the data and consistent with Deloof (2003), Lazaridis and
Tryfonidis (2006), Padachi (2006), Garcia-Teruel and Martinez-Solano (2007). It supports
the argument that firms with shorter accounts receivable (AR) period are able to improve
their profitability since shorter accounts receivable period frees up cash quickly for
companies. This cash could be used to make payment of bills on time in order to enjoy
early payment discounts without the need for the firm to seek external source of funding
which often tend to be very expensive customers (Martinez-Sola et al., 2013). This finding
contradicts studies of Ramachandran and Janakiraman (2009), Raheman et al. (2010).
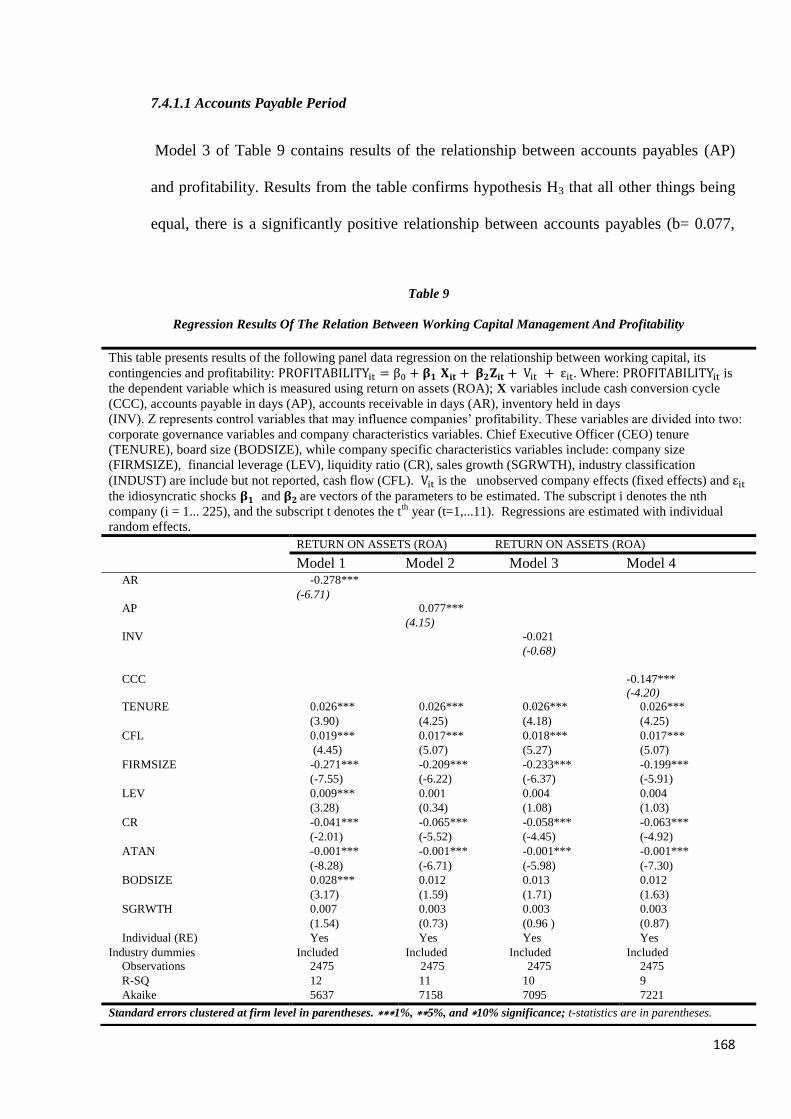
168
7.4.1.1 Accounts Payable Period
Model 3 of Table 9 contains results of the relationship between accounts payables (AP)
and profitability. Results from the table confirms hypothesis H3 that all other things being
equal, there is a significantly positive relationship between accounts payables (b= 0.077,
Table 9
Regression Results Of The Relation Between Working Capital Management And Profitability
This table presents results of the following panel data regression on the relationship between working capital, its
contingencies and profitability: . Where: is
the dependent variable which is measured using return on assets (ROA); X variables include cash conversion cycle
(CCC), accounts payable in days (AP), accounts receivable in days (AR), inventory held in days
(INV). Z represents control variables that may influence companies’ profitability. These variables are divided into two:
corporate governance variables and company characteristics variables. Chief Executive Officer (CEO) tenure
(TENURE), board size (BODSIZE), while company specific characteristics variables include: company size
(FIRMSIZE), financial leverage (LEV), liquidity ratio (CR), sales growth (SGRWTH), industry classification
(INDUST) are include but not reported, cash flow (CFL). is the unobserved company effects (fixed effects) and the idiosyncratic shocks and are vectors of the parameters to be estimated. The subscript i denotes the nth
company (i = 1... 225), and the subscript t denotes the tth
year (t=1,...11). Regressions are estimated with individual
random effects.
RETURN ON ASSETS (ROA) RETURN ON ASSETS (ROA)
Model 1 Model 2 Model 3 Model 4 AR -0.278***
(-6.71)
AP 0.077***
(4.15)
INV -0.021
(-0.68)
CCC -0.147***
(-4.20)
TENURE 0.026***
(3.90)
0.026***
(4.25)
0.026***
(4.18)
0.026***
(4.25)
CFL 0.019***
(4.45)
0.017***
(5.07)
0.018***
(5.27)
0.017***
(5.07)
FIRMSIZE -0.271***
(-7.55)
-0.209***
(-6.22)
-0.233***
(-6.37)
-0.199***
(-5.91)
LEV 0.009***
(3.28)
0.001
(0.34)
0.004
(1.08)
0.004
(1.03)
CR -0.041***
(-2.01)
-0.065***
(-5.52)
-0.058***
(-4.45)
-0.063***
(-4.92)
ATAN -0.001***
(-8.28)
-0.001***
(-6.71)
-0.001***
(-5.98)
-0.001***
(-7.30)
BODSIZE 0.028***
(3.17)
0.012
(1.59)
0.013
(1.71)
0.012
(1.63)
SGRWTH 0.007
(1.54)
0.003
(0.73)
0.003
(0.96 )
0.003
(0.87)
Individual (RE) Yes Yes Yes Yes
Industry dummies Included Included Included Included
Observations 2475 2475 2475 2475
R-SQ 12 11 10 9
Akaike 5637 7158 7095 7221
Standard errors clustered at firm level in parentheses. ∗∗∗1%, ∗∗5%, and ∗10% significance; t-statistics are in parentheses.

169
p<0.01) and profitability. Therefore hypothesis H3 is supported by the data and consistent
with Mathuva (2010), Falope and
Ajilore (2009); Vishnani and Shah (2007); Raheman et al. (2010); Sen and Oruc (2009);
Dong and Su (2010) but contradicts studies of Deloof (2003), Lazaridis and Tryfonidis
(2006), Ganesan (2007), Garcia-Teruel and Martinez-Solano (2007), Raheman and Nasr
(2007), Karaduman et al. (2011), Alipour (2011), Hayajneh and Yassine (2011) and
Karaduman et al. (2011).
7.4.1.1 Inventory Holding Period
Evidence results of Model 4 from Table 9 reveals a negative but not significant
relationship between inventory day holding (INV) period (b = -0.021, p>0.1) and ROA.
This result is consistent with Padachi (2006) but contradicts (Deloof, 2003; Ganesan, 2007;
Garcia-Teruel and Martinez-Solano, 2007; Raheman and Nasr, 2007; Samiloglu and
Demirgunes, 2008; Falope and Ajilore, 2009; Sen and Oruc, 2009; Dong and Su, 2010;
Gill et al., 2010; Raheman et al., 2010; Alipour, 2011; Hayajneh and Yassine, 2011;
Karaduman et al., 2011; Stephen and Elvis, 2011). Hypothesis H4 is therefore is not
supported by the data.
7.4.1.2 Control Variables
I. Corporate Governance
With respect of the corporate governance control variables, the study found a significantly
positive relationship between CEO tenure and ROA in all the four models. This supports
hypothesis H9 of chapter six that all things being equal, there is a positive association
between CEO tenure and profitability as found by Agrawal and Knoeber (1996). This
suggests that longer tenured CEO leads companies to higher profitability. This result
170
contradicts studies of (Lorsch and MacIver, 1989; Coles et al., 2001). However, the study
also found a significantly positive relationship between company board size (b= 0.028,
p<0.01) and ROA in model 2. This finding supports H10 of chapter six that all things being
equal, there is a significantly negative relationship between company board size and
profitability. This confirms the findings of Uadiale (2010); Mangena et al. (2012); Kajola
et al. (2008) but contradicts previous studies of (e.g., Lipton and Lorsch, 1992; Yermack,
1996; Eisenberg et al., 1998). However, the study did not find any significant relationship
between company board size and ROA in the rest of the models.
II. Company Characteristics
In order to determine the relationship between working capital management and
profitability, the study also introduces the effect of company characteristics as control
variables. These variables have been introduced and found significant in estimating the
relationship. They include company size, financial leverage, assets tangibility liquidity
ratio and cash flow and sales growth. The study found a significantly negative relationship
between company size and profitability in all the models (model 1, b = -0.199 p< 0.01;
model 2, b = -0.271 p< 0.01; model 3, b = -0.209 p< 0.01 and model 4, b = -0.233 p<
0.01). This finding confirms hypothesis H11 of chapter six that all thing being equal, there
is a significantly negative relationship between company size and profitability. The
evidence supports previous studies (Hansen and Wernerfelt (1989) that larger companies
tend to be more profitable than smaller companies. This association can be pinned on the
fact that larger companies benefit from economies of scale and therefore improves ROA
(Singh and Whittington, 1975; Serrasqueiro and Nunes, 2008).
In terms of assets tangibility, the study found a significantly negative relationship between
asset tangibility and ROA in all the models (model 1, b = -0.001 p< 0.01; model 2, b = -
171
0.001 p< 0.01; model 3, b = -0.001 p< 0.01and model 4, b = -0.001 p< 0.01), which shows
that higher proportion of tangible fixed assets leads to reduced ROA. This finding confirms
hypothesis H12 of chapter six that all thing being equal, there is a significantly negative
relationship between company size and profitability. These findings are consistent with the
result of a study by Raheman and Nasr (2007) that also found a negative and significant
association between asset tangibility and ROA. However, the study only found a
significantly positive relationship between financial leverage (b = 0.009 p< 0.01) and ROA
in model 2. On the basis of this evidence, the study suggests that firms with higher
leverage tend to have a higher profitability. The evidence supports the study’s hypothesis
H13 and the findings of Bothwell et al. (1984) and Tirta (2006). On the other hand, the
study did not find any significant relationship between financial leverage and ROA in the
rest of the models in Table 9. The study also found a significantly negative relationship
between liquidity ratio and ROA in all the models (model 1, b = -0.063 p< 0.01; model 2, b
= -0.041 p< 0.01; model 3, b = -0.065 p< 0.01 and model 4, b = -0.058 p< 0.01), which
supports hypothesis H14 of chapter six, that there is a significantly negative relationship
between liquidity ratio and profitability. This supports the argument by Hvide and Moen
(2007); Ng and Baek (2007) that a high liquidity may hinder a company’s profitability. It
also confirms empirical evidence of Tauringana and Afrifa (2013). Finally, the results of
the control variables in Table 9 also show that company’s cash flow is significant and
positively related to ROA in all the models (model 1, b = 0.017 p< 0.01; model 2, b =
0.019 p< 0.01; model 3, b = 0.017 p< 0.01and model 4, b = 0.018 p< 0.01), consistent
with H15 of chapter and previous studies of Autukaite and Molay (2011). Therefore the
study suggest that the availability of cash flow may lead to higher profitability as firms are
also able to reduce their transactional cost of paying bills according to Ferris (1981).
172
SGRTH is not significant in all the models. Therefore, H16 is not supported by the data of
the study.
7.5 DISCUSSION
The evidence presented in this chapter suggests a significantly negative relationship
between WCM (CCC) and profitability as found by most studies (Garcia-Teruel and
Martinez-Solano, 2007; Sen and Oruc, 2009; Dong and Su, 2010). Evidence from the study
supports the traditional belief that reducing working capital investment would positively
affect the profitability of firm (aggressive policy) by reducing proportion of current assets
in total assets (Garcia-Teruel and Martinez-Solano, 2007). It confirms the argument made
by Nobanee (2009) that profitable firms are able to quickly recover their receipts from
credit sales quickly whiles quick in their cash disbursements in order to earn high discounts
for early payment. It has also been argued that firms with a shorter cash conversion cycle
are able to maximise profitability due to their ability to internally generate funds, which
could reduce their reliance on external finance, which often tends to be expensive
(Autukaite and Molay, 2011; Banos-Caballero et al., 2013).
On the other hand, the study found a significantly negative relationship between accounts
receivable (AR) and profitability. This evidence is consistent with studies of Deloof
(2003); Lazaridis and Tryfonidis (2006); Padachi (2006); Garcia-Teruel and Martinez-
Solano (2007) that a lower accounts receivable period improves companies’ profitability
because it frees up cash which could be used to make payment of bills on time in order to
enjoy early payment discounts and also helps the company to avoid the costly need of
borrowing to fund investment in customers.
The study also found a significantly positive relation between accounts payable (AP) days
and profitability. This suggests that firms could improve their profitability through early
173
payments as they are able to earn high discounts for early payment. Ng et al. (1999) argued
that firms that wait longer before settling their supplies often tend to lose discount for early
payment. This sometimes affects their profitability as the amount of cash discount can
sometimes be substantial leading to some firms facing a high opportunity cost due to the
loss of discount and the high inherent cost involved in credit period. Delaying payments
also involves bearing the cost of charge interest for late payment which may have negative
effects on profitability and liquidity because of debt defaults (Cheng and Pike, 2003). Also,
it may lead the buyer to incur some additional administrative costs such as insurance cost
and cost of warehousing (Mian and Smith, 1992), because of costly credit management
activity (Martinez-Sola et al., 2013) which negatively affects the firms’ profitability.
However, the study did not find any significant relation between inventory holding period
(INV) and profitability. On the basis of the above evidence the study concludes that WCM
and two its components (AR and AP) have significantly relationship with profitability as
determine by most previous studies.
Under the control variables, the study found a significant relationship between corporate
governance factors (Chief Executive Officer (CEO) tenure and board size) and
profitability, evidence from the study found a significantly positive relation between CEO
tenure and profitability which supports Kyereboah-Coleman (2007b) that since CEOs
continue to accumulate task knowledge and also sharpen their leadership skills with time,
longer tenured CEOs are motivated to improve profitability. The study also found a
significantly negative relationship between company board size and profitability. This
finding confirms the findings of Uadiale (2010), Mangena et al. (2013) and Kajola et al.
(2008) that companies with larger board size tend to be more profitable.
Furthermore, the results also suggests that a significantly negative relationship between
company size and profitability. The evidence supports previous studies Yang and Chen

174
(2009) that larger companies tend to be more profitable than smaller companies. This
finding supports the argument that larger companies can improve profitability because of
their reduced operating costs and costs of innovation (Serrasqueiro and Nunes, 2008;
Hardwick, 1997). In terms of assets tangibility, the study found a significantly negative
relationship between asset tangibility and ROA. These findings are consistent with the
result of a study by Raheman and Nasr (2007). However, the study only found a
significantly positive relationship between financial leverage and profitability. On the basis
of this evidence, the study suggests that firms with higher leverage tend to have a higher
profitability. The study also found a significantly negative relationship between liquidity
ratio and ROA which supports the argument of Hvide and Moen (2007) that a high
liquidity may hinder a company’s profitability. Finally, the results of the study also show
that company’s cash flow is significant and positively related to ROA. Therefore the study
suggest that the availability of cash flow may lead to higher profitability as firms are also
able to reduce their transactional cost of paying bills according to Ferris (1981).
Based on these contrasting effects of WCM and its components on firm profitability; and
the impact of corporate governance and firms characteristics on profitability, it can be
argued that the relationship between WCM and firm profitability may not be linear as
previously suggested (see, Jose et al., 1996; Shin and Soenen, 1998; Wang, 2002; Garcia-
Teruel and Martinez-Solano, 2007). Its impact might be caused by multiple factors within
and outside the firm.
7.6 SUMMARY AND CONCLUSION
This chapter presented empirical results on the relationship between working capital
management and profitability as examined by most previous studies. Its objective was to
isolate the impact of working capital management and its components on profitability in

175
order to determine if the impact may be caused by multiple contingent factors as postulated
by the contingency framework. It incorporates other control variables found relevant by
previous studies to influence the relationship between WCM and its components (AR, AP
and INV) on profitability. The rest of the chapter was structured as follows. Section 7.2
provided descriptive statistics of the study. Section 7.3 presented the correlation analysis.
Section 7.4 discussed the multiple regression results whilst a final discussion was
presented in 7.5. A final summary and conclusion of the chapter was summary in section
7.6.
176
8 CHAPTER EIGHT
THE RELATIONSHIP BETWEEN WORKING CAPITAL MANAGEMENT, ITS
COMPONENTS AND PROFITABLITY: THE CONTINGENCY THEORY
APPROACH
8.1 INTRODUCTION
This chapter presents empirical results of the study on the relationship between working
capital management and profitability using the contingency theory framework. Its
objective is to investigate whether the relationship between working capital management,
its components (AR, AP and INV) and profitability is constrained by the interaction of
contingent factors (environmental (E), resource (R) and management (M)) factors of the
firm as postulated by the contingency framework in chapter five. The rest of the chapter is
structured as follows. Section 8.2 presents empirical analysis on the relationship between
working capital, contingency variables and profitability. Section 8.3 provides a discussion
on the findings on the relationship between working capital, contingency variables and
profitability. Section 8.4 presents the robust test whist a final conclusion on the chapter is
presented in section 8.5.
8.2 WORKING CAPITAL MANAGEMENT, CONTINGENCY VARIABLES
AND PROFITABILITY
Evidence on the relationship between working capital, its contingencies and profitability is
presented in Table 10. The study interacted each component of working capital with
environmental (E), resource (R) and management (M) variables as postulated by the
contingency theory. Their coefficients should not significantly differ from model 1, 2, 3
and 4. The sum of the coefficient of WCM (CCC) and its components (AR, AP and INV)

177
and their interactive term (CCC*ERM, AR*ERM, AP*ERM and INV*ERM) reflects the
total effect of WCM and its components after interaction (see Mangena et al., 2012; and
Darnel, 2009).

178
Table 10
Working Capital Management, Its Contingencies and Profitability
This table presents results of the following panel data regression on the relationship between working capital, its
contingencies and profitability: . Where:
is the dependent variable which is measured using return on assets (ROA); X variables include cash
conversion cycle (CCC), accounts payable in days (AP), accounts receivable in days (AR), inventory held in days (INV).
Z represents control variables that may influence companies’ profitability. These variables are divided into two: corporate
governance variables and company characteristics variables. Chief Executive Officer (CEO) tenure (TENURE), board
size (BODSIZE), while company specific characteristics variables include: company size (FIRMSIZE), financial leverage
(LEV), liquidity ratio (CR), sales growth (SGRWTH), industry classification (INDUST) are include but not reported, cash
flow (CFL). XZ represents the interactive term (environmental, resource and management variables) with the main
variables of working capital management. CERM, ARERM, APERM and INVERM denotes the interaction of
environmental resource and management variables with cash conversion cycle accounts receivables accounts payables
and inventory days held respectively. Environmental variables are proxy by industry classification, resource variable
proxy by cash flow and management proxy by board size. is the unobserved company effects (fixed effects) and the idiosyncratic shocks and are vectors of the parameters to be estimated. The subscript i denotes the nth company
(i = 1... 225), and the subscript t denotes the tth
year (t=1,...11). Regressions are estimated with individual random effects.
RETURN ON ASSETS (ROA) RETURN ON ASSETS (ROA)
Model 5 Model 6 Model 7 Model 8
CCC -0.375***
(-7.55)
AR -0.524***
(-9.71)
AP 0.051
(-1.54)
INV -0.242***
(-5.62)
CCC*ERM
0.643***
(7.33)
AR*ERM
0.634***
(8.04)
APD*ERM
INV*ERM
0.460***
(7.05)
0.644***
(8.07)
TENURE 0.019***
(2.90)
0.016**
(2.28)
0.020***
(3.10)
0.011
(1.62)
FIRMSIZE -0.262***
(-7.36)
-0.332***
(-8.89)
-0.268***
(-7.55)
-0.230***
(-5.53)
LEV 0.013***
(3.16)
0.018***
(4.71)
0.009**
(2.63)
0.012**
(2.81)
CR -0.054**
(-3.40)
-0.039***
(-1.73)
-0.065***
(-5.27)
-0.024
(-0.84)
ATAN -0.001***
(-6.65)
-0.001***
(-8.73)
-0.001***
(-5.88)
-0.001***
(-5.21)
SGRWTH 0.001
(0.42)
0.006
(1.28)
0.002
(0.42)
0.003
(0.55)
Constant -2.869***
(-9.61)
-1.984***
(-5.82)
-1.781***
(-5.97)
-3.105***
(-10.87)
E Included Included Included Included
R -0.022***
(-3.91)
-0.024***
(-3.51)
-0.022***
(-3.86)
-0.010
(-1.83)
M -0.057***
(-4.49)
-0.041**
(-3.06)
-0.055***
(-4.51)
-0.041***
(-3.22)
Individual (RE) Yes Yes Yes Yes
Observations 2475 2475 2475 2475
R-SQ 16 19 18 12
Akaike Test 6396 4968 6303 5796
Total Effect 0.402 0.268 0.11 0.409
Standard errors clustered at firm level in parentheses. ∗∗∗1%, ∗∗5%, and ∗10% significance; t-statistics are in parentheses.

179
The study expects both the coefficients of the interaction terms and the sum of the
coefficients of the individual variables and their interaction terms to be positive and
significant (see also Coles et al., 2008).
8.2.1 Working Capital Management Variables
Table 10 shows regression results of the relationship between working capital
management, its contingencies and profitability. Results of model 5 and model 6 confirm
similar results of model 1 and model 2 of table 9. The study found a significantly negative
relationship between CCC (b=-0.375, p<0.01) and ROA; accounts receivable (AR) (b=-
0.524, p<0.01) and ROA. These results are consistent with studies of with Garcia-Teruel
and Martinez-Solano (2007); Falope and Ajilore (2009). On the other hand, the study
rather found an insignificant relationship between accounts payables (AP) (b=-0.051,
p>0.1) and ROA. It also found a significantly negative relationship between inventory day
holding (INV) period and ROA. This finding was found to be insignificant in model 4 of
Table 9.
8.2.1.1 Cash Conversion Cycle, Contingent Variables and Profitability
The study also documented that, the coefficient of the interactive term (CCC*ERM) is
significant and positive at the 1% level or better. This finding is consistent with hypothesis
H5. It also found that the coefficient of the interaction term (b=0.643) and the total effect
are positive and significant (b = 0.268, p<0.01) as recommended by Coles, et al. (2008).
Therefore the interaction of environmental, resources and management factors significantly
moderates the relationship between cash conversion cycle and profitability.
180
8.2.1.2 Accounts Receivables, Contingent Variables and Profitability
Evidence results of Model 6 from Table 10 also reveals a significantly positive (b = 0.634,
p< 0.01) relationship between accounts receivables, the interactive term (AR *ERM) and
ROA. This result is consistent with hypothesis H6, that all other things being equal the
interaction of environmental, resources and management factors significantly moderates
the relationship between account receivables and profitability. The models’ coefficient of
the interaction term (b=0.643) and the total effect are positive and significant (b = 0.11,
p<0.01) as predicted. On the basis of this evidence, the study suggests that environmental,
resources and management factors significantly moderates the relationship between
accounts receivable and profitability.
8.2.1.3 Accounts Payables, Contingency Variables and Profitability
In terms of accounts payables, the study documented significant relationship at 1% level of
significance between interactive term (AP*ERM) and profitability. The findings also
confirm hypothesis H7 that the interaction of environmental, resources and management
factors significantly moderates the relationship between accounts payables and
profitability. The predicted coefficient of the interaction term (b=0.460) and the total effect
are positive and significant (b = 0.409, p<0.01) as recommended by Coles et al. (2008).
8.2.1.4 Inventory Holding Period, Contingent Variables and Profitability
The relationship between interactive term (INV*ERM) of INV and profitability is also
significant at 1% level of significance and hence confirms our hypothesis H8 that the
interaction of environmental, resources and management factors significantly moderates
the relationship between inventory holding period and profitability. The study also found a
positive and significant the predicted coefficient of the interaction term (b=0.644) and the
total effect are positive and significant (b = 0.402, p<0.01). On the basis of this finding the
181
study suggests that the interaction of environmental, resources and management factors
significantly moderates the relationship between inventory holding period and profitability.
8.2.2 Control Variables
For the control variables, the study found most of them to remain similar to those of Table
8.3 although some of them have their level of significance and signs change.
8.2.2.1 Corporate governance
The study found a significantly positive relationship between CEO tenure and ROA in all
the models except model 7.
8.2.2.2 Company Characteristics
Compared to Table 9 of chapter 7, results of table 10 also found a significantly negative
relationship between company size and profitability in all the models. Results of table 10
also confirm the results of table 9 and that of Raheman and Nasr (2007) that there is a
significantly negative association between asset tangibility and ROA. Unlike table 9 which
only found a significantly positive relationship between financial leverage and ROA in
model 1, results on table 10 found a significantly positive relationship between financial
leverage and profitability in all the models. The study also found a significantly negative
relationship between liquidity ratio and ROA in all the models except model 8. Like results
of table 9, results of Table 10 did not find any significantly relationship between sales
growth and profitability in all the models.
8.3 DISCUSSION
The study adopts the contingency theory approach to determine the relationship between
working capital management and profitability. This is evident in the fact there may be a
non-linear relationship between WCM and firm profitability due to the contrasting results

182
found in chapter six. Supported by the contingency theory which suggests that firms
change their policies over time to adjust to the demands of their environment (Ambrosini et
al., 2009; Rueda-Manzanares et al., 2008), their resource (Mol and Wijnberg, 2011) and
management capabilities (Luo et al., 2013). Such an adjustment positively affects the
firms’ profitability. For instance, the degree of concentration in an industry, determines
firm behavior and profitability. This is because higher concentration enables collusion
between firms which leads to higher profits. According to Porter (1980), industrial
characteristics such as industry concentration often results in barriers to entry for new
firms and enables established firms to share industry profits among themselves. Therefore,
firms need to adjust their policies to meet the demands of their environment within which
they operate.
According Peteraf (1993), profitability differentials are produced by resource heterogeneity
among competing firms. According to the resource based value of the firm, firm’s unique
resources accumulated over time are difficult and costly to emulate, as a result they
contribute to superior profitability for firms (Demsetz, 1973). Grant (1991) identified
financial resources such as cash flow as some of the key profitability related resources of
the firm. Companies with available cash flow may take advantage of the cash to make bulk
purchases which may reduce the procurement cost of production. The bulk purchase cost
savings will also result in a decrease in the cost of sales of the product, which will reduce
the overall price of the product leading to more profitability (Ng et al., 1999; Wilner 2000).
The availability of cash flow may also increase the firm’s profitability by reducing the
transaction costs of raising funds (Peterson and Rajan, 1997). Moreover it has also been
suggested that a firm’s profitability depends on its conduct in matters such as its
management policy, which also depends on the industrial structural characteristics,
stakeholders and size (Spanos, Zaralis, and Liouks, 2004; Darnall, 2009).

183
Against this evidence, the study suggests that the impact of working capital management
on firms’ profitability needs to be understood in the context of firm-specific characteristics
which are classified as environmental, resource and management factors by Luthans and
Steward (1977). This will help identify the conditions under which firms are more effective
as decision-making groups and which contingencies enhance or constrain firms’ ability to
enhance profitability through investment in working capital. As a result, the study
interacted WCM and its components (AR, AP and INV) with the three key contingent
variables (environment (E), resources(R) and management (M)) as postulated by
contingency theory. The results suggest that all the four interactive variables are
significantly positive associated with profitability. When compared to the results of the
regression models without the three key contingent variables (environment, resources and
management) as postulated by contingency theory in chapter six, the study found the
inclusion of the interactive models in chapter seven better explains the relationship
between WCM and profitability.
Evidence of the akaike test criteria suggests results of Table 10 to have lowest (arithmetic)
value as compared to those of Table 9. Also, results of the total effect of each of the
models were estimated by taking the first derivative of the each of the regression functions.
Evidence from the total effect estimation and R-square confirm results of Table 10 to be
the best fit models in explaining the relationship between working capital management and
profitability. On the basis of this evidence the study concludes that working capital
management has an indirect effect on profitability. Its impact is constrained and modified
by organisational contingencies (environment, resources and management factors) of the
firm. Therefore firms must align their working capital management policies with their
environment and also arrange their resources internally to support such alignment as
postulated in the contingency framework as any misalignment could significantly affect the

184
firms’ profitability (Miles and Snow, 1978). As a result, it suggests the need for policy
makers to match organisational resources with opportunities and threats in the general
business environment (Andrews, 1971; Miller & Friesen, 1983) in order to improve their
financial performance.
Importantly, any misalignment can significantly affect firm performance (Miles and Snow,
1978). As a result, it suggests the need for firms to introduce policies that are appropriate
to their organisation ’s own resources to face the opportunities and threats that exist in the
general business environment in order to improve their financial performance. For
instance, in an environmental with high uncertainty, firms with defender strategy such as
an aggressive working capital where firms strive to reduce their investment in working
capital (Deloof, 2003) could potentially face a misfit as a defender strategy works well in
a more certain and stable environment (Miles and Snow, 1978). According to Bhattacharya
(2008) firms could better achieve the objective of tighten their receivables during periods
of stable demand and high sales (Long et al., 1993) and vice versa. On the other hand, Paul
and Boden (2008) suggested that during recessions and other periods of financial distress
firms witness a high demand for trade this is because failing and financially distressed
firms tend to supply more credit as a means of trying to secure sales and take more credit
from the supply–based as bank credit (Wilson, 2008). Therefore a firm aiming at boosting
sales and profitability in such an environment could focus more investment in working
capital (conservative policy).
Also the working capital policy pursued by the firm to enhance profitability could also
depend on the management structure. Burton et al. (2000) suggested that a highly
centralised company operating in a highly uncertain business environment is likely to face
a potential misfit due to the level of information and decision overload on top
management. Therefore Burton et al. (2000) argues that in order for companies not to

185
suffer from information and decision overload in a highly uncertain business environment,
large companies need to have a highly decentralized management structure with a large
composition. According to Lehn et al. (2004), larger boards have the advantage of enjoying
a large amount of collective information which is also valuable for the monitoring function
of the board. Such information may include the credit profiles of customers and their daily
business operations. This helps to reduce the level of credit default among customers.
Goodstein et al. (1994) suggested that the diversity of specialisation at the board could help
companies to secure critical resources and also reduce environmental uncertainties. This
helps reduce the level of information asymmetry between the buyer and the seller which
often results in customers wanting more time to assess the quality of products before they
buy (Deloof, 2003). Furthermore, it makes it easier to create committees within the
company for the effective execution of duties and responsibilities (Bathula, 2008). These
communities are able to sub-divide the duties and responsibilities on the lines of
specialisation and expertise so as to ensure effectiveness and efficiency, which may
maximise profitability for the firm.
Finally, firms’ working capital policy needs to be support by their unique resources in
order to enhance their profitability. Evidence (e.g., Banos-Caballero et al., 2013) suggests
that firms with higher financial resources such as cash flow increase their investment in
working capital, which leads to higher profitability. Cash flow holdings constraints firms’
investment in working capital (Banos-Caballero et al., 2013) in terms of its inventory or
decision to extend more credit given there may be a limit in terms of how much inventory
it can buy on credit and also how much trade credit it can ask from suppliers. Therefore
firms with a positive cash flow holding are able to increase profitability through
investment in working capital. In an event of cash flow unavailability firms strive to reduce
186
the investment in working capital (Banos-Caballero et al., 2013) in order to improve
profitability.
8.4 ROBUSTNESS TESTS
To enhance the robustness of the results, further analysis on the relationship between
working capital management and profitability was estimated. This allows the justification
of the argument made by Hill et al. (2010) that investment in working capital depends on
internal financing resources of the firms. Following Baños-Caballero et al. (2013) the study
divided the sample into two groups, based on the median cash flow value. Thus, firms with
a cash flow above the sample median are assumed to have high available cash flow, whiles
those below the sample median are assumed to suffer from a lack of cash flow (Baños-
Caballero et al., 2013). The rational for the choice of firms’ cash flow is driven from the
argument of Moyen (2004) and Baños-Caballero et al. (2013) that; firms’ investment in
working capital management is sensitive to cash flow constraints. Firms with limited cash
flow strive to reduce investment in working capital so as to avoid the need for expensive
external finance whiles those with available internal cash flow increase investment in
working capital in order to maximise profitability.
The Akaike criterion (AIC) was used as a decision criterion for the model of best fit. The
study expects the variables to be more associated with financially constrained firms than
non-financially constrained firms. The results are reported in table 11 and 12. Results from
table 11 and 12 confirm that the variables are more associated with financially constrained
firms since they have the lowest (arithmetic) AIC values.
In order to provide a further analysis on the relationship between working capital
management and profitability, equation 1 in chapter five is extended into equation 3 by
incorporating a dummy variable that distinguishes between firms more likely to face

187
financing constraints and those that are less likely according to the different classifications
commented above. The study proposes the following specification:
(3)
Where:
PROFITABILITY is the dependent variable which is measured using return on assets
(ROA); X variables include cash conversion cycle (CCC), accounts payable in days (AP),
accounts receivable in days (AR), inventory held in days (INV). DFC is a dummy variable
that takes a value of 0 for firms more financially constrained, and 1 otherwise. Z represents
control variables (firm size, cash flow, gearing, assets tangibility, tenure, sales growth and
industry) that may influence companies’ profitability. XZ represents the interactive term
(environmental, resource and management variables) with the main variables of working
capital management. is the unobserved company effects (fixed effects) and the
idiosyncratic shocks and are vectors of the parameters to be estimated.
Measures working capital investment of more constraint firms, measure the optimal
working capital for less financially constraint firms. The subscript i denotes the nth
company (i = 1,... 225), and the subscript t denotes the tth
year (t=1,...11).
8.4.1 Working capital management and profitability using cash flow constraint as a
criterion
In this section the study introduces the dummy variable for financial constraint into the
model to determine if the investment in working capital by firms to enhance profitability is
positively influenced by internal financing capacity of the firms. The importance of cash
flow to firm profitability is evident from the amounts that are kept by companies. For
188
example, research by Guney et al. (2003) found that British firms on average hold 10.3%
of their total assets in cash. The availability of cash flow will have an influence on the
relationship between WCM and profitability of companies. Research has shown that
availability of cash flow leads to higher investment in working capital (Hill et al. 2010;
Baños-Caballero et al. 2013). Baños-Caballero et al. (2010) found that while the cost of
financing negatively affects firms’ working capital, better access to capital markets
increases the investment in this. The availability of cash flow may lead to an increase in
the investment of inventory, which will increase the overall CCC of a company. A
company with available cash flow may take advantage and make bulk purchases, so
reducing the procurement cost of production, and cost of sales of the product, which will in
tend reduce the overall price of the product, enhancing profitability. The cost savings of
bulk purchase may arise through quantity discounts from the supplier, reduced
transportation costs (through making fewer trips to collect the supplies, or requiring fewer
deliveries), and lower administrative costs (e.g. of placing and processing orders).
An increase in investment in inventory will help avoid the prospect of stockout (Christiano
and Fitzgerald 1989; Wen 2003). Stockout has a catastrophic effect on a company’s
profitability through losing goodwill (Bhattacharya 2008), and driving both current and
potential customers away to competitors. This will affect not only the current but also the
future profitability of the company.
The availability of cash flow may also lead to increased investment in accounts receivable,
leading to higher profitability. A company with available cash flow may be in a better
position to offer generous credit to customers, giving them time to verify the quality of the
product before paying (Smith 1987; Long et al. 1993; Danielson and Scott 2000). This is
especially useful for new customers, who do not have experience of the product quality.
Product guarantee facilitates future purchases (Bastos and Pindado 2007).

189
The availability of cash flow may also increase the investment in working capital by
reducing the accounts payable period. A company with sufficient cash flow may take
advantage of suppliers’ cash discounts by paying immediately for supplies (Baños-
Caballero et al. 2010); these discounts can be substantial (Ng et al. 1999). The decision to
accept or request a credit period results in an inherent cost to a company, which diminishes
profitability. Research by Ng et al. (1999) indicated that the combination of a 2% discount
for payment within 10 days of receiving supplies and a net period of 30 days’ credit
implies an annualised interest rate of 43.9%. Therefore, the high cost inherently associated
with the credit period will cause a reduction in profitability. This means that the
availability of cash flow may help companies to improve their profitability by paying for
supplies on time. Evidence of the analysis is presented in table 11. Evidence of the analysis
is presented in table 11.
8.4.1.1 Financial Distress
The results of Table 11 present evidence of the relationship between financial distressed
and profitability (ROA). The study found a significantly negative relationship between
financial distress and ROA in all the models. Therefore the more financially distressed
firms are, the less profitable they become. Less constraint firms tend to have adequate cash
flow which is often used to increase their investment in working capital in order to
improve profitability. Such evidence justifies the assertion that internally generated funds
and access to external financing have an impact on firms’ working capital decisions
(Baños-Caballero et al. 2010; Autukaite and Molay 2011; Baños-Caballero et al. 2013).
Comparing the akaike test criteria and the r-square for the best fitted model to explain the
relationship, it is found that the interactive models (model 5 – 8) have the lowest akaike
test criteria values and high r-square values than those models without the interactive
effect (model 1 – 4). Therefore within the context of financial distress, the interaction of

190
environmental resource and management factors of the firms significantly estimate the
relationship between working capital management and profitability. This result confirms
the findings reported in table 9 and 10.
8.4.1.2 Cash Conversion Cycle
The study also found a significantly negative relationship between cash conversion cycle
and profitability in both model 1 (b= -0.191, p<0.01) and model 5 (b= -0.363, p<0.01) of
table 11. This means that the management of cash conversion cycle affect profitability of
firms. Evidence from the study supports the argument that firms that have lower cash
conversion cycle tend to have a higher profitability. The study therefore supports Nobanee
(2009) argument that profitable firms are able to quickly to convert their inventory into
sales and able to recover receipts from credit sales quickly whiles slowing down their cash
disbursements. This finding is consistent with that of table 9. In terms of the interactive
term, the study also found a significantly positive relationship between the interactive term
CCC*ERM) and profitability. This finding is consistent with hypothesis H5 that the
interaction of environmental, resources and management factors significantly moderates
the relationship between cash conversion cycle and profitability. However, with lower
akaike test values and high r-square values, the study finds the interactive term models (5,
6, 7 and 8) to better explain the relationship between cash conversion cycle and
profitability which also consistent with results of Table 9.
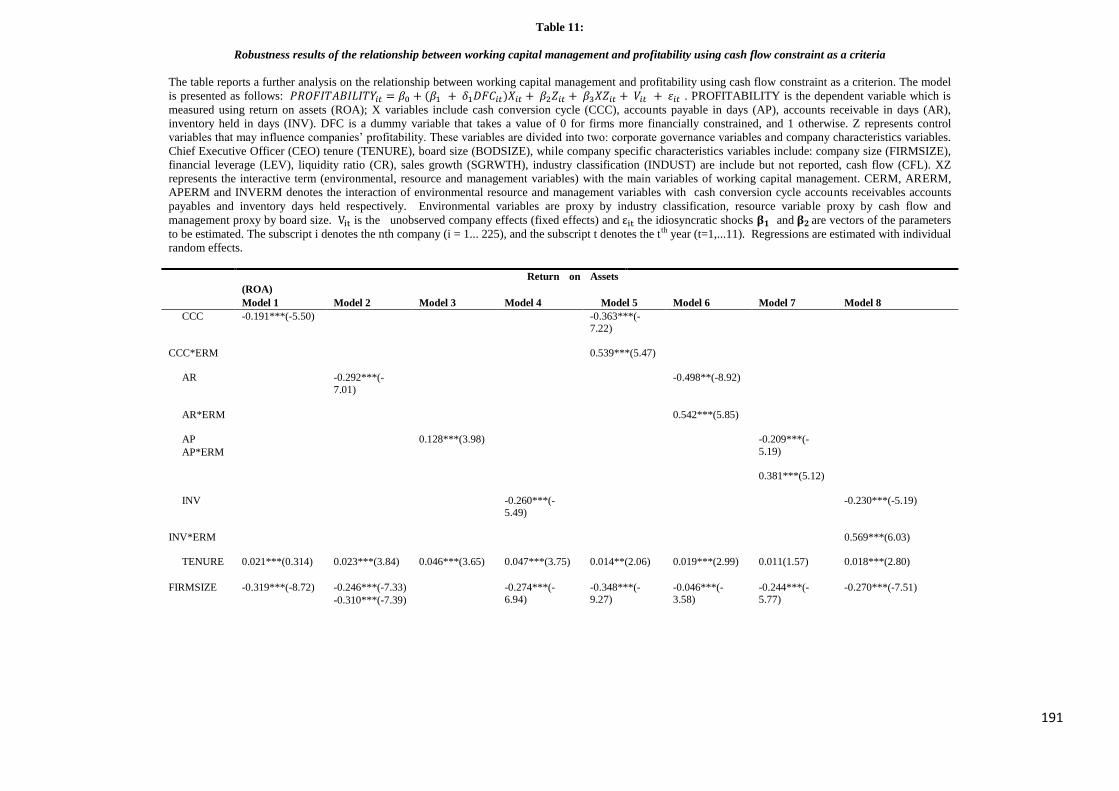
191
Table 11:
Robustness results of the relationship between working capital management and profitability using cash flow constraint as a criteria
The table reports a further analysis on the relationship between working capital management and profitability using cash flow constraint as a criterion. The model
is presented as follows: . PROFITABILITY is the dependent variable which is
measured using return on assets (ROA); X variables include cash conversion cycle (CCC), accounts payable in days (AP), accounts receivable in days (AR),
inventory held in days (INV). DFC is a dummy variable that takes a value of 0 for firms more financially constrained, and 1 otherwise. Z represents control
variables that may influence companies’ profitability. These variables are divided into two: corporate governance variables and company characteristics variables.
Chief Executive Officer (CEO) tenure (TENURE), board size (BODSIZE), while company specific characteristics variables include: company size (FIRMSIZE),
financial leverage (LEV), liquidity ratio (CR), sales growth (SGRWTH), industry classification (INDUST) are include but not reported, cash flow (CFL). XZ
represents the interactive term (environmental, resource and management variables) with the main variables of working capital management. CERM, ARERM,
APERM and INVERM denotes the interaction of environmental resource and management variables with cash conversion cycle accounts receivables accounts
payables and inventory days held respectively. Environmental variables are proxy by industry classification, resource variable proxy by cash flow and
management proxy by board size. is the unobserved company effects (fixed effects) and the idiosyncratic shocks and are vectors of the parameters
to be estimated. The subscript i denotes the nth company (i = 1... 225), and the subscript t denotes the t th year (t=1,...11). Regressions are estimated with individual
random effects.
Return on Assets
(ROA)
Model 1 Model 2 Model 3 Model 4 Model 5 Model 6 Model 7 Model 8
CCC -0.191***(-5.50)
-0.363***(-7.22)
CCC*ERM 0.539***(5.47)
AR -0.292***(-
7.01)
-0.498**(-8.92)
AR*ERM 0.542***(5.85)
AP
AP*ERM
0.128***(3.98)
-0.209***(-
5.19)
0.381***(5.12)
INV
-0.260***(-5.49)
-0.230***(-5.19)
INV*ERM
0.569***(6.03)
TENURE 0.021***(0.314)
0.023***(3.84)
0.046***(3.65) 0.047***(3.75)
0.014**(2.06)
0.019***(2.99)
0.011(1.57)
0.018***(2.80)
FIRMSIZE -0.319***(-8.72)
-0.246***(-7.33)
-0.310***(-7.39)
-0.274***(-6.94)
-0.348***(-9.27)
-0.046***(-3.58)
-0.244***(-5.77)
-0.270***(-7.51)
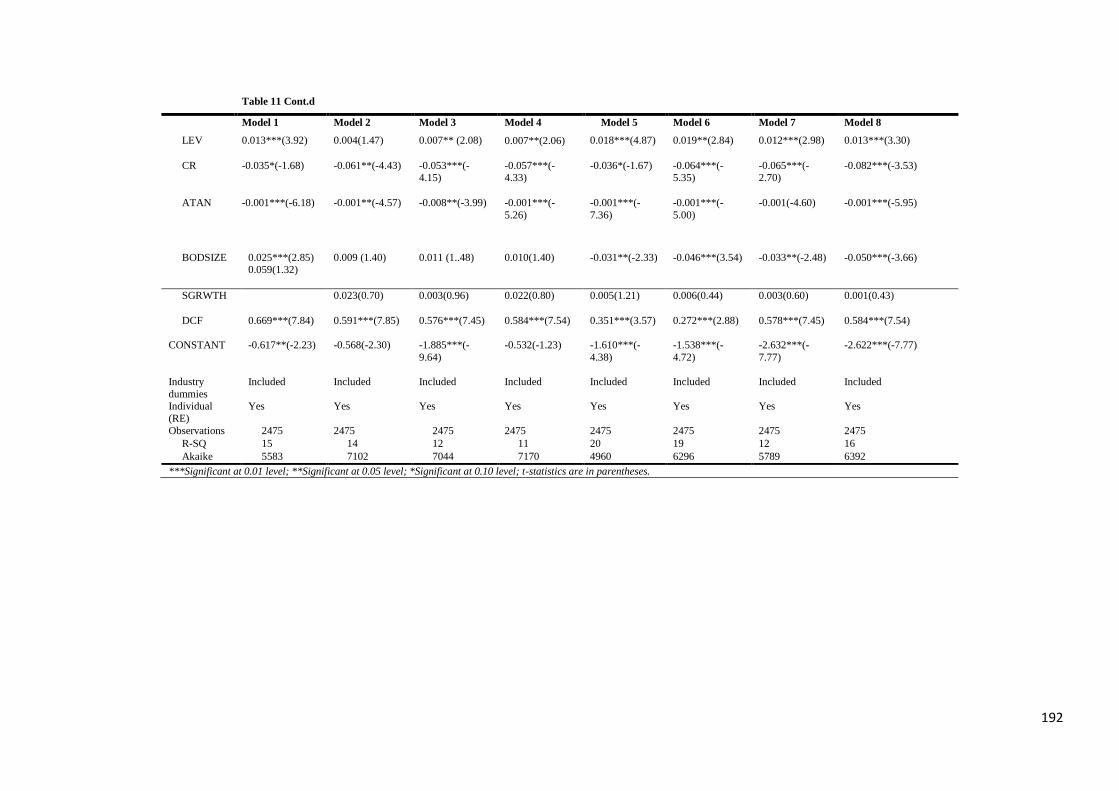
192
Table 11 Cont.d
Model 1 Model 2 Model 3 Model 4 Model 5 Model 6 Model 7 Model 8
LEV 0.013***(3.92)
0.004(1.47)
0.007** (2.08)
0.007**(2.06)
0.018***(4.87)
0.019**(2.84)
0.012***(2.98)
0.013***(3.30)
CR -0.035*(-1.68)
-0.061**(-4.43)
-0.053***(-4.15)
-0.057***(-4.33)
-0.036*(-1.67)
-0.064***(-5.35)
-0.065***(-2.70)
-0.082***(-3.53)
ATAN -0.001***(-6.18)
-0.001**(-4.57)
-0.008**(-3.99)
-0.001***(-
5.26)
-0.001***(-
7.36)
-0.001***(-
5.00)
-0.001(-4.60)
-0.001***(-5.95)
BODSIZE 0.025***(2.85) 0.059(1.32)
0.009 (1.40)
0.011 (1..48)
0.010(1.40)
-0.031**(-2.33)
-0.046***(3.54)
-0.033**(-2.48)
-0.050***(-3.66)
SGRWTH 0.023(0.70)
0.003(0.96)
0.022(0.80)
0.005(1.21)
0.006(0.44)
0.003(0.60)
0.001(0.43)
DCF 0.669***(7.84)
0.591***(7.85)
0.576***(7.45)
0.584***(7.54)
0.351***(3.57)
0.272***(2.88)
0.578***(7.45)
0.584***(7.54)
CONSTANT -0.617**(-2.23)
-0.568(-2.30)
-1.885***(-
9.64)
-0.532(-1.23)
-1.610***(-
4.38)
-1.538***(-
4.72)
-2.632***(-
7.77)
-2.622***(-7.77)
Industry
dummies
Included Included Included Included Included Included Included Included
Individual
(RE)
Yes Yes Yes Yes Yes Yes Yes Yes
Observations 2475 2475 2475 2475 2475 2475 2475 2475
R-SQ 15 14 12 11 20 19 12 16
Akaike 5583 7102 7044 7170 4960 6296 5789 6392
***Significant at 0.01 level; **Significant at 0.05 level; *Significant at 0.10 level; t-statistics are in parentheses.
193
8.4.1.3 Accounts Receivables Period
Results of model 2 from Table 11 reveals a significantly negative relationship between
accounts receivable period and ROA in all the models (model 1 b = -0.292, p<0.01; model
6 b = -0.498, p<0.01). This suggest that by lowering the accounts relievable day period,
firms free up cash quickly to make payment of bills on time in order to enjoy early
payment discounts and also avoid the costly need of borrowing to fund investment in
customers (Martinez-Sola et al., 2013). This helps to improve their profitability. The study
also found a significantly positive relationship between the interactive term (AR*ERM)
and profitability. Comparing the akaike test criteria and the r-square for the best fitted
model to explain the relationship, it is found that the interactive models (model 5, 6, 7 and
8) have the lowest akaike test criteria and high r-square values than those models without
the interactive effect (model 1, 2, 3 and 4). This suggests that the interaction of
environmental, resources and management factors significantly moderates the relationship
between accounts receivables and profitability.
8.4.1.4 Accounts Payable Period
The coefficient of accounts payable period is significant and positively (b=0.128, p<0.01)
related to ROA at the 1 per cent level of significance in both. Therefore by delaying
payments firms could enhance their profitability when they take advantage and use
suppliers’ credit for working capital needs. However, in the interactive model (model 7),
the study rather found an insignificant relationship between the coefficient of accounts
payable (b=-0.208, p>0.1) and profitability. In terms of the coefficient of the interactive
effect (AP*ERM), they study found a significantly positive relationship between accounts
payable, its interactive and profitability. The results indicate that the environmental
resource and management factors positively moderate the relationship between working
194
capital and profitability since the interactive effect models lower akaike test values and
high r-square values than models (1, 2, 3 and 4).
8.4.1.5 Inventory Holding Period
The study also found the coefficient of inventory holding period to be negatively related
to ROA at the 1 per cent level of significance in both the direct and indirect models (model
4 and 8) respectively. Evidence from the study suggests that a firm’s profitability could be
reduced when it holds high amount of inventory. This is because maintaining a high level
of inventory represents amount of the companies’ money locked up on the inventory. This
may result in a sub-optimisation of financial resources as the opportunity cost of investing
the funds on profitable projects to enhance the firms’ profitability is forgone. The study
also found a significantly positive relationship between the coefficient of the interactive
term (b= 0.569, p<0.01) of inventory management, its contingencies in model 8 and
profitability. Comparing the akaike test criteria and the r-square for the best fitted model to
explain the relationship, it is found that the interactive models (model 5, 6, 7 and 8) have
the lowest akaike test criteria and high r-square values than those models without the
interactive effect (model 1, 2, 3 and 4). This evidence supports hypothesis H8 stated in
chapter six that the relationship between inventory holding period and profitability is
positively moderated by environmental, resource and management factors of the firm
195
8.5 CONCLUSION
The chapter presented empirical results on the relationship between working capital
management and profitability on a sample of 225 listed companies on the main market of
London Stock Exchange using the contingency theory approach. It adopted environmental,
resources and management factors of the firm as key contingency variables as suggested
by Luthans and Steward (1977). The study was structured into two main sections of which
three forms of control variables (corporate governance and company characteristics) were
incorporated to estimate the relationship.
In the first section, the study incorporated organisational contingencies (environmental,
resources and management factors) postulated in the contingency theory framework. In
order to achieve these two objectives, the study interacted the four measures of WCM
(CCC, AR, AP and INV) with the three key contingent variables (environment, resources
and management) as postulated by contingency theory. In the second section, the study
presented a robust test analysis on the relationship between working capital management
and profitability. The rational of this section was to demonstrate how the findings obtained
are robust to alternative empirical estimations. Following Baños-Caballero et al. (2013) the
study divided the sample into two groups, based on the median cash flow value. Thus,
firms with a cash flow above the sample median are assumed to have high available cash
flow, whiles those below the sample median are assumed to suffer from a lack of cash flow
(Baños-Caballero et al., 2013). The rational for the choice of firms’ cash flow is driven
from the argument of Moyen (2004) and Baños-Caballero et al. (2013) that; firms’
investment in working capital management is sensitive to cash flow constraints. Evidence
from the study confirms Hill et al. (2010) argument that financial capacity of the firms

196
positively influences company profitability. However it was found that results of the main
explanatory variables generally remain unchanged from that reported earlier. Based on the
akaike test criteria values and r-square values obtained from this estimation, the study
found that models that incorporated the interactive terms better explain the relationship
between working capital and profitability. The financial constraint company criteria
confirm that the firms’ environmental, resource and management factors significantly
moderate the relationship between working capital, its components and profitability.
Therefore, the study supports the argument of Baños-Caballero et al. (2013) that there
exists a non-linearity in the relationship between working capital management and
profitability. However in the study, it was found that working capital management has an
indirect effect on profitability. Its impact is constrained and modified by organisational
contingencies (environmental, resources and management factors) of the firm. Therefore
firms must align their working capital management policies with their environment and
also arrange their resources internally to support such an alignment as postulated in the
contingency framework. Importantly, any misalignment can significantly affect firm
profitability (Miles and Snow, 1978). As a result, it suggests the need for firms to introduce
policies that are appropriate to their organisation s’ own resources to face the opportunities
and threats that exist in the general business environment in order to improve their
financial performance.
197
9 CHAPTER NINE
SUMMARY AND CONCLUSION
9.1 INTRODUCTION
This chapter presents a summary and conclusion of the study. The section also provided a
discussion on some of the policy implications, limitations of the study and possible insight
for future research. The remainder of the chapter is organised as follows. Section 9.2
provides the research objective of the study. Section 9.3 presents a summary of the
methodology and research techniques adopted for the study. Section 9.4 summarise the
policy implication of the study. The contribution of the study is summarised in section 9.5.
In section 9.6, the study presents the main limitations of the study. Potential insight for
future research and improvements is presented in section 9.7.
9.2 RESEARCH OBJECTIVES
The focus of this study was to improve upon the understanding of the relationship between
working capital and profitability on a panel of 225 listed companies on the main market of
London stock exchange. The central hypothesis is that the interaction of environment,
resources and management variables (Luthans and Steward, 1977) helps to explain
differences in profitability among firms. This connects with the contingency theoretical
framework and other empirical research devoted to the analysis of working capital
management and profitability. The study also incorporated three main objectives in order
to further understand the dynamics of this relationship. These include:
1. Estimating the relationship between working capital management and its
components and profitability as per extant research.

198
2. Determining whether the effect of working capital management on profitability is
contingent on the interaction of environmental, resource and management variables
of UK firms.
3. Investigating whether the effect of the components of working capital management
(accounts payables in days, accounts receivables in days, and inventory held in
days) on profitability is contingent on the interaction of environmental, resource
and management variables of UK firms.
9.3 RESEARCH METHODOLOGY AND METHODS
The population for the study was taken from listed companies on the main market of
London Stock Exchange (LSE) for the period 2001 to 2011. The choice of the period was
guided by UK Late Payment of Commercial Debts (Interest) Act 1998 which was
subsequently amended to bring it into line with the EU Late 2002 Payment directive.
Against this backdrop, the study extends the research data to cover the entire period of the
old and new late payment legislation. In order to arrive at the final sample, the study
considers non-financial companies that have their financial statement covering the entire
period under consideration, which is from 1st of January 2000 to 31st of December 2011
inclusive. Non-financial firms were considered because financial companies have different
accounting regulations to non-financial companies (Deloof, 2003). Also financial services
firms’ financial characteristics and investment in working capital are largely different from
non-financial companies (Falope and Ajilore, 2009). The two criteria were necessary to
allow for easy comparability with similar studies and to permit the use of balanced panel
data, which has the advantage of more degrees of freedom and less multicollinearity
among variables (Gujarati, 2003). As a result of the strict application of these two criteria
the final sample was narrowed down to 225 companies.
199
9.4 RECOMMENDATIONS/POLICY IMPLICATIONS
There are many implications of the results reported in this thesis. First, evidence of the
study demonstrates the importance of incorporating organisational contingencies in
formulating policies on firms’ financial performance. Results of the study suggest that the
impact of working capital management on profitability is positively moderated by
organisational contingencies of the firm. This clearly shows that there are some
constraining factors that inhibit companies from effectively managing working capital to
maximise profitability. Therefore policy makers over time should focus on adjusting their
working capital management strategies to the demands of these contingencies in order to
improve firms’ profitability as any significant misalignment could negatively affect firms’
performances. Third, the study also found the external environment to significantly have an
influence on the relationship between working capital management (WCM) and
profitability of companies. The business environment according to Porter (1980) set
bounds on the strategies and profitability of firms. Some of the external environmental
factors that can possibly hamper the relationship include: the bargaining power of between
the suppliers and customers (Porter, 1980), industrial structure (Hawawini et al., 1986;
Filbeck and Krueger, 2005) and the prevailing economic conditions of companies (Wilson,
2008). In an industry with few suppliers but many customers, suppliers determine the price
of the products and even the terms of credit to be offered than an industry with more
suppliers but fewer customers. Also during periods of economic down turn, businesses
bear the brunt of the credit squeeze, as a result, companies, tend to offer even more
generous credit terms to win business (Wilson, 2008). Besides, fast growing firms or those
operating in competitive markets are more likely to offer additional credit to extend their
market share; in tend, they might be expected to demand more credit from their suppliers
200
to create equilibrium in their cash conversion cycle (Paul and Boden, 2011). Therefore in
formulating working capital management strategy, policy makers must aim at aligning the
strategy with demands of their environment.
More so, the findings of the study confirm that, the efficacy of the firms’ policy
significantly depends on the ability of the firms to arrange internal resource to support such
policy. Firms must focus on adjusting their working capital management strategies to meet
their resource capability (Mol and Wijnberg, 2011) in order to improve firms’
profitability. For instance, a firm may adopt a conservative policy to increase investment in
working capital so as to stimulate sales thereby increasing profitability or rather adopt an
aggressive working capital management by minimising the amount of accounts receivable
and inventory held in order to reduce cost associated with warehousing, storage and
insurance so as to increase the firm’s profitability. However each of these policies can
only be achieve based on the resource (Mol and Wijnberg, 2011) of the firm. According to
Hill et al. (2010) investment in working capital depends on internal financing resource
capability, external financing costs, capital market access and financial distress of the
firms. Companies with available cash flow may take advantage of the cash to make bulk
purchases which may reduce the procurement cost of production. They may be in a better
position to pursue a conservative working capital management than financially constrained
firms. Firms with limited cash flow strive to achieve to achieve a reduction in investment
in working capital so as to avoid the need for expensive external finance. With available
Cash flow holdings, firms are able lengthen their cash conversion cycle, which can
improve company profitability by increasing sales (Deloof, 2003). Therefore in
formulating working capital management policies to enhance profitability, policy makers
must focus on aligning such a policy to meet their resource capability. As a result, the
study suggests the need for firms to introduce policies that are appropriate to their

201
organisations’ own resources to face the opportunities and threats that exist in the general
business environment in order to improve their financial performance.
Furthermore, results from the panel data analysis also indicates that a firm’s financial
performance could also be influenced by their management capability as suggested by Luo
et al. (2012). Evidence of the study support the argument that corporate governance
variables such as Chief Executive Officer (CEO) tenure and Board size affects profitability
of firms. As a result the study suggests the need for policy makers to seriously consider
corporate governance when formulating firms’ financial profitability policies. Policy
makers of listed companies on the main market of London Stock Exchange, are encourage
to comply with the UK’s combined code on corporate governance as its compliance results
to enhancing profitability of firms. For example, with a large board size, the possibility of
CEO dominance and influence is greatly minimal. It makes it difficult for the CEO to
influence the decision of the board due to its size. This helps to minimise CEO domination
and pursuant of personal interest thereby leading to profitability. Also, a Chief Executive
Officer (CEO) that has spent a long time at his or her post will become more comfortable
and will use their power and knowledge gained to seek their own interest at the expense of
profitability.
Secondly, the results of the study demonstrate the importance of short-term financial
decisions of the firms to policy makers. Traditionally, the scope of current corporate
finance literature has been long-term financial decisions such as analysing investments,
capital structure, dividends or company valuation (Garcia-Teruel and Martínez-Solano,
2007). Consequently, this study acknowledges that, the investment that firms make in
short-term assets significantly affects their profitability. The actual short-term financial
decisions about how much to invest in the customer and inventory accounts, and how
much credit to accept from suppliers, are reflected in the firm’s working capital, which has

202
been measured by the four components namely: accounts payable, accounts receivable,
inventory holding period and the cash conversion cycle which represents the average
number of days between the date when the firm must start paying its suppliers and the date
when it begins to collect payments from its customers. Therefore the study suggests that
financial managers need to prioritise the investment and management of working capital
since the management of working capital affect both profitability and risk of companies
(Smith 1980). It is acknowledged that many UK businesses have failed because of poor
credit management (Perrin, 1998; Summers and Wilson, 2000 ) and it’s evident that the
main source of this problem is in late payment among business organisation s in the UK.
When payments are overdue and the payment date becomes uncertain then the financing
costs, and management time involved in chasing payments and financing the delay can
seriously erode the profitability of the sale and put pressure of the businesses own
relationships with its bankers and suppliers (Wilson, 2008).
On the other hand, the findings of the study also identified three principal components of
working capital management significant in determining the financial value of firms. These
include: cash conversion cycle, accounts payable and accounts receivables. Evidence from
the study supports the argument firms that efficient management of these variables
significantly improve profitability for firms. The study found that most profitable firms are
able to recover receipts from credit sales quickly whiles slowing down their cash
disbursements as suggested by Nobanee (2009). Therefore, policy makers need to properly
manage the time lag between the firm’s expenditure for the purchase of raw materials and
its collection of sales of finished goods. This can be achieved by building an effective
inter-business relationship with both their suppliers and customers in order to maximise the
benefits of better understanding the needs of each customer to so as to develop a tailor-
made credit arrangement for each customers thereby reducing the risk of default. An

203
effective inter-business relationship could also lead to better terms being offered to the
company by suppliers. Some authors such as Afrifa (2013) suggests that the management
of the time lag between the firm’s expenditure for the purchase of raw materials and its
collection of sales of finished goods could also be achieved by devoting more time
towards the management of working capital and also incorporating it into the corporate
strategy of companies. This will help firms to influence the value of the company
(Kieschnick et al., 2008) and also use their working capital strategy as a competitive
weapon (Ruback and Sesia, 2000).
Finally, the results reveal the effect of specific company characteristics on the profitability
of companies. These specific company characteristics include company size, financial
leverage, assets tangibility liquidity ratio and cash flow and sales growth. Apart from sales
growth, the rest of the variables have been found significant in estimating the relationship.
The study also found that these variables have different level of effect and influence on
firms profitably. As a result the study suggests the need for policy makers to identify their
specific company characteristics in order to work towards improving those areas so as to
improve profitability.
9.5 CONTRIBUTION TO KNOWLEDGE
The primary contribution of this study to the finance literature is the introduction of an
indirect pathway through which working capital management affects profitability. Current
studies have traditionally opined that working capital management has an impact on
profitability, without considering the potential dynamic effects, which depend on the
environment, resource and management capability of the firm. While Luthans and Steward
(1977) in the contingency frame highlight the impact of these three organisation al
contingencies (environment, resource and management) on a firm’s financial performance,

204
the study extended this stream of knowledge by demonstrating their impact in estimating
the relationship between working capital management and profitability. Although the
contingency framework has been adopted and found significant in both theoretical and
empirical studies particularly on board functioning and effectiveness (Forbes and Milliken,
1999; Zona et al., 2012; Nicholson and Kiel, 2003), there is still no study that used
contingent theory to link working capital management and profitability. Consistent with
Zona et al. (2012), results of the study confirm the relevance of the contingency theory.
This study is the first to document the application of contingency theory in explaining the
relationship between working capital management and profitability.
The other significant contribution of the research is that it demonstrates that the impact of
(INV) and (AP) on firms’ profitability changes under different conditions. Like other
previous studies (Rajeev, 2008; Tauringana and Afrifa, 2013), the study found that WCM
component (INV) does not drive the profitability of many firms. However, when ERM
variables were taken into account, the results show that INV had a significant impact on
profitability. Similarly, while WCM component (AP) does have a significant direct effect
on profitability, the results show that when ERM variables are taken into account, AP does
not have a significant impact on profitability. This suggests that the impact of (INV) and
(AP) on firms’ profitability needs to be understood in the context of firm-specific
characteristics. This will help managers identify the conditions under which firms are more
effective as decision-making groups and which contingencies enhance or constrain firms’
ability to enhance profitability through investment in working capital. For instance,
Sprague and Wacker (1996) contend that a firm’s inventory is controlled rather than
managed in order to drive the practice and profitability of firms. The rational is that
inventory management is not generally treated as a critical or strategic activity for firms
because it constitutes part of the businesses strategic objectives. According to their

205
evidence, firms need to control their inventory by formulating detailed set of activities
surrounding the order practices of individual inventory items taking into context the firm-
specific characteristics which Luthans and Steward (1977) classified as environmental,
resource and management factors. On the other hand, since (AP) constitutes a significant
portion of firms’ current assets used as a source of short-term financing for companies
(Garcia-Teruel and Martinez-Solano, 2010) firms need to efficiently management rather
than controlled (AP) to enhance their profitability.
Finally, the study broadens research on working capital management and profitability in
UK where current knowledge and understanding of the working capital management
policies is currently inadequate in view of the fact that late payment and working capital
management has been identified as the primary source of business failure (Wilson, 2008).
Many UK businesses have failed because of poor credit management (Perrin, 1998;
Summers and Wilson, 2000) and it is evident that the main source of this problem is in late
payment among business organisations in the UK.
9.6 LIMITATIONS OF THE RESEARCH
The study acknowledged a number of limitations despite the above implications expatiated
above. The first limitation identified for this study is the sample size. The study has a
relatively small sample size of 225 listed companies on the main market of London Stock
Exchange. The sample is considered small in view of the fact that out of 755 listed non-
financial firms listed firms on the main market of London Stock Exchange; the sample
only represented 30 per cent of the sample. Even though in terms of sample representation,
the study’s sample fell within Sekaran (2000) proposed percentage guidance on sample
representation, a larger sample might have been preferred as could provide evidence of a
more robust and reliable relationship between working capital, its contingencies and
profitability. This is because statistically the larger the sample size the more reliable the

206
results (Hill and Alexander, 2006). But compared to prior studies (Tauringana and Afrifa,
2013; Mathuva, 2010; Gill et al., 2010) on working capital management, the thesis sample
size of 225 is larger. Tauringana and Afrifa (2013) adopted a sample of 160 listed British
SME firms on AIM of the London Stock Exchange for a period of four years to estimate
the relative importance of working capital management to the profitability of SMEs. On
the other hand, a sample of 88 listed manufacturing firms on New York Stock Exchange
was adopted by Gill et al. (2010) for a period of 3 years to estimate the relationship
between the firms’ working capital management and their profitability. In estimating the
relationship among some selected production Turkish firms listed on the Istanbul Stock
Exchange, Sen and Oruc (2009) rather had a sample of 49 companies. This is a much lower
sample compared to that of this thesis. Despite this evidence, the study still advice scholars
to be cautious about generalisation of the findings of this thesis.
Secondly, the eleven year period adopted by the study seems to be too long compared to
evidence of prior studies such as (Tauringana and Afrifa, 2013; Deloof, 2003; Lazaridis
and Tryfonidis, 2006; Raheman and Nasr, 2007) and hence a limitation for the study. A
longer period of time has the advantage of capturing major changes in the economy or
business cycle. However, the major downsize of having a longer period of study as in the
case of this thesis is that majority of the companies are dropped from the sample due to the
non-availability of financial data for the entire period under consideration. Some of the
companies were not listed as at that period or had been delisted or merged with other
companies as a result the study excluded those companies from the sample which virtually
narrowed the sample size to about 30 per cent of all listed non-financial firms on the main
market of London Stock Exchange. Statistically, 30 per cent suggest is a sufficiently large
sample (Anderson et al., 2007) but a larger sample would have been much preferred
because of its advantage to the research.

207
Another potential limitation identified in the study is the source of the data. The data for
the study was extracted from three data sources: Thompson one Analytics, Analyse Major
Databases from European Sources (AMEDEUS) and Boardex. Majority of the database
involving both accounting and financial performance figures and ratios were extracted
from Thompson one Analytics, Analyse Major Databases from European Sources
(AMEDEUS) whiles data on corporate governance variables were also obtained from
Boardex. The major weakness of using this source of data is that any major error identified
in the data could significantly affect the results of the study. As a result the study would
have preferred retrieving the data from the company website of each individual company.
However in order to reduce the likelihood of such occurrence, both financial and corporate
governance information obtained from the database was further verified from the website
each of the companies. Despite the limitation identified above, the three data sources:
Thompson one Analytics, Analyse Major Databases from European Sources (AMEDEUS)
and Boardex have extensively been adopted by previous studies (such as Tauringana and
Afrifa, 2013; Garcıa-Teruel and Martınez-Solano, 2007; Ruubel and Hazak, 2011) and
have justified the reliability of each of these dataset.
Furthermore, the study only relied on one measure of profitability (return on assets). It
adopted return on assets (ROA) as the measure of profitability because it has more
desirable distributional properties than other accounting measures such as return on equity
(Core et al., 2006). Besides its adoption in the model allows easy comparability with
similar studies (e.g., Deloof, 2003; Tauringana and Afrifa, 2013; Lazaridis and Tryfonidis,
2006). Various researchers have also adopted a number of measures for firm’s
profitability. Net operating profit was used by Raheman and Nasr (2007) as their main
measure of profitability whist Lazaridis and Tryfonidis (2006) used gross operating profit
in their study. Vishnani and Shah (2007) on the other hand rather employed return on
208
capital employed to represent companies’ profitability. The variation in the proxies used to
measure companies profitability shows that a single measure cannot represent a complete
measure of companies’ profitability and therefore the results should be interpreted with
caution.
Also the findings of the study are only limited to companies listed on the main market of
London Stock Exchange. As a result, the study cautions scholars against generalisation
using the findings of this thesis on non-listed companies. This is because companies found
in each of these categories (listed and non-listed) exhibits different features and
characteristics. For instance, in terms of access to finance, listed companies have unlimited
access to finance than non-listed firms who mostly rely on to only owners’ equity and
finance from friends and families. Also listed firms are able to influence their dynamics of
working capital management due to the high reputation they receive from being listed
(Marchisio and Ravasi, 2001; Beatty and Ritter, 1986; Sirgy, 2002). For some investors,
companies that have membership of a stock market often signal the quality of the
company. Furthermore, the study could not adopt all the firms’ organisational
contingencies. The effects of other contingencies have influence the relationship between
working capital management and profitability, key example is the impact of the business or
economic cycle on firms.
9.6 FURTHER RESEARCH
The study’s limitations presented above open several avenues for further studies and
improvement. Further and more extensive analyses on multiple contexts and countries
would be required to establish causal effects between the variables on other stock
exchanges. It would be interesting to investigate this relationship on other markets with
different economic climate in order to determine whether the same pattern of findings will

209
be exhibited. Further evidence from the study could be explored by replicating the findings
of this study particularly in a well-developed capital market where access to finance is
readily available to businesses as in the case of the UK. According to Demirguc-Kunt et al.
(2006), companies operating in countries with more developed banking systems grant more
trade credit to their customers, and at the same time they receive more finance from their
own suppliers.
Secondly, the study adopted ROA as the only measure of profitability. This is because;
ROA has more desirable distributional properties and has ability to remove size effects,
therefore allowing for inter-industry comparison (Lev and Sunder, 1979) than other
accounting measures such as return on equity (Core et al., 2006). Besides it also allow easy
comparability with similar studies (e.g., Deloof, 2003; Tauringana and Afrifa, 2013). In
spite of this, the study advocates the need to also adopt other measures of profitability in
examine the relationship.
Thirdly, the study also advocates the need to estimate the relationship in limited or short
period of time or rather relax some of the sample selection criteria in order to avoid cases
where majority of the companies were dropped from the sample due to the non-availability
of financial data for the entire period under consideration. This will help increase the
sample size for the study to enhance more reliability of the results (Hill and Alexander,
2006).
Fourthly, the study could also be replicated to estimate the relationship among SME
companies listed on a stock exchange as a result of the fact that listed SMEs have access to
unlimited finance through the issue of shares and are able to obtain higher reputation
because of the stringent regulations imposed on it. The higher reputation of listed SMEs

210
will allow for good dealings with both suppliers and customers, which will improve the
profitability (Tauringana and Afrifa, 2013).
Fifthly, the study only adopted board size, cash flow and industry as key organisational
contingencies (i.e. management, resource and environmental variables respectively) to
estimate their impact on the relationship between working capital management and
profitability. The study recommends the need to incorporate other organisational
contingencies to enrich the discussion.
Finally, further studies can also explore by incorporating other corporate governance and
firm characteristics as controls to measure the relationship between working capital
management and profitability. In terms of corporate governance, the influence of CEO age,
block shareholders, proportion of non-executive directors, directors’ remuneration,
institutional shareholders and CEO duality could be investigated to determine their
influence on the relationship between working capital management and profitability. Other
firms’ characteristics such as the influence of company age, gross working capital
efficiency and working capital requirement could also be explored in further research to
measure their influence on firms’ profitability.

211
REFERENCES
Aaronson, D., Bostic, R.W., Huck, P. and Townsend, R., 2004. Supplier relationships and
small business use of trade credit. Journal of Urban Economics 55, 4667.
Abel. M., 2008. The Impact of Working Capital Management on Cash Holdings: A
Quantitative Study of Swedish Manufacturing SMEs. Mid Sweden University,
Faculty of Human Sciences, Department of Social Sciences, Student thesis.
Abuzayed B., 2012. Working capital management and firms’ performance in emerging
markets: the case of Jordan. International Journal of Managerial Finance, 8(2), 155
– 179.
Accountancy Today, 2007. Late payment in UK. Retrieve from
http://www.accountancyage.com/aa/news/1753564/late-payments-cost-uk-economy-
gbp20bn.
Adams, R. B. and Ferreira, D., 2007. A theory of friendly boards, Journal of Finance, 62,
217-250.
Adams, R., and Mehran, H., 2003. Is corporate governance different for bank holding
companies? Federal Reserve Bank of New York Economic Policy Review, 123-
142.
Adeyemi, S. L., 2010. Just-in-Time Production Systems (JITPS) in Developing Countries:
The Nigerian Experience. Journal of Social Science, 22(2), 145-152.
Afrifa G., 2013. Working capital management and AIM listed SME companies
profitability: a mixed research method approach. PhD Thesis (PhD). Bournemouth
University.

212
Afza, T. and Nazir, M. S., 2007. Is it better to be aggressive or conservative in managing
working capital? Journal of Quality and Technology Management, 3(2), 11-21.
Agrawal, A., and Knoeber. C. R., 1996. Firm Performance and Mechanisms to Control
Agency Problems between Managers and Shareholders. Journal of Financial and
Quantitative Analysis 31: 377–97.
Aguirre, M. S., Lee T. K. and Pantos T. D., 2008. Universal versus functional banking
regimes: The Structure Conduct Performance Hypothesis revisited. Journal of
Banking Regulation 10, 46-67.
Ahmad, A., Mehra, S., and Pletcher, M., 2004. The perceived impact of JIT
implementation on firms‘ financial/growth performance. Journal of Manufacturing
Technology Management, 15(2), 118 - 130.
Akinlo, O., and Asaolu, T., 2012. Profitability and Leverage: Evidence from Nigerian
Firms. Global Journal of Business Research, 6(1), 17-25.
Akintoye I. R., 2008. Sensitivity of Performance to Capital Structure. European Journal of
Social Sciences, 7(1).
Allgood, S., and Farrell, K. A., 2003. The match between CEO and firm. Journal of
Business, 76, 317-341.
Alipour, M., 2011. Working capital management and corporate profitability: Evidence
from Iran, World Applied Sciences Journal, 12(7), 1093-1099.
Ambrosini, V., Bowman, C., and Collier, N., 2009. Dynamic capabilities: An exploration
of how firms renew their resource base. British Journal of Management, 20, 9-24.

213
Amir S. S. and Sana, A., 2006. Impact of Working Capital Management on the
Profitability of Oil and Gas Sector of Pakistan. European Journal of Scientific
Research, 15(3): 301-307.
Amit, R.and Schoemaker P. J., 1993. Strategic assets and organisational rent. Strategic
Management Journal 14 (January): 33-46.
Anderson R., Mansi S., and Reeb, D., 2004. Board characteristics, accounting report
integrity and the cost of debt. Journal of Accounting Economics, 37, 315-342.
Anderson, C. R., and Reeb, M. D., 2004. Board Composition: Balancing Family Influence
in S&P 500 Firms. Administrative Science Quarterly, 49, 209-237.
Anderson, D. R., Sweeney, D. J., Williams, T. A., Freeman, J., and Shoesmith, E., 2007.
Statistics for business and economics. London: Thomson Learning.
Antov, D. and Atanasova, C. V. 2007. Trade Credit Financing: How Expensive is it
Really?, in Working Paper, University of York, March 2007,
http://ssrn.com/abstract=967522.
Arena, M. and Julio B. 2010. Litigation Risk and Corporate Cash Holdings. Working
Paper.
Athanasoglou, P. P., Brissimis, S. N. and Delis, M. D., 2005. Bank-specific industry
specific and macroeconomics determinants of bank profitability, Bank of Greece.
Working Paper 25, June.
Autukaite, R. and Molay, E., 2011. Cash holding, working capital and fir value: evidence
from France. International conference of the French Finance association (AFFI),
Pp11−13.
214
Bain, J., 1959. Industrial Organisation . Wiley: New York.
Bain, J. S., 1956. Barriers to new competition. Cambridge: Harvard University Press.
Balakrishnan, R., Linsmeier, T. J., and Venkatachalam. M., 1996. Financial benefits from
JIT adoption: Effects of customer concentration and cost structure. The Accounting
Review, 71, 183- 205.
Balestra, P., 1992. Introduction to linear models for panel data, in Matyas, L. (eds.), The
Econometrics of Panel Data, 5 09-520, Kluwer Academic Publishers.
Balestra, P., and Nerlove, M., 1966. Pooling Cross Section and Time Series Data in the
Estimation of a Dynamic Model: The Demand for Natural Gas, Econometrica, 34,
585-612.
Baligh, H. H., Burton, R. M. and Obel, B., 1996. Organisation al Consultant: Creating a
Usable Theory for Organisation al Design. Management Science, 32(12) 1648-
1662.
Baltagi, B. H., 2005. Econometric Analysis of Panel Data, third Edition, New York: John.
Baltagi, B., 1995. In: Econometric Analysis of Panel Data, Wiley, Chichester.
Baltagi, B. H. and Levin, D., 1992. Cigarette taxation: Raising revenues and reducing
consumption, Structural Change and Economic Dynamics 3, 321–335.
Banerjee, A. A., 2006. Capital Market Access to SMES in India. In: 10th Indian Institute
of Capital Markets Conference Paper. Available from:
http://ssrn.com/abstract=962033.
Banerjee, S., Gatchev, V.A., and Spindt, P.A., 2007. Stock Market Liquidity and Firm
Dividend Policy. Journal of Financial and Quantitative Analysis, 42(2), 369-398.

215
Baños-Caballero, S., García-Teruel, P. J. and Martínez-Solano, P., 2013. Working capital
management, corporate performance, and financial constraints, Journal of Business
Research, Pages 7.
Baños-Caballero, S., García-Truel P.J. and Martínez-Solano P. 2010. Working Capital
Management in SMEs. Accounting & Finance 50 (2010) 511-527
Bathula , H., 2008. Board Characteristics and Firm Performance: Evidence from New
Zealand. Thesis (PhD). Auckland University of Technology.
Barney, J., 1986. Strategic factor markets: expectations luck and business strategy.
Management Science, 42, 1231-1241.
Barney, J. B., McWilliams, A. and Turk, T., 1989. On the relevance of the concept of entry
barriers in the theory of competitive strategy. Paper presented at the annual meeting
of the Strategic Management Society, San Francisco.
Barney, J., 1991. Firm resources and sustained competitive advantage. Journal of
Management, 17, 99-120.
Bartov, E., Radhakrishnan, S. and Krinsky, I., 2000. Investor sophistication and patterns in
stock returns after earnings announcements. The Accounting Review, 75, 43–63.
Barron, D. N., West, E., and Hannan, M. T., 1994. A time to growth and a time to die:
Growth and mortality of credit unions in New York, 1914-1990. American Journal
of Sociology, 100(2), 381-421.
Bastos, R. and Pindado, J. 2007. An agency model to explain trade credit policy and
empirical evidence. Applied Economics, 39, 2631–2642.

216
Baum, C. F., Schafer, D., and Talavera, O., 2007. The Effects of Short-Term Liabilities on
Profitability: A Comparison of German and US Firms. Boston College Working
Papers in Economics 636, Boston College Department of Economics.
Baumol, W. J., 1959. Business Behavior, Value, and Growth, (Revised Edition, New York:
Harcourt Brace Jovanovich).
Beard, J. W. and Summer M., 2004. Seeking strategic advantage in the post-net era:
viewing ERP systems from the resource-based perspective. Journal of Strategic
Information Systems: 129-150.
Bebchuk, L., Cohen A. and Ferrell A., 2009. What Matters in Corporate Governance?,
Review of Financial Studies, 22, 783-827.
Begona, G., 1997. The influence of company characteristics and accounting regulation on
information disclosed by Spanish firms. The European Accounting Review, 6 (1),
45-68.
Berger, A. N. and Udell, G. F. 1998. The economics of small business finance: The roles
of private equity and debt markets in the financial growth cycle. Journal of Banking
and Finance, 22, 613-673.
Bergh, D. D. 2001. Executive retention and acquisition outcomes: a test of opposing views
on the influence of organisation al tenure. Journal of Management, 27(5): 603–622.
Bertrand, M., and Mullainathan, S., 2003. Enjoying the quiet life? Corporate governance
and managerial preferences. Journal of Political Economy. 111(5), 1075.
Bhagat, S., Dong, M., Hirshleifer, D. and Noah, R. 2005. Do Tender Offers Create Value:
New Methods and Evidence, Journal of Financial Economics 76: 3-60.
217
Bhattacharya, H., 2008. Theories of Trade Credit: Limitations and Applications. Available
from: http://ssrn.com/abstract=1286443 [Accessed 25 November 2010].
Blazenko, G. and Vandezande, K., 2003. Corporate holding of finished goods inventories.
Journal of Economics and Business, 55, 255-66.
Blinder, A. S. and Maccini, L. J., 1991. The Resurgence of Inventory Research, What
Have We Learned? Journal of Economic Survey, 5, 291-328.
Boeker, W., 1997. Executive migration and strategic change. Administrative Science
Quarterly, 42:213–236.
Boermans, M. A., and Wiilbrands, D., 2011. Firm performance under financial constraints
and risks: recent evidence from micro finance clients in Tanzania, HU University
of Applied Sciences Utrecht, Working paper.
Bogaert, I., Maertens, R. and Van Cauwenbergh, A., 1994. Strategy as a situational Puzzle:
the first of components, in Hamel, G. and Heene, A., Competence-Based
Competition. John Wiley, Chichester.
Boissay, F. and Gropp. R. 2007. Trade Credit Defaults and Liquidity Provision by Firms.
Working Paper 753, European Central Bank, Frankfurt.
http://www.ecb.int/pub/pdf/scpwps/ ecbwp753.pdf.
Bothwell, J.T., Cooley, T., and Hall, T., 1984. A new view of the market structure-
performance debate. Journal of Industrial Economics, 32, 397-417.
Bourke, P., 1989. Concentration and other Determinants of Bank Profitability in Europe.
Journal of Banking and Finance, 65-80.
218
Bougheas S., Mateut S. and Mizen P. 2009. Corporate trade credit and inventories: new
evidence of a trade-off from accounts payable and receivable. Journal of Banking
and Finance 33 (2), 300-307.
Boute, R. N., Lambrecht, M. R. Lambrechts Ol. and Sterckx P., 2004. An analysis of
inventory turnover in the Belgian manufacturing industry, wholesale and retail and
the financial impact on inventory reduction. Working paper. Faculty of Economics
and Applied Economics, K.U. Leuven.
Braun, M., 2003. Financial Contractibility and Asset Hardness. mimeo, Harvard
University.Brennan, M.. Vojislav M. and Josef Z., 1988. Vendor Financing. Journal
of Finance, 43, 1127–41.
Brennan, M.. Vojislav M. and Josef Z., 1988. Vendor Financing. Journal of Finance, 43,
1127–41.
Brick, I. E., and Fung, W. K. H., 1984. Taxes and the theory of trade debt. Journal of
finance, 39(4), 1169-1176.
Brito, P., and Mello, A. S., 1995. Financial constraints and firm post-entry performance.
International Journal of Industrial Organisation , Elsevier, 13(4), 543-565.
Brown, J. H., 2002. Structure–Conduct–Performance: A Comment on Blaug's Is
Competition Such a Good Thing? Static Efficiency versus Dynamic Efficiency.
Review of Industrial Organisation , 21(1), 103-105.
Burrell, G. and Morgan G., 1979. Sociological Paradigms and Organisation al Analysis
London and Exeter, NH: Heinemann.
219
Burton, R. M., Lauridsen, J. and Obel, B., 2000. Fit and Misfits in the Multi-Dimensional
Contingency Model: An Organisation al Change Perspective. LOK Research
Center, København. LOK, Working Paper.
Burton, R. M. and Obel, B., 1998. Strategic Organisation al Diagnosis and Design:
Developing Theory for Application, Boston, Kluwer Publishers, 1995 (includes
Organisation al Consultant software). Second edition.
Buzzell, R. D., Gale, B. T. and Sultan, R. G., 1975. Market share: A key to profitability.
Harvard Business Review, (Jan): 97-106.
Cabral, L. M. A., and Mata, J., 2003. On the evolution of the firm size distribution: facts
and theory. American Economic Review, 93, 1075-1090.
Caesar, G., and Holmes, S., 2003. Capital Structure and Financing of SMEs: Australian
Evidence. Journal of Accounting and Finance, 43, 123-147.
Campello, M., 2005. Debt Financing: Does it Boost or Hurt Firm Performance in Product
Markets? forthcoming, Journal of Financial Economics.
Capkun, V., Hameri, A. P. and Weiss, L. A., 2009. On the relationship between inventory
andfinancial performance in manufacturing companies. International Journal of
Operations& Production Management, 29 (8), 789−806.
Caves, R. and Porter, M. E., 1977. From entry barriers to mobility barriers: conjectural
decisions and contrived deterrence to new competition. Quarter/y Journal of
Economics, 26: 241-262.
Chandler, Alfred D., 1962. Strategy and Structure: Chapters in the History of the Industrial
Enterprises. Cambridge, MA: MIT Press.

220
Charitou ,M. S., Elfani, M., and Lois. P., 2010. The effect of WorkingCapital Management
on firms Profitability: Empirical evidence from an Emerging Market . Journal of
Business and Economic Research, 8(12), 63 –68.
Chen, H., Frank M.Z. and Wu Q.W., 2005. What Actually Happened to the Inventories of
American Companies between 1981 and 2000? Management Science, 51(7), 1015–
1031.
Chen, K. C. W., Zhihong, C. and Wei, K. C. J., 2009. Legal protection of investors,
corporate governance, and the equity cost of capital. Journal of Corporate Finance,
15(3): 273-388.
Chen, A. L., Chen, R. Y., and Lee, W. C., 2002. The effect of passing rate of CPA
examination on the industrial structure of accounting firms in Taiwan. PanPacific
Management Review, 5(2), 155–170.
Cheng, S. N. and Pike, R. 2003. The Trade Credit Decision: Evidence of UK Firms,
Management and Decision Economics, 24: 219-438
Cheng, T. C. E. and Podolsky, S., 1996. Just-In-Time manufacturing an introduction. 2nd
edition. Chapman & Hall: London.
Cheng, S., Evans III J. H. and Nagarajan, N. 2008. Board size and firm performance: the
moderating effects of the market for corporate control, Review of Quantitative
Finance and Accounting, forthcoming, DOI: 10.1007/s11156-007-0074-3.
Chenhall, R. H. 2003. Management control system design within its organizational
context: Findings from contingency-based research and directions for the future.
Accounting, Organizations and Society 28(2-3): 127-168.

221
Ching H. Y., Novazzi A., and Gerab F., 2011. Relationship between working capital
management and profitability in Brazilian-listed companies. Journal of Global
Business and Economics, 3(1), 74–86.
Chittenden, F., Hall, G., and Hutchinson, P., 1996. Small Firm Growth, Access to Capital
Markets and Financial Structure: Review of Issues and an Empirical Investigation.
Small Business Economics. Springer, 8(1), 59-67.
Christie, A. A., Joye, M. P., and Watts, R. L., 1991. Decentralisation of the Firm: Theory
and evidence, Working paper, University of Rochester.
Christopher, S.B., and Kamalavalli, A. L., 2009. Sensitivity of profitability to working
capital management in Indian corporate hospitals. Working Paper, NGM College.
Available from:http://papers.ssrn.com/sol3/papers.cfm?abstract_id=1331500.
[Accessed 19 April 2010].
Christiano, L. J., and Fitzgerald, T. J., 1989. The magnitude of the speculative motive for
holding inventories in a real business cycle model. Discussion Paper Institute for
Empirical Macroeconomics, Federal Reserve Bank of Minneapolis.
Churchman, C. W., 1968. The Systems Approach. Dell Publishing: New York.
Clarke, R., 1984. Profit margins and market concentration in UK manufacturing industry:
1970-6. Applied Economics. 16, 577-71.
Coad, A., Segarra-Blasco, A., and Teruel, M., 2010. Like Milk or Wine: Does Firm
Performance Improve with Age?. XREAP Working Paper No. 2010-10. Available
from: http://ssrn.com/abstract=1815028 [Accessed 18 December 2010].
222
Coles, J. I., Daniel, N. D. and Naveen, L., 2008. Boards: does one size fit all? Journal of
Financial Economics, 87(3), 329-356.
Collis, J. and Hussey, R., 2009. Business Research: A practical guide for undergraduate
and postgraduate students, 3rd edition, New York, Palgrave Macmillan.
Conyon, M. J., and Peck, S. I., 1998. Board control, remuneration committee, and top
management compensation. Academy of Management Journal, 41(2), 146-57.
Cool, K.O. and Schendel, D., 1987. Strategic group formation and performance: The case
of the U.S. pharmaceutical industry, 1963-1982. Management Science, 33: 1102-I
124.
Couderc F. 2006. Short-rate interest rate models in the HJM framework: models,
calibration and MC simulation. Technical report, Risk Metrics Group
Core, J. E., Guay W. R. And Rusticus T. O., 2006. Does Weak Governance Cause Weak
Stock Returns? An Examination of Firm Operating Performance and Investors'
Expectations. Journal of Finance, 61 (2) 655–687.
Cosh, A. and Hughes, A., 1994. Size, Financial Structure and Profitability: UK Companies
in the 1980s’ in Finance and the Small Firm, Hughes, A. and Storey D..J. London:
Routledge.
Cremers, K. J. M. and Nair V. B., 2005. Governance Mechanisms and Equity Prices,
Journal of Finance, 60, 2859-2894.
Dahya, J., Dimitrov, O., and McConnell, J. J., 2008. Dominant shareholders, corporate
boards, and corporate value: A cross-country analysis. Journal of Financial
Economics, 87, 73-100.

223
Dalton, C. M., and Dalton, D. R., 2005, Boards of Directors: Utilizing Empirical Evidence
in Developing Practical Prescriptions. British Journal of Management, 16, 91-97.
Damodaran, A., 2005. Marketability and Value: Measuring the Illiquidity Discount.
working paper, New York University.
Danielson, M. G., and Scott, J. A., 2000. Additional Evidence on the Use of Trade Credit
by Small Firms: The Role of Trade Credit Discounts. Available from: SSRN:
http://ssrn.com/abstract=236260. [Accessed 113 February 2010].
Dann, L., 1981. Common stock repurchases: an analysis of returns to bondholders and
stockholders, Journal of Financial Economics, 9(2), 113-138.
Darnall, N., 2009. Environmental regulations, green production offsets and organisation s’
financial performance. Public Administration Review, 69, 418-434.
Das, B. J., 1997. Structure, conduct, performance, and public policy of the automobile
industry. International Journal of Management, 14(3), 503–510.
Davis, D., 1996. Business Research for Decision making, 4th Edition, Duxbury:
Massachusetts.
Day, G., 1994. The capabilities of market-driven organisation s. Journal of Marketing, 58,
4, 37-52.
Day, G. and Wensley, R., 1988. Assessing advantage: a framework for diagnosing
competitive superiority. Journal of Marketing, 52, 17-32.
Dehaene A., Vuyst, V. D., and Ooghe, H., 2001. Corporate performance and board
structure in Belgian companies. Long Range Plan, 34: 383-393.
224
Deloof, M. and Jegers, M., 1996. Trade Credit, Product Quality, and Intragroup Trade:
Some European Evidence. Financial Management, 25, 33–43.
Deloof, M., 2003, Does Working Capital Management Affect Profitability of Belgian
Firms? Journal of Business, Finance and Accounting. 30(3-4), 573-587.
Deloof, M., and Jegers, M., 1999. Trade credit, corporate groups, and the financing of
Belgian firms. Journal of Business Finance & Accounting, 26(7), 945-966.
Demeter, K., 2003. Manufacturing strategy and competitiveness. International Journal of
Production Economics, 81/82, 205-13.
Demirguc-Kunt, A., Love, I., and Maksimovic, V., 2006. Business Environment and the
Incorporation Decision, Journal of Banking and Finance.
Dimitrov, V., and Jain P. C., 2005. The Value Relevance of Changes in Financial
Leverage. Available from: http://ssrn.com/abstract= 708281[Accessed 1 December
2009].
Demsetz, H., 1973. Industrial Structure, Market Rivalry, and Public Policy. Journal of Law
and Economics, 16(1), 1-10.
Dewar, R.D. and Dutton, J.E., 1986. The Adoption of Radical and Incremental
Innovations: An Empirical Analysis. Management Science, 32, 1422–33.
Dhaliwal D., Heitzman S.and Li O. Z. 2005. Taxes, Leverage, and the Cost of Equity
Capital. Working paper. University of Arizona.
Dong, H. P., and Su, J., 2010. The relationship between working capital management and
profitability: a Vietnam case. International Research Journal of Finance and
Economics, 49, 62-71.
225
Donaldson, L., 2001. The Contingency Theory of Organisations, Sage Publications Inc.
Drazin, R., and Van de Ven A. H., 1985. Alternative Forms of Fit in Contingency Theory
Administrative Science Quarterly, 30, 514–539
Drury, C., 2000. Management Cost Accounting, (Edn. 5)Italy: Vincenzo Bona. 1194.
Dudley, L. and Lasserre, P., 1989. Information as a substitute for inventories. European
Economic Review, 33, 67-88.
Duncan, R. B., 1972. Characteristics of Organisation al Environments and Perceived
Environmental Uncertainty. Administrative Science Quarterly 17(3): 313-327.
Eisenberg, T., Sundgren S., and Wells, M.T. 1998. Larger board size and decreasing firm
value in small firms. Journal of Financial Economics, 48, 35-54.
Emery G.W., 1987. An Optimal Financial Response to Variable Demand. Journal of
Financial and Quantitative Analysis, 22, 209-225.
Emery, G.W., 1984. A Pure Financial Explanation for Trade Credit. Journal of Financial
and Quantitative Analysis, 19(3), 271-285.
Eroglu, C. and Hofer, C., 2011b. Inventory Types and Firm Performance: Vector
Autoregressive and Vector Error Correction Models, Journal of Business Logistics
32 (3): 227−239.
Europa, 2009. Combating Late Payment: The Economic Rationale, available at:
http://ec.europa. eu/enterprise/regulation/late_payments/rationale.htm (accessed 12
October, 2009).
226
Falope O. I., and Ajilore O. T., 2009. Working capital management and corporate
profitability: evidence from panel data analysis of selected quoted companies in
Nigeria. Research Journal of Business Management, 3(3), 73-84.
Fama, E. and Jensen, M. C., 1983. Separation of ownership and control, Journal of
Lawand Economics, 26, 301-326.
Farooque, O. A., Zijl, T., Dunstan, K. and Karim, W., 2007. Corporate governance in
Bangladesh: link between ownership and financial performance. Corporate
Governance: An International Review, 15(6), 1453-68.
Fazzari, S.M., Hubbard R. G. and Petersen B. C., 1988. Financing Constraints and
Corporate Investment. Brookings Paper on Economic Activity, 1, 141-195.
Fazzari, S. M. and Petersen B., 1993. Working Capital and Fixed Investment: New
Evidence on Financing Constraints. Rand Journal of Economics 24, 328-342.
Ferguso, N, P. R. and Ferguson, G. J., (1994). Industrial economics: issues and
perspectives. London: MacMillan
Ferris, J.S. 1981. A transactions theory of trade credit use. Quarterly Journal of Economics
94, 243–270.
Field, A., 2005. Discovering statistics using SPSS. Second ed. London: Sage Publications
Ltd.
Filbeck, G. and Krueger, M.T., 2005. An Analysis of Working Capital Management
Results across Industries. Mid-American Journal of Business, 20, 11-18.
Fisman, R. and Love, I. 2003. Trade Credit, Financial Intermediary Development and
Industry Growth. The Journal of Finance 58, 353-374.
227
Fisher, F. M., McGowan, J. J. and Greenwood, J. E. 1983. Folded, spindled and mutilated.
Cambridge: MIT Press.
Flynn, B., Huo, B. and Zhao, X., 2010. The impact of supply chain integration on
performance: a contingency and configuration approach. Journal of Operations
Management, 28(1) 58-71.
Fridman, B. and Ostman L., 1989. Accounting development-some perspectives. A book in
honour of Sven-Erik Jobansson, Stockholm, Economic Research Institute.
Freeman, J., 1973. Environment, technology and the administrative intensity of
organisation s. Am. Soc. Rev., 38(6): 750-763.
Forbes, D. P. and Milliken, F.J., 1999. Cognition and corporate governance: understanding
boards of directors as strategic decision-making groups. Academy of Management
Review, 24, 489–505.
Freixas, X., 1993, Short-Term Credit versus Accounts Receivable Financing. Universitat
Pompeu Fabra, Economics Working Paper, 27.
Fridman, B. and Ostman, L., 1989. Accounting development-some perspectives. A book
in honour of Sven-Erik Jobansson. Stockholm, Economic Research Institute.
Gabarro, J. J., 1987. The dynamics of taking charge. Boston: Harvard Business School
Press.
Ganesan, V., 2007. An analysis of working capital management efficiency in
telecommunication equipment industry. River Academic Journal, 3(2), 1-10.
Garcia-Perez-de-Lema, D., Durendez, A., and Marino, T., 2010. A Strategic Decision for
Growth, Financing And Survival Of Small And Medium Family Businesses: Going
228
Public In An Alternative Stock Market (MAB). Economics and Finance Review,
1(8), 31-42.
Garcia-Teruel, P. J., and Martinez-Solano, P., 2007. Effects of Working Capital
Management on SME Profitability. International Journal of Managerial Finance,
3(2), 164-177.
Garcia-Teruel, P. J., and Martinez-Solano, P., 2010a. A dynamic approach to accounts
receivable: a study of Spanish SMEs. European Financial Management, 16(3), 400-
421.
Garcia-Teruel, P. J., and Martinez-Solano, P., 2010a. A dynamic approach to accounts
receivable: a study of Spanish SMEs. European Financial Management, 16(3),
400-421.
Garcia-Teruel, P. J., and Martinez-Solano, P., 2010b. A dynamic perspective on the
determinants of accounts payable. Rev. Quant Finan Acc, 34, 439-457.
Garcia-Teruel, P. J. and Martinez-Solano, P., 2010c. Determinants of trade credit: a
comparative study of European SMEs. International Small Business Journal, 28(3),
215-233.
Ghauri, P. and Grønhaug, K., 2005. Research Methods in Business Studies – A Practical
Guide. 3 rd ed. Harlow: Prentice Hall.
Giffi, C., Roth, A.V., and Seal, G. M., 1990, Competing in World-Class Manufacturing:
America’s 21st Century Challenge, Business One Irwin, Homewood, IL.
229
Gill, A., Biger, N., and Mathur, N., 2010. The relationship between working capital
management and profitability: evidence from the United States. Business and
Economics Journal, 10, 1-9.
Gill, A. S. and Biger, N., 2013. The impact of corporate governance on working capital
management efficiency of American manufacturing firms. Managerial Finance, 39
(2), 116 – 132.
Goddard, J, Tavakoli, M., and Wilson, J., 2005. Determinants of Profitability in European
Manufacturing and Services: Evidence from a Dynamic Panel Data, Applied
Financial Economics, 15, 1269-1282.
Goodstein, J., Kanak, G., and Boeker, W., 1994. The Effects of Board Size and Diversity
on Strategic Change. Strategic Management Journal, 15(3) 241-250.
Gompers, P., Ishii, J. and Metrick, A., 2003. Corporate Governance and Equity Prices
Quarterly Journal of Economics, 118, 107-155.
Granstrand, O., Patel, P. and Pavitt, K., 1997. Multi-technology corporations: Why they
have distributed rather than distinctive core competencies. California Management
Review, 39(4), 8-25.
Grant, R. M., 1991. The Resource-Based Theory of Competitive Advantage: Implications
for Strategy Formation. California Management Review, 33(3), 114-35.
Gray, S., 1997a. Forum at the Forefront. The Times, 9 September.
Gray, S., 1997b.Who Needs a Late Payment Law?. The Times,9 September.
Greene, W. H., 2003. Econometric Analysis, 5 ed. Prentice-Hall.
Greene, W., 2000. Econometric Analysis. Upper Saddle River, NJ: Prentice–Hall.
230
Greene, W., 1997, Econometric Analysis, 3 ed. NJ: Prentice-Hall.
Greene, P., Brush, C. and Brown, T., 1997. Resources in small firms: an exploratory study.
Journal of Small Business Strategy, 8(2), 25-40.
Gu, Z., 1993. Debt use and profitability: A reality check for the restaurant industry, Journal
of Foodservice Systems 7, 135-147.
Guest, P. M., 2008. The determinants of board size and composition: Evidence from the
UK, Journal of Corporate Finance, 14, 51-72.
Guest, P. M., 2009. The impact of board size on firm performance: Evidence from the UK.
European Journal of Finance, 15(4): 385-404.
Gujarati, D. N., 2003. Basic Econometrics. 4 ed. McGraw-Hill: New York.
Gyapong, O. A., 1986. Alternative estimating techniques for panel data on strike activity.
Review of Economics and Statistics 68, 526–531.
Jain, N., 2001. Monitoring Costs and Trade Credit. Quarterly Review of Economics and
Finance, 41(1), 89-110.
Jensen, M. C. 1993. The Modern Industrial Revolution, Exit and the Failure of Internal
Control Systems. Journal of Finance, vol. 48, no. 3, pp. 831-880.
Jensen, M.C. and Meckling, W.H. 1976. Theory of the Firm: Managerial Behavior,
Agency Costs and Ownership Structure. Journal of Financial Economics, 3(4),
305−360.
Jeong, K. Y. and Masson, R. T., (2003). A new methodology linking concentration
dynamics to current and steady-state profits: Examining Korean industrial policy
during take-off. International Journal of Industrial Organisation , 21, 1489–1526.

231
Hall, R. 1992. The strategic analysis of intangible resources. Strategic Management
Journal. 13 (February): 135-144.
Hambrick, D. C., Geletkanycz, M. A.and Fredrickson, J. W. 1993. Top executive
commitment to the status quo: Some tests of its determinants, Strategic
Management Journal, Vol. 14, No. 6, pp. 401-418.
Kandori, M., 1992. Social Norms and Community Enforcement. Review of Economic
Studies, 59(1), 63-80.
Khan Z, Jawaid S. T., Arif I and Khan M. N., 2012. Working capital management and
firm’s profitability in Pakistan: A disaggregated analysis. African Journal of
Business Management 6(9), 3253-3261.
Khandwalla P. N., 1977. The Design of Organisation s, Harcourt Brace Jovanovoich, New
York.
Kim, Y. and Atkins, J., 1978. Evaluating Investments in Accounts Receivable: A Wealth
Maximizing Framework. Journal of Finance 33, 403-412.
Klein, A., 1998. Firm Performance and Board Committee Structure. Journal of Law and
Economics, 41, 275-99.
Haniffa, R., and Hudaib, M., 2006. Corporate Governance Structure and Performance of
Malaysian Listed Companies. Journal of Business Finance & Accounting, 33 (7-8),
1034-1062.

232
Hansen, G. S., and Wernerfelt, B., 1989. Determinants of firm performance: The relative
importance of economic and organisational factors. Strategic Management Journal,
10, 399-411.
Hardwick, P., 1997. Measuring cost inefficiency in the UK life insurance industry. Applied
Financial Economics, 7, 37–44.
Harris, R. and Robinson, C., 2001. A Critical Review of Empirical Research on
Hindrances to Business Development and Productivity Growth and the Relative
Importance of Different Contraints on UK Business. Unpublished Report to Small
Business Service.
Hart, O., 1995. Firms, Contacts, and Financial Structure. Oxford: Clarendon Press.
Hart, O., and Moore, J., 1994. A Theory of Debt Based on the Inalienability of Human
Capital. Quarterly Journal of Economics 109, 841-879.
Hawawini, G., Viallet, C.and Vora, A., 1986. Industry influence on corporate working
capital decisions, Sloan Management Review, 27(4),15-25.
Hayajneh, O. S., and Yassine, F. L. A., 2011. The Impact of Working Capital Efficiency
on Profitability -an Empirical Analysis on Jordanian Manufacturing Firms.
International Research Journal of Finance and Economics, 66, 67-76.
Henderson, B. D., 1989. The origin of strategy. Harvard Business Review, Nov-Dee: 139-
143.
Hermalin, B. E., and Weisbach, M. S., 1998. Endogenously chosen boards of directors and
their monitoring of the CEO. American Economic Review, 96-118.

233
Hill, N. and Alexander, J., 2006. Handbook of customer satisfaction and loyalty
measurement, Gower Publishing, England.
Hill, M. D., Kelly, G. W. and Highfield, M. J., 2010. Net Operating Working Capital
Behavior: A First Look. Financial Management, 39(2), 1-44.
Hill, M. D., Kelly, G. W. and Lockhart, G.B., 2012. Shareholder returns from supplying
trade credit. Financial Management 41: 255–280.
Hill, C. W. L., and Phan, P., 1991. CEO tenure as a determinant of CEO pay. Academy of
Management Journal, 34, 707-717.
Hill, N. and Sartoris W, 1992. Short-Term Financial Management. Macmillan.
Hittle, L. C., Haddad, K. and Gitman L. J., 1992. Over-the-Counter Firms, Asymmetric
Information and Financing Preferences. Review of Financial Economics, 81-92.
Higgins, R.C., 1977. How Much Growth Can a Firm Afford? Financial Management, 6 (3),
7-16.
HMSO, 1994. Competitiveness, Helping Business to Win, Cmnd 2563, HMSO, London.
HMSO, 1998. Late Payment of Commercial Debts (Interest) Act 1998, HMSO, London.
Hsiao, C., 2003, Analysis of Panel Data. 2nd ed. Cambridge: Cambridge University Press.
Hoopes, D. G., 2001. Why are their glitches in product development? R and D
Management, 31, 381–389.
Hoopes, D. G., Madsen, T. L. and Walker G. 2003. Why is there a resource-based
view?Toward a theory of competitive heterogeneity, Strategic Management
Journal, 24(10), 889–902.
234
Howorth C and Wilson N., 1999. Late payment and the small firm: an examination of case
studies. Small Business and Enterprise Development 5(4): 307–315.
Howorth, C., and Westhead P., 2003. The Focus of Working Capital Management in UK
Small Firms. Management Accounting Research, 14(2), 94-111.
Howorth, C., and Reber, B., 2003. Habitual late payment of trade credit: An empirical
examination of UK small firms. Managerial and Decision Economics, 24, 471-482.
Hsiao, C., 2003, Analysis of Panel Data. 2nd ed. Cambridge: Cambridge University Press.
Hsieh, P. J., and Kleiner, B. H., 1992. New Developments in Inventory and Materials
Management. Logistics Information Management, 5(2), 32 - 35.
Huson, M. and Nanda, D., 1995. The impact of just-in-time manufacturing on firm
performance in the US. Journal of Operations Management, 12, 297-310.
Hvide, H. K. and Møen, J., 2007. Liquidity Constraints and Entrepreneurial Performance.
Discussion Papers 2007/21, Department of Finance and Management Science,
Norwegian School of Economics.
Inmyxai, S., and Takahashiin, Y., 2010. The Effect of Firm Resources on Business
Performance of Male-and Female-Headed Firms in the Case of Lao Micro-, Small-,
and Medium-Sized Enterprises (MSMEs). International Journal of Business and
Information, 5(1), 63-86.
IOD, 1993. Late Payment of Debt: A Position Paper, Institute of Directors, London.
Islam, J. and Hu H., 2012. A review of literature on contingency theory in managerial
accounting, African Journal of Business Management, 6(15), 5159-5164.

235
Jain, N., 2001. Monitoring Costs and Trade Credit. Quarterly Review of Economics and
Finance, 41(1), 89-110.
James, C., 1987. Some evidence on the uniqueness of bank loans, Journal of Financial
Economics, 19(2), 217-235.
Jarvis, R., and Gillie, S., 1998. Late payment – can factoring help? Accounting &
Business. 33-34.
Jensen, M. C., and Meckling W. H., 1976. Theory of the Firm: Managerial Behavior,
Agency Costs and Ownership Structure. Journal of Financial Economics, 3(4), 305-
360.
Jensen, M., 1986. Agency cost of free cash flow, corporate finance and takeovers.
American Economic Review Papers and Proceedings, 76, 323-329.
Jensen, M., 1993. The modern industrial revolution, exit and the failure of internal control
systems. Journal of Finance, 48, 831-880.
Johnson, A., 1986. MRP?, MRPII?, OPT?, CIM?, FMS?, JIT? Is Any System Letter
Perfect?. Management Review, 9.
Jose M. L., Lancaster, C. and Stevens, J.L., 1996. Corporate Returns and Cash Conversion
Cycle. Journal of Economics and Finance, 20 (1), 33-46.
Kajola, S. O., 2008. Corporate Governance and Firm Performance: The Case of Nigerian
Listed Firms. European Journal of Economics, Finance and Administrative
Sciences, 14, 16-28.

236
Kakani, R. K. and Kaul, M., 2002. Firm Performance and Size in Liberalized Era: The
Indian Case. XLRI Jamshedpur School of Business Working Paper No. 2002-06.
Available from: http://ssrn.com/abstract=905001 [Accessed 3 May 2010].
Karaduman, H., Akbas, H. E., Caliskan, A. O., and Durer, S., 2011. The relationship
between working capital management and profitability: evidence from an emerging
market. International Research Journal of Finance and Economics, 62, 61-67.
Keasey, K., and Watson, R., 1992. Investment and Financing Decisions and the
Performance of Small Firms. National Westminster Bank: London.
Kellick, A., 2008. Advantages and disadvantages of listing on the Alternative Investment
Market. Available from:
http://www.tcii.co.uk/images/upload/guest_article_pdfs/gaandrewkillick_5485.pdf
[Accessed 5 September 2012].
Kieschnick. R., LaPlante. M., and Moussawi.R., 2008. Working Capital Management,
Access to Financing, and Firm Value, Working Paper. Available at SSRN:
http://ssrn.com/abstract=1431165.
Kim, W., 1997. The determinants of capital structure choice in the US restaurant industry,
Tourism Economics, 3, 329-340.
Kim, Y. and Atkins, J. 1978. Evaluating Investments in Accounts Receivable: A Wealth
Maximizing Framework. Journal of Finance 33: 403-412.
Kim, L. and Lim, Y., 1988. Environment, generic strategies, and performance in a rapidly
developing country: A taxonomic approach. Academy of Management Journal, 31:
802-827.
237
Klein, A., 1998. Firm Performance and Board Committee Structure. Journal of Law and
Economics, 41, 275-99.
Kohler, M., Britton, E., and Yates, T., 2000. Trade credit and the monetary transmission
mechanism. Bank of England Discussion Paper.
Korteweg, A., 2004. Financial leverage and expected stock returns: evidence from pure
exchange offers’’, available from: http://ssrn.com/abstract¼597922 (Accessed 10
February 2009).
Koumanakos, D.P., 2008. The effect of inventory on firm performance. International
Journal of Productivity and Performance Management, 57(5), 355−369.
Kraft, K., Puia, G. and Hage J., 1995. Structural contingency theory revisited: Main
effects versus interactions in Child’s national study of manufacturing and service
sectors. Canadian Journal of Administrative Sciences 12/3: 182–194.
Kyereboah-Coleman, A. 2007a. Corporate governance and firm performance in Africa: A
dynamic panel data analysis. In: International Conference on Corporate
Governance in Emerging Markets, 15th – 17th November, 2007, Sabanci
University, Istanbul, Turkey [Accessed 15 April 2011].
Kyereboah-Coleman, A., 2007b. The impact of capital structure on the performance of
microfinance institutions. Journal of Risk Finance, 8, 56-71.
Lartey V. C., Antwi S. and Boadi E. K., 2013. The Relationship between Liquidity and
Profitability of Listed Banks in Ghana. International Journal of Business and
Social Science, 4, 3.
238
Lawrence, P. R. and Lorsch, J. W., 1967. Organisation and Environment, Irwin,
Homewood, Illinois.
Lazaridis, I., and Tryfonidis, D., 2006. Relationship between working capital management
and profitability of listed companies in the Athens stock exchange. Journal of
Financial Management and Analysis, 19(1), 26-35.
Lee, Y. W., and Stowe, J. D., 1993. Product Risk, Asymmetric Information, and Trade
Credit. Journal of Financial and Quantitative Analysis, 28(2), 285–300.
Lee, C. C., 2012. The causal correlations among market structure, conduct and
performance of the CPA industry. The Service Industries Journal, 32(3), 431-450.
Lee, Y. W. and Stowe, J. D., 1993. Product Risk, Asymmetric Information, and Trade
Credit. Journal of Financial and Quantitative Analysis 28, 285–300.
Lehn, K., Sukesh, P. and Zhao, M., 2004. Determinants of the size and structure of
corporate boards: 1935-2000, Working Paper, Katz Graduate School of Business.
Lev B., and Sunder S., 1979. Methodological issues in the use of financial ratios. Journal
of Accounting and Economics, 1(3), 187-210.
Liang, N., and Li, J., 1999. Board structure and firm performance: New evidence from
China’s private firms. China Centre for Economic Research. Available from:
http://www.ccer.edu.cn/workingpaper/paper/e1999008.pdf [Accessed 16 May
2008].
Lipczynski, J. and Wilson J., 2004. The Economics of Business Strategy. Pearson
Education, - Business planning - 321
239
Lipton, M., and Lorsch, J., 1992, A modest proposal for improved corporate governance.
Business Lawyer, 48, 59-77.
Loderer, C., and Waelchli, U., 2010. Firm age and performance. MPRA Paper 26450,
University Library of Munich, Germany.
Long, M. S., Malitz, I. B. and Ravid, S. A., 1993. Trade Credit, Quality Guarantees, and
Product Marketability. Financial Management, 22(4), 117–127.
Lorsch, J. W., and MacIver, E., 1989. Pawns or potentates: The reality of America's
corporate boards. Boston: Harvard Business School Press.
Luo, X., Kanuri, V.K. and Andrews, M., 2013. How does CEO matter? The mediating role
of firm- employee and firm-customer relationship, Strategic Management Journal,
John Wiley & Sons.
Luthans, F. and Stewart, T. I., 1977. A General Contingency Theory of Management,
Academy of Management Review, 2, 181 – 195.
Majumdar, S.K., 1997. The Impact of Size and Age on Firm-Level Performance: Some
Evidence from India. Review of Industrial Organisation , 12 (2), 231-241.
Malherbe, S. and Segal N., 2003. South Africa: After Apartheid. In C. P. Oman (Eds.),
Corporate governance in development, the experiences of Brazil, Chile, India, and
South Africa: 247-251. Washington, OECD.
Mak, Y. T., and Yuanto, K., 2003. Board Size Really Matters: Further Evidence on the
Negative Relationship Between Board Size and Firm Value. Singapore Stock
Exchange.
Manager, 2009. Late payments to SMEs leap 40% to £256 billion. No.Spring, pp.8.
240
Mangena, M., Tauringana, V. and Chamisa, E., 2010. Corporate boards, ownership
structure and firm performance in an environment of severe political and economic
uncertainty. British Journal of Management, 23, 23-41.
Mangena, M and Tauringana, V., 2008. A study of the relationship between audit
committee factors and voluntary external auditor involvement in UK interim
reporting. International Journal of Auditing, 12(1), 43-63.
Marsh, D. and Furlong, P., 2002. A Skin Not A Sweater: Ontology and Epistemology in
Political Science, in D. Marsh and G. Stoker (Eds) Theory and Methods in Political
Science, 2nd Ed., Chapter 1, pp. 17-11.
Mascarenhas, B. and Aaker, D. A., 1989. Mobility barriers and strategic groups. Strategic
Management Journal, 10: 475-486.
Mason, E. S., 1939. Price and production policies of large-scale enterprise. American
Economic Review, Supplement 29.
Mathuva, D., 2010. The influence of working capital management components on
corporate profitability: a survey on Kenyan listed firms. Research Journal of
Business Management, 4(1), 1-11.
Mathuva, D. M., 2013. Determinants of Corporate Inventory Holdings: Evidence from a
Developing Country. The International Journal of Applied Economics and Finance
7(1): 1−22.
McGee, J. S., 1988. Industrial organisation . Englewood Cliffs, NJ: Prentice-Hall.
McMillan, J., and Woodruff, C., 1999. Interfirm Relationships and Informal Credit in
Vietnam. The Quarterly Journal of Economics, 114(4), 1285-1320.

241
McWilliams, A. and Smart, D., 1991. Incorporating demand dynamics into our theory of
the firm: Extending the resource base view of the firm. Paper presented at the
annual meeting of the Strategic Management Society, Toronto.
McGahan A. M., and Porter M. E., 1997. How much does industry matter really? Strategic
Management Journal, 18, 15–30.
McGee, J. and Thomas, H., 1986. Strategic groups: theory, research and taxonomy.
Strategic Management Journal, 7: 141-160.
McWilliams, A. and Smart, D., 1991. Incorporating demand dynamics into our theory of
the firm: Extending the resource base view of the firm. Paper presented at the
annual meeting of the Strategic Management Society, Toronto.
Mesher, G. M., and Zajac, E. E., 1997. The political economy of telecommunications in
Malaysia and Singapore: A structure-conduct-performance comparative analysis.
Information Economics and Policy, 9(3), 183–202.
Mehta, D.R. 1974. Working Capital Management, Prentice-Hall, Inc., Englewood Cliffs,
NJ.
Mian, S. L., and Smith, C. W., 1992. Accounts receivable management policy: theory and
evidence. Journal of Finance, 47(1), 169-200.
Mian, S. L., and Smith, C. W., 1992. Accounts receivable management policy: theory and
evidence. Journal of Finance, 47(1), 169-200.
Michaelas, N., Chittenden, F., and Poutziouris, P., 1999. Financial Policy and Capital
Structure Choice in UK SMEs: Evidence from Company Panel Data. Small
Business Economics, 12 (2), 113-130.

242
Miles, R. E., and Snow, C. C., 1978. Organisation and Environment, Harvard Graduate
School of Business Administration.
Miles, R. E. and Snow, C. C., 1984. Designing strategic Human Resources systems,
Organisation al Dynamics, Summer: 46-52.
Miller, M. H. 1977. Debt and taxes. Journal of Finance, 32, 261-275.
Miller, D., 1986. Configurations of strategy and structure: toward a synthesis. Strategic
Management Journal, 7: 233-249.
Miller, D. and Friesen, P. H., 1986. Porter’s (1980) generic strategies and performance: An
empirical examination with American data. Organisation Studies, 7: 37-55.
Miller, D., and Shamsie, J., 2001. Learning across the life cycle: experimentation and
performance among the Hollywood studio heads. Strategic Management Journal,
22: 725–745.
Milgrom, P. and Roberts, J., 1988. Communication and inventories substitutes in
organizing production. Scandinavian Journal Economics, 90, 275-89.
Miwa, Y and Ramseyer, J. M. 2005. Trade Credit, Bank Loans and Monitoring: Evidence
from Japan, in Harvard Law and Economics Discussion Paper nº. 527, October,
http://ssrn.com/abstract=843526.
Modigliani, F., 1957. Business Reasons for Holding Inventories and Their Macro-
Economic Implications, NBER Chapters. In: Problems of Capital Formation:
Concepts, Measurement, and Controlling Factors. National Bureau of Economic
Research, Inc, 495-511.

243
Modigliani, F., and Miller, M., 1963. Corporate income taxes and the cost of capital: A
correction. American economic Review, 433-443.
Mojtahedzadeh, V., Tabari, S. H. A., and Mosayebi, R., 2011. The Relationship between
Working Capital Management and Profitability of the Companies (Case Study:
Listed Companies on TSE). Internatinal Research Journal of Finance and
Economics, 76, 159-166.
Mol, J. M. and Wijnberg, N. M., 2011. From Resources to Value and Back: Competition
Between and Within Organisation s. British Journal of Management, 22 (1), 77–95.
Morgan, D. P., 1991. Will just-in-time inventory techniques dampen recessions? Economic
Review, Federal Reserve Bank of Kansas City, issue Mar, 21-33.
Mutenheri, E., 2003. The Determinants of Corporate Financial Policy in Zimbabwe;
Empirical evidence from company panel data. Thesis, (PhD). Loughborough
University.
Myers, S. C. and Majluf, N. S., 1984. Corporate financing and investment decisions when
firms have information investors do not have. Journal of Financial Economics, 13,
187-221.
Nadiri, M. I., 1969. The Determinants of Trade Credit in the U.S. Total Manufacturing
Sector. Econometrica, 37, 408-423.
Nazir, M. S. and Afza, T., 2009. Working Capital Requirements and the Determining
Factors in Pakistan. IUP Journal of Applied Finance, 15(4), 28-38.
244
Nelson, E. G., and De Bruijn, E. J., 2005.The Voluntary Formalization Of Enterprises In A
Developing Economy—The Case Of Tanzania. Journal of International
Development
Nelson, R. R., 2002. Technology, institutions, and innovation systems. Research Policy,
31(2), 265-272.
Ng, A. and Baek, H. Y., 2007. Free Cash Flow, Leverage, and Performance: Evidence
from Canadian Acquisitions. Journal of International Finance and Economics, 5(1),
11-26.
Ng, C. K., Smith, J. K., and Smith, R. L., 1999. Evidence on the determinants of trade
credit terms used in interfirm trade. Journal of Finance, 54(3), 1109-1129.
Nguyen, K. M., 2001. Financial management and profitability of small and medium
enterprises. Thesis, (PhD). Southern Cross University.
Nicholson, G. J. and Kiel, G. C., 2003. Toward an integrative theory of boards of directors:
the intellectual capital of the board. Paper presented at the Annual Meeting of the
Academy of Management: Democracy in a Knowledge Economy, 1–6 August,
Seattle, Washington.
Nilsen, J. H., 2002. Trade Credit and Bank Lending Channel Journal of Money, Credit and
Banking, 34 (1): 226-253.
Niskanen, J. and Niskanen, M., 2006. The Determinants of Corporate Trade Credit Policies
in a Bank-dominated Financial Environment: the Case of Finnish Small Firms.
European Financial Management. 12(1), 81–102.
245
Nobanee, H., 2009. Working capital management and firm’s profitability: an optimal cash
conversion cycle. . Available from: http://ssrn.com/abstract=1471230 [Accessed 10
October 2010].
Nobanee, H., Abdullatif, M., and AlHajjar, M., 2010. Cash conversion cycle and firm’s
performance of Japanese firms. Available from:
http://papers.ssrn.com/sol3/papers.cfm?abstract_id=1645118. [Accessed 17
October 2010].
Nobanee, H., and Alhajjar, M., 2009a. A note on working capital management and
corporate profitability of Japanese firms. http://ssrn.com/abstract=1433243.
[Accessed 12 October 2010].
Nobanee, H., and Alhajjar, M., 2009b. Working capital management, operating cash flow
and corporate performance. http://ssrn.com/abstract=1471236. [Accessed 10
October 2010].
Nobanee, H., AlShattarat, W., and Haddad, A. E., 2009. Optimizing working capital
management. Available from:
http://papers.ssrn.com/sol3/papers.cfm?abstract_id=1528894. [Accessed 20
October 2010].
Ntim C. G., 2013. An Integrated Corporate Governance Framework and Financial
Performance in South African-Listed Corporations. South African Journal of
Economics. 81, 3.
Ntim, C. G., 2012. An Integrated Corporate Governance Framework and Financial
Performance in South African Listed Corporations. South African Journal of
Economics, Forthcoming.
246
Ntim, C. G., Opong K. K. and Danbolt, J., 2012a. The Relative Value Relevance of
Shareholder versus Stakeholder Corporate Governance Disclosure Policy Reforms
in South Africa. Corporate Governance: An International Review, 20(1), 84-105.
Ocasio, W., 1994. Political Dynamics and the Circulation of Power: CEO Succession in
U.S. Industrial Corporations, 1960–1990. Administrative Science Quarterly,
39:285–312.
Ojo, A. S., 2012. The Effect of Financial Leverage on Corporate Performance of Some
Selected Companies in Nigeria. Canadian Social Science, 8(1), 85-91ISSN 1712-
8056.
Onaolapo, A. A., and Kajola, S.O., 2010. Capital Structure and Firm Performance:
Evidence from Nigeria. European Journal of Economics, Finance and
Administrative Sciences, 25, 70-82.
Oster, S. M., 1990. Modern competitive analysis. New York: Oxford University Press.
Padachi, K., 2006. Trends in Working Capital Management and its Impact on Firms
Performance. International Review of Business Research Paper, 2(2), 45-58.
Panagiotou, G., 2006. The impact of managerial cognitions on the structure-conduct-
performance (scp) paradigm: a strategic group perspective. Management Decision,
44(3), 423-41.
Paul, S.Y., 2004. Strategic Trade Credit: An Empirical Study. PhD Thesis, Leeds
University Business School, Leeds, UK.
Paul, S.Y. and Boden, R., 2008. The secret life of UK trade credit supply: Setting a new
research agenda. British Accounting Review, 40(3), 272–281.

247
Paul, S.and Wilson, N., 2006. Trade credit supply: an empirical investigation of companies
level data. Journal of Accounting-Business and Management 13 (85)113.
Paul, S.Y. and Boden, R., 2011(a). Size Matters: the Late Payment Problem. Journal of
Small Business and Enterprise Development, 18 (4): 732–47.
Paul, S.Y., Devi S. S. and Teh C. G., 2012. Impact of late payment on Firms' profitability:
Empirical evidence from Malaysia. Pacific-Basin Finance Journal 20, 777–792
Peel, M. J., Wilson, N., and Howorth, C. A., 2000. Late payment and Credit management
in the small firm sector: Some Empirical Evidence. International Small Business
Journal, 18(2), 52-68.
Peel, M.J. and Wilson, N., 1996. Working capital and financial management practices in
the small firm sector. International Small Business Journal 14 (2), 52e68.
Pennings, J. M., 1975. The relevance of the structural contingency model of organisation al
effectiveness. Administrative Science Quarterly, 20, 393–410.Peteraf, M.A., 1993.
The cornerstones of competitive advantage: a resource-based view. Strategic
Management Journal, 14, 179–191.
Penrose, E.T., 1959. The Theory of the Growth of the Firm. Oxford: Basil Blackwell.
Petersen M. A. and Rajan, R. G., 1997. Trade credit: Theories and evidence. Review of
Financial Studies, 10(3), 661-691.
Peteraf, M. A. 1993. The Cornerstones of Competitive Advantage: A Resource-Based
View. Strategic Management Journal; 14, (3), pp. 179–191.
Perrin, S. 1998. Credit control is power: techniques for efficient credit-control for small
and medium sized companies. Management Today, No.1 February, pp.78-9.
248
Pfeffer, J., 1972. Size and composition of corporate boards of director: The organisation
and its environment. Administrative Science Quarterly, 17, 218-229.
Pi, L., and Timme, S G., 1993, Corporate Control and Bank Efficiency. Journal of Banking
Finance, 17, 515-530.
Pike R., Cheng N.S., Cravens K., and Lamminmaki D., 2005. Trade credit terms:
asymmetric information and price discrimination evidence fromthree continents.
JBus Finance Account 32(5):1197–1236
Pike, R., and Cheng, N. S., 2001. Credit management: An examination of policy choices,
practices and late payment in UK companies. Journal of Business Finance and
Accounting, 28(7) pp.1013-1042.
Pike, R. H., Cheng, N. S. and Chadwick, L., 1998. Managing Trade Credit for
Competitive Advantage: A Study of Large UK Companies, CIMA Publishing,
London.
Porter, M. E., 1979. The structure within industries and companies’ performance. Review
of Economics and Statistics, 60: 214-227.
Porter, M. E., 1980. Competitive strategy. New York: The Free Press.
Porter, M. E., 1981. The contributions of industrial organisation to Strategic Management.
Academy of Management Review, 6:609-620.
Porter, M. E., 1985. Competitive advantage. New York: Free Press.
Porter, M. E., 1987. From competitive advantage to corporate strategy. Harvard Business
Review, 65: 43-59.
249
Punnose E. M., 2008. A Profitability Analysis of Business Group Firms vs. Individual
Firms in the Indian Electrical Machine Manufacturing Industry, The Icfai Journal
of Management Research, 7, 52-76.
Quartey, P., 2003. Finance and Small and Medium-sized Enterprise development in Ghana.
Thesis, PhD. University of Manchester.
Raheman, A., Afza, T., Qayyum, A., and Bodla, M. A., 2010. Working capital
management and corporate performance of manufacturing sector in Pakistan.
International Research Journal of Finance and Economics, 47, 156-169.
Raheman, A., and Nasr, M., 2007. Working capital management and profitability – case of
Pakistani firms. International Review of Business Research Papers, 3(1), 279-300.
Raia, Ernest. 1990. JIT Delivery: Redefining ’On-Time’. Purchasing, 109(13), 64–76.
Rajeev, N., 2008. Do IM practices affect economic performance? An empirical evaluation
of the machine tool SMEs in Bangalore. International Journal of Management
Science and Engineering Management.3(4): 312−320.
Raheja, C. G., 2005. Determinants of board size and composition: A theory of corporate
boards, Journal of Financial and Quantitative Analysis, 40, 283-306.
Ramachandran, A. and Janakiraman, M., 2009. The relationship between working capital
management efficiency and EBIT. Managing Global Transitions, 7(1), 61-74.
Ray, M. A., 1992. Economic Education, Experimental Methods and the Structure-Conduct-
Performance Paradigm. American Economist, 36:2 (Fall), 66-71.

250
Renders, A., Gaeremynck A. and Sercu P., 2010. Corporate Governance Ratings and
Company Performance: A Cross-European Study. Corporate Governance: An
International Review, 18, 87-106.
Ross, S. A., Westerfield, R. W. and Jaffe, J. F. 2002. Corporate Finance, 6th Edition,
McGraw-Hill Companies Inc., New York, USA.
Rotemberg, J. and Saloner, G., 1989. The cyclical behaviour of strategic inventories.
Quarterly Journal of Economics, 104, 73-97.
Ruback, R. and Sesia, A., 2000. Dell's Working Capital. Harvard Business School Case
201-029.
Rueda-Manzanares, A., Aragón-Correa, J. A. and Sharma, S., 2008. The influence of
stakeholders on the environmental strategy of service firms: The moderating effects
of complexity, uncertainly and munificence. British Journal of Management, 19,
185–203.
Ruland, W., Zhou, P., 2005. Debt, Diversification and Valuation. Review of Quantitative
Finance and Accounting, 25, 277-291.
Rumelt R., 1991. How much does industry matter? Strategic Management Journal 12(3),
167–185.
Rumelt, R. P., 1974. Strategy, structure and economic performances. Cambridge: Harvard
University Press.
Rumelt, R. P., 1984. Towards a strategic theory of the firm. Pp.556-570 in R. Lamb (Ed.),
Competitive strategic management. Englewood Cliffs, NJ: Prentice-Hall.

251
Runyan, R., Huddleston, P. and Swinney, J., 2006. Entrepreneurial orientation and social
capital as small firm strategies: a study of gender differences from a Resource-
Based View, Entrepreneurship Management, 2: 455-477.
Ruubel, R., and Hazak, A., 2011. Is There a Relationship between Company Profitability
and Salary Level? A Pan-European Empirical Study. International Conference on
Innovation, Management and Service, 14(2011) (2011) IACSIT Press, Singapore.
Saleem, Q., and Rehman, R. U., 2011. Impacts of liquidity ratios on profitability (case of
oil and gas companies of Pakistan). Interdisciplinary Journal of Research in
Business, 1(7), 95-98.
Samiloglu, F., and Demirgunes K., 2008. The Effect of Working Capital Management on
Firm Profitability: Evidence from Turkey. The International Journal of Applied
Economics and Finance, 2(1): 44-50.
Samuelson, P. A. 1965. Foundations of economic analysis. Valley Forge, MA: Atheneum.
Sartoris, W. and Hill, N., 1981. Evaluating Credit Policy Alternatives: A Present Value
Framework. Journal of Financial Research, 4, 81-89.
Sartoris, W. and Hill, N., 1983. A Generalized Cash Flow Approach to Short-Term
Financial Decision. Journal of Finance 38, 349-360.
Saunders, M. N. K. Lewis, P. and Thornhill, A., 2003. Research methods for business
students, 3rd ed. Harlow: FT Prentice Hall.
Schaffer, R. H., Thomson, H. A., 1992. Successful change programs begin with results.
Harvard Business Review, 80-89.

252
Scherer, F. M., 1980. Industrial market structure and economic performance. Boston:
Houghton Mifflin.
Schmalensee R., 1985. Do markets differ much? American Economic Review, 75: 341–
351.
Schwartz, A., 1974. An economic model of trade credit. Journal of Financial and
Quantitative Analysis, 9, 643-657.
Schwartz, R., and Whitcomb, D., 1979. The Trade Credit Decision. In: Bicksler, J, ed.
Handbook of Financial Economics. North-Holland, New York.
Scott, W.R., and Cole, R., 2000. The Quality Movement and Organisation al Theory, Sage,
Thousand Oaks, CA, pp. 13-14.
Sekaran, U., 2000. Research method for business: A skill building approach, John Wiley
and Sons, Inc.
Sen M., and Oruc, E., 2009. Relationship Between Efficiency Level of Working Capital
Management and Return on Total Assets is ISE. International journal of Business
and Management, 4(10), 109-114.
Serrasqueiro, Z. S., and Nunes, P. N., 2008. Performance and Size: Empirical Evidence
from Portuguese SMEs. Small Business Economics, 31(2), 195-217.
Shah, R. and Shin, H. 2007. Relationships among information technology, inventory, and
profitability: an investigation of level invariance using sector level data. Journal of
Operations Management. 25(4), 768-84.
Shakir, R., 2008. Board size, board composition and property firm performance. Pacific
Rim Property Research Journal, 14(1), 1-16.
253
Sharma, A. K. and Kumar, S., 2011. Effect of Working Capital Management on Firm
Profitability. Global Business Review, 12(1), 159-173.
Shen, W., 2003. The Dynamics of the CEO-board Relationship: An Evolutionary
Perspective’, Academy of Management Review, 28, pp. 466–476.
Sheel, A., 1994. Determinants of capital structure choice and empirics on leverage
behaviour: A comparative analysis of hotel and manufacturing firms. Hospitality
Research Journal, 17, 3-16.
Shen, W. and Cannella A. A., 2002. Power Dynamics within Top Management and their
Impact on CEO Dismissal followed by Inside Succession. Academy of
Management Journal, 45, 1195–1206.
Shen, W., 2003. The dynamics of the CEO-board relationship: an evolutionary perspective.
Academy of Management Review, 28(3). 466–476.
Shepherd, W. G., 1989. Public Enterprise: Criteria and Cases, in: de Jong, H. W. (ed.), The
Structure of European Industry, Dordrecht: Kluwer Academic Publishers.
Sheridan, J. H., 1989. Ignoring the Real Promises of JIT? Industry Week, 6, 44-45.
Shi, X. and Zhang, S., 2010. An incentive-compatible solution for trade credit term
incorporating default risk. European Journal Of Operational Research 206(1): 178-
196.
Shin, H. H. and Soenen, L., 1998. Efficiency of Working Capital and Corporate
Profitability. Financial Practice and Education 8, 37-45.
Shipley, D. and Davis, L., 1991. The role and burden allocation of credit in distribution
channels. Journal of Marketing Channel, 1: 3-22.

254
Shipley, D., Davis, L., 1991. The role and burden allocation of credit in distribution
channels. Journal of Marketing Channels 1, 3-22.
Short, J., Ketchen, D., Palmer, T., and Hult, G.T., 2007. Firm, strategic group, and industry
influences on performance. Strategic Management Journal, 28(2), 147-167.
Silverman, D., 2005. Doing Qualitative Research-a practical handbook. 2nd
ed Sage,
London
Singh, H. and Montgomery, C. A., 1987. Corporate acquisition strategies and economic
performance. Strategic Management Journal, 8: 377-386.
Singh, A., and Whittington, G., 1975. The Size and Growth of Firms. Review of Economic
Studies, 62, 15-26.
Smith, J.K., 1987. Trade Credit and Informational Asymmetry, Journal of Finance, 42,
863-872.
Smith, K. G., Gutherie, J. P. and Chen, M. J., 1989. Strategy, size and performance.
Organisation Studies, 10: 63-81.
Smith, K., 1980. Profitability versus Liquidity Tradeoffs in Working Capital Management,
in Readings on the Management of Working Capital, West Publishing Company,
St. Paul, New York.
Sohal, A. S., Ramsay, L., and Samson, D., 1993. JIT manufacturing: industry analysis and
a methodology for implementation. International Journal of Operations and
Production Management, 13(7), 22-56.
Spanos Y., Zaralis, G. and Lioukas, S., 2004. Strategy and Industry Effects on
Profitability: Evidence from Greece. Strategic Management Journal, 25, 139–165.
255
Sprague, L. G and Wacker. J. G., 1996. Macroeconomic analyses of inventories: learning
from practice. International journal of production economics 45(1-3) 231–237
Soenen L.A., 1993. Cash conversion cycle and corporate profitability. Journal of Cash
Management, 13, 4, 53-58.
Sorensen, J. B., and Stuart, T. E., 2000. Aging, Obsolescence, and Organisation al
Innovation. Administrative Science Quarterly, 81-112.
Stephen, M. and Elvis, K., 2011. Influence of Working Capital Management on Firms
Profitability: A Case of SMEs in Kenya. International Business Management, 5(5),
279-286.
Stinchcombe, A. L., 1965. Social Structure and Organisation s. In March, J. G, ed.
Handbook of Organisation s. Chicago: Rand McNally.
Sunder, L. S. and Myers, S.C., 1999. Testing static trade-off against pecking order models
of capital structure, Journal of Financial Economics. 51, 219-244.
Summers, B. and Wilson, N., 2000. Some empirical evidence on late payment in the UK.
Credit Management.
Symeou, P., 2010. The Firm Size-Performance Relationship: An Empirical Examination of
the Role of the Firm's Growth Potential. Avialable from:
http://www.industrystudies.pitt.edu/pittsburgh11/documents/Papers/PDF%20Paper
s/6-2%20Symeou.pdf. [Accessed 3 April 2011].
Szulanski, G., 1996. Exploring internal stickiness: Impediments to the transfer of best
practice within the firm. Strategic Management Journal, 17, 27–43.
256
Tauringana, V. and Afrifa G. A. 2013. The relative importance of working capital
management and its components to SMEs profitability. Journal of Small Business
and Enterprise Development, 20(3), 1462-6004.
Teece, D., and Pisano G., 1998. The Dynamic Capabilities of Firms: an Introduction, 193-
214. In Dosi, G., Teece, D. J. and Chytry, J, eds. Technology, Organisation and
Competitiveness. Perspectives on Industrial and Corporate Change. Oxford: Oxford
University Press.
Titman, S., and Wessles, R., 1988. The determinants of capital structure choice. Journal of
Finance 43(1), 1-19.
Tirta, M., 2006. Creating relational rents: The effect of business groups on affiliated firms’
performance in Indonesia. Asia Pacific Journal of Management, 23(4), 537-557.
Tunc, E.A. and Gupta, N.D., 1993. Is time a competitive weapon among manufacturing
firms?. International Journal of Operations & Production Management, 13(3), 4-13.
Uadiale, O. M., 2010. The Impact of Board Structure on Corporate Financial Performance
in Nigeria. International Journal of Business and Management, 5(10), 155-161.
Upneja, A and Dalbor, M. C., (2001). An examination of capital structure in the restaurant
industry, International Contemporary Hospitality Management, 13(2), 54-59.
Uyar, A., 2009. The relationship of cash conversion cycle with firm size and profitability:
an empirical investigation in Turkey. International Research Journal of Finance and
Economics 24: 186−193.
Wald, J. K., 1999. How firm characteristics affect capital structure: an international
comparison. Journal of Financial research, 22(2), 161-188.
257
Wang, Y. J., 2002. Liquidity management, operating performance, and corporate value:
evidence from Japan and Taiwan. Journal of Multinational Financial Management,
12, 159-169.
Waterhouse J. and Tiessen P., 1978. A contingency framework for management
accounting system. Accounting Organisation & Society, 3(1), 65–76.
Wen, Y., 2003. Understanding the Inventory Cycle. Journal of Monetary Economics, 52,
1533-1555.
Weill, L., 2003. Leverage and Corporate Performance: A Frontier Efficiency Analysis on
European Countries. EFMA 2003 Helsinki Meetings. Available from:
http://ssrn.com/abstract=300640 [Accessed 12 July 2010].
Weinraub, H. and Visscher, S., 1998. Industry Practice Relating to Aggressive
Conservative Working capital Policies. Journal of Financial and strategic Decisions
11 (2) 11-18.
Wernerfelt, B., 1984. A resource-based view of the firm, Strategic Management Journal,
5, 171-80.
Wernerfelt, B., and Montgomery, C. A., 1988. Tobin’s Q and the Importance of Focus in
Firm Performance. American Economic Review, 78(1), 246-250.
Wilner, B. S. 2000. The exploitation of relationship in financial distress: the case of trade
credit, Journal of Finance, 55, 153-178.
Wilson, N. 2008. An Investigation into Payment Trends and Behaviour in the UK: 1997-
2007. CMRC Centre, Leeds University Business School, Leeds.

258
Wilson, N., Watson, K., Singleton, C. and Summers, B., 1996. Credit Management, Late
Payment and the SME Business Environment: A Survey. Credit Management
Research Group, University of Bradford.
Wilson, N., Watson, K. and Summers, B., 1995. Trade Relationships, Credit Management
and Corporate Performance: A Survey. Credit Management Research Group,
University of Bradford.
Wilson, N. and Summers, B., 2002. Trade Credit Terms Offered by Small Firms: Survey
Evidence and Empirical Analysis, Journal of Business Finance and Accounting, 29:
317-351.
Wincent, J., Anokhin, S. and Örtqvist, D., 2010. Does network board capital matter? A
study of innovative performance in strategic SME networks. Journal of Business
Research, 63, 265–275.
White, R. E., 1986. Generic business strategies, organisation al context and performance:
An empirical analysis. Strategic Management Journal, 7: 2 17-231.
Whited, T.M., 1992. Debt, liquidity constraints, and corporate investment: evidence from
panel data. Journal of Finance 47, 1425- 1460.
Wooldridge, J., 2002. Econometrics Analysis of Cross Section and Panel Data, MIT Press.
Woodward, J., 1965. Industrial Organisation: Theory and Practice, Oxford University
Press, London.
Vafeas, N., 1999. Board Meeting Frequency and Firm Performance. Journal of Financial
Economics, 53, 113-142.

259
Van den Berghe L. and Levrau A., 2004. Evaluating boards of directors: what constitutes a
good corporate board? Corporate Governance – An international Review, 12(4),
461-478.
Van de Ven, A. H. and Ferry D. L. 1980. Measuring and Assessing Organisation s, New
York, John Wiley and Sons.
Van de Ven, A. H. and Drazin, R., 1985. The concept of fit in contingency theory.
Research in Organisation al Behaviour, 7: 333-365.
Vastag, G. and Whybark, C., 2005. Inventory management: is there a knock-on effect?,
International Journal of Production Economics, 93-94, 129-38.
Van Horne, J. C., and Wachowiez, J. M., 2001. Fundamentals of Financial Management.
11th edn. Prentice Hall Inc., New York.
Velnampy. T. and Niresh, J. A. 2012. The Relationship between Capital Structure and
Profitability. Global Journal of Management and Business Research, Volume 12
Issue 13.
Venkatraman, N. and Prescott J. E. 1990. Environment-strategy coalignment: an empirical
test of its performance Implications. Strategic Management Journal, 11, 1–23.
Vishnani, S., Shah, B. K., 2007. Impact of Working Capital Management Policies on
Corporate Performance: An Empirical Study. Global Business Review, 8, 267-281.
Yang, C., and Chen K., 2009. Are small firms less efficient? Small Business Economics,
32(4), 375-395.
Yermack, D., 1996. Higher market valuation of companies with a small board of directors.
Journal of Financial Economics, 40(2), 185–221.

260
Younies, H., Barhem, B., and Ed Hsu, C., 2007. A review of the Adoption of Just-In-Time
method and its effect on efficiency. The Public Administration & Financial
Management, an Interactive Journal (PAMIJ), 12, 2.
Zainudin, N., 2008. Tracking the credit collection period of Malaysian small and medium-
sized enterprises. International Business Research 1 (1), 78–86.
Zajac, E. J., and Westphal, J. D., 1996. Director reputation, CEO-board power, and board
interlocks. Administrative Science Quarterly, 41, 507-529.
Zariyawati M. A., Annuar M. N., and Raman A. S. A., 2009. Effect of Working Capital
Management on Profitability of Firms in Malaysia. University Pura Malaysia,
Malaysia.
Zeithaml C P. and Zeithaml V. A., 1988. Environmental Management: Revising the
Marketing Perspective, Journal of Marketing, 48, 46-53.
Zikmund, W.G., 1997. Business Research Methods, Fort Worth: The Dryden Press.
Zikmund, W. G., 2003. Business Research Methods. Mason, OH: South Western.
Zona, F., Zattoni, A. and Minichili, A., 2012. A contingency model of boards of directors
and firm innovation: The moderating role of firm size. British Journal of
Management. ••, ••–••
Zajac, E. J., and Westphal, J. D., 1996. Director reputation, CEO-board power, and board
interlocks. Administrative Science Quarterly, 41, 507-529.