Embed Size (px)
Citation preview

Working Document to
ICES Working Group on Widely distributed Stocks (WGWIDE), ICES Headquarters, Copenhagen, Denmark, 27 August-2 September 2013
Cruise report from the coordinated ecosystem survey
(IESSNS) with M/V ”Libas”, M/V “Eros”; M/V “Finnur Fríði” and R/V “Arni Fridriksson” in the Norwegian Sea and surrounding
waters, 2 July - 9 August 2013
Leif Nøttestad, Kjell Rong Utne, Valantine Anthonypillai, Øyvind Tangen, John Willy Valdemarsen
Institute of Marine Research, Bergen, Norway
Guðmundur J. Óskarsson, Sveinn Sveinbjörnsson, Sigurður Jónsson Marine Research Institute, Reykjavik, Iceland
Högni Debes, Ebba Mortensen, Leon Smith, Anna Ólafsdóttir, Jan Arge Jacobsen
Faroe Marine Research Institute, Tórshavn, Faroe Islands

Ecosystem Survey in Northeast Atlantic July-August 2013
2
Abstract....................................................................................................................... 3 Introduction................................................................................................................ 4 Material and methods ................................................................................................ 4
Hydrography and Zooplankton..................................................................... 5 Trawl sampling ............................................................................................... 5 Marine mammal observations........................................................................ 5 Underwater camera observations during trawling ...................................... 7 Digital photos and filming ............................................................................. 8 Acoustics .......................................................................................................... 8 Intercalibration of Multpelt 832 pelagic trawl ............................................... 9 Cruise tracks .................................................................................................... 9 Swept area index and biomass estimation .................................................. 11
Results....................................................................................................................... 13 Hydrography ........................................................................................... ..... 12 Zooplankton .................................................................................................. 17 Pelagic fish species ........................................................................................ 18
Mackerel................................................................................................................18 Norwegian Spring-spawning herring...................................................................27
Blue whiting...........................................................................................................29
Marine mammal observations..............................................................................32
Discussion................................................................................................................. 32
Recommendations ...................................................................................................34
General recommendations....................................................................................34 To the participants in the survey..........................................................................34
Survey participants .................................................................................................. 35 Acknowledgements ................................................................................................. 36 References ................................................................................................................. 36 Annex 1 Intercalibration of the Multpelt 832 between vessels.............................. 37
Annex 2 Swept area estimates in the different Exclusive Economical Zones ...... 41

Ecosystem Survey in Northeast Atlantic July-August 2013
3
Abstract
The international coordinated ecosystem survey in the Norwegian Sea and adjacent areas (IESSNS) was performed during 2 July to 9 August 2013 by four vessels from Norway (2), Iceland (1) and Faroese (1). A standardised pelagic trawl swept area method has been developed and used to estimate a swept area abundance estimate of NEA mackerel in the Nordic Seas in recent years. The method is analogous to the various bottom trawl surveys run for many demersal stocks.
The total swept area estimate of NEA mackerel in summer 2013 was 8.8 million tonnes based with coverage of 3.2 million square kilometres in the Nordic Seas from about 55.30 degrees up to 74.50 degrees north and from the Norwegian coast in east and west to the Irminger Sea in Greenland waters. The 2010 year class contributed to more than 20% in number followed by abundant 2006, 2007 and 2011-year classes around 15% each, respectively. The 2008 year class was also well represented in the catches, contributing with 12% of the total number. The mackerel was distributed in most of the surveyed area, and the zero boundaries were found in many areas, although not in the west in Greenland waters, south in the North Sea and west of the British Isles. Approximately 10% of the mature mackerel sampled during the survey had not yet spawned in the Nordic Seas based on systematic and standard gonad maturity measurements performed after each standardized trawl haul onboard all the vessels.
The geographical coverage and survey effort in 2013 (3.2 mill km2) was significantly larger than in 2012 (1.5 mill km2) and in 2010 (1.7 mill km2), while the coverage in 2011 was limited (1.1 mill km2). In 2011 the northern part of the Norwegian Sea was not properly covered due to only one Norwegian vessel participating in the survey. The swept area biomass estimates of 4.8 million tonnes in 2010, 5.1 million tonnes estimate in 2012 may be compared with the biomass estimate of 8.8 million tonnes in 2013. These abundance estimates strongly suggest that the NEA mackerel have increased significantly both in geographical distribution and abundance. All these biomass estimates must be considered to be underestimations and only represent part of the stock.
The spatiotemporal overlap between NEA mackerel and NSS herring in July-August 2013 was highest in the south-western part of the Norwegian Sea (Faroese, east Icelandic area and Jan Mayen waters). Herring were most densely aggregated in close relation to where we found the highest concentrations of zooplankton. Mackerel, on the other hand, were found over much larger areas and present in areas with varying zooplankton concentrations.
Acoustic estimations of NSS herring and Atlantic blue whiting were also done during the survey from calibrated echousounder data. The biomass of Norwegian spring-spawning herring was estimated to 8.6 million tonnes in July-August 2013. The previous acoustic abundance estimates of NSS herring from the survey were 13.6 million tonnes in 2009, 10.7 million tonnes in 2010 and 7.3 million tonnes in 2012. Thus, the trend in the July survey clearly follows first the negative trend in the biomass estimates from the assessment and in 2013 followed by an increase, partly due to the 2009 year class coming into the adult population. The herring was mainly found in the outskirt of the Norwegian Sea; i.e. from north of the Faroes, the east Icelandic area and north in the Jan Mayen area, with small concentrations in the central and eastern areas.
This survey confirmed the presence of young blue whiting (ages 1-2) in the summer feeding areas. The concentrations were highest along the continental shelf of Norway in the eastern Norwegian Sea and in an area west of Iceland.
The temperatures in the Nordic Seas in July-August 2013 are now close to the long-term average except for in the northern part of the Norwegian Sea with higher temperatures than the average temperature during the last 20 years.

Ecosystem Survey in Northeast Atlantic July-August 2013
4
The concentrations of zooplankton in the Nordic Seas indicate to have increased from average concentrations of 6 g/m2 in July-August 2012 up till 8.6 g/m2 in July-August 2013.
Whale observations were done by the two Norwegian vessels during the survey. The number of marine mammal sightings was generally low in the central and eastern part of the Norwegian Sea but with considerable higher numbers of especially fin whales in the northern Norwegian Sea and into the Barents Sea. Groups of killer whales were observed in central Norwegian Sea, whereas fin and humpback whales where mainly observed near Jan Mayen, Bear Island and the southwestern part of the Barents Sea and off the coast of Finnmark.
All vessels that participated in the IESSNS 2013 survey used the same designed pelagic sampling trawl (Multpelt 832) and similar protocol for both rigging and operation agreed upon in Hirtshals in February 2013 (ICES 2013). The swept area methodology for abundance estimation of NEA mackerel was further developed by dedicated experiments with parallel trawling and direct comparison of mackerel trawl catches between vessels in the same areas. Trawling experiments were done with multi-beam sonar monitoring of mackerel behaviour and aggregation before and during trawling. Systematic underwater video recordings of mackerel swimming and aggregation behaviour, patchiness and catchability were also conducted.
The ultimate goal is to get accepted and use this combined swept area estimate as an absolute/relative abundance index of spawning stock biomass (SSB) and possibly recruitment index, on an annual basis in the assessment of NEA mackerel after the NEA mackerel benchmark in February 2014.
Introduction
In July-August 2013, four vessels; the chartered trawler/purse seiners M/V “Libas” and M/V “Eros” from Norway, and M/V “Finnur Fríði” from Faroe Islands, and the research vessel R/V “Arni Friðriksson” from Iceland, participated in the joint ecosystem survey (IESSNS) in the Norwegian Sea and surrounding waters. The five weeks coordinated survey from 2nd of July to 9th of August is part of a long-term project to collect updated and relevant data on abundance, distribution, aggregation, migration and ecology of northeast Atlantic mackerel and other major pelagic species. Major aims of the survey were to quantify abundance, spatio-temporal distribution, aggregation and feeding ecology of Northeast Atlantic mackerel in relation to distribution of other pelagic fish species such as Norwegian spring-spawning herring and blue whiting, oceanographic conditions and prey communities. Whale observations were conducted on the Norwegian vessels in order to collect data on distribution and aggregation of marine mammals in relation to potential prey species and the physical environment. The pelagic trawl survey was initiated by Norway in the Norwegian Sea in the beginning of the 1990’s. Faroe Islands and Iceland have been participating on the joint mackerel-ecosystem survey since 2009, but the Icelandic survey results for 2009 were not included in a joint cruise report that year.
Material and methods
Coordination of the survey was done by correspondence during the spring and summer 2013 and in relation to the international ICES WKNAMMM workshop in February 2013 in Hirtshals, Denmark. The participating vessels together with their effective survey periods are listed in Table 1.
In general, the weather was mostly calm with good survey conditions for oceanographic monitoring, plankton sampling, acoustic registrations and pelagic trawling. Although Finnur Fríði experienced some bad weather in the southern part of the area in the beginning of the survey, the weather conditions did not

Ecosystem Survey in Northeast Atlantic July-August 2013
5
affect the quality to any extent of the various scientific data collection during the survey for the involved survey vessels.
During this year’s survey the special designed pelagic trawl, Multpelt 832, was used by all four participating vessels for the second year. This trawl is a product of a cooperation of participating institutes in designing and construction of a standardized sampling trawl for this survey in the future for all participants. The work lead by trawl gear scientist John Willy Valdemarsen, Institute of Marine Research (IMR), Bergen, Norway, has been in progress for three years. The design of the trawl was finalized during meetings of fishing gear experts and skippers at meetings in January and May 2011. Further discussions on modifications in standardization between the rigging and operation of Multpelt 832 was done during a trawl expert meeting in Copenhagen 17-18 August 2012, in parallel with the post-cruise meeting for the joint ecosystem survey, and then at the WKNAMMM workshop and tank experiments on a prototype (1:32) of the Multpelt 832 pelagic trawl, conducted as a sequence of trials in Hirtshals, Denmark from 26 to 28 February 2013 (ICES 2013).
Table 1. Survey effort by each of the four vessels in the July-August survey in 2013.
Vessel Effective survey period
Length of cruise track (nmi)
Trawl stations CTD stations Plankton station
Arni Friðriksson 12/7-9/8 5830 111* 96 98
Finnur Fríði 2/7- 17/7 2500 45* 37 37
Libas 6/7-29/7 4213 71** 67 67
Eros 6/7-29/7 3454 81** 74 74
Total 2/7-9/8 15997 308 274 272
*Including 8 intercalibration trawl hauls.
** Including 4 intercalibration trawl hauls
Hydrography and Zooplankton
The hydrographical and plankton stations by all vessels combined are shown in Figure 2. Arni Fridriksson was equipped with a SEABIRD CTD sensor with a water rosette that was applied during the entire cruise. Finnur Fríði was equipped with a mini SEABIRD SBE 25+ CTD sensor, and Eros and Libas were equipped with a SAIV SD200 CTD sensor, recording temperature, salinity and pressure (depth) from the surface down to 500 m, or when applicable as linked to maximum bottom depth.
All vessels collected and recorded also oceanographic data from the surface either applying a thermosalinograph (temperature and salinity) placed at approximately 6 m depth underneath the surface or a thermograph logging temperatures continuously near the surface throughout the survey.
Zooplankton was sampled with a WP2-net on all vessels. Mesh sizes were 180 µm (Libas and Eros) and 200 µm (Arni Fridriksson and Finnur Fríði). The net was hauled vertically from a depth of 200 m (or bottom depth at shallower stations) to the surface at a speed of 0.5 m/s. All samples were split in two, one half preserved for species identification and enumeration, and the other half dried and weighed.
Zooplankton sampling was performed on each predefined station; 67 stations on Libas, 74 stations on Eros, 98 stations on Arni Fridriksson and 37 stations on Finnur Fríði.
Trawl sampling
Catches from trawl hauls were sorted and weighed; fish were identified to species level, when possible, and other taxa to higher taxonomic levels. The full biological sampling at each trawl station varied between nations and is presented in Table 2.

Ecosystem Survey in Northeast Atlantic July-August 2013
6
Table 2. Summary of biological sampling in the survey from 2nd of July to 9th of August 2013 by the four participating countries. Numbers denote the maximum number of individuals sampled for each species for the different determinations.
Species Faroes Iceland Norway Length measurements Mackerel 100* 100 100 Herring 100* 200 100 Blue whiting 100* 100 100 Other fish sp. 0 50 25 Weighed, sexed and maturity determination Mackerel 15 50 25 Herring 15 50 25 Blue whiting 15 50 25 Other fish sp. 10 10* 0 Otoliths/scales collected Mackerel 15 25 25 Herring 15 50 25 Blue whiting 50 50 25 Other fish sp. 0 0 0 Stomach sampling Mackerel 10 10 10 Herring 10 10 10 Blue whiting 10 10 10 Other fish sp. 0 0 10*
*are also weighted
All vessels used the newly designed and constructed Multpelt 832 pelagic trawl aimed for standardization of fishing gear used in the survey (see ICES WKNAMMM 2013). The most important properties of the Multpelt 832 trawls during the survey and their operation were as shown in Table 3.

Ecosystem Survey in Northeast Atlantic July-August 2013
7
Table 3. Trawl settings and operation details during the international mackerel survey in the Nordic Seas in July-August 2013. The column for influence indicates observed differences between vessels likely to influence performance. Influence is categorized as 0 (no influence) and + (some influence).
Properties Libas Arni Fridriksson Eros Finnur Fridi
Influence
Trawl producer
Egersund Trawl AS Tornet/Hampiðjan (50:50)
Egersund Trawl AS
Vónin 0
Warp in front of doors Dyneema – 36 mm Dynex-34 mm Dyneema -32 mm Dynex – 34mm + Warp length during towing
350 m 350 m 350 m 350 m 0
Difference in warp length port/starboard
0-4 m 3-12 m 0-4 m 5-12 m 0
Weight at the lower wing ends
400 kg 400 kg 300 kg 400 kg 0
Setback in metres 6 m 6 m 6 m 6 m + Type of trawl door Seaflex adjustable
hatches Jupiter Seaflex adjustable
hatches Injector F-15 0
Weight of traw door 2000 kg 2200 kg 1700 kg 2000 kg + Area trawl door 9 m2 75% hatches
(effective 6.5m2) 7 m2 7.5 m2 25% hatches
(effective 6.5m2) 6 m2 +
Towing speed (GPS) in knots
4.6 (4.3-5.2) 5.0 (4.5-5.5) 4.5 (4.3-4.7) 4.9 (4.1-5.1) +
Setting time 5-6 min 3.5-6 min 5-6 min 5-6 min + Trawl height 26-34 27-30 29-31 ~ 35 + Door distance 115-125 m 113-117 m 120-125 m 110 + Trawl width* - 64-68 m - ~ 60 m + Turn radius 2-8 degrees turn 5-10 degrees turn 5-6 degrees turn 5-10 degrees turn + Hauling time warp 5-6 min 3.5-6 min 5-6 min 5 min + A flapper in front end of cod-end
Yes No Yes No +
Trawl door depth (port and starboard)
5-12, 5-12 m 8-13, 10-15 m 10-15 m 5-15 m +
Headline depth 0-1 m 0-1 m 0-1 m 0-1 m + Float arrangements on the headline
Kite +2 buoys on each wing
Kite + 2 buoys on wings
Kite with 1 elongated buoy + 2 buoys on each wingtip
Dynex float rope, whole headline (382 kg buoyancy) + 2 buoys on wings and 1 in middle
+
Weighing of catch All weighted All weighted All weighted All weighted +
Marine mammal observations
Observations of marine mammals were conducted by trained scientific personnel and crew members from the bridge between 4th and-28th of July 2013 onboard the Norwegian chartered vessels M/V “Libas” and M/V “Eros” respectively. The priority periods of observing were during the transport stretches from one trawl station to another. Observations were done 24 h per day if the visibility was sufficient for marine mammal sightings. Digital filming and photos were taken whenever possible on each registration from scientists onboard.
Underwater camera observations during trawling
“Libas” and “Eros” attached a portable camera inside the trawl to record videos during the trawl hauls. The purpose of the video recordings was to quantify the efficient trawling period as well as observing the mackerel behaviour inside the trawl. By comparing when the fish were entering the trawl to the time used to shoot out and retrieve the trawl, a qualitative estimate of the fishing abilities of the trawl during shooting and hiving could be achieved. The cameras used were of brand “GoPro HD Hero 3 Black Edition” put
Ecosystem Survey in Northeast Atlantic July-August 2013
8
inside a waterproof box able to tolerate the pressure down to 60 m depth. Hence, it was not possible to use the camera during deep hauls targeting blue whiting. It was not used external light so the camera recordings from the night hauls were not useable. The camera position was changes regularly to get observations from different parts of the trawl. The positions were between the codend and the 400 mm meshes in the trawl, attached to the top, bottom or the sides of the trawl. Video recordings were taken during 51 of the trawl hauls onboard Eros.
Observation positions of GoPro camera during experiments onboard “Eros” and “Libas” are indicated with arrows on sketch below.
Digital photos and filming
Digital photography with Nikon D70, D200 camera on smart phones in addition to digital filming with Sony TCR TRV50 was done throughout the cruise for documentation of trawl catches, various scientific activities and visual observations of marine mammals and seabirds along the cruise tracks on board M/V “Libas” and M/V “Eros”.
Acoustics Multifrequency echosounder
The acoustic equipment onboard Libas and Eros were calibrated 3rd of July 2013 for 18, 38, 70, 120 and 200 kHz. Arni Fridriksson was also calibrated in April 2013 for all frequencies 18, 38, 120 and 200 kHz, whereas Finnur Fridi was calibrated on 2nd July for 38, 120 and 200 kHz prior to the cruise. All vessels used standard hydro-acoustic calibration procedure for each operating frequency (Foote, 1987). CTD measurements were taken in order to get the correct sound velocity as input to the echosounder calibration settings. Salient acoustic settings are summarized in the text table below.
Multibeam sonar
M/V “Libas” and M/V “Eros” were equipped with the new Simrad fisheries sonars SX90 (frequency range: 111.5-115.5 kHz), with a scientific output incorporated which allow the storing of the beam data for post-processing. One of the objectives in this survey was to continue the test of the software module “Processing system for fisheries omni-directional sonar, PROFOS” in LSSS at the Institute of Marine Research in Norway. The first test was done during the 2010 survey, and the basic processing was described in the cruise report (Nøttestad et al., 2010). The PROFOS module is in a late development phase and for this survey, functionalities for school enhancement by image processing techniques and for automatic school detection have been incorporated (Nøttestad et al., 2012).
Acoustic doppler current profiler (ADCP)
R/V “Libas” are equipped with a scientific ADCP, RDI Ocean surveyor, operating at 75 kHz and/or 150 kHz. The data collected during the survey will be quality checked and used for later analysis.
400 mm 200 mm 100 mm

Ecosystem Survey in Northeast Atlantic July-August 2013
9
Intercalibration of Multpelt 832 pelagic trawl
Two intercalibrations of the Multpelt 832 pelagic trawl were performed during the 2013 survey, between the Icelandic and the Faroese vessels and then by the two Norwegian vessels. The same procedure was followed as in the intercalibration from 17-18 July 2012 (Nøttestad et al. 2012) and the results from July 2013 are provided in Annex 1a and b.
Cruise tracks
M/V “Libas”, M/V “Eros”, M/V “Finnur Friði” and R/V “Arni Fridriksson” followed predetermined survey lines with pre-selected pelagic trawl stations. (Figure 1). An adaptive survey design was also adopted although to a small extent, due to uncertain geographical distribution of our main pelagic planktivorous schooling fish species. The cruising speed was between 10-12.0 knots if the weather permitted otherwise the cruising speed was adapted to the weather situation.
Figure 1. Cruise tracks and pelagic trawl stations shown for M/V “Libas” and “Eros” (Norway) in blue, M/V “Finnur Friði” (Faroe Islands) in black and R/V “Arni Fridriksson” (Iceland) in red within the covered areas of the Norwegian Sea and surrounding waters from 2nd of July to 9th of August 2013.
CTD sensors in combination with WP2 plankton net samples from the surface and down to maximum 200 m depth were taken systematically on almost every pelagic trawl station onboard all four vessels (Figure 2).

Ecosystem Survey in Northeast Atlantic July-August 2013
10
Figure 2. CTD stations (0-500 m) using SEABIRD SBE 37 (Arni Fridriksson) SEABIRD SB 25+ (Finnur Friði) and SAIV SD200 (Libas and Eros) CTD sensors and WP2 plankton net samples (0-200 m depth). These were taken systematically on every pelagic trawl station on all four vessels
The survey was based on scientific echosounders using 38 kHz frequency as the main frequency for the abundance estimate. Also 200 kHz was used as frequency for acoustic registrations of NEA mackerel. A summary of acoustic settings is given in Table 4.
Generally, acoustic recordings were scrutinized using the LSSS onboard Libas, Eros and Arni Fridriksson Finnur Friði scrutinized using Echoview software on daily basis. Species were identified and partitioned using catch information, characteristic of the recordings, and frequency between integration on 38 kHz and on other frequencies by a scientist experienced in viewing echograms.
Acoustic estimates of herring and blue whiting abundance were obtained during the surveys in a same way as e.g. done in the International ecosystem survey in the Nordic Seas in May (ICES 2012). The acoustic methods were unchanged from last year (ICES 2012).

Ecosystem Survey in Northeast Atlantic July-August 2013
11
Table 4. Acoustic instruments and settings for the primary frequency in the July/August survey in 2013.
R/V Libas R/V Arni Friðriksson
M/V Eros M/V Finnur Friði
Echo sounder Simrad EK60 Simrad EK 60 Simrad EK 60 Simrad EK 60
Frequency (kHz) 18, 38, 70, 120, 200 18, 38, 120, 200 18, 38, 70, 120, 200 38,120, 200
Primary transducer ES38B ES38B ES38B ES38B
Transducer installation Drop keel Drop keel Drop keel Hull
Transducer depth (m) 9 8 9 5
Upper integration limit (m) 15 15 15 12
Absorption coeff. (dB/km) 9.9 10 9.9 9.7
Pulse length (ms) 1.024 1.024 1.024 1.024
Band width (kHz) 2.43 2.425 2.425 2.43
Transmitter power (W) 2000 2000 2000 2000
Angle sensitivity (dB) 21.9 21.9 21.9 21.9
2-way beam angle (dB) -21.1 -20.9 -20.6 -20.7
TS Transducer gain (dB) 24.87 24.64 23.27 24.51
sA correction (dB) -0.60 -0.84 -0.65 -0.65
alongship: 6.89 7.31 7.01 7.13
athw. ship: 6.87 6.95 7.11 7.21
Maximum range (m) 500 750 750 500
Post processing software LSSS LSSS
LSSS
Sonardata Echoview 5.1
Swept area index and biomass estimation
The swept area estimate is based on catches in the whole area covered in the survey, or between 60°N and 73°N and 30°W and 18°E. Rectangle dimensions were 1° latitude by 2° longitude as in the estimates from previous years. Allocation of the biomass to exclusive economic zones (EEZs) was done in the same way as in 2010 and 2011, i.e.: a) allocation of sea area to EEZs is based on a table taken from a NEAFC blue whiting report, and b) sea area proportion of rectangles overlapping land were calculated with polygon clipping in R using packages 'geoextras' and 'geo' (available on http://r-forge.r-project.org) and 'maps', 'mapdata' (available on http://cran.r-project.org) (Jónsson et al. 2011; Björnsson 2010; Becker and Wilks 2010, R Development Core Team 2011). Estimation of sea area proportion was improved from that used in 2010.
Exclusive Economic Zone’s (EEZ’s) in the Northeast Atlantic shown as overlays on some of the figures in this report were taken from shape files on http://www.vliz.be/vmdcdata/marbound/.
In order to calculate a swept area estimate, the horizontal with of the trawl opening is required. The horizontal spread in the trawl opening was continually measured during the trawl hauls on the Faroese vessel Finnur Friði using distance sensors attached to the side-net in the trawl opening. On the Icelandic vessel six test hauls were measured using at cable sonar attached to the headline. For the two Norwegian vessels, estimation of horizontal trawl opening was calculated from simulations based on the distance between the trawl doors. The results of the measurements and estimations for the four vessels are show in Table 1. The average horizontal with of 65 m was used in the swept area calculations.

Ecosystem Survey in Northeast Atlantic July-August 2013
12
Table 5. Gear parameters observed and estimated on the participating vessels in the joint mackerel survey in 2013. Figures in italics (with of trawl opening for the two Norwegian vessels) were estimated based on simulation from doorspread at a certain trawl speed. The gear parameters were measured continuously on the Faroese vessel and from six test hauls on the Icelandic vessels. Estimated average with of the trawl opening for all the vessels is 64.7 m or rounded to 65 m and used the average with of the trawl opening in the swept area calculations for mackerel.
Measurement (m) FO NO1 NO2 IS Average Doorspread 110.5 122 118 115 116 Underwing (spread) 76 - - - - Width of trawl-opening 59.2 68.4 65.1 66 65 Depth of groundrope 35.6 30 32 34.2 33

Ecosystem Survey in Northeast Atlantic July-August 2013
13
Results
Hydrography
There have been considerable changes in the temperature regime in the Norwegian Sea and adjacent waters the last few years compared to a 20 years average. However, in July/August 2013 these changes seem to be much less pronounced in the entire area compared to previous periods. One exception is the northern and north-eastern Norwegian Sea, where temperatures were about 2°C higher compared to the 20 years average (Figure 3). One striking difference compared to 2012 is the absence of the warm area in the western and northern part of Icelandic and Greenland waters in 2013. It must be mentioned that the NOAA sea surface temperature measurements (SST) are sensitive to the weather condition (i.e. wind and cloudiness) prior to and during the observations and do therefore not necessarily reflect the oceanographic condition of the water masses in the areas, as seen when comparing detailed features of SSTs between years (Figures 3 and 4).
Figure 3. Sea surface temperature anomalies (°C; centered for mid July 2013) showing warm and cold conditions in comparison to a 20 year average.

Ecosystem Survey in Northeast Atlantic July-August 2013
14
Figure 4. Sea surface temperature anomalies (°C; centered for mid July 2012) showing warm and cold conditions in comparison to a 20 year average.
The temperature at depth based on CTD measurements from the four participating vessels is shown in Figures 5 - 10. The temperature in the upper layers (10m and 20m) shows warm water of Atlantic origin covering most of the survey area. Generally the temperature pattern in the survey area in 2013 was similar to the 2012 situation, except for the absence of the warm water mass observed south of Iceland in 2012. This year the coverage was extended southwards, and the highest temperature was recorded in this area, especially in the south-east, where it reached 12-13°C. Most of the Norwegian Sea and the area south of Iceland had surface temperatures around 10-11°C, while it was considerably colder north of Iceland. The warm Atlantic water extended north beyond the 70 degrees in the eastern Norwegian Sea. The temperature distribution at 50m depth was similar as the surface layers but with cooler water, especially in the south-western Norwegian Sea, where the cold East Icelandic Current (EIC) and features like the Iceland-Faroe-Front (IFF) was clearly detected. South and west of the Iceland-Scotland Ridge, warm Atlantic water dominated the entire water column with temperature of 7-9°C at 400m depth. In the eastern Norwegian Sea warm Atlantic water was also detected down to 400m depth. In waters deeper than 100m the influence of the EIC is more pronounced and extends further south into Faroese and east into Norwegian waters.

Ecosystem Survey in Northeast Atlantic July-August 2013
15
60°
65°
70°
75°
40° 0°10° 10° 20°20° 30°30°
Temperature 10m July-aug. 2013
13
9
Figure 5. Temperature (°C) at 10 m depth in the Norwegian Sea and surrounding waters in July/August 2013.
60°
65°
70°
75°
55°40° 0°10° 10° 20°20° 30°30°
Temperature 20m July-aug. 2013
11
13
7
10
Figure 6. Temperature (°C) at 20 m depth in the Norwegian Sea and surrounding waters in July/August 2013.

Ecosystem Survey in Northeast Atlantic July-August 2013
16
60°
65°
70°
75°
55°40° 0°10° 10° 20°20° 30°30°
Temperature 50m July-aug. 2013
7
7
10
5
1
7
Figure 7. Temperature (°C) at 50 m depth in the Norwegian Sea and surrounding waters in July/August 2013.
60°
65°
70°
75°
55°40° 0°10° 10° 20°20° 30°30°
Temperature 100m July-aug. 2013
7
6
10
6
Figure 8. Temperature (°C) at 100 m depth in the Norwegian Sea and surrounding waters in July/August 2013.

Ecosystem Survey in Northeast Atlantic July-August 2013
17
60°
65°
70°
75°
55°40° 0°10° 10° 20°20° 30°30°
Temperature 200m July-aug. 2013
7
5
0
6
Figure 9. Temperature (°C) at 200 m depth in the Norwegian Sea and surrounding waters in July/August 2013.
60°
65°
70°
75°
55°40° 0°10° 10° 20°20° 30°30°
Temperature 400m July-aug. 2013
9
5
3
6
Figure 10. Temperature (°C) at 400 m depth in the Norwegian Sea and surrounding waters in July/August 2013.

Ecosystem Survey in Northeast Atlantic July-August 2013
18
Zooplankton
The average plankton biomass increased from 6.0 g/m2 in July-August 2012 to 8.6 g/m2 over all stations throughout the survey area in July-August 2013. The plankton concentrations were lowest in the central Norwegian Sea and highest in Faroese and Icelandic waters in addition to northern EU waters. The zooplankton samples for species identification have not been examined in detail.
The increased biomass of zooplankton is in agreement with the increase that has been observed in the zooplankton biomass in the Norwegian Sea in the May survey in 2013 after a decade with a decreasing trend in zooplankton biomass. These data need nevertheless to be treated with some care, due to various amounts of phytoplankton and salps between years and areas in the samples influencing the total amount of zooplankton (g dry weight/m2) which is relevant and valuable as available food for pelagic planktivorous fish.
60°
65°
70°
75°
55°40° 0°10° 10° 20°20° 30°30°
11
14
5 planktonJuly-August 2013
Figure 11. Zooplankton biomass (g dw/m2, 0-200 m) in the Norwegian Sea and surrounding waters, 2nd of July -9th of August 2013.

Ecosystem Survey in Northeast Atlantic July-August 2013
19
Pelagic fish species
Mackerel
The total mackerel catches (kg) taken during the joint ecosystem survey with the Multpelt 832 quantitative sampling trawl is presented in standardized rectangles in Figure 12. The map is showing different concentrations of mackerel from zero catch to more than 5000 kg.
Figure 12. Catches of mackerel in kg represented in standardized rectangles. Light blue represents small catches (1-50 kg), while dark red represents catches of more than 5000 kg mackerel. Vessel tracks are shown as continuous lines.
The length distribution of NEA mackerel during the joint ecosystem survey showed a pronounced length- dependent distribution pattern both with regard to latitude and longitude. The largest mackerel were found in the northernmost and westernmost part of the covered area in July-August 2013 (Figure 13).

Ecosystem Survey in Northeast Atlantic July-August 2013
20
60°
65°
70°
75°
55°40° 0°10° 10° 20°20° 30°30°
36
36 MackerelJuly - August 2013
30
3436
30
32 28
38
3828
34
Figure 13. Average length distribution of NEA mackerel from the joint ecosystem survey with M/V “Libas”, M/V “Brennholm”, M/V “Finnur Friði” and R/V “Arni Fridriksson” in the Norwegian Sea and surrounding waters between 2nd of July and 9th of August 2013.
Mackerel caught in the pelagic trawl hauls on the four vessels varied from 15 cm to 47 cm in length with the individuals between 27-31 cm and 34-37 cm dominating in the abundance. The mackerel weight (g) varied between 10 to 800 g (Figure 14).

Ecosystem Survey in Northeast Atlantic July-August 2013
21
Figure 14. Total length (cm) and weight (g) distribution in percent (%) for mackerel in all catches.
The 2010 year class contributed to more than 20% in number followed by abundant 2006, 2007 and 2011-year classes around 15% each, respectively. The 2008 year class was also well represented in the catches, contributing with 12% of the total number (Figure 15).
Figure 15. Age and length distribution in percent (%) of Atlantic mackerel in the Norwegian Sea and surrounding waters from 2nd of July to 9th of August 2013.

Ecosystem Survey in Northeast Atlantic July-August 2013
22
The spatial distribution and overlap between the major pelagic fish species from the joint ecosystem survey in the Nordic Seas are shown in Figure 16.
Figure 16. Distribution and spatial overlap between mackerel (red), herring (blue), blue whiting (yellow) and salmon (violet) from joint ecosystem surveys conducted onboard M/V “Libas” and M/V “Eros” (Norway), M/V “Finnur Friði” (Faroe Islands) and R/V “Arni Fridriksson” (Iceland) in the Norwegian Sea and surrounding waters between 2nd of July and 9th of August 2013. Vessel tracks are shown as continuous lines.
Swept area analyses from standardized pelagic trawling with Multpelt 832
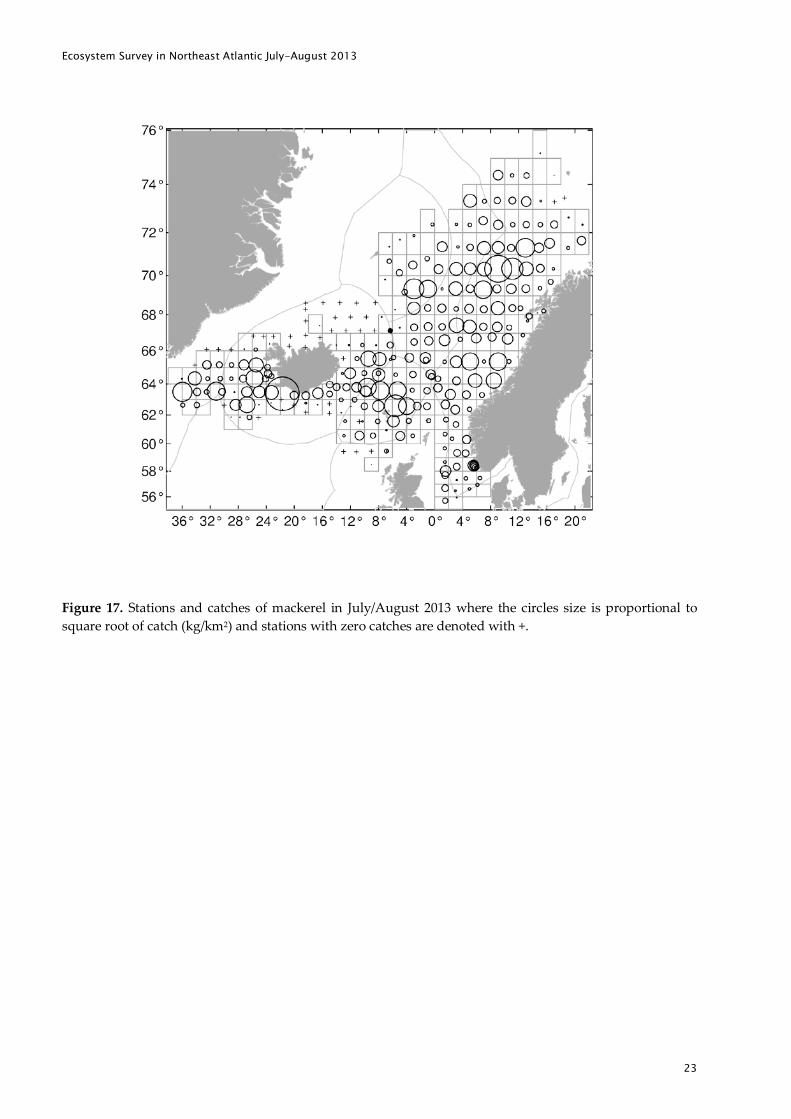
The swept area estimates of mackerel biomass were based on average catches of mackerel within rectangles of 1° latitude and 2° longitude and measurements of horizontal opening of the trawls (Table 5), which gave catch indices (kg/km2; Fig. 17). An interpolation for rectangles not covered on the edges of area covered was only done for those that had adjacent rectangles with one or more tows on three or four sides. Total number of rectangles interpolated was 16 (Fig. 18). The interpolation was done by taking the average values of all adjacent rectangles. The swept area estimates for the different rectangles is shown in Fig. 18 and in more graphical manners in Fig. 19. The total biomass estimate came to 8.8 million tons, which was allocated to the different EEZs as in previous years (Annex 2). The horizontal opening of the trawls used in the estimations was 65 m (see Table 5) and was the basis in the swept-area biomass estimation. The absolute minimum biomass estimate, assuming that all mackerel inside the trawl doors are caught, or 116 m (Table 5), was 5 million tonnes.
Ecosystem Survey in Northeast Atlantic July-August 2013
23
Figure 17. Stations and catches of mackerel in July/August 2013 where the circles size is proportional to square root of catch (kg/km2) and stations with zero catches are denoted with +.

Ecosystem Survey in Northeast Atlantic July-August 2013
24
Figure 18. Mean mackerel catch index (kg/km) in 1° lat. by 2° lon. rectangles from swept area estimates in July/August 2013, where interpolated rectangles are denoted with blue shading.

Ecosystem Survey in Northeast Atlantic July-August 2013
25
Figure 19. Mean mackerel catch index (kg/km2) for mackerel the July/August 2013 survey represented graphically. Colouring of index levels is the same as in the 2012 IESSNS survey report (Nøttestad et al. 2012).
Underwater camera observations
The underwater video recordings at different positions inside the Multpelt 832 trawl have not yet been properly analyzed, so the main results are not ready when finalizing this report. The videos taken during daytime were of high quality and is therefore an important source of knowledge on how NEA mackerel and NSS herring is captured with the Multpelt 832 trawl. Nearly all fish entering the belly section with 200 mm mesh size were swimming in the direction of the tow. This swimming behaviour was maintained until the fish entered the codend. The transport of fish backwards in the trawl was reduced towards the codend entrance. Mackerel was observed to maintain swimming in front of the codend for several minutes when the towing speed was close to 5 knots (Figure 20) Preliminary analysis of number of fish passing through the belly into the 80 mm sections (36 m forward to the codend) during a 30 minutes tow, indicates continuous entrance of fish with some minor variation in density (See pictures in figures 21 and 22) throughout the tow. Such analyses have to include more hauls to provide a representative picture the overall capture and fish distribution pattern. A likely indication of these observations is that mackerel was not occurring in dense schools, rather loose aggregations during the survey period.
Another important observation was that fish swimming far back in the trawl swam forward when the forward movement of the trawl was reduced during haul back. This happened when hauling in the sweeps and the trawl. Some of the fish that swam forward most likely escaped through the larger meshes (> 200 mm) in the front trawl belly. To prevent possible loss forward of fish that had entered the codend a fish escape preventer was installed in the front part of the codend. The video observations confirmed that this device prevented fish from coming forward during reduced trawl movement, and that fish could pass it freely during the towing situation. The video recordings will be analyzed in more detail at a later stage.

Ecosystem Survey in Northeast Atlantic July-August 2013
26
Figure 20. Mackerel swimming in front of the codend entrance at 5 knots towing speed.
Figure 21. Photos taken from a GoPro video camera with 5 min intervals positioned in the bottom panel in the joining between 80 and 100 mm panels (36 m in front of the codend entrance) onboard M/V “Eros” in trawl haul number 53 (total catch of mackerel = 4651 kg).
15 min 20 min
25 min 30 min

Ecosystem Survey in Northeast Atlantic July-August 2013
27
Figure 22. Number of mackerel counted every minute in the camera view when positioned on the bottom panel in the joining of 80 and 100 mm meshes from trawl station number 53 onboard M/V “Eros.
Multibeam sonar recordings The mackerel schools detected were of small size, predominantly with low density and appeared in the upper 40 m of the water column throughout the day, on Simrad SH80 and Simrad SX90 operated within large geographical areas. Only small and loose mackerel schools were recorded on the multibeam sonars at all onboard M/V “Libas” and M/V “Eros”. Further quantitative sonar analyses on NEA mackerel will be done in the months ahead. Occationally the mackerel were practically invisible for the multibeam sonars most probably due to very loose aggregation and thereby extremely low detection probability on any acoustic instrumentation including multifrequency echosounder and high and low frequency multibeam sonars. We could sometimes see nothing or very little on the sonars but still got high catches of mackerel during surface trawling with the Multpelt 832 pelagic sampling trawl. The multibeam sonar data will be analysed in more detail later.
Norwegian spring-spawning herring
The Norwegian spring-spawning (NSS) herring (Clupea harengus) was acoustically recorded and biological samples were taken at all pelagic trawl stations where herring was present in the upper water masses. A biomass estimate was performed on NSS herring based on the acoustic recordings using the primary frequency of 38 kHz. The biomass estimate on NSS herring was 8.6 million tons in July-August 2013.
Norwegian summer-spawning herring were also sampled and acoustically monitored along the northeastern part of the Norwegian Sea and in the Lofoten and Vestfjord area in northern Norway, while Icelandic summer-spawning herring were sampled west and south of Iceland (around west of 14°W).
The sA values shows that NSS herring was distributed across the whole survey area except for the middle part of the northern Norwegian Sea (Figure 23). The concentrations were low in the northern and eastern areas. The highest concentrations were in the southern areas north of the Faroes and in the western part where NSS herring extended all the way to 20°W north of Iceland and around 14°W south of Iceland. West

Ecosystem Survey in Northeast Atlantic July-August 2013
28
of these locations there were Icelandic summer spawners according to trawl samples. The periphery of the distribution of NSS herring towards north were probably not reached between 20°W and 8°E, as in 2012.
Herring was in the surface waters in most area feeding and possibly above the transducer (acoustic dead zone) and therefore poorly represented in the acoustic measurements.
60°
65°
70°
75°
55°40° 0°10° 10° 20°20° 30°30°
300
200
0
HerringJuly 2013
Figure 23. Contours of SA/Nautical Area Scattering Coefficient (NASC) values of herring along the cruise track, 2nd of July to 9th of August 2013.
Norwegian spring-spawning herring had a length distribution from 20-39 cm with a peak at 34 cm individual length and mean weight at age ranging from 119 g (age 2) to 410 g (age 1+) (Figure 24).
The age distribution in NSS herring shows dominance of the 2003 year class with about 19% in numbers of the acoustic estimate, followed by the 2004 year class (17.5%) and 2009 year class (12.5%) (Figure 25).

Ecosystem Survey in Northeast Atlantic July-August 2013
29
Figure 24. Length and weight distribution in percent for norwegian spring-spawning herring from 2nd to July 9th August 2013.
Figure 25. Age and length distribution of Norwegian spring-spawning herring from 2nd to July 9th August 2013.

Ecosystem Survey in Northeast Atlantic July-August 2013
30
The length distribution measured on herring showed overall a pronounced length dependent migration pattern, with the largest individuals (34 cm) swam furthest west and northwest (Figure 26).
60°
65°
70°
75°
55°40° 0°10° 10° 20°20° 30°30°
35
30
HerringJuly 2013
30
Figure 26. Length distribution of Norwegian spring-spawning herring during the coordinated ecosystem survey 2nd of July to 9th of August 2013.
Blue whiting
Acoustic estimates of blue whiting were used to construct a geographical distribution of the stock (Figure 27). It must be considered that blue whiting was not the main target species in the survey so dedicated trawl samples from schools of blue whiting at greater depths than surface were very few. The total biomass estimate of blue whiting from the acoustic survey was 1.172 million tons, whereas almost 60% of it was fish at age 1 and 2. The composition of the stock should though be taken with great cautious due to very few dedicated trawl sampling effort of blue whiting during the survey.
This survey confirmed the presence of immature blue whiting in the feeding areas during summer.

Ecosystem Survey in Northeast Atlantic July-August 2013
31
60°
65°
70°
75°
55°40° 0°10° 10° 20°20° 30°30°
200
200
0
Blue whitingJuly 2013
400
Figure 27. Contours of sA (Nautical Area Scattering Coefficient) values of blue whiting along the cruise track, 2nd of July -9th of August 2013.
Ecosystem Survey in Northeast Atlantic July-August 2013
32
Marine Mammal Observations
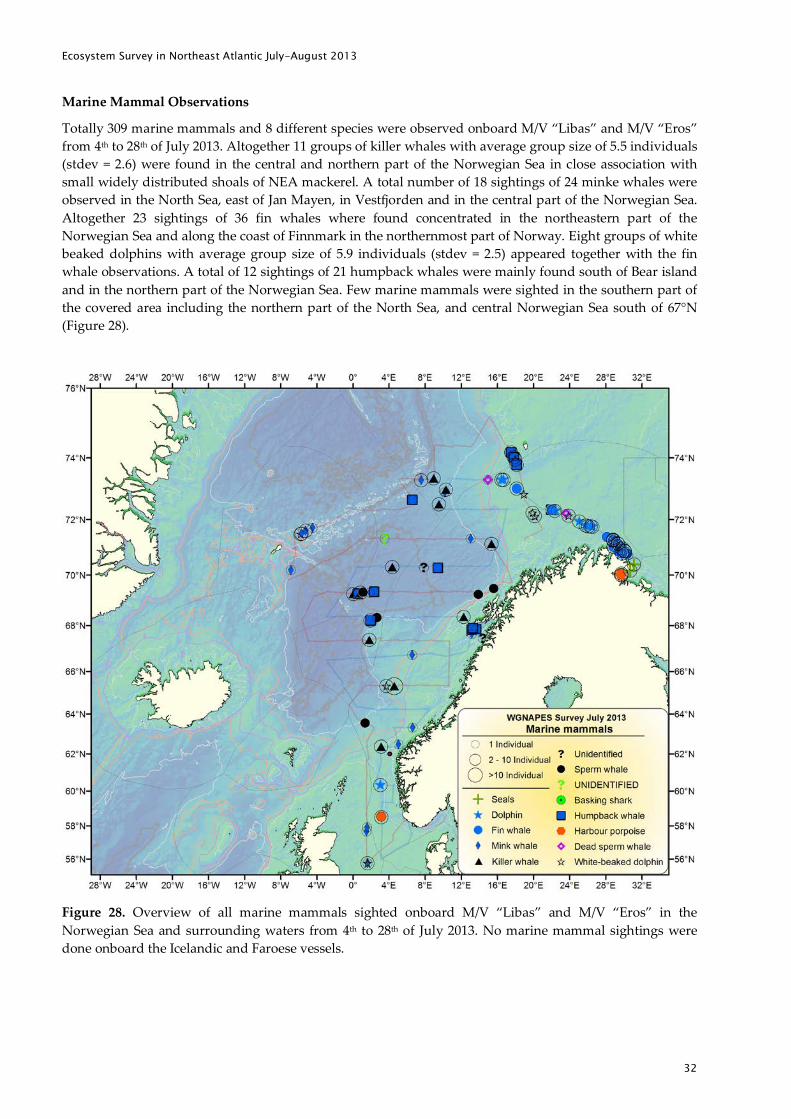
Totally 309 marine mammals and 8 different species were observed onboard M/V “Libas” and M/V “Eros” from 4th to 28th of July 2013. Altogether 11 groups of killer whales with average group size of 5.5 individuals (stdev = 2.6) were found in the central and northern part of the Norwegian Sea in close association with small widely distributed shoals of NEA mackerel. A total number of 18 sightings of 24 minke whales were observed in the North Sea, east of Jan Mayen, in Vestfjorden and in the central part of the Norwegian Sea. Altogether 23 sightings of 36 fin whales where found concentrated in the northeastern part of the Norwegian Sea and along the coast of Finnmark in the northernmost part of Norway. Eight groups of white beaked dolphins with average group size of 5.9 individuals (stdev = 2.5) appeared together with the fin whale observations. A total of 12 sightings of 21 humpback whales were mainly found south of Bear island and in the northern part of the Norwegian Sea. Few marine mammals were sighted in the southern part of the covered area including the northern part of the North Sea, and central Norwegian Sea south of 67°N (Figure 28).
Figure 28. Overview of all marine mammals sighted onboard M/V “Libas” and M/V “Eros” in the Norwegian Sea and surrounding waters from 4th to 28th of July 2013. No marine mammal sightings were done onboard the Icelandic and Faroese vessels.

Ecosystem Survey in Northeast Atlantic July-August 2013
33
Discussion
The international coordinated ecosystem survey in the Norwegian Sea and adjacent areas (IESSNS) was performed during 2 July to 12 August 2013 by four vessels from Norway (2), Iceland (1) and Faroese (1). A standardised surface trawling was carried out there at predefined locations and used for a swept area abundance estimation of NEA mackerel in the Nordic Seas as done since 2007, although not in all years. The method is analogous to the various bottom trawl surveys run for many demersal stocks.
The total swept area estimate of mackerel in summer 2013 was 8.8 million tonnes based on a coverage of more than 3.2 million square kilometres in the Nordic Seas from about 59 degrees up to 75 degrees north and from the Norwegian coast in east and west to the Greenlandic continental shelf. This represents average density of 2719 kg/km2 compare to 3340 kg/km2 in 2012, which is approximately 18% decrease. Mackerel was distributed over most of the surveyed area, and the zero boundaries for mackerel were not reached towards south in the Greenland waters and towards south in the North Sea.
Even if the geographical coverage and survey effort in 2013 was larger compared to previous years, the mackerel stock was not fully covered. Thus despite the increase in the swept area abundance estimate, it is still considered to be underestimation of the mackerel stock.
The 2010 year class contributed to more than 20% in number followed by abundant 2006, 2007 and 2011-year classes around 15% each, respectively. The 2008 year class was also well represented in the catches, contributing with 12% of the total number.
The overlap between mackerel and NSS herring was highest in the south-western part of the Norwegian Sea (Faroe and east Icelandic area), which is similar to 2012. A high overlap between the species might increase the inter-specific competition between the species for food in the area, especially in a period with low abundance of zooplankton, as observed in recent years. According to Langøy et al. (2012), Debes et al. (2012), and Oskarsson et al. (2012) the herring may suffer in this competition, the mackerel had higher stomach fullness index than herring and the herring stomach composition is different from previous periods. Langøy et al (2012) and Debes et al. (2012) also found that mackerel target more prey species compared to herring and mackerel may thus be a stronger competitor and more robust in periods with low zooplankton abundances.
Acoustic estimation of herring and blue whiting was also done during the survey. The biomass of Norwegian spring-spawning herring was estimated to 8.6 million tonnes in July-August 2013. The previous acoustic abundance estimates of NSS herring from the survey were 13.6 million tonnes in 2009 and 10.7 million tonnes in 2010 and 7.3 million tonnes in 2012. Thus the trend in the July survey, the trend in the biomass estimates from the International herring survey in May and the assessment. The herring was mainly found in the southern and western parts of the covered area, i.e. from north of the Faroes, the east Icelandic area and north into Jan Mayen area, with less concentration in the central and eastern areas.
This survey confirmed the presence of young blue whiting (ages 1-2) in the summer feeding areas. The concentrations were highest along the continental shelf of Norway in the eastern Norwegian Sea and in the west of Iceland.
The temperatures in the Nordic Seas in 2013 are now close to the long-term average except for in the northern part of the Norwegian Sea with higher temperatures than the average temperature during the last 20 years.
The concentrations of zooplankton increased from 6.0 g dry weight/m2 in July-August 2012 to 8.6 g/m2 in July-August 2013 after more than a decade of decreasing trend in plankton concentrations.
Whale observations were done by the two Norwegian vessels during the survey. The number of marine mammal sightings was generally low in the central and eastern part of the Norwegian Sea but with considerable higher numbers of especially fin whales in the northern Norwegian Sea and into the Barents Sea. Groups of killer whales were mostly observed in central Norwegian Sea, whereas fin and humpback

Ecosystem Survey in Northeast Atlantic July-August 2013
34
whales where mainly observed near Jan Mayen, Bear Island and the southwestern part of the Barents Sea and off the coast of Finnmark.
A new master thesis has revealed a lot of new knowledge on mackerel schooling behaviour, diel vertical distribution, swimming speed and direction in relation to current speed and direction (Diaz 2013). Mackerel shoals remained in the upper 35-40 m of the water column throughout the day. Mackerel swam predominantly with the prevailing current based on results from sonar measurements of swimming speed and direction with the in situ current speed and direction. The swimming speed of selected NEA mackerel schools in different areas of the Norwegian Sea was low on average (1-2 knots) (Diaz 2013), suggesting that NEA mackerel is actively feeding with low swimming speed following the current and probably do not perform fast migrations from one area to another during this period. Most mackerel schools moved in a northern direction following the Atlantic current, but in the west where the currents moved southwards, the mackerel schools also swam south with the prevailing current system. Based on multibeam sonar and visual observations, concentrations of these species occurred above and close to the transducer depth and would therefore not be reliably detected by the downward oriented echosounders. Nevertheless, we are steadily progressing in this area of science, and recommend the further use of acoustics, both multi-frequency echosounders and multibeam sonars, for active use in the coordinated ecosystem survey in the years to come (see Nøttestad and Jacobsen 2009 and Nøttestad et al. 2010; 2011; 2012).
Information on stomach content of the three main pelagic species (mackerel, herring and blue whiting), combined with concurrent information on zooplankton and the hydrographical conditions are of paramount importance for a more thorough and detailed understanding of the feeding ecology, potential inter-specific feeding competition, spatiotemporal overlap and migration patterns of mackerel, herring and blue whiting in the Norwegian Sea and surrounding waters. Although only parts of these data are currently available at the different institutes, they might prove very valuable in the future. We therefore recommend continuing systematic sampling and diet analyses on the coordinated ecosystem surveys.
A comprehensive survey manual for the survey will be compiled in the coming months. It will be based on the methodology that has been evolved in recent years in this survey regarding the trawl and trawling procedure (e.g. Nøttestad et al. 2012) as well as manual from the IESNS survey in May in Norwegian Sea regarding acoustic, biological sampling, zooplankton and CTD.

Ecosystem Survey in Northeast Atlantic July-August 2013
35
Recommendations
General recommendations
• Participation by EU in the survey is recommended and encouraged by the group in order to be able to expand the survey coverage to cover the entire distribution of the stock and thereby obtain a more holistic and comprehensive understanding of mackerel abundance and distribution.
Recommendations to the survey participants
• Refer to the ICES WKNAMMM 2013 workshop report section from Hirtshals, Denmark in February 2013 for specific recommendations (ICES 2013).
Survey partic ipants
R/V “Árni Friðriksson”: Sveinn Sveinbjörnsson, Marine Research Institute, Reykjavík, Iceland Björn Sigurðarson, Marine Research Institute, Reykjavík, Iceland Guðmundur J. Óskarsson, Marine Research Institute, Reykjavík, Iceland Páll Valgeirsson, Marine Research Institute, Reykjavík, Iceland Sólrún Sigurgeirsdóttir, Marine Research Institute, Reykjavík, Iceland Gunnhildur Bogadóttir, Marine Research Institute, Reykjavík, Iceland Ragnhildur Ólafsdóttir, Marine Research Institute, Reykjavík, Iceland Stefán Brynjólfsson, Marine Research Institute, Reykjavík, Iceland Agnar M. Sigurðsson, Marine Research Institute, Reykjavík, Iceland Guðrún Finnbogadóttir, Marine Research Institute, Reykjavík, Iceland Søren Lorenzen Post, Greenland Institute of Natural Resources, Nuuk, Greenland M/V “Finnur Friði”: Høgni Debes, Faroe Marine Research Institute, Torshavn, Faroe Ebba Mortensen, Faroe Marine Research Institute, Torshavn, Faroe Poul Vestergaard, Faroe Marine Research Institute, Torshavn, Faroe Anna Ólafsdóttir, Faroe Marine Research Institute, Torshavn, Faroe Inga Kristiansen, Faroe Marine Research Institute, Torshavn, Faroe M/V “Eros”: Kjell Rong Utne, Institute of Marine Research, Bergen, Norway Øyvind Tangen, Institute of Marine Research, Bergen, Norway Gunnar Lien, Institute of Marine Research, Bergen, Norway Merete Kvalsund, Institute of Marine Research, Bergen, Norway Stine Karlson, Institute of Marine Research, Bergen, Norway Jostein Røttingen, Institute of Marine Research, Bergen, Norway Ørjan Sørensen, Institute of Marine Research, Bergen, Norway Jaime Alvarez, Institute of Marine Research, Bergen, Norway Justine Diaz, University of Bergen and Institute of Marine Research, Bergen, Norway Thassya Smith, University of Bergen and Institute of Marine Research, Bergen, Norway
Ecosystem Survey in Northeast Atlantic July-August 2013
36
M/V “Libas”: Leif Nøttestad, Institute of Marine Research, Bergen, Norway Valantine Anthonypillai, Institute of Marine Research, Bergen, Norway Jarle Kristianen, Institute of Marine Research, Bergen, Norway Matteo Bernasconi, Institute of Marine Research, Bergen, Norway Åse Husebø, Institute of Marine Research, Bergen, Norway Lise Langård, University of Bergen and Institute of Marine Research, Bergen, Norway Inger Henriksen, Institute of Marine Research, Bergen, Norway Karen Gjertsen, Institute of Marine Research, Bergen, Norway John Willy Valdemarsen, Institute of Marine Research, Bergen, Norway Jan Tore Øvredal, Institute of Marine Research, Bergen, Norway
Acknowledgements
We greatly appreciate and thank skippers and crew members onboard M/V “Libas”, M/V “Eros”, M/V “Finnur Fríði” and R/V “Arni Fridriksson” for outstanding collaboration and practical assistance on the joint ecosystem cruise in the Norwegian Sea and surrounding waters from 2nd of July to 9th of August 2013.
References
Debes, H., Homrum, E., Jacobsen, J.A., Hátún, H., Danielsen, J. 2012. The feeding ecology of pelagic fish in the southwestern Norwegian Sea –Inter species food competition between Herring (Clupea harengus) and mackerel (Scomber scombrus). ICES CM 2012/M:07. 19 pp.
Diaz, J. 2013. Schooling dynamics of summer time migrating northeast Atlantic mackerel (Scomber scombrus) in the Norwegian Sea using sonar. Master Theses, University of Bergen, Institute of Marine Research, Norway. 59 p.
Foote, K. G., 1987. Fish target strengths for use in echo integrator surveys. J. Acoust. Soc. Am. 82: 981-987. Höskuldur Björnsson (2010). geo: Draw and annotate maps, especially nautical charts of the North Atlantic.
R package version 1.0. http://R-Forge.R-project.org/projects/geo ICES. 2011. Report of the Working Group on Northeast Atlantic Pelagic Ecosystems Surveys (WGNAPES),
16-19 August 2011, Kaliningrad, Russian Federation. ICES CM 2011/SSGESST:16. 193 pp. ICES 2012. International ecosystem survey in the Nordic Sea (IESNS) in April-June 2012. Working
document to Working Group on International Pelagic Surveys. Reykjavik, Iceland, June 2012. 28 p. ICES 2013. Report of the Workshop on Northeast Atlantic Mackerel monitoring and methodologies
including science and industry involvement (WKNAMMM), 25–28 February 2013, ICES Headquarters, Copenhagen and Hirtshals, Denmark. ICES CM 2013/SSGESST:18. 33 pp.
Langøy, H., Nøttestad, L., Skaret, G., Broms, C., & Fernö, A. (2012). Overlap in distribution and diets of Atlantic mackerel (Scomber scombrus), Norwegian spring- spawning herring (Clupea harengus) and blue whiting (Micromesistius poutassou) in the Norwegian Sea during late summer. Marine biology research, 8(5-6), 442-460.Nøttestad L. and J.A. Jacobsen 2009. Coordinated Norwegian-Faroese ecosystem survey with M/V ”Libas”, M/V ”Eros”, and M/V ”Finnur Fríði” in the Norwegian Sea, 15 July – 6 August 2009. Working Document to WGWIDE, ICES 2-8 Sept. 2009. 32 p.
Nøttestad L., J.A. Jacobsen, S. Sveinbjørnsson et al. 2010. Cruise report form the coordinated Norwegian-Faroese ecosystem survey with M/V ”Libas”, M/V ”Eros”, and M/V ”Finnur Fríði” in the Norwegian Sea and surrounding waters,, 9 July – 20 August 2010. Working Document to WGWIDE, ICES 2-8 Sept. 2009. 49 p.
Nøttestad, L. G. Oskarsson, J.A. Jacobsen et al. 2011. Cruise report from the coordinated ecosystem survey (IESSNS) with M/V ”Libas”, M/V “Finnur Fridi” and R/V ”Arni Fridriksson” in the Nowegian Sea

Ecosystem Survey in Northeast Atlantic July-August 2013
37
and surrounding waters, 18 July-31 August 2011.. Working Document to WGWIDE, ICES, Lowestoft, UK, 21-27 August 2012.. 31 p.
Nøttestad, L, Utne, K.R., Óskarsson, G.J., Debes H. 2012 Cruise report from the coordinated ecosystem survey (IESSNS) with R/V ”G. O. Sars”, M/V “Brennholm”; M/V “Christian í Grótinum” and R/V “Arni Fridriksson” in the Norwegian Sea and surrounding waters, 1 July-10 August 2012. Working document to ICES WGWIDE, Lowestoft, UK, 21-27 August 2012. 45p.
Óskarsson, G.J., Sveinbjörnsson, S. Guðmundsdóttir, A. and Sigurðsson, Th. 2012. Ecological impacts of recent extension of feeding migration of NE-Atlantic mackerel into the ecosystem around Iceland. ICES CM 2012/M:03. 25 pp.
R Development Core Team (2011). R: A language and environment for statistical computing. R Foundation for Statistical Computing, Vienna, Austria. ISBN 3-900051-07-0, URL http://www.R-project.org/.
Richard A. Becker and Allan R. Wilks 2010. maps: Original S code by Richard A. Becker and Allan R. Wilks. R version by Ray Brownrigg Enhancements by Thomas P Minka. Maps: Draw Geographical Maps. R package version 2.1-5. http://CRAN.R-project.org/package=maps
Richard A. Becker and Allan R. Wilks 2010. mapdata: Original S code by Richard A. Becker and Allan R. Wilks. R version by Ray Brownrigg ([email protected]). mapdata: Extra Map Databases. R package version 2.1-3. http://CRAN.R-project.org/package=mapdata
Sigurður Þór Jónsson, Höskuldur Björnsson, Ásta Guðmundsdóttir and Árni Magnússon (2011). geoextras: Extras for the 'geo' package. R package version 0.3-0/r18. http://R-Forge.R-project.org/projects/geoextras/

Ecosystem Survey in Northeast Atlantic July-August 2013
38
Annex 1
Intercalibration of the Multpelt 832 pelagic trawl between vessels
Comparative pelagic trawl hauls were conducted between the Norwegian vessels M/V “Libas” and M/V “Eros” 5-6 July, and between R/V “Arni Fridriksson” and M/V “Finnur Friði” 15-16 July. The Norwegian vessels had 4 comparative hauls while the Faroese and the Icelandic vessels had 8 comparative hauls. Two of the eight hauls (haul 2 and 3) conducted by the Icelandic and Faroese vessel were excluded due to bad transect lines during the trawling. In haul number 2 “Finnur Friði” was crossing the path of “Arni Fridriksson” which made “Arni Fridriksson” trawl in the propeller wake of “Finnur Fridi”. In haul number 3, “Finnur Friði” had to make a sharp turn to avoid interfering with the trawl from “Arni Fridriksson”. The Norwegian vessels conducted the hauls in an area with fairly high abundance of both mackerel and herring (Table 1), while the Faroese and Icelandic vessels were trawling in an area with fairly high abundance of herring but low abundance of mackerel (Table 2)
There was not a Gaussian distribution of the catches for any of the four vessels, and a non-parametric test had to be used to check if the catches were different. Both “Libas” and “Eros” are commercial vessels of similar size and fishing performance. The catches between these vessels were not significantly different for neither herring nor mackerel (t-test, p>0.05) (Figure 1 and 2). “Arni Fridriksson” is a research vessel and “Finnur Friði” a commercial vessel. However, the catches between these vessels were also not significant different (Wilcox test, p>0.05) (Figure 1 and 2). An important issue is the low number of comparative trawl hauls between the vessels, which reduce the probability to find significant difference in catchability between the vessels. Maps of the trawl hauls for “Libas” and “Eros” are presented in figure 2, and for “Arni Fridriksson” and “Finnur Friði” in Figure 3.
Table 1. Total and average catch (kg) of mackerel and herring for the two Norwegian vessels for the four comparative trawl hauls.
Mackerel (kg) Herring (kg)
Vessel Total Mean Total Mean
Libas 5898 1475 1088 272
Eros 5171 1293 2121 530
Table 2. Total and average catch (kg) of mackerel and herring for the Icelandic and the Faroese vessel for six of the eight comparative trawl hauls (trawl haul 2 and 3 were excluded from the analyses).
Mackerel (kg) Herring (kg)
Vessel Total Mean Total Mean
Arni Fridriksson 351 58 1157 193
Finnur Fridi 104 17 1658 276

Ecosystem Survey in Northeast Atlantic July-August 2013
39
Figure 1. Boxplot of herring and mackerel catches (kg) during the comparative trawl hauls.

Ecosystem Survey in Northeast Atlantic July-August 2013
40
Figure 2. The tracks of the “Libas” and “Eros” during the four inter-calibration trawl hauls on 5-6 July 2013.

Ecosystem Survey in Northeast Atlantic July-August 2013
41
Figure 3. The tracks of the “Arni Fridriksson” and “Finnur Friði” during the 8 inter-calibration trawl hauls on 15-16 July 2013.

Ecosystem Survey in Northeast Atlantic July-August 2013
42
Annex 2
Swept area biomass estimates in the different exclusive economical zones (EEZs)
Allocation of the total swept area estimate of mackerel biomass to exclusive economic zones (EEZs) was done in the same way as in 2010, 2011 and 2012, i.e.: a) allocation of sea area to EEZs is based on a table taken from a NEAFC blue whiting report, and b) sea area proportion of rectangles overlapping land were calculated with polygon clipping in R using packages 'geoextras' and 'geo' (available on http://r-forge.r-project.org) and 'maps', 'mapdata' (available on http://cran.r-project.org) (Jónsson et al. 2011; Björnsson 2010; Becker and Wilks 2010, R Development Core Team 2011).
Exclusive Economic Zone’s (EEZ’s) in the Northeast Atlantic were taken from shape files on http://www.vliz.be/vmdcdata/marbound/.
Table 1. Swept area estimates of NEA mackerel biomass in the different Exclusive Economic Zones (EEZs) according to the international coordinated ecosystem (IESSNS) survey in July-August 2013. NEA mackerel in the Svalbard zone contributed with 1.6% of the total estimated biomass.
Area Biomass Biomass
(1000 km2) (1000 tonnes) (% )
Total 3254 8847 100
Faroese EEZ 374 1525 17.2
Icelandic EEZ 614 1525 17.2
Norwegian EEZ 988 3405 38.5
Jan Mayen EEZ 229 584 6.6
EU EEZ 401 324 3.7
Greenlandic EEZ 162 504 5.7
International waters, north
392 919 10.4
International waters, west
93 62 0.7