Embed Size (px)
Citation preview

○ ○ ○ ○ ○ ○ ○ ○ ○ ○ ○ ○ ○ ○ ○ ○ ○ ○ ○ ○ ○ ○ ○ ○ ○ ○ ○ ○ ○ ○ ○ ○ ○ ○ ○ ○ ○ ○ ○ ○ ○ ○
G R O W I N G X T O G E T H E R X O R X D R I F T I N G X A P A R T
W O R K I N G X P A R T N E R S H I P S X U S A1
Working Families and Businessin the New Economy
A Status Report on Social and Economic Well-Being in Silicon Valley
A Joint Publication of
W O R K I N G P A R T N E R S H I P S U S AECONOMIC POLICY INSTITUTE
C h r i s B e n n e rS p e c i a l F o r e w o r d b y
A m y B . D e a n

○ ○ ○ ○ ○ ○ ○ ○ ○ ○ ○ ○ ○ ○ ○ ○ ○ ○ ○ ○ ○ ○ ○ ○ ○ ○ ○ ○ ○ ○ ○ ○ ○ ○ ○ ○ ○ ○ ○ ○ ○ ○
G R O W I N G X T O G E T H E R X O R X D R I F T I N G X A P A R T
W O R K I N G X P A R T N E R S H I P S X U S A 2
Advisory Board
ECONOMIC INDICATORS ADVISORYBOARD
The Honorable Jim Beall, SupervisorSanta Clara County
Jared Bernstein, EconomistEconomic Policy Institute
Kate Besleme, Community Indicators Program CoordinatorRedefining Progress
Ron Blackwell, DirectorAFL-CIO Department of Corporate Affairs
Bob Brownstein, Director of Public Policy and BudgetBudget Office of Mayor Susan Hammer, City of San José
Clifford Cobb, Senior FellowRedefining Progress
Martin Carnoy, Professor of EducationStanford University
Leo Chavez, ChancellorFoothill-De Anza Community College District
Amy B. Dean, Executive OfficerSouth Bay AFL-CIO Labor Council
The Honorable Mark Friedman, Council MemberCity of El Cerrito
Lenny Goldberg, Executive DirectorCalifornia Tax Reform Association
Stephen Levy, DirectorCenter for Continuing Study of the California Economy
The Honorable Henry Manayan, MayorCity of Milpitas
Ron McPherson, MemberSanta Clara County Black Chamber of Commerce
Lawrence Mishel, Research DirectorEconomic Policy Institute
Christina Perez, RN, Regional Minority Health ConsultantOffice of Minority HealthU.S. Department of Health and Human Services
Hal Plotkin, Contributing WriterINC. Magazine
Manuel Pastor, DirectorLatin American Studies ProgramUniversity of California, Santa Cruz
Sylvia Rodriguez-Andrew, DeanCollege of Social Work, San Jose State University
Michael Rao, PresidentMission College
Jean Ross, Executive DirectorCalifornia Budget Project
AnnaLee SaxenianAssociate Professor of City and Regional PlanningUniversity of California, Berkeley
Harley Shaiken, Professor of EducationUniversity of California, Berkeley
Regina Stanback-Stroud, DeanWorkforce & Matriculation, Mission College
Ellen Teninty, Program TrainerJust Economics
Richard Walker, Professor of GeographyUniversity of California, Berkeley
Kent Wong, DirectorCenter for Labor Research and Education,University of California, Los Angeles
The Honorable Pat Vorreiter, Council MemberCity of Sunnyvale

○ ○ ○ ○ ○ ○ ○ ○ ○ ○ ○ ○ ○ ○ ○ ○ ○ ○ ○ ○ ○ ○ ○ ○ ○ ○ ○ ○ ○ ○ ○ ○ ○ ○ ○ ○ ○ ○ ○ ○ ○ ○
G R O W I N G X T O G E T H E R X O R X D R I F T I N G X A P A R T
W O R K I N G X P A R T N E R S H I P S X U S A3
Table of Contents
III
Foreword 9
I. Executive Summary 13
II. Introduction 19
III. Who Are We? A Demographic Profile of Santa Clara County 23
IV. Working in the New Economy: Employment, Wages and Income Trends 29
V. Community and Society: Health, Education and Related Trends 45
VI. Civic Life: Public Institutions and Involvement 55
VII. Environmental Quality and Public Health Indicators of Substainability 63
VIII. A Working Partnership to Shape the New Economy 71
IX. About Economic Policy Institute 75
X. Data Sources 77

○ ○ ○ ○ ○ ○ ○ ○ ○ ○ ○ ○ ○ ○ ○ ○ ○ ○ ○ ○ ○ ○ ○ ○ ○ ○ ○ ○ ○ ○ ○ ○ ○ ○ ○ ○ ○ ○ ○ ○ ○ ○
G R O W I N G X T O G E T H E R X O R X D R I F T I N G X A P A R T
W O R K I N G X P A R T N E R S H I P S X U S A 4
GROWING TOGETHER OR DRIFTING APART:Working Families and Business in the New EconomyA Status Report on Social and Economic Well Being in Silicon Valley
Copyright © 1998, Working Partnerships USA
Also available from Working Partnerships USA:SHOCK ABSORBERS IN THE FLEXIBLE ECONOMY:The Rise of Contingent Employment in Silicon Valley.
To obtain additional copies of this report or“Shock Absorbers in the Flexible Economy”please send $9.00 for each report to:
WORKING PARTNERSHIPS USA2102 ALMADEN ROAD • SUITE 107SAN JOSE • CA • 95125
PHONE: [408] 269.7872FAX: [408] 266.2653EMAIL: wpusa @atwork .orgURL: www.a twork .org

○ ○ ○ ○ ○ ○ ○ ○ ○ ○ ○ ○ ○ ○ ○ ○ ○ ○ ○ ○ ○ ○ ○ ○ ○ ○ ○ ○ ○ ○ ○ ○ ○ ○ ○ ○ ○ ○ ○ ○ ○ ○
G R O W I N G X T O G E T H E R X O R X D R I F T I N G X A P A R T
W O R K I N G X P A R T N E R S H I P S X U S A5
Acknowledgements
Chris Benner is the primary author of this report. Mr. Bennerleads Working Partnerships’ research projects to document therise of contingent employment, the availability of successful la-bor market intermediaries and is the author of the study, “ShockAbsorbers in the Flexible Economy: The Rise of Contingent Em-ployment in Silicon Valley.” He is a doctoral candidate in Cityand Regional Planning at the University of California, Berkeley.
Amy Dean is the Chief Executive Officer of the South Bay AFL-CIO Labor Council. Ms. Dean is responsible for directing all poli-cies and political activities of the AFL-CIO in the Silicon Valleyregion of California. As the primary umbrella organization for localunions, the South Bay AFL-CIO Labor Council is the fifteenth larg-est labor council in the nation, comprised of 110 affiliated local unionsrepresenting over 100,000 working families in the Silicon Valley.As the Chair of the National Advisory Committee on the Future ofCentral Labor Councils, Ms. Dean is leading a nationwide strategicplanning effort to expand the role of Central Labor Councils in eco-nomic development and coordinated organizing campaigns. In 1995,Amy Dean founded Working Partnerships USA, a non-profit orga-nization dedicated to rebuilding the links between regional economicpolicy and community well-being.
This report was made possible by the financial support from the FordFoundation, the Burr Oak Fund of the Tides Foundation, and theCounty of Santa Clara. We additionally offer our heartfelt thanks tothe French-American Charitable Trust, the McKay Foundation, theNew World Foundation, and the Unitarian Universalist Veatch Pro-gram at Shelter Rock. Working Partnerships wishes to particularlyacknowledge Supervisor Jim Beall from the County of Santa Clara.
We would like to thank:
Jared Bernstein from the Economic Policy Institute for his analysis ofwage dynamics in Santa Clara County, and his overall assistance andadvice in developing the report.

○ ○ ○ ○ ○ ○ ○ ○ ○ ○ ○ ○ ○ ○ ○ ○ ○ ○ ○ ○ ○ ○ ○ ○ ○ ○ ○ ○ ○ ○ ○ ○ ○ ○ ○ ○ ○ ○ ○ ○ ○ ○
G R O W I N G X T O G E T H E R X O R X D R I F T I N G X A P A R T
W O R K I N G X P A R T N E R S H I P S X U S A 6
David Webster from the Economic Policy Institute for his assistance withdata sources and analysis.
Lawrence Mishel from the Economic Policy Institute for his carefulreview of the report and extensive editorial assistance.
The entire Advisory Board for their assistance, guidance and sugges-tions. While we were not able to incorporate all of their suggestionsand ideas, mostly due to time constraints, their input was invaluable.
Additional people who gave valuable input on the overall project and/orspecific indicators include: Ted Smith, Linda Bagneschi, Wendy Laird-Benner, the entire staff of Working Partnerships USA and the South BayAFL-CIO Labor Council, and all participants in the Labor/CommunityLeadership Institute, where many of the indicators published here werefirst presented.
Jim Grossfeld, for his extensive assistance with editing and writing thefinal document.
Tony Bustamante and Peter Costello for assistance with the layout.
Poncho Guevara, for graphic design assistance.

○ ○ ○ ○ ○ ○ ○ ○ ○ ○ ○ ○ ○ ○ ○ ○ ○ ○ ○ ○ ○ ○ ○ ○ ○ ○ ○ ○ ○ ○ ○ ○ ○ ○ ○ ○ ○ ○ ○ ○ ○ ○
G R O W I N G X T O G E T H E R X O R X D R I F T I N G X A P A R T
W O R K I N G X P A R T N E R S H I P S X U S A7
Dear Friend,
At a time when you can hardly open a newspaper without reading about the strength of America’s neweconomy, we would all do well to remember that too many families are still struggling to get by in the “old”one. That is why this report raises important and serious issues.
Growing Together, Or Drifting Apart? poses the question many of our national leaders have shied awayfrom asking: whether many of the accomplishments of the new high-tech economy are actually slippingthrough the fingers of numerous working families. This study not only warns us of real problems, it callson each of us to take action.
As Amy Dean points out, while Silicon Valley is setting the pace in the information-based economy,“hundreds of thousands of our neighbors are at risk of being left behind.” She reminds us that it’s up topolicy makers, labor and business to join forces to guarantee that does not happen.
Whether or not you agree with its point of view, Growing Together, Or Drifting Apart? ought to be requiredreading for anyone concerned with Silicon Valley’s future.
Sincerely,
Anna Eshoo Jim Beall Susan HammerMember of Congress Santa Clara County Supervisor Mayor of San José

○ ○ ○ ○ ○ ○ ○ ○ ○ ○ ○ ○ ○ ○ ○ ○ ○ ○ ○ ○ ○ ○ ○ ○ ○ ○ ○ ○ ○ ○ ○ ○ ○ ○ ○ ○ ○ ○ ○ ○ ○ ○
G R O W I N G X T O G E T H E R X O R X D R I F T I N G X A P A R T
W O R K I N G X P A R T N E R S H I P S X U S A 8

○ ○ ○ ○ ○ ○ ○ ○ ○ ○ ○ ○ ○ ○ ○ ○ ○ ○ ○ ○ ○ ○ ○ ○ ○ ○ ○ ○ ○ ○ ○ ○ ○ ○ ○ ○ ○ ○ ○ ○ ○ ○
G R O W I N G X T O G E T H E R X O R X D R I F T I N G X A P A R T
W O R K I N G X P A R T N E R S H I P S X U S A9
Foreword
At the age of 25, the future looked bright for Richelle Noroyan. Witha bachelor’s degree and experience working summers at IBM duringcollege, she had hopes of establishing a successful career. After sixmonths of looking for permanent employment, she realized that shewas only going to find employment through a temp agency so she ac-cepted a series of $7.00 an hour jobs. Richelle made a breakthroughwhen Apple Computer offered her a job as a project coordinator. Itwas still a temporary position that offered no medical benefits. Fi-nally after 15 months, Apple hired her as a regular employee. ButRichelle’s new job came at a high price. The years she worked with-out health insurance led her to ignore acute pain in her foot which hasnow turned into tendonitis. She has pain when she walks and mayhave to have surgery to fix the problem.
Doug McPhail had everything in the world going for him. Thirty yearsold, he was earning $45,000 a year at a Silicon Valley firm. But justas he was beginning to work on his MBA, the company decided theunit Doug was working in didn’t fit into their product line. Less thana year after being hired, and with only one week’s notice, Doug waslaid off. Trying to finance school without the steady income he hadcounted on, he depleted his savings and had to move in with his sister.Thankfully, after graduation, Doug found a job. But he’s still workingto pay down the heavy debt he incurred while in school.
Alejandro Rodriguez and his family came to the United States over adecade ago to escape the poverty of his native Nicaragua. For the lastfour years he’s worked as a shipping clerk at Hewlett-Packard, butalways on a contingent basis. In fact, two years ago the company trans-ferred almost all the employment in his building to Manpower, a tem-porary employment agency. Recently, Alejandro hurt his back at work,but because he had no health insurance his injury went untreated.After he hired a lawyer and threatened the temp agency with legalaction, Manpower agreed to pay for Alejandro to be treated by a doc-tor.
Richelle Noroyan, Doug McPhail, and Alejandro Rodriguez. Differ-ent people, but each sharing the same dream of careers, families andhomes of their own in a safe and healthy Silicon Valley. But for each

○ ○ ○ ○ ○ ○ ○ ○ ○ ○ ○ ○ ○ ○ ○ ○ ○ ○ ○ ○ ○ ○ ○ ○ ○ ○ ○ ○ ○ ○ ○ ○ ○ ○ ○ ○ ○ ○ ○ ○ ○ ○
G R O W I N G X T O G E T H E R X O R X D R I F T I N G X A P A R T
W O R K I N G X P A R T N E R S H I P S X U S A 10
of them, and too many others, turning those simple, American dreamsinto a reality is growing more elusive each year.
It’s no secret that Silicon Valley is blessed with a robust economyfueled by innovation and entrepreneurial genius. Today, 20 of theworld’s 100 largest electronics and software companies have madeour Valley their home. Though our community has less than 10% ofCalifornia’s population, we generate 38% of our state’s export sales.The fact that Silicon Valley stands for quality world-wide is a sourceof pride to all of our families.
However, as this study documents, while Silicon Valley is setting thepace in America’s new information-based economy, hundreds of thou-sands of our neighbors are at risk of being left behind. At a time whenSilicon Valley business and the community should be growing together,our research finds that, in far too many respects, we are only driftingapart.
Shrinking Paychecks
Like Richelle, Doug and Alejandro, the working families of Silicon Val-ley aren’t looking for handouts, but only the chance to work hard and taketheir place in the region’s winner’s circle. That’s part of the reason whySilicon Valley has one of the highest levels of productivity in Americatoday. But, despite our productivity, the hourly wages of three-quarters ofSilicon Valley’s workers were actually lower in 1996 than in 1989. Infact, five of the ten fastest growing occupations in our Valley today payless than $10 an hour for entry level positions. However, while the major-ity of workers were bringing home paychecks that were either small orshrinking, corporate executive earnings have only climbed. In the elec-tronics industry today, top executives now pay themselves 220 times asmuch as average production workers compared to 42:1 in 1991.
In a community where rents increased by more than 16% since 1990 —and where the median price of a home is over $320,000 — the implica-tions of our community’s growing wage gap are clear. But the crisis fac-ing this “other” Silicon Valley can’t only be measured in paychecks andhousing costs.
ii
“At a time when Silicon Valley
business and the community
should be growing together, our
research finds that, in far too
many respects, we are only
drifitng apart.”

○ ○ ○ ○ ○ ○ ○ ○ ○ ○ ○ ○ ○ ○ ○ ○ ○ ○ ○ ○ ○ ○ ○ ○ ○ ○ ○ ○ ○ ○ ○ ○ ○ ○ ○ ○ ○ ○ ○ ○ ○ ○
G R O W I N G X T O G E T H E R X O R X D R I F T I N G X A P A R T
W O R K I N G X P A R T N E R S H I P S X U S A11iii
Traffic jams and long delays are growing commonplace on our roadsand freeways. The threat of toxic hazards continues to plague us bothon the job and in our neighborhoods. Though high school drop outrates throughout California have been decreasing, in Santa ClaraCounty they’ve been on the rise. Gang activity in our community isgrowing. The fact that juvenile felony arrest rates have quadrupledsince 1985 is a grim reminder that Silicon Valley’s streets have be-come more dangerous, even as its businesses have grown more profit-able.
The Virtual Corporation
In the past, the quality of life within a region could often be calibratedto the competitiveness of its largest employers. And for good reason.In the 1950s, for example, a booming auto industry enabled the UnitedAuto Workers to bargain lucrative contracts which helped to movehundreds of thousands of southeastern Michigan families into themiddle-class. The claim that what was “good for General Motors wasgood for America” rang true for many communities nationwide. Inreturn for these wages and benefits, auto makers reaped the advan-tages of a stable workforce governed by a mutually agreed to set ofrules.
However, in our Valley no institution has yet stepped forward to fillthe same role in the electronics and software industries. Unlike theauto industry, which created rigidly tooled, mass production facilitiesto build its product, the semiconductor, computer and software indus-tries today are more a collection of “virtual” corporations: highly flex-ible firms which invest less in the development of plants than in col-laborative relationships with suppliers and subcontractors. In theseindustries a model of trade unionism designed for the era of HenryFord and Frederick Taylor is as unworkable as it is unattractive.
But employee organizations do have a vital part to play in winningbetter lives for workers like Richelle, Doug and Alejandro, though, inmany respects, they will need to function differently in the future.Like the industries of the new economy, the unions of the new economywill themselves need to become more nimble and innovative. The next
“...working families aren’t
looking for handouts, but only
the chance to work hard and
take their place in the region’s
winner’s circle.”

○ ○ ○ ○ ○ ○ ○ ○ ○ ○ ○ ○ ○ ○ ○ ○ ○ ○ ○ ○ ○ ○ ○ ○ ○ ○ ○ ○ ○ ○ ○ ○ ○ ○ ○ ○ ○ ○ ○ ○ ○ ○
G R O W I N G X T O G E T H E R X O R X D R I F T I N G X A P A R T
W O R K I N G X P A R T N E R S H I P S X U S A 12
generation of unions, for example, will bargain less for rigid workrules, and more for a real voice in workplace decision making. Theirmembers won’t always be the employees of individual companies,but individuals working for a range of employers. The contracts theynegotiate won’t only win new opportunity for their members, but alsoset standards for entire industries.
A New Economy and a New Social Compact
Similarly, it is up to the business community to recognize its new re-sponsibilities. A growing contingent workforce may satisfy WallStreet’s definition of corporate success, but we expect employers inSilicon Valley to live up to a higher standard. Not simply because it’sgood corporate citizenship, but because, in the new economy, a healthy,educated, stable and empowered workforce provides any employerwith a strategic advantage. Achieving this won’t come easy, but it won’thappen at all unless business embraces its stakeholders much as itdoes its stockholders. That means joining with government and laborto craft a new social compact so all of us can step into the winner’scircle together. In that respect, we urge employers to see this reportless as an indictment of their failures in the past, than as an invitationto work with us to help shape the future.
Silicon Valley is an exceptional community of talented men andwomen. Together, we’ve presented America — and the world — withan exciting vision of a new, information-based economy: an economythat can generate prosperity in which all can share. But we also knowthat making that vision real for our generation begins with carefullyassessing the problems we will face along the way. We present thisreport in that spirit and with the hope that it will help our communityand business grow together, not continue to drift apart.
Amy B. DeanFounderWorking Partnerships USAJanuary 1998
“...IN THE NEW ECONOMY, A
HEALTHY, EDUCATED, STABLE
AND EMPOWERED
WORKFORCE PROVIDES ANY
EMPLOYER WITH A STRATEGIC
ADVANTAGE.”

○ ○ ○ ○ ○ ○ ○ ○ ○ ○ ○ ○ ○ ○ ○ ○ ○ ○ ○ ○ ○ ○ ○ ○ ○ ○ ○ ○ ○ ○ ○ ○ ○ ○ ○ ○ ○ ○ ○ ○ ○ ○
G R O W I N G X T O G E T H E R X O R X D R I F T I N G X A P A R T
W O R K I N G X P A R T N E R S H I P S X U S A13
Growing Together, or Drifting Apart? provides a detailed statistical
portrait of the daily life of residents of Silicon Valley. By evaluating
data on wages, employment and poverty, and analyzing key indica-
tors of social and community life, we are presenting a comprehensive
overview of our region’s well-being.
This report comes at a critical time. Many leaders in both government
and the private sector believe the Silicon Valley experience can pro-
vide important clues for an America anxious to succeed in a new, glo-
bal economy. There is significant evidence to suggest they are wise to
do so. As this report points out, over the course of the last two decades
our region’s economy has prospered far more than most. Our success,
fueled in large part by the growth of new, information technology in-
dustries, has recently given rise to a host of efforts by others in the
U.S. and worldwide to create high-tech “corridors” in their own com-
munities.
However, while there is no question that much of the Silicon Valley
experience merits this enthusiasm, our report finds that the rewards of
our region’s economic competitiveness are still not being shared by
many residents of our community. Further, we find that despite our
region’s successes, Silicon Valley is experiencing a dramatic growth
in income inequality and economic insecurity.
The decoupling of economic competitiveness from the quality of life
has disturbing implications. Economic development policies have long
been guided by the assumption that the success of private employers
accrues to the benefit of the community as a whole. To this end, local
I. Executive Summary
“...despite our region’s
successes, Silicon Valley is
experiencing a dramatic growth
in income inequality and
economic insecurity.”

○ ○ ○ ○ ○ ○ ○ ○ ○ ○ ○ ○ ○ ○ ○ ○ ○ ○ ○ ○ ○ ○ ○ ○ ○ ○ ○ ○ ○ ○ ○ ○ ○ ○ ○ ○ ○ ○ ○ ○ ○ ○
G R O W I N G X T O G E T H E R X O R X D R I F T I N G X A P A R T
W O R K I N G X P A R T N E R S H I P S X U S A 14
governments have routinely embraced an array of incentives to en-
courage the location, growth and retention of various industries. How-
ever, by examining a range of indicators our report suggests that, ab-
sent the presence of mediating institutions, the competitiveness of Sili-
con Valley industry has not resulted in a higher quality of life for local
residents.
There is some validity to comparing the impact of the growth of the
information technology industry on our community to that of the steel
industry on Pittsburgh or the meat packing industry on Chicago.
Though, in their time, both industries were dynamic and highly com-
petitive, it was only after the wide scale organization of labor unions
that this resulted in the creation of large numbers of middle-class wage
earners. Similarly, the Silicon Valley experience suggests that, barring
the development of similar wage-setting institutions, income inequal-
ity will continue to expand, even as local industry continues to pros-
per.
Responding to income inequality and building an economy where busi-
nesses and workers’ wages do grow together, in fact, requires bold and
innovative leadership from Silicon Valley’s policy makers, business
leaders and community activists. Reaching a consensus will require
each to challenge many traditional assumptions about the roles of both
industry and public institutions in community life. While this will be
difficult, failing will have enormous implications for the businesses
and families who have made their home in Silicon Valley.
“...barring the development of
similar wage-setting institutions,
income inequality will continue
to expand, even as local
industry continues to prosper.”

○ ○ ○ ○ ○ ○ ○ ○ ○ ○ ○ ○ ○ ○ ○ ○ ○ ○ ○ ○ ○ ○ ○ ○ ○ ○ ○ ○ ○ ○ ○ ○ ○ ○ ○ ○ ○ ○ ○ ○ ○ ○
G R O W I N G X T O G E T H E R X O R X D R I F T I N G X A P A R T
W O R K I N G X P A R T N E R S H I P S X U S A15
Major findings of this report include:
Growing Economic Inequality: While incomes have been rising
steadily for high-income wage earners, others have experienced only
limited benefits from our area’s economic success. This disparity has
persisted even in the face of growing productivity and sales in the
region’s information technology industry.
• In 1996, hourly wages for 75% of the workforce were still lower
than they were in 1989, prior to the last recession. Wages for the bot-
tom 25% of the workforce have actually declined by more than 13%
in inflation-adjusted terms since 1989.
• Five of the ten fastest growing occupations in our region pay less
than $10 per hour for entry-level positions.
• An estimated 19% of all area jobs pay less than a living wage* for a
single adult. Nearly 40% of all jobs pay too little to keep a single
parent and child out of poverty. A full 55% of Silicon Valley jobs pay
too little to support a family of four.
• The ratio of earnings for top corporate executives to that of produc-
tion workers in the electronics industry has climbed from 42:1 in 1991
to 220:1 in 1996.
*Defines the minimum income required to be self sufficient without any form of publicsubsidies. In Santa Clara County, a worker needs to earn between $11.00-$17.00per hour, depending on the marital status and number of children.
“While incomes have been
rising steadily for high-income
wage earners, others have
experienced only limited
benefits from our area’s
economic success.”

○ ○ ○ ○ ○ ○ ○ ○ ○ ○ ○ ○ ○ ○ ○ ○ ○ ○ ○ ○ ○ ○ ○ ○ ○ ○ ○ ○ ○ ○ ○ ○ ○ ○ ○ ○ ○ ○ ○ ○ ○ ○
G R O W I N G X T O G E T H E R X O R X D R I F T I N G X A P A R T
W O R K I N G X P A R T N E R S H I P S X U S A 16
Decaying Quality of Life: Area housing costs have soared in recent
years, far out-pacing income growth, while access to quality health
care and education show dramatic disparities.
• The average rent in Santa Clara County for a one bedroom apart-
ment is now over $1,100. In the last four years, average rents have
increased 28%.
• The median purchase price of a home in Santa Clara County in
1996 was 7.6% above the 1995 level. The median price in August
1997 was $323,000, a nearly 20% increase over the same month
in 1996.
• Over 27% of Latina mothers in Santa Clara County have late pre-
natal care, or none at all. The teen birth rate for Latinas is nearly
one-in-eight.
• Nearly 13.6% of Santa Clara County adults report no health insur-
ance coverage. For Latino residents, the rate of non-coverage is
nearly 25%.
• In one of the most disturbing trends, the high school drop out rate
has been increasing and over 40% of Latino adults lack a high
school degree.
“ In one of the most disturbing
trends, the high school drop out
rate has been increasing”

○ ○ ○ ○ ○ ○ ○ ○ ○ ○ ○ ○ ○ ○ ○ ○ ○ ○ ○ ○ ○ ○ ○ ○ ○ ○ ○ ○ ○ ○ ○ ○ ○ ○ ○ ○ ○ ○ ○ ○ ○ ○
G R O W I N G X T O G E T H E R X O R X D R I F T I N G X A P A R T
W O R K I N G X P A R T N E R S H I P S X U S A17
Strained Public Sector Services: Though both population growth
and expanding wage inequality have placed new demands on public
education and an array of public services, local government has con-
tinued to face severe financial constraints in providing them. Since
the 1978 passage of Proposition 13, local tax burdens have shifted
from property taxes and federal transfers, to an increasing reliance on
sales taxes and service charges—regressive taxes which place an un-
fair burden on middle-income and lower-income residents. The result
is that even though our community as a whole benefits from public
education and the provisions of other public services, the cost of pro-
viding those services is increasingly being borne by those who can
least afford to pay. This new reliance on the sales tax impacts local
economic development strategies as local governments give prefer-
ence to retailers and other sales tax generators over industries which
may have greater value to the community.
Threats to Environmental Quality and Public Health: While envi-
ronmental threats posed by the electronics industry are not as readily
apparent as those posed by heavy industries such as oil and steel, sig-
nificant environmental problems such as groundwater contamination,
high-volume water use, and serious toxic exposure in the workplace
are hallmarks of high tech production. Our region’s heavy reliance on
automobiles is also straining our transportation infrastructure while
posing a growing hazard to public health and environmental quality.
“Our region’s heavy reliance on
automobiles is also straining
our transportation infrastructure
while posing a growing hazard
to public health and
environmental quality.”

○ ○ ○ ○ ○ ○ ○ ○ ○ ○ ○ ○ ○ ○ ○ ○ ○ ○ ○ ○ ○ ○ ○ ○ ○ ○ ○ ○ ○ ○ ○ ○ ○ ○ ○ ○ ○ ○ ○ ○ ○ ○
G R O W I N G X T O G E T H E R X O R X D R I F T I N G X A P A R T
W O R K I N G X P A R T N E R S H I P S X U S A 18

○ ○ ○ ○ ○ ○ ○ ○ ○ ○ ○ ○ ○ ○ ○ ○ ○ ○ ○ ○ ○ ○ ○ ○ ○ ○ ○ ○ ○ ○ ○ ○ ○ ○ ○ ○ ○ ○ ○ ○ ○ ○
G R O W I N G X T O G E T H E R X O R X D R I F T I N G X A P A R T
W O R K I N G X P A R T N E R S H I P S X U S A19
Growing Together, or Drifting Apart? profiles the economic and so-
cial well-being of Silicon Valley residents. It presents a comprehen-
sive overview of our region’s economy, analyzing significant trends
in employment, wages, income and poverty. This report also presents
various indicators of community life and key factors in determining
social well-being. By presenting this material, Growing Together, or
Drifting Apart? is intended to foster an informed discussion of our
region’s economic development strategies and how the competitive-
ness of Silicon Valley business can better lead to an improved quality
of life for area residents.
Silicon Valley: The Heart of the New Economy
Once known only for its fruit orchards, Silicon Valley1 is now regarded
as the heart of the new economy: a diverse array of information tech-
nology industries centered around the production of semiconductors,
computers, software and related “high-tech” industries. According to
a recent Business Week magazine survey, 45% of all industrial growth
in the United States during the last five years came from the computer
and semiconductor industries alone. In fact, 20 of the world’s 100
largest electronics and software firms are headquartered in Silicon
Valley today. The presence of these industries is a principal reason
why Silicon Valley is the nation’s largest export market today, and
accounts for 38% of state export sales despite the fact that it has less
than 10% of California’s population.
II. Introduction
1:Silicon Valley includes all of Santa Clara County and significant parts ofneighboring counties including Alameda, San Mateo and Santa Cruz Counties. Foranalytical puposes, data has been collected from Santa Clara County as the largestgeographic segment of Silicon Valley and a key indicator of trends in the region.
The report...”is intended to
foster an informed discussion
of our region’s economic
development strategies”

○ ○ ○ ○ ○ ○ ○ ○ ○ ○ ○ ○ ○ ○ ○ ○ ○ ○ ○ ○ ○ ○ ○ ○ ○ ○ ○ ○ ○ ○ ○ ○ ○ ○ ○ ○ ○ ○ ○ ○ ○ ○
G R O W I N G X T O G E T H E R X O R X D R I F T I N G X A P A R T
W O R K I N G X P A R T N E R S H I P S X U S A 20
Measuring Success in the New Economy
By most traditional measures of economic growth, Silicon Valley can
be considered a clear success. A review of the area’s Gross Regional
Product, productivity, unemployment and corporate profits paints a
vivid portrait of an economy which is the envy of urban America.
However, despite its prosperity, Silicon Valley is plagued by declin-
ing wages and a deteriorating quality of life. This incongruency sug-
gests the need for more realistic indicators that measure the well-be-
ing of a community, not simply the competitiveness of its principal
employers.
The quandary presented by traditional economic indicators is threefold:
• First, they do not capture a series of standard economic factors that
fundamentally shape the quality of life. Among these factors are: wages,
income distribution, income inequality, job insecurity, and the rise in
temporary, part-time and other forms of contingent employment.
• Second, traditional economic indicators do not capture issues that
are crucial to determining the quality of life. For example, they fail
to incorporate data measuring education, public health, recreation
and other elements vital to assessing the quality of individual and
community life.
• Third, traditional indicators also fail to assess the true economic cost
of a variety of vital activities. For example, housework, child care
“...traditional indicators also fail
to assess the true economic
cost of a variety of vital
activities.”

○ ○ ○ ○ ○ ○ ○ ○ ○ ○ ○ ○ ○ ○ ○ ○ ○ ○ ○ ○ ○ ○ ○ ○ ○ ○ ○ ○ ○ ○ ○ ○ ○ ○ ○ ○ ○ ○ ○ ○ ○ ○
G R O W I N G X T O G E T H E R X O R X D R I F T I N G X A P A R T
W O R K I N G X P A R T N E R S H I P S X U S A21
and care for the elderly are crucial to our economic well-being, yet
they are not counted in measures of economic activity when performed
by family members rather than purchased as outside services. Addi-
tionally, indicators often determine that some activities are an eco-
nomic benefit to society, when closer scrutiny suggests they should be
regarded as a cost. The expense of treating patients exposed to pollu-
tion, for example, may generate economic activity in a community,
but also has definite costs. Environmental destruction and the deple-
tion of natural resources are very real costs that are not calculated into
traditional economic indicators.
In response to these and other concerns, economists are developing
new approaches to measuring the social and economic health that go
well beyond traditional indicators. Preparing such indicators allows
us not only to better measure the socioeconomic well-being of our
communities, but to craft sensible responses to the problems within
them. In this respect, Growing Together, Or Drifting Apart? was
prepared not as an academic exercise, but as a tool to help build a
consensus on economic development strategies in Silicon Valley.
Outline of Report
Growing Together, Or Drifting Apart is divided into five parts:
“Who Are We? A Demographic Profile of Santa Clara County” pro-
vides a statistical overview of the composition of Silicon Valley’s
population and the components of population change.
“Preparing such indicators
allows us not only to better
measure the socioeconomic
well-being of our communities,
but to craft sensible responses
to the problems within them.”

○ ○ ○ ○ ○ ○ ○ ○ ○ ○ ○ ○ ○ ○ ○ ○ ○ ○ ○ ○ ○ ○ ○ ○ ○ ○ ○ ○ ○ ○ ○ ○ ○ ○ ○ ○ ○ ○ ○ ○ ○ ○
G R O W I N G X T O G E T H E R X O R X D R I F T I N G X A P A R T
W O R K I N G X P A R T N E R S H I P S X U S A 22
“Working in the New Economy: Employment, Wages and Income
Trends” details employment and wage trends in the Silicon Valley, as
well as developments in income inequality, economic opportunity, and
poverty.
“Community and Society: Health, Education and Related Trends” of-
fers indicators on the quality of life in our region by exploring trends
in health, education, housing and other areas.
“Civic Life: Public Institutions and Involvement” analyzes trends re-
lated to local government and public participation.
“Environmental Quality and Public Health: Indicators of
Sustainability” provides indicators of environmental quality, public
health and sustainability in Silicon Valley.

○ ○ ○ ○ ○ ○ ○ ○ ○ ○ ○ ○ ○ ○ ○ ○ ○ ○ ○ ○ ○ ○ ○ ○ ○ ○ ○ ○ ○ ○ ○ ○ ○ ○ ○ ○ ○ ○ ○ ○ ○ ○
G R O W I N G X T O G E T H E R X O R X D R I F T I N G X A P A R T
W O R K I N G X P A R T N E R S H I P S X U S A23
III. Who Are We? A Demographic Profile of Santa Clara County
Total Population
In 1997, Santa Clara County had an estimated population of 1.65 mil-
lion people, a 10.4% increase from 1990. However, this growth has
been uneven and centered largely in the county’s southern and eastern
communities. Morgan Hill, for example, showed a population increase
of 22.2%. Milpitas grew by 20.7%. In comparison, San Jose grew by
11.6% adding an estimated 90,000 residents since completion of the
last census.

○ ○ ○ ○ ○ ○ ○ ○ ○ ○ ○ ○ ○ ○ ○ ○ ○ ○ ○ ○ ○ ○ ○ ○ ○ ○ ○ ○ ○ ○ ○ ○ ○ ○ ○ ○ ○ ○ ○ ○ ○ ○
G R O W I N G X T O G E T H E R X O R X D R I F T I N G X A P A R T
W O R K I N G X P A R T N E R S H I P S X U S A 24
1,800,000
1,600,000
1,400,000
1,200,000
1,000,000
800,000
600,000
400,000
200,000
1990
White
Latino
Asian/Pacific Island
Black
Native American
1991 1992 1993 1994 19950
4%
20%
23%
53%
Chart 1: Santa Clara County Population by Race–1990-1995
Source: California Dept. of Finance
Growing Diversity
Not unlike California as a whole, Silicon Valley is becoming more
ethnically diverse with each passing year. According to the most re-
cent data, all of Santa Clara County’s net population gain since 1990
is the result of the growth of its non-white population. The white popu-
lation now represents less than 53% of the county’s total population,
while the Latino population has grown to 23%. The number of Asian/
Pacific Islanders has also grown and now represents 20% of Santa
Clara County’s residents. Growth in the county’s African-American
community has remained relatively static and continues to represent
approximately 4% of Santa Clara County’s population.
“Not unlike California as a
whole, Silicon Valley is
becoming more ethnically
diverse with each passing year.”

○ ○ ○ ○ ○ ○ ○ ○ ○ ○ ○ ○ ○ ○ ○ ○ ○ ○ ○ ○ ○ ○ ○ ○ ○ ○ ○ ○ ○ ○ ○ ○ ○ ○ ○ ○ ○ ○ ○ ○ ○ ○
G R O W I N G X T O G E T H E R X O R X D R I F T I N G X A P A R T
W O R K I N G X P A R T N E R S H I P S X U S A25
150,000
100,000
50,000
0
-50,000
-100,000
Chart 2: Components of Population ChangeSanta Clara County, 1990-1995
133,900
Total Population GrowthNatural Increase(Births-Deaths) Net International
Migration
Source: California Dept. of Finance
Net Domestic Migration
111,348 89,486 -66,934
Changes in the region’s population in this decade reflect a number of
different trends. Immigration from other countries resulted in an av-
erage of 15,000 new residents annually. However, from other areas of
the U.S., fewer people are moving to Silicon Valley than the number
leaving, averaging 11,000 people per year. Most of the population
growth is as a result of childbirth rather than immigration.
Trends among ethnic groups differ widely. With more than 75,000
new members between 1990 and 1995, Santa Clara County’s Asian/
Pacific Islanders represent the fastest growing segment of this diverse
community. Almost two out of three of these new residents migrated
into the county. In contrast, of the 50,000 new members of Santa Clara
County’s Latino community, only 14% came from outside the county.
“Most of the population growth
[in the Valley] is as a result
of childbirth rather than
immigration.”

○ ○ ○ ○ ○ ○ ○ ○ ○ ○ ○ ○ ○ ○ ○ ○ ○ ○ ○ ○ ○ ○ ○ ○ ○ ○ ○ ○ ○ ○ ○ ○ ○ ○ ○ ○ ○ ○ ○ ○ ○ ○
G R O W I N G X T O G E T H E R X O R X D R I F T I N G X A P A R T
W O R K I N G X P A R T N E R S H I P S X U S A 26
Age Profile
The age of Santa Clara County residents differs dramatically by race
with the white population significantly older than that of the county as
a whole. For example, though whites made up 55% of the county’s
total population in 1995, only 44% of children under the age of 15
were white. Of residents age 65 and older, nearly 73% were white. In
contrast, Latinos, account for 23% of the total population, but make
up 31% of all children under the age of 15, and only 12% of residents
age 65 and older.
The implication of this shift is that the future of Silicon Valley is inter-
twined with that of its younger and growing Latino community. How-
ever, as highlighted later in this report, it is the Latino community
which is currently at greatest risk of being “left behind” economically
and socially.
“...the future of Silicon Valley is
intertwined with that of its
younger and growing Latino
community. .... [which] is
currently at greatest risk of
being ‘left behind’”-60000
-40000
-20000
0
20000
40000
60000
80000
100000
120000
Natural Change
Source: California Department of Finance
Net MigrationTotal Change
TotalNative AmericanBlackAsian
Pacific IslanderLatinoWhite
Chart 3: Net Change in Population by Race, 1990 Cencus to July 1995

○ ○ ○ ○ ○ ○ ○ ○ ○ ○ ○ ○ ○ ○ ○ ○ ○ ○ ○ ○ ○ ○ ○ ○ ○ ○ ○ ○ ○ ○ ○ ○ ○ ○ ○ ○ ○ ○ ○ ○ ○ ○
G R O W I N G X T O G E T H E R X O R X D R I F T I N G X A P A R T
W O R K I N G X P A R T N E R S H I P S X U S A27
Education Profile
By far, educational attainment is one of the most telling indica-
tors of any community’s well-being. This is particularly true in
Silicon Valley, where employers in the information technology
industry require a highly skilled and sophisticated workforce. How-
ever, educational attaintment in Santa Clara County is sharply
stratified along ethnic and racial lines. According to 1990 data,
the county’s Chinese, Japanese and Indian communities are, by
far, the best educated with more than 60% of adults aged 18-64
having received a college degree. No other ethnic group ap-
proaches this level of educational attainment. Over 40% of Latino
adults lack a high school education and in the Native American
community, more adults lack a high school diploma than have a
college degree.
“...educational attaintment in
Santa Clara County is sharply
stratified along ethnic and racial
lines.”

○ ○ ○ ○ ○ ○ ○ ○ ○ ○ ○ ○ ○ ○ ○ ○ ○ ○ ○ ○ ○ ○ ○ ○ ○ ○ ○ ○ ○ ○ ○ ○ ○ ○ ○ ○ ○ ○ ○ ○ ○ ○
G R O W I N G X T O G E T H E R X O R X D R I F T I N G X A P A R T
W O R K I N G X P A R T N E R S H I P S X U S A 28
1,000,000
900,000
800,000
700,000
600,000
500,000
400,000
300,000
200,000
100,000
0
1983 1984 1985 1986 1987 1988 1989 1990 1991 1992 1993 1994 1995 1996 1997*
Government
Services
Chart 7: Employment in Santa Clara County, 1983-1997
Finance, Insurance, Real Estate
Wholesale and Retail Trade
Transportation and Public Utilities
Manufacturing
Construction
Farm and Mining
Source: California Economic Development Department
167,000(23.2%)
132,800(18.4%)
302,300(32.6%)
179,700(19.4%)
263,200(36.6%)
255,600(27.6%)
Editor Note: Reference for Section IV (following page)
Non-HispanicWhite
Japanese,Chinese,
Indian
Black
Other AsianPacific Islander
Native American
Other
Latino
0%
College Degree
Less than High School
10% 20% 30% 40% 50% 60% 70%
Chart 6: Educational Attainment by Ethnic Group, Adults 18-64 in Santa Clara County, 1990
Source: U.S. Census, 1990

○ ○ ○ ○ ○ ○ ○ ○ ○ ○ ○ ○ ○ ○ ○ ○ ○ ○ ○ ○ ○ ○ ○ ○ ○ ○ ○ ○ ○ ○ ○ ○ ○ ○ ○ ○ ○ ○ ○ ○ ○ ○
G R O W I N G X T O G E T H E R X O R X D R I F T I N G X A P A R T
W O R K I N G X P A R T N E R S H I P S X U S A29
IV. Working in the New Economy: Employment, Wages and Income Trends
Silicon Valley’s Economy in Perspective
As often noted, Silicon Valley’s economy is dominated by a high con-
centration of electronics and related information technology indus-
tries. An estimated 25-to-35% of all employment in our region is
directly related to these firms. Like the entertainment industry in Los
Angeles, Silicon Valley’s information technology industry is signifi-
cant, but not the only employment sector impacting the economic well-
being of the region.
The Information Economy is a Manufacturing Economy
Of the 28% of Silicon Valley’s workforce employed in manufacturing
industries, four of every five are employed in computer, semiconduc-
tor and related industries. Another 33% of Silicon Valley’s workforce
is employed in what statisticians refer to as “service industries,” an
extraordinarily broad category encompassing a host of industries from
health care to education. While many of these positions, particularly
in the retail industry, require relatively few skills, the concentration of
information technology firms in Santa Clara County has generated an
array of new, highly sophisticated service jobs. For example, the de-
velopment of custom software, though requiring highly specialized
skills, is still considered a “service” job for the purpose of data collec-
tion.
Editor Note: Reference Chart No. 7 on previous page
“Like the entertainment
industry in Los Angeles,
Silicon Valley’s information
technology industry
is significant, but not the only
employment sector impacting
the economic well-being
of the region”

○ ○ ○ ○ ○ ○ ○ ○ ○ ○ ○ ○ ○ ○ ○ ○ ○ ○ ○ ○ ○ ○ ○ ○ ○ ○ ○ ○ ○ ○ ○ ○ ○ ○ ○ ○ ○ ○ ○ ○ ○ ○
G R O W I N G X T O G E T H E R X O R X D R I F T I N G X A P A R T
W O R K I N G X P A R T N E R S H I P S X U S A 30
Largest Employment Sectors
The largest employment sector in Silicon Valley is electronic components,
a sector that includes semiconductor manufacturing. Given the depth of
technical knowledge and problem solving required of many workers in
this industry, which includes semiconductors, it is little surprise that the
incomes it provides are among the highest of any in Santa Clara County.
Annual incomes of workers in this industry averaged $62,445, well above
the county average of $44,792. By comparison, the second largest em-
ployer in Santa Clara County, local government, paid an average of $34,684
a year. Other enterprises related to computers and data processing, the
third and fourth largest employers in Silicon Valley, also provide wages
far in excess of the county average. However, the fifth and sixth largest
employers, restaurants and taverns, and temporary employment agencies,
offered wages at a fraction of the county average. For example, the aver-
age earnings of an employee of a restaurant or similar establishment to-
taled $11,933, only 26% of the county average. All told, eight of the top
15 employment sectors in Silicon Valley provide wages well above the
county average, while six offer pay significantly below it.
“...eight of the top 15
employment sectors in Silicon
Valley provide wages well above
the county average, while six
offer pay significantly below it.”

○ ○ ○ ○ ○ ○ ○ ○ ○ ○ ○ ○ ○ ○ ○ ○ ○ ○ ○ ○ ○ ○ ○ ○ ○ ○ ○ ○ ○ ○ ○ ○ ○ ○ ○ ○ ○ ○ ○ ○ ○ ○
G R O W I N G X T O G E T H E R X O R X D R I F T I N G X A P A R T
W O R K I N G X P A R T N E R S H I P S X U S A31
Driving Industry Clusters
Analysts of economic development in Silicon Valley often base their analy-
sis on “driving industry clusters” in the region — concentrations of largely
complimentary industries which are seen as driving wealth creation in the
value through the exports of goods and services. Major driving industry
clusters in the area include: computers/communications, semiconduc-
tors, software, bioscience, professional services, manufacturing/innova-
tion services, and environmental technologies. Studying employment
trends and industry dynamics in these sectors can provide important clues
to understanding the region’s economic health. However, this approach
has at least three major flaws in terms of assessing the overall well-being
of the region’s economy and working families in the area.
First, this approach hides inequality within firms. By focusing on total
employment, this approach fails to examine the types of jobs firms are
creating, how many of those jobs are part-time or full-time, how many are
temporary or permanent, and how many provide opportunities for ad-
vancement or are just dead-end jobs. In addition, by focusing only on
average wages, this approach fails to examine wage inequality within the
firm, and whether the incomes of workers within those firms are going up
at the same time as company revenues and profits are expanding.
Second, this approach makes little effort to assess inequality of wages
within clusters. Starkly divergent trends can be “hidden” within in-
dustry clusters. Some economic analysts use the catagory of “profes-
sional services” but include within this catagory both true professional
services (e.g., attorneys, architects, accountants, etc.) and a variety of
“...this approach fails to
examine wage inequality within
the firm, and whether the
incomes of workers within those
firms are going up at the same
time as company revenues and
profits are expanding.”

○ ○ ○ ○ ○ ○ ○ ○ ○ ○ ○ ○ ○ ○ ○ ○ ○ ○ ○ ○ ○ ○ ○ ○ ○ ○ ○ ○ ○ ○ ○ ○ ○ ○ ○ ○ ○ ○ ○ ○ ○ ○
G R O W I N G X T O G E T H E R X O R X D R I F T I N G X A P A R T
W O R K I N G X P A R T N E R S H I P S X U S A 32
low-end services (e.g., photocopying services, services provided by tem-
porary help agencies, etc.). This distinction becomes crucial given the
growing practice by employers of “out-sourcing” a range of essential “pro-
fessional” services, such as custodial work, which businesses previously
hired employees of their own to provide often at higher wages. As the
following table shows, the number of Silicon Valley workers providing
out-sourced services at relatively low wages has been soaring, while the
employment of higher paid professionals has shown only modest gains.
A somewhat similar trend is also revealed on closer examination of em-
ployment within the cluster of “computers/communications” firms. While
employment at Sun, Hewlett-Packard, Apple and other major computer
companies has been stagnant or declining in recent years, hiring by con-
tractors which manufacture components used by these firms has been
rapidly expanding. However, the earnings of employees of these contrac-
tors are 30% less than that of workers at the original equipment manufac-
turer. Not unlike its neglect of the out-sourcing low-end professional ser-
vices, this methodology largely ignores the impact on wages of this grow-
ing reliance by major computer firms on component manufacturers.
“While employment at Sun,
Hewlett-Packard, Apple and
other major computer
companies has been stagnant
or declining in recent years,
hiring by contractors which
manufacture components used
by these firms has been rapidly
expanding.”
○ ○ ○ ○ ○ ○ ○ ○ ○ ○ ○ ○ ○ ○ ○ ○ ○ ○ ○ ○ ○ ○ ○ ○ ○ ○ ○ ○ ○ ○ ○ ○ ○ ○ ○ ○ ○ ○ ○ ○ ○ ○
G R O W I N G X T O G E T H E R X O R X D R I F T I N G X A P A R T
W O R K I N G X P A R T N E R S H I P S X U S A33
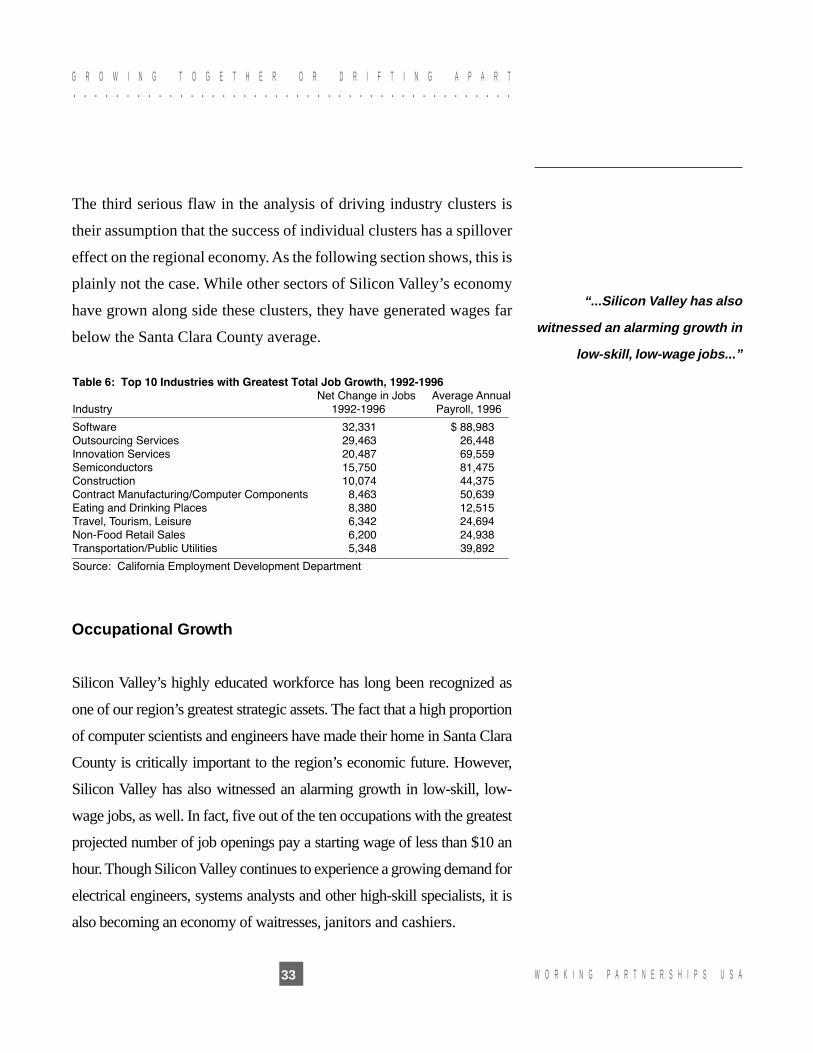
The third serious flaw in the analysis of driving industry clusters is
their assumption that the success of individual clusters has a spillover
effect on the regional economy. As the following section shows, this is
plainly not the case. While other sectors of Silicon Valley’s economy
have grown along side these clusters, they have generated wages far
below the Santa Clara County average.
(Table 6—Top 10 Industries with
Greatest Job Growth, 1992-1996)
Occupational Growth
Silicon Valley’s highly educated workforce has long been recognized as
one of our region’s greatest strategic assets. The fact that a high proportion
of computer scientists and engineers have made their home in Santa Clara
County is critically important to the region’s economic future. However,
Silicon Valley has also witnessed an alarming growth in low-skill, low-
wage jobs, as well. In fact, five out of the ten occupations with the greatest
projected number of job openings pay a starting wage of less than $10 an
hour. Though Silicon Valley continues to experience a growing demand for
electrical engineers, systems analysts and other high-skill specialists, it is
also becoming an economy of waitresses, janitors and cashiers.
“...Silicon Valley has also
witnessed an alarming growth in
low-skill, low-wage jobs...”

○ ○ ○ ○ ○ ○ ○ ○ ○ ○ ○ ○ ○ ○ ○ ○ ○ ○ ○ ○ ○ ○ ○ ○ ○ ○ ○ ○ ○ ○ ○ ○ ○ ○ ○ ○ ○ ○ ○ ○ ○ ○
G R O W I N G X T O G E T H E R X O R X D R I F T I N G X A P A R T
W O R K I N G X P A R T N E R S H I P S X U S A 34
Wage Trends
Average annual income in the Silicon Valley has been increasing in recent
years, but closer review suggests that wage gains for most Silicon Valley
residents have been much weaker than generally believed. For example, in
1996 average real annual earnings climbed locally by 5.1%. However, when
adjusted to reflect wage inequality within different sectors of the workforce
and income increases resulting from additional hours worked, the story is
much more complex.
A careful analysis of hourly earnings reveals a disturbing trend toward growing
wage inequality. In fact, most wage earners in Silicon Valley have yet to fully
recover from the recession of the early 1990s. By 1996, only Silicon Valley’s
highest income workers, those at the 90th percentile, were earning wages above
those earned in 1989. Lower wage workers, those at the 10th and 25th percen-
tile, have actually seen their wages drop by more than 13% since 1989.
“...wage gains for most Silicon
Valley residents have been
much weaker than generally
believed.”These are the latest figures from the EDD’s Survey of Occupational Wages. The EDD survey does not report salary datafor each occupation in each county. When information is not available for Santa Clara County, salary data from a comparablecounty was used.

○ ○ ○ ○ ○ ○ ○ ○ ○ ○ ○ ○ ○ ○ ○ ○ ○ ○ ○ ○ ○ ○ ○ ○ ○ ○ ○ ○ ○ ○ ○ ○ ○ ○ ○ ○ ○ ○ ○ ○ ○ ○
G R O W I N G X T O G E T H E R X O R X D R I F T I N G X A P A R T
W O R K I N G X P A R T N E R S H I P S X U S A35
As Table 9 indicates, earners with a high school education or less
and wage earners at the bottom 20% of the labor market have expe-
rienced a particularly steep decline in their wages over the past seven
years. Non-white workers have also experienced a significant ero-
sion in their wages during this period. The fact that 1995-96 average
hourly earnings fell to $17.34 from $18.66 in 1989-90 indicates that
the annual income increase for many is actually the result of work-
ing more hours for less money.
A generally accepted measure of inequality is the Gini coefficient.
This indicator measures the extent a region’s total income is con-
“The fact that...average hourly
earnings fell...indicates that the
annual income increase for many
is actually the result of working
more hours for less money.”

○ ○ ○ ○ ○ ○ ○ ○ ○ ○ ○ ○ ○ ○ ○ ○ ○ ○ ○ ○ ○ ○ ○ ○ ○ ○ ○ ○ ○ ○ ○ ○ ○ ○ ○ ○ ○ ○ ○ ○ ○ ○
G R O W I N G X T O G E T H E R X O R X D R I F T I N G X A P A R T
W O R K I N G X P A R T N E R S H I P S X U S A 36
0.28
0.29
0.30
0.31
0.32
0.33
0.34
0.35
0.36
0.37
0.38
USA
Santa Clara County
19961995199419931992199119901989
Source: Economic Policy Institute analysis of Census Data
Chart 8: Gini Co-efficient of Inequality,Santa Clara County and USA
centrated in a minority of the population. Today, wage inequality in
Silicon Valley exceeds that of the U.S. as a whole. Given that this
measure is based only on wages and fails to reflect earnings from
stock options, the true extent of inequality in Silicon Valley is likely
greater than that reflected by the Gini coefficient.
Executive Pay Growth
An additional indicator of widening wage inequality in Silicon Valley
is the steep increase in the earnings of executives at major firms in
Santa Clara County relative to the earnings of their employees. Since
1991, the average annual compensation of the highest paid 100 corpo-
rate executives at Silicon Valley’s largest companies grew by 390%.
“Today, wage inequality in
Silicon Valley exceeds that of
the U.S. as a whole. ”

○ ○ ○ ○ ○ ○ ○ ○ ○ ○ ○ ○ ○ ○ ○ ○ ○ ○ ○ ○ ○ ○ ○ ○ ○ ○ ○ ○ ○ ○ ○ ○ ○ ○ ○ ○ ○ ○ ○ ○ ○ ○
G R O W I N G X T O G E T H E R X O R X D R I F T I N G X A P A R T
W O R K I N G X P A R T N E R S H I P S X U S A37
In contrast, the average annual income of production workers in the
electronics industry declined by 6%. The ratio of annual income of
the top 100 executives to that of the average production worker climbed
from 42:1 in 1991 to 220:1 in 1996.
Productivity and Wages
Silicon Valley can boast one of the highest levels of productivity of
any region in the United States. In our region, value added per manu-
facturing employee (a key measure of productivity) was $114,000 in
1992 compared to a U.S. average of less than $80,000. However, this
impressive productivity is not reflected in workers’ paychecks.
From 1977 through 1992, value added per manufacturing employee
grew at a rate of 2.5% annually. But the wages paid to manufacturing
workers have increased by only 0.7% annually.
“Since 1991, the average
annual compensat ion of
the highest paid 100
corporate executives at
Silicon Valley’s largest
companies grew by 390%.
In contrast, the average
annual income of
production workers in the
electronics industry
declined by 6%.”

○ ○ ○ ○ ○ ○ ○ ○ ○ ○ ○ ○ ○ ○ ○ ○ ○ ○ ○ ○ ○ ○ ○ ○ ○ ○ ○ ○ ○ ○ ○ ○ ○ ○ ○ ○ ○ ○ ○ ○ ○ ○
G R O W I N G X T O G E T H E R X O R X D R I F T I N G X A P A R T
W O R K I N G X P A R T N E R S H I P S X U S A 38
Chart 10: Productivity and Wages in Computer and Office Equipment Manufacturing,Santa Clara County, 1982-1992
0
$50,000
$75,583
$44,869
$22,603
$107,084
$54,492
$33,035
$158,181
$54,691
$33,245
$100,000
$150,000
$200,000
199219871982
Value Added Per Employee
Average Income, Non-Production Worker
Average Income, Production Worker
Source: Census of U.S. Manufacturers
Chart 11: Santa Clara County Semiconductor Manufacturing Productivity and Wages 1977-1992
$82,683
$103,115
$148,777
$60,784
$31,176
$48,280
$30,239
$43,005
$23,663
Value Added Per Employee
Average Income, Non-Production Worker
Average Income, Production Worker
Source: Census of U.S. Manufacturers
0
$30,000
$60,000
$90,000
$120,000
$150,000
199219871982
“Silicon Valley can boast one of
the highest levels of productivity
of any region in the United
States.”
$20,000
$40,000
$60,000
$80,000
$100,000
$120,000
Value Added Per Employee
Average Income, Non-Production Worker
Average Income, Production Worker
199219871982
$77,867
$93,469
$51,822
$30,258 $30,284
$56,765
$113,254
$43,828
$26,978
Chart 9: Productivity and Wages in Manufacturing,Santa Clara County, 1982-1992
Source: Census of U.S. Manufacturers
○ ○ ○ ○ ○ ○ ○ ○ ○ ○ ○ ○ ○ ○ ○ ○ ○ ○ ○ ○ ○ ○ ○ ○ ○ ○ ○ ○ ○ ○ ○ ○ ○ ○ ○ ○ ○ ○ ○ ○ ○ ○
G R O W I N G X T O G E T H E R X O R X D R I F T I N G X A P A R T
W O R K I N G X P A R T N E R S H I P S X U S A39
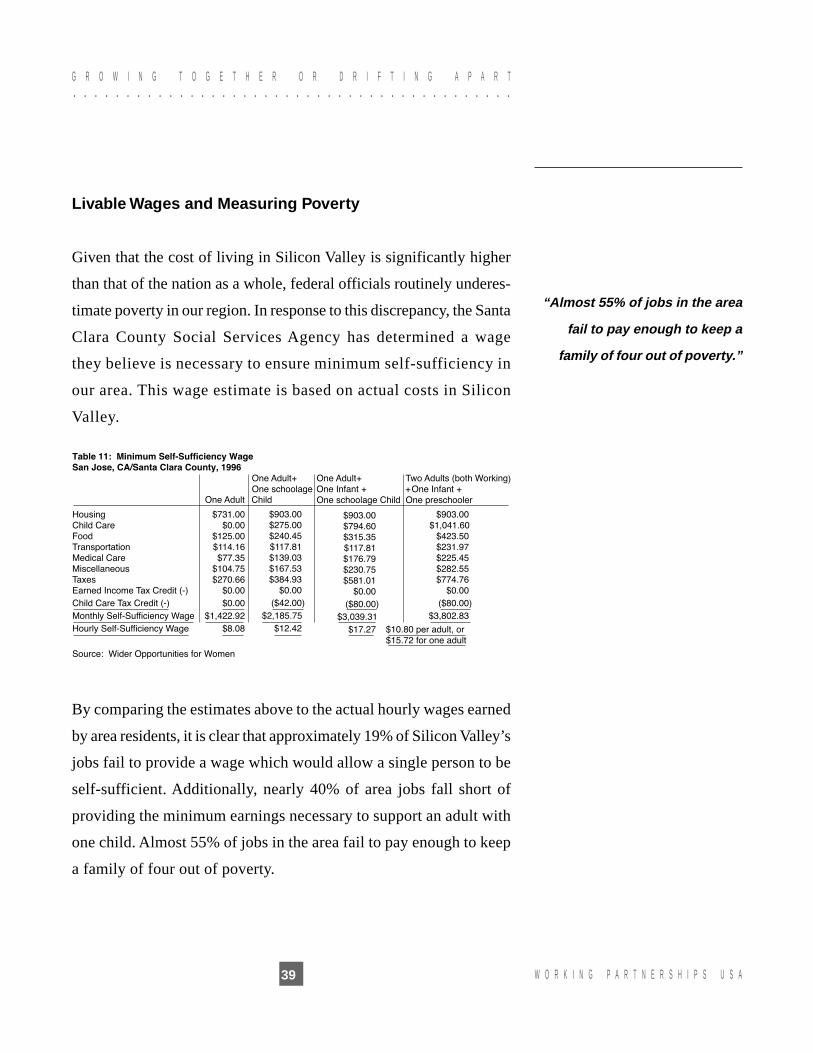
Livable Wages and Measuring Poverty
Given that the cost of living in Silicon Valley is significantly higher
than that of the nation as a whole, federal officials routinely underes-
timate poverty in our region. In response to this discrepancy, the Santa
Clara County Social Services Agency has determined a wage
they believe is necessary to ensure minimum self-sufficiency in
our area. This wage estimate is based on actual costs in Silicon
Valley.
By comparing the estimates above to the actual hourly wages earned
by area residents, it is clear that approximately 19% of Silicon Valley’s
jobs fail to provide a wage which would allow a single person to be
self-sufficient. Additionally, nearly 40% of area jobs fall short of
providing the minimum earnings necessary to support an adult with
one child. Almost 55% of jobs in the area fail to pay enough to keep
a family of four out of poverty.
“Almost 55% of jobs in the area
fail to pay enough to keep a
family of four out of poverty.”

○ ○ ○ ○ ○ ○ ○ ○ ○ ○ ○ ○ ○ ○ ○ ○ ○ ○ ○ ○ ○ ○ ○ ○ ○ ○ ○ ○ ○ ○ ○ ○ ○ ○ ○ ○ ○ ○ ○ ○ ○ ○
G R O W I N G X T O G E T H E R X O R X D R I F T I N G X A P A R T
W O R K I N G X P A R T N E R S H I P S X U S A 40
10%
19%
39%
54%
0
20%
30%
40%
50%
60%
Source: Economic Policy Institute and Wider Opportunities for Women
Chart 12: Percent of jobs in Santa Clara County in 1996 that did not pay a self-sufficiency wage
Pay too little to support a single person
Pay too little to support a single parent with one child
Pay too little for one person to support a family of four
Bankruptcy Filings
In order to provide for their basic needs, many area residents are using
credit cards, borrowing heavily and, as a result, are falling into debt.
Unfortunately, accurate data on individual consumer debt on a regional
basis is unavailable. However, one proxy for this is data related to
personal bankruptcy filings. In Santa Clara County, personal bank-
ruptcy filings have increased 65% in the last six years, providing an
indication of the financial hardships being faced by many Silicon Val-
ley residents.
“In Santa Clara County,
personal bankruptcy filings
have increased 65% in the last
six years,”

○ ○ ○ ○ ○ ○ ○ ○ ○ ○ ○ ○ ○ ○ ○ ○ ○ ○ ○ ○ ○ ○ ○ ○ ○ ○ ○ ○ ○ ○ ○ ○ ○ ○ ○ ○ ○ ○ ○ ○ ○ ○
G R O W I N G X T O G E T H E R X O R X D R I F T I N G X A P A R T
W O R K I N G X P A R T N E R S H I P S X U S A41
0
1,000
2,000
3,000
4,000
5,000
6,000
7,000
8,000
Individual
* Estimate based on first 6 months of 1997
Business
1997*1996199519941993199219911990
Chart 13: Bankruptcy Filings Santa Clara County, 1990-1997
680
3,769
4,980
5,705
4,949 4,983 5,107
6,0356,234
838 8431119
970 831 746 735
Welfare Reform
While many of the obstacles facing Silicon Valley’s low income fami-
lies suggest a flaw in our region’s labor market, one may instead be
traceable to significant changes in Federal and state policy. The enact-
ment of the Personal Responsibility and Work Opportunity Reconcili-
ation Act of 1996, better known as welfare reform, coupled with the
state’s new CalWORKs welfare system, represents a radical, new re-
sponse to the problems facing low and poverty wage workers.
Included among the principles guiding both the Federal and state mea-
sures are the following:
“...welfare reform, coupled with
the state’s new CalWORKs
welfare system, represents a
radical, new response to the
problems facing low and
poverty wage workers.

○ ○ ○ ○ ○ ○ ○ ○ ○ ○ ○ ○ ○ ○ ○ ○ ○ ○ ○ ○ ○ ○ ○ ○ ○ ○ ○ ○ ○ ○ ○ ○ ○ ○ ○ ○ ○ ○ ○ ○ ○ ○
G R O W I N G X T O G E T H E R X O R X D R I F T I N G X A P A R T
W O R K I N G X P A R T N E R S H I P S X U S A 42
• Stringent work requirements for welfare and food stamp recipients;
• Narrow time-limits on eligibility for welfare benefits, including a
new, five-year life time limit;
• An abolition of the principle of guaranteed public assistance to those
in need.
By replacing the principle of entitlement with an assumption that
government’s role should be limited to helping individuals into the
workforce, the success of both the Federal and state measures will de-
pend on our economy’s ability to provide an adequate supply of perma-
nent, good-quality jobs. However, even Santa Clara County, which cur-
rently boasts one of the state’s lowest unemployment rates, will be un-
able to accommodate the new job seekers who will enter the workforce
as a result of welfare reform. According to data collected by the Califor-
nia Budget Project, welfare reform will result in three times as many job
seekers in Santa Clara County as there will be available jobs.
Additionally, as noted elsewhere in this report, many of the jobs former
welfare recipients are likely to find will not allow them to earn an
adequate income. This problem is particularly acute for single parents
with children. Absent public assistance, nearly 40 percent of all jobs
“...welfare reform will result in
three times as many job seekers
in Santa Clara County as there
will be available jobs.”

○ ○ ○ ○ ○ ○ ○ ○ ○ ○ ○ ○ ○ ○ ○ ○ ○ ○ ○ ○ ○ ○ ○ ○ ○ ○ ○ ○ ○ ○ ○ ○ ○ ○ ○ ○ ○ ○ ○ ○ ○ ○
G R O W I N G X T O G E T H E R X O R X D R I F T I N G X A P A R T
W O R K I N G X P A R T N E R S H I P S X U S A43
in Silicon Valley pay too little to keep a single mother with one child
out of poverty.
The lack of Silicon Valley jobs providing adequate wages is under-
scored by the fact that many Santa Clara County welfare recipients
today routinely enter the workforce, only to be forced back on to wel-
fare rolls by low wages. For example, 45% of families receiving assis-
tance in Santa Clara County currently exceed the five-year life time
limit, though the median length of time recipients obtained benefits
was only 21 months.
Another key factor in the inability of welfare recipients to both enter
and remain in the workforce is the lack of critical support services
such as transportation and child care. However, both the Federal and
state welfare reform measures have failed to adequately address ei-
ther concerns. For example, while the availability of subsidized
childcare in Santa Clara County has dramatically improved over the
past decade, the new demand for subsidized childcare resulting from
welfare reform far outstrips the available supply. Though 12,000 sub-
sidized childcare “slots” exist today, the Community Coordinated Child
Development Council of Santa Clara County reports that almost 14,000
eligible children are still waiting for subsidized child care. More than
46,000 total children in Santa Clara County are on public assistance.
By requiring welfare recipients to work, while denying them adequate
wages and support services, welfare reform is far more likely to worsen
poverty in Silicon Valley than it is to alleviate it.
“Absent public assistance,
nearly 40% of all jobs in
Sil icon V alley pay too little
to keep a mother with
one child out of poverty.”

○ ○ ○ ○ ○ ○ ○ ○ ○ ○ ○ ○ ○ ○ ○ ○ ○ ○ ○ ○ ○ ○ ○ ○ ○ ○ ○ ○ ○ ○ ○ ○ ○ ○ ○ ○ ○ ○ ○ ○ ○ ○
G R O W I N G X T O G E T H E R X O R X D R I F T I N G X A P A R T
W O R K I N G X P A R T N E R S H I P S X U S A 44

○ ○ ○ ○ ○ ○ ○ ○ ○ ○ ○ ○ ○ ○ ○ ○ ○ ○ ○ ○ ○ ○ ○ ○ ○ ○ ○ ○ ○ ○ ○ ○ ○ ○ ○ ○ ○ ○ ○ ○ ○ ○
G R O W I N G X T O G E T H E R X O R X D R I F T I N G X A P A R T
W O R K I N G X P A R T N E R S H I P S X U S A45
0
$50,000
$100,000
$150,000
$200,000
$250,000
$300,000
$350,000
Source: Peninsula West Valley Association of Realtors
August 1997199619951994
Chart 14: Median Home Purchase PriceSanta Clara County, 1994-1997
$249,000 $255,000$270,000
$323,000
Current trends in employment and wages are only one measure of the
quality of life and long term well being of Silicon Valley’s residents.
Other measures include developments related to housing, education,
health and family life.
HOUSING AFFORDABILITY
Home Ownership
The scarcity of affordable housing has clearly become one of the most
significant challenges facing residents of Silicon Valley. The median
purchase price of a house in Santa Clara County in 1996 was $270,000.
This represents a 6% increase over the 1995 median purchase price of
$255,000. The median purchase price of a single-family house sold in
August 1997 was $323,000, an increase of approximately 20% over
the same month one year earlier.
“The scarcity of affordable
housing has clearly become
one of the most significant
challenges facing residents
of Silicon Valley.
V. Community and Society: Health, Education and Related Trends

○ ○ ○ ○ ○ ○ ○ ○ ○ ○ ○ ○ ○ ○ ○ ○ ○ ○ ○ ○ ○ ○ ○ ○ ○ ○ ○ ○ ○ ○ ○ ○ ○ ○ ○ ○ ○ ○ ○ ○ ○ ○
G R O W I N G X T O G E T H E R X O R X D R I F T I N G X A P A R T
W O R K I N G X P A R T N E R S H I P S X U S A 46
Rental Market
In light of the fact that seven out of ten residents cannot afford to
purchase a home in Santa Clara County, many are trapped in the area’s
rental housing market. Here, the lack of affordable housing is particu-
larly acute. The average monthly rent in Santa Clara County for all
apartments is $1,100. In the last four years the average rent for apart-
ments in Santa Clara County increased by 28%.
HEALTH ACCESS AND HEALTH CARE
Infant Mortality Rate
The infant mortality rate is an important, basic indicator of child health.
In 1995, Santa Clara County showed an overall decrease in infant
mortality rates to 5.2 deaths per 1,000 live births. However, the rate
“In the last four years the
average rent for apartments in
Santa Clara County increased
by 28%.”
800 $14.00
1993
$946 $935
$982
Average Monthly Rent
Average Hourly WageProduction Workers in Manufacturing
Source: RealFacts and the California Employment Development Department
$1,160
$1,208
$16.48$16.11 $16.10 $16.08
$16.76
1994 1995 1996 1997
$15.00
$16.00
$17.00
$18.00
$19.00
$20.00
$21.00
$22.00
900
1000
1100
1200
1300
Chart 15: Average Monthly Rentals and WagesSanta Clara County, 1993-1997 (1996 Dollars)

○ ○ ○ ○ ○ ○ ○ ○ ○ ○ ○ ○ ○ ○ ○ ○ ○ ○ ○ ○ ○ ○ ○ ○ ○ ○ ○ ○ ○ ○ ○ ○ ○ ○ ○ ○ ○ ○ ○ ○ ○ ○
G R O W I N G X T O G E T H E R X O R X D R I F T I N G X A P A R T
W O R K I N G X P A R T N E R S H I P S X U S A47
for African-Americans is still significantly higher. In 1993, the last year
reliable statistics were available, the infant mortality rates for African-
Americans in Santa Clara County was 20.6. per 1,000 live births.
Prenatal Care
The availability of prenatal care is a crucial measure for judging the
health of any community. While recent years have seen significant
improvements in access to prenatal care, many of Silicon Valley’s ex-
pectant mothers are still receiving inadequate care, or none at all. While
fewer than 10% of white and Japanese-American expectant mothers
lacked adequate prenatal care, 27.9% of Latino and 35.7% of Native
Americans went without the care they needed.
“...many of Silicon Valley’s
expectant mothers are still
receiving inadequate care, or
none at all. “

○ ○ ○ ○ ○ ○ ○ ○ ○ ○ ○ ○ ○ ○ ○ ○ ○ ○ ○ ○ ○ ○ ○ ○ ○ ○ ○ ○ ○ ○ ○ ○ ○ ○ ○ ○ ○ ○ ○ ○ ○ ○
G R O W I N G X T O G E T H E R X O R X D R I F T I N G X A P A R T
W O R K I N G X P A R T N E R S H I P S X U S A 48
The lack of prenatal care is a principal factor in babies being born with a
low birth weight. In Santa Clara County in 1995, 6% of babies were born
with a low birth weight, up from 5.7% in 1994 and 5.3% in 1993.
Teen Birth Rate
Rising teen birth rates play a role in a host of social problems. Compara-
tively, Santa Clara County’s teen birth rate for females ages 15-19 (49.3 per
1,000) is significantly lower than the rate for California as a whole (64.4 per
1,000). However, these rates vary by race and ethnicity. Latino teens, for
example, had a birth rate of 113.7 per 1,000 in 1995. The fact that nearly one
of every eight Latinas has children by the age of 19 is a contributing factor
to the high dropout rate among Latino students in Silicon Valley schools.
“Rising teen birth rates play a
role in a host of social
problems.”
0 1.0% 2.0% 3.0% 4.0% 5.0% 6.0%
Chart 17:High SchoolDrop-Out Rates
Santa ClaraCounty
California
Source: California Dept. of Education
1991-92
1992-93
1993-94
1994-95
1995-96

○ ○ ○ ○ ○ ○ ○ ○ ○ ○ ○ ○ ○ ○ ○ ○ ○ ○ ○ ○ ○ ○ ○ ○ ○ ○ ○ ○ ○ ○ ○ ○ ○ ○ ○ ○ ○ ○ ○ ○ ○ ○
G R O W I N G X T O G E T H E R X O R X D R I F T I N G X A P A R T
W O R K I N G X P A R T N E R S H I P S X U S A49
0
5
10
15
20
25
30
LatinoAsian/OtherWhite
Per
cent
24.7
12.4
7.1
Chart 16: Prevalence of people Reporting No Health Care Coverage, Santa Clara County, 1997
Health Care Coverage
Access to affordable, quality health care coverage remains one of the
key determinants of any family’s health care status. Unfortunately, until
1997, relevant data has not been systematically collected at a county
level. However, a new data collection process, the Behavioral Risk Fac-
tor Survey, has determined that Santa Clara County residents enjoy a
significantly higher level of health care coverage than Californians as a
whole. Only 13.6% of local survey participants aged 18-to-64 lacked
health care coverage compared to 23% for the state as a whole. The
extent of coverage varies widely by race, however. While 7.1% of Santa
Clara County’s white residents reported no health coverage, almost one
of every four Latinos reported having no health coverage.
“...almost one of every four
Latinos reported having no
health coverage.”
○ ○ ○ ○ ○ ○ ○ ○ ○ ○ ○ ○ ○ ○ ○ ○ ○ ○ ○ ○ ○ ○ ○ ○ ○ ○ ○ ○ ○ ○ ○ ○ ○ ○ ○ ○ ○ ○ ○ ○ ○ ○
G R O W I N G X T O G E T H E R X O R X D R I F T I N G X A P A R T
W O R K I N G X P A R T N E R S H I P S X U S A 50
Source: California Dept. of Education
0
1.0%
2.0%
3.0%
4.0%
5.0%
6.0%
California
Santa Clara County
1995-961994-951993-941992-931991-92
Chart 17: High School Drop-Out Rates
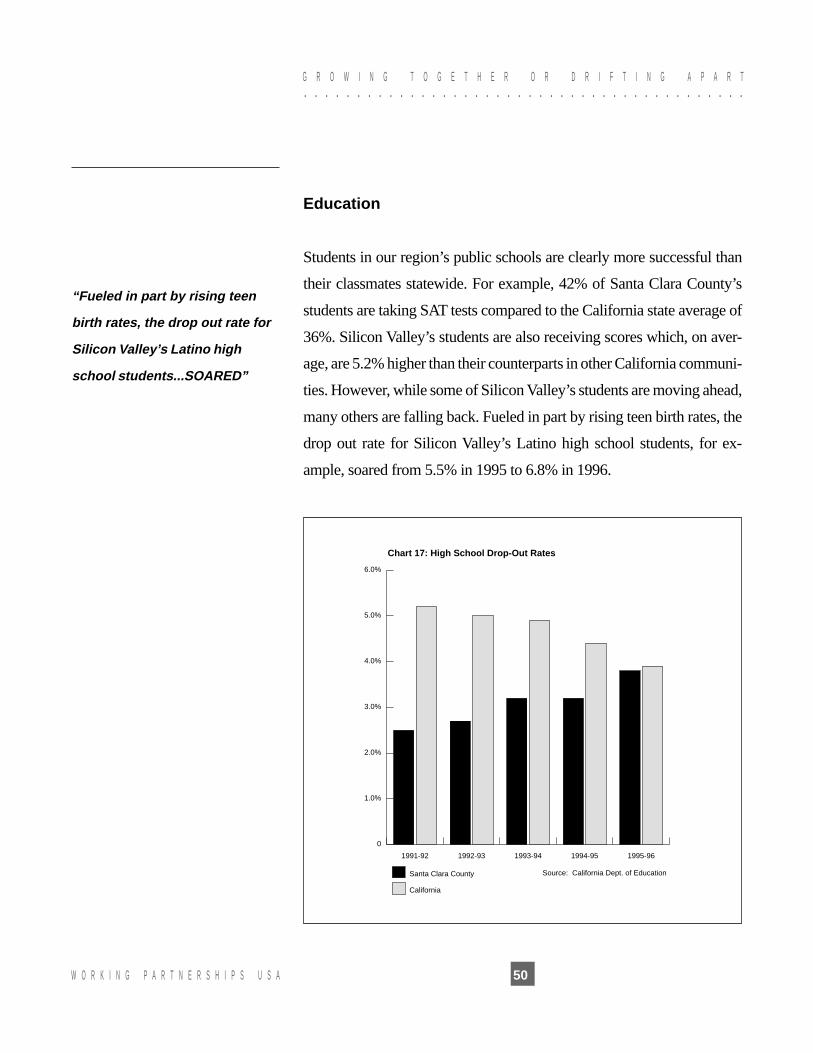
Education
Students in our region’s public schools are clearly more successful than
their classmates statewide. For example, 42% of Santa Clara County’s
students are taking SAT tests compared to the California state average of
36%. Silicon Valley’s students are also receiving scores which, on aver-
age, are 5.2% higher than their counterparts in other California communi-
ties. However, while some of Silicon Valley’s students are moving ahead,
many others are falling back. Fueled in part by rising teen birth rates, the
drop out rate for Silicon Valley’s Latino high school students, for ex-
ample, soared from 5.5% in 1995 to 6.8% in 1996.
“Fueled in part by rising teen
birth rates, the drop out rate for
Silicon Valley’s Latino high
school students...SOARED”

○ ○ ○ ○ ○ ○ ○ ○ ○ ○ ○ ○ ○ ○ ○ ○ ○ ○ ○ ○ ○ ○ ○ ○ ○ ○ ○ ○ ○ ○ ○ ○ ○ ○ ○ ○ ○ ○ ○ ○ ○ ○
G R O W I N G X T O G E T H E R X O R X D R I F T I N G X A P A R T
W O R K I N G X P A R T N E R S H I P S X U S A51
Chart 18: High School Drop-Out Rates by Ethnic Group
0
1
2
3
4
5
6
7
8
1996
1995
1994
1993
1992
WhiteAsianFilipinoCounty Average
Pacific Islander
BlackNative American
Latino
Source: California Department of Educ.
Family Stresses
In recent years, an increasing number of policy makers have come to
understand that the quality of family life is a vital component to the
well-being of communities. In this regard we found developments
which were encouraging, but others which cause concern. According
to Santa Clara County’s Department of Family & Children’s Services,
reported cases of child abuse and neglect, a key indicator of family
instability, were down. In 1996-97, 22,700 cases of child abuse and
“...quality of family life is a vital
component to the well-being of
communities.”

○ ○ ○ ○ ○ ○ ○ ○ ○ ○ ○ ○ ○ ○ ○ ○ ○ ○ ○ ○ ○ ○ ○ ○ ○ ○ ○ ○ ○ ○ ○ ○ ○ ○ ○ ○ ○ ○ ○ ○ ○ ○
G R O W I N G X T O G E T H E R X O R X D R I F T I N G X A P A R T
W O R K I N G X P A R T N E R S H I P S X U S A 52
neglect were reported compared to 23,850 in 1995-96. During the reces-
sion years of 1991-1993, child abuse and neglect reached a recent
high of more than 26,000 reported cases. It should be noted, though,
that despite the recent decline, the current level of child abuse and
neglect is significantly higher than the 19,000 cases reported in
1986-87.
Source: Santa Clara County Social Services Agency, Department of Family & Children's Services
Chart 19: Child Abuse and Neglect Referrals Received, 1986-997
0
5,000
10,000
15,000
20,000
25,000
30,000
Caretaker absence or incapacity
Exploitation
Emotional Abuse
General Neglect
Severe Neglect
Physical Abuse
Sexual Abuse
1996-971995-961994-951993-941992-931991-921990-911989-901988-891987-881986-87

○ ○ ○ ○ ○ ○ ○ ○ ○ ○ ○ ○ ○ ○ ○ ○ ○ ○ ○ ○ ○ ○ ○ ○ ○ ○ ○ ○ ○ ○ ○ ○ ○ ○ ○ ○ ○ ○ ○ ○ ○ ○
G R O W I N G X T O G E T H E R X O R X D R I F T I N G X A P A R T
W O R K I N G X P A R T N E R S H I P S X U S A53
However, while child abuse and neglect rates are dropping, juvenile
felony arrest rates have increased dramatically. In 1989, the juvenile
felony arrest rate was 1,820 per 100,000 people. By 1995, it has risen
to 2,549. Since the 1980’s, the number of arrests for violent crimes
have climbed from fewer than 150 per 100,000 people in 1985, to 622
in 1995.
“...while child abuse and
neglect rates are dropping,
juvenile felony arrest rates
have increased dramatically.”
0
100
200
300
400
500
600
700
800
19951994199319921989
Chart 20: Juvenile Violent Arrest Rate
Source: Santa Clara County Children's Report Card
268
514 499
627 622

○ ○ ○ ○ ○ ○ ○ ○ ○ ○ ○ ○ ○ ○ ○ ○ ○ ○ ○ ○ ○ ○ ○ ○ ○ ○ ○ ○ ○ ○ ○ ○ ○ ○ ○ ○ ○ ○ ○ ○ ○ ○
G R O W I N G X T O G E T H E R X O R X D R I F T I N G X A P A R T
W O R K I N G X P A R T N E R S H I P S X U S A 54

○ ○ ○ ○ ○ ○ ○ ○ ○ ○ ○ ○ ○ ○ ○ ○ ○ ○ ○ ○ ○ ○ ○ ○ ○ ○ ○ ○ ○ ○ ○ ○ ○ ○ ○ ○ ○ ○ ○ ○ ○ ○
G R O W I N G X T O G E T H E R X O R X D R I F T I N G X A P A R T
W O R K I N G X P A R T N E R S H I P S X U S A55
VI. Civic Life: Public Institutions and Involvement
An essential element of quality community life is the presence of strong
and vital public institutions. One important measure of this is the abil-
ity of local government to provide adequate public services to its resi-
dents. In recent years, policy makers and other opinion leaders through-
out urban America have debated the role of government in the deliv-
ery of public services. While some have advocated the privatization
of various services, others point out that the public sector remains the
only avenue for providing services efficiently and fairly on a commu-
nity basis. Faced with severe restrictions on its ability to generate rev-
enue, Silicon Valley government has gradually withdrawn from pro-
viding a range of services. Furthermore, the private sector has failed
to fill the vacuum this has created.
Local Government Revenues and Expenditures
As a whole, government in California is far smaller today than it was
20 years ago. In fact, according to the California Budget Project, while
California was the sixth highest tax state in 1976-77, by 1992-93, it
ranked 27th. The decline in revenue generation is particularly signifi-
cant at the local level. During roughly the same period, per capita
revenue for California cities declined from $1,138 to $981. Similarly,
per capita revenue for the state’s counties declined from $907 to $812.
The driving force behind the reduction in city and county revenues
was the passage of Proposition 13 in 1978. As a result of the property
tax reductions mandated by Proposition 13, California, which once
had the fourth highest per capita property tax revenues in the U.S.,
now has the 34th. In addition, the decline in Federal assistance to
“An essential element of
quality community life is the
presence of strong and vital
public institutions.”

○ ○ ○ ○ ○ ○ ○ ○ ○ ○ ○ ○ ○ ○ ○ ○ ○ ○ ○ ○ ○ ○ ○ ○ ○ ○ ○ ○ ○ ○ ○ ○ ○ ○ ○ ○ ○ ○ ○ ○ ○ ○
G R O W I N G X T O G E T H E R X O R X D R I F T I N G X A P A R T
W O R K I N G X P A R T N E R S H I P S X U S A 56
local government, particularly to cities, has also had a significant im-
pact. Between 1977-78 and 1994-95 revenue for the County of Santa
Clara declined from $788 per person to $734. Per capita revenues for
the City of San Jose have also declined, dropping from $780 per per-
son in 1977-78 to $776 per person in 1994-95. However, these reduc-
tions would have been far more severe had area lawmakers not moved
to increase various taxes and fees to compensate for Proposition 13
and the decline in Federal support.
A More Regressive Tax Structure and Reduced Services
Faced with declining revenues, municipal government opted to in-
crease what fees and taxes they could while reducing services. How-
ever, the costs of their choices fell disproportionately on Silicon Valley’s
middle and low income families. The highly regressive sales tax has
now become the single largest revenue source for the City of San Jose,
accounting for nearly 12% of the city’s budget. City officials have
also increased various fees and service charges. For example, sewer
charges, which were $57 in 1977-78 had increased to $114 per person
by 1994-95. County government, which has relatively little authority
to raise revenue on its own, has had more difficulty compensating for
lost revenue. Despite transfers from the State government, total per
capita revenue for the County of Santa Clara County is 20% lower
than the average for California counties.
Simultaneous with this increase in tax regressivity has been a reduc-
tion in the quality and availability of public services for Silicon Valley
residents. Though the County of Santa Clara has increased spending
“Faced with declining revenues,
municipal government opted to
increase what fees and taxes
they could while reducing
services... the costs of their
choices fell disproportionately
on Silicon Valley’s middle and
low income families.”

○ ○ ○ ○ ○ ○ ○ ○ ○ ○ ○ ○ ○ ○ ○ ○ ○ ○ ○ ○ ○ ○ ○ ○ ○ ○ ○ ○ ○ ○ ○ ○ ○ ○ ○ ○ ○ ○ ○ ○ ○ ○
G R O W I N G X T O G E T H E R X O R X D R I F T I N G X A P A R T
W O R K I N G X P A R T N E R S H I P S X U S A57
on law enforcement and corrections from $165 per capita in 1977-78
to $228 in 1994-95, it has reduced outlays in every other area. Despite
evidence of greater need, per capita expenditures for health care have
declined nearly 20% over the last 20 years.
At the municipal level the story is much the same. Per capita spending
by the City of San Jose on parks and recreation has been cut in half,
from $91 in 1977-78 to $43 in 1994-95. Spending on libraries and
museums and on streets and traffic has also been reduced.
“Despite evidence of greater
need, per capita expenditures for
health care have declined nearly
20% over the last 20 years.”
0
$100
$51.27
$788.45
$30.45
$196.35
$207.45
$7.21$16.17
$279.56
$65.90
$734.02
$51.33
$181.27
$311.65
$4.44$1.78
$117.65
$200
$300
$400
$500
$600
$700
$800
Other Revenue
Charge for Services
Federal And Other Transfers
State Transfers
Source: California Office of the Controller
1996
Dol
lars
Other Taxes
Sales and Use Taxes
Property Taxes
1994-951977-78
Chart 21: Per Capita Revenue, Santa Clara Valley, 1977-78 and 1994-95
County

○ ○ ○ ○ ○ ○ ○ ○ ○ ○ ○ ○ ○ ○ ○ ○ ○ ○ ○ ○ ○ ○ ○ ○ ○ ○ ○ ○ ○ ○ ○ ○ ○ ○ ○ ○ ○ ○ ○ ○ ○ ○
G R O W I N G X T O G E T H E R X O R X D R I F T I N G X A P A R T
W O R K I N G X P A R T N E R S H I P S X U S A 58
0
$100
$200
$300
$400
$500
$600
$700
$800
1996
Dol
lars
Source: California Office of the Controller
1994-951977-78
Chart 22: Per Capita Expenditures, Santa Clara Valley, 1977-78 and 1994-95
Debt Service
Public Assistance
Health/Sanitation
Public Protection
General Function
$84.78
$228.08
$127.47
$268.45
$43.61
$752.39
$799.68
$143.69
$164.70
$158.42
$302.11
$30.77
County

○ ○ ○ ○ ○ ○ ○ ○ ○ ○ ○ ○ ○ ○ ○ ○ ○ ○ ○ ○ ○ ○ ○ ○ ○ ○ ○ ○ ○ ○ ○ ○ ○ ○ ○ ○ ○ ○ ○ ○ ○ ○
G R O W I N G X T O G E T H E R X O R X D R I F T I N G X A P A R T
W O R K I N G X P A R T N E R S H I P S X U S A59
“Spending on libraries and
museums and on streets and
traffic has also been reduced.”
$71.73
$779.77
$21.41
$56.77
$174.66
$92.96
$129.80
$107.11
$125.33
$105.70
$776.25
$114.28
$131.76
$20.13
$71.67
$61.55
$101.18
$169.99
Chart 23: Per Capita Revenue, San Jose, 1977-78 and 1994-95
Source: California Office of the Controller
0
$100
$200
$300
$400
$500
$600
$700
$800
Other Revenue
Other Service Charges
Sewer Revenue
Federal & Other Transfers
State Transfers
Other Taxes
Sales Taxes
Property Taxes
1994-951977-78
Chart 24: Per Capita Expenditure, San Jose, 1977-78 and 1994-95
Source: California Office of the Controller
0
$100
$200
$300
$400
$500
$600
$700
$800
Airport
Sewers
Libraries/Museums
Parks and Recreation
Streets
Fire
Police
Other
Solid Waste Collection
Water Utility
Housing
Redevelopment
General Expenses
1994-951977-78
$186.81
$78.00$12.12$24.85$35.06
$67.60
$58.79
$148.51
$76.80
$85.86
$42.56$20.45
$97.47
$68.50
$816.57
$2.20$46.04
$145.85
$71.67
$89.91
$90.60
$104.20
$760.82
$23.54
○ ○ ○ ○ ○ ○ ○ ○ ○ ○ ○ ○ ○ ○ ○ ○ ○ ○ ○ ○ ○ ○ ○ ○ ○ ○ ○ ○ ○ ○ ○ ○ ○ ○ ○ ○ ○ ○ ○ ○ ○ ○
G R O W I N G X T O G E T H E R X O R X D R I F T I N G X A P A R T
W O R K I N G X P A R T N E R S H I P S X U S A 60
Taxes and Community Development in Silicon Valley
No less significant than the effect declining revenues have had
on Silicon Valley’s residents in the recent past, is the impact they
could have on our region’s future. While the effect of service cuts
on the immediate well-being of area families has long been evi-
dent, the new prominence of the sales tax poses a different risk.
With the growing reliance on the sales tax by the City of San Jose
and other municipalities, there is the threat that public officials
will promote sales tax generating enterprises, such as auto malls
and “Big Box” retail outlets, over ventures which may generate
more jobs of higher quality, pose fewer environmental hazards,
or respond to other community needs. For example, although Sili-
con Valley is in dire need of affordable housing, local officials
are acutely aware that new housing creates demand for new ser-
vices while generating comparatively little tax revenue. (See Chart
25)
“With the growing reliance on
the sales tax...there is the
threat that public officials will
promote sales tax generating
enterprises, ... over ventures
which may generate more jobs
of higher quality, pose fewer
environmental hazards, or
respond to other community
needs.”
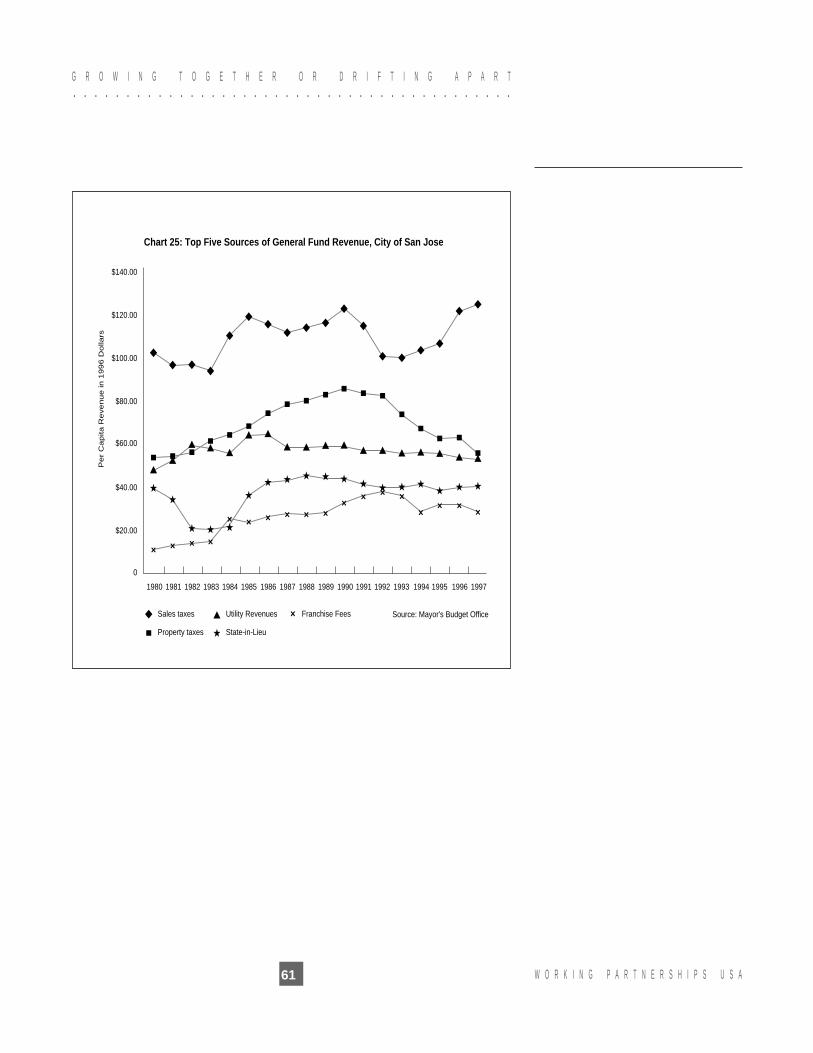
○ ○ ○ ○ ○ ○ ○ ○ ○ ○ ○ ○ ○ ○ ○ ○ ○ ○ ○ ○ ○ ○ ○ ○ ○ ○ ○ ○ ○ ○ ○ ○ ○ ○ ○ ○ ○ ○ ○ ○ ○ ○
G R O W I N G X T O G E T H E R X O R X D R I F T I N G X A P A R T
W O R K I N G X P A R T N E R S H I P S X U S A61
1980
0
$20.00
$40.00
$60.00
$80.00
$100.00
$120.00
$140.00
1981 1982 1983 1984 1985
Source: Mayor's Budget Office
Chart 25: Top Five Sources of General Fund Revenue, City of San Jose
Sales taxes
Property taxes
Utility Revenues
State-in-Lieu
Franchise Fees
1986 1987 1988 1989 1990 1991 1992 1993 1994 1995 1996 1997
Pe
r C
ap
ita
Re
ve
nu
e in
19
96
Do
llars
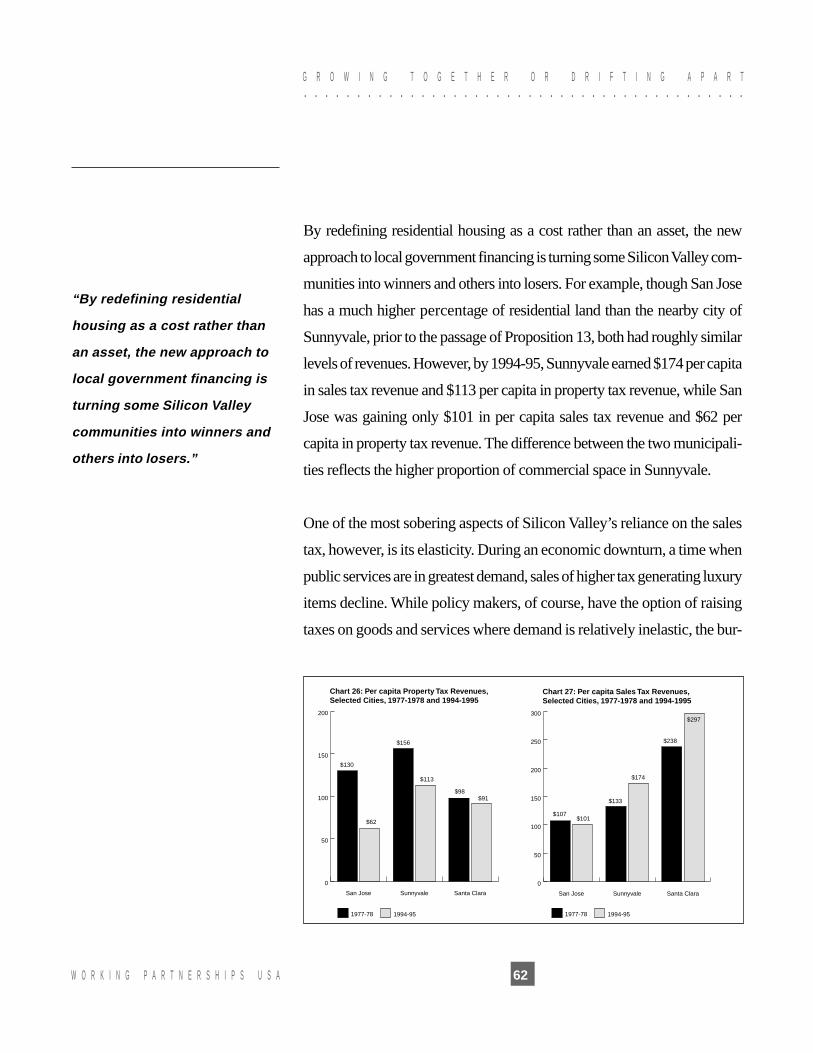
○ ○ ○ ○ ○ ○ ○ ○ ○ ○ ○ ○ ○ ○ ○ ○ ○ ○ ○ ○ ○ ○ ○ ○ ○ ○ ○ ○ ○ ○ ○ ○ ○ ○ ○ ○ ○ ○ ○ ○ ○ ○
G R O W I N G X T O G E T H E R X O R X D R I F T I N G X A P A R T
W O R K I N G X P A R T N E R S H I P S X U S A 62
By redefining residential housing as a cost rather than an asset, the new
approach to local government financing is turning some Silicon Valley com-
munities into winners and others into losers. For example, though San Jose
has a much higher percentage of residential land than the nearby city of
Sunnyvale, prior to the passage of Proposition 13, both had roughly similar
levels of revenues. However, by 1994-95, Sunnyvale earned $174 per capita
in sales tax revenue and $113 per capita in property tax revenue, while San
Jose was gaining only $101 in per capita sales tax revenue and $62 per
capita in property tax revenue. The difference between the two municipali-
ties reflects the higher proportion of commercial space in Sunnyvale.
One of the most sobering aspects of Silicon Valley’s reliance on the sales
tax, however, is its elasticity. During an economic downturn, a time when
public services are in greatest demand, sales of higher tax generating luxury
items decline. While policy makers, of course, have the option of raising
taxes on goods and services where demand is relatively inelastic, the bur-
“By redefining residential
housing as a cost rather than
an asset, the new approach to
local government financing is
turning some Silicon Valley
communities into winners and
others into losers.”
0
50
100
150
200
250
300
Santa ClaraSunnyvaleSan Jose
Chart 27: Per capita Sales Tax Revenues,Selected Cities, 1977-1978 and 1994-1995
0
50
100
150
200
1994-951977-78 1994-951977-78
Santa ClaraSunnyvaleSan Jose
$130
$107$101
$133
$174
$238
$297
$62
$156
$113
$98$91
Chart 26: Per capita Property Tax Revenues,Selected Cities, 1977-1978 and 1994-1995

○ ○ ○ ○ ○ ○ ○ ○ ○ ○ ○ ○ ○ ○ ○ ○ ○ ○ ○ ○ ○ ○ ○ ○ ○ ○ ○ ○ ○ ○ ○ ○ ○ ○ ○ ○ ○ ○ ○ ○ ○ ○
G R O W I N G X T O G E T H E R X O R X D R I F T I N G X A P A R T
W O R K I N G X P A R T N E R S H I P S X U S A63
den will fall inequitably on middle and lower income consumers.
This generation of Americans, more than any in recent memory,
understands the intimate relationship between environmental quality
and public health. As a community, Silicon Valley has long prided
itself for its environmental ethic. And, compared to much of urban
America, that pride is well justified. However, our community also
faces a range of challenges which, if left unaddressed, will seri-
ously undermine the quality of the environment and the health of
area residents.
Environmental Costs of High Tech
At the time the electronics industry was created, many believed it
posed few environmental hazards. However, over the past 15 years,
science has recognized a series of environmental costs of the elec-
tronics industry. For example, the production of every six-inch sili-
con wafer requires the use of 22 cubic feet of hazardous gases and
produces 25 pounds of sodium hydroxide, 2,840 gallons of waste
water, and seven pounds of miscellaneous hazardous wastes.
Prior to more stringent controls, many area companies improp-
erly stored toxic waste material. As a result, Santa Clara County
has more Superfund toxic cleanup sites than any other county
in the U.S.
VII. Environmental Quality and Public Health Indicators of Sustainability
“Santa Clara County has
more Superfund toxic
cleanup sites than any
other county in the U.S.”

○ ○ ○ ○ ○ ○ ○ ○ ○ ○ ○ ○ ○ ○ ○ ○ ○ ○ ○ ○ ○ ○ ○ ○ ○ ○ ○ ○ ○ ○ ○ ○ ○ ○ ○ ○ ○ ○ ○ ○ ○ ○
G R O W I N G X T O G E T H E R X O R X D R I F T I N G X A P A R T
W O R K I N G X P A R T N E R S H I P S X U S A 64

○ ○ ○ ○ ○ ○ ○ ○ ○ ○ ○ ○ ○ ○ ○ ○ ○ ○ ○ ○ ○ ○ ○ ○ ○ ○ ○ ○ ○ ○ ○ ○ ○ ○ ○ ○ ○ ○ ○ ○ ○ ○
G R O W I N G X T O G E T H E R X O R X D R I F T I N G X A P A R T
W O R K I N G X P A R T N E R S H I P S X U S A65
Workplace Health and Safety
The electronics industry is a light manufacturing industry, and as
such causes fewer overall injuries than heavier manufacturing in-
dustries. Occupational illnesses, however, occur at a higher rate
among electronics workers, and particularly workers in the semi-
conductor industry.
This is clear from studies that have looked at occupational illnesses
severe enough to result in time lost from work. In 1995, the aver-
age in all manufacturing industries for work loss due to occupa-
tional illness was 6.2% of all reported reasons for workloss. The
electronics industry as a whole produced a much higher prevalence
of occupational illness cases, with 9.7%. The semi-conductors
industry had the highest rate of occupational illness in 1995, with
12.8%, up from 10.9% in 1994.
Similar studies looking at all reported illness and injuries, includ-
ing the larger number of cases that don’t result in loss of work,
show an even stronger trend. Here, the manufacturing industry
average is 14.3%, electronics industry 20.5%, and the semicon-
ductor industry 30.2% in 1995, with significant increases in the
1992-1995 period.
The rapidly increasing pace of technological change in semicon-
ductor manufacturing places workers in increased danger. In the
1980’s, a typical schedule of a new technology, from research and
development to pilot lines to full manufacturing was 6-8 years.
“The semi-conductor industry
had the highest rate of
occupational illness in 1995”

○ ○ ○ ○ ○ ○ ○ ○ ○ ○ ○ ○ ○ ○ ○ ○ ○ ○ ○ ○ ○ ○ ○ ○ ○ ○ ○ ○ ○ ○ ○ ○ ○ ○ ○ ○ ○ ○ ○ ○ ○ ○
G R O W I N G X T O G E T H E R X O R X D R I F T I N G X A P A R T
W O R K I N G X P A R T N E R S H I P S X U S A 66
Now, these efforts are being compressed into a 2-3 year time frame.
Any large semiconductor facility uses several thousand chemicals,
and the opportunities for health professionals to evaluate new or un-
usual health hazards are being diminished by the quickening pace of
technological change.
Occupational illnesses as a% of all reported illness and injury include
the larger number of non-workloss cases. Here, the 1995 manufactur-
ing industry average is 14.3% of all workers, the electronics industry
rate is 20.5%, and the rate for the semiconductors industry is 30.2%,
with significant increases between 1992 and 1995.
“...opportunities for health
professionals to evaluate new or
unusual health hazards are
being diminished by the
quickening pace of
technological change.”

○ ○ ○ ○ ○ ○ ○ ○ ○ ○ ○ ○ ○ ○ ○ ○ ○ ○ ○ ○ ○ ○ ○ ○ ○ ○ ○ ○ ○ ○ ○ ○ ○ ○ ○ ○ ○ ○ ○ ○ ○ ○
G R O W I N G X T O G E T H E R X O R X D R I F T I N G X A P A R T
W O R K I N G X P A R T N E R S H I P S X U S A67
Energy Use
Energy use is a key measure of environmental sustainability. The use
of non-renewable fossil fuels depletes the environment and undermines
Silicon Valley’s long-term economic viability. Over the course of the
past decade, the use of renewable resources in the production of elec-
tricity by Pacific Gas & Electric has significantly declined.
“Over the course of the past
decade, the use of renewable
resources in the production of
electricity by Pacific Gas &
Electric has significantly
declined.”
Net PG&E Renewable
32%
Net PG&E Renewable
13%
Natural Gas52%
Natural Gas48%
Oil1%
Oil3%
Geothermal15%
Geothermal10%
Nuclear 0%Nuclear
26%Combustion Turbine 0%
Combustion Turbine 0%
Chart 28: Net PG&E System Sources of Energy 1984

○ ○ ○ ○ ○ ○ ○ ○ ○ ○ ○ ○ ○ ○ ○ ○ ○ ○ ○ ○ ○ ○ ○ ○ ○ ○ ○ ○ ○ ○ ○ ○ ○ ○ ○ ○ ○ ○ ○ ○ ○ ○
G R O W I N G X T O G E T H E R X O R X D R I F T I N G X A P A R T
W O R K I N G X P A R T N E R S H I P S X U S A 68
Transportation
Silicon Valley’s transportation infrastructure is being stretched be-
yond the breaking point. Heavy traffic jams and long delays have
become commonplace on area freeways. In 1996, for example, ve-
hicle delays on freeways in Santa Clara County increased to their
highest level in eight years. The hours lost due to delays in traffic
soared from 13,000 in 1995 to 20,000 in 1996.
0
5000
10000
15000
20000
25000
Miles of Congestion Per Year
Daily Vehicle Hours of Delay Source: Caltrans Highway Operations Branch
1996199519941993199219911990
Veh
icle
Hou
rs o
f Del
ay
Chart 29: Santa Clara County Traffic Congestion
13300
10400
13100 12800
8800
13000
20500
55 50 60 51 41 61 70
“The hours lost due to delays in
traffic soared from 13,000 in
1995 to 20,000 in 1996.”

○ ○ ○ ○ ○ ○ ○ ○ ○ ○ ○ ○ ○ ○ ○ ○ ○ ○ ○ ○ ○ ○ ○ ○ ○ ○ ○ ○ ○ ○ ○ ○ ○ ○ ○ ○ ○ ○ ○ ○ ○ ○
G R O W I N G X T O G E T H E R X O R X D R I F T I N G X A P A R T
W O R K I N G X P A R T N E R S H I P S X U S A69
Driving to work alone remains the dominant mode of transportation
for area commuters. Trends charted through 1995 showed a gradual
improvement in the number of motorists using car pools or opting to
use public transportation. However, in 1996 the percentage of people
driving alone showed an increase.
0.0
20%
40%
60%
80%
100%
Others
Transit
Carpool
Drive Alone
19961995199419931990
Chart 30: Commute Modes in Santa Clara County
Source: RIDES For Bay Area Commuters--Check with Linda Bagneschi
“Driving to work alone remains
the dominant mode of
transportation for area
commuters.”
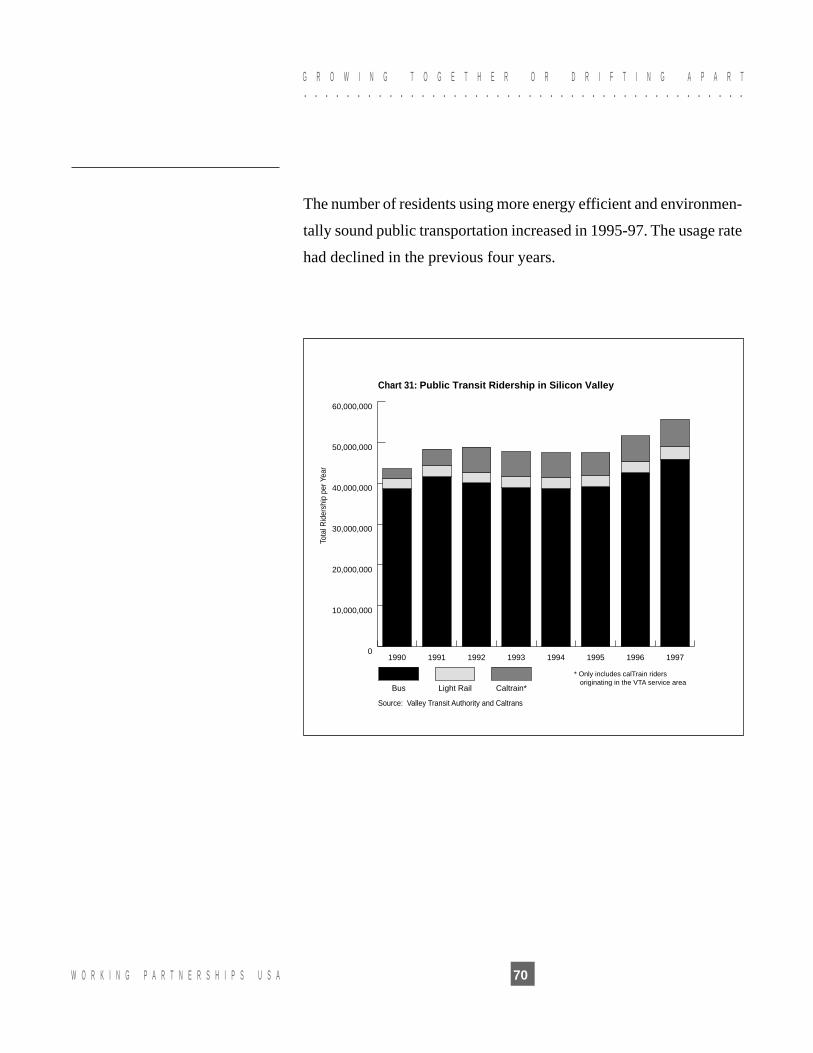
○ ○ ○ ○ ○ ○ ○ ○ ○ ○ ○ ○ ○ ○ ○ ○ ○ ○ ○ ○ ○ ○ ○ ○ ○ ○ ○ ○ ○ ○ ○ ○ ○ ○ ○ ○ ○ ○ ○ ○ ○ ○
G R O W I N G X T O G E T H E R X O R X D R I F T I N G X A P A R T
W O R K I N G X P A R T N E R S H I P S X U S A 70
The number of residents using more energy efficient and environmen-
tally sound public transportation increased in 1995-97. The usage rate
had declined in the previous four years.
0
10,000,000
20,000,000
30,000,000
40,000,000
50,000,000
60,000,000
Light Rail Caltrain*
* Only includes calTrain riders originating in the VTA service area
Bus
19971996199519941993199219911990
Chart 31: Public Transit Ridership in Silicon Valley
Source: Valley Transit Authority and Caltrans
Tota
l Rid
ersh
ip p
er Y
ear

○ ○ ○ ○ ○ ○ ○ ○ ○ ○ ○ ○ ○ ○ ○ ○ ○ ○ ○ ○ ○ ○ ○ ○ ○ ○ ○ ○ ○ ○ ○ ○ ○ ○ ○ ○ ○ ○ ○ ○ ○ ○
G R O W I N G X T O G E T H E R X O R X D R I F T I N G X A P A R T
W O R K I N G X P A R T N E R S H I P S X U S A71
By examining a series of key indicators we have reached several conclu-
sions about the economic and social well-being of Silicon Valley:
• Despite the fact that our region’s information technol-
ogy industry is highly competitive, the economic secu-
rity of the majority of Silicon Valley’s workforce is con-
tinuing to decline.
• While Silicon Valley’s private sector is flourishing, our
public institutions have grown weaker. In turn, this weak-
ness has contributed to a gradual decline in the quality
and availability of adequate housing, education and
health care services throughout our region.
• Though Silicon Valley’s concentration of high-tech firms
has positioned our community to be a global center of
the new economy, it has also generated environmental
and public health hazards not unlike those of the old
economy.
Faced with these challenges, traditional policy makers might suggest an ex-
panded role for government. In fact, several problems identified in this report
— particularly those related to health, education and transportation — do
require a public sector response. Additionally, as evidenced by the 1995 Santa
Clara County Board of Supervisors decision linking business tax incentives
to the creation of quality jobs, local government can address widening in-
come inequality and the growth of the contingent workforce.
VIII. A Working Partnership to Shape the New Economy

○ ○ ○ ○ ○ ○ ○ ○ ○ ○ ○ ○ ○ ○ ○ ○ ○ ○ ○ ○ ○ ○ ○ ○ ○ ○ ○ ○ ○ ○ ○ ○ ○ ○ ○ ○ ○ ○ ○ ○ ○ ○
G R O W I N G X T O G E T H E R X O R X D R I F T I N G X A P A R T
W O R K I N G X P A R T N E R S H I P S X U S A 72
However, while government can help fashion solutions, public sector interven-
tion should not be construed as a solution in and of itself. The evolution of two
Silicon Valleys — one comfortable and prosperous, the other struggling to get
by — is, in many respects, a problem well beyond the capacity of government
alone to respond. Instead, it requires a new role to be played between govern-
ment and other institutions: the formation of a new social compact of business,
labor, policy makers and community leaders to build a Silicon Valley where
employers and employees both move ahead, and where no family is left behind.
Working Partnerships USA
In 1995 Working Partnerships USA was formed in order to respond to the
growing rift between business competitiveness and community prosperity in
Silicon Valley. Founded by community leaders, Working Partnerships has
launched a series of initiatives to redefine community economic development.
In its first year, Working Partnerships led a community campaign in support of
the Santa Clara County measure linking tax assistance to businesses with job
creation. Later, it worked with San Jose officials to ban further development of
“Big Box” retailers within the city. The following year, Working Partnerships
released its study, “Shock Absorbers in the Flexible Economy,” which charted
the growth of contingent employment in Silicon Valley. The group also initi-
ated a vigorous program in conjunction with San Jose State University to train
grassroots leaders in issues related to economic development.
However, just as significant as its efforts to foster a public debate
about economic development has been, Working Partnerships’ program
to promote promising, new approaches to labor-management rela-
tions and employment policies in today’s workplace.
“The evolution of two Silicon
Valleys — one comfortable and
prosperous, the other
struggling to get by — is, in
many respects, a problem well
beyond the capacity of
government alone to respond.”

○ ○ ○ ○ ○ ○ ○ ○ ○ ○ ○ ○ ○ ○ ○ ○ ○ ○ ○ ○ ○ ○ ○ ○ ○ ○ ○ ○ ○ ○ ○ ○ ○ ○ ○ ○ ○ ○ ○ ○ ○ ○
G R O W I N G X T O G E T H E R X O R X D R I F T I N G X A P A R T
W O R K I N G X P A R T N E R S H I P S X U S A73
The Next Generation of Unions
Consistent with its mission of promoting both economic competitiveness and a
higher quality of life for area workers, Working Partnerships is encouraging the
creation of “high performance” work systems. These joint efforts, which bring
unions and employers together to improve both working conditions and prod-
uct design and delivery, can fundamentally transform labor-management rela-
tions. By promoting these new, collaborative, work systems, Working Partner-
ships is proving to be a catalyst for the “next generation” of unions: institutions
which in addition to offering employees a strong voice, also provide employ-
ers with an innovative partner.
For example in 1998, together with area community colleges and local unions,
Working Partnerships will launch a pilot project that will provide skills certifica-
tion, job rights training, and job placement for temporary workers seeking cleri-
cal jobs with employers throughout Silicon Valley. The organization will ad-
minister portable benefits and provide ongoing job referrals to participants. The
efforts of Working Partnerships will prove particularly valuable as Santa Clara
County struggles to help area welfare recipients make a successful transition
into the working world.
The Challenge Facing Business
Silicon Valley business must, of course, play a central role in shaping
any strategy to assure that our region’s prosperity is widely shared.
Playing that role first requires an authentic partnership with the
community built on shared goals, not private interests. Operating
as a “high-tech Chamber of Commerce,” the action agenda that
many leaders of Silicon Valley’s information technology industry
“an authentic partnership with
the community built on shared
goals, not private interests. “

○ ○ ○ ○ ○ ○ ○ ○ ○ ○ ○ ○ ○ ○ ○ ○ ○ ○ ○ ○ ○ ○ ○ ○ ○ ○ ○ ○ ○ ○ ○ ○ ○ ○ ○ ○ ○ ○ ○ ○ ○ ○
G R O W I N G X T O G E T H E R X O R X D R I F T I N G X A P A R T
W O R K I N G X P A R T N E R S H I P S X U S A 74
have described clearly addresses their most critical needs. For ex-
ample, recent interest from the business community in area schools
has been focused on concerns relating to a feared shortage of skilled
employees in the future. Addressing this concern must undoubt-
edly be part of any educational reform initiatives undertaken in the
Valley. However, focusing primarily on this concern will not ulti-
mately lead to the well-rounded public education that our children
need and deserve.
The Next Step: A Comprehensive Economic Blueprint
As this report notes, the growing disparity in wages and the quality
of life in Silicon Valley raises a series of fundamental questions about
jobs, and the roles government, business, labor and others can play
in our economic life. Those questions and others can be and should
be fully addressed. To this end, in the summer of 1997, Working
Partnerships launched a series of roundtable discussions to provide
for both an in-depth analysis of Silicon Valley’s economy, as well as
an assessment of the values and priorities which should guide eco-
nomic development throughout the region. These discussions have
so far involved over 300 area leaders and activists who have met to
discuss topics such as health care, jobs, education, housing and other
issues. Their continuing efforts will culminate in the preparation of a
Community Economic Blueprint for Silicon Valley. This process of-
fers an excellent opportunity to begin building a new consensus to
guarantee that everyone in our community truly grows together.
“This process offers an
excellent opportunity to begin
building a new consensus to
guarantee that everyone in our
community truly grows
together.”

○ ○ ○ ○ ○ ○ ○ ○ ○ ○ ○ ○ ○ ○ ○ ○ ○ ○ ○ ○ ○ ○ ○ ○ ○ ○ ○ ○ ○ ○ ○ ○ ○ ○ ○ ○ ○ ○ ○ ○ ○ ○
G R O W I N G X T O G E T H E R X O R X D R I F T I N G X A P A R T
W O R K I N G X P A R T N E R S H I P S X U S A75
IX. About Economic Policy Institute
The Economic Policy Institute was founded in 1986 to widen the debate
about policies to achieve healthy economic growth, prosperity, and oppor-
tunity in the difficult new era America has entered.
Today, America’s economy is threatened by slow growth and increasing in-
equality. Expanding global competition, changes in the nature of work, and
rapid technological advances are altering economic reality. Yet many of our
policies, attitudes, and institutions are based on assumptions that no longer
reflect real world conditions.
Central to the Economic Policy Institute’s search for solutions is the exploration
of policies that encourage every segment of the American economy (business,
labor, government, universities, voluntary organizations, etc.) to work coopera-
tively to raise productivity and living standards for all Americans. Such an
undertaking involves a challenge to conventional views of market behavior and
a revival of a cooperative relationship between the public and private sectors.
With the support of leaders from labor, business, and the foundation
world, the institute has sponsored research and public discussion on a
wide variety of topics: trade and fiscal policies; trends in wages, in-
comes, and prices; the causes of the productivity slowdown; labor-mar-
ket problems; rural and urban policies; inflation; state-level economic
development strategies; comparative international economic perfor-
mance; and studies of the overall health of the U.S. manufacturing sec-
tor and of specific key industries.
○ ○ ○ ○ ○ ○ ○ ○ ○ ○ ○ ○ ○ ○ ○ ○ ○ ○ ○ ○ ○ ○ ○ ○ ○ ○ ○ ○ ○ ○ ○ ○ ○ ○ ○ ○ ○ ○ ○ ○ ○ ○
G R O W I N G X T O G E T H E R X O R X D R I F T I N G X A P A R T
W O R K I N G X P A R T N E R S H I P S X U S A 76
The institute works with a growing network of innovative economists
and other social science researchers in universities and research centers
all over the country who are willing to go beyond the conventional wis-
dom in considering strategies for public policy.
Founding scholars of the Institute include Jeff Faux, EPI president; Lester
Thurow, Sloan School of Management, MIT; Ray Marshall, former U.S.
secretary of labor, professor at the LBJ School of Public Affairs, Univer-
sity of Texas; Barry Bluestone, University of Massachusetts-Boston; Robert
Reich, former U.S. secretary of labor; and Robert Kuttner, author, editor
of The American Prospect, and columnist for Business Week and the
Washington Post Writers Group. For additional information about the
Institute, contact EPI at 1660 L Street, NW, Suite 1200, Washington, DC
20036, (202) 775-8810, HTTP.www.EPINET.org

○ ○ ○ ○ ○ ○ ○ ○ ○ ○ ○ ○ ○ ○ ○ ○ ○ ○ ○ ○ ○ ○ ○ ○ ○ ○ ○ ○ ○ ○ ○ ○ ○ ○ ○ ○ ○ ○ ○ ○ ○ ○
G R O W I N G X T O G E T H E R X O R X D R I F T I N G X A P A R T
W O R K I N G X P A R T N E R S H I P S X U S A77
Silicon Valley includes all of Santa Clara County and significant parts of neighboring counties including Alameda, San Mateo and SantaCruz Counties. For analytical puposes, data has been collected from Santa Clara County as the largest geographic segment of Silicon Valley and akey indicator of trends in the region. Unless otherwise noted, adjustments for inflation are made using the CPI-U-X1 index. Budget figuresfor the City and County government are adjusted for inflation using the CPI for California for Fiscal Years from the California Departrmentof Finance.
Tables:
Table 1State of California, Department of Finance, Historical City/County Population Estimates, 1991-1997, with 1990 Census Counts.(Sacramento, California, May 1997)
Table 2Santa Clara County, Public Health Department Santa Clara County 1997 Health Status Report: A Platform for Action for the Year 2000(San Jose, CA) 1997
Table 3Employment figures for Santa Clara County are from the Labor Market Information Division of the California Economic DevelopmentDepartment.
Tables 4-6All industry employment figures are from ES-202 data from the California Economic Development Department, Labor Market InformationDivision. The industry categories for Table 4 are from 3-digit Standard Industrial Classification (SIC) Codes. For the industry clusteranalysis, the following SIC codes were used for each cluster:
Outsourcing Services 733-Mailing, reproduction, stenographic services734-Services to Buildings736-Personnel Supply Services738-Miscellaneous Business Services (60% is security services, 40% are services not elsewhere classified)
Professional Services 275-Commercial Printing279-Printing Trade Services731-Advertising Services732-Credit Reporting and Collection Services
Computer Equipment 3571-Electronic Computers3572-Electronic Storage Devices3575-Computer Terminals3577-Computer Peripheral Equipment, not elsewhere classified3661-Telephone and Telegraph Apparatus3663-Radio, TV Communications Equipment3695-Magnetic and Optical Recording Media
Printed Circuit BoardsAnd Components 3672-Printed Circuit Boards
3679-Electronic Components, not elsewhere classifiedSoftware 7371-Computer programming services
7372-Prepackaged software7373-Computer integrated systems design7374-Data processing and preparation7375-Information retrieval services
X. Data Sources

○ ○ ○ ○ ○ ○ ○ ○ ○ ○ ○ ○ ○ ○ ○ ○ ○ ○ ○ ○ ○ ○ ○ ○ ○ ○ ○ ○ ○ ○ ○ ○ ○ ○ ○ ○ ○ ○ ○ ○ ○ ○
G R O W I N G X T O G E T H E R X O R X D R I F T I N G X A P A R T
W O R K I N G X P A R T N E R S H I P S X U S A 78
Innovation Services 5045-Wholesale distribution of computers, peripherals, etc. 5065-Wholesale distribution of electronic parts and components 7376-Computer facilities management 7377-Computer rental and leasing 7378-Computer maintenance, repair 7379-Computer related services, not elsewhere classified 8711-Engineering services 873-Research and Testing Services
Semiconductors 3559-Special Industry Machinery, not elsewhere classified3674-Semiconductors and related devices3825-Instruments to measure electricity
Construction 15-19-Construction IndustryEating and Drinking Places 58-Eating and Drinking PlacesTravel, Tourism and Leisure 45-Transportation by Air
472-passenger Transport Arrangement701-704-Hotels, motels, rooming houses, camps.783-799-Theatres, video houses, amusement/recreation services
Non-Food Retail Sales 52-53, 55-57, 59-All retail sales except food stores and eating and drinking placesTransportation/Public Utilities 40-49-Transportation and Public Utilities.
Table 7California Economic Development Department, Labor Market Information Division Occupational Projections 1994-2001 (Sacramento,CA) 1997. Wage figures from EDD Survey of Occupational Wages.
Tables 8-9Data for these tables are compiled from each year’s 12 monthly Current Population Survey (CPS) Outgoing Rotation Group (ORG) files,typically referred to as the CPS Earnings Files, or the CPS ORG Files. The CPS is a monthly survey of 60,000 workers nationwideconducted by the Bureau of the Census. The CPS provides the source for official U.S. government statistics on employment, unemploy-ment, unionization, household income and employee earnings. Each month, questions on union status, weekly earnings, and hours workedper week are included in an earnings supplement. These questions are administered to a quarter sample of the CPS every month. Thesampling design of the CPS is such that households are interviewed for four months, followed by eight months out of the sample, followedby an additional four months in the sample. The out-going rotation groups comprise the quarter sample who are asked questions from theearnings supplement.
From this national sample, we included all households living in Santa Clara County. The total sample size for Santa Clara County rangefrom 908 households in 1979 to 447 in 1985, and rising to 603 in 1996. There is a slight anomaly in 1995. During 1995 the U.S. CensusBureau changed their system for sub-state geographic identifiers, and for four months (May-August) no sub-state geographic code isavailable for the CPS ORG files. Thus, the sample for 1995 includes only 238 people, and only includes the months of Jan-April and Sept-Dec. Thus figures for 1995 should be treated with some care.
In order to test the representativeness of the sample for Santa Clara County, we compared the gender and age characteristics for our samplein 1989, compared to the County population as reported in the 1990 census, and found no significant statistical difference.
Changes in annual or weekly earnings can result from changes in hourly earnings, or from more working time (either more hours per weekor weeks per year). Our analysis is centered around the hourly wage (exclusive of benefits) because we are interested in changing paylevels for the workforce, and to be able to clearly distinguish changes in earnings resulting from more or less work, rather than more or lesspay. In our view, the ORG files provide a better source of data for wage analysis than the traditionally used March CPS files. In order tocalculate hourly wages from the March CPS, analysis must make calculations using three retrospective variables; annual earnings, weeksworked, and usual weekly hours worked in the year prior to the survey. In contrast, respondents in the ORG are asked a set of questionsabout hours worked, weekly wages, and hourly wages in the week prior to the survey, providing for more reliable data than the March CPS.Furthermore, the sample size is much larger for the ORG files, an especially important point when making analyses at a sub-national level.

○ ○ ○ ○ ○ ○ ○ ○ ○ ○ ○ ○ ○ ○ ○ ○ ○ ○ ○ ○ ○ ○ ○ ○ ○ ○ ○ ○ ○ ○ ○ ○ ○ ○ ○ ○ ○ ○ ○ ○ ○ ○
G R O W I N G X T O G E T H E R X O R X D R I F T I N G X A P A R T
W O R K I N G X P A R T N E R S H I P S X U S A79
Table 10Data for Executive Pay is compiled by the San Jose Mercury News from annual company filings with the Securities Exchange Commis-sion, and published in their annual survey of “What the Boss Makes”. Data for production worker wages comes from the CaliforniaEconomic Development Departments Average Production Worker Wages. Annual income was calculated by multiplying the averagehourly wage by 2080 hours (52 weeks at 40 hours a week).
Table 11The Self-Sufficiency Standard was conceived and developed by Dr. Diana Pearce, Director of the Women and Poverty Project of WiderOpportunities for Women in Washington DC. It calculates the earnings necessary to meet basic needs without public subsidies (such aspublic housing, food stamps, Medicare or child care) or private or informal subsidies (such as free babysitting by a relative/friend, foodprovided by churches or local food banks, or housing shared with relatives or friends). The self-sufficiency standard accounts for regionalvariations in cost, and takes into account that may costs differ by family size and age of children. Thus, it represents a more comprehensiveand accurate picture of poverty levels than national official poverty thresholds, which do not take these factors into account.
Table 12Estimates developed by California Budget Project (916-444-0500) based on data from the Employment Development Department.
Table 13From Data published in Kids in Common (1997) 1997 Santa Clara County Children’s Report Card (408-882-0900).
Table 14-17Santa Clara County Public Health Department Santa Clara County 1997 Health Status Report: A Platform for Action for the Year 2000October 1997.
Table 18Mayor Susan Hammer’s Budget and Gang Policy Office. These are the Mayor’s estimates of expenditures and revenues related toresidential units.
Table 19Data collected by Silicon Valley Toxics Coalition (408-287-6707).
Tables 20-21Cited in: LaDou, Joseph and Timothy Rohm (1998) Occupational Hazards in the International Microelectronics Industry’s InternationalJournal of Occupational and Environmental Health Vol. 4, No. 1, 1998.
Charts:
Charts 1-5State of California, Department of Finance, Race/Ethnic Population Estimates: Components of Change by Race, 1990-1995. Sacramento,California, March 1997.
Chart 6United States Census Bureau, 1990 Census, Public Use Micro-data Sample. (Washington DC).
Chart 7California Economic Development Department, Labor Market Information Division, ES-202 Data for Santa Clara County.
Chart 8Gini co-efficient was calculated by the Economic Policy Institute from wage figures from the Current Population Survey OutgoingRotation Group files (CPS-ORG). See notes for Tables 8-9 for a detailed description of this data source.
○ ○ ○ ○ ○ ○ ○ ○ ○ ○ ○ ○ ○ ○ ○ ○ ○ ○ ○ ○ ○ ○ ○ ○ ○ ○ ○ ○ ○ ○ ○ ○ ○ ○ ○ ○ ○ ○ ○ ○ ○ ○
G R O W I N G X T O G E T H E R X O R X D R I F T I N G X A P A R T
W O R K I N G X P A R T N E R S H I P S X U S A 80
Charts 9-11All figures are calculated from the Census of Manufacturers, 1982, 1987 and 1992, from the U.S. Department of Commerce and Bureau of theCensus. Value added per employee is determined by dividing the total value added by manufacturer by the total number of employees.Average Production worker wages is calculated by dividing total wages of production workers by total number of production workers, andrepresents the difference between the total value of shipments minus the cost of materials and the cost of new capital expenditures. Averagewage for non-production workers is calculated by subtracting production workers and wages from the total reported employees and payroll.
Chart 12Self-sufficiency wages for Santa Clara County were calculated by Wider Opportunities for Women (see notes for Table 13). Percent of jobspaying self-sufficiency wages was calculated from Economic Policy Institute’s analysis of wage data from the Current Population SurveyOut-going Rotation Group data files (see notes for Table 8-9).
Chart 13Administrative Office of the U.S. Courts, Statistics Division, Washington, DC.
Chart 14Peninsula West Valley Association of Realtors (http://www.penwest.com).
Chart 15Real Facts Real Estate Information Firm (415-884-2480) and California Economic Development Department, Annual Report on Employ-ment, Hours and Earnings.
Chart 16Santa Clara County Public Health Department Santa Clara County 1997 Health Status Report: A Platform for Action for the Year 2000Published October 1997.
Charts 17-18California Department of Education, Educational Demographics Unit (916) 657-3934.
Chart 19Santa Clara County Public Health Department Santa Clara County 1997 Health Status Report: A Platform for Action for the Year 2000Published October 1997.
Chart 20From Data published in Kids in Common (1997) 1997 Santa Clara County Children’s Report Card (408-882-0900).
Charts 21-24 and 26-27California Office of the Controller Annual Report of Financial Transactions Concerning Counties of California and Annual Report ofFinancial Transactions Concerning Cities of California Various years (Sacramento, CA).
Chart 25Mayor Susan Hammer’s Budget and Gang Policy Office.
Chart 28Pacific Gas and Electric Company 1994 Financial and Statistical Report .
Chart 29 and 31California Department of Transportation, District 4, Office of Highway Operations, May 1997 Highway Congestion Monitoring Report 1996.
Chart 30RIDES for Bay Area Commuter.