Embed Size (px)
Citation preview

48th International Conference on Environmental Systems ICES-2018-26 8-12 July 2018, Albuquerque, New Mexico
Copyright © 2018 Jet Propulsion Laboratory, California Institute of Technology
Working Fluid Trade Study for a Two-Phase Mechanically
Pumped Loop Thermal Control System
Stefano Cappucci1, Ben Furst2, Eric Sunada3, Pradeep Bhandari4, Takuro Daimaru5
Jet Propulsion Laboratory, California Institute of Technology, Pasadena, CA 91109
NASA Jet Propulsion Laboratory is investigating a two-phase mechanically pumped fluid loop (MPFL)
technology for spacecraft thermal control for future planetary space science mission concepts. The two-phase
technology combines the potential of single-phase MPFL and the passive two-phase heat pipe systems. Previous
two-phase MPFL studies4,5 at JPL have identified an evaporator system with a separated flow architecture as
providing a robust light mass thermal control system with very high spatial and temporal thermal stability
required by the science instruments on these missions. These studies have further identified the thermo-
physical properties of the working fluid to be key to the performance of a two-phase fluid loop. This paper
describes the methodology used in the selection of the working fluids for optimizing the performance of the
two-phase MPFL. A high level model was developed that includes the constraints and boundaries driven by
the system components. The performance of fluids from the REFPROP database were investigated and rated
for this system. The working fluid attributes such as cost, hazardous properties, and heritage were taken into
account in this selection. A typical spacecraft dissipating 1000 W and a fluid loop consisting of an evaporator,
accumulator, radiator, and associated tubing components was used as an example in this study.
Nomenclature
SFA = Separated Flow Architecture
JPL = Jet Propulsion Laboratory
LHP = Loop Heat Pipe
CPL = Capillary Pumped Loop
NPSH = Net Positive Suction Head
P = fluid pressure
ṁ = mass flow rate
R = hydraulic resistance
Q = heat load applied to evaporator
λ = latent heat of vaporization
σ = liquid surface tension
r = pore radius
( )liq = liquid (subscript)
( )vap = vapor (subscript)
( )tot = total (subscript)
( )wick = wick (subscript)
1 Thermal Engineer, Thermal Fluid Systems and Mission Operations 2 Thermal Engineer, Thermal Fluid Systems and Mission Operations 3 Principal Engineer, Propulsion, Thermal, and Materials Systems 4 Principal Engineer, Propulsion, Thermal, and Materials Systems 5 Thermal Engineer, Thermal Fluid Systems and Mission Operations

International Conference on Environmental Systems
2
I. Introduction
The ability to perform a range of planetary science is strongly connected to the development of new enabling
technologies. Planetary science missions concepts that would explore the outer planets are often expensive and thus
flight opportunities can be limited. It becomes therefore essential to minimize flight system mass and power
requirements while meeting science objectives. NASA’s New Frontiers mission, Juno, which entered Jupiter orbit on
July 4, 2016, is the furthest a spacecraft has traveled from the Sun on solar power. Its launch mass was 3625 kg and
end-of-life (EOL) power will be about 400 W using three solar arrays measuring 2.65 m by 8.9 m each8. A significant
portion of the power budget (120 W) was consumed by the thermal control system in the form of heater power to
maintain minimum allowable temperatures, largely for the propulsion and attitude control system. A two-phase
mechanically pumped fluid loop (2-Ф MPFL) thermal management system would provide a more effective thermal
control system and potentially reduce mass by 50% and power by 95%. To show the potential and benefits of a 2-
phase mechanically pumped loop compared to the state of the art of thermal control systems, JPL has created a
reference mission concept and point design that would allow a solar powered mission to study Enceladus, one of
Saturn’s tiny moon. Simultaneously, a study of a 2-phase loop system architecture has been conducted to improve the
new technology TRL. A significant part of this research involves the working fluid trade study since there is very
scarce or no heritage for working fluids in this type of system. Various possibilities have been investigated for heat
pipes and single-phase fluid. However, combining these two technologies introduces new requirements that have to
be thoroughly understood in order to select the best working fluid5.
II. Two-Phase Mechanically Pumped Fluid Loop System Architecture
Several variations of mechanically pumped 2-phase flow systems have been investigated in the past, with varying
degrees of reported success4,11. The specific architecture explored here is the same presented in reference (B Furst
2017).4
Figure 1. 2-Phase MPFL architecture
Figure 1 shows the key elements of the architecture. A pump circulates the working fluid, an evaporator absorbs
the heat load, and a condenser rejects the heat load. An accumulator is used to set the system pressure at the pump
inlet. The evaporator is designed similarly to a CPL evaporator, with liquid and vapor channels being separated by a
porous wick (Figure 2). Unlike a CPL evaporator, the SFA evaporator has a liquid outlet line that allows the liquid
flow to bypass the evaporator and continually circulate during normal operation. This means that during normal
operation, excess liquid is not forced through the wick by the pump. Instead, the wick picks up whatever liquid it
needs to satisfy the vapor mass flow rate required by the heat load. The vapor and liquid phases remain separated in
the entire loop except for in the condenser. This particular design allows to maintain isothermality and assures system
stability by managing vapor distribution and minimizing all the unpredictable phenomena related to two-phase flow.

International Conference on Environmental Systems
3
Figure 2. Evaporator CAD model. Evaporator case (grey) and porous wick (cyan).
III. 1-D High Level Model
A. Operations
The vapor distribution eventually comes down to pressures balance. The following scheme and governing
equations show the interactions between the evaporator and the system and how the pressures have to be controlled in
order to achieve optimal performance at steady state. It is useful to show the pressure variations in the system to better
understand the functioning mechanism of this particular evaporator design and to later introduce the lumped parameter
model utilized for the fluid study. Looking at Figure 3, at the outlet of the pump (1), the pressure is high. Between the
pump outlet and evaporator inlet the flow is single phase liquid and pressure decreases monotonically. Inside the
evaporator, two distinct pressure regions exist: one in the vapor chamber (2’) and one in the liquid chamber (2). These
chambers are completely separated during steady state operation by a porous wick that contains the liquid-vapor
interface. The application of a heat load maintains the presence of vapor in the vapor chamber. The liquid-vapor
interface forms a meniscus that can sustain a pressure difference across it. During normal operation, the pressure in
the vapor chamber is higher than in the liquid chamber. This prevents liquid from being forced into the vapor chamber
by the pump. Depending on how the system is designed, the vapor pressure in the vapor chamber can be even higher
than at the pump outlet. The pressure in the liquid chamber varies relatively little between the inlet and outlet of the
evaporator, since the hydraulic diameter here would typically be bigger than in the transport lines. In the liquid bypass
line between the evaporator (2) and the point where the liquid and vapor lines meet (6), the pressure drops
monotonically due to the flow of liquid. In the vapor line between the outlet of the evaporator (3) and the point where
the two flows meet (6), the pressure also monotonically decreases. In the first leg of the line between the evaporator
(3) and condenser (4), the flow is pure vapor; in the second section within the condenser (4 to 5) the flow is two-phase;
and in the third section from the condenser outlet (5) to the point where liquid and vapor lines recombine (6) the flow
is pure liquid. After the two lines meet the flow is liquid up to the pump inlet (7). The pressure at the pump inlet is
fixed by the accumulator.4
International Conference on Environmental Systems
4
Figure 3. Pressure versus position for a typical SFA system
Figure 4. Schematic of the section of the SFA system that is being modelled (above), and the corresponding
circuit diagram (below). The circuit diagram visually describes the simplified lumped-parameter model that
is developed here. The key quantities of the model are included in the diagram.
B. Governing equations
Consider the portion of a simple SFA system from the evaporator inlet to the point after the condenser where the
liquid and condensed vapor lines meet (point 6 in Figure 3) This is the section of an SFA system that is of primary
interest. Figure 4 shows two schematics of this section illustrating the physical system and its simplified, abstracted
circuit diagram. At steady state, the vapor chamber is filled with vapor as is the line between the outlet of the
evaporator and the condenser. The condenser contains two-phase flow, and the remainder of the system contains
liquid. The liquid and vapor phases are separated in the evaporator by a meniscus which forms in the wick (just as in
a heat pipe). The key physical parameters accounted for in the lumped parameter model are shown on the circuit
diagram. Pressure in the liquid chamber and on either side of the meniscus is captured as well as flow resistances in
the wick Rwick, liquid chamber Rliq and vapor chamber Rvap.
International Conference on Environmental Systems
5
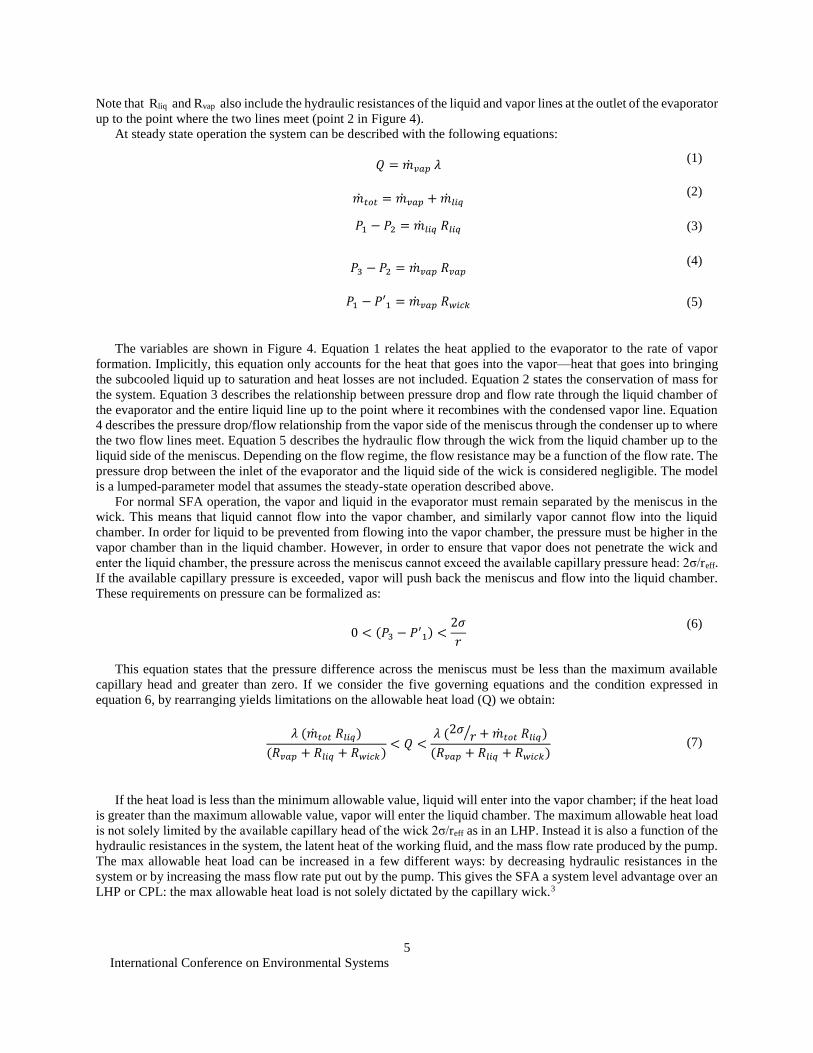
Note that Rliq and Rvap also include the hydraulic resistances of the liquid and vapor lines at the outlet of the evaporator
up to the point where the two lines meet (point 2 in Figure 4).
At steady state operation the system can be described with the following equations:
𝑄 = �̇�𝑣𝑎𝑝 𝜆 (1)
�̇�𝑡𝑜𝑡 = �̇�𝑣𝑎𝑝 + �̇�𝑙𝑖𝑞 (2)
𝑃1 − 𝑃2 = �̇�𝑙𝑖𝑞 𝑅𝑙𝑖𝑞 (3)
𝑃3 − 𝑃2 = �̇�𝑣𝑎𝑝 𝑅𝑣𝑎𝑝 (4)
𝑃1 − 𝑃′1 = �̇�𝑣𝑎𝑝 𝑅𝑤𝑖𝑐𝑘
(5)
The variables are shown in Figure 4. Equation 1 relates the heat applied to the evaporator to the rate of vapor
formation. Implicitly, this equation only accounts for the heat that goes into the vapor—heat that goes into bringing
the subcooled liquid up to saturation and heat losses are not included. Equation 2 states the conservation of mass for
the system. Equation 3 describes the relationship between pressure drop and flow rate through the liquid chamber of
the evaporator and the entire liquid line up to the point where it recombines with the condensed vapor line. Equation
4 describes the pressure drop/flow relationship from the vapor side of the meniscus through the condenser up to where
the two flow lines meet. Equation 5 describes the hydraulic flow through the wick from the liquid chamber up to the
liquid side of the meniscus. Depending on the flow regime, the flow resistance may be a function of the flow rate. The
pressure drop between the inlet of the evaporator and the liquid side of the wick is considered negligible. The model
is a lumped-parameter model that assumes the steady-state operation described above.
For normal SFA operation, the vapor and liquid in the evaporator must remain separated by the meniscus in the
wick. This means that liquid cannot flow into the vapor chamber, and similarly vapor cannot flow into the liquid
chamber. In order for liquid to be prevented from flowing into the vapor chamber, the pressure must be higher in the
vapor chamber than in the liquid chamber. However, in order to ensure that vapor does not penetrate the wick and
enter the liquid chamber, the pressure across the meniscus cannot exceed the available capillary pressure head: 2σ/reff.
If the available capillary pressure is exceeded, vapor will push back the meniscus and flow into the liquid chamber.
These requirements on pressure can be formalized as:
0 < (𝑃3 − 𝑃′1) <
2𝜎
𝑟
(6)
This equation states that the pressure difference across the meniscus must be less than the maximum available
capillary head and greater than zero. If we consider the five governing equations and the condition expressed in
equation 6, by rearranging yields limitations on the allowable heat load (Q) we obtain:
𝜆 (�̇�𝑡𝑜𝑡 𝑅𝑙𝑖𝑞)
(𝑅𝑣𝑎𝑝 + 𝑅𝑙𝑖𝑞 + 𝑅𝑤𝑖𝑐𝑘)< 𝑄 <
𝜆 (2𝜎𝑟⁄ + �̇�𝑡𝑜𝑡 𝑅𝑙𝑖𝑞)
(𝑅𝑣𝑎𝑝 + 𝑅𝑙𝑖𝑞 + 𝑅𝑤𝑖𝑐𝑘)
(7)
If the heat load is less than the minimum allowable value, liquid will enter into the vapor chamber; if the heat load
is greater than the maximum allowable value, vapor will enter the liquid chamber. The maximum allowable heat load
is not solely limited by the available capillary head of the wick 2σ/reff as in an LHP. Instead it is also a function of the
hydraulic resistances in the system, the latent heat of the working fluid, and the mass flow rate produced by the pump.
The max allowable heat load can be increased in a few different ways: by decreasing hydraulic resistances in the
system or by increasing the mass flow rate put out by the pump. This gives the SFA a system level advantage over an
LHP or CPL: the max allowable heat load is not solely dictated by the capillary wick.3
International Conference on Environmental Systems
6
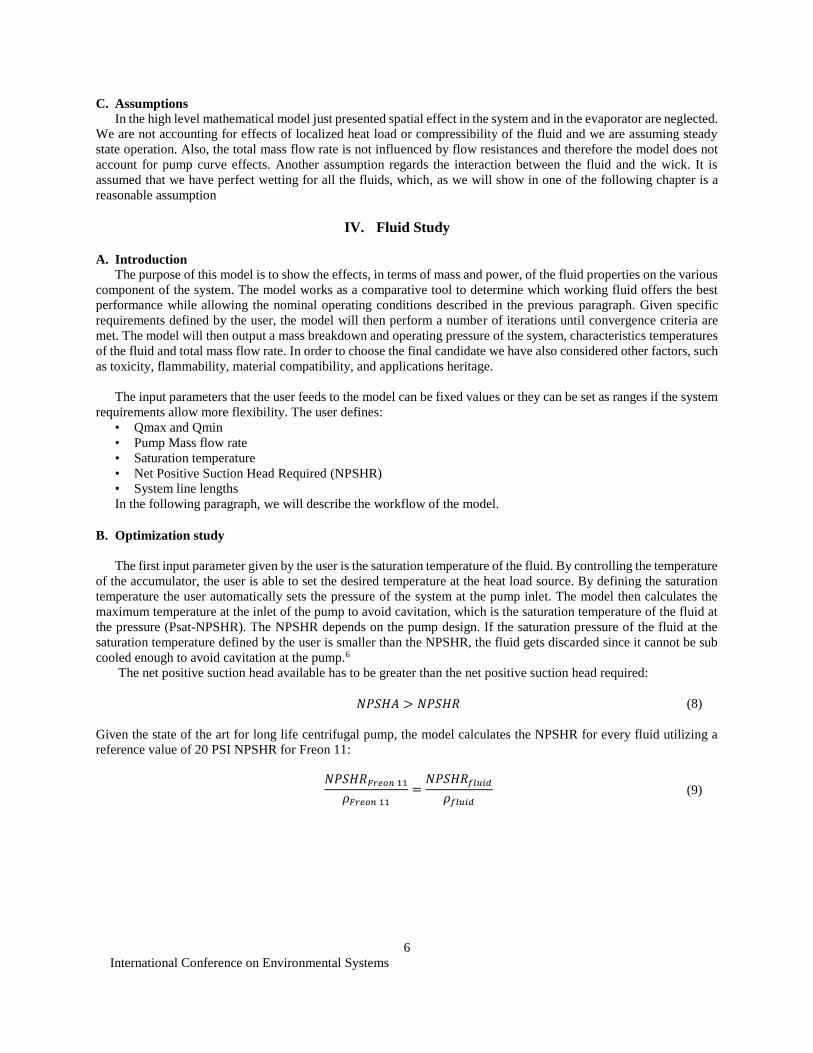
C. Assumptions
In the high level mathematical model just presented spatial effect in the system and in the evaporator are neglected.
We are not accounting for effects of localized heat load or compressibility of the fluid and we are assuming steady
state operation. Also, the total mass flow rate is not influenced by flow resistances and therefore the model does not
account for pump curve effects. Another assumption regards the interaction between the fluid and the wick. It is
assumed that we have perfect wetting for all the fluids, which, as we will show in one of the following chapter is a
reasonable assumption
IV. Fluid Study
A. Introduction
The purpose of this model is to show the effects, in terms of mass and power, of the fluid properties on the various
component of the system. The model works as a comparative tool to determine which working fluid offers the best
performance while allowing the nominal operating conditions described in the previous paragraph. Given specific
requirements defined by the user, the model will then perform a number of iterations until convergence criteria are
met. The model will then output a mass breakdown and operating pressure of the system, characteristics temperatures
of the fluid and total mass flow rate. In order to choose the final candidate we have also considered other factors, such
as toxicity, flammability, material compatibility, and applications heritage.
The input parameters that the user feeds to the model can be fixed values or they can be set as ranges if the system
requirements allow more flexibility. The user defines:
• Qmax and Qmin
• Pump Mass flow rate
• Saturation temperature
• Net Positive Suction Head Required (NPSHR)
• System line lengths
In the following paragraph, we will describe the workflow of the model.
B. Optimization study
The first input parameter given by the user is the saturation temperature of the fluid. By controlling the temperature
of the accumulator, the user is able to set the desired temperature at the heat load source. By defining the saturation
temperature the user automatically sets the pressure of the system at the pump inlet. The model then calculates the
maximum temperature at the inlet of the pump to avoid cavitation, which is the saturation temperature of the fluid at
the pressure (Psat-NPSHR). The NPSHR depends on the pump design. If the saturation pressure of the fluid at the
saturation temperature defined by the user is smaller than the NPSHR, the fluid gets discarded since it cannot be sub
cooled enough to avoid cavitation at the pump.6
The net positive suction head available has to be greater than the net positive suction head required:
𝑁𝑃𝑆𝐻𝐴 > 𝑁𝑃𝑆𝐻𝑅
(8)
Given the state of the art for long life centrifugal pump, the model calculates the NPSHR for every fluid utilizing a
reference value of 20 PSI NPSHR for Freon 11:
𝑁𝑃𝑆𝐻𝑅𝐹𝑟𝑒𝑜𝑛 11
𝜌𝐹𝑟𝑒𝑜𝑛 11
=𝑁𝑃𝑆𝐻𝑅𝑓𝑙𝑢𝑖𝑑
𝜌𝑓𝑙𝑢𝑖𝑑
(9)

International Conference on Environmental Systems
7
If the saturation temperature is set as a range and the saturation pressure of the fluid is lower than the NPSHR, the
model automatically increases the saturation temperature up to the maximum value set by the user to satisfy the NPSH
requirement.
The second input parameter given by the user is the Qmax. For this comparison study, the Qmax value is set to 1
kW. The model calculates the minimum mass flow rate necessary to transport 1 kW:
𝑄𝑚𝑎𝑥 = �̇�𝑡𝑜𝑡(𝐶𝑝∆𝑇 + 𝜆)
(10)
Once the minimum mass flow rate is calculated the model increases the vapor line diameter by finite increments
to change the system resistances until the Qmax conditions in equation (14) is satisfied or the maximum vapor line
diameter is reached.
𝑄𝑚𝑎𝑥 <𝜆 (2𝜎
𝑟⁄ + �̇�𝑡𝑜𝑡 𝑅𝑙𝑖𝑞)
(𝑅𝑣𝑎𝑝 + 𝑅𝑙𝑖𝑞 + 𝑅𝑤𝑖𝑐𝑘))
(11)
The pressure jump across the wick ∆P = 2σr⁄ depends of the surface tension of the fluid and on the pore radius of
the wick. For this study we assumed the pore radius of the wick to be 50 µm.
While satisfying the Qmax condition the model also calculates Qmin utilizing two input parameters set by the user: a
maximum Qmin value and a maximum liquid line diameter. The model iterates the calculations for the Qmin by
increasing the liquid line diameter by finite increments until the maximum Qmin value is satisfied or the maximum
liquid lined diameter is reached. It has to be noted that Rvap and Rliq influence both the Qmax and the Qmin values. As
Rliq decreases both the Qmin and the Qmax decrease. As Rvap decreases both Qmax and Qmin increase. The model
goes through several iteration changing the values of Rvap and Rliq to meet both the Qmin and Qmax requirements.
The resistances Rliq and Rvap are calculated by combining 3 different equations: one for laminar, one for the
transition regime and one for turbulent regime.9
In order to be able to compare the fluids and their impact on system mass and power, the model uses simple
equations to estimate components sizes once the geometries of the lines and the total fluid volume have been defined.
Because of its design, the evaporator mass is almost insensitive to the system operating pressure. For simplicity, we
kept the mass and the geometries of the evaporator fixed (0.7 x 0.7 m 5.75 kg). The titanium evaporator was designed
to be able to withstand 35 bar of internal pressure. Stress analysis fo the evaporator is shown in Figure 5. The model
discards automatically all the fluids with higher saturation pressure.
Figure 5. Evaporator stress analysis results

International Conference on Environmental Systems
8
The mass of the accumulator depends on its thickness and the fluid volume it has to accommodate. The model
calculates the thickness of the accumulator at the operating pressure with the Lame's theory pressure vessel equation
(15). 2
𝜎𝑙𝑜𝑛𝑔 =𝑝(𝑟 − 0.4𝑡)
2𝑡𝐸
(12)
In equation (15) σlong is the stress in longitudinal direction, p is the internal pressure, r is the radius and t the thickness
of the cylinder . E captures joints and variation of stresses across the thickness.
The maximum heat load the radiator has to be able to dissipate is Qmax. If we assume the same Qmax and
environment boundary conditions for every fluid, the saturation temperature and the sub cooling temperature are the
two drivers for the radiator size and mass. If we break down the radiator in two sections, the condenser and the sub-
cooler, we can say that a higher saturation temperature allows the condenser to run hotter and be able to dissipate the
same amount of heat with a smaller area. In addition, obtaining a bigger delta T between the saturation temperature
and the sub-cooling temperature to avoid cavitation will require a larger sub-cooler. The size of the condenser and
sub-cooler vary also depending on the value of the latent heat and the sensible heat of the fluid. Ideally, to optimize
the total mass of the radiator, it is desirable to have high latent heat values and the small sensible heat values. Assuming
a radiator constantly looking at deep space, the model estimates the area necessary to reject the heat and calculate the
total mass of the radiator.1
C. Output
The model analyzes all the fluids in the REFPROP database and gives four charts as output:
• Qmax and Qmin values
• Mass breakdown of the system
• Mass flow rate
• System pressure
• Characteristic temperatures
Figure 6. Qmax and Qmin model results
As shown in Figure 6 the Qmax values are never exactly equal to 1000 W because for every iteration the model
performs, the increments on the mass flow rate or the vapor line diameter are finite. The model stops iterating if either
the 1 kW requirement is satisfied or the maximum vapor line diameter or maximum mass flow rate exceed the values
fixed by the user.
0.0
200.0
400.0
600.0
800.0
1000.0
1200.0
Pow
er [
W]
Qmin Qmax

International Conference on Environmental Systems
9
A bigger difference between the Qmax and Qmin values makes the system more stable and allows it to
accommodate different heat loads without changing the pump speed. A high ΔQ is desirable since constant operating
speed increases the life of the pump and reduces system complexity.
Figure 7. Characteristic temperatures comparison
When considering characteristic temperatures (Figure 7) it becomes very hard to define a single figure of merit. It
is therefore up to the user to analyze the effects of these temperatures on the system. For our final choice of the working
fluid we have considered the following effects.
Like we have already anticipated, the sub cooling temperature affects the size of the condenser. The higher the sub
cooling temperature, the more heat the radiator is going to be able to dissipate. In addition, the sub cooling point
should be considerably higher than the freezing point to avoid any freezing risks or a freezable radiator design.
If we look at the saturation temperature of the system we can observe another interesting effect. For a given fluid,
the delta T between the saturation temperature and the sub cooling temperature is influenced by the position of the
saturation temperature on the saturation curve. Looking at the saturation curve for water (Figure 8) we can observe
that if the saturation temperature lands on a steeper part of the curve, the fluid will require less sub cooling to meet
the NPSH requirement. Conversely, if the saturation temperature is on a flatter part of the curve the fluid will need
more sub cooling to avoid cavitation at the pump.
Figure 8. Water saturation curve
0
50
100
150
200
250
300
350
400
450
500
Tem
per
atu
re [
K]
Tsat Tliquid Critic. Point Freezing point
International Conference on Environmental Systems
10
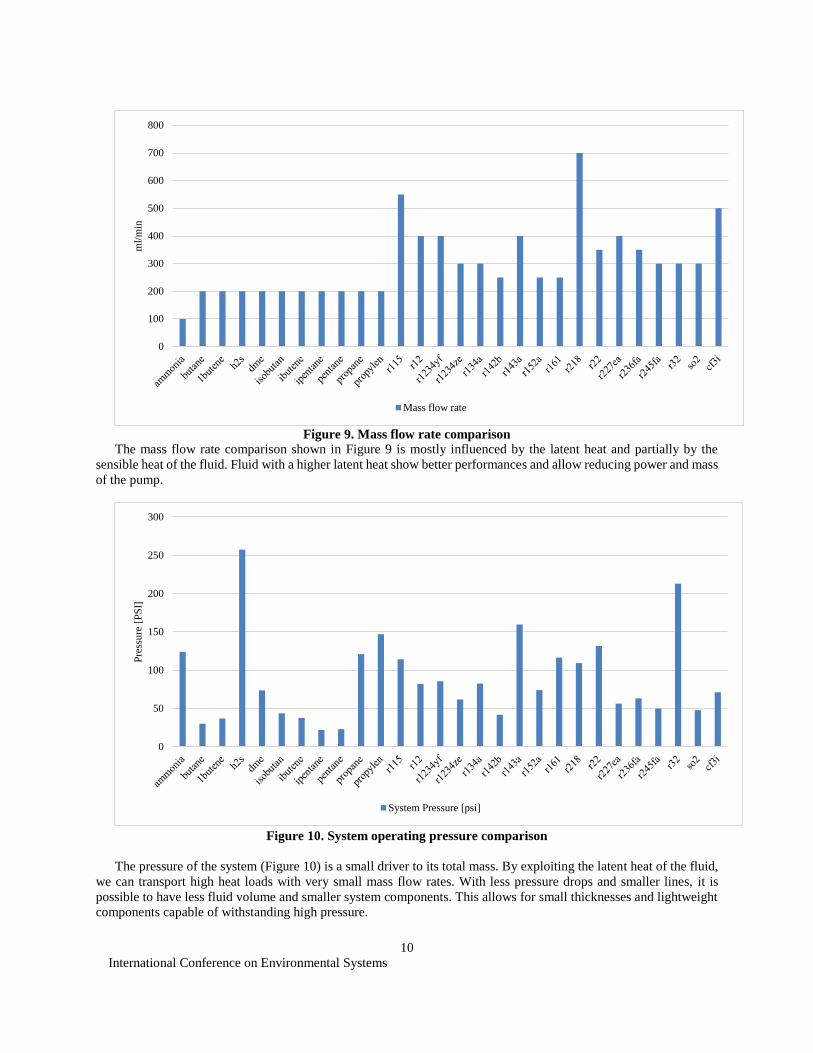
Figure 9. Mass flow rate comparison
The mass flow rate comparison shown in Figure 9 is mostly influenced by the latent heat and partially by the
sensible heat of the fluid. Fluid with a higher latent heat show better performances and allow reducing power and mass
of the pump.
Figure 10. System operating pressure comparison
The pressure of the system (Figure 10) is a small driver to its total mass. By exploiting the latent heat of the fluid,
we can transport high heat loads with very small mass flow rates. With less pressure drops and smaller lines, it is
possible to have less fluid volume and smaller system components. This allows for small thicknesses and lightweight
components capable of withstanding high pressure.
0
100
200
300
400
500
600
700
800
ml/
min
Mass flow rate
0
50
100
150
200
250
300
Pre
ssu
re [
PS
I]
System Pressure [psi]

International Conference on Environmental Systems
11
Figure 11. System mass breakdown
The describing the mass breakdown in
0
10
20
30
40
50
60
70
80
90
100M
ass
[kg]
Fluid Mass [kg] Accumulator mass [kg] Evaporator mass [kg] Tubing mass [kg] Radiator mass [kg]
0
10
20
30
40
50
60
70
80
90
100
Mas
s [k
g]
Fluid Mass [kg] Accumulator mass [kg] Evaporator mass [kg] Tubing mass [kg] Radiator mass [kg]

International Conference on Environmental Systems
12
Figure 11 shows some results that we have already anticipated: the pressure of the system only slightly influences the
accumulator mass. The influence on the evaporator and tubing mass is negligible. One big driver of the total system
mass is the fluid volume and its density. Fluids with low surface tension, low vapor density, low latent heat, will force
the model to increase the lines diameter to reduce pressure drops and meet the Qmax and Qmin requirement. With a
bigger fluid volume, the size and therefore the mass of the accumulator and the tubing also have to increase.
From
Figure 11, Ammonia seems to be the best fluid for our system, although several other fluids have comparable
performance.
• butane
• 1-butene
• Hydrogen Sulfide
• Dimethyl ether
• Isobutane
• Isobutene
• Isopentane
• pentane
• propane
• propylene
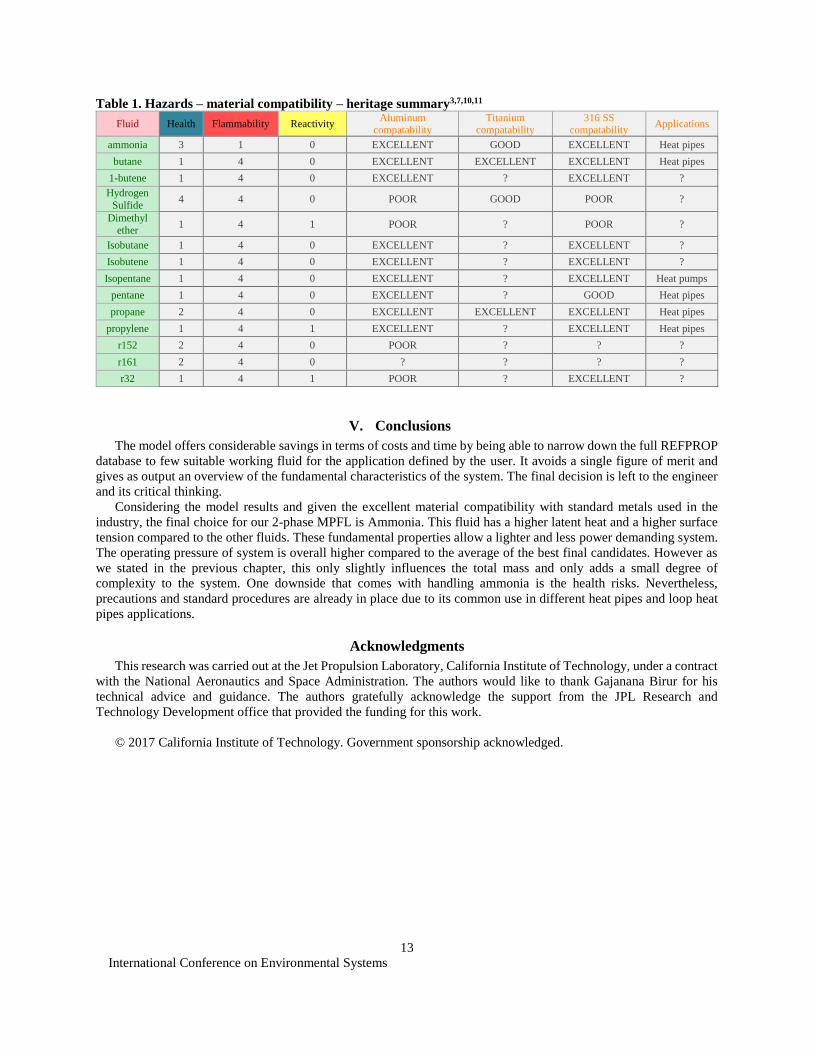
To finalize our study we also considered other factors that the model is incapable of capturing like material
compatibility, toxicity, flammability and application heritage. The following table summarizes these information on
the best candidates given by the model.
0
10
20
30
40
50
60
70
80
90
100
Mas
s [k
g]
Fluid Mass [kg] Accumulator mass [kg] Evaporator mass [kg] Tubing mass [kg] Radiator mass [kg]
International Conference on Environmental Systems
13
Table 1. Hazards – material compatibility – heritage summary3,7,10,11
Fluid Health Flammability Reactivity Aluminum
compatability Titanium
compatability 316 SS
compatability Applications
ammonia 3 1 0 EXCELLENT GOOD EXCELLENT Heat pipes
butane 1 4 0 EXCELLENT EXCELLENT EXCELLENT Heat pipes
1-butene 1 4 0 EXCELLENT ? EXCELLENT ?
Hydrogen
Sulfide 4 4 0 POOR GOOD POOR ?
Dimethyl
ether 1 4 1 POOR ? POOR ?
Isobutane 1 4 0 EXCELLENT ? EXCELLENT ?
Isobutene 1 4 0 EXCELLENT ? EXCELLENT ?
Isopentane 1 4 0 EXCELLENT ? EXCELLENT Heat pumps
pentane 1 4 0 EXCELLENT ? GOOD Heat pipes
propane 2 4 0 EXCELLENT EXCELLENT EXCELLENT Heat pipes
propylene 1 4 1 EXCELLENT ? EXCELLENT Heat pipes
r152 2 4 0 POOR ? ? ?
r161 2 4 0 ? ? ? ?
r32 1 4 1 POOR ? EXCELLENT ?
V. Conclusions
The model offers considerable savings in terms of costs and time by being able to narrow down the full REFPROP
database to few suitable working fluid for the application defined by the user. It avoids a single figure of merit and
gives as output an overview of the fundamental characteristics of the system. The final decision is left to the engineer
and its critical thinking.
Considering the model results and given the excellent material compatibility with standard metals used in the
industry, the final choice for our 2-phase MPFL is Ammonia. This fluid has a higher latent heat and a higher surface
tension compared to the other fluids. These fundamental properties allow a lighter and less power demanding system.
The operating pressure of system is overall higher compared to the average of the best final candidates. However as
we stated in the previous chapter, this only slightly influences the total mass and only adds a small degree of
complexity to the system. One downside that comes with handling ammonia is the health risks. Nevertheless,
precautions and standard procedures are already in place due to its common use in different heat pipes and loop heat
pipes applications.
Acknowledgments
This research was carried out at the Jet Propulsion Laboratory, California Institute of Technology, under a contract
with the National Aeronautics and Space Administration. The authors would like to thank Gajanana Birur for his
technical advice and guidance. The authors gratefully acknowledge the support from the JPL Research and
Technology Development office that provided the funding for this work.
© 2017 California Institute of Technology. Government sponsorship acknowledged.
International Conference on Environmental Systems
14
References 1Anthony D Paris, Pradeep Bhandari, Gajanana Birur. Jul 19 2004. "High Temperature Mechanically pumped fluid
loop for space application working fluid selection - 20060043586." ICES. Colorado Springs: ICES. 2ASME. 2007. "2007 ASME Boiler & Pressure Vessel Code: An International Code. Rules for construction of pressure
vessels. VIII." In 2007 ASME Boiler & Pressure Vessel Code, by ASME. New York. 3Association, National Fire Protection. 2017. "NFPA 704: Standard System for the Identification of the Hazards of
Materials for Emergency Response." Quincy. 4B Furst, E Sunada, P Bhandari, G Birur, Cappucci, Daimaru. Jul 16 2017. "A Comparison of System Architectures
for a Mechanically Pumped Two-Phase Thermal Control System - ICES-2017-119 ." ICES. Charelston:
ICES. 5E Sunada, B Furst, P Bhandari, B Carrol, G Birur, Cappucci, Nagai, Daimaru,Mizerak. Jul 10 2016. "A Two-Phase
Mechanically Pumped Fluid Loop for Thermal Control of Deep Space Science Missions - ICES-2016-129."
ICES. Vienna: ICES. 6Furukawa, Masao, Kazuki Mimura. 1997. "Development test of a vapor/liquid separated two-phase fluid loop." SAE
technical paper. 7Gilmore, David G. 2002. Thermal Control Handbook. 8GRACO. 2008. "Chemical Compatibility Guide." 9Grammier, Richard S. March 7 2009. "A Look Inside the Juno Mission to Jupiter-1095-323X ." Aerospace
Conference IEEE. Big Sky: IEEE . 10Incropera, Theodore Bergman, Dewitt. 2011. Fundamental of Heat and Mass Transfer. 11Matheson. 2009. "Materials Compatibility Guide." 12Park, CHanwoo, Aparna VAllury, and Jon Zuo. September 27 2009. "Performance evaluation of a pump-assisted ,
capillary two-phase cooling loop." Journal of Thermal Science and Engineering Applications.