Embed Size (px)
Citation preview

Working Holiday Maker visa programme report 31 December 2014


Contents Page
About this report 1
Enquiries 1
Definition of terms 2
Background to the Working Holiday Maker programme 3
Recent developments in the Working Holiday Maker programme 6
Executive summary 7
Section 1 Lodged 9
Section 2 Granted 15
Section 3 Grant Rate 27
Section 4 Visa holders in Australia 31

About this report
This report provides monthly and programme year data on the Working Holiday Maker (WHM) visa programme
administered by the Department of Immigration and Border Protection (the department). The report has been provided
to assist policymakers and stakeholder organisations.
This report is published every six months, and further developments will occur over time to increase and improve
information sharing about the WHM programme. Current and previous versions of the report are available on the
department’s website at: http://www.immi.gov.au/pub-res/Pages/statistics/visitor-programme-statistics.aspx . This web
page also contains a Working Holiday Maker visa grants pivot table, which is updated on a quarterly basis.
Data is sourced from several departmental visa processing and recording systems. Data can be dynamic and there can
be delays in transmission of information from the department's global operations. Variations in figures between this
report and previous reports can occur. Due to these issues, data from the current financial year should always be
considered provisional.
Further information about the Working Holiday Maker programme is available on the department’s website at: http://www.immi.gov.au/Visas/Pages/417.aspx and http://www.immi.gov.au/Visas/Pages/462.aspx.
Notes on statistical tables presented by citizenship country
A result of ‘na’ indicates that the country did not have a Working Holiday Maker arrangement with Australia during the
specified period. This may be because the arrangement had not yet commenced or the arrangement is no longer in
place. Refer to the table 'Australia's Working Holiday Maker visa arrangements’ in the ‘Background to the Working
Holiday Maker visa programme’ section.
A citizenship country of 'Not Specified' can result from eligible dual nationality applicants where the non-eligible
nationality has been recorded for the WHM application.
Enquiries Any comment or enquiries concerning this report should be sent to [email protected] quoting
report id BR0110.
BR0110 Working Holiday Maker visa programme report | 31 December 2014 | page 1

Definition of terms
Citizenship country: The country of citizenship of the visa applicant or visa holder. Where a visa applicant or visa holder has more than one citizenship country, either the citizenship of the
travel document or the citizenship nominated by the visa applicant is used.
Granted: Unless otherwise specified, the number of visas granted includes all visa grants.
Snapshot date: The snapshot date is a point in time at which a count is undertaken. In this report, the
number of visa holders in Australia at a point in time is used.
Visa applicant: Used to refer to clients applying for a visa.
Working Holiday Maker: Refers collectively to both the Working Holiday (subclass 417) visa and the Work and
Holiday (subclass 462) visa.
BR0110 Working Holiday Maker visa programme report | 31 December 2014 | page 2

Background to the Working Holiday Maker visa programme
The Working Holiday Maker (WHM) programme’s purpose is to foster closer ties and cultural exchange between
Australia and partner countries, with particular emphasis on young adults. It has been in existence since 1975. Today, the WHM programme is comprised of the Working Holiday (subclass 417) and the Work and Holiday (subclass 462) visa programmes. Partner countries initially comprised a relatively small number of Commonwealth countries, but the
programme has since grown to encompass 34 partner nations and regions (Hong Kong Special Administrative Region
of the People’s Republic of China) from across the globe.
Australia has an overarching bilateral arrangement, usually in the form of a Memorandum of Understanding, with each
partner country. Of the 34 partner countries, 19 are Working Holiday (subclass 417) visa arrangements, and 15 are
Work and Holiday (subclass 462) visa arrangements. The key differences between the two visas are that Work and
Holiday visa arrangements generally have caps on the number of visas granted annually and additional eligibility
requirements. The Work and Holiday visa arrangements that Australia has signed with Greece, Israel and Papua New
Guinea are not yet in effect. Each of these arrangements will be implemented once both Australia and the partner country have the necessary legislative and administrative systems in place. Announcements will be made on the
department’s website once implementation processes are complete, enabling participants to lodge visa applications.
WHM arrangements are reciprocal in nature, providing Australians with similar opportunities overseas. In considering
whether to add new WHM partner countries, the Australian Government considers a range of factors, including the
ability of the prospective partner to offer reciprocity to Australians, and the strength of any cultural and people-to-people
links.
Eligibility Requirements
All WHM (both Working Holiday and Work and Holiday) visa applicants must:
· be aged 18-30 at time of application · hold a passport from an eligible partner country · not be accompanied by dependent children during their stay in Australia
· meet health and character requirements · meet financial requirements.
Work and Holiday visa applicants must meet additional requirements, including:
· functional English· successful completion of at least two years of undergraduate university study
Working Holiday (subclass 417) partner countries:
1 Belgium
2 Canada
3 Cyprus
4 Denmark
5 Estonia
6 Finland
7 France
8 Germany 9 Hong Kong Special Administrative Region of the
People's Republic of China (HKSAR of the PRC) 10 Ireland 11 Italy
12 Japan 13 Korea, Republic of 14 Malta 15 Netherlands
16 Norway
17 Sweden
18 Taiwan 19 United Kingdom
Work and Holiday (subclass 462) partner countries:
1 Argentina
2 Bangladesh
3 Chile
4 Greece*
5 Indonesia
6 Israel*
7 Malaysia 8 Papua New Guinea*
9 Poland 10 Portugal 11 Spain
12 Thailand
13 Turkey 14 United States of America
15 Uruguay
*Work and Holiday arrangement signed but not yet ineffect as at 31 December 2014
BR0110 Working Holiday Maker visa programme report | 31 December 2014 | page 3
Background to the Working Holiday Maker visa programme - continued
Countries with which Australia is currently negotiating new Work and Holiday (subclass 462) arrangements
1 Andorra
2 Austria
3 Brazil 4 China 5 Czech Republic
6 Fiji 7 Hungary
8 Latvia
9 Mexico
10 Mongolia
11 Philippines
12 San Marino 13 Slovak Republic
14 Solomon Islands
15 Switzerland
16 Vietnam
Working while in Australia
All WHMs may work for the full duration of their 12 month stay in Australia, but may not remain with any one employer for longer than six months (by operation of mandatory visa condition 8547).
Studying while in Australia
All WHMs are entitled to study for a period of up to four months during their 12 month stay in Australia.
Second Working Holiday
Participants are generally limited to holding only one Working Holiday visa or Work and Holiday visa in their lifetime. However, on 1 November 2005, the second Working Holiday visa initiative was introduced. This initiative allows
first-time Working Holiday (subclass 417) visa holders who undertake 88 days ‘specified work’ in regional Australia during their stay to acquire eligibility to apply for a second such visa. The initiative is not available to Work and Holiday
(subclass 462) participants.
‘Specified work’ includes work in the agriculture, mining and construction industries. For the purposes of the second
Working Holiday visa initiative, regional Australia includes large parts of rural and regional Australia, which are identified
in a list of postcodes available on the department’s website at: http://www.immi.gov.au/Visas/Pages/417.aspx.
The number of second Working Holiday visa grants has grown rapidly since the programme commenced in late 2005. There were 2692 grants in 2005-06, compared with 45,950 grants in 2013-14. In 2013-14, approximately one in four first-time Working Holiday visa holders went on to acquire a second Working Holiday visa.
The second Working Holiday visa programme had grown to constitute 20 per cent of the overall Working Holiday
programme by 30 June 2014. This compared with just a 3.3 per cent share of overall Working Holiday visa holders in Australia as at 30 June 2006.
Processing Times
Participants are generally limited to holding only one Working Holiday visa or Work and Holiday visa in their lifetime. However, on 1 November 2005, the second Working Holiday visa initiative was introduced. This initiative allows
first-time Working Holiday (subclass 417) visa holders who undertake 88 days ‘specified work’ in regional Australia during their stay to acquire eligibility to apply for a second such visa. The initiative is not available to Work and Holiday
(subclass 462) participants.
The visa processing service standard for Work and Holiday (subclass 462) online visa applications (USA nationals only) is that 75 per cent are finalised within six calendar days of lodgement. In the six months to 31 December 2014, 84.7 per cent of online Work and Holiday visa applications were finalised within service standards. The service standard
for Work and Holiday (subclass 462) paper visa applications is that 75 per cent are finalised within 14 calendar days of lodgement. In the six months to 31 December 2014, 50.5 per cent of paper Work and Holiday visa applications were
finalised within service standards.
Processing times may be affected by factors such as the completeness of applications lodged and additional checks
performed by visa processing officers, such as those relating to health and character.
BR0110 Working Holiday Maker visa programme report | 31 December 2014 | page 4

Australia’s Working Holiday Maker visa arrangements
BR0110 Working Holiday Maker visa programme report | 31 December 2014 | page 5
Commencement Date Country / Region Type of Agreement Cap
1975 United Kingdom Working Holiday (SC 417) N/A 1975 Ireland Working Holiday (SC 417) N/A 1975 Canada Working Holiday (SC 417) N/A 1 December 1980 Japan Working Holiday (SC 417) N/A 1 July 1995 South Korea Working Holiday (SC 417) N/A 1 July 1996 Malta Working Holiday (SC 417) N/A 1 July 2000 Germany Working Holiday (SC 417) N/A 1 July 2001 Sweden Working Holiday (SC 417) N/A 1 July 2001 Norway Working Holiday (SC 417) N/A 1 July 2001 Denmark Working Holiday (SC 417) N/A 15 September 2001 Hong Kong (HKSAR of the PRC) Working Holiday (SC 417) N/A 1 May 2002 Finland Working Holiday (SC 417) N/A 1 July 2002 Cyprus Working Holiday (SC 417) N/A 2 January 2004 Italy Working Holiday (SC 417) N/A 20 February 2004 France Working Holiday (SC 417) N/A 1 November 2004 Taiwan Working Holiday (SC 417) N/A 1 November 2004 Belgium Working Holiday (SC 417) N/A 20 May 2005 Estonia Working Holiday (SC 417) N/A 1 August 2005 Thailand Work and Holiday (SC 462) 500 1 March 2006 Chile Work and Holiday (SC 462) 1500 1 July 2006 Netherlands Working Holiday (SC 417) N/A 31 March 2007 Turkey Work and Holiday (SC 462) 100 31 October 2007 United States of America Work and Holiday (SC 462) N/A 1 February 2009 Malaysia Work and Holiday (SC 462) 100 1 July 2009 Indonesia Work and Holiday (SC 462) 1000 31 December 2010 Bangladesh Work and Holiday (SC 462) 100 29 February 2012 Argentina Work and Holiday (SC 462) 500 1 April 2013 Uruguay Work and Holiday (SC 462) 200 1 August 2014 Poland Work and Holiday (SC 462) 200 23 November 2014 Portugal Work and Holiday (SC 462) 200 23 November 2014 Spain Work and Holiday (SC 462) 500
Signed 12 October 2011 - not yet in effect
as at 31 December 2014 Papua New Guinea Work and Holiday (SC 462) 100
Signed 14 May 2014 - not yet in effect
as at 31 December 2014 Greece Work and Holiday (SC 462) 500
Signed 22 October 2014 - not yet in effect
as at 31 December 2014 Israel Work and Holiday (SC 462) 500

Recent developments in the Working Holiday Maker programme Implementation of Work and Holiday arrangements with Poland, Portugal and Spain
New Work and Holiday (subclass 462) visa arrangements were implemented with Poland on 1 August 2014, and with Portugal and Spain on 23 November 2014, enabling the commencement of visa grants under each arrangement.
Commencement of Work and Holiday negotiations with Austria, the Philippines, the Solomon Islands and Switzerland
Australia commenced new Work and Holiday (subclass 462) visa arrangement negotiations with Austria (annual visa
cap of 200 places), the Philippines (200 places), the Solomon Islands (100 places) and Switzerland (200 places) during
the six months to 31 December 2014, taking the total number of Work and Holiday negotiations underway to 16 countries as at 31 December 2014.
Work and Holiday arrangement signed with Israel
On 22 October 2014, a new Work and Holiday visa arrangement was signed with Israel. It is anticipated that the
arrangement will be implemented in 2015, once both Australia and Israel have made appropriate arrangements for the commencement of visa grants.
Agreement on a Work and Holiday arrangement with China
In November 2014, Australia and China concluded negotiations over a Work and Holiday visa arrangement, under which Australia will grant up to 5000 Work and Holiday visas to Chinese nationals annually. It is anticipated that the
Memorandum of Understanding on a Work and Holiday arrangement with China will be signed, and the arrangement implemented, in 2015.
BR0110 Working Holiday Maker visa programme report | 31 December 2014 | page 6
Executive Summary
Key Points In the six months to 31 December 2014, a total of 120,686 Working Holiday Maker (WHM) (subclass 417 and
subclass 462) visas were granted, a 9.5 per cent reduction compared to the corresponding period in 2013-14.
There was a 10.9 per cent reduction in first Working Holiday (subclass 417) visa grants to 92,374 and an8.2 per cent reduction in second Working Holiday visa grants to 22433. Work and Holiday (Subclass 462) visagrants increased 11.7 per cent to 5,879.
There were 160,941 WHM visa holders in Australia at 31 December 2014, a 10.1 per cent reduction compared to31 December 2013.
1 Applications lodged
In the six months to 31 December 2014, there was an 8.7 per cent reduction in WHM visa application lodgements compared to the corresponding period in 2013-14.
There were a total of 92,890 first Working Holiday (subclass 417) visa applications, 23,354 second Working Holiday (subclass 417) visa applications, and 6,079 Work and Holiday (subclass 462) visa applications lodged in the six months to 31 December 2014.
The very high average grant rate of WHM visas (98 per cent - see Section 3) means the number of visas granted tends to be very close to the number of visa applications lodged during the period, noting that there can be a delay between lodgement and grant.
2 Visas granted
First Working Holiday (subclass 417) visa programme
A total of 92,374 first Working Holiday visas were granted in the six months to 31 December 2014, a 10.9 per cent reduction compared to the corresponding period in 2013-14.
This may signal a continued natural tapering of the very strong growth in grant numbers in the four years to 30 June 2013, including a record number of visa application grants under the total WHM visa programme in 2012-13.
Reductions in Working Holiday visa grant numbers may be influenced by a complex range of factors including changing economic conditions and seasonal variability in visa application numbers in partner countries.
The top five countries for first Working Holiday visa grants were: United Kingdom (down 0.9 per cent to 19,239) Germany (down 5.3 per cent to 14,218) France (down 13.2 per cent to 11,603) South Korea (down 19.8 per cent to 9560) Taiwan (down 19.6 per cent to 8193).
BR0110 Working Holiday Maker visa programme report | 31 December 2014 | page 7
Second Working Holiday (subclass 417) visa programme
A total of 22,433 second Working Holiday visas were granted in the six months to 31 December 2014. This is an 8.2 per cent reduction compared to the corresponding period in 2013-14. This is largely the result of a flow-on effect from a reduction in first Working Holiday visa grants in 2013-14.
There is a direct but delayed flow-on relationship between the rate of first Working Holiday visa grants and the rate of second Working Holiday visa grants, which usually takes 12 to 18 months to be reflected in the data. Thus, where there has been an increase or decrease in first Working Holiday visa grants, a similar but delayed trend could be expected to flow through to second Working Holiday visa grants.
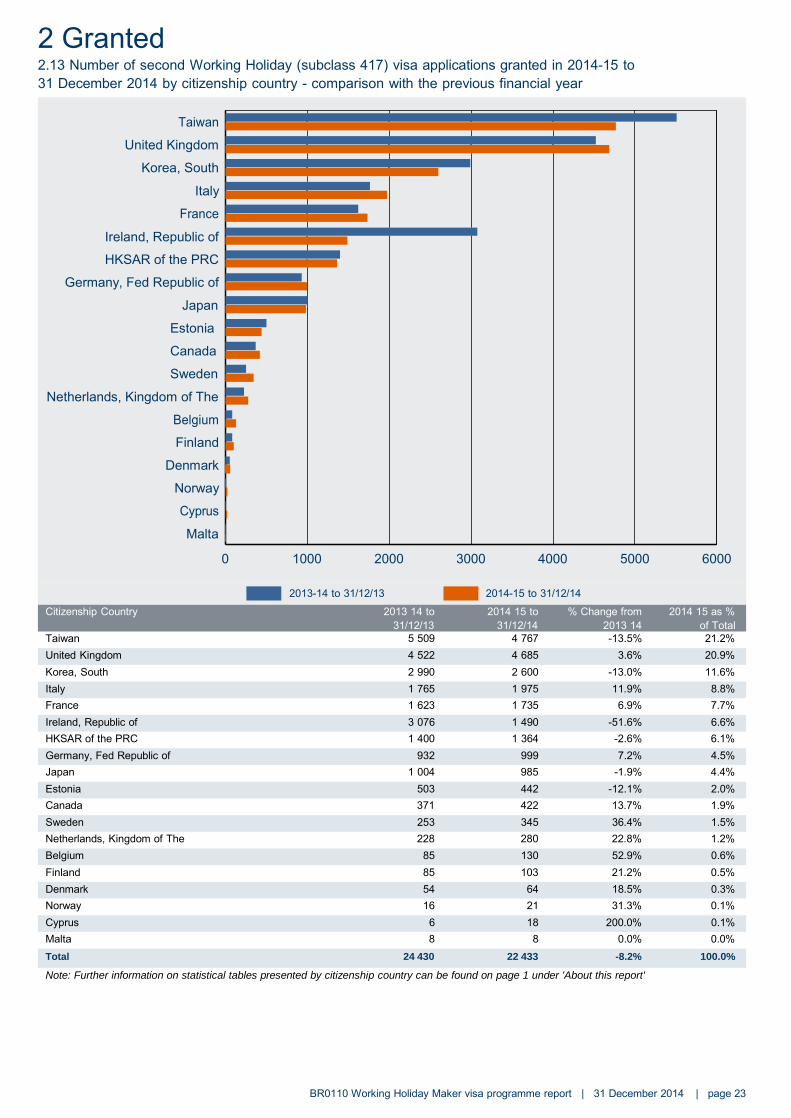
The top five countries for second Working Holiday visa grants were: Taiwan (down 13.5 per cent to 4767) United Kingdom (up 3.6 per cent to 4685) South Korea (down 13 per cent to 2600) Italy (up 11.9 per cent to 1975) France (up 6.9 per cent to 1735).
In the six months to 31 December 2014, around 91 per cent of the second Working Holiday visa applicants indicated they engaged in agricultural work to acquire eligibility, around six per cent undertook construction work, and around one per cent undertook mining work (see Table 2.15). The employment of the remaining participants (approximately 1 per cent) has not been disaggregated.
Combined Working Holiday (subclass 417) visa programme
A total of 114,807 combined Working Holiday (first and second) visas were granted in the six months to 31 December 2014. This is a 10.4 per cent reduction compared to the corresponding period in 2013-14 and is a result of the fall in both first Working Holiday visa and second Working Holiday visa applications granted.

Executive Summary - continued
2 Visas granted – continued
The top five countries for combined first and second Working Holiday visa grants were: United Kingdom (23,924) Germany (down 4.5 per cent to 15,217) France (down 11 per cent to 13,338) Taiwan (down 17.5 per cent to 12,960) South Korea (down 18.4 per cent to 12,160).
Work and Holiday (subclass 462) visa programme
A total of 5,879 Work and Holiday visas were granted in the six months to 31 December 2014. This is an 11.7 per cent increase compared to the corresponding period in 2013-14.
The top five countries for visa grants under the Work and Holiday visa programme were: United States of America (up 8.8 per cent to 4001) Chile (up 17.5 per cent to 538) Argentina (up 77.9 per cent to 500) Thailand (down 9.7 per cent to 371) Poland (130).
The first visas under the new Work and Holiday visa arrangements with Poland and Spain were granted during the period. It is also notable that the cap of 500 visa places for Argentina had already been filled during the first six months of 2014-15, indicating the increasing awareness and popularity of this visa programme as the arrangement with Argentina entered its third year.
3 Grant rates
The grant rate for first Working Holiday visas for the six months to 31 December 2014 was 99.4 per cent, the grant rate for second Working Holiday visas was 96 per cent and the grant rate for Work and Holiday visas was 98.4 per cent.
The grant rates for WHM visas are indicative of the low risk nature of this caseload. The large proportion of online applications for this caseload also contributes to the high grant rate. A number of automated eligibility checks occur during online applications, alerting clients early in the process if they do not meet visa requirements.
4 Working Holiday Makers in Australia
Working Holiday (subclass 417) visa holders
As at 31 December 2014, there were 154,599 Working Holiday visa holders in Australia (first and second visas). This is a 10.7 per cent reduction in the number of Working Holiday visa holders in Australia compared to 31 December 2013.
Work and Holiday (subclass 462) visa holders
As at 31 December 2014, there were 6,342 Work and Holiday visa holders in Australia. This is an eight per cent increase in the number of Work and Holiday visa holders in Australia compared to 31 December 2013.
BR0110 Working Holiday Maker visa programme report | 31 December 2014 | page 8

1 Lodged
BR0110 Working Holiday Maker visa programme report | 31 December 2014 | page 9
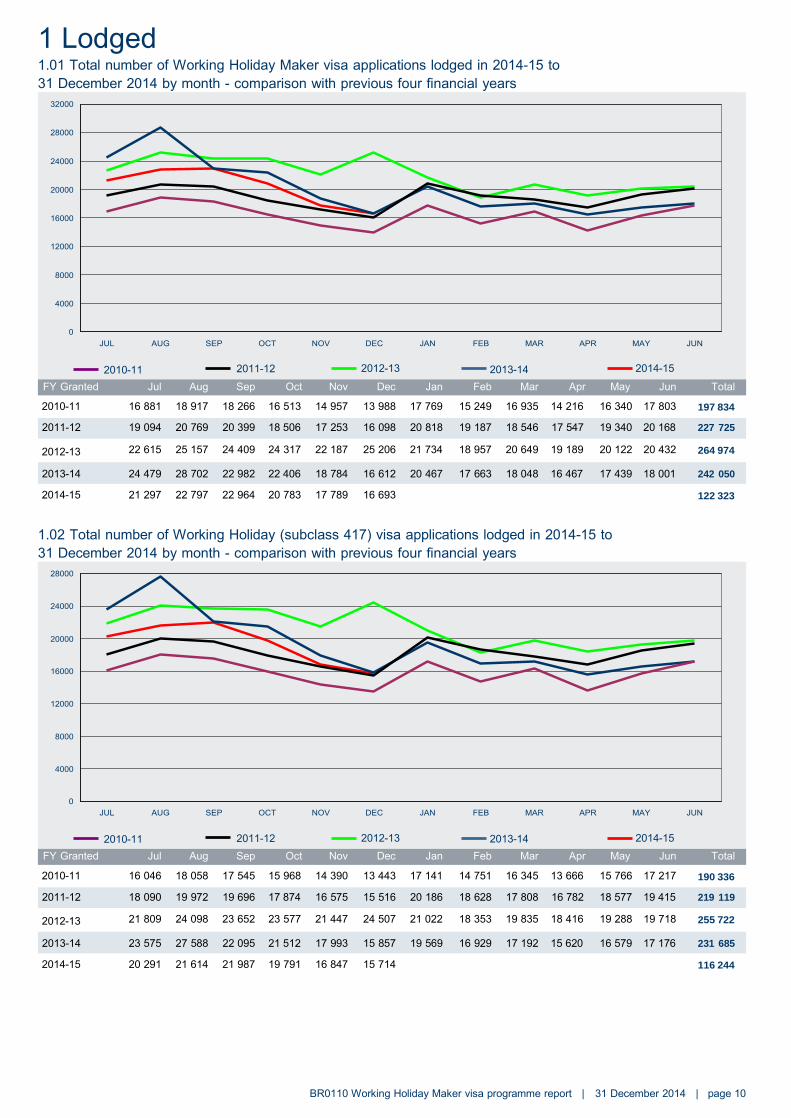
1 Lodged 1.01 Total number of Working Holiday Maker visa applications lodged in 2014-15 to
31 December 2014 by month - comparison with previous four financial years 32000
28000
24000
20000
16000
12000
8000
4000
0 JUL AUG SEP OCT NOV DEC JAN FEB MAR APR MAY JUN
2012-13 2014-15 2010-11 2011-12 2013-14 FY Granted Jul Aug Sep Oct Nov Dec Jan Feb Mar Apr May Jun Total
2010-11 16 881 18 917 18 266 16 513 14 957 13 988 17 769 15 249 16 935 14 216 16 340 17 803 197 834
2011-12 19 094 20 769 20 399 18 506 17 253 16 098 20 818 19 187 18 546 17 547 19 340 20 168 227 725
2012-13 22 615 25 157 24 409 24 317 22 187 25 206 21 734 18 957 20 649 19 189 20 122 20 432 264 974
2013-14 24 479 28 702 22 982 22 406 18 784 16 612 20 467 17 663 18 048 16 467 17 439 18 001 242 050
2014-15 21 297 22 797 22 964 20 783 17 789 16 693 122 323
1.02 Total number of Working Holiday (subclass 417) visa applications lodged in 2014-15 to
31 December 2014 by month - comparison with previous four financial years 28000
24000
20000
16000
12000
8000
4000
0 JUL AUG SEP OCT NOV DEC JAN FEB MAR APR MAY JUN
2012-13 2014-15 2010-11 2011-12 2013-14 FY Granted Jul Aug Sep Oct Nov Dec Jan Feb Mar Apr May Jun Total
2010-11 16 046 18 058 17 545 15 968 14 390 13 443 17 141 14 751 16 345 13 666 15 766 17 217 190 336
2011-12 18 090 19 972 19 696 17 874 16 575 15 516 20 186 18 628 17 808 16 782 18 577 19 415 219 119
2012-13 21 809 24 098 23 652 23 577 21 447 24 507 21 022 18 353 19 835 18 416 19 288 19 718 255 722
2013-14 23 575 27 588 22 095 21 512 17 993 15 857 19 569 16 929 17 192 15 620 16 579 17 176 231 685
2014-15 20 291 21 614 21 987 19 791 16 847 15 714 116 244
BR0110 Working Holiday Maker visa programme report | 31 December 2014 | page 10
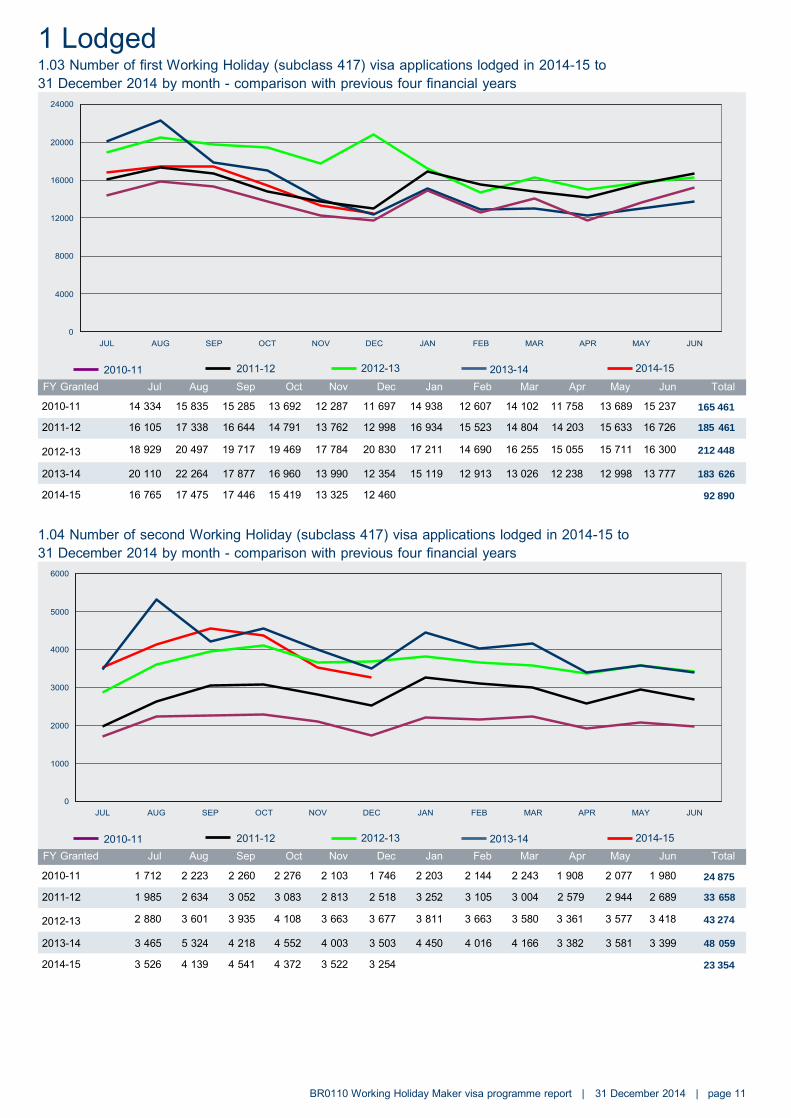
1 Lodged 1.03 Number of first Working Holiday (subclass 417) visa applications lodged in 2014-15 to
31 December 2014 by month - comparison with previous four financial years 24000
20000
16000
12000
8000
4000
0 JUL AUG SEP OCT NOV DEC JAN FEB MAR APR MAY JUN
2012-13 2014-15 2010-11 2011-12 2013-14 FY Granted Jul Aug Sep Oct Nov Dec Jan Feb Mar Apr May Jun Total
2010-11 14 334 15 835 15 285 13 692 12 287 11 697 14 938 12 607 14 102 11 758 13 689 15 237 165 461
2011-12 16 105 17 338 16 644 14 791 13 762 12 998 16 934 15 523 14 804 14 203 15 633 16 726 185 461
2012-13 18 929 20 497 19 717 19 469 17 784 20 830 17 211 14 690 16 255 15 055 15 711 16 300 212 448
2013-14 20 110 22 264 17 877 16 960 13 990 12 354 15 119 12 913 13 026 12 238 12 998 13 777 183 626
2014-15 16 765 17 475 17 446 15 419 13 325 12 460 92 890
1.04 Number of second Working Holiday (subclass 417) visa applications lodged in 2014-15 to
31 December 2014 by month - comparison with previous four financial years 6000
5000
4000
3000
2000
1000
0 JUL AUG SEP OCT NOV DEC JAN FEB MAR APR MAY JUN
2012-13 2014-15 2010-11 2011-12 2013-14 FY Granted
2010-11
Jul
1 712
Aug
2 223
Sep
2 260
Oct
2 276
Nov
2 103
Dec
1 746
Jan
2 203
Feb
2 144
Mar
2 243
Apr
1 908
May
2 077
Jun
1 980
Total
24 875
2011-12 1 985 2 634 3 052 3 083 2 813 2 518 3 252 3 105 3 004 2 579 2 944 2 689 33 658
2012-13 2 880 3 601 3 935 4 108 3 663 3 677 3 811 3 663 3 580 3 361 3 577 3 418 43 274
2013-14 3 465 5 324 4 218 4 552 4 003 3 503 4 450 4 016 4 166 3 382 3 581 3 399 48 059
2014-15 3 526 4 139 4 541 4 372 3 522 3 254 23 354
BR0110 Working Holiday Maker visa programme report | 31 December 2014 | page 11

1 Lodged 1.05 Total number of Work and Holiday (subclass 462) visa applications lodged in 2014-15 to
31 December 2014 by month - comparison with previous four financial years 1200
1000
800
600
400
200
0 JUL AUG SEP OCT NOV DEC JAN FEB MAR APR MAY JUN
2012-13 2014-15 2010-11 2011-12 2013-14 FY Granted
2010-11
Jul
835
Aug
859
Sep
721
Oct
545
Nov
567
Dec
545
Jan
628
Feb
498
Mar
590
Apr
550
May
574
Jun
586
Total
7 498
2011-12 1 004 797 703 632 678 582 632 559 738 765 763 753 8 606
2012-13 806 1 059 757 740 740 699 712 604 814 773 834 714 9 252
2013-14 904 1 114 887 894 791 755 898 734 856 847 860 825 10 365
2014-15 1 006 1 183 977 992 942 979 6 079
1.06 Total number of Working Holiday Maker visa applications lodged in the 6 month period
between 1 July 2014 and 31 December 2014 by visa subclass and visa type - comparison with
previous four periods
Visa Subclass 01/07/12 to
31/12/12
01/01/13 to
30/06/13
01/07/13 to
31/12/13
01/01/14 to
30/06/14
01/07/14 to
31/12/14
417 Working Holiday First visa 117 226 95 222 103 555 80 071 92 890
Second visa 21 864 21 410 25 065 22 994 23 354
All 417 Working Holiday 139 090 116 632 128 620 103 065 116 244
462 Work and Holiday 4 801 4 451 5 345 5 020 6 079
All Working Holiday Maker 143 891 121 083 133 965 108 085 122 323
BR0110 Working Holiday Maker visa programme report | 31 December 2014 | page 12

1 Lodged
1.07 Number of Working Holiday (subclass 417) visa applications lodged in 2014-15 to 31 December 2014 by citizenship country - comparison with same period in previous financial year
BR0110 Working Holiday Maker visa programme report | 31 December 2014 | page 13
United Kingdom Germany, Fed Republic of
France Taiwan
Korea, South Italy
Japan HKSAR of the PRC
Canada Ireland, Republic of
Sweden Netherlands, Kingdom of The
Belgium Estonia Finland
Denmark Norway
Malta Cyprus
Not Specified
0 4000 8000 12000 16000 20000 24000 28000
2013-14 to 31/12/13 2014-15 to 31/12/14
Citizenship Country - 2013 14 to - 2014 15 to % Change from - 2014 15 as % 31/12/13 31/12/14 - 2013 14 of Total
United Kingdom 24 235 24 299 0.3% 20.9%
Germany, Fed Republic of 15 975 15 273 -4.4% 13.1%
France 15 180 13 528 -10.9% 11.6%
Taiwan 15 262 12 846 -15.8% 11.1%
Korea, South 15 052 12 583 -16.4% 10.8%
Italy 9 813 8 649 -11.9% 7.4%
Japan 4 920 4 980 1.2% 4.3%
HKSAR of the PRC 5 913 4 767 -19.4% 4.1%
Canada 4 217 4 309 2.2% 3.7%
Ireland, Republic of 6 576 4 062 -38.2% 3.5%
Sweden 3 847 3 512 -8.7% 3.0%
Netherlands, Kingdom of The 2 583 2 616 1.3% 2.3%
Belgium 1 205 1 286 6.7% 1.1%
Estonia 1 409 1 097 -22.1% 0.9%
Finland 940 1 036 10.2% 0.9%
Denmark 1 050 961 -8.5% 0.8%
Norway 335 316 -5.7% 0.3%
Malta 51 63 23.5% 0.1%
Cyprus 55 47 -14.5% 0.0%
Not Specified < 5 14 600.0% 0.0%
Total 128 620 116 244 -8.7% 100.0%
Note: Further information on statistical tables presented by citizenship country can be found on page 1 under 'About this report'
1 Lodged
BR0110 Working Holiday Maker visa programme report | 31 December 2014 | page 14
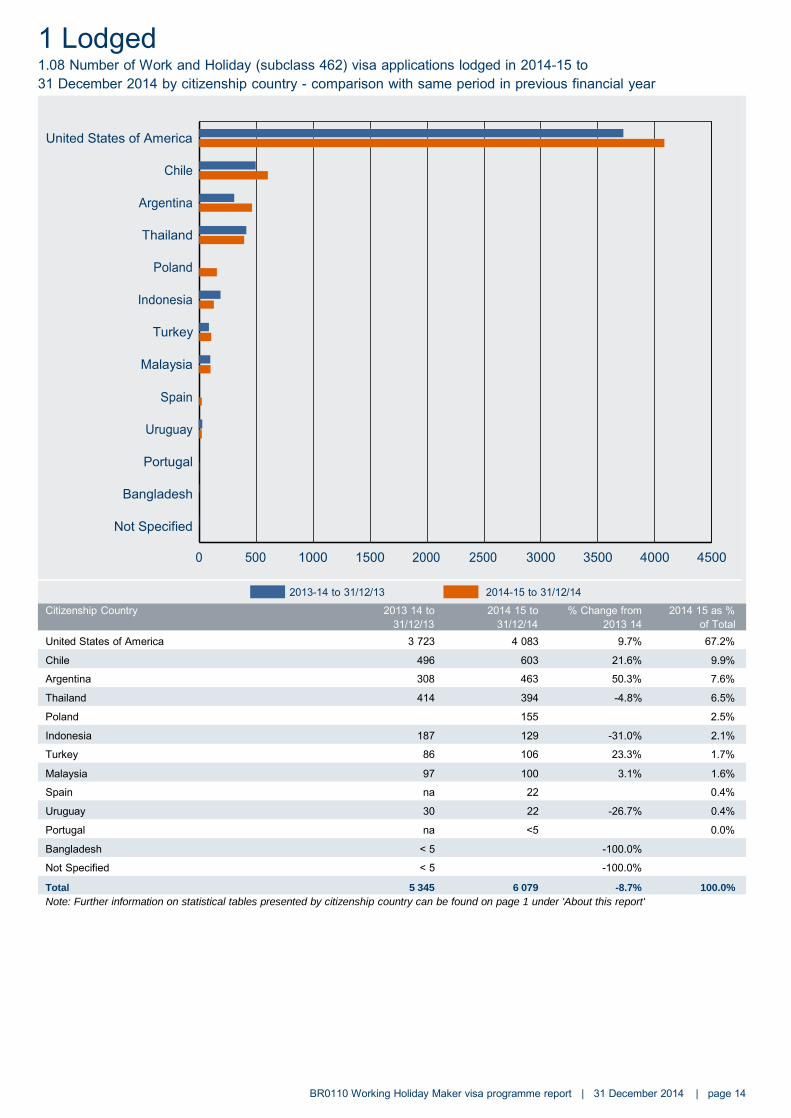
1.08 Number of Work and Holiday (subclass 462) visa applications lodged in 2014-15 to 31 December 2014 by citizenship country - comparison with same period in previous financial year
United States of America
Chile
Argentina
Thailand
Poland
Indonesia
Turkey
Malaysia
Spain
Uruguay
Portugal
Bangladesh
Not Specified
0 500 1000 1500 2000 2500 3000 3500 4000 4500
2013-14 to 31/12/13 2014-15 to 31/12/14
Citizenship Country - 2013 14 to - 2014 15 to % Change from - 2014 15 as % 31/12/13 31/12/14 - 2013 14 of Total
United States of America 3 723 4 083 9.7% 67.2%
Chile 496 603 21.6% 9.9%
Argentina 308 463 50.3% 7.6%
Thailand 414 394 -4.8% 6.5%
Poland 155 2.5%
Indonesia 187 129 -31.0% 2.1%
Turkey 86 106 23.3% 1.7%
Malaysia 97 100 3.1% 1.6%
Spain na 22 0.4%
Uruguay 30 22 -26.7% 0.4%
Portugal na <5 0.0%
Bangladesh < 5 -100.0%
Not Specified < 5 -100.0%
Total 5 345 6 079 -8.7% 100.0%
Note: Further information on statistical tables presented by citizenship country can be found on page 1 under 'About this report'

2 Granted
BR0110 Working Holiday Maker visa programme report | 31 December 2014 | page 15

2 Granted
BR0110 Working Holiday Maker visa programme report | 31 December 2014 | page 16
2.01 Total number of Working Holiday Maker visa applications granted in 2014-15 to 31 December 2014 by month - comparison with previous four financial years
28000
24000
20000
16000
12000
8000
4000
0 JUL AUG SEP OCT NOV DEC JAN FEB MAR APR MAY JUN
2010-11 2011-12 2012-13 2013-14 2014-15
FY Granted Jul Aug Sep Oct Nov Dec Jan Feb Mar Apr May Jun Total
2010-11 16 381 18 202 17 760 16 619 15 006 13 338 17 241 14 312 17 336 13 956 16 069 16 702 192 922
2011-12 18 857 20 583 19 909 18 178 17 568 15 445 19 351 19 130 19 029 16 989 18 728 19 225 222 992
2012-13 21 842 24 118 24 039 23 746 21 777 20 630 24 505 18 462 20 652 18 978 19 771 19 728 258 248
2013-14 23 951 26 159 24 046 22 990 19 626 16 559 20 523 17 290 17 463 16 069 17 498 17 418 239 592
2014-15 20 794 22 030 22 857 20 772 17 357 16 876 120 686
2.02 Total number of Working Holiday (subclass 417) visa applications granted in 2014-15 to 31 December 2014 by month - comparison with previous four financial years
28000
24000
20000
16000
12000
8000
4000
0 JUL
2010-11
AUG SEP OCT
2011-12
NOV DEC
2012-13
JAN FEB MAR
2013-14
APR MAY
2014-15
JUN
FY Granted Jul Aug Sep Oct Nov Dec Jan Feb Mar Apr May Jun Total
2010-11 15 595 17 315 17 107 15 980 14 445 12 789 16 628 13 820 16 779 13 434 15 446 16 142 185 480
2011-12 18 187 19 810 19 134 17 518 16 883 14 864 18 682 18 590 18 304 16 225 17 954 18 493 214 644
2012-13 21 057 23 124 23 326 22 982 21 065 19 952 23 730 17 865 19 950 18 207 18 927 19 046 249 231
2013-14 23 210 25 074 23 039 22 056 18 894 15 797 19 606 16 499 16 641 15 289 16 677 16 596 229 378
2014-15 19 885 20 917 21 812 19 832 16 395 15 966 114 807
2 Granted
BR0110 Working Holiday Maker visa programme report | 31 December 2014 | page 17
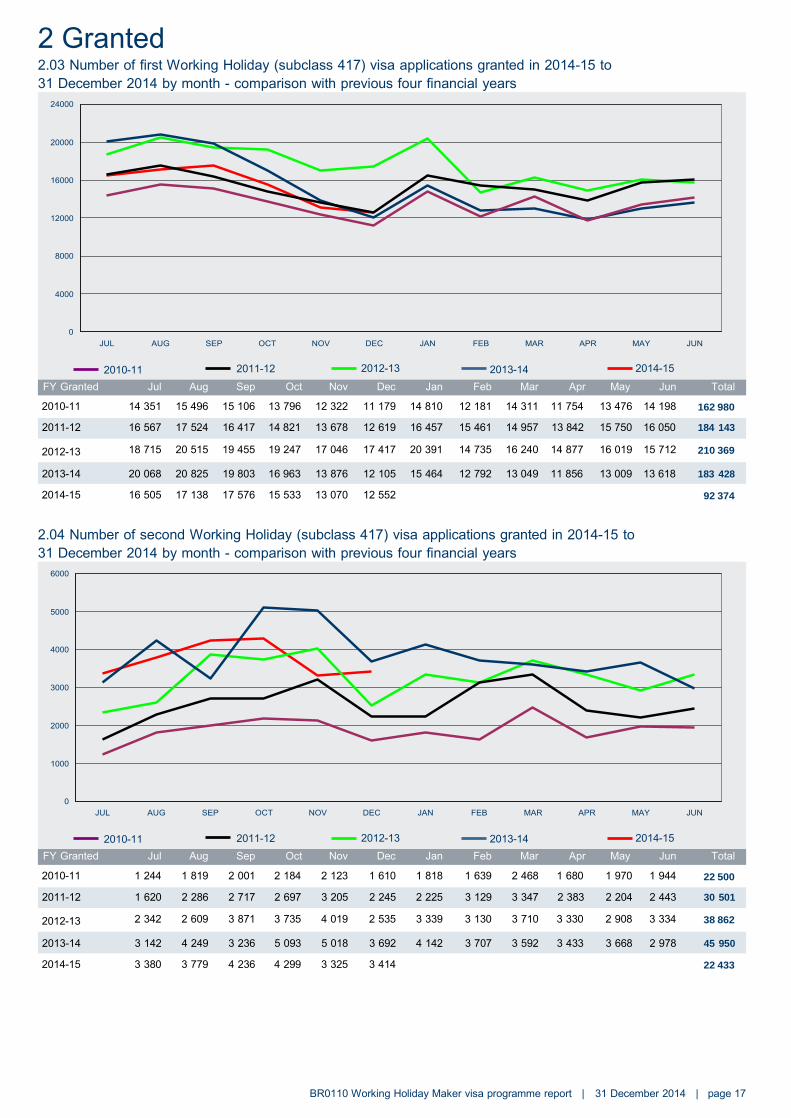
2.03 Number of first Working Holiday (subclass 417) visa applications granted in 2014-15 to 31 December 2014 by month - comparison with previous four financial years
24000
20000
16000
12000
8000
4000
0 JUL AUG SEP OCT NOV DEC JAN FEB MAR APR MAY JUN
2010-11 2011-12 2012-13 2013-14 2014-15
FY Granted Jul Aug Sep Oct Nov Dec Jan Feb Mar Apr May Jun Total
2010-11 14 351 15 496 15 106 13 796 12 322 11 179 14 810 12 181 14 311 11 754 13 476 14 198 162 980
2011-12 16 567 17 524 16 417 14 821 13 678 12 619 16 457 15 461 14 957 13 842 15 750 16 050 184 143
2012-13 18 715 20 515 19 455 19 247 17 046 17 417 20 391 14 735 16 240 14 877 16 019 15 712 210 369
2013-14 20 068 20 825 19 803 16 963 13 876 12 105 15 464 12 792 13 049 11 856 13 009 13 618 183 428
2014-15 16 505 17 138 17 576 15 533 13 070 12 552 92 374
2.04 Number of second Working Holiday (subclass 417) visa applications granted in 2014-15 to 31 December 2014 by month - comparison with previous four financial years
6000
5000
4000
3000
2000
1000
0 JUL AUG SEP OCT NOV DEC JAN FEB MAR APR MAY JUN
2010-11 2011-12 2012-13 2013-14 2014-15
FY Granted
2010-11
Jul
1 244
Aug
1 819
Sep
2 001
Oct
2 184
Nov
2 123
Dec
1 610
Jan
1 818
Feb
1 639
Mar
2 468
Apr
1 680
May
1 970
Jun
1 944
Total
22 500
2011-12 1 620 2 286 2 717 2 697 3 205 2 245 2 225 3 129 3 347 2 383 2 204 2 443 30 501
2012-13 2 342 2 609 3 871 3 735 4 019 2 535 3 339 3 130 3 710 3 330 2 908 3 334 38 862
2013-14 3 142 4 249 3 236 5 093 5 018 3 692 4 142 3 707 3 592 3 433 3 668 2 978 45 950
2014-15 3 380 3 779 4 236 4 299 3 325 3 414 22 433

2 Granted
BR0110 Working Holiday Maker visa programme report | 31 December 2014 | page 18
2.05 Total number of Work and Holiday (subclass 462) visa applications granted in 2014-15 to 31 December 2014 by month - comparison with previous four financial years
1200
1000
800
600
400
200
0 JUL AUG
2010-11
SEP OCT
2011-12
NOV DEC
2012-13
JAN FEB MAR
2013-14
APR MAY
2014-15
JUN
FY Granted
2010-11
Jul
786
Aug
887
Sep
653
Oct
639
Nov
561
Dec
549
Jan
613
Feb
492
Mar
557
Apr
522
May
623
Jun
560
Total
7 442
2011-12 670 773 775 660 685 581 669 540 725 764 774 732 8 348
2012-13 785 994 713 764 712 678 775 597 702 771 844 682 9 017
2013-14 741 1 085 1 007 934 732 762 917 791 822 780 821 822 10 214
2014-15 909 1 113 1 045 940 962 910 5 879
2.06 Total number of Working Holiday Maker visa applications granted in the 6 month period between 1 July 2014 and 31 December 2014 by visa subclass and visa type - comparison with previous four periods
Visa Subclass 01/07/12 to 31/12/12
01/01/13 to 30/06/13
01/07/13 to 31/12/13
01/01/14 to 30/06/14
01/07/14 to 31/12/14
417 Working Holiday First visa 112 395 97 974 103 640 79 788 92 374
Second visa 19 111 19 751 24 430 21 520 22 433
All 417 Working Holiday 131 506 117 725 128 070 101 308 114 807
462 Work and Holiday 4 646 4 371 5 261 4 953 5 879
All Working Holiday Maker 136 152 122 096 133 331 106 261 120 686

2 Granted
2.07 Total number of Working Holiday (subclass 417) visa applications granted in 2014-15 to 31 December 2014 by citizenship country - comparison with the previous four financial years
- 2010 11 to - 2011 12 to - 2012 13 to - 2013 14 to - 2014 15 to % Change from - 2014 15 as a Citizenship Country 31/12/10 31/12/11 31/12/12 31/12/13 31/12/14 - 2013 14 % of Total
United Kingdom 19 866 20 818 24 134 23 928 23 924 0.0% 20.8% Germany, Fed Republic of 10 995 12 149 14 719 15 940 15 217 -4.5% 13.3%
France 10 566 11 092 13 815 14 988 13 338 -11.0% 11.6% Taiwan 6 007 9 112 17 968 15 703 12 960 -17.5% 11.3%
Korea, South 14 002 15 201 16 844 14 907 12 160 -18.4% 10.6% Italy 3 871 5 092 9 078 9 665 8 475 -12.3% 7.4%
Japan 3 342 3 966 4 732 4 859 4 938 1.6% 4.3% HKSAR of the PRC 1 760 2 824 4 666 5 837 4 681 -19.8% 4.1% Canada 4 571 4 550 4 385 4 173 4 232 1.4% 3.7% Ireland, Republic of 8 923 11 928 10 239 6 660 4 074 -38.8% 3.5%
Sweden 2 861 3 292 3 773 3 795 3 478 -8.4% 3.0% Netherlands, Kingdom of The 2 485 2 360 2 636 2 572 2 585 0.5% 2.3%
Belgium 784 818 1 014 1 195 1 274 6.6% 1.1% Estonia 941 1 073 1 375 1 441 1 063 -26.2% 0.9% Finland 672 732 827 925 1 036 12.0% 0.9%
Denmark 765 901 900 1 042 947 -9.1% 0.8% Norway 572 415 283 334 313 -6.3% 0.3%
Malta 62 58 62 51 63 23.5% 0.1% Cyprus 12 15 55 54 49 -9.3% 0.0%
Not Specified 174 < 5 < 5 -100.0%
Total 93 231 106 396 131 506 128 070 114 807 -10.4% 100.0%
Note: Further information on statistical tables presented by citizenship country can be found on page 1 under 'About this report'
2.08 Number of first Working Holiday (subclass 417) visa applications granted in 2014-15 to 31 December 2014 by citizenship country - comparison with the previous four financial years
- 2010 11 to - 2011 12 to - 2012 13 to - 2013 14 to - 2014 15 to % Change from - 2014 15 as a Citizenship Country 31/12/10 31/12/11 31/12/12 31/12/13 31/12/14 - 2013 14 % of Total
United Kingdom 17 474 17 761 20 385 19 406 19 239 -0.9% 20.8% Germany, Fed Republic of 10 360 11 362 13 837 15 008 14 218 -5.3% 15.4%
France 9 779 10 141 12 611 13 365 11 603 -13.2% 12.6% Korea, South 11 613 12 678 14 181 11 917 9 560 -19.8% 10.3%
Taiwan 5 083 7 274 14 921 10 194 8 193 -19.6% 8.9% Italy 3 508 4 561 8 204 7 900 6 500 -17.7% 7.0%
Japan 2 723 3 299 3 894 3 855 3 953 2.5% 4.3% Canada 4 303 4 187 4 058 3 802 3 810 0.2% 4.1% HKSAR of the PRC 1 514 2 346 3 875 4 437 3 317 -25.2% 3.6%
Sweden 2 744 3 135 3 558 3 542 3 133 -11.5% 3.4% Ireland, Republic of 7 317 9 134 6 504 3 584 2 584 -27.9% 2.8%
Netherlands, Kingdom of The 2 389 2 209 2 467 2 344 2 305 -1.7% 2.5% Belgium 737 750 934 1 110 1 144 3.1% 1.2%
Finland 636 687 752 840 933 11.1% 1.0% Denmark 736 854 838 988 883 -10.6% 1.0%
Estonia 705 792 995 938 621 -33.8% 0.7% Norway 563 392 272 318 292 -8.2% 0.3%
Malta 55 51 53 43 55 27.9% 0.1% Cyprus 11 13 55 48 31 -35.4% 0.0%
Not Specified < 5 < 5 -100.0%
Total 82 250 91 626 112 395 103 640 92 374 -10.9% 100.0%
Note: Further information on statistical tables presented by citizenship country can be found on page 1 under 'About this report'
BR0110 Working Holiday Maker visa programme report | 31 December 2014 | page 19

2 Granted
2.09 Number of second Working Holiday (subclass 417) visa applications granted in 2014-15 to 31 December 2014 by citizenship country - comparison with the previous four financial years
- 2010 11 to - 2011 12 to - 2012 13 to - 2013 14 to - 2014 15 to % Change from - 2014 15 as a Citizenship Country 31/12/10 31/12/11 31/12/12 31/12/13 31/12/14 - 2013 14 % of Total
Taiwan 924 1 838 3 047 5 509 4 767 -13.5% 21.2% United Kingdom 2 392 3 057 3 749 4 522 4 685 3.6% 20.9% Korea, South 2 389 2 523 2 663 2 990 2 600 -13.0% 11.6%
Italy 363 531 874 1 765 1 975 11.9% 8.8% France 787 951 1 204 1 623 1 735 6.9% 7.7% Ireland, Republic of 1 606 2 794 3 735 3 076 1 490 -51.6% 6.6% HKSAR of the PRC 246 478 791 1 400 1 364 -2.6% 6.1%
Germany, Fed Republic of 635 787 882 932 999 7.2% 4.5% Japan 619 667 838 1 004 985 -1.9% 4.4%
Estonia 236 281 380 503 442 -12.1% 2.0% Canada 268 363 327 371 422 13.7% 1.9%
Sweden 117 157 215 253 345 36.4% 1.5% Netherlands, Kingdom of The 96 151 169 228 280 22.8% 1.2%
Belgium 47 68 80 85 130 52.9% 0.6% Finland 36 45 75 85 103 21.2% 0.5%
Denmark 29 47 62 54 64 18.5% 0.3% Norway 9 23 11 16 21 31.3% 0.1% Cyprus < 5 < 5 6 18 200.0% 0.1%
Malta 7 7 9 8 8 0.0% 0.0% Not Specified 174
Total 10 981 14 770 19 111 24 430 22 433 -8.2% 100.0%
Note: Further information on statistical tables presented by citizenship country can be found on page 1 under 'About this report'
2.10 Number of Work and Holiday (subclass 462) visa applications granted in 2014-15 to 31 December 2014 by citizenship country - comparison with the previous four financial years
- 2010 11 to - 2011 12 to - 2012 13 to - 2013 14 to - 2014 15 to % Change from - 2014 15 as a Citizenship Country 31/12/10 31/12/11 31/12/12 31/12/13 31/12/14 - 2013 14 % of Total
United States of America 3 167 3 330 3 487 3 677 4 001 8.8% 68.1%
Chile 248 311 381 458 538 17.5% 9.2% Argentina na na 240 281 500 77.9% 8.5%
Thailand 485 302 389 411 371 -9.7% 6.3%
Poland 130 2.2% Indonesia 66 95 210 118 -43.8% 2.0%
Malaysia 100 100 100 92 100 8.7% 1.7%
Turkey < 5 < 5 41 97 91 -6.2% 1.5% Uruguay na na na 27 25 -7.4% 0.4%
Spain na na na na < 5 0.1%
Iran 8 < 5 na na na Bangladesh 7 8 -100.0%
Not Specified < 5 < 5 0.0%
Total 4 075 4 144 4 646 5 261 5 879 11.7% 100.0%
Note: Further information on statistical tables presented by citizenship country can be found on page 1 under 'About this report'
BR0110 Working Holiday Maker visa programme report | 31 December 2014 | page 20

2 Granted
2.11 Total number of Working Holiday (subclass 417) visa applications granted in 2014-15 to 31 December 2014 by citizenship country - comparison with the previous financial year
BR0110 Working Holiday Maker visa programme report | 31 December 2014 | page 21
United Kingdom Germany, Fed Republic of
France Taiwan
Korea, South Italy
Japan HKSAR of the PRC
Canada Ireland, Republic of
Sweden Netherlands, Kingdom of The
Belgium Estonia Finland
Denmark Norway
Malta Cyprus
Not Specified
0 4000 8000 12000 16000 20000 24000
2013-14 to 31/12/13 2014-15 to 31/12/14
Citizenship Country - 2013 14 to - 2014 15 to % Change from - 2014 15 as % 31/12/13 31/12/14 - 2013 14 of Total
United Kingdom 23 928 23 924 0.0% 20.8% Germany, Fed Republic of 15 940 15 217 -4.5% 13.3%
France 14 988 13 338 -11.0% 11.6% Taiwan 15 703 12 960 -17.5% 11.3%
Korea, South 14 907 12 160 -18.4% 10.6% Italy 9 665 8 475 -12.3% 7.4%
Japan 4 859 4 938 1.6% 4.3% HKSAR of the PRC 5 837 4 681 -19.8% 4.1% Canada 4 173 4 232 1.4% 3.7% Ireland, Republic of 6 660 4 074 -38.8% 3.5%
Sweden 3 795 3 478 -8.4% 3.0% Netherlands, Kingdom of The 2 572 2 585 0.5% 2.3%
Belgium 1 195 1 274 6.6% 1.1% Estonia 1 441 1 063 -26.2% 0.9% Finland 925 1 036 12.0% 0.9%
Denmark 1 042 947 -9.1% 0.8% Norway 334 313 -6.3% 0.3%
Malta 51 63 23.5% 0.1% Cyprus 54 49 -9.3% 0.0%
Not Specified < 5 -100.0% Total 128 070 114 807 -10.4% 100.0%
Note: Further information on statistical tables presented by citizenship country can be found on page 1 under 'About this report'

2 Granted
2.12 Number of first Working Holiday (subclass 417) visa applications granted in 2014-15 to 31 December 2014 by citizenship country - comparison with the previous financial year
United Kingdom
Germany, Fed Republic of France
Korea, South
Taiwan
Italy
Japan
Canada
HKSAR of the PRC
Sweden
Ireland, Republic of Netherlands, Kingdom of The
Belgium
Finland
Denmark
Estonia
Norway
Malta
Cyprus
Not Specified
0 4000 8000 12000 16000 20000
2013-14 to 31/12/13 2014-15 to 31/12/14
Citizenship Country - 2013 14 to - 2014 15 to % Change from - 2014 15 as % 31/12/13 31/12/14 - 2013 14 of Total
United Kingdom 19 406 19 239 -0.9% 20.8% Germany, Fed Republic of 15 008 14 218 -5.3% 15.4%
France 13 365 11 603 -13.2% 12.6% Korea, South 11 917 9 560 -19.8% 10.3%
Taiwan 10 194 8 193 -19.6% 8.9% Italy 7 900 6 500 -17.7% 7.0%
Japan 3 855 3 953 2.5% 4.3% Canada 3 802 3 810 0.2% 4.1% HKSAR of the PRC 4 437 3 317 -25.2% 3.6%
Sweden 3 542 3 133 -11.5% 3.4% Ireland, Republic of 3 584 2 584 -27.9% 2.8%
Netherlands, Kingdom of The 2 344 2 305 -1.7% 2.5% Belgium 1 110 1 144 3.1% 1.2%
Finland 840 933 11.1% 1.0% Denmark 988 883 -10.6% 1.0%
Estonia 938 621 -33.8% 0.7% Norway 318 292 -8.2% 0.3%
Malta 43 55 27.9% 0.1% Cyprus 48 31 -35.4% 0.0%
Not Specified < 5 -100.0% Total 103 640 92 374 -10.9% 100.0%
Note: Further information on statistical tables presented by citizenship country can be found on page 1 under 'About this report'
BR0110 Working Holiday Maker visa programme report | 31 December 2014 | page 22
2 Granted
2.13 Number of second Working Holiday (subclass 417) visa applications granted in 2014-15 to 31 December 2014 by citizenship country - comparison with the previous financial year
BR0110 Working Holiday Maker visa programme report | 31 December 2014 | page 23
Taiwan
United Kingdom
Korea, South
Italy
France
Ireland, Republic of
HKSAR of the PRC
Germany, Fed Republic of
Japan
Estonia
Canada
Sweden
Netherlands, Kingdom of The
Belgium
Finland
Denmark
Norway
Cyprus
Malta
0 1000 2000 3000 4000 5000 6000
2013-14 to 31/12/13 2014-15 to 31/12/14
Citizenship Country - 2013 14 to - 2014 15 to % Change from - 2014 15 as % 31/12/13 31/12/14 - 2013 14 of Total
Taiwan 5 509 4 767 -13.5% 21.2% United Kingdom 4 522 4 685 3.6% 20.9% Korea, South 2 990 2 600 -13.0% 11.6%
Italy 1 765 1 975 11.9% 8.8% France 1 623 1 735 6.9% 7.7% Ireland, Republic of 3 076 1 490 -51.6% 6.6% HKSAR of the PRC 1 400 1 364 -2.6% 6.1%
Germany, Fed Republic of 932 999 7.2% 4.5% Japan 1 004 985 -1.9% 4.4%
Estonia 503 442 -12.1% 2.0% Canada 371 422 13.7% 1.9%
Sweden 253 345 36.4% 1.5% Netherlands, Kingdom of The 228 280 22.8% 1.2%
Belgium 85 130 52.9% 0.6% Finland 85 103 21.2% 0.5%
Denmark 54 64 18.5% 0.3% Norway 16 21 31.3% 0.1% Cyprus 6 18 200.0% 0.1%
Malta 8 8 0.0% 0.0% Total 24 430 22 433 -8.2% 100.0%
Note: Further information on statistical tables presented by citizenship country can be found on page 1 under 'About this report'

2 Granted
2.14 Number of Work and Holiday (subclass 462) visa applications granted in 2014-15 to 31 December 2014 by citizenship country - comparison with the previous financial year
United States of America
Chile
Argentina
Thailand
Poland
Indonesia
Malaysia
Turkey
Uruguay
Spain
Bangladesh
Not Specified
0 500 1000 1500 2000 2500 3000 3500 4000 4500
2013-14 to 31/12/13 2014-15 to 31/12/14
Citizenship Country - 2013 14 to - 2014 15 to % Change from - 2014 15 as % 31/12/13 31/12/14 - 2013 14 of Total
United States of America 3 677 4 001 8.8% 68.1% Chile 458 538 17.5% 9.2%
Argentina 281 500 77.9% 8.5% Thailand 411 371 -9.7% 6.3%
Poland 130 2.2% Indonesia 210 118 -43.8% 2.0%
Malaysia 92 100 8.7% 1.7% Turkey 97 91 -6.2% 1.5%
Uruguay 27 25 -7.4% 0.4% Spain na < 5 0.1%
Bangladesh 8 -100.0% Not Specified < 5 0.0%
Total 5 261 5 879 11.7% 100.0%
Note: Further information on statistical tables presented by citizenship country can be found on page 1 under 'About this report'
BR0110 Working Holiday Maker visa programme report | 31 December 2014 | page 24

2 Granted
2.15 Second Working Holiday (subclass 417) visa applications granted in 2014-15 to 31 December 2014 by employer industry
BR0110 Working Holiday Maker visa programme report | 31 December 2014 | page 25
24000
20000
16000
12000
8000
4000
0
20,501
1,443 168 321
Agriculture, Forestry Construction Mining Not Classified and Fishing

BR0110 Working Holiday Maker visa programme report | 31 December 2014 | page 26
3 Grant Rate For this section, grant rates have been shown.
A grant rate is defined as:
Number of grants x 100
Number of decisions
where the number of decisions equals the number of grants plus the number of refusals.
BR0110 Working Holiday Maker visa programme report | 31 December 2014 | page 27

3 Grant rate
3.01 Grant rate of Working Holiday Maker visa applications decided in the 6 month period between 1 July 2014 and 31 December 2014 by visa type and visa subclass - comparison with previous four periods
Visa Subclass 01/07/12 to 01/01/13 to 01/07/13 to 01/01/14 to 01/07/14 to 31/12/12 30/06/13 31/12/13 30/06/14 31/12/14
417 Working Holiday First visa 99.5% 99.2% 99.4% 99.3% 99.4%
Second visa 95.1% 94.5% 94.8% 94.9% 96.0%
All 417 Working Holiday 98.8% 98.4% 98.5% 98.3% 98.7%
462 Work and Holiday Standard 99.2% 99.0% 99.1% 99.4% 98.4%
All Working Holiday Maker 98.9% 98.4% 98.5% 98.4% 98.7%
BR0110 Working Holiday Maker visa programme report | 31 December 2014 | page 28
3 Grant rate
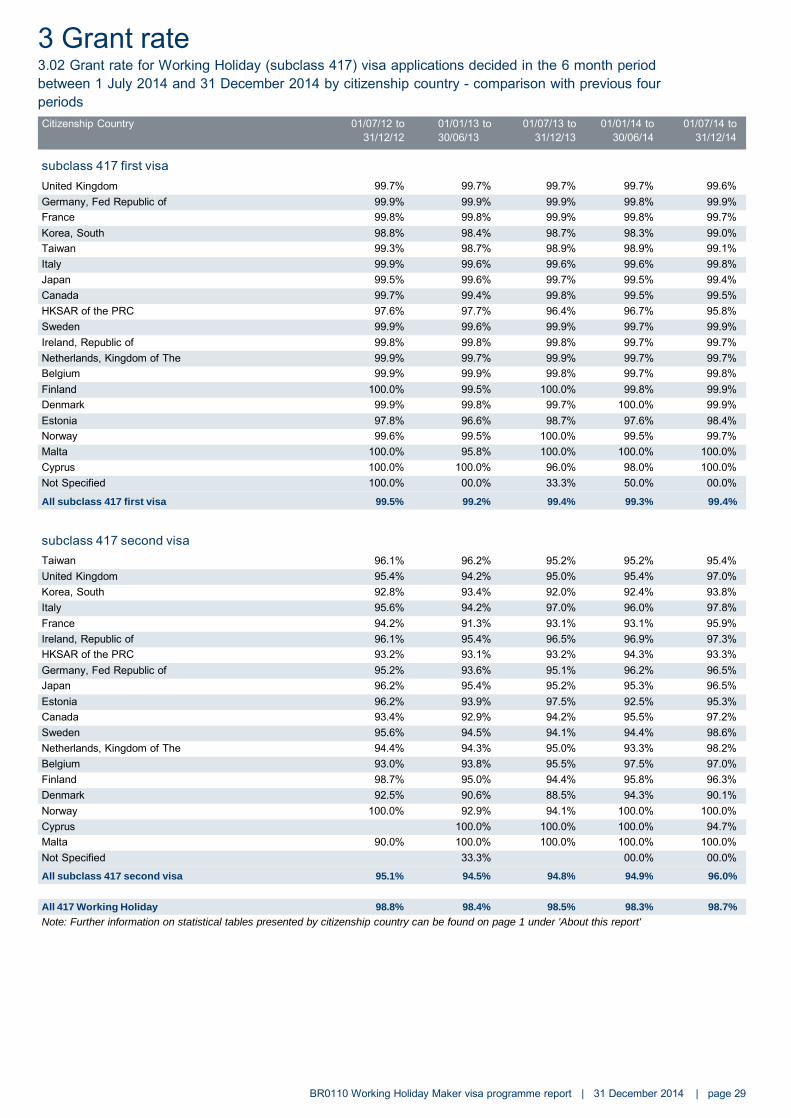
3.02 Grant rate for Working Holiday (subclass 417) visa applications decided in the 6 month period between 1 July 2014 and 31 December 2014 by citizenship country - comparison with previous four periods
Citizenship Country 01/07/12 to 01/01/13 to 01/07/13 to 01/01/14 to 01/07/14 to 31/12/12 30/06/13 31/12/13 30/06/14 31/12/14
subclass 417 first visa United Kingdom 99.7% 99.7% 99.7% 99.7% 99.6%
Germany, Fed Republic of 99.9% 99.9% 99.9% 99.8% 99.9% France 99.8% 99.8% 99.9% 99.8% 99.7% Korea, South 98.8% 98.4% 98.7% 98.3% 99.0%
Taiwan 99.3% 98.7% 98.9% 98.9% 99.1% Italy 99.9% 99.6% 99.6% 99.6% 99.8%
Japan 99.5% 99.6% 99.7% 99.5% 99.4% Canada 99.7% 99.4% 99.8% 99.5% 99.5% HKSAR of the PRC 97.6% 97.7% 96.4% 96.7% 95.8%
Sweden 99.9% 99.6% 99.9% 99.7% 99.9% Ireland, Republic of 99.8% 99.8% 99.8% 99.7% 99.7%
Netherlands, Kingdom of The 99.9% 99.7% 99.9% 99.7% 99.7% Belgium 99.9% 99.9% 99.8% 99.7% 99.8%
Finland 100.0% 99.5% 100.0% 99.8% 99.9% Denmark 99.9% 99.8% 99.7% 100.0% 99.9%
Estonia 97.8% 96.6% 98.7% 97.6% 98.4% Norway 99.6% 99.5% 100.0% 99.5% 99.7%
Malta 100.0% 95.8% 100.0% 100.0% 100.0% Cyprus 100.0% 100.0% 96.0% 98.0% 100.0%
Not Specified 100.0% 00.0% 33.3% 50.0% 00.0%
All subclass 417 first visa 99.5% 99.2% 99.4% 99.3% 99.4%
subclass 417 second visa Taiwan 96.1% 96.2% 95.2% 95.2% 95.4%
United Kingdom 95.4% 94.2% 95.0% 95.4% 97.0% Korea, South 92.8% 93.4% 92.0% 92.4% 93.8%
Italy 95.6% 94.2% 97.0% 96.0% 97.8% France 94.2% 91.3% 93.1% 93.1% 95.9% Ireland, Republic of 96.1% 95.4% 96.5% 96.9% 97.3% HKSAR of the PRC 93.2% 93.1% 93.2% 94.3% 93.3%
Germany, Fed Republic of 95.2% 93.6% 95.1% 96.2% 96.5% Japan 96.2% 95.4% 95.2% 95.3% 96.5%
Estonia 96.2% 93.9% 97.5% 92.5% 95.3% Canada 93.4% 92.9% 94.2% 95.5% 97.2%
Sweden 95.6% 94.5% 94.1% 94.4% 98.6% Netherlands, Kingdom of The 94.4% 94.3% 95.0% 93.3% 98.2%
Belgium 93.0% 93.8% 95.5% 97.5% 97.0% Finland 98.7% 95.0% 94.4% 95.8% 96.3%
Denmark 92.5% 90.6% 88.5% 94.3% 90.1% Norway 100.0% 92.9% 94.1% 100.0% 100.0% Cyprus 100.0% 100.0% 100.0% 94.7%
Malta 90.0% 100.0% 100.0% 100.0% 100.0% Not Specified 33.3% 00.0% 00.0%
All subclass 417 second visa 95.1% 94.5% 94.8% 94.9% 96.0%
All 417 Working Holiday 98.8% 98.4% 98.5% 98.3% 98.7%
Note: Further information on statistical tables presented by citizenship country can be found on page 1 under 'About this report'
BR0110 Working Holiday Maker visa programme report | 31 December 2014 | page 29
3 Grant rate
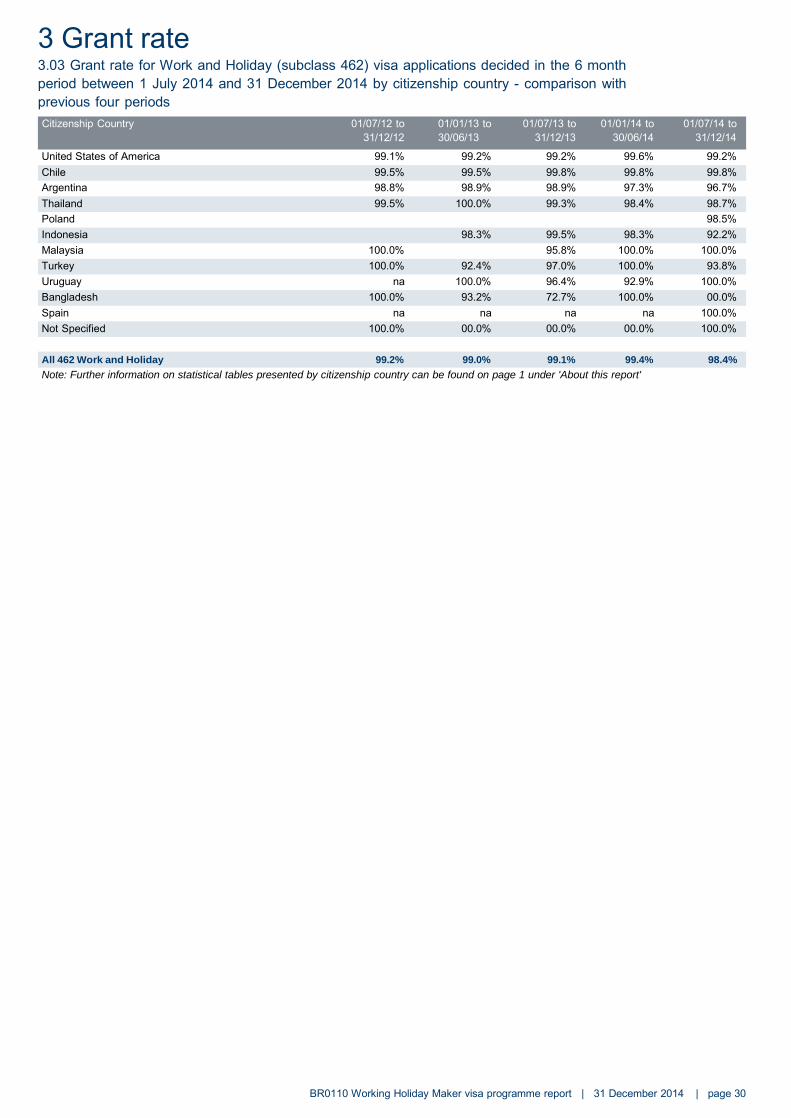
3.03 Grant rate for Work and Holiday (subclass 462) visa applications decided in the 6 month period between 1 July 2014 and 31 December 2014 by citizenship country - comparison with previous four periods
Citizenship Country 01/07/12 to 01/01/13 to 01/07/13 to 01/01/14 to 01/07/14 to 31/12/12 30/06/13 31/12/13 30/06/14 31/12/14
United States of America 99.1% 99.2% 99.2% 99.6% 99.2% Chile 99.5% 99.5% 99.8% 99.8% 99.8%
Argentina 98.8% 98.9% 98.9% 97.3% 96.7% Thailand 99.5% 100.0% 99.3% 98.4% 98.7%
Poland 98.5% Indonesia 98.3% 99.5% 98.3% 92.2%
Malaysia 100.0% 95.8% 100.0% 100.0% Turkey 100.0% 92.4% 97.0% 100.0% 93.8%
Uruguay na 100.0% 96.4% 92.9% 100.0% Bangladesh 100.0% 93.2% 72.7% 100.0% 00.0%
Spain na na na na 100.0% Not Specified 100.0% 00.0% 00.0% 00.0% 100.0%
All 462 Work and Holiday 99.2% 99.0% 99.1% 99.4% 98.4%
Note: Further information on statistical tables presented by citizenship country can be found on page 1 under 'About this report'
BR0110 Working Holiday Maker visa programme report | 31 December 2014 | page 30

4 Visa Holders in Australia
BR0110 Working Holiday Maker visa programme report | 31 December 2014 | page 31

4 Visa holders in Australia
4.01 Total number of Working Holiday (subclass 417) visa holders in Australia as at 31 December 2014 by citizenship country - comparison with the same date in the previous year
United Kingdom Taiwan
Germany, Fed Republic of Korea, South
France Italy
HKSAR of the PRC Japan
Ireland, Republic of Canada
Sweden
Netherlands, Kingdom of The Estonia Belgium Finland
Denmark Norway
Malta Cyprus
Not Specified
0 4000 8000 12000 16000 20000 24000 28000 32000
as at 31/12/13 as at 31/12/14
Citizenship Country
United Kingdom
31/12/13
30 880
31/12/14
30 315
% Change from
31/12/13 -1.8%
31/12/14 as %
of Total 19.6%
Taiwan 28 572 23 270 -18.6% 15.1% Germany, Fed Republic of 19 278 18 286 -5.1% 11.8%
Korea, South 23 059 17 735 -23.1% 11.5% France 16 680 15 680 -6.0% 10.1%
Italy 11 780 10 905 -7.4% 7.1% HKSAR of the PRC 9 331 8 588 -8.0% 5.6%
Japan 7 575 8 093 6.8% 5.2% Ireland, Republic of 10 104 6 121 -39.4% 4.0% Canada 4 253 4 260 0.2% 2.8%
Sweden 3 562 3 385 -5.0% 2.2% Netherlands, Kingdom of The 2 710 2 715 0.2% 1.8%
Estonia 1 816 1 486 -18.2% 1.0% Belgium 1 262 1 368 8.4% 0.9%
Finland 904 1 073 18.7% 0.7% Denmark 926 910 -1.7% 0.6%
Norway 290 271 -6.6% 0.2% Malta 53 75 41.5% 0.0%
Cyprus 71 63 -11.3% 0.0% Not Specified < 5 -100.0%
Total 173 108 154 599 -10.7% 100.0%
Note: Further information on statistical tables presented by citizenship country can be found on page 1 under 'About this report'
BR0110 Working Holiday Maker visa programme report | 31 December 2014 | page 32

4 Visa holders in Australia
4.02 Total number of Work and Holiday (subclass 462) visa holders in Australia as at 31 December 2014 by citizenship country - comparison with the same date in the previous year
United States of America
Chile
Argentina
Thailand
Indonesia
Turkey
Malaysia
Bangladesh
Poland
Uruguay
0 500 1000 1500 2000 2500 3000 3500 4000 4500
as at 31/12/13 as at 31/12/14
Citizenship Country
United States of America
31/12/13
3 959
31/12/14
4 133
% Change from
31/12/13 4.4%
31/12/14 as %
of Total 65.2%
Chile 593 765 29.0% 12.1% Argentina 393 489 24.4% 7.7%
Thailand 432 380 -12.0% 6.0% Indonesia 244 305 25.0% 4.8%
Turkey 113 77 -31.9% 1.2% Malaysia 73 64 -12.3% 1.0%
Bangladesh 50 51 2.0% 0.8% Poland 49 0.8%
Uruguay 17 29 70.6% 0.5%
Total 5 874 6 342 8.0% 100.0%
Note: Further information on statistical tables presented by citizenship country can be found on page 1 under 'About this report'
BR0110 Working Holiday Maker visa programme report | 31 December 2014 | page 33

4 Visa holders in Australia
4.03 Working Holiday Maker visa holders in Australia at 31 December 2014 by visa type and visa subclass - comparison with previous four periods
Visa Subclass 31/12/12 30/06/13 31/12/13 30/06/14 31/12/14
417 Working Holiday
First visa 130 745 123 160 138 301 107 377 117 511
Second visa 26 821 32 165 34 807 37 817 37 088
All 417 Working Holiday 157 566 155 325 173 108 145 194 154 599
462 Work and Holiday 4 909 5 178 5 874 6 007 6 342
All Working Holiday Maker 162 475 160 503 178 982 151 201 160 941
BR0110 Working Holiday Maker visa programme report | 31 December 2014 | page 34

BR0110 Working Holiday Maker visa programme report | 31 December 2014 | page 35