Embed Size (px)
Citation preview
8
Mark Bryan University of Sheffield
No. 2015-21
December 2015
Working Hours, Work Identity and Subjective
Wellbeing
Alita Nandi Institute for Social and Economic Research
University of Essex
ISE
R W
ork
ing P
aper S
erie
s
ww
w.is
er.e
sse
x.a
c.u
k
Non-technical summary
Does working long hours reduce our sense of wellbeing? We expect the answer to be yes, but
this is not clearly established by existing evidence from different countries including the UK,
Australia and Germany. Some researchers have pointed out that it is not work hours that
reduce our wellbeing but divergence from the hours we prefer to work. But this raises the
question of what explains differences in workers’ preferences? One of the reasons we suggest
is work identity, that is, how important their occupation is to their sense of who they are.
Identity theories that have been developed by social psychologists since 1950s (and recently
incorporated into economics) explain how identity formation is the result of a development
process and that it involves adherence to behavioural norms. They predict individuals with
stronger identities to have higher levels of wellbeing due to their higher levels of self-esteem
and also when they behave according to their identity (behaviour) norm. For example, the
behaviour norm for a person with a strong work identity is being very dedicated to their
work. As such, they are expected to experience greater wellbeing when working long hours
than would a person with a weaker work identity.
We test these ideas using data on working age employees from Understanding Society, a
nationally representative sample of UK residents. The data include new measures of peoples’
sense of identity as well as a range of wellbeing measures that capture both how people
evaluate their lives and the feelings they experience: job satisfaction, life satisfaction, job-
related anxiety and depression.
We find that identity and work hours interact to determine wellbeing in three main ways:
For a given level of hours, having a stronger work identity is associated with higher
wellbeing – consistent with predictions from social psychology that the achievement of
identity and its verification in a social role (in this case that of a worker) leads to higher
self-esteem that is reflected in greater subjective wellbeing.
Working long hours is associated with lower wellbeing and working part-time is
associated with higher wellbeing but these effects are not always visible because people
tend to select jobs with work hours that match their identities. Thus someone with a weak
work identity will avoid a long-hours job that would be harmful to their wellbeing. Once
we control for this selection mechanism, the relationships between hours and wellbeing
emerge more clearly.
Work identity can mitigate (but not generally eliminate) the adverse effects of working
long hours. Women working long hours who have a strong work identity report less job-
related anxiety and higher job satisfaction than similar women (working long hours) who
have a weak work identity, and for men we see a similar effect on their life satisfaction.
The findings confirm that a person’s sense of identity plays a key role in determining their
wellbeing, both directly and via the type of job they do. The sizes of the effects are often
substantial when benchmarked against the wellbeing effect of good versus poor health. For
instance, long hours are associated with about the same increase in job-related anxiety as the
health effect, part-time work among women is associated with an increase in job satisfaction
that is half the health effect, and the difference in job satisfaction between the two ends of the
identity scale is nearly four times the health effect.
Working Hours, Work Identity and Subjective Wellbeing
Mark L. Bryan Alita Nandi
(University of Sheffield) (ISER, University of Essex)
30 November 2015
Abstract
Following theories of social and economic identity, we use representative data containing
measures of personal identity to investigate the interplay of work identity and hours of work
in determining subjective wellbeing (job satisfaction, job-related anxiety and depression, and
life satisfaction). We find that for a given level of hours, having a stronger work identity is
associated with higher wellbeing on most measures. Working long hours is associated with
lower wellbeing and working part-time is associated with higher wellbeing, but for men hours
mainly affect their job-related anxiety and depression rather than reported satisfaction. The
relationships between hours and wellbeing are generally strengthened when controlling for
identity implying that individuals sort into jobs with work hours that match their identities.
Work identity partially mitigates the adverse effects of long hours working on job satisfaction
and anxiety (for women) and on life satisfaction (for men). The effects of both work hours
and identity are substantial relative to benchmark effects of health on wellbeing.
Keywords: identity, wellbeing, working hours, job satisfaction, anxiety, depression
JEL codes: J22, J28, J29, I31
Acknowledgements
This research was supported by funding from the UK Economic and Social Research Council
for the Research Centre on Micro-Social Change at ISER, University of Essex. For
assistance, comments and suggestions, we thank seminar and conference participants at the
University of Essex, University of Sheffield, WPEG Conference 2015, 2015 European
Society for Population Economics Annual Conference and Understanding Society Scientific
Conference 2015.
Correspondence
Bryan: Department of Economics, University of Sheffield, 9 Mappin Street, Sheffield, S1
4DTUK. Email: [email protected]
Nandi: Institute for Social and Economic Research, University of Essex, Wivenhoe Park,
Colchester CO4 3SQ, UK. Email: [email protected]
1
1. Introduction
Work remains a central part of people’s life experiences: despite predictions, dating back to
at least Keynes (1930), that working hours would fall to as little as 15 hours per week by the
early 21st century (Dower 1965; Kahn and Wiener 1967), the average working week in the
UK is currently 32 hours and only 8% of the employed work 15 hours or less (ONS 2014). At
the same time increasing shares of the population have been drawn into the workforce, with a
secular rise in women’s employment and, more recently, employment among older workers
(Engelhardt et al 2008, Figure 3; Hotopp 2005, Figure 1). What has arguably changed over
the last few decades is that while average working hours have remained fairly stable, there
has been a trend towards more diverse work schedules, with an increase in both part-time
jobs and, at least until the late 90s, also long-hours working (Green 2008).
The increasing diversity of work schedules has stimulated interest in the effect of non-
standard working time on individuals’ wellbeing, with concern expressed about the
potentially deleterious effects of the long hours culture (Bunting 2004, Schor 1992) on the
one hand, and underemployment (Bell and Blanchflower 2011) on the other. Meanwhile there
have been renewed calls for radical reductions in average working hours (Skidelsky and
Skidelsky 2013). Empirical research looking into the effect of working hours on wellbeing
(job and life satisfaction) have found mixed results. It is the mismatch between preferred and
actual hours worked that has been found to reduce wellbeing (Wooden et al 2009, Wunder
and Heineck 2012, Iseke 2014, Angrave and Charlwood 2015), but it is not clear whether
over and above this preference matching there is any negative effect of long hours.
In this paper, we argue that a key ingredient of a person’s work-related wellbeing is
the importance of work for their self-image or their ‘work identity’. Following theories of
social and economic identity, we formulate empirical models of subjective wellbeing to test
for the mediating and moderating effects of identity. This framework provides an explanation
for preference mismatch literature. A few studies have attempted to estimate similar models
but they have used proxies for work identity (Pereira and Coelho 2012, Iseke 2014), we
estimate the models for the UK using new individual-level data from Understanding Society
which includes an explicit measure of work identity together. We also extend research in this
area which mainly focus on two ‘evaluative’ measures of wellbeing – job and life satisfaction
– by also looking at two ‘affective’ measures of wellbeing – job-related anxiety and
depression. To our knowledge this is the first time that the implications of the identity model
for wellbeing have been tested using direct measures of identity rather than proxies for
identity derived from observed social categories.
2
We find that, for a given level of hours, having a stronger work identity is associated
with higher wellbeing, although the relationship is relatively weak for job-related anxiety
(except among women working long hours). In general, working long hours is associated
with lower wellbeing and working part-time is associated with higher wellbeing, although for
men we only find these relationships using the two affective wellbeing measures, job-related
anxiety and depression (we find little effect of hours on their job or life satisfaction). These
relationships between hours and wellbeing are generally strengthened when controlling for
identity implying that, consistent with theory, individuals sort into jobs with work hours that
match their identities. We find some evidence that work identity ‘protects’ partially against
the adverse effects of long hours working. Women working long hours who have a strong
work identity report less job-related anxiety and higher job satisfaction than similar women
(working long hours) who have a weak work identity. Nevertheless, irrespective of their work
identity, both men and women working long hours suffer more job-related anxiety and
depression than those working standard full time hours (30-40 hours). Our results confirm the
role played by work identity in determining wellbeing, both as a direct factor and indirectly
through its interactions with work hours.
Our results are robust to individual level differences (as measured via personality
traits) and non-response. We confirm that the estimated effects are due to work identity and
not other dimensions such as family identity. We also confirm that the identity measure is not
only relevant to those employed in professional occupations (and as a result picking up
aspects of professional jobs not related to identity but correlated with success and wellbeing).
Indeed some of the estimated effects are stronger among non-professional employees.
Finally, our estimates are not driven by interactions between partners, as some of the results
are stronger for employees not in partnerships whose employment decisions are not tempered
by their partners.
2. Background
There is a substantial literature investigating the implications of non-standard work, including
both long and short hours jobs. Early research into part-time work tended to focus on
objective job characteristics, for instance pay, conditions and prospects for career
advancement (Blank 1990), but more recently researchers have turned to look at the effect of
part-time work on subjective wellbeing and in particular on job and life satisfaction.
Assuming that work is a source of disutility, we may expect part-time work to be associated
with higher wellbeing than full-time work (after controlling for objective job quality). While
3
some studies find that part-time work does indeed raise job satisfaction, especially among
women (for Britain see Booth and van Ours 2008, Bardasi and Francesconi 2004), others find
no significant effect (Booth and van Ours 2009 for Australia and D’Addio et al 2007 for
Denmark), and a recent evidence from the Netherlands indicates that part-time work lowers
women’s job satisfaction there (Possenriede and Plantenga 2014). In a meta-analysis,
Thorsteinson (2003) concludes that overall there is no significant effect of part-time work on
job satisfaction.
For life satisfaction the results are similarly mixed. While there is evidence that part-
time work (versus full-time) increases women’s life satisfaction in Australia (Booth and van
Ours 2009), Germany and Britain (Gash et al 2012), other studies with a different focus (and
different empirical specifications) find no effects in Britain (Booth and van Ours 2008) and
negative effects among mothers in Germany (Berger 2013). Meanwhile men in Australia
experience higher satisfaction in full-time than part-time work (Booth and van Ours 2009).1
There is less research into the effect of long working hours on satisfaction measures
(although there has been much work on health, stress and family relationships – see the
discussion in Wooden et al 2009). In studies that include a continuous control for (log)
working hours, the coefficient is typically negative and significant, indicating that longer
hours lower job satisfaction (Clark 1996, Clark et al 1996, Chongvilaivan and Powdthavee
2012) and life satisfaction (Pereira and Coelho 2013). Only a few authors specifically look at
long hours as opposed to standard full-time hours, but there is evidence that hours greater
than 50 have a particularly adverse effect on women’s job and life satisfaction, but not men’s
(Booth and van Ours 2009, Gray et al 2004).
Why should there be such a divergence of findings across different settings? Some
authors have suggested that since preferences for working long or short hours can be
expected to differ within the population, the mismatch between actual and preferred hours
may matter more for wellbeing than actual hours worked (Wooden et al. 2009, Wunder and
Heineck 2013, Angrave and Charlwood 2015, Iseke 2014; see also Green and Tsitsianis
2005). Wooden et al (2009) conclude that there is little relationship between job or life
satisfaction and working hours for those working their preferred hours. But job satisfaction is
reduced for those working fewer hours than they would like (and doing short hours), and
among those doing more hours than they would like (especially when the hours are already
1 In both their studies, Booth and van Ours looked at the impact of partner’s as well as own hours of work. The
main finding was that Australian women experienced greater life satisfaction if their partners worked full time.
There was little evidence that partner hours influenced the satisfaction of either men or women in Britain.
4
long). Appealing to discrepancy theory, Iseke (2014) argues that job satisfaction depends on a
combination of mismatches between the characteristics of the job and a worker’s preferences
and abilities. She finds that part-time work has an overall negative effect on job satisfaction,
which is attributed to discrepancies such as a lack of career opportunities compared to full-
time jobs.
In this paper we argue that identity theory is a unifying framework that incorporates
both job mismatches and role perception in explaining wellbeing. Identity theory originated
in the 1950s and has since been developed both by social psychologists (Tajfel 1974, 1981;
Turner et. al. 1994) and by sociologists (Stryker 1968, Stryker and Serpe 1982). The
sociological variant of identity theory in particular emphasises that people acquire a sense of
their social roles by interacting with others in a process that leads to self-meaning and self-
definition. This process of self-examination and its conclusion with a successful achievement
of identity results in higher levels of self-esteem and consequent subjective wellbeing
(Phinney 1990, Cast and Burke 2002). Also a person who ‘self-verifies’ by performing their
role satisfactorily (generally with the approval of others) will experience higher levels of self-
esteem, while someone who perceives they are not performing their role adequately will
experience psychological distress (Hogg et al 1995, Stets and Burke 2000). Some previous
studies have also argued that identity plays a moderating role in determining wellbeing. Iseke
(2014) shows that the negative effect of part-time work on job satisfaction is substantially
reduced for people who place high importance on their role in the family; and Pereira and
Coelho (2013) find, for instance, that work hours have less of an effect among those with a
stronger occupational identity. Booth and van Ours (2009) also conclude that the differential
pattern of work-related satisfaction across men and women can be rationalised by gendered
identities that reflect societal norms about mothers’ work-family roles. However, a drawback
of these studies is that they are not able to use direct measures of identity, instead they proxy
for it using other outcomes (e.g. housework time as a proxy for family identity in Iseke 2014)
or socio-economic characteristics (e.g. gender and supervisory role status in Pereira and
Coelho 2013). In this paper we use direct measures of identity derived from questions about
the importance of different domains to respondents’ sense of self.
Our analytical framework is based on Akerlof and Kranton’s (2000) adaption of
identity theory to economics. In this approach the traditional utility function is augmented by
a term capturing the ‘identity utility’ that results from the match between a person’s actual
behaviour and the ‘ideal’ behaviour prescribed by their identity. In the spirit of Akerlof and
Kranton (2000), we write the following utility function as a function of working hours:
5
Utility = U(h, w, I), where I = I(h, s; X, P(s))
where h is weekly work hours, w is weekly earnings, s is the importance of work for a
person’s self-image (their work identity), and X is a vector of other personal and household
characteristics; P(s) is the set of ideal or prescribed behaviours corresponding to a given level
of work identity s, and I(.) is identity utility.
The augmented utility function makes clear that work decisions and identity impact
utility in several ways. In addition to the conventional direct channel – longer work hours are
a source of disutility – they affect identity utility via further two channels: first, there could
be a direct contribution of work identity to identity utility if a strong identity s raises a
person’s sense of purpose or their self-esteem (Hogg et al 1990); second, identity utility
depends on the match between the number of hours worked h (actual behaviour) and the ideal
number of hours given by P(s), with a close match increasing I (a large s implies a large P(s).
We assume that behaviour norm associated with work identity is working long hours (or
being willing to do so). This assumption is supported by findings from a meta-analysis of
work hours and occupational identity (Ng and Feldman 2008) and our data which shows that
employees with stronger work identity do work longer hours (see Figure 4.2). And so a
person with a strong work identity will derive more identity utility in a demanding, long-
hours job than in a regular 9-5 job). Some effects may be opposing, most obviously in the
case of a person with a strong work identity for whom longer hours reduce utility through the
first channel but raise (identity) utility via the third channel. To test the implications of the
theory, we specify a set of empirical models of the form:
yi = xi β + hi γ1 + si γ2 + hi.si γ3 + εi (1)
where xi is a set of personal and job characteristics of individual i, and hi is working hours
and si is a measure of work identity. Rather than utility, which is in any case unobserved, yi is
a measure of subjective wellbeing. Given the psychological origins of identity theory,
measures of subjective wellbeing are arguably more appropriate anyway. Based on this
framework, we expect the effect of work hours on wellbeing to be negative (as work
increases disutility). But we may not observe this in the standard model (that is, where we do
not control for work identity) for the following reason. Workers sort into jobs where the work
hours match their identity as closely as possible. Thus a person with a strong work identity
will tend to choose jobs with longer work hours and those with weaker work identity will
choose jobs with lesser work hours. All else equal, this matching of hours with their own
work identity will increase their wellbeing and as a result the overall difference in wellbeing
by work hours will be small. So, once we control for work identity, the net effect of work
6
hours on wellbeing (due to work related disutility) will be larger. Following on from this, we
also expect that the additional negative effect of working longer hours will be smaller for
those with strong work identity. Additionally, we expect work identity itself to have a
positive effect on wellbeing.
4. Data & Methodology
Data
We use data from a nationally representative UK household longitudinal Survey,
Understanding Society (UKHLS). This is a multipurpose survey with detailed information
about individuals’ socio-demographic characteristics, educational and labour market
activities, objective and subjective measures of health and well-being and a host of questions
on values, beliefs and attitudes including questions on identity across different domains.
Questions on identity, job related anxiety and depression questions make this survey
particularly useful for our analysis. Every year all adults (16 years or above) in the sampled
households are eligible for interviews, with most conducted face-to-face. Those who agree to
participate are also asked to complete a self-completion questionnaire which includes
questions deemed to be sensitive and expected to be measured more accurately if not asked
by the interviewer.
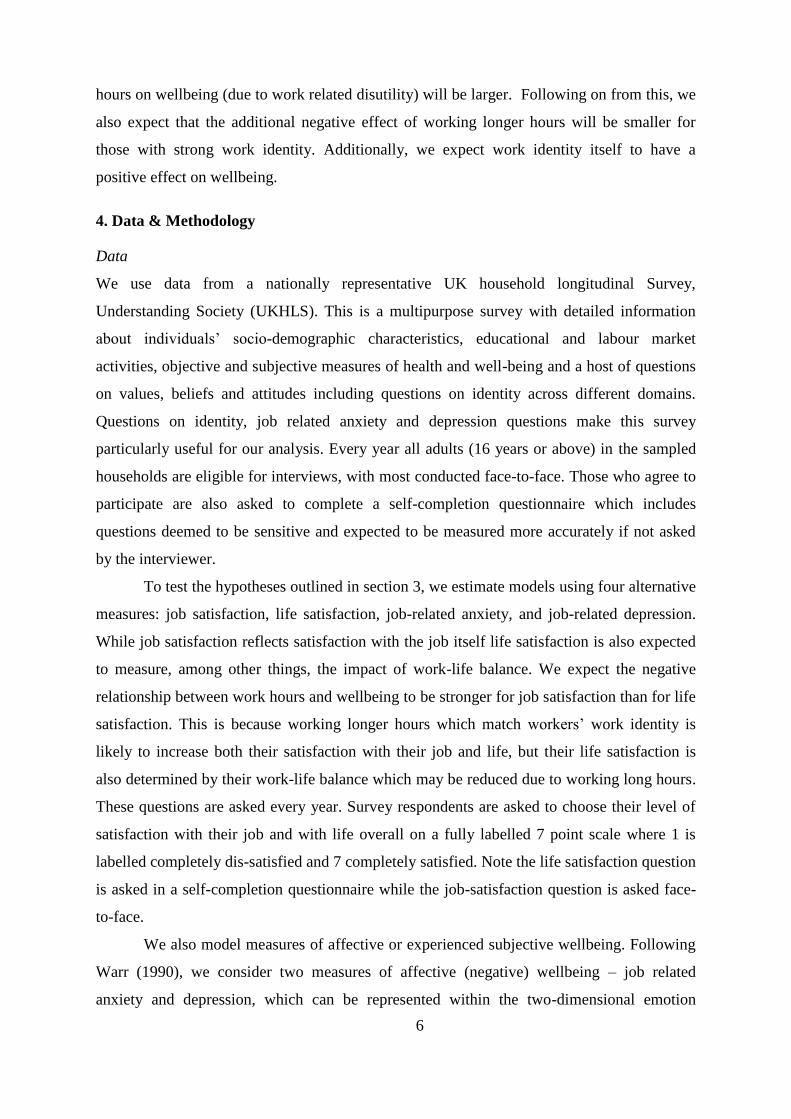
To test the hypotheses outlined in section 3, we estimate models using four alternative
measures: job satisfaction, life satisfaction, job-related anxiety, and job-related depression.
While job satisfaction reflects satisfaction with the job itself life satisfaction is also expected
to measure, among other things, the impact of work-life balance. We expect the negative
relationship between work hours and wellbeing to be stronger for job satisfaction than for life
satisfaction. This is because working longer hours which match workers’ work identity is
likely to increase both their satisfaction with their job and life, but their life satisfaction is
also determined by their work-life balance which may be reduced due to working long hours.
These questions are asked every year. Survey respondents are asked to choose their level of
satisfaction with their job and with life overall on a fully labelled 7 point scale where 1 is
labelled completely dis-satisfied and 7 completely satisfied. Note the life satisfaction question
is asked in a self-completion questionnaire while the job-satisfaction question is asked face-
to-face.
We also model measures of affective or experienced subjective wellbeing. Following
Warr (1990), we consider two measures of affective (negative) wellbeing – job related
anxiety and depression, which can be represented within the two-dimensional emotion
7
structure as high-arousal-displeasure and low-arousal-displeasure. As job and life
satisfaction measures are evaluative they are more likely to be subject to more variations in
context, even minor ones (Schwarz and Strack 19912) than these affective measures.
However, note these measures are not to be interpreted as more stable substitutes of the job
satisfaction measure, rather they represent additional psychological dimensions of wellbeing.
Thus it is possible for a person working longer hours to be satisfied with her job but at the
same to experience high levels of job related anxiety.
In the second wave of the study, employees were asked 6 questions to measure their
job related anxiety and depression in the face-to-face interviews. Job related anxiety
questions asked the respondents how much time in the past few weeks had their job made the
respondent feel: tense, uneasy and worried; and job related depression questions asked how
much of the time in the past few weeks had their job made them feel: depressed, gloomy, and
miserable. The response options for each question were: Never, Occasionally, Some of the
time, Most of the time, All of the time. As is standard, these scores (1 to 5) were averaged
across the three items (for each measure) to produce the two variables we use in our analysis
(see Green 2010)3.
The second wave self-completion questionnaire also included questions to measure
identity across different domains – profession, family, gender, political beliefs, ethnic or
racial background, education, age and life stage4. These questions asked respondents how
important these domains were to their sense of who they were. The response options were:
Very important, Fairly important, Not very important and Not at all important, Don’t
know/does not apply. We consider individuals who report Very or Fairly important to the
question on profession as having “strong work identity” and the rest as having weak work
identity.
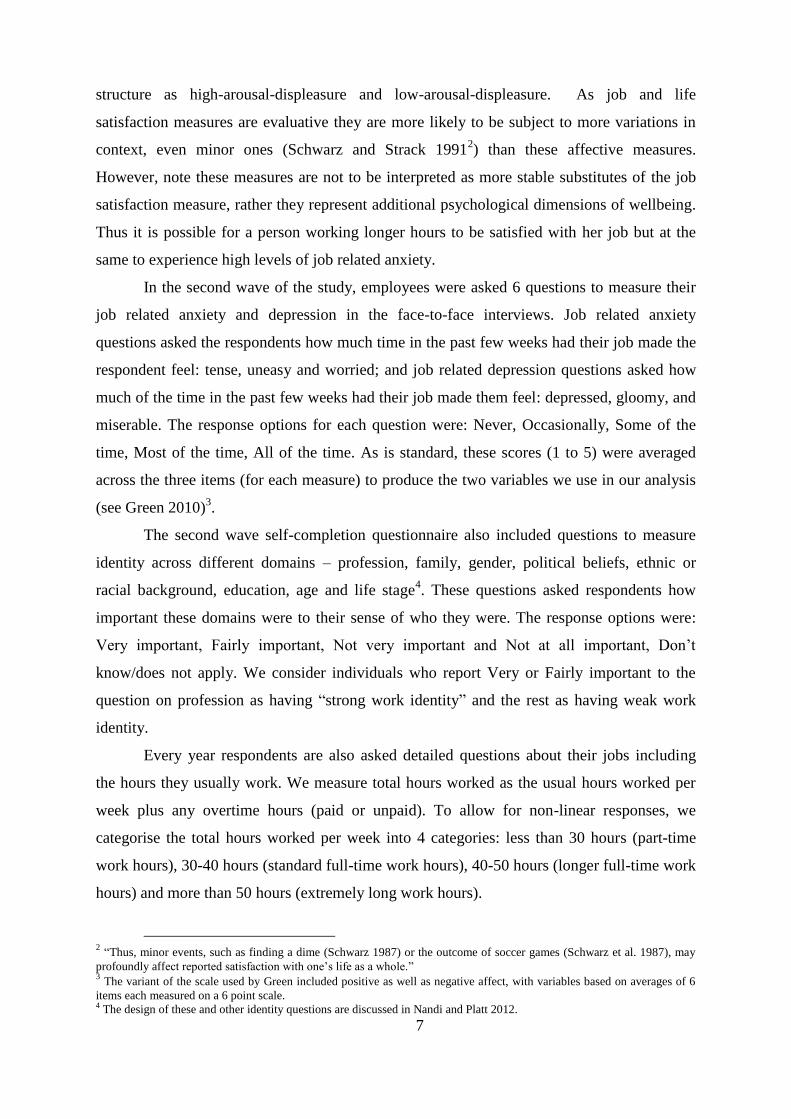
Every year respondents are also asked detailed questions about their jobs including
the hours they usually work. We measure total hours worked as the usual hours worked per
week plus any overtime hours (paid or unpaid). To allow for non-linear responses, we
categorise the total hours worked per week into 4 categories: less than 30 hours (part-time
work hours), 30-40 hours (standard full-time work hours), 40-50 hours (longer full-time work
hours) and more than 50 hours (extremely long work hours).
2 “Thus, minor events, such as finding a dime (Schwarz 1987) or the outcome of soccer games (Schwarz et al. 1987), may
profoundly affect reported satisfaction with one’s life as a whole.” 3 The variant of the scale used by Green included positive as well as negative affect, with variables based on averages of 6
items each measured on a 6 point scale. 4 The design of these and other identity questions are discussed in Nandi and Platt 2012.
8
We restrict our analysis to data from the second wave as it is the only available wave
to include all the key variables. As we include questions from the self-completion
questionnaire, our sample is restricted to those who complete the self-completion
questionnaire (so excludes proxy respondents). In addition, to avoid the interaction of ethnic
identity norms with work identity norms, we restrict the sample for the analysis to White
majority respondents (from the nationally-representative General Population sample).5
Finally we restrict the sample to the post-education, pre-retirement age (23 years to 59 years)
paid employees. This results in a sample size of 10,597 comprising of 4,574 men and 5,967
women.
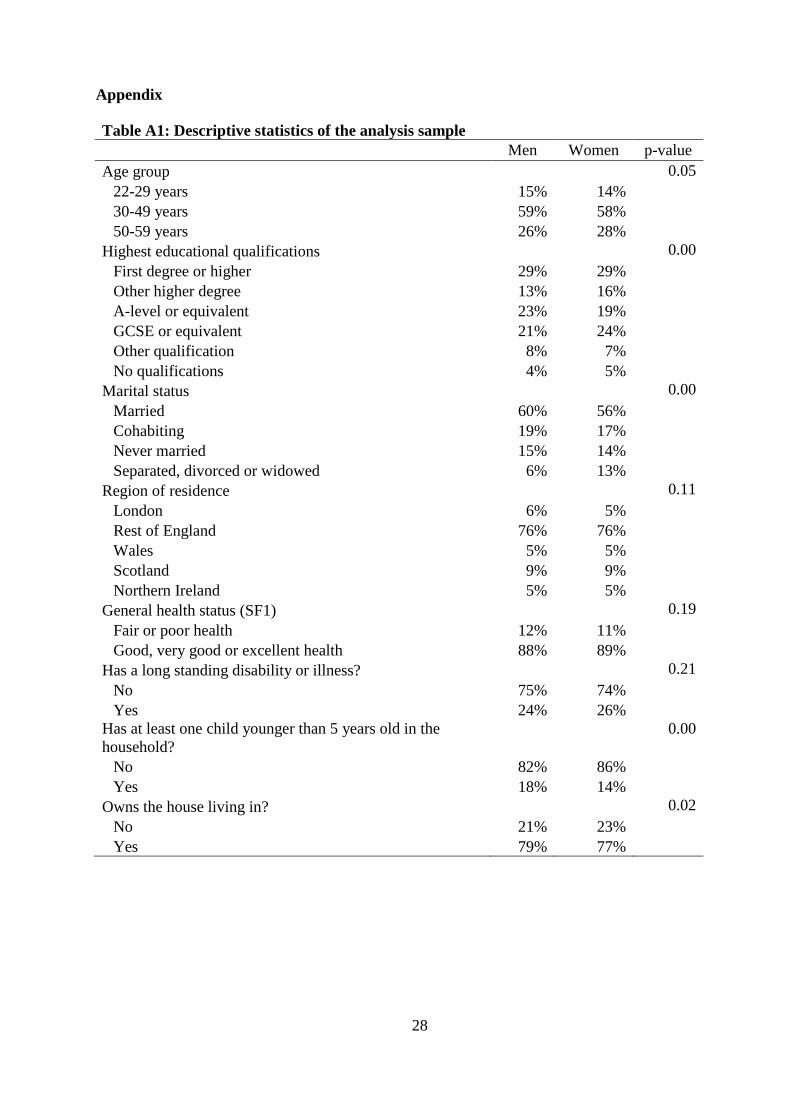
Descriptive statistics: Gender differences
Our analysis focuses on work identity and its role in explaining the relationship
between work hours and different measures of subjective well-being. Given men and
women’s different labour market experiences and existing evidence that the determinants of
wellbeing differ across gender, all the analyses have been done separately for men and
women. For detailed descriptive statistics by gender and p-values of tests of gender
differences see Table A1 in the Appendix. Differences by gender are along expected lines –
female employees earn less than their male counterparts, are less likely to own a house and
less likely to have a (own) child less than 5 years old in the household (as mothers of young
children are less likely to be in paid employment). Female paid employees are also less likely
to be in the highest professions or in skilled trades or process, plant and machine operatives.
Very similar proportions of men and women are in paid employment (68% of men and 66%
of women) but within our sample of employees, as expected there is a striking difference in
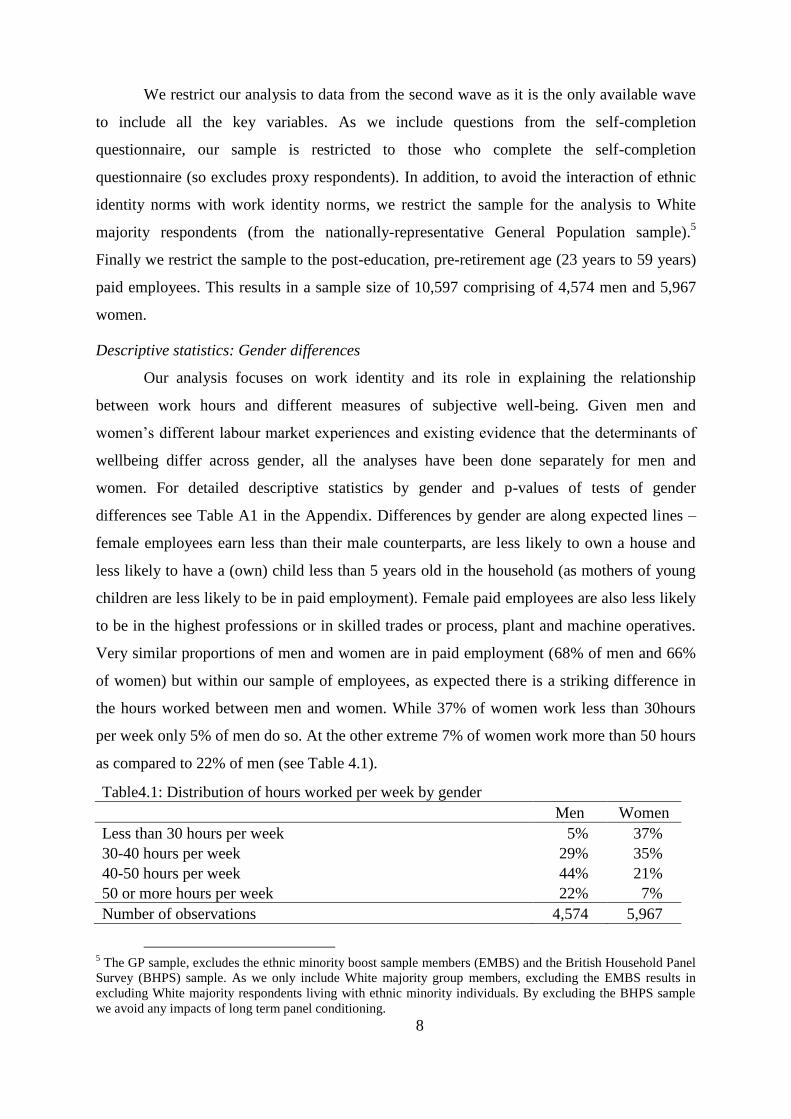
the hours worked between men and women. While 37% of women work less than 30hours
per week only 5% of men do so. At the other extreme 7% of women work more than 50 hours
as compared to 22% of men (see Table 4.1).
Table4.1: Distribution of hours worked per week by gender
Men Women
Less than 30 hours per week 5% 37%
30-40 hours per week 29% 35%
40-50 hours per week 44% 21%
50 or more hours per week 22% 7%
Number of observations 4,574 5,967
5 The GP sample, excludes the ethnic minority boost sample members (EMBS) and the British Household Panel
Survey (BHPS) sample. As we only include White majority group members, excluding the EMBS results in
excluding White majority respondents living with ethnic minority individuals. By excluding the BHPS sample
we avoid any impacts of long term panel conditioning.

9
Note: hours per week includes overtime hours. Sample restricted to White majority, paid employees between the ages
of 23 and 60 years, those who gave a face-to-face interview and completed the self-completion questionnaire.
Descriptive statistics: Work identity and hours worked
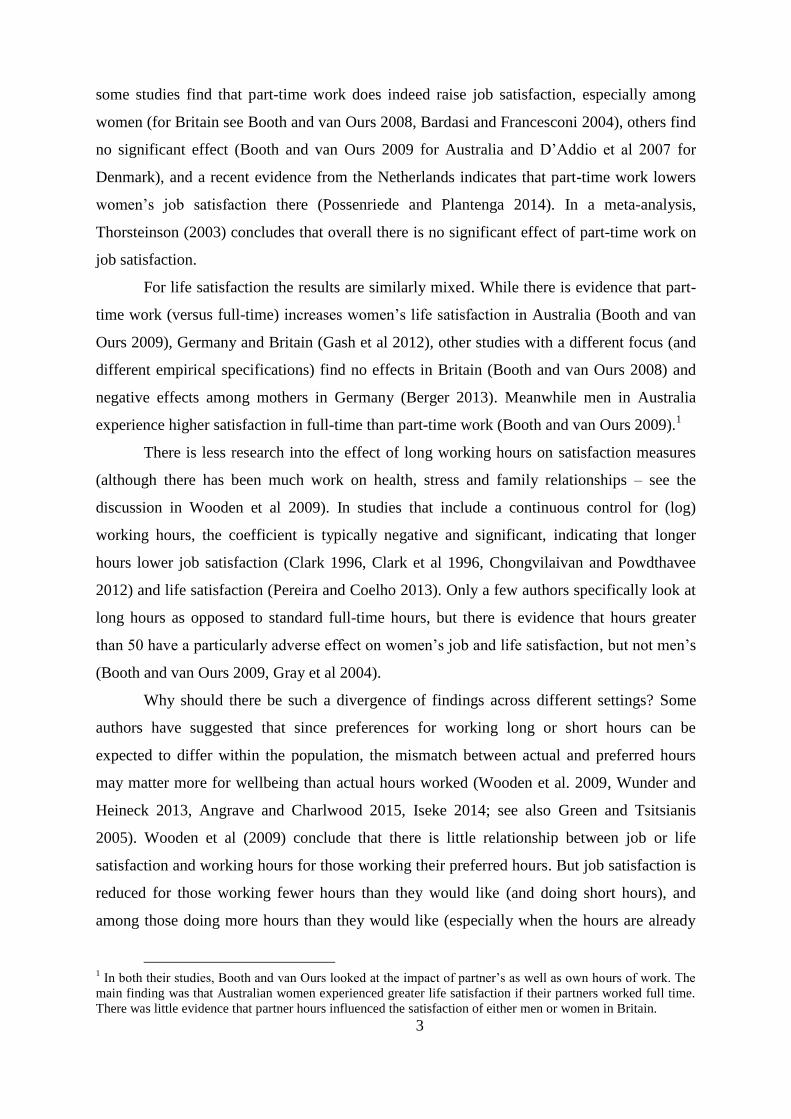
Before we compare work identities between male and female employees, we compare
the work identities of all men and women to see if these are in the expected directions We
find that it is lower among women than men (which could reflect suggestions that women
have more home-centred preferences, see Hakim 2002). But as women with weaker work
identities are also less likely to be in paid employment than men the gender difference
observed for all individuals may not be observed among employees. This turns out to be the
case: women in paid employment have slightly stronger work identities than their male
counterparts (Figure 4.1)6.
Figure 4.1: Distribution of work identity among men and women in paid employment
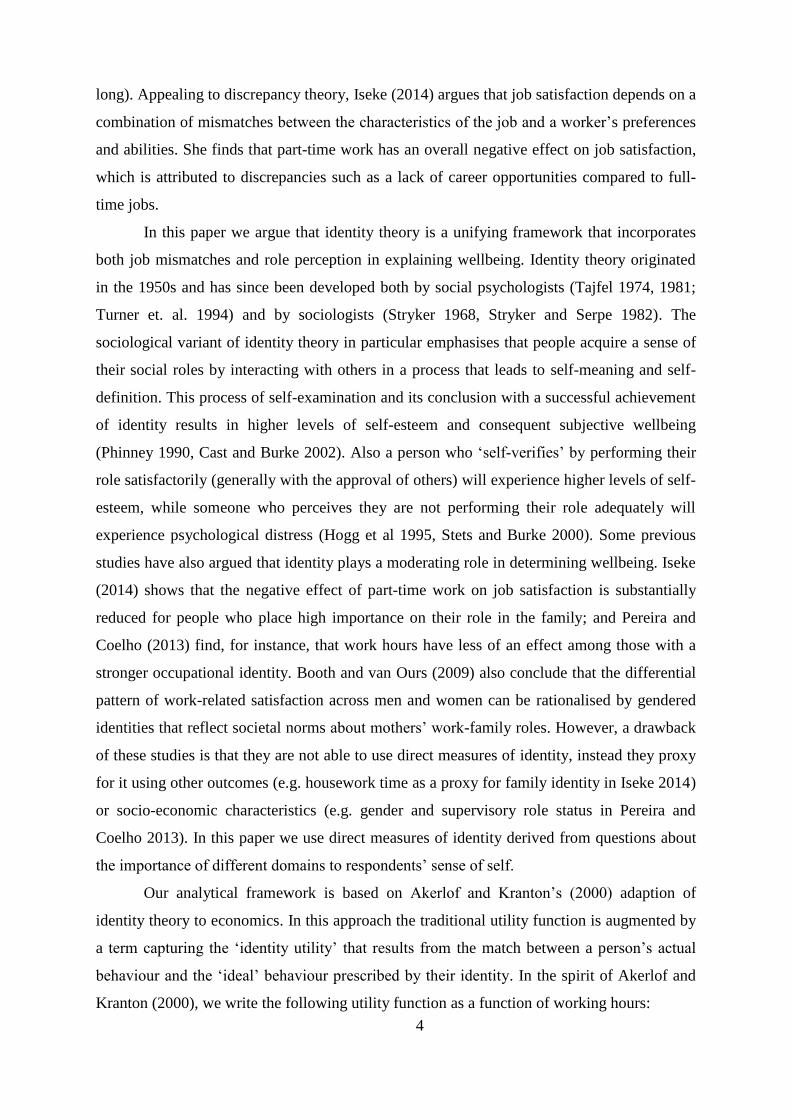
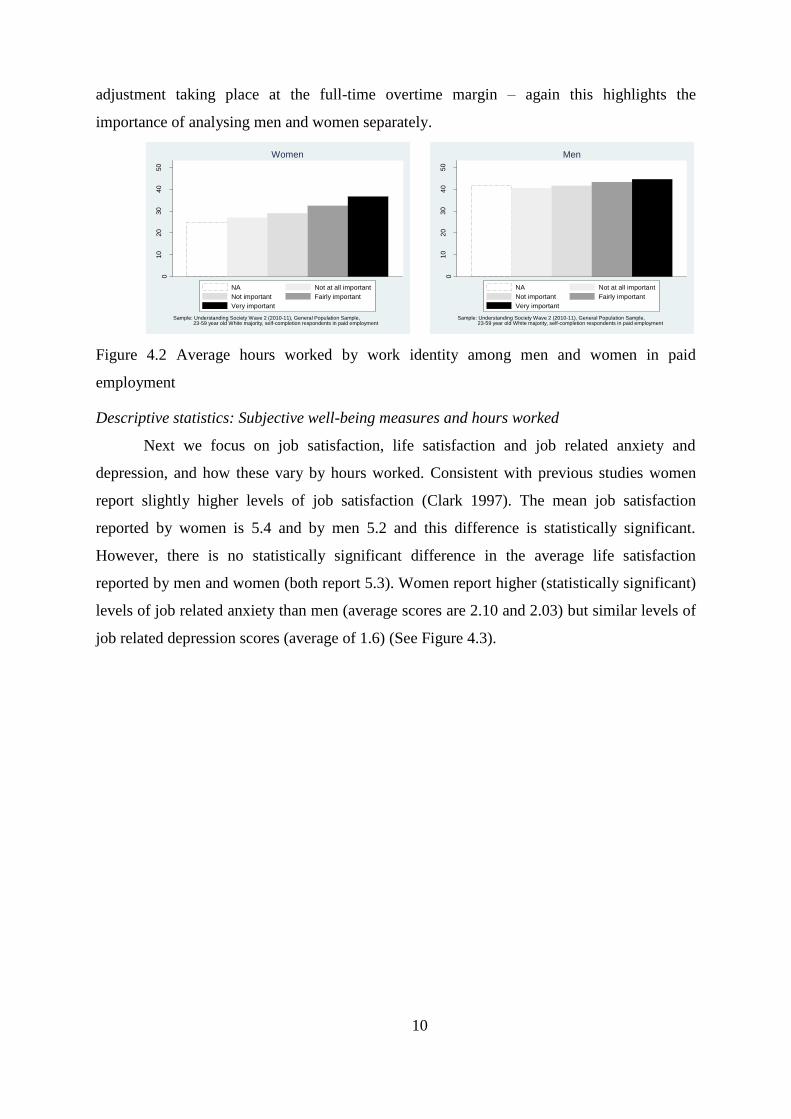
In Section 3 we suggested that employees with stronger work identity would choose
jobs with longer hours. The raw data broadly reflects this but the positive correlation between
work identity and hours worked is much stronger for women than men (See Figure 4.2). The
weaker association for men may reflect their lower prevalence of part-time work, with most
6 We find that 43% of women who are not employed and 57% of men who are not employed report strong work
identity (defined as those who report “Fairly important” and “Very important”), but among employees we find
that 74% of men and 76% of women report strong work identity.
0.1
.2.3
.4.5
Women Men
DK/NA Not at all important Not important
Fairly important Very important
Sample: Understanding Society Wave 2 (2010-11), General Population Sample, 23-59 year old White majority, self-completion respondents in paid employmentQuestion: How important is Your Profession to your sense of who you are
Work identity
10
adjustment taking place at the full-time overtime margin – again this highlights the
importance of analysing men and women separately.
Figure 4.2 Average hours worked by work identity among men and women in paid
employment
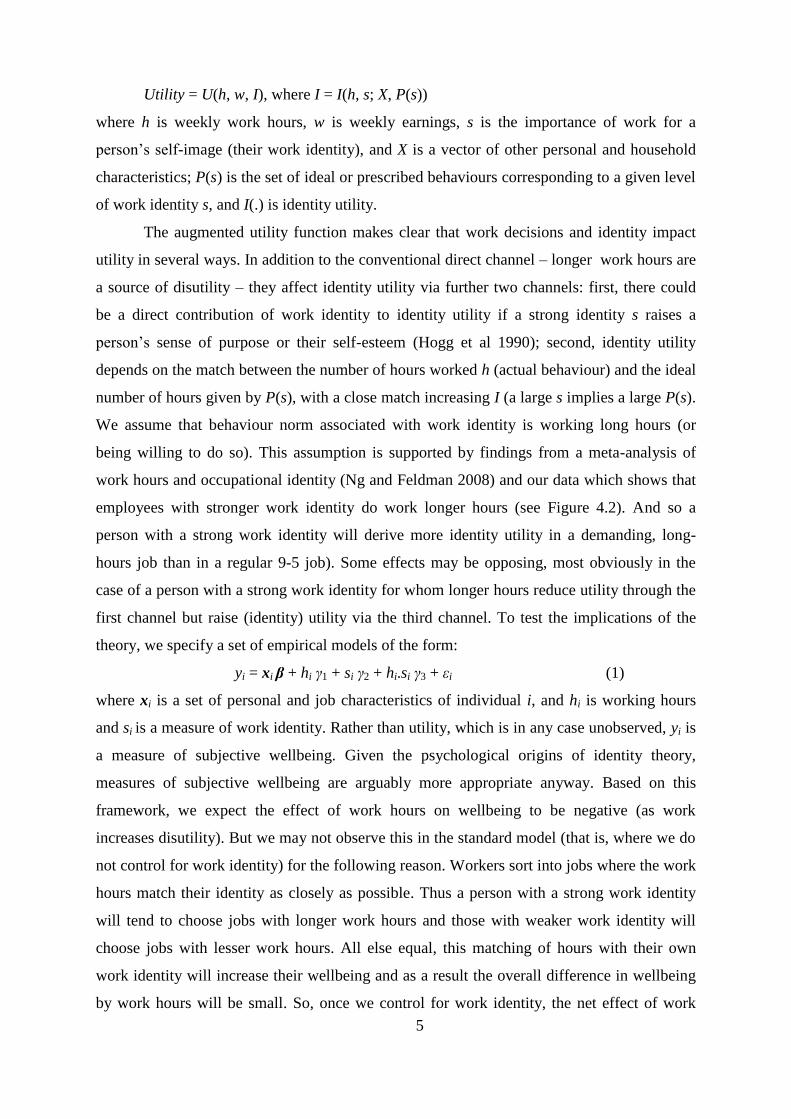
Descriptive statistics: Subjective well-being measures and hours worked
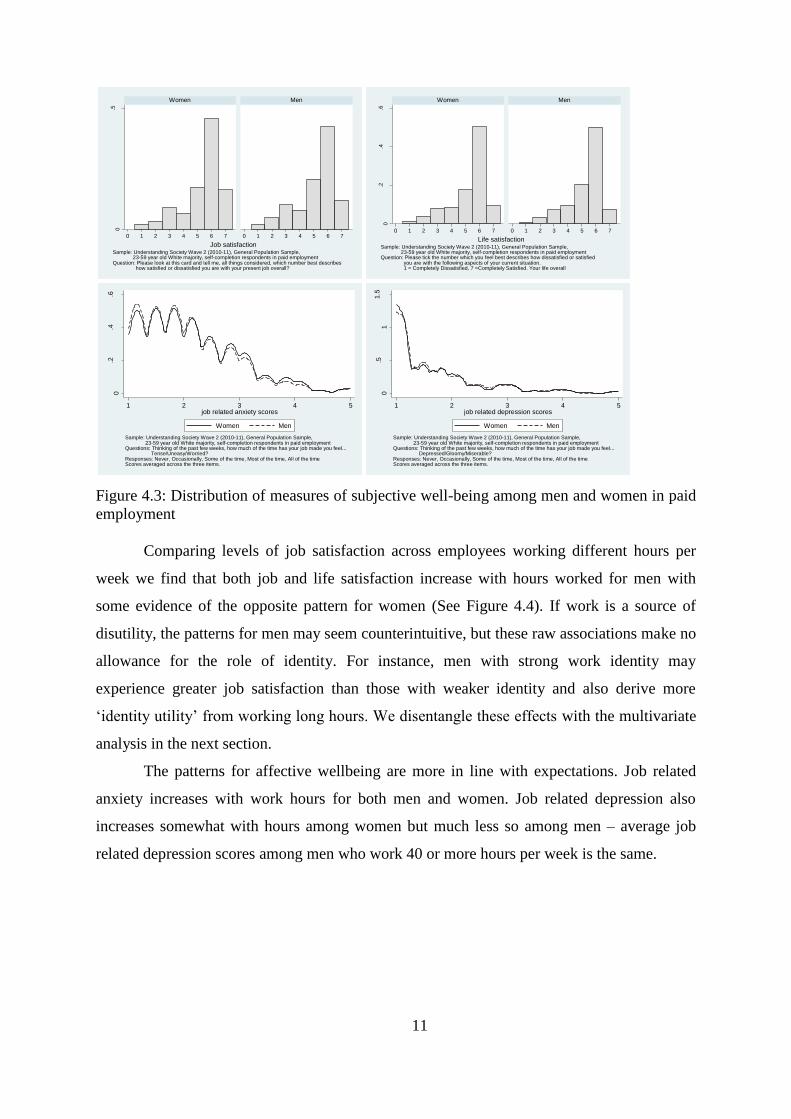
Next we focus on job satisfaction, life satisfaction and job related anxiety and
depression, and how these vary by hours worked. Consistent with previous studies women
report slightly higher levels of job satisfaction (Clark 1997). The mean job satisfaction
reported by women is 5.4 and by men 5.2 and this difference is statistically significant.
However, there is no statistically significant difference in the average life satisfaction
reported by men and women (both report 5.3). Women report higher (statistically significant)
levels of job related anxiety than men (average scores are 2.10 and 2.03) but similar levels of
job related depression scores (average of 1.6) (See Figure 4.3).
010
20
30
40
50
Avera
ge
hou
rs w
ork
ed p
er
we
ek
Sample: Understanding Society Wave 2 (2010-11), General Population Sample, 23-59 year old White majority, self-completion respondents in paid employment
Women
NA Not at all important
Not important Fairly important
Very important
01
02
03
04
05
0
Ave
rag
e h
ours
wo
rked
per
we
ek
Sample: Understanding Society Wave 2 (2010-11), General Population Sample, 23-59 year old White majority, self-completion respondents in paid employment
Men
NA Not at all important
Not important Fairly important
Very important
11
Figure 4.3: Distribution of measures of subjective well-being among men and women in paid
employment
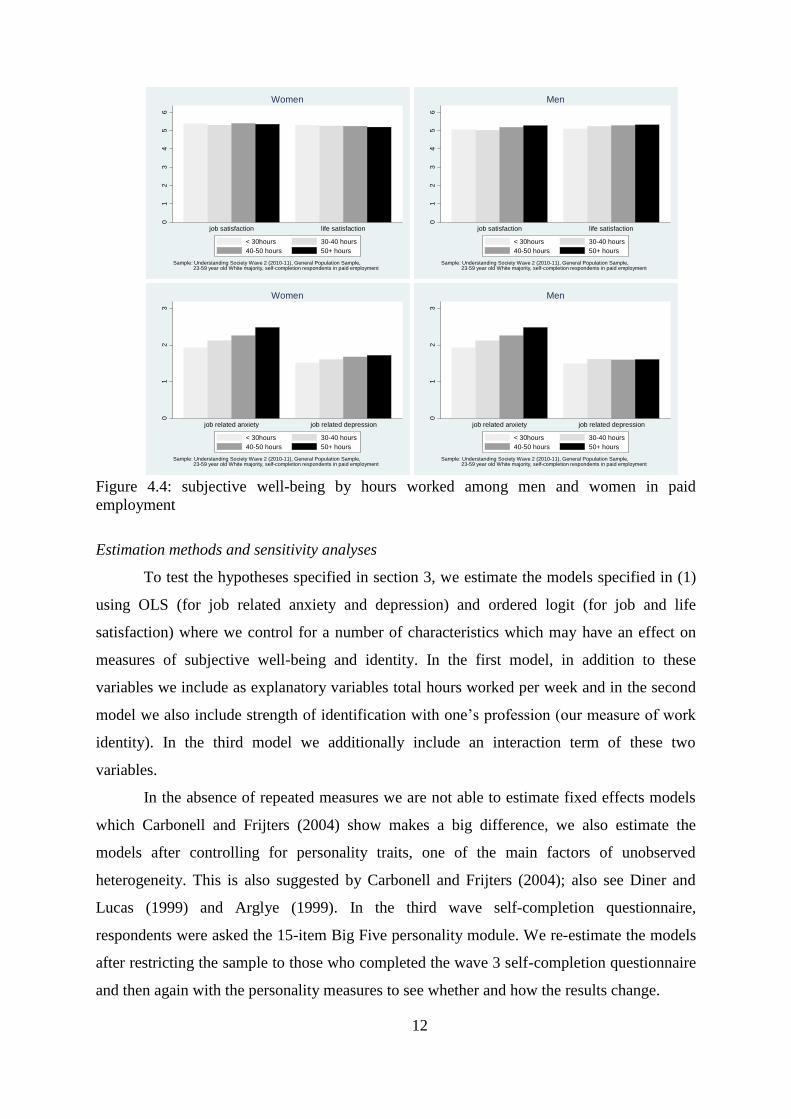
Comparing levels of job satisfaction across employees working different hours per
week we find that both job and life satisfaction increase with hours worked for men with
some evidence of the opposite pattern for women (See Figure 4.4). If work is a source of
disutility, the patterns for men may seem counterintuitive, but these raw associations make no
allowance for the role of identity. For instance, men with strong work identity may
experience greater job satisfaction than those with weaker identity and also derive more
‘identity utility’ from working long hours. We disentangle these effects with the multivariate
analysis in the next section.
The patterns for affective wellbeing are more in line with expectations. Job related
anxiety increases with work hours for both men and women. Job related depression also
increases somewhat with hours among women but much less so among men – average job
related depression scores among men who work 40 or more hours per week is the same.
0.5
0 1 2 3 4 5 6 7 0 1 2 3 4 5 6 7
Women Men
Den
sity
Job satisfactionSample: Understanding Society Wave 2 (2010-11), General Population Sample, 23-59 year old White majority, self-completion respondents in paid employmentQuestion: Please look at this card and tell me, all things considered, which number best describes how satisfied or dissatisfied you are with your present job overall?
0.2
.4.6
0 1 2 3 4 5 6 7 0 1 2 3 4 5 6 7
Women Men
Den
sity
Life satisfactionSample: Understanding Society Wave 2 (2010-11), General Population Sample, 23-59 year old White majority, self-completion respondents in paid employmentQuestion: Please tick the number which you feel best describes how dissatisfied or satisfied you are with the following aspects of your current situation. 1 = Completely Dissatisfied, 7 =Completely Satisfied. Your life overall
0.2
.4.6
Den
sity
1 2 3 4 5job related anxiety scores
Women Men
Sample: Understanding Society Wave 2 (2010-11), General Population Sample, 23-59 year old White majority, self-completion respondents in paid employmentQuestions: Thinking of the past few weeks, how much of the time has your job made you feel... Tense/Uneasy/Worried?Responses: Never, Occasionally, Some of the time, Most of the time, All of the timeScores averaged across the three items.
0.5
11
.5
Den
sity
1 2 3 4 5job related depression scores
Women Men
Sample: Understanding Society Wave 2 (2010-11), General Population Sample, 23-59 year old White majority, self-completion respondents in paid employmentQuestions: Thinking of the past few weeks, how much of the time has your job made you feel... Depressed/Gloomy/Miserable?Responses: Never, Occasionally, Some of the time, Most of the time, All of the timeScores averaged across the three items.
12
Figure 4.4: subjective well-being by hours worked among men and women in paid
employment
Estimation methods and sensitivity analyses
To test the hypotheses specified in section 3, we estimate the models specified in (1)
using OLS (for job related anxiety and depression) and ordered logit (for job and life
satisfaction) where we control for a number of characteristics which may have an effect on
measures of subjective well-being and identity. In the first model, in addition to these
variables we include as explanatory variables total hours worked per week and in the second
model we also include strength of identification with one’s profession (our measure of work
identity). In the third model we additionally include an interaction term of these two
variables.
In the absence of repeated measures we are not able to estimate fixed effects models
which Carbonell and Frijters (2004) show makes a big difference, we also estimate the
models after controlling for personality traits, one of the main factors of unobserved
heterogeneity. This is also suggested by Carbonell and Frijters (2004); also see Diner and
Lucas (1999) and Arglye (1999). In the third wave self-completion questionnaire,
respondents were asked the 15-item Big Five personality module. We re-estimate the models
after restricting the sample to those who completed the wave 3 self-completion questionnaire
and then again with the personality measures to see whether and how the results change.
01
23
45
6
avera
ge
job satisfaction life satisfaction
Sample: Understanding Society Wave 2 (2010-11), General Population Sample, 23-59 year old White majority, self-completion respondents in paid employment
Women
< 30hours 30-40 hours
40-50 hours 50+ hours
01
23
45
6
avera
ge
job satisfaction life satisfaction
Sample: Understanding Society Wave 2 (2010-11), General Population Sample, 23-59 year old White majority, self-completion respondents in paid employment
Men
< 30hours 30-40 hours
40-50 hours 50+ hours
01
23
avera
ge
job related anxiety job related depression
Sample: Understanding Society Wave 2 (2010-11), General Population Sample, 23-59 year old White majority, self-completion respondents in paid employment
Women
< 30hours 30-40 hours
40-50 hours 50+ hours
01
23
avera
ge
job related anxiety job related depression
Sample: Understanding Society Wave 2 (2010-11), General Population Sample, 23-59 year old White majority, self-completion respondents in paid employment
Men
< 30hours 30-40 hours
40-50 hours 50+ hours
13
The question we use to measure work identity asked respondents to say how
important their own profession was to their sense of self. It is possible that some respondents
interpreted this as only salient for those in professional jobs. So, we estimate the models
separately for those in professional and managerial occupations and those in manual and
service or administrative occupations.
Note job satisfaction, job related anxiety are asked in face-to-face surveys while life
satisfaction are asked in the self-completion questionnaire (as are the identity measures).
Conti and Pudney (2011) find that gender differences in the effect of working hours (and
wages) on job satisfaction are observed in face-to-face interviews where the interviewer is
present but not in self-completion. As this is driven by differences in reporting across
interview mode among women, they conclude that women working longer hours feel
compelled to report lower job satisfaction – as “women are more reluctant to report to the
interviewer something that could conflict with gender roles prevalent in society”. As our
paper directly addresses this issue, our results for job satisfaction (even though asked by the
interviewer) should be robust to the interview mode. But as gender differences in these types
of studies vary by interview modes and most of our wellbeing measures were asked face-to-
face, we estimate the models separately by gender and do not comment on gender
differences.
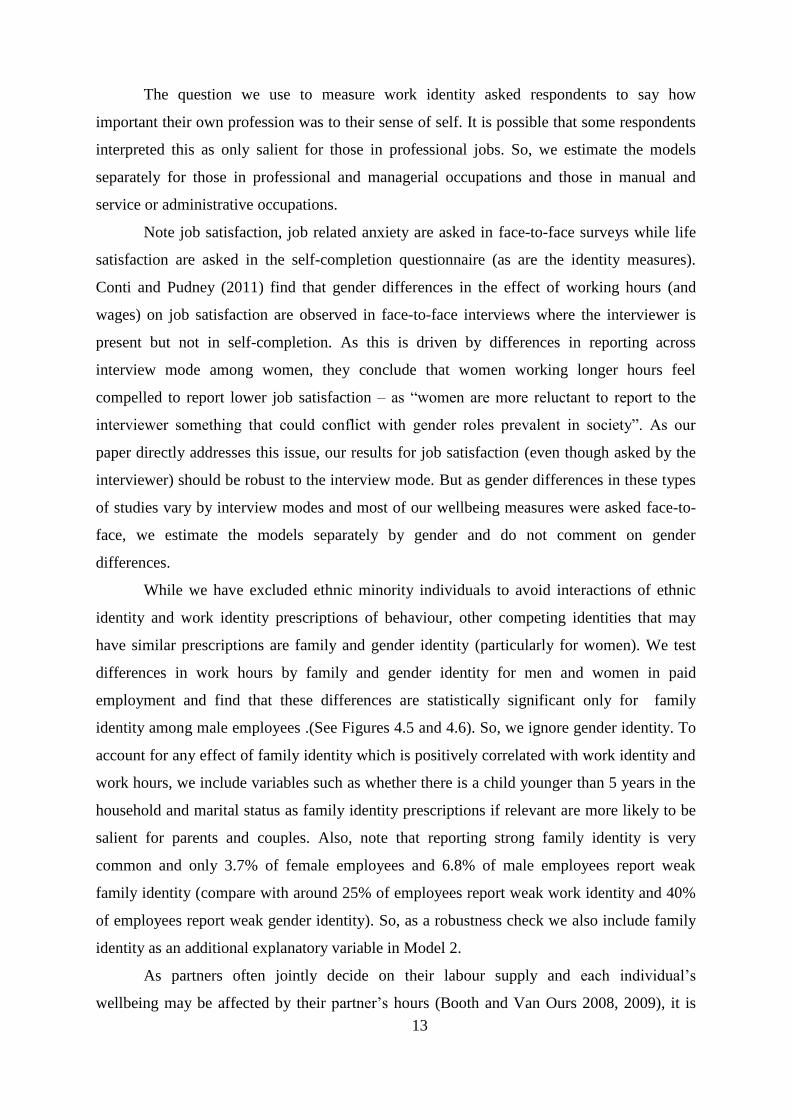
While we have excluded ethnic minority individuals to avoid interactions of ethnic
identity and work identity prescriptions of behaviour, other competing identities that may
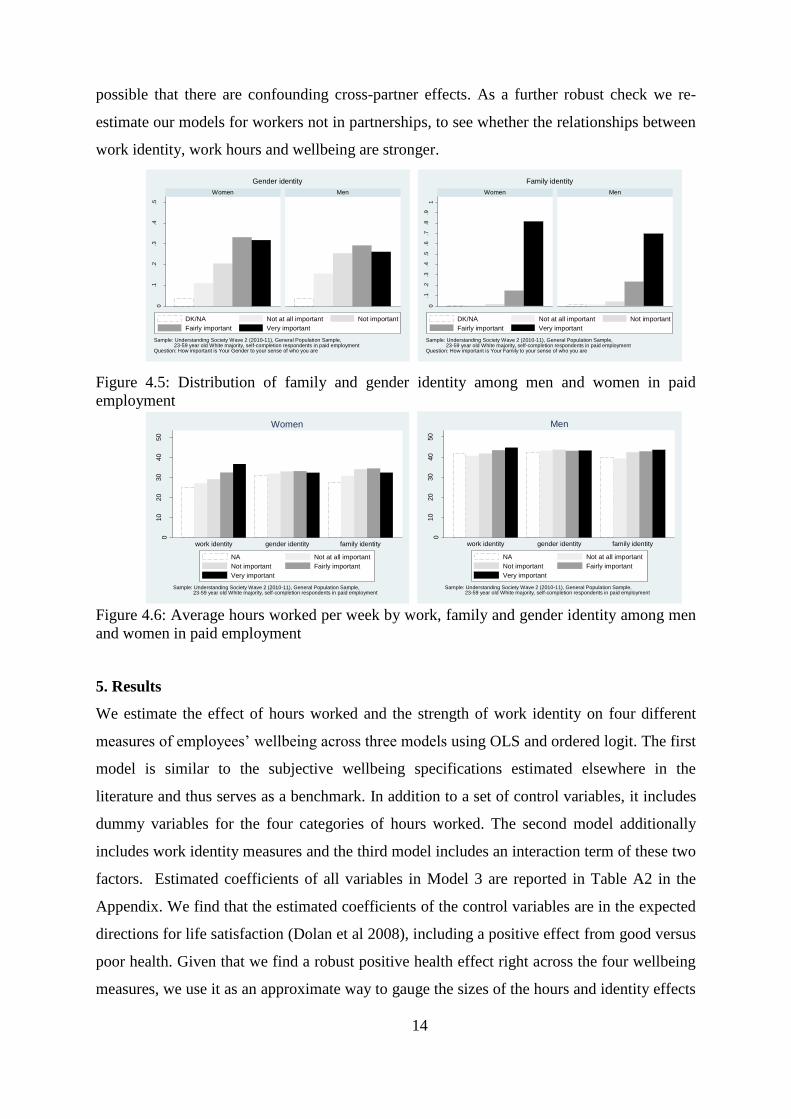
have similar prescriptions are family and gender identity (particularly for women). We test
differences in work hours by family and gender identity for men and women in paid
employment and find that these differences are statistically significant only for family
identity among male employees .(See Figures 4.5 and 4.6). So, we ignore gender identity. To
account for any effect of family identity which is positively correlated with work identity and
work hours, we include variables such as whether there is a child younger than 5 years in the
household and marital status as family identity prescriptions if relevant are more likely to be
salient for parents and couples. Also, note that reporting strong family identity is very
common and only 3.7% of female employees and 6.8% of male employees report weak
family identity (compare with around 25% of employees report weak work identity and 40%
of employees report weak gender identity). So, as a robustness check we also include family
identity as an additional explanatory variable in Model 2.
As partners often jointly decide on their labour supply and each individual’s
wellbeing may be affected by their partner’s hours (Booth and Van Ours 2008, 2009), it is
14
possible that there are confounding cross-partner effects. As a further robust check we re-
estimate our models for workers not in partnerships, to see whether the relationships between
work identity, work hours and wellbeing are stronger.
Figure 4.5: Distribution of family and gender identity among men and women in paid
employment
Figure 4.6: Average hours worked per week by work, family and gender identity among men
and women in paid employment
5. Results
We estimate the effect of hours worked and the strength of work identity on four different
measures of employees’ wellbeing across three models using OLS and ordered logit. The first
model is similar to the subjective wellbeing specifications estimated elsewhere in the
literature and thus serves as a benchmark. In addition to a set of control variables, it includes
dummy variables for the four categories of hours worked. The second model additionally
includes work identity measures and the third model includes an interaction term of these two
factors. Estimated coefficients of all variables in Model 3 are reported in Table A2 in the
Appendix. We find that the estimated coefficients of the control variables are in the expected
directions for life satisfaction (Dolan et al 2008), including a positive effect from good versus
poor health. Given that we find a robust positive health effect right across the four wellbeing
measures, we use it as an approximate way to gauge the sizes of the hours and identity effects
0.1
.2.3
.4.5
Women Men
DK/NA Not at all important Not important
Fairly important Very important
Sample: Understanding Society Wave 2 (2010-11), General Population Sample, 23-59 year old White majority, self-completion respondents in paid employmentQuestion: How important is Your Gender to your sense of who you are
Gender identity
0.1
.2.3
.4.5
.6.7
.8.9
1
Women Men
DK/NA Not at all important Not important
Fairly important Very important
Sample: Understanding Society Wave 2 (2010-11), General Population Sample, 23-59 year old White majority, self-completion respondents in paid employmentQuestion: How important is Your Family to your sense of who you are
Family identity
010
20
30
40
50
Avera
ge
hou
rs w
ork
ed p
er
we
ek
work identity gender identity family identity
Sample: Understanding Society Wave 2 (2010-11), General Population Sample, 23-59 year old White majority, self-completion respondents in paid employment
Women
NA Not at all important
Not important Fairly important
Very important
010
20
30
40
50
Avera
ge
hou
rs w
ork
ed p
er
we
ek
work identity gender identity family identity
Sample: Understanding Society Wave 2 (2010-11), General Population Sample, 23-59 year old White majority, self-completion respondents in paid employment
Men
NA Not at all important
Not important Fairly important
Very important
15
and compare them across measures. The estimated coefficients of hours worked and work
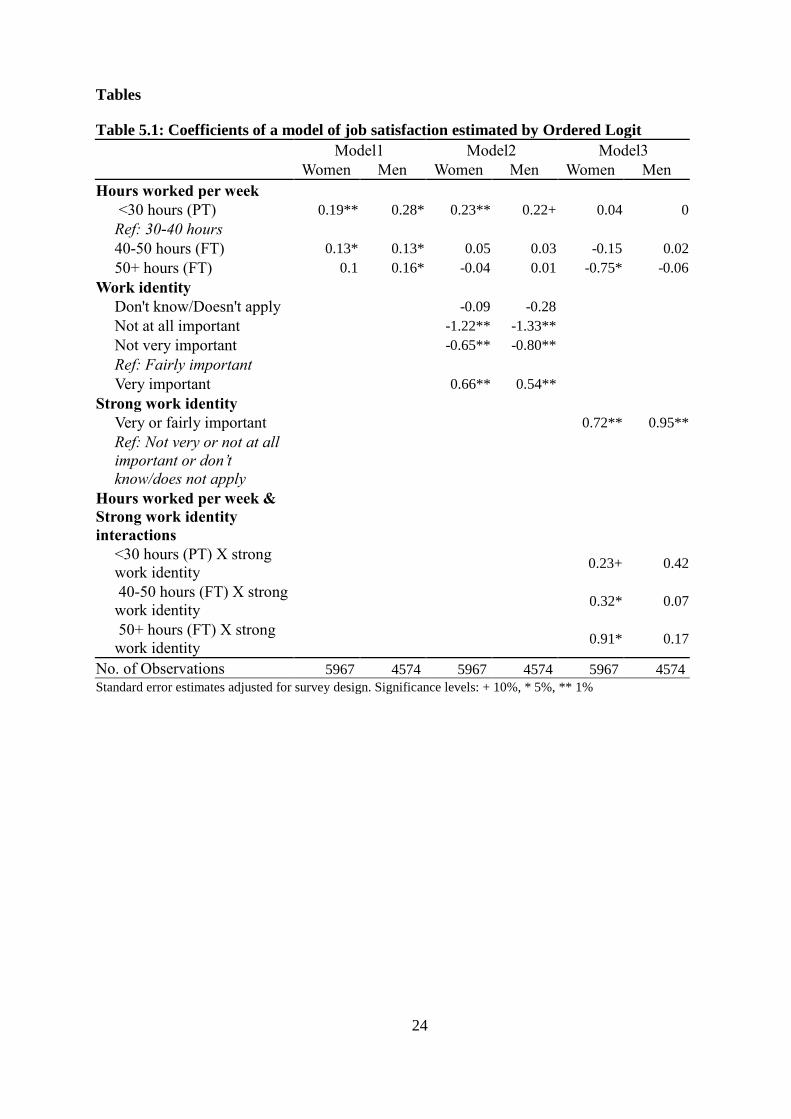
identity in the three models are reported in Tables 5.1-5.4; for employee’s job satisfaction see
Table 5.1, job-related anxiety see Table 5.2, job related depression see Table 5.3 and overall
life satisfaction or happiness see Table 5.4.
Job satisfaction
Looking at the estimated coefficients in the standard model for job satisfaction we
find that job satisfaction is not always lower for employees who are working longer hours
(Model 1, Table 5.1). While among female employees those working less than 30 hours per
week report a higher level of job satisfaction than those working 30-40 hours (as expected),
both male and female employees working 40-50 hours also report higher levels of job
satisfaction. However once we control for work identity, and so ‘undo’ the effect of
employees sorting into jobs on the basis of identity, we find that the positive effect of
working longer hours disappears among both male and female employees; moreover the
positive effect of shorter hours among women is strengthened (Model 2, Table 5.1). For
women, working part-time is associated with 0.23 greater job satisfaction (as reflected in the
latent index of the logit model); this represents almost half of the job satisfaction gap between
those in good and poor health (Table A2).
Identity itself also has a direct association with wellbeing: those with stronger work
identity report higher levels of job satisfaction (Models 2, Table 5.1) and the effects are large:
for both men and women the difference in satisfaction between the two ends of the identity
scale is about 1.9, which is nearly 4 times the health gap.
We also hypothesised that those who with stronger work identity will suffer less from
working longer hours because they gain some identity utility from the match between their
behaviour and self-image. We test this effect by interacting hours worked with strength of
work identity where work identity has been dichotomised (1 if Fairly or Very important, 0
otherwise) to allow sufficient cell sizes (Model 3, Table 5.1). We find that the decrease in
wellbeing with increased hours worked is higher among female employees with weak work
identity compared to those with strong work identity. In fact, among female employees with
strong work identity, job satisfaction increases with hours worked (for 50+ hours the sum of
the main and interaction effects is +0.16, compared with a main effect of -0.75 for women
with weak work identity). This relationship is not observed among male employees. So,
although we find that in general men working part-time are more satisfied with their job than
others, once we control for work identity, we do not find this relationship among strong or
16
weak work identity employees separately. This is possibly due to small sample sizes:
numbers of part-time employed strong and weak work identity men are 86 and 153.
<< Table 5.1 here >>
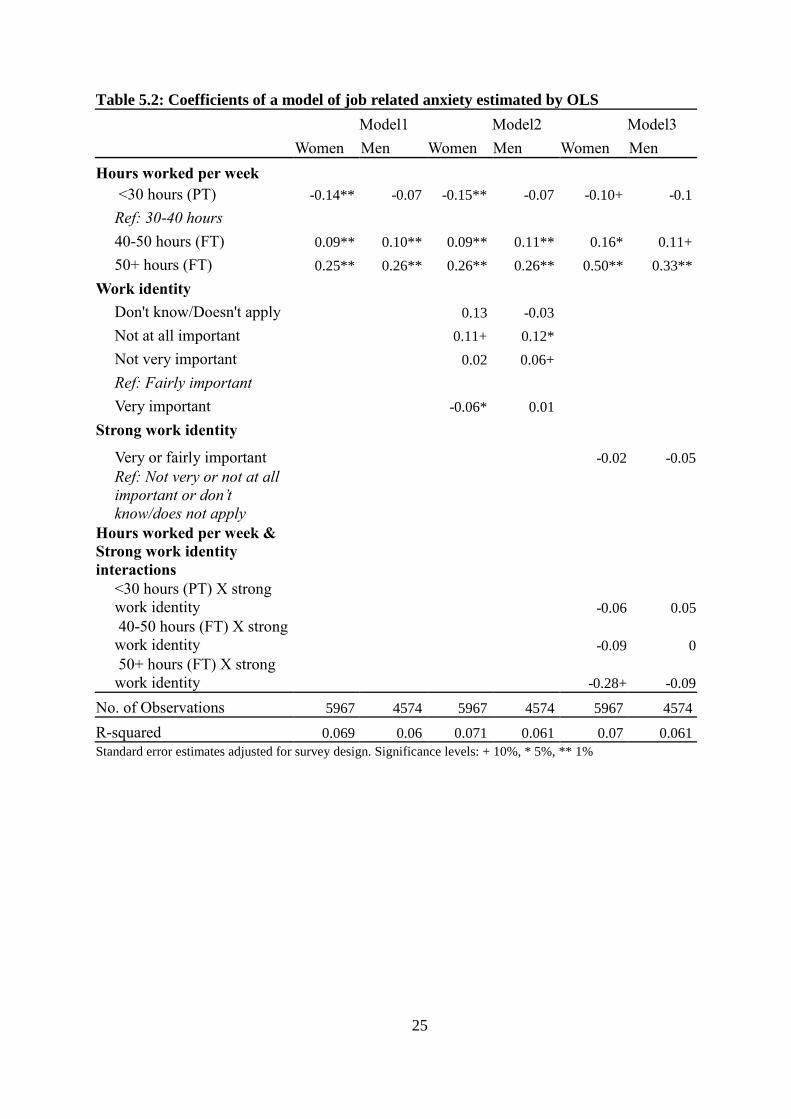
Job-related anxiety
We now consider the affective measures of work-related wellbeing, beginning with
anxiety. Estimated coefficients of Model 1 in Table 5.2 show that work-related anxiety is
higher for those working longer hours and this effect is very similar for both men and
women. The idea that more work is a ‘bad’ and less work is a ‘good’ shows up much more
clearly in anxiety levels than in evaluated job satisfaction, even in the benchmark model not
allowing for identity. The coefficients for hours worked variables have the expected signs and
relative magnitudes and all are significant at the 1% level except for the coefficient on men’s
part-time hours. Working 50 or more hours is associated with an increase of 0.25 on the
anxiety scale, the same amount as associated with poor versus good general health (Table
A2). After we control for work identity, the hours worked coefficients change very little
(Model 2, Table 5.2) for both men and women.
Among men and women with weak work identity, working longer hours has a greater
effect on their job related anxiety than observed among all men and women (compare Models
2 and 3, Table 5.2). However, the differences between the strong and weak identity groups in
Model 3 are only significant for women working longer hours. The difference in the effect of
working 50+ hours compared to 30-40 hours on job-related anxiety between strong and weak
work identity women is negative (-0.28) and statistically significant. While this effect is also
negative for men it is not statistically significant.
Turning to the direct effects of identity, we find that anxiety levels are lower for
employees with stronger work identity, but the effect is weak and imprecisely estimated
(Model 2, Table 5.2). However, while strong work identity does not by itself reduce work
related anxiety, as seen above we find that the negative effect of longer work hours is very
high among those with weak work identity as compared to the whole sample.
<< Table 5.2 here >>
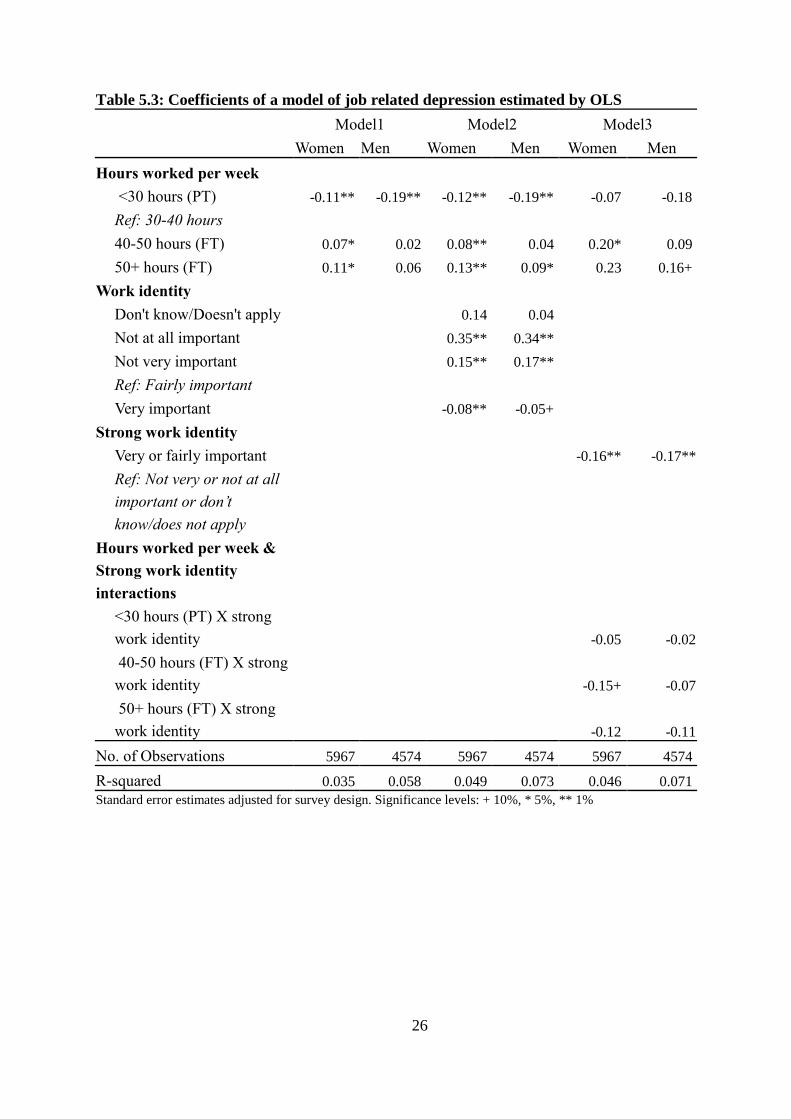
Job-related depression
Working hours are also linked to job-related depression, which is higher for women
working longer hours and lower for both men and women working 30 hours or less as
compared to those working 30-40 hours per week (Model1, Tables 5.3). After we control for
strength of work identity, the effects become slightly stronger and are more precisely
17
estimated for male and female employees (Model 2, Table 5.3). However, they appear
somewhat smaller, relative to the effect of general health, than the anxiety effects (they are
typically about a third of the size of the health effects).
We also find some weak evidence that work identity mitigates the depressive effects
of working more than full-time hours. Among women working 40-50 hours, those with
stronger work identity report lower levels of work related depression than those with weaker
work identity (0.05 vs 0.20), both coefficients are statistically significant (Model 3, Table
5.3).
Testing for the direct effects of identity, we see that male and female employees with
stronger work identity report lower levels job related depression (Model 2, Table 5.3),
consistent with the idea that identity raises self-esteem (Phinney 1990, Cast and Burke 2002.
Studies based on qualitative data and small scale surveys have found evidence of this direct
effect but until this paper this has not been established by large scale survey data.
<< Table 5.3 here >>
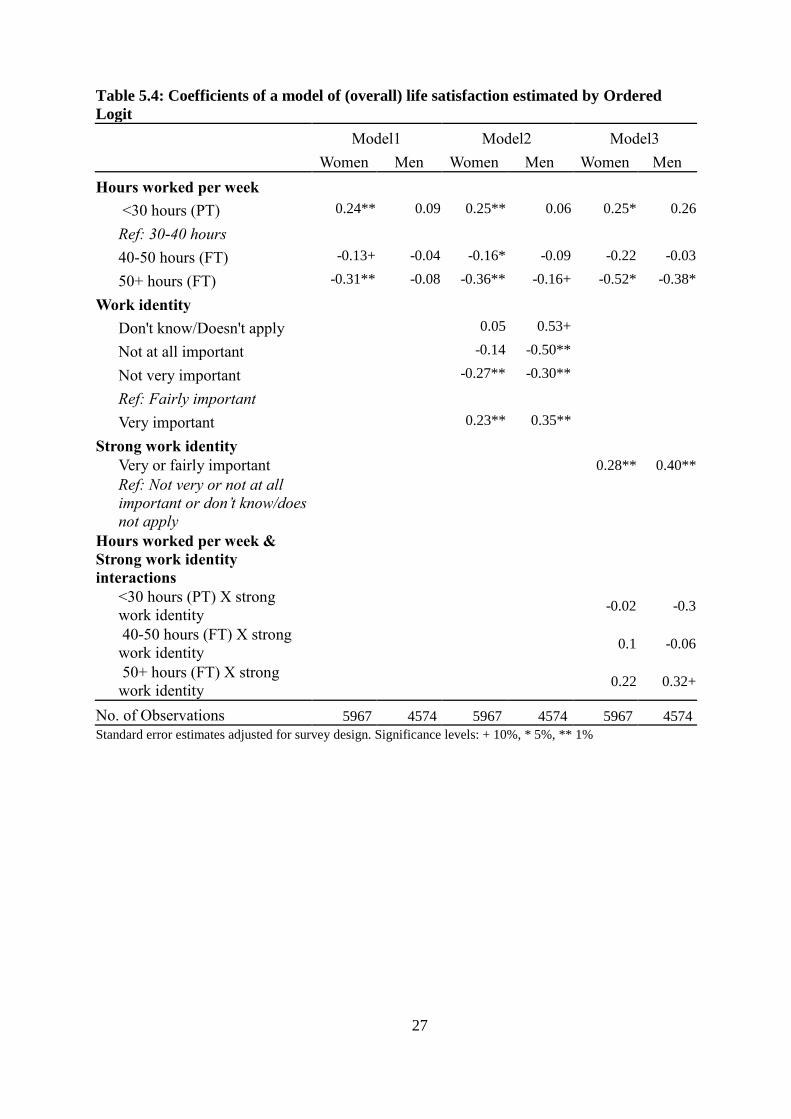
Life satisfaction
Moving beyond the work-specific measures of wellbeing to look at overall life
satisfaction we find that hours worked have no effect on life satisfaction for men but that it
decreases with hours worked for women (Model 1, Table 5.4). Once we control for work
identity, these effects are slightly reinforced and are more precisely estimated, so there is now
evidence that men working 50+ hours also experience significantly lower life satisfaction
(Model 2, Table 5.4). For men the 50+ hours effect is about 15% of the size of the general
health effect while for women it is a third of the gap (Table A2). We find weak evidence of
the hypothesised differential impact on life satisfaction of hours worked by strength of work
identification, but it is statistically significant only for men working more than 50 hours per
week (Model 3, Table 5.4).
Work identity has a positive direct effect on life satisfaction for both men and women
(Model 2, Table 5.4) but the estimates are somewhat larger for men. For them the difference
in satisfaction between the two ends of the identity scale is about 0.9 (0.4 for women), almost
the same size as the health gap (about 40% of health gap for women).
<< Table 5.4 here >>
6. Robustness checks
Robustness check 1: Controlling for unobserved heterogeneity
18
As explained in Section 4, we restrict the sample to those who responded in both
waves 2 and 3, and then re-estimated the above models with and without controlling for
personality traits. Results are in Tables A3.1-3.4 in the Appendix. The top panel, panel A
reports estimated coefficients for hours worked, work identity and their interactions across
the three models without controlling for personality and the bottom panel, panel B, reports
these coefficients estimated after controlling for personality traits. The added personality
traits are significant predictors of wellbeing (in particular of the two satisfaction measures).
These results, particularly that extaversion is positively and neuroticism is negatively
associated with subjective wellbeing, is in line with existing empirical evidence (Lucas and
Diener 2009). Nevertheless we find that the estimated coefficients of hours worked are very
similar between the two panels in each of the Tables A3.1-A3.4. While in some cases the
magnitude of the work hours and work identity coefficients after controlling for personality
traits are slightly smaller (the differences are largest for life satisfaction models), in other
cases the coefficients are little larger – and in particular the interaction effect of long hours
and identity is stronger across almost all models once personality traits are included.7 Thus
we find no evidence that our results are driven by differences in personality that are
correlated with identity or hours worked.
Robustness check 2: Measurement issue - Significance of measuring work identity using the
term “profession”
We find that 85% of those in the top three occupations (managers and senior
occupations, professional and, associated professional & technical occupations) report their
“profession” being fairly or very important to their sense of who they are as opposed to 66%
of employees in other occupations8. While it is possible that employees in the top three
occupations have stronger work identity than others, it is also possible that the work identity
question which asked how important a person’s “profession” was to their sense of who they
were was interpreted as being relevant only employees in these occupations. So, we estimated
the wellbeing models separately for these two samples. In Table A4.1-A4.4 we report the
estimated coefficients for Model 3 only, separately by these two samples and the combined
sample (same estimates as in Tables 5.1-5.4, Model3).
7 Also, note that the results do not change substantially after we restrict the sample to those who responded in
both waves 2 and 3 (compare Table 5.1 with Table A3.1 Panel A, compare Table 5.2 with Table A3.2 Panel A
and so on), although some effects are stronger in the restricted sample. 8 We used the 1 digit SOC2000 classification
19
For the job satisfaction, life satisfaction and depression models we find that the
association of work identity on wellbeing for both samples is positive, and the magnitude is
greater for top three occupations sample. As with the combined sample, the direct effect of
work identity on job related anxiety is statistically insignificant for both samples.
We also find that the negative association of long hours among weak identity workers
was generally stronger among the bottom six occupations and the positive association
between working part-time and wellbeing among weak work identity women is stronger
among the top three occupations. Among weak identity men, the decrease in job related
depression associated with working part time and the decrease in life satisfaction and job
related anxiety associated with working longer hours is also stronger for those in the top three
occupations.
The positive association of long work hours and wellbeing among stronger work
identity workers was also evident only among the employees in the bottom 6 occupations;
except in the case of life satisfaction.
If the work identity question was being mis-interpreted by respondents as being only
relevant for the top three (or professional) occupations then we should have seen the results
only showing up for this sample. In that case, an alternative explanation of the association
between identity and wellbeing could be that those in professional occupations are more
successful which is contributing to their wellbeing. As that is not the case, we conclude that
there is no measurement error. Instead it seems there are substantive differences in the way
work identity affects the relationship between work hours on wellbeing between these two
samples.
Robustness check 3: Is it family identity or work identity that matters
As discussed in Section 4, we wanted to check whether family identity mattered,
particularly for men, and whether some of effects of work identity observed were actually the
effects of family identity and so would disappear once we controlled for family identity. We
included family identity in our models and the estimated coefficients were not statistically
significant and adding this variable did not change the work identity coefficients.
Robustness check 4: Non-response bias
Weighted estimates were similar to unweighted ones, with some changes in the
estimated standard errors. This shows the results are robust to non-response (at the
household, individual and self-completion) level.
Robustness check 5: Are workers in partnerships different from those who are not?
20
As discussed in Section 4, to identify more precise estimates of the relationship between
work hours, work identity and wellbeing (that is not confounded by additional issues of joint
labour supply decisions and correlation between each couple’s wellbeing) we re-estimate the
models for only those workers who are not in partnerships. Note as a result the sample size
drops from 10,541 to 2,588. Comparing workers not in partnerships to those in the whole
sample, we find that, in general, the decrease in wellbeing associated with working longer
hours among workers with weak work identity is stronger as is the mitigating effect of
stronger work identity. In other words, the relationship between work hours, work identity
and subjective wellbeing is a little stronger among workers not in partnerships.
7. Conclusions
Based on theories of social and economic identity, we have investigated the interplay of work
identity and hours of work in determining subjective wellbeing. Basic economic theory posits
work as a source of disutility that should be associated with lower wellbeing and yet previous
empirical research has failed to uncover such a simple relationship. It seems that what counts
is not so much the number of hours as mismatches between hours (and other job
characteristics) and preferences. But what lies behind preferences? We argue that a key
ingredient is the importance of work to a person’s sense of self. Once we account for the role
of work identity, we find effects of work hours on wellbeing that are much more in line with
theoretical expectations. Working long hours is associated with lower wellbeing and working
part-time is associated with higher wellbeing – but with the twist that identity plays a role in
moderating the negative/adverse effects of long hours working.
More specifically, our analysis has uncovered three ways in which identity and hours
interact to determine wellbeing. First, for a given level of hours, having a stronger work
identity is associated with higher wellbeing. This is consistent with predictions from social
psychology that the achievement of identity and its verification in a social role (in this case
that of a worker) leads to higher self-esteem that is reflected in greater subjective wellbeing
(Cast and Burke 2002). The only surprising result we find is that identity is only weakly
related to job-related anxiety (although strongly to job-related depression).
Second, identity plays a mediating role between hours and wellbeing that is consistent
with the sorting of individuals into jobs with work hours that match their identities. Once we
control for identity, and so ‘undo’ the sorting, the expected relationships between hours and
wellbeing are generally revealed or strengthened. The changes are often quite small but we
21
resolve an anomalous result for men: in a standard specification they appear to be more
satisfied working long hours but this effect disappears once we control for identity.
Third, again consistent with identity theory, we find some evidence that work identity
mitigates the adverse effects of long hours working. Women working long hours who have a
strong work identity report less job-related anxiety and higher job satisfaction than similar
women (working long hours) who have a weak work identity, and for men we see a similar
effect on their life satisfaction.
The sizes of the effects are often substantial when benchmarked against the wellbeing
effect of good versus poor health. For instance, long hours are associated with about the same
increase in job-related anxiety as the health effect, part-time work among women is
associated with an increase in job satisfaction that is half the health effect, and the difference
in job satisfaction between the two ends of the identity scale is nearly four times the health
effect.
Our results confirm the role played by work identity in determining wellbeing, both as
a direct factor and indirectly through its interactions with work hours. While the analysis is
cross-sectional, the findings are robust to the inclusion of controls for personality traits and a
series of checks to confirm that our estimates are not confounded by other factors.
References
Akerlof G, Kranton R (2000) Economics and Identity. The Quarterly Journal of Economics
115(3): 715–753.
Angrave D, Charlwood A (2015) What is the relationship between long working hours, over-
employment, under-employment and subjective well-being of workers? Longitudinal
evidence from the UK. Human Relations 68 (9): 1491-1515.
Argyle M (1999) Causes and correlates of happiness. In Kahneman D, Diener E, Schwarz N
(eds) Well-being: The foundations of hedonic psychology. Russell Sage Foundation,
New York, pp 353-373.
Bardasi E, Francesconi M (2004) The impact of atypical employment on individual
wellbeing: evidence from a panel of British workers. Social Science and Medicine
58(9): 1671–1688.
Bell D., Blanchflower D (2011) Underemployment in the UK in the Great Recession.
National Institute Economic Review 215: R23–33.
Berger E (2013) Happy Working Mothers? Investigating the Effect of Maternal Employment
on Life Satisfaction. Economica 80: 23–43.
Blank R (1990) Are part-time jobs lousy jobs? In Burtless G (ed.) A Future of Lousy Jobs?
The Brookings Institute, Washington DC, pp 123–64.
Booth A, van Ours J (2009) Hours of work and Gender Identity: Does Part-time Work Make
the Family Happier? Economica 76: 176-196.
Booth A, van Ours J (2008) Job Satisfaction and Family Happiness: The Part-Time Work
Puzzle. The Economic Journal 118(526): F77-F99.
22
Bunting M (2004) Willing Slaves: How the Overwork Culture is Ruling our Lives. Harper,
London.
Cast A D, Burke P J (2002) A Theory of Self-Esteem. Social Forces, 80(3):1041–1068
Chongvilaivan A, Powdthavee N (2014) Do Different Work Characteristics Have Different
Distributional Impacts on Job Satisfaction? A Study of Slope Heterogeneity in
Workers’ Well-Being. British Journal of Industrial Relations 52(3): 426-444.
Clark, A (1996) Job satisfaction in Britain. British Journal of Industrial Relations 34: 189–
217.
Clark A (1997) Job satisfaction and gender: Why are women so happy at work? Labour
Economics, 4(4): 341–372.
Clark A, Oswald A, Warr P (1996) Is job satisfaction U‐shaped in age? Journal of
Occupational and Organizational Psychology 69(1): 57-81.
Conti G and Pudney S (2011) Survey Design and the Analysis of Satisfaction, Review of
Economics and Statistics, 93(3): 1087–1093.
D’Addio C, Eriksson T, Frijters P (2007) An analysis of the determinants of job satisfaction
when individuals’ baseline satisfaction levels may differ. Applied Economics 39:
2413–23.
Diener E, Lucas R (1999) Personality and subjective well-being. In Kahneman, D, Diener, E,
Schwarz, N (eds) Well-being: The foundations of hedonic psychology. Russell Sage
Foundation, New York, Chapter 11.
Dolan P, Peasgood T, White M (2008) Do we really know what makes us happy? A review
of the economic literature on the factors associated with subjective well-being.
Journal of Economic Psychology 29: 94-122.
Dower M (1965) The Fourth Wave: the Challenge of Leisure. Civic Trust, London (reprinted
from The Architect's Journal, 20 Jan.: 123-90).
Engelhardt H, Kögel T, Prskawetz A (2008) Fertility and women's employment reconsidered:
A macro-level time-series analysis for developed countries, 1960–2000. Population
Studies: A Journal of Demography 58 (1): 109-120.
Ferrer-i-Carbonell A, Frijters P (2004) How important is methodology for the estimates of the
determinants of happiness? The Economic Journal 114 (497): 641-659.
Gash V, Mertens A, Gordo L (2012) The Influence Of Changing Hours Of Work On
Women's Life Satisfaction. The Manchester School 80: 51–74.
Gray M, Qu L, Stanton D, Weston R (2004) Long Work Hours and the Wellbeing of Fathers
and their Families. Australian Journal of Labour Economics 7(2): 255–273.
Green F (2010) Well-being, job satisfaction and labour mobility. Labour Economics 17: 897-
903.
Green F (2008) Work Effort and Worker Well-Being in the Age of Affluence. In Cooper, C,
Burke R (eds.) The Long Work Hours Culture. Causes, Consequences And Choices.
Emerald Group Publications.
Green, Francis and Tsitsianis, Nicholas (2005) An Investigation of National Trends in Job
Satisfaction in Britain and Germany, British Journal of Industrial Relations, 43(3):
401-429.
Hakim C (2002) Lifestyle Preferences as Determinants of Women’s Differentiated Labor
Market Careers, Work and Occupations, 29(4): 428-459
Hogg, M, Abrams D (1990) Social motivation, self-esteem, and social identity. In Abrams D,
Hogg M (eds.) Social identity theory. Constructive and critical advances. Harvester
Wheatsheaf, London, pp: 44–70.
Hogg M A, Terry D J, White K M (1995) A Tale of Two Theories: A Critical Comparison of
Identity Theory With Social Identity Theory. Social Psychology Quarterly, 58:255–
69.
23
Hotopp U (2005) The employment rate of older workers. ONS, Labour market trends.
Iseke A (2014) The Part-Time Job Satisfaction Puzzle: Different Types of Job Discrepancies
and the Moderating Effect of Family Importance. British Journal of Industrial
Relations 52(3): 445–469.
Kahn H, Wiener A (1967) The Year 2000: A framework for Speculation on the Next Thirty-
three Years. Macmillan, New York.
Keynes JM (1930); reprinted Keynes JM (1963) Essays in Persuasion, New York: WW
Norton & Co.
Lucas R, Diener E (2009) Personality and Subjective Well-Being. In Diener E (ed) The
Science of Well-Being: The collected works of Ed Diener, Social Indicators Research
Series, 37: 75-102.
Nandi A, Platt L (2012) Developing ethnic identity questions for Understanding Society.
Longitudinal and Life Course Studies 3(1): 80-100.
Ng T, Feldman D (2008) Long work hours: a social identity perspective on meta-analysis
data. Journal of Organizational Behavior 29: 853-880.
ONS (2014) Statistical Bulletin: UK Labour Market, September 2014.
Pereira M, Coelho F (2013) Work Hours and Well Being: An Investigation of Moderator
Effects. Social Indicators Research 111(1): 235–253.
Phinney J (1990) Ethnic Identity in Adolescents and Adults: Review of Research.
Psychological Bulletin 108 (3): 499-514.
Possenriede, D, Plantenga J (2014) Temporal and Locational Flexibility of Work, Working-
Time Fit, and Job Satisfaction. IZA Discussion Paper No. 8436.
Skidelsky R, Skidelsky E (2013) How Much is Enough?: Money and the Good Life. Penguin
Schor J (1992) The Overworked American: the Unexpected Decline of Leisure. Basic Books,
New York.
Schwarz N, Strack F (1999) Reports of Subjective Well-Being: Judgmental Processes and
Their Methodological Implications. In Kahneman D, Diener E, Schwarz N (eds) Well-
being: The foundations of hedonic psychology. Russell Sage Foundation, New York,
Chapter 4. Stets J, Burke P (2000) Identity Theory and Social Identity Theory. Social Psychology
Quarterly 63(3): 224–237.
Stryker S(1968) Identity Salience and Role Performance. Journal of Marriage and the
Family 4: 558–64.
Stryker S, Serpe R T (1982) Commitment, Identity Salience, and Role Behavior: A Theory
and Research Example. In Ickes W, Knowles E S (eds) Personality, Roles, and Social
Behavior, 199-218. New York: Springer- Verlag
Tajfel H (1974) Social identity and intergroup behaviour. Social Science Information 13: 65-
93.
Tajfel H (1981) Human Groups and Social Categories, Cambridge University Press.
Turner J, Oakes P, Haslam S, McGarty C (1994) Self and Collective: Cognition and Social
Context, Personality and Social Psychology Bulletin, 20: 454.
Thorsteinson T (2003) Job attitudes of part-time vs. full-time workers: a meta-analytic
review, Journal of Occupational and Organizational Psychology 76: 151–77.
Warr P (1990) The measurement of well-being and other aspects of mental health, Journal of
Occupational Psychology, 63: 193–210.
Wooden M, Warren D, Drago R (2009) Working time mismatch and subjective well-being.
British Journal of Industrial Relations 47(1): 147-179.
Wunder C, Heineck G (2013) Working Time Preferences, Hours Mismatch and Well-Being
of Couples: Are There Spillovers? Labour Economics 24: 244–52.
24
Tables
Table 5.1: Coefficients of a model of job satisfaction estimated by Ordered Logit
Model1 Model2 Model3
Women Men Women Men Women Men
Hours worked per week
<30 hours (PT) 0.19** 0.28* 0.23** 0.22+ 0.04 0
Ref: 30-40 hours
40-50 hours (FT) 0.13* 0.13* 0.05 0.03 -0.15 0.02
50+ hours (FT) 0.1 0.16* -0.04 0.01 -0.75* -0.06
Work identity
Don't know/Doesn't apply
-0.09 -0.28
Not at all important
-1.22** -1.33**
Not very important
-0.65** -0.80**
Ref: Fairly important
Very important
0.66** 0.54**
Strong work identity
Very or fairly important
0.72** 0.95**
Ref: Not very or not at all
important or don’t
know/does not apply
Hours worked per week &
Strong work identity
interactions
<30 hours (PT) X strong
work identity 0.23+ 0.42
40-50 hours (FT) X strong
work identity 0.32* 0.07
50+ hours (FT) X strong
work identity 0.91* 0.17
No. of Observations 5967 4574 5967 4574 5967 4574
Standard error estimates adjusted for survey design. Significance levels: + 10%, * 5%, ** 1%
25
Table 5.2: Coefficients of a model of job related anxiety estimated by OLS
Model1 Model2 Model3
Women Men Women Men Women Men
Hours worked per week
<30 hours (PT) -0.14** -0.07 -0.15** -0.07 -0.10+ -0.1
Ref: 30-40 hours
40-50 hours (FT) 0.09** 0.10** 0.09** 0.11** 0.16* 0.11+
50+ hours (FT) 0.25** 0.26** 0.26** 0.26** 0.50** 0.33**
Work identity Don't know/Doesn't apply
0.13 -0.03
Not at all important
0.11+ 0.12*
Not very important
0.02 0.06+
Ref: Fairly important
Very important
-0.06* 0.01
Strong work identity
Very or fairly important
-0.02 -0.05
Ref: Not very or not at all
important or don’t
know/does not apply
Hours worked per week &
Strong work identity
interactions
<30 hours (PT) X strong
work identity
-0.06 0.05
40-50 hours (FT) X strong
work identity
-0.09 0
50+ hours (FT) X strong
work identity
-0.28+ -0.09
No. of Observations 5967 4574 5967 4574 5967 4574
R-squared 0.069 0.06 0.071 0.061 0.07 0.061
Standard error estimates adjusted for survey design. Significance levels: + 10%, * 5%, ** 1%
26
Table 5.3: Coefficients of a model of job related depression estimated by OLS
Model1 Model2 Model3
Women Men Women Men Women Men
Hours worked per week
<30 hours (PT) -0.11** -0.19** -0.12** -0.19** -0.07 -0.18
Ref: 30-40 hours
40-50 hours (FT) 0.07* 0.02 0.08** 0.04 0.20* 0.09
50+ hours (FT) 0.11* 0.06 0.13** 0.09* 0.23 0.16+
Work identity Don't know/Doesn't apply
0.14 0.04
Not at all important
0.35** 0.34**
Not very important
0.15** 0.17**
Ref: Fairly important
Very important
-0.08** -0.05+
Strong work identity Very or fairly important
-0.16** -0.17**
Ref: Not very or not at all
important or don’t
know/does not apply
Hours worked per week &
Strong work identity
interactions
<30 hours (PT) X strong
work identity
-0.05 -0.02
40-50 hours (FT) X strong
work identity
-0.15+ -0.07
50+ hours (FT) X strong
work identity
-0.12 -0.11
No. of Observations 5967 4574 5967 4574 5967 4574
R-squared 0.035 0.058 0.049 0.073 0.046 0.071
Standard error estimates adjusted for survey design. Significance levels: + 10%, * 5%, ** 1%
27
Table 5.4: Coefficients of a model of (overall) life satisfaction estimated by Ordered
Logit
Model1 Model2 Model3
Women Men Women Men Women Men
Hours worked per week
<30 hours (PT) 0.24** 0.09 0.25** 0.06 0.25* 0.26
Ref: 30-40 hours
40-50 hours (FT) -0.13+ -0.04 -0.16* -0.09 -0.22 -0.03
50+ hours (FT) -0.31** -0.08 -0.36** -0.16+ -0.52* -0.38*
Work identity
Don't know/Doesn't apply 0.05 0.53+
Not at all important -0.14 -0.50**
Not very important -0.27** -0.30**
Ref: Fairly important
Very important 0.23** 0.35**
Strong work identity Very or fairly important
0.28** 0.40**
Ref: Not very or not at all
important or don’t know/does
not apply
Hours worked per week &
Strong work identity
interactions
<30 hours (PT) X strong
work identity -0.02 -0.3
40-50 hours (FT) X strong
work identity 0.1 -0.06
50+ hours (FT) X strong
work identity 0.22 0.32+
No. of Observations 5967 4574 5967 4574 5967 4574
Standard error estimates adjusted for survey design. Significance levels: + 10%, * 5%, ** 1%
28
Appendix
Table A1: Descriptive statistics of the analysis sample
Men Women p-value
Age group 0.05
22-29 years 15% 14%
30-49 years 59% 58%
50-59 years 26% 28%
Highest educational qualifications
0.00
First degree or higher 29% 29%
Other higher degree 13% 16%
A-level or equivalent 23% 19%
GCSE or equivalent 21% 24%
Other qualification 8% 7%
No qualifications 4% 5%
Marital status 0.00
Married 60% 56%
Cohabiting 19% 17%
Never married 15% 14%
Separated, divorced or widowed 6% 13%
Region of residence 0.11
London 6% 5%
Rest of England 76% 76%
Wales 5% 5%
Scotland 9% 9%
Northern Ireland 5% 5%
General health status (SF1) 0.19
Fair or poor health 12% 11%
Good, very good or excellent health 88% 89%
Has a long standing disability or illness? 0.21
No 75% 74%
Yes 24% 26%
Has at least one child younger than 5 years old in the
household?
0.00
No 82% 86%
Yes 18% 14%
Owns the house living in? 0.02
No 21% 23%
Yes 79% 77%
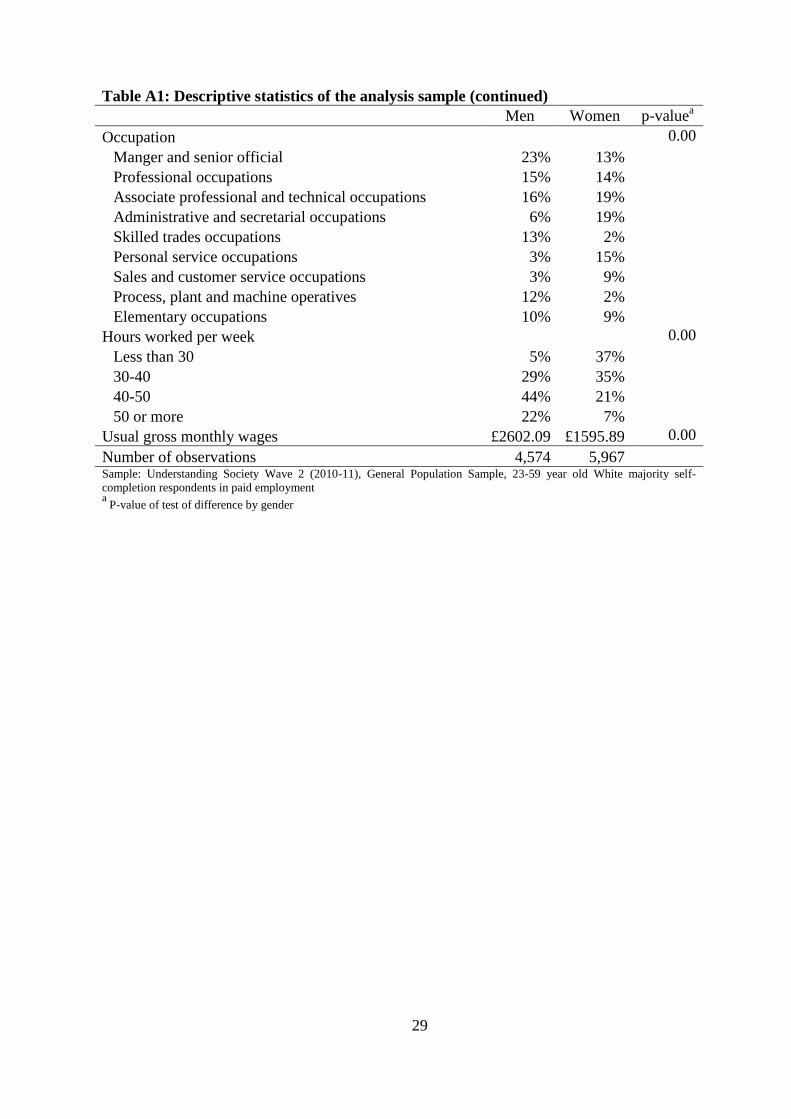
29
Table A1: Descriptive statistics of the analysis sample (continued)
Men Women p-valuea
Occupation 0.00
Manger and senior official 23% 13%
Professional occupations 15% 14%
Associate professional and technical occupations 16% 19%
Administrative and secretarial occupations 6% 19%
Skilled trades occupations 13% 2%
Personal service occupations 3% 15%
Sales and customer service occupations 3% 9%
Process, plant and machine operatives 12% 2%
Elementary occupations 10% 9%
Hours worked per week 0.00
Less than 30 5% 37%
30-40 29% 35%
40-50 44% 21%
50 or more 22% 7%
Usual gross monthly wages £2602.09 £1595.89 0.00
Number of observations 4,574 5,967 Sample: Understanding Society Wave 2 (2010-11), General Population Sample, 23-59 year old White majority self-
completion respondents in paid employment a
P-value of test of difference by gender
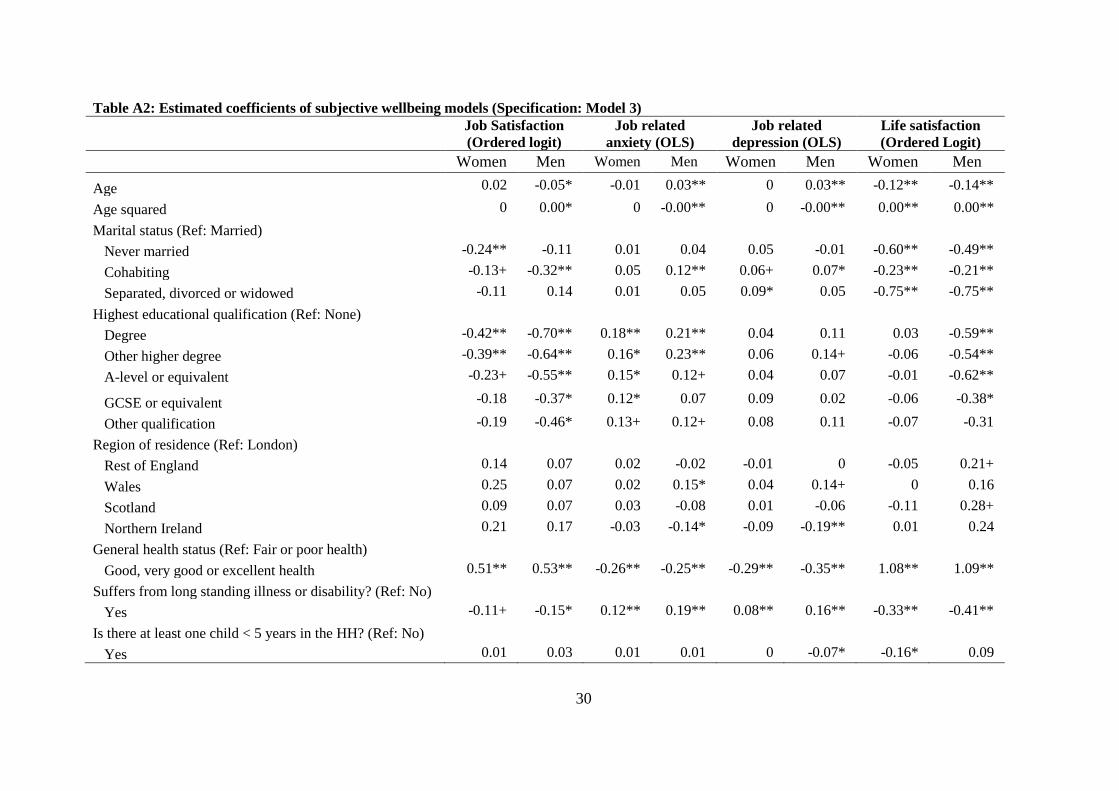
30
Table A2: Estimated coefficients of subjective wellbeing models (Specification: Model 3)
Job Satisfaction
(Ordered logit)
Job related
anxiety (OLS)
Job related
depression (OLS)
Life satisfaction
(Ordered Logit)
Women Men Women Men Women Men Women Men
Age 0.02 -0.05* -0.01 0.03** 0 0.03** -0.12** -0.14**
Age squared 0 0.00* 0 -0.00** 0 -0.00** 0.00** 0.00**
Marital status (Ref: Married)
Never married -0.24** -0.11 0.01 0.04 0.05 -0.01 -0.60** -0.49**
Cohabiting -0.13+ -0.32** 0.05 0.12** 0.06+ 0.07* -0.23** -0.21**
Separated, divorced or widowed -0.11 0.14 0.01 0.05 0.09* 0.05 -0.75** -0.75**
Highest educational qualification (Ref: None)
Degree -0.42** -0.70** 0.18** 0.21** 0.04 0.11 0.03 -0.59**
Other higher degree -0.39** -0.64** 0.16* 0.23** 0.06 0.14+ -0.06 -0.54**
A-level or equivalent -0.23+ -0.55** 0.15* 0.12+ 0.04 0.07 -0.01 -0.62**
GCSE or equivalent -0.18 -0.37* 0.12* 0.07 0.09 0.02 -0.06 -0.38*
Other qualification -0.19 -0.46* 0.13+ 0.12+ 0.08 0.11 -0.07 -0.31
Region of residence (Ref: London)
Rest of England 0.14 0.07 0.02 -0.02 -0.01 0 -0.05 0.21+
Wales 0.25 0.07 0.02 0.15* 0.04 0.14+ 0 0.16
Scotland 0.09 0.07 0.03 -0.08 0.01 -0.06 -0.11 0.28+
Northern Ireland 0.21 0.17 -0.03 -0.14* -0.09 -0.19** 0.01 0.24
General health status (Ref: Fair or poor health)
Good, very good or excellent health 0.51** 0.53** -0.26** -0.25** -0.29** -0.35** 1.08** 1.09**
Suffers from long standing illness or disability? (Ref: No)
Yes -0.11+ -0.15* 0.12** 0.19** 0.08** 0.16** -0.33** -0.41**
Is there at least one child < 5 years in the HH? (Ref: No)
Yes 0.01 0.03 0.01 0.01 0 -0.07* -0.16* 0.09
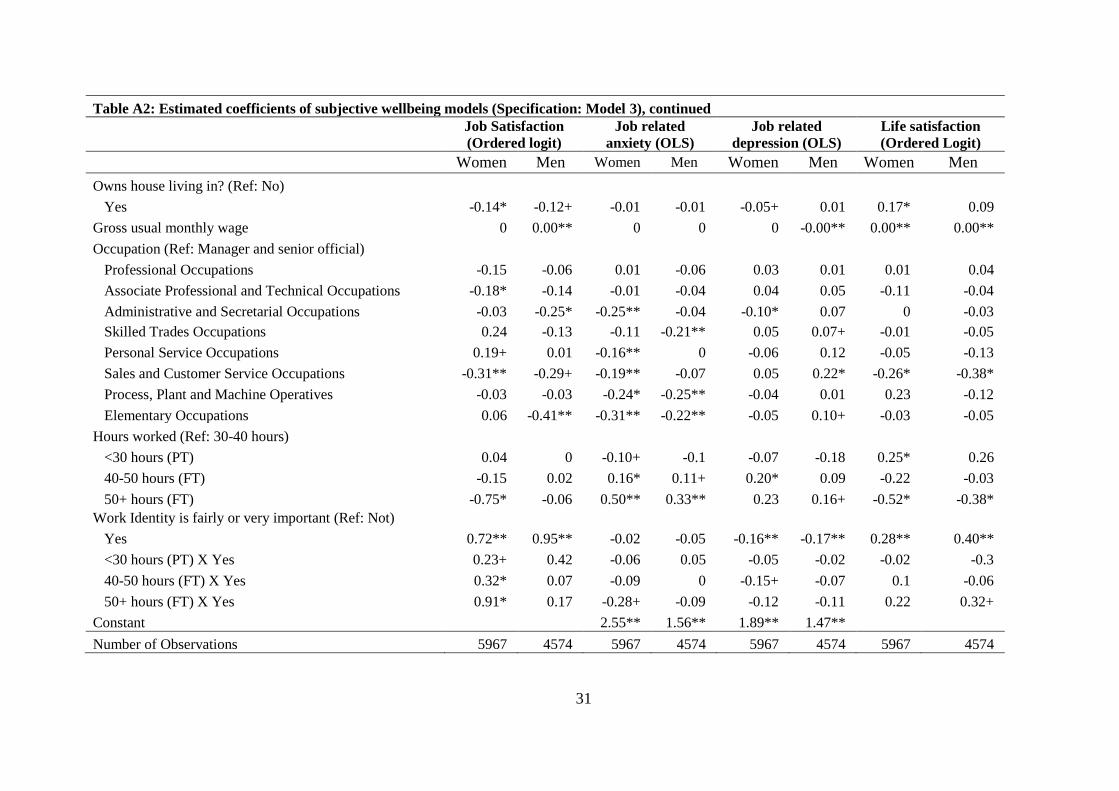
31
Table A2: Estimated coefficients of subjective wellbeing models (Specification: Model 3), continued
Job Satisfaction
(Ordered logit)
Job related
anxiety (OLS)
Job related
depression (OLS)
Life satisfaction
(Ordered Logit)
Women Men Women Men Women Men Women Men
Owns house living in? (Ref: No)
Yes -0.14* -0.12+ -0.01 -0.01 -0.05+ 0.01 0.17* 0.09
Gross usual monthly wage 0 0.00** 0 0 0 -0.00** 0.00** 0.00**
Occupation (Ref: Manager and senior official)
Professional Occupations -0.15 -0.06 0.01 -0.06 0.03 0.01 0.01 0.04
Associate Professional and Technical Occupations -0.18* -0.14 -0.01 -0.04 0.04 0.05 -0.11 -0.04
Administrative and Secretarial Occupations -0.03 -0.25* -0.25** -0.04 -0.10* 0.07 0 -0.03
Skilled Trades Occupations 0.24 -0.13 -0.11 -0.21** 0.05 0.07+ -0.01 -0.05
Personal Service Occupations 0.19+ 0.01 -0.16** 0 -0.06 0.12 -0.05 -0.13
Sales and Customer Service Occupations -0.31** -0.29+ -0.19** -0.07 0.05 0.22* -0.26* -0.38*
Process, Plant and Machine Operatives -0.03 -0.03 -0.24* -0.25** -0.04 0.01 0.23 -0.12
Elementary Occupations 0.06 -0.41** -0.31** -0.22** -0.05 0.10+ -0.03 -0.05
Hours worked (Ref: 30-40 hours)
<30 hours (PT) 0.04 0 -0.10+ -0.1 -0.07 -0.18 0.25* 0.26
40-50 hours (FT) -0.15 0.02 0.16* 0.11+ 0.20* 0.09 -0.22 -0.03
50+ hours (FT) -0.75* -0.06 0.50** 0.33** 0.23 0.16+ -0.52* -0.38*
Work Identity is fairly or very important (Ref: Not)
Yes 0.72** 0.95** -0.02 -0.05 -0.16** -0.17** 0.28** 0.40**
<30 hours (PT) X Yes 0.23+ 0.42 -0.06 0.05 -0.05 -0.02 -0.02 -0.3
40-50 hours (FT) X Yes 0.32* 0.07 -0.09 0 -0.15+ -0.07 0.1 -0.06
50+ hours (FT) X Yes 0.91* 0.17 -0.28+ -0.09 -0.12 -0.11 0.22 0.32+
Constant
2.55** 1.56** 1.89** 1.47**
Number of Observations 5967 4574 5967 4574 5967 4574 5967 4574

32
Table A3.1: Coefficients of a model of job satisfaction estimated by Ordered Logit
Panel A: Additional sample restriction: Responded in Wave 3 self-completion
questionnaire
Model1 Model2 Model3
Women Men Women Men Women Men
Hours worked per week
<30 hours (PT) 0.13+ 0.37* 0.18* 0.27+ -0.02 -0.04
Ref: 30-40 hours
40-50 hours (FT) 0.1 0.14+ 0.02 0.03 -0.17 0.08
50+ hours (FT) 0.05 0.16+ -0.08 -0.02 -1.12** -0.13
Work identity
Don't know/Doesn't apply 0.02 -0.28
Not at all important -1.15** -1.32**
Not very important -0.64** -0.82**
Ref: Fairly important
Very important 0.66** 0.60**
Strong work identity
Very or fairly important 0.68** 0.99**
Ref: Not very or not at all
important or don’t
know/does not apply
Hours worked per week &
Strong work identity
interactions
<30 hours (PT) X strong
work identity 0.24+ 0.58+
40-50 hours (FT) X strong
work identity 0.31+ -0.01
50+ hours (FT) X strong
work identity 1.29** 0.22
No. of Observations 4779 3569 4779 3569 4779 3569
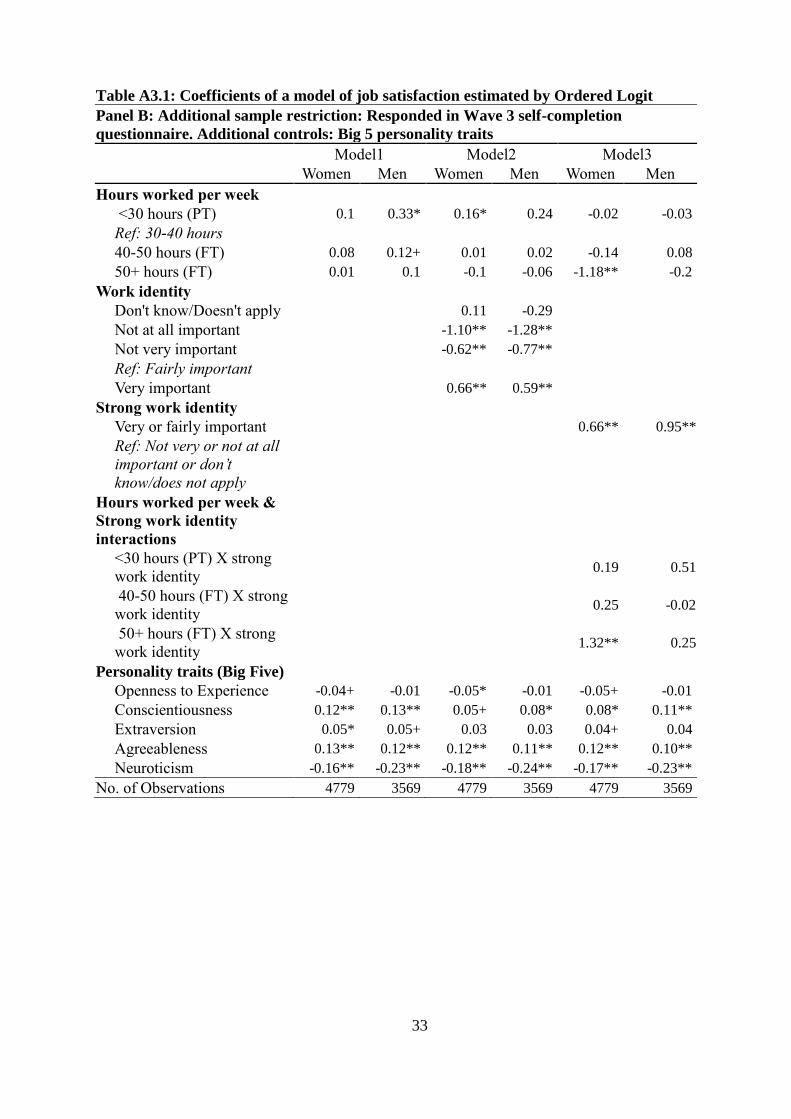
33
Table A3.1: Coefficients of a model of job satisfaction estimated by Ordered Logit
Panel B: Additional sample restriction: Responded in Wave 3 self-completion
questionnaire. Additional controls: Big 5 personality traits
Model1 Model2 Model3
Women Men Women Men Women Men
Hours worked per week
<30 hours (PT) 0.1 0.33* 0.16* 0.24 -0.02 -0.03
Ref: 30-40 hours
40-50 hours (FT) 0.08 0.12+ 0.01 0.02 -0.14 0.08
50+ hours (FT) 0.01 0.1 -0.1 -0.06 -1.18** -0.2
Work identity
Don't know/Doesn't apply 0.11 -0.29
Not at all important -1.10** -1.28**
Not very important -0.62** -0.77**
Ref: Fairly important
Very important 0.66** 0.59**
Strong work identity
Very or fairly important 0.66** 0.95**
Ref: Not very or not at all
important or don’t
know/does not apply
Hours worked per week &
Strong work identity
interactions
<30 hours (PT) X strong
work identity 0.19 0.51
40-50 hours (FT) X strong
work identity 0.25 -0.02
50+ hours (FT) X strong
work identity 1.32** 0.25
Personality traits (Big Five)
Openness to Experience -0.04+ -0.01 -0.05* -0.01 -0.05+ -0.01
Conscientiousness 0.12** 0.13** 0.05+ 0.08* 0.08* 0.11**
Extraversion 0.05* 0.05+ 0.03 0.03 0.04+ 0.04
Agreeableness 0.13** 0.12** 0.12** 0.11** 0.12** 0.10**
Neuroticism -0.16** -0.23** -0.18** -0.24** -0.17** -0.23**
No. of Observations 4779 3569 4779 3569 4779 3569
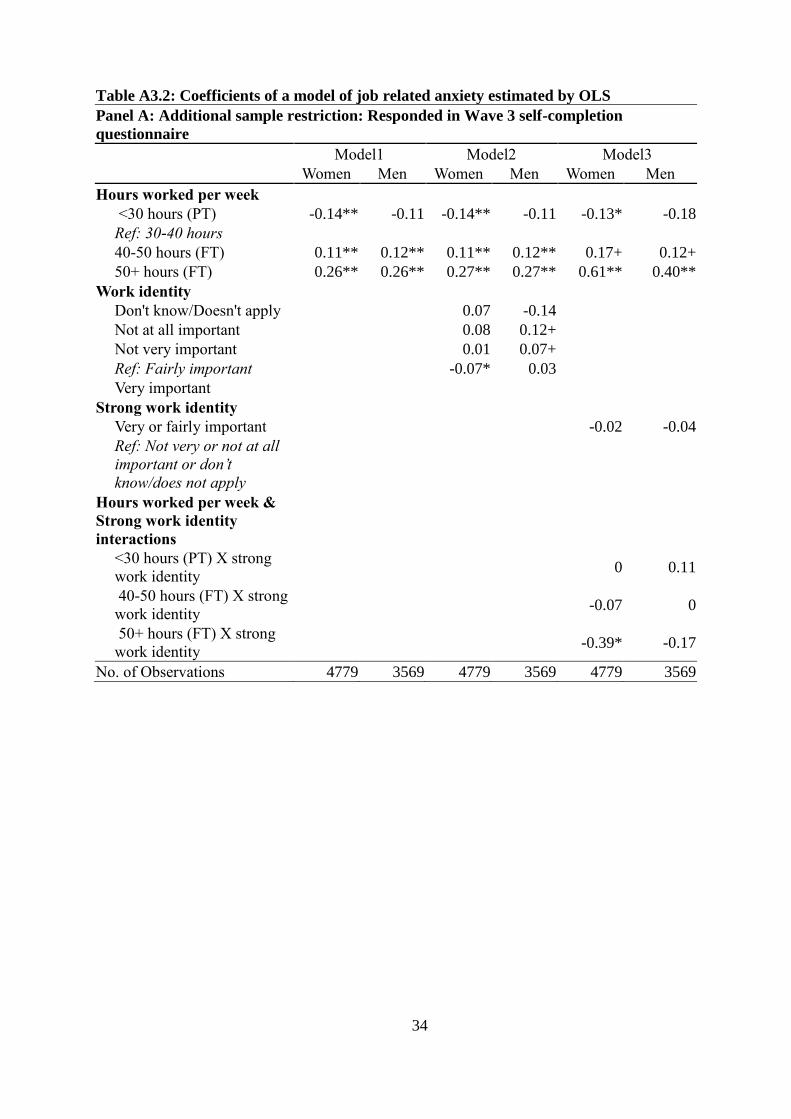
34
Table A3.2: Coefficients of a model of job related anxiety estimated by OLS
Panel A: Additional sample restriction: Responded in Wave 3 self-completion
questionnaire
Model1 Model2 Model3
Women Men Women Men Women Men
Hours worked per week
<30 hours (PT) -0.14** -0.11 -0.14** -0.11 -0.13* -0.18
Ref: 30-40 hours
40-50 hours (FT) 0.11** 0.12** 0.11** 0.12** 0.17+ 0.12+
50+ hours (FT) 0.26** 0.26** 0.27** 0.27** 0.61** 0.40**
Work identity
Don't know/Doesn't apply 0.07 -0.14
Not at all important 0.08 0.12+
Not very important 0.01 0.07+
Ref: Fairly important -0.07* 0.03
Very important
Strong work identity
Very or fairly important -0.02 -0.04
Ref: Not very or not at all
important or don’t
know/does not apply
Hours worked per week &
Strong work identity
interactions
<30 hours (PT) X strong
work identity 0 0.11
40-50 hours (FT) X strong
work identity -0.07 0
50+ hours (FT) X strong
work identity -0.39* -0.17
No. of Observations 4779 3569 4779 3569 4779 3569
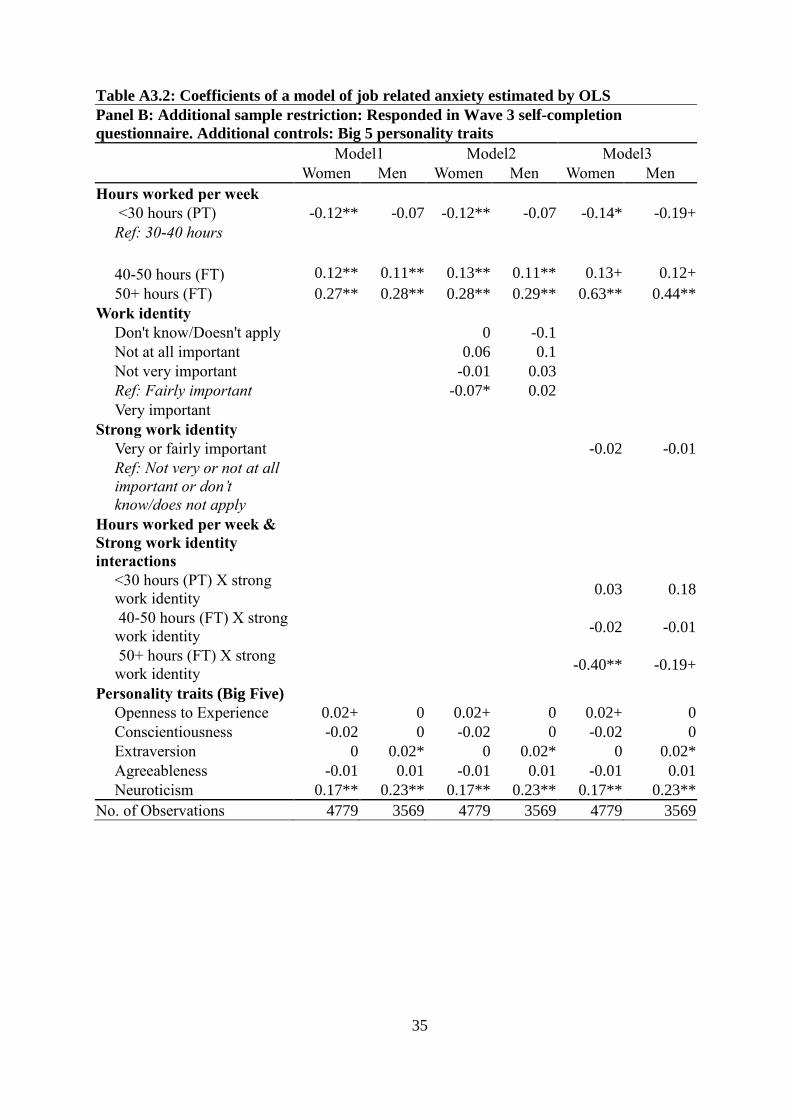
35
Table A3.2: Coefficients of a model of job related anxiety estimated by OLS
Panel B: Additional sample restriction: Responded in Wave 3 self-completion
questionnaire. Additional controls: Big 5 personality traits
Model1 Model2 Model3
Women Men Women Men Women Men
Hours worked per week
<30 hours (PT) -0.12** -0.07 -0.12** -0.07 -0.14* -0.19+
Ref: 30-40 hours
40-50 hours (FT) 0.12** 0.11** 0.13** 0.11** 0.13+ 0.12+
50+ hours (FT) 0.27** 0.28** 0.28** 0.29** 0.63** 0.44**
Work identity
Don't know/Doesn't apply 0 -0.1
Not at all important 0.06 0.1
Not very important -0.01 0.03
Ref: Fairly important -0.07* 0.02
Very important
Strong work identity
Very or fairly important -0.02 -0.01
Ref: Not very or not at all
important or don’t
know/does not apply
Hours worked per week &
Strong work identity
interactions
<30 hours (PT) X strong
work identity 0.03 0.18
40-50 hours (FT) X strong
work identity -0.02 -0.01
50+ hours (FT) X strong
work identity -0.40** -0.19+
Personality traits (Big Five)
Openness to Experience 0.02+ 0 0.02+ 0 0.02+ 0
Conscientiousness -0.02 0 -0.02 0 -0.02 0
Extraversion 0 0.02* 0 0.02* 0 0.02*
Agreeableness -0.01 0.01 -0.01 0.01 -0.01 0.01
Neuroticism 0.17** 0.23** 0.17** 0.23** 0.17** 0.23**
No. of Observations 4779 3569 4779 3569 4779 3569
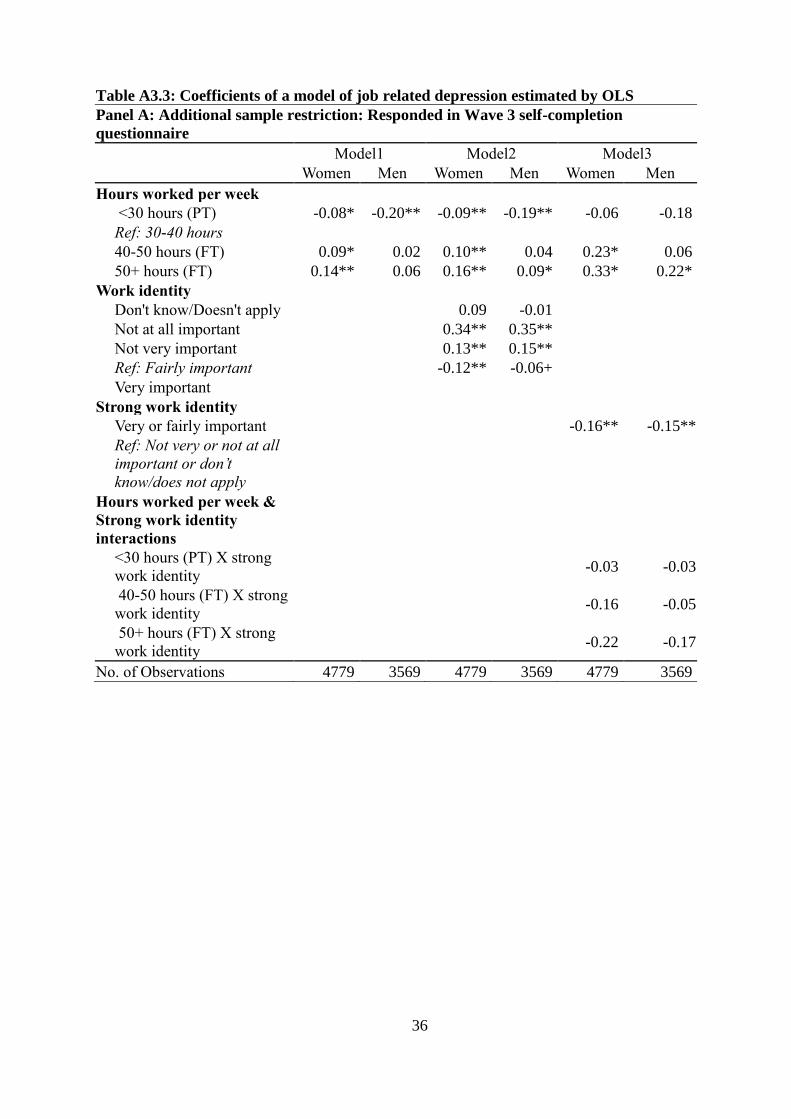
36
Table A3.3: Coefficients of a model of job related depression estimated by OLS
Panel A: Additional sample restriction: Responded in Wave 3 self-completion
questionnaire
Model1 Model2 Model3
Women Men Women Men Women Men
Hours worked per week
<30 hours (PT) -0.08* -0.20** -0.09** -0.19** -0.06 -0.18
Ref: 30-40 hours
40-50 hours (FT) 0.09* 0.02 0.10** 0.04 0.23* 0.06
50+ hours (FT) 0.14** 0.06 0.16** 0.09* 0.33* 0.22*
Work identity
Don't know/Doesn't apply 0.09 -0.01
Not at all important 0.34** 0.35**
Not very important 0.13** 0.15**
Ref: Fairly important -0.12** -0.06+
Very important
Strong work identity
Very or fairly important -0.16** -0.15**
Ref: Not very or not at all
important or don’t
know/does not apply
Hours worked per week &
Strong work identity
interactions
<30 hours (PT) X strong
work identity -0.03 -0.03
40-50 hours (FT) X strong
work identity -0.16 -0.05
50+ hours (FT) X strong
work identity -0.22 -0.17
No. of Observations 4779 3569 4779 3569 4779 3569
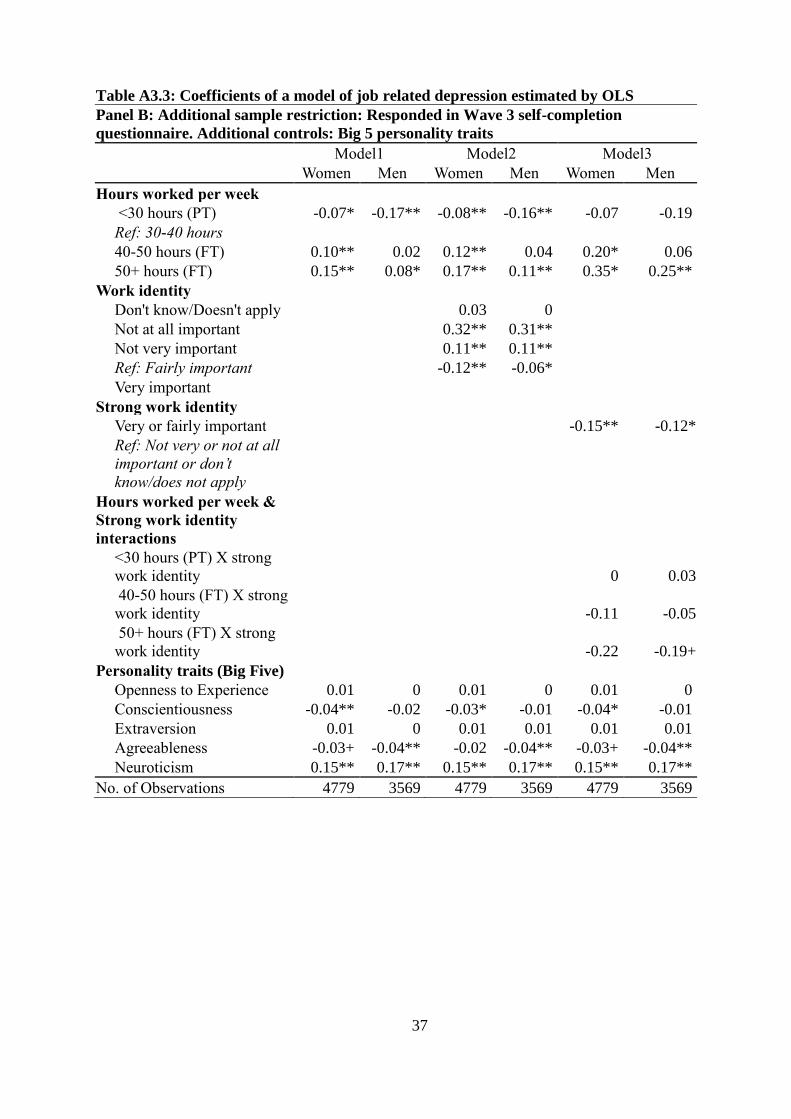
37
Table A3.3: Coefficients of a model of job related depression estimated by OLS
Panel B: Additional sample restriction: Responded in Wave 3 self-completion
questionnaire. Additional controls: Big 5 personality traits
Model1 Model2 Model3
Women Men Women Men Women Men
Hours worked per week
<30 hours (PT) -0.07* -0.17** -0.08** -0.16** -0.07 -0.19
Ref: 30-40 hours
40-50 hours (FT) 0.10** 0.02 0.12** 0.04 0.20* 0.06
50+ hours (FT) 0.15** 0.08* 0.17** 0.11** 0.35* 0.25**
Work identity
Don't know/Doesn't apply 0.03 0
Not at all important 0.32** 0.31**
Not very important 0.11** 0.11**
Ref: Fairly important -0.12** -0.06*
Very important
Strong work identity
Very or fairly important -0.15** -0.12*
Ref: Not very or not at all
important or don’t
know/does not apply
Hours worked per week &
Strong work identity
interactions
<30 hours (PT) X strong
work identity
0 0.03
40-50 hours (FT) X strong
work identity
-0.11 -0.05
50+ hours (FT) X strong
work identity -0.22 -0.19+
Personality traits (Big Five)
Openness to Experience 0.01 0 0.01 0 0.01 0
Conscientiousness -0.04** -0.02 -0.03* -0.01 -0.04* -0.01
Extraversion 0.01 0 0.01 0.01 0.01 0.01
Agreeableness -0.03+ -0.04** -0.02 -0.04** -0.03+ -0.04**
Neuroticism 0.15** 0.17** 0.15** 0.17** 0.15** 0.17**
No. of Observations 4779 3569 4779 3569 4779 3569
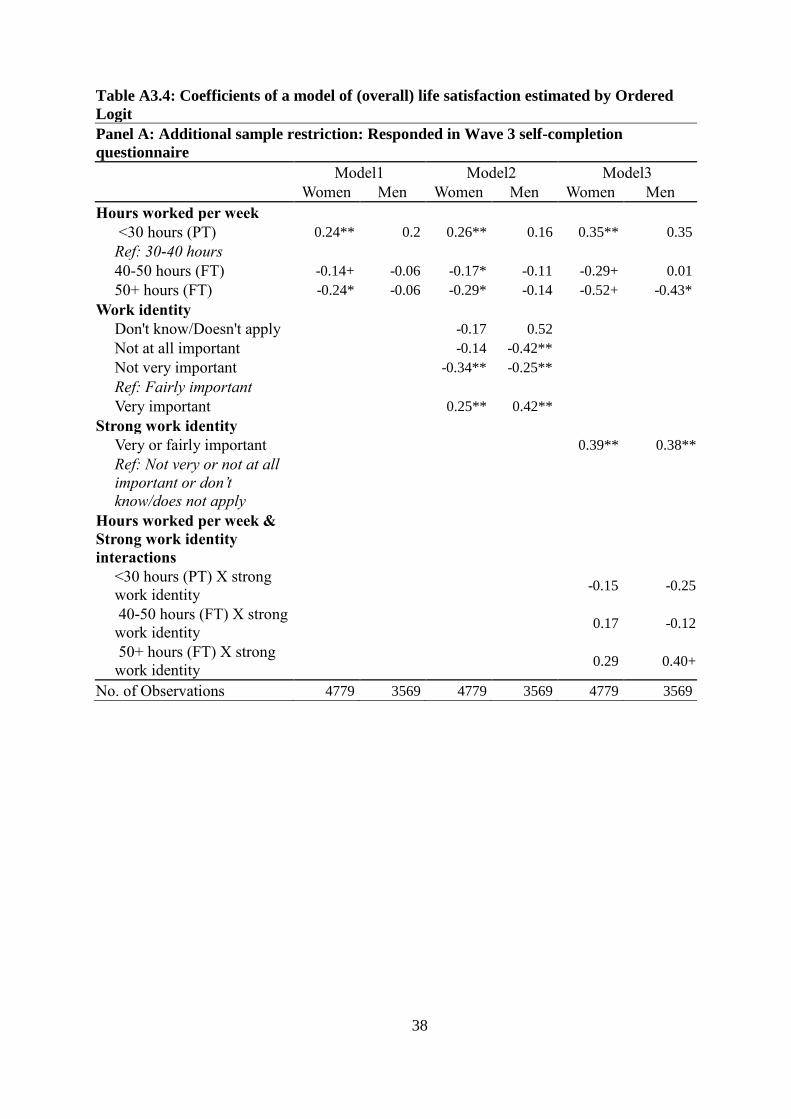
38
Table A3.4: Coefficients of a model of (overall) life satisfaction estimated by Ordered
Logit
Panel A: Additional sample restriction: Responded in Wave 3 self-completion
questionnaire
Model1 Model2 Model3
Women Men Women Men Women Men
Hours worked per week
<30 hours (PT) 0.24** 0.2 0.26** 0.16 0.35** 0.35
Ref: 30-40 hours
40-50 hours (FT) -0.14+ -0.06 -0.17* -0.11 -0.29+ 0.01
50+ hours (FT) -0.24* -0.06 -0.29* -0.14 -0.52+ -0.43*
Work identity
Don't know/Doesn't apply -0.17 0.52
Not at all important -0.14 -0.42**
Not very important -0.34** -0.25**
Ref: Fairly important
Very important 0.25** 0.42**
Strong work identity
Very or fairly important 0.39** 0.38**
Ref: Not very or not at all
important or don’t
know/does not apply
Hours worked per week &
Strong work identity
interactions
<30 hours (PT) X strong
work identity -0.15 -0.25
40-50 hours (FT) X strong
work identity 0.17 -0.12
50+ hours (FT) X strong
work identity 0.29 0.40+
No. of Observations 4779 3569 4779 3569 4779 3569
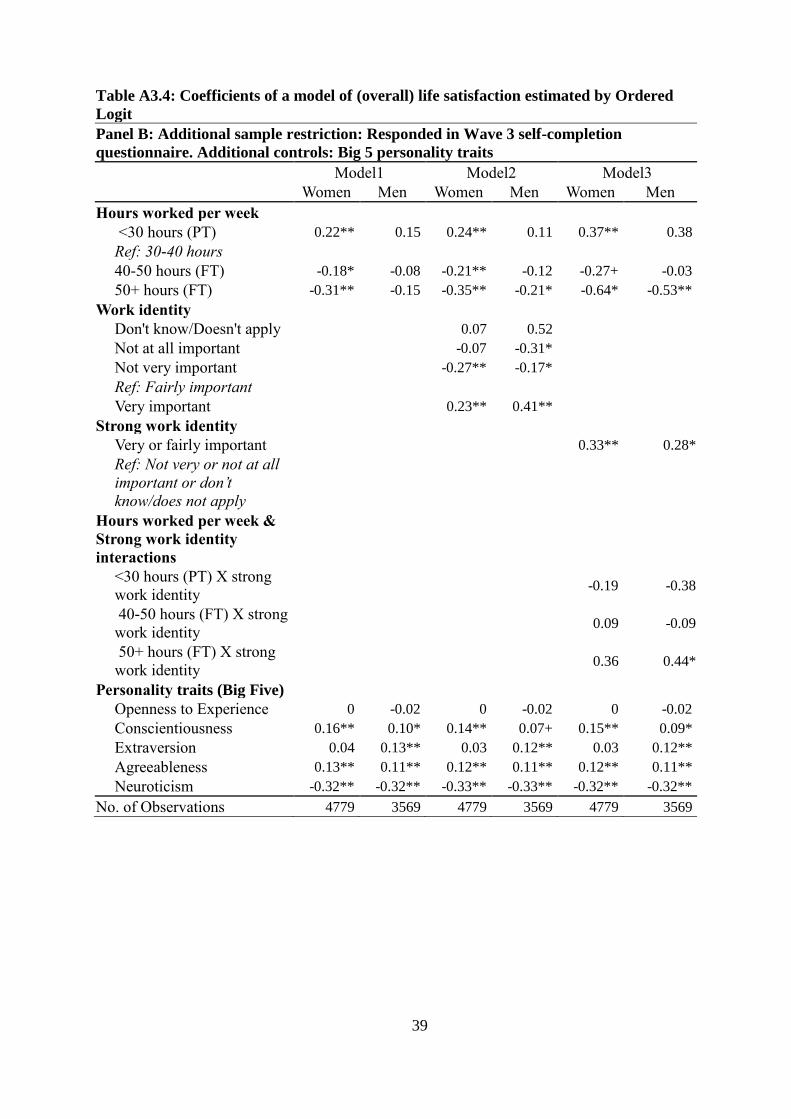
39
Table A3.4: Coefficients of a model of (overall) life satisfaction estimated by Ordered
Logit
Panel B: Additional sample restriction: Responded in Wave 3 self-completion
questionnaire. Additional controls: Big 5 personality traits
Model1 Model2 Model3
Women Men Women Men Women Men
Hours worked per week
<30 hours (PT) 0.22** 0.15 0.24** 0.11 0.37** 0.38
Ref: 30-40 hours
40-50 hours (FT) -0.18* -0.08 -0.21** -0.12 -0.27+ -0.03
50+ hours (FT) -0.31** -0.15 -0.35** -0.21* -0.64* -0.53**
Work identity
Don't know/Doesn't apply 0.07 0.52
Not at all important -0.07 -0.31*
Not very important -0.27** -0.17*
Ref: Fairly important
Very important 0.23** 0.41**
Strong work identity
Very or fairly important 0.33** 0.28*
Ref: Not very or not at all
important or don’t
know/does not apply
Hours worked per week &
Strong work identity
interactions
<30 hours (PT) X strong
work identity -0.19 -0.38
40-50 hours (FT) X strong
work identity 0.09 -0.09
50+ hours (FT) X strong
work identity 0.36 0.44*
Personality traits (Big Five)
Openness to Experience 0 -0.02 0 -0.02 0 -0.02
Conscientiousness 0.16** 0.10* 0.14** 0.07+ 0.15** 0.09*
Extraversion 0.04 0.13** 0.03 0.12** 0.03 0.12**
Agreeableness 0.13** 0.11** 0.12** 0.11** 0.12** 0.11**
Neuroticism -0.32** -0.32** -0.33** -0.33** -0.32** -0.32**
No. of Observations 4779 3569 4779 3569 4779 3569
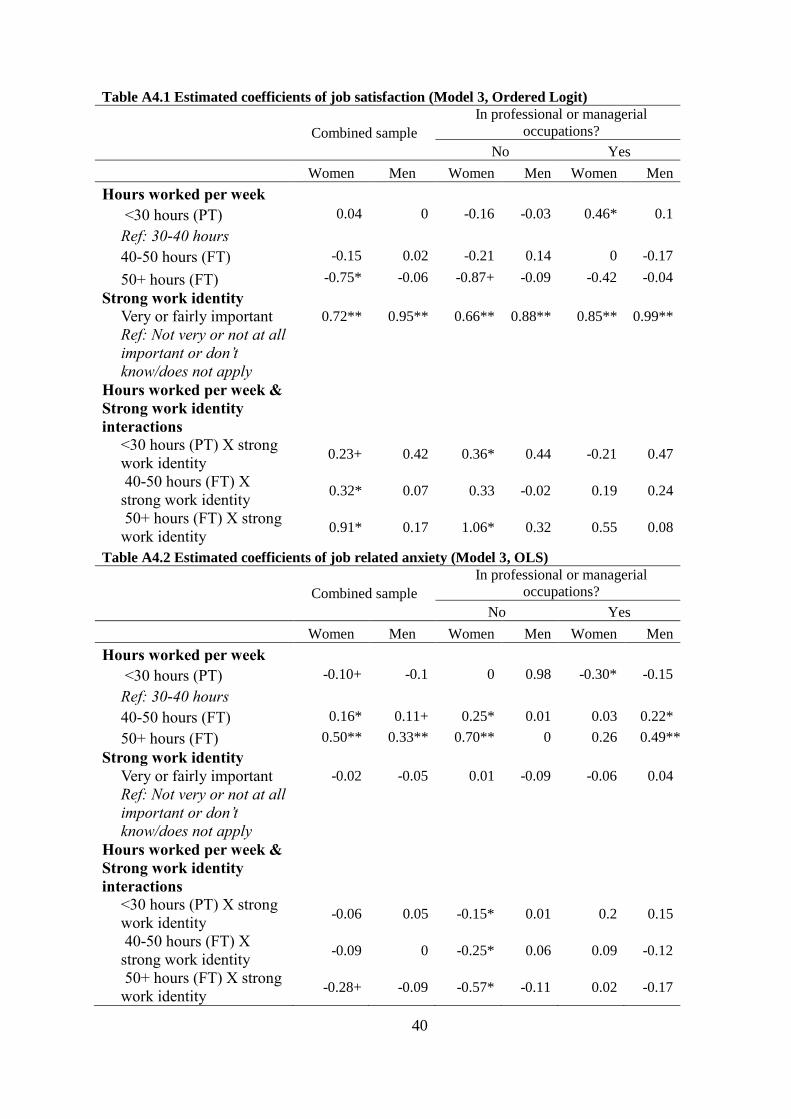
40
Table A4.1 Estimated coefficients of job satisfaction (Model 3, Ordered Logit)
Combined sample
In professional or managerial
occupations?
No Yes
Women Men Women Men Women Men
Hours worked per week <30 hours (PT) 0.04 0 -0.16 -0.03 0.46* 0.1
Ref: 30-40 hours
40-50 hours (FT) -0.15 0.02 -0.21 0.14 0 -0.17
50+ hours (FT) -0.75* -0.06 -0.87+ -0.09 -0.42 -0.04
Strong work identity
Very or fairly important 0.72** 0.95** 0.66** 0.88** 0.85** 0.99**
Ref: Not very or not at all
important or don’t
know/does not apply
Hours worked per week &
Strong work identity
interactions
<30 hours (PT) X strong
work identity 0.23+ 0.42 0.36* 0.44 -0.21 0.47
40-50 hours (FT) X
strong work identity 0.32* 0.07 0.33 -0.02 0.19 0.24
50+ hours (FT) X strong
work identity 0.91* 0.17 1.06* 0.32 0.55 0.08
Table A4.2 Estimated coefficients of job related anxiety (Model 3, OLS)
Combined sample
In professional or managerial
occupations?
No Yes
Women Men Women Men Women Men
Hours worked per week
<30 hours (PT) -0.10+ -0.1 0 0.98 -0.30* -0.15
Ref: 30-40 hours
40-50 hours (FT) 0.16* 0.11+ 0.25* 0.01 0.03 0.22*
50+ hours (FT) 0.50** 0.33** 0.70** 0 0.26 0.49**
Strong work identity
Very or fairly important -0.02 -0.05 0.01 -0.09 -0.06 0.04
Ref: Not very or not at all
important or don’t
know/does not apply
Hours worked per week &
Strong work identity
interactions
<30 hours (PT) X strong
work identity -0.06 0.05 -0.15* 0.01 0.2 0.15
40-50 hours (FT) X
strong work identity -0.09 0 -0.25* 0.06 0.09 -0.12
50+ hours (FT) X strong
work identity -0.28+ -0.09 -0.57* -0.11 0.02 -0.17
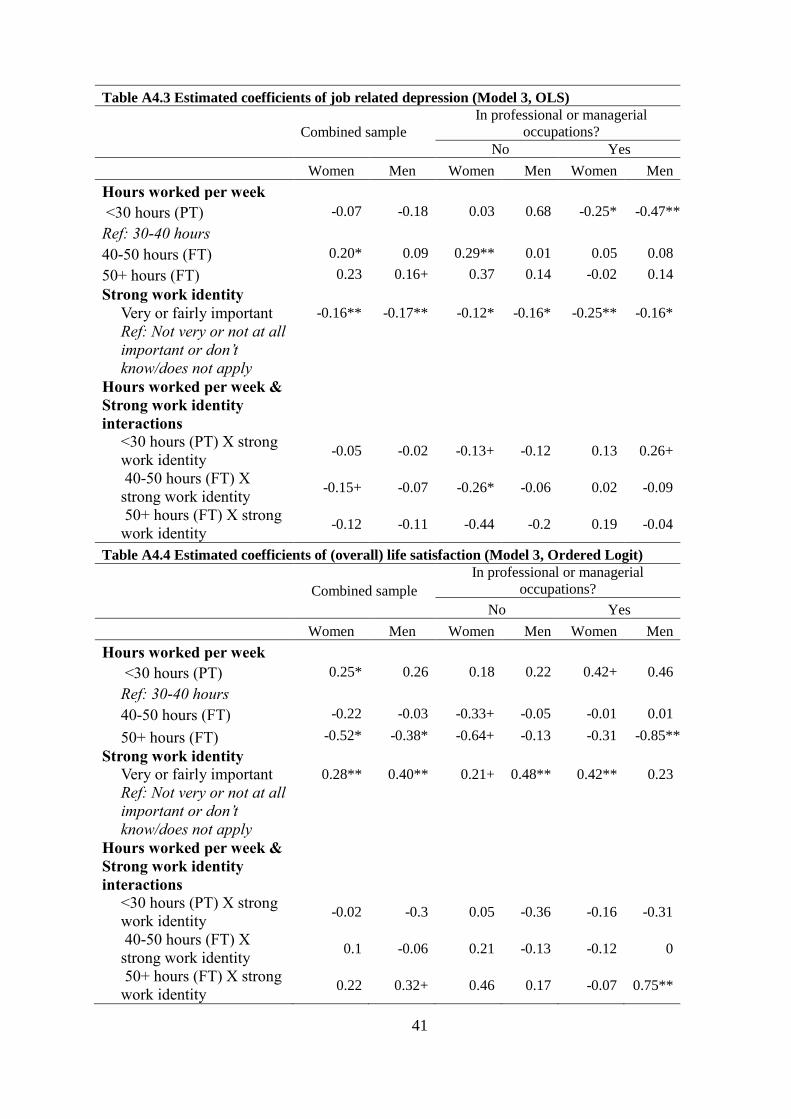
41
Table A4.3 Estimated coefficients of job related depression (Model 3, OLS)
Combined sample
In professional or managerial
occupations?
No Yes
Women Men Women Men Women Men
Hours worked per week <30 hours (PT) -0.07 -0.18 0.03 0.68 -0.25* -0.47**
Ref: 30-40 hours
40-50 hours (FT) 0.20* 0.09 0.29** 0.01 0.05 0.08
50+ hours (FT) 0.23 0.16+ 0.37 0.14 -0.02 0.14
Strong work identity
Very or fairly important -0.16** -0.17** -0.12* -0.16* -0.25** -0.16*
Ref: Not very or not at all
important or don’t
know/does not apply
Hours worked per week &
Strong work identity
interactions
<30 hours (PT) X strong
work identity -0.05 -0.02 -0.13+ -0.12 0.13 0.26+
40-50 hours (FT) X
strong work identity -0.15+ -0.07 -0.26* -0.06 0.02 -0.09
50+ hours (FT) X strong
work identity -0.12 -0.11 -0.44 -0.2 0.19 -0.04
Table A4.4 Estimated coefficients of (overall) life satisfaction (Model 3, Ordered Logit)
Combined sample
In professional or managerial
occupations?
No Yes
Women Men Women Men Women Men
Hours worked per week <30 hours (PT) 0.25* 0.26 0.18 0.22 0.42+ 0.46
Ref: 30-40 hours
40-50 hours (FT) -0.22 -0.03 -0.33+ -0.05 -0.01 0.01
50+ hours (FT) -0.52* -0.38* -0.64+ -0.13 -0.31 -0.85**
Strong work identity
Very or fairly important 0.28** 0.40** 0.21+ 0.48** 0.42** 0.23
Ref: Not very or not at all
important or don’t
know/does not apply
Hours worked per week &
Strong work identity
interactions
<30 hours (PT) X strong
work identity -0.02 -0.3 0.05 -0.36 -0.16 -0.31
40-50 hours (FT) X
strong work identity 0.1 -0.06 0.21 -0.13 -0.12 0
50+ hours (FT) X strong
work identity 0.22 0.32+ 0.46 0.17 -0.07 0.75**
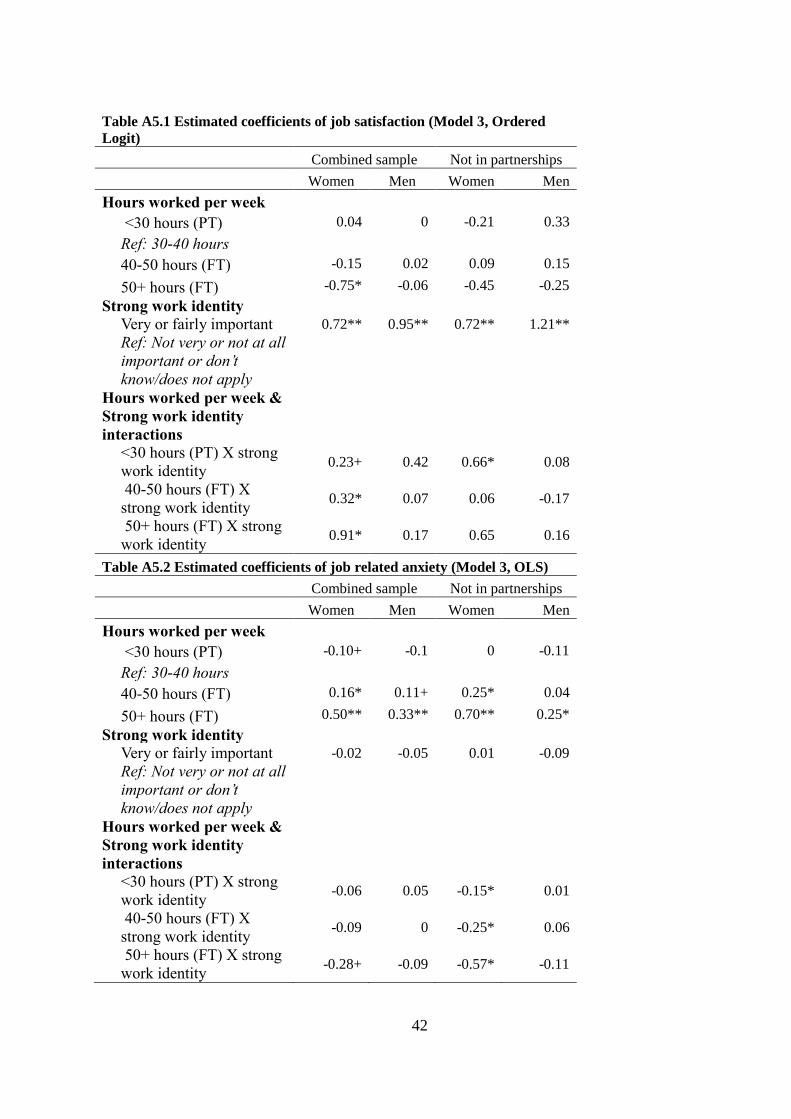
42
Table A5.1 Estimated coefficients of job satisfaction (Model 3, Ordered
Logit)
Combined sample Not in partnerships
Women Men Women Men
Hours worked per week <30 hours (PT) 0.04 0 -0.21 0.33
Ref: 30-40 hours
40-50 hours (FT) -0.15 0.02 0.09 0.15
50+ hours (FT) -0.75* -0.06 -0.45 -0.25
Strong work identity
Very or fairly important 0.72** 0.95** 0.72** 1.21**
Ref: Not very or not at all
important or don’t
know/does not apply
Hours worked per week &
Strong work identity
interactions
<30 hours (PT) X strong
work identity 0.23+ 0.42 0.66* 0.08
40-50 hours (FT) X
strong work identity 0.32* 0.07 0.06 -0.17
50+ hours (FT) X strong
work identity 0.91* 0.17 0.65 0.16
Table A5.2 Estimated coefficients of job related anxiety (Model 3, OLS)
Combined sample Not in partnerships
Women Men Women Men
Hours worked per week <30 hours (PT) -0.10+ -0.1 0 -0.11
Ref: 30-40 hours
40-50 hours (FT) 0.16* 0.11+ 0.25* 0.04
50+ hours (FT) 0.50** 0.33** 0.70** 0.25*
Strong work identity
Very or fairly important -0.02 -0.05 0.01 -0.09
Ref: Not very or not at all
important or don’t
know/does not apply
Hours worked per week &
Strong work identity
interactions
<30 hours (PT) X strong
work identity -0.06 0.05 -0.15* 0.01
40-50 hours (FT) X
strong work identity -0.09 0 -0.25* 0.06
50+ hours (FT) X strong
work identity -0.28+ -0.09 -0.57* -0.11
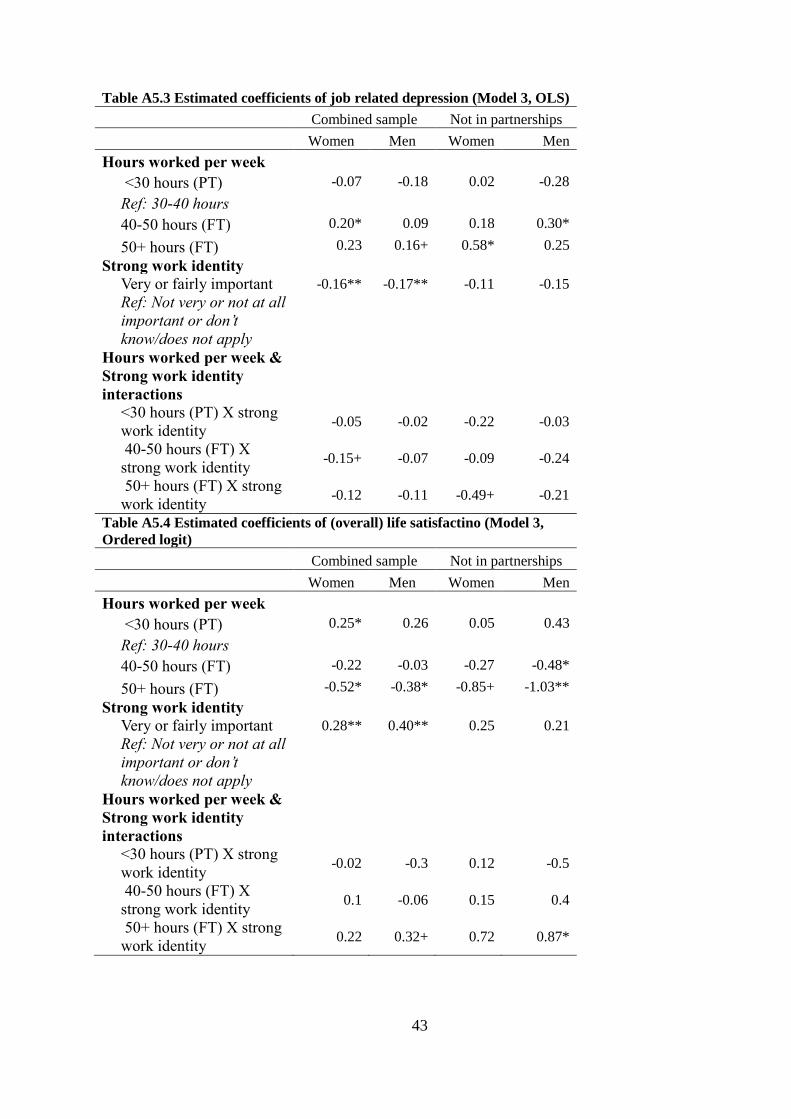
43
Table A5.3 Estimated coefficients of job related depression (Model 3, OLS)
Combined sample Not in partnerships
Women Men Women Men
Hours worked per week <30 hours (PT) -0.07 -0.18 0.02 -0.28
Ref: 30-40 hours
40-50 hours (FT) 0.20* 0.09 0.18 0.30*
50+ hours (FT) 0.23 0.16+ 0.58* 0.25
Strong work identity
Very or fairly important -0.16** -0.17** -0.11 -0.15
Ref: Not very or not at all
important or don’t
know/does not apply
Hours worked per week &
Strong work identity
interactions
<30 hours (PT) X strong
work identity -0.05 -0.02 -0.22 -0.03
40-50 hours (FT) X
strong work identity -0.15+ -0.07 -0.09 -0.24
50+ hours (FT) X strong
work identity -0.12 -0.11 -0.49+ -0.21
Table A5.4 Estimated coefficients of (overall) life satisfactino (Model 3,
Ordered logit)
Combined sample Not in partnerships
Women Men Women Men
Hours worked per week <30 hours (PT) 0.25* 0.26 0.05 0.43
Ref: 30-40 hours
40-50 hours (FT) -0.22 -0.03 -0.27 -0.48*
50+ hours (FT) -0.52* -0.38* -0.85+ -1.03**
Strong work identity
Very or fairly important 0.28** 0.40** 0.25 0.21
Ref: Not very or not at all
important or don’t
know/does not apply
Hours worked per week &
Strong work identity
interactions
<30 hours (PT) X strong
work identity -0.02 -0.3 0.12 -0.5
40-50 hours (FT) X
strong work identity 0.1 -0.06 0.15 0.4
50+ hours (FT) X strong
work identity 0.22 0.32+ 0.72 0.87*