Embed Size (px)
Citation preview
NBER WORKING PAPER SERIES
INVESTOR BEHAVIOR IN THE OCTOBER 1987 STOCK MARKET CRASH:
THE CASE OF JAPAN
Robert J. Shiller Fumiko Konya
Yoshiro Tsutsui
Working Paper No. 2684
NATIONAL BUREAU OF ECONOMIC RESEARCH 1050 Massachusetts Avenue
Cambridge, MA 02138
August 1988
The authors are grateful to Koichi Hamada and Oaiwa Security Company for
support ad suggestions. This research is part of NBER's research program in
Financial Markets and Monetary Economics. Any opinions expressed are those
of the authors not those of the National Bureau of Economic Research.
NBER Working Paper #2684
August 1988
INVESTOR BEHAVIOR IN THE OCTOBER 1987 STOCK MARKET CRASH: THE CASE OF JAPAN
ABSTRACT
In a questionnaire survey we asked Japanese institutional investors to
recall what they thought and did during the worldwide stock market crash in
October, 1987. The results confirm that the drop in U. S. stock prices was
the primary factor on their minds, and other news stories in the United
States dominated Japanese news stories. A comparison with an earlier survey
of U. 5. institutional investors at the time of the crash (Shiller [1987])
shows a remarkable similarity between Japanese and U. S. institutional
investors in a number of attitudinal and behavioral dimensions. The results
suggest that events in the United States were the proximate cause of the
crash in Japan, but that the tranamiasion mechanism of the crash was very
similar in both countries.
Robert J. Shiller Fumiko Konya Cowles Foundation Japan Securities Yale University Research Institute Box 2125 Yale Station 1-5-8, Nihonbaahi, New Haven, CT 06520-2125 Kayabacho
Chuo-ku, Tokyo, 103 JAPAN
Yoshiro Tautusi
Department of Economics
Nagoya City University Mizuho-cho, Mizuho-ku Nagoya, 467 JAPAN
The main shortcomings of the present survey are that it was undertaken
four months after the crash and that the sample size is only 52. We think,
however, that in an event ao dramatic as the biggest stock market crash in
history, memories will still he sufficiently fresh that the responses will
be useful. Moreover, a sample size of 52 is large enough to produce
reasonably small standard errors on estimated proportions - generally in the
4 percentage point to 7 percentage point range; small enough to permit us to
make some broad conclusions.
Timins of Events
The Tokyo Stock Exchange (Tokyo SE) closes each day before the New York
Stock Exchange (NYSE) opena. Thus, the Japanese market could not react to
the 13. 5. crash on Monday October 19 until Tuesdsy October 20. For this
reason, October 20 was aubatituted in Japan for October 19 on questions
asked of U. S. investors in Shiller (1987].
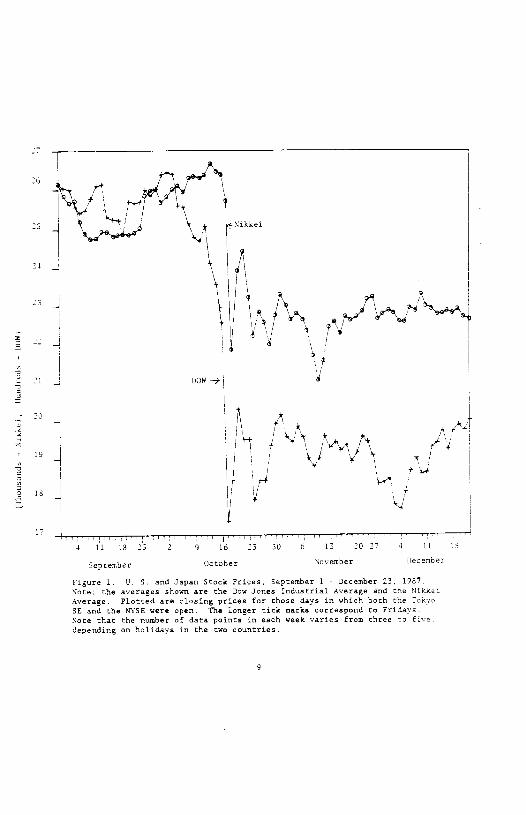
To get a rough ides of the relative stock movements of the NYSE and Tokyo
SE around the craah, we plot the Dow Jones Industrial Average and the Nikkei
Average Tuesday September 1 through Wednesday December 23 in Figure l. We
can see from the figure that while the decline of stock prices on the NYSE
began Monday October 5, the Tokyo SE did not show any drop until Monday
October 19, and then only a relatively small one. The New York Stock
Exchange experienced a 10.8% drop between Monday October 5 and Thursday
October 15, but the Tokyo SE did not respond to it. Thua, the market
decline in Japan essentially began on Tuesday October 20, the date we
singled out in the survey questions.
3The Nikkei average is based on an arithmetic average of prices of 225 stocks. The Nikkei average is commonly called the "Nikkei Dow Jones."
2
News Stories
In order to find what news the Japanese investors reacted to, we selected
a list of news stories and asked respondents to rate their importance, as
they remember judging it on October 20, 1987, on a one to seven scale (one
completely unimportant, seven very important). The respondents were told
'Please tell how important y then thought these were, and not how others thought about them."
The news items are shown in Table 2. They may be classified into four
categories: 1) news about the Japanese stock price movement, 2) news about
the U. S. stock price movement, 3) other news of Jspsn, and 4) other news
of the U. S.
What the Japmnese investors thought most important was the news of the -
crash of New York Stock Exchange on October 19. Fully 87% of the
respondents rated this "very important"; the sverage of the snswers is
6.727. The drop in the morning October 20 in Tokyo SE comes next. 65% of
the respondents answered that this wss "very important" (the average of the
answers is 6.266).
The other items were rated lower. Jspsnese investors thought that the
price drops of the preceding week in the NYSE were more important than the
slight drop in Tokyo Stock Exchange on October 19. The aversges of the
answers to the news of "Drop in the New York and other Stock Prices that
preceded October 19" is 5.257, while the news of Drop in the Tokyo SE on
October 19" is 4.608. On the contrsry, (or similarly?) the U.S. investors
rsted the drops of their own market more important than that of the foreign
3 -
market ( 5.235 vs. 4.776). This is reasonable since the Tokyo SE did not
show any decline in the preceding week except the 2.3% drop on October 19.
Comparing the news of the U.S. and Japan, Japanese investors rated the
former higher than the latter. For example, "The news that Takesita was
nominated as the new president of Liberal Democratic Party on October 20"
was rated lower than the news of "U.S. attack on Iranian oil station October
19" (2.434 vs. 3.317).
Interestingly, the news on the U. S. economy were rated higher by the
Japanese investors than by the U. S. investors. For example, the news of
the U.S. trade deficits, the rise of prime rate and U.S. treasury bill
yields, and Treasury Secretary Baker's suggestion on the exchange rate were
rsted more than five on average by Japanese investors, while U.S. investors
rated most of them around four. Moreover many of the U.S. economic news
stories were raced higher than the news of the stock prices of the preceding
week by the Japanese investors.
We asked a question that "Did you think the crash would influence the
Japanese market?"4 Of our respondents, 98.2% answered that they thought
then that Japanese stock prices would go down. Only 1.8% (one person)
thought that the drop of Tokyo Stock Exchange would be larger than that of
NYSE. This also seems to support the notion that the Japanese stock market
crash was caused by the United States crash.
Two interpretations are possible to these results. One is to regard them
as general features of the Japanese investors and to suppose that the Tokyo
4This question immediately followed a question asking the date and time when respondents first heard of the crash on the NYSE. All but two of the resondents had heard by 8:00 a. m. JST. Thus, in context, this question may be interpreted as asking for the opinion the respondent held before the crash in the Tokyo market.
4
SE is dependent on the NYSE. Considering thst Tokyo SE by some measures is
now about as large as NYSE, however, the unidirectional causation is hard to
believe.
The other interpretation is to regard the dependency of Tokyo SE on the
NYSE as specific to the current crash. A stock market crash is apparently a
unique event in investors minds, not just a bigger version of smaller price
movements. The reasons the event occurred in the U.S. in the United States
are not clear, though the conclusion in Shiller [1987] was that a self-
amplifying sequence of reactions to price declines played a role; the
reaction each day to price declinea of the previous day, starting the
previous week. The crash in the Tokyo SE seemed to have no apparent toots
in their own economy, and there were no significant price declines in Japan
the preceding week. This may explain why the Japanese investors rated the
news in the U.S. very high in the survey. However, the latter
interpretation does not requite that this is always true. If a crash
happens autonomously in Japan and spreads to the NYSE, the U.S. investors
would rate the news in Japan very high.
Attitude and Behavior Comparisons - U. S. and Japan
In the previous survey of U. S. institutional investors (Shiller [1987])
it was concluded that important factors in the crash were investors'
impressions of the psychology of other investors. The theory moat common
among investors was that investors had caused the market to be overpriced
and vulnerable to a panic, much like the one that occurred in the United
States in October 1929.
Respondents were asked "Which of the following better describes your
theory about the detline: a theory about investor psychology, [or] a theory
about fundamentals such as profits or interest rates?" (See Table 3 for
questions discussed in this section.) Of Japanese investors, 22.2% chose
investor psychology. This is even higher than the percent answering yea
Song U. 5; institutional investors (64.0%).
Of the Japanese respondents, 83.6% answered that they thought just before
the crash that the market was overpriced relative to fundamental values.
This is very close to the result with the U.S. institutional investor, where
84.3% said they thought the market overpriced. Apparently the average
institutional investor in both Japan and the United States thought that
Qthx investors were too optimistic about share values. This is consistent
with the result that only 29.1% of the Japanese respondents and 22.2% of the
U. S. respondents thought that they were bullish and optimiatit relative to
the other investors.
Japanese investors were remarkably similar in their willingnesa to admit
that they had experienced "contagion of fear" on the day of the crash. Of
Japanese investors, 41.8% said yea, of U. S. investors, 41.3% said yea. The
question "Roughly how many people did you talk to about the atock market on
[the day of the crash]?" also yielded similar numbers in the both countries
(Japan 15.4 vs. U.S.19.?). Thus, the interpersonal communication that is
necessary for contagion of fear was present in roughly equal amounts in both
•tountries. Interestingly about 20% of the respondents in Japan said they
thought or talked about the events of 1929 (which are most likely to he U.
S. and not Japanese events) in the few days before the crash; the number is
even higher than that of the U.S. institutional investors, which is 53.2%.
We asked investors directly about anxiety levels as expressed by explicit
6
symptoms. Anxiety levels in Japan were comparatively low the week before
the crash and over the weekend before the crash, as one might expect given
the absence of major stock price movements in Japan then. On October 20
anxiety levels in Japan were fully comparable to those described by U. S.
investors. Japanese investors were somewhat less confident of their ability
to predict when a rebound would occur than were U. S. investors.
Only around 11% of the Japanese investors had a policy of limiting bases
at the point of October 20. This number is quite similar to that in the
U.S.. While portfolio insurance appears to be very important in the United
States, the overall impact of all loss-limiting policies appears to be
roughly equally important in the two countries.
Respondents were also aaked whether they had abandoned a policy of
investing for the long term just before the crash: 10.9% of the Japanese
investors answered yes. The number is not significantly different from that
of the U.S. institutional investors (6.6%).
Interpretation and Conjectures
What is most striking in the survey data of the Japanese institutional
investors is that the answers are very similar to those of the U.S. insti-
tutional investors.5 The comparisons of the U. S. and Japan at the time of
the market crash show that there are today not only world markets: there is
also a world market culture: patterns of behavior, outlook and communica-
tions, that transcends national boundaries.
We think that it is a strong suggestion of these results that the
51n fact, according to the surveys, we can say that the U.S. institutional investors are closer in behavior to the Japanese institutional investors than they are to the U.S. individual investors.
proximate tause of the crash came from the United States. A scenario of the
Tokyo SE on October 20 may be as follows: Investors anticipated that a
sharp drop would occur in Tokyo SE on October 20 when they got up and heard
the news of the crash of NYSE, and focused on the movement of the stock
price in the morning. The big question on their minds that morning was
about Japanese investor pyschology: how investors in the Japanese market
would react to the U. S. stock market crash. Considerable anxious
interpersonal communications on this issue took place among Japanese
institutional investors that day.
What is interesting is that the Tokyo market did not respond to the
decline of NYSE in the preceding weeks, although the decline was not small
compared with the declines in previous history (394 points for two weeks)
Perhaps the channel of the contagion across national boundaries of a market
decline is in operation only when it becomes of considerable size.6
In Tsutsui [1988] it was found that Cranger causality tests with nine
lags between the NYSE (Dow Jones Industrial Average) and the Tokyo SE
(Nikkei Average) in nominal terms showed strong evidence of bidirectional
causality with daily data April 1, 1985 to October 13, 1987. The evidence
for causality was stronger from the NYSE to the Tokyo SE than in the reverse
direction. When the sample was shortened to April 1 1.985 to October 13,
1987 (excluding the crash) there is still evidence of bidirectional
• causality, though now causality from the Tokyo SE to the NYSE was only just
significant at the 5% level.
6lnstitutional investor behavior on ordinary days may show less active communications and less concern with market psychology; see Pound and Shiller [19871.
8
November Decorober
Figure 1. 1!. S. and Japan Stock Priceo, September 1 - December 23, 1987. Note: the averages shown are the Sow Jones industrial. Average and the Nikkei
Average. Plotted are closing prices for those days in which both the Tokyo SE and the NYSE were open. The longer tick marks correspond to Fridays. Note that the nomber of data points in each week varies from three to five.
depending on holidays in the two countries.
21
20
DOW -'9W
19
18
17
September
4 l1 18 23 2 9 16 23 319 8 13 20 27 4 11 IS
October
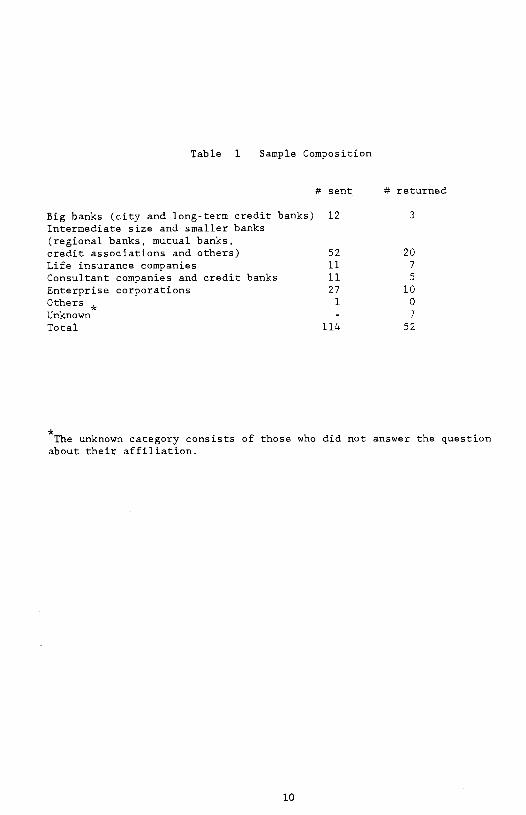
Table 1 Sample Composition
# sent # returned
Big banks (city and long-term credit banks) 12 3
Intermediate size and smaller banks
(regional banks, mutual banks, credit associations and others) 52 20 Life insurance companies 11 7
Consultant companies and credit banks 11 5
Enterprise corporations 27 10 Others * 1 0
Unknown - 7 Total 114 52
* The unknown category consists of those who did not answer the question
about their affiliation.
10
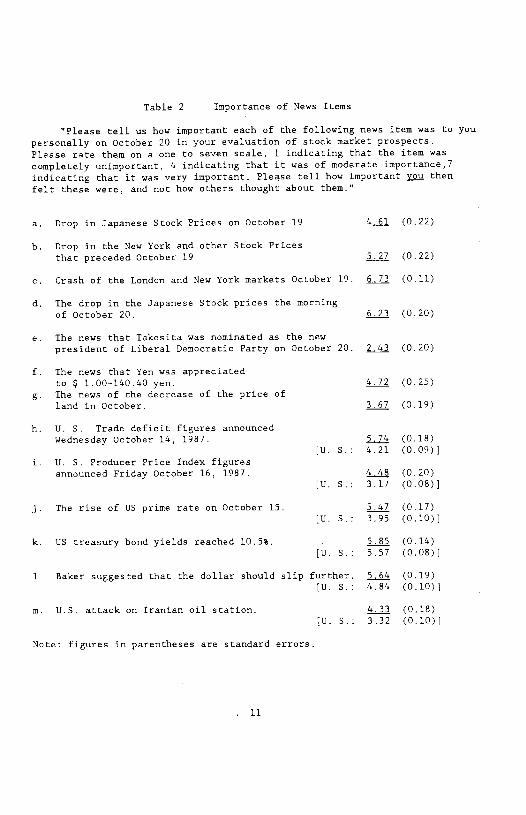
Table 2 Importance of News Items
"Please tell us how important each of the following news item was to you
personally on October 20 in your evaluation of stock market prospects. Please rate them on a one to seven acale, I indicating that the item was
completely unimportant, 4 indicating that it waa of moderate importance,7
indicating that it was very important. Please tell how important yp then felt these were, and not how othera thought about them."
a. Drop in Japanese Stock Prices on October 19 (0.22)
b. Drop in the New York and other Stock Prices that preceded October 19 (0.22)
c. Crash of the London and New York markets October 19. 6.73 (0.11)
d. The drop in the Japanese Stock prices the morning of October 20. kll (0.20)
e. The news that Takesita was nominated as the new
president of Liberal Democratic Party on October 20. (0.20)
f. The news that Yen was appreciated to $ 1.DO14D.4O yen. L].Z (0.25)
g. The news of the decrease of the price of land in October. L1 (0.19)
h. U. S. Trade deficit figures announced
Wednesday October 14, 1987. Lj (0.18) [U. S.: 4.21 (0.09)]
i. U. S. Producer Price Index figures announced Friday October 16, 1987. (0.20)
[U. S.: 3.17 (0.08)]
j. The rise of US prime rate on October 15. j (0.17) [U. S.: 3.95 (0.10)]
k. US treasury bond yields reached 10.5%. Lfl (0.14) [U. S.: 5.57 (0.08)]
I. Baker suggested that the dollar should slip further. (0.19) [U. S.: 4.84 (0.10)]
m. U.S. attack on Iranian oil station. 4.33 (0.18) [U. S.: 3.32 (0.10)]
Note: figures in parentheses are standard errors.
11
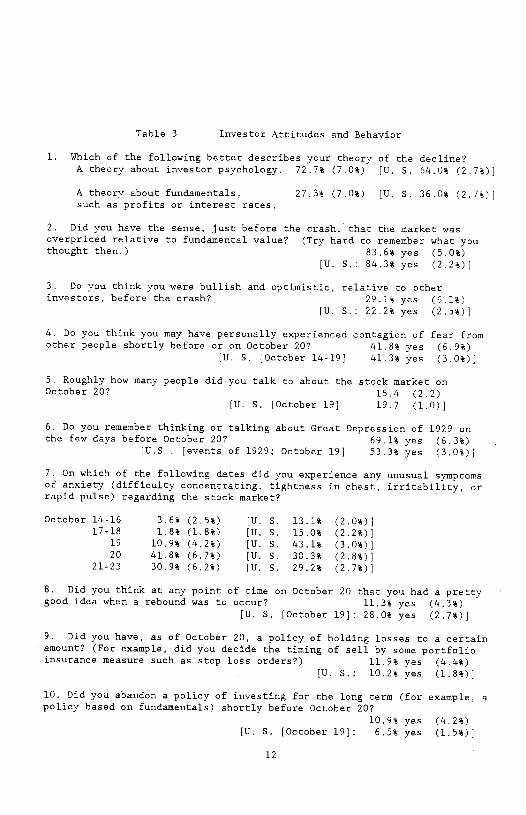
Table 3 Investor Attitudes snd Behavior
1. Which of the following better describes your theory of the decline? A theory about investor psychology. 72.7% (7.0%) [U. S. 64.0% (2.7%)]
A theory about fundamentals, 27.3% (7.0%) [U. S. 36,0% (2.7%)) such as profits or interest rates.
2. Did you have the sense, just before the crash, that the market was overpriced relative to fundamental value? (Try hard to remember what you thought then.) 83.6% yes (5.0%)
[U. S.: 84.3% yes (2.2%))
3. Do you think you were bullish and optimistic, relative to other investors, before the crash? 29.1% yes (6.1%)
[U. S.: 22.2% yes (2.5%))
4. Do you think you may have personally experienced contagion of fear from other people shortly before or on October 20? 41.8% yes (6.9%)
[U. S. [October 14-19) 41.3% yes (3.0%)[
5. Roughly how many people did you talk to about the stock market on October 20? 15.4 (2.2)
[U. S. [October 19[ 19.7 (1.0))
6. Do you remember thinking or talking about Great Depression of 1929 on the few days before October 20? 69.1% yes (6.3%)
[U.S . [events of 1929; October 19] 53.3% yes (3.0%))
7. On which of the following dates did you experience any unusual symptoms of anxiety (difficulty concentrating, tightness in chest, irritability, or rapid pulse) regarding the stock market?
October 14-16 3.6% (2.5%) [U. 5, 13.1% (2.0%)] 17-18 1.8% (1.8%) [U. 5. 15.0% (2.2%)[
19 10.9% (4.2%) [U. 5. 43.1% (3.0%)] 20 41.8% (6.7%) [U. 5. 30.3% (2.8%)]
21-23 30.9% (6.2%) [U. S. 29.2% (2.7%)]
8. Did you think at any point of time on October 20 that you had a pretty good idea when a rebound was to occur? 11.3% yes (4.3%)
[U. 5. [October 19]: 28.0% yes (2.7%)]
9. Did you have, as of October 20, a policy of holding losses to a certain amount? (For example, did you decide the timing of sell by some portfolio insurance measure such as stop loss orders?) 11.9% yes (4.4%)
[U. 5.: 10.2% yes (1.8%)]
10. Did you abandon a policy of investing for the long term (for example, a policy based on fundamentals) shortly before October 20?
10.9% yes (4.2%) [U. 5. [October 19]: 6.5% yes (1.5%)]
12
APPENDIX
QUESTIONNAIRE WITH TABUlATED RESULTS
SURVEY CONCERNING THE STOCK MARKET DROP
)% of the item the number of the answers) [weighted average of items, the total # of the answers] (Comparable U. S. results shown with letters US)
Instructions
This questionnaire should take no more than ten minutes of your time if you skip the optional essay questions. We would appreciate it if you answer the optional questions too. We will send a report on this survey to those who participate.
The purpose of this questionnaire:
October 19, 1987, on the "black Monday," the New York Stock Exchange fell more than ever before in history. The New York Dow Jones fell 508 points in one day. The crash occurring in the NYSE spread to other foreign exchanges all over the world. The Nikkei Average fell 14.9% on October 20, which is unprecedented in history.
The purpose of this questionnaire is to know how investors looked at the situation and what they thought and how they behaved. Please try to remember your personal experience then. Please give answers by circling numbers. There are also some essay questions.
The survey is anonymous. The results are used only for academic research and not for any commercial purposes. Individual answers will not be announced. Please finish what you can of this survey and return it, even if you cannot answer all questions.
13
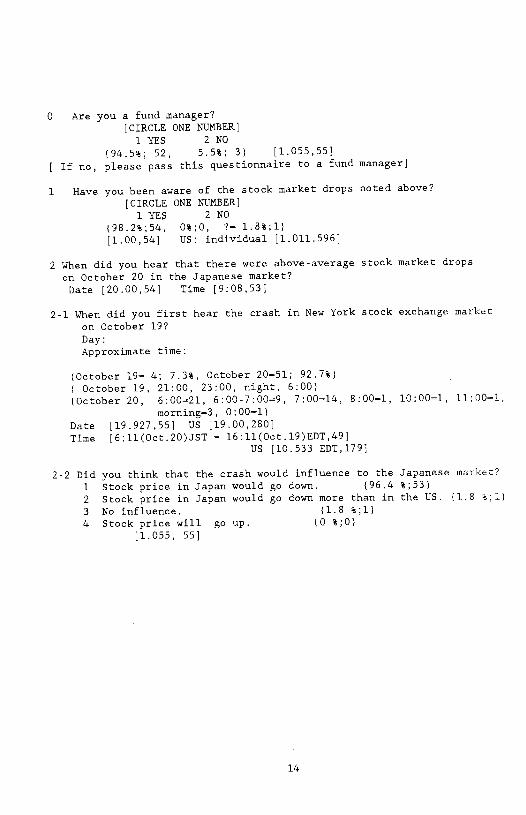
O Are you a fund manager? [CIRCLE ONE NIJMBER] 1YES 2ND
(94.5%; 52, 5.5%; 3) [1.055,55]
If no, please pass this questionnaire to a fund manager]
Have you been aware of the stock market drops noted above?
[CIRCLE ONE NUMBER] 1YES 2ND
(98.2%;54, 0%;O, ?—l.8%;l)
[1.00,54] US: individual [1.011,596]
2 When did you hear that there were above-average stock market drops
on October 20 in the Japanese market?
Date [20.00,54] lime [9:08,53]
2-1 When did you first hear the crash in New York stock exchange market
on October 19?
Day: Approximate time:
(October 19= 4; 7.3%, October 20=51; 92.?%)
October 19, 21:00, 23:00, night, 6:00)
(October 20, 6:00=21, 6:00-7:00=9, ?:OO=14, 8:00=1, 10:00=1, 11:00=1,
morning=3, 0:00=1] Date ]19.92?,55] US [19.00,280] lime [6:11(Oct.20)JSI — 16:1l(Oct.19)EDI,49]
US [10.533 EDI,l?9]
2-2 Did you think that the crash would influence to the Japanese market?
1 Stock price in Japan would go down. (96.4 %;53)
2 Stock price in Japan would go down more than in the US. (1.8 %;1(
3 No influence. (1.8 %;l} 4 Stock price will go up. (0 %;0)
[1.055, 55]
14
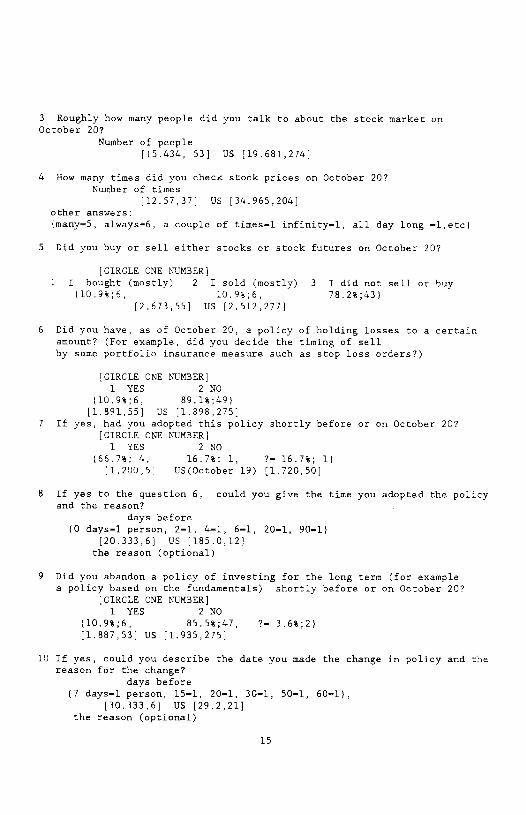
3 Roughly how many people did you talk to about the stock market on October 20?
Number of people [15.434, 53] US [19.681,274]
4 How many times did you check stock prices on October 20? Number of times
[12.57,37] US [34.965,204] other answers:
[many—S always—6, a couple of times—l infinityl, all day long —l,etc[
5 Did you buy or sell either stocks or stock futures on October 20?
[CIRCLE ONE NUMBER] 1 I bought (mostly) 2 I sold (mostly) 3 I did not sell or buy
[lO.9%;6, 1O.9%;6, 78.2%;43[ [2.673,55] US [2.512,277]
6 Did you have, as of October 20, a policy of holding losses to a certain amount? (For example, did you decide the timing of sell by some portfolio insurance measure such as stop loss orders?)
[CIRCLE ONE NIJMBER[ 1 YES 2NO
[1O.9%;6, 89.l%;49[ [1.891,55] US [1.898,275]
7 If yes, had you adopted this policy shortly before or on October 20? [CIRCLE ONE NUMBER]
1 YES 2NO [66.7%; 4, 16.7%; 1, 7— 16.7%; 1]
[1.200,5] US(October 19) [1.720,50]
8 If yes to the question 6, could you give the time you adopted the policy and the reason?
days before (0 days—I person, 2—1, 4—1, 6—1, 20—1, 90—1]
[20.333,6] US [185.0,12] the reason (optional)
9 Did you abandon a policy of investing for the long term (for example a policy based on the fundamentals) shortly before or on October 20?
[CIRCLE ONE NUMBER] 1 YES 2N0
[1O.9%;6, 85.5%;47, ?— 3.6%;2[ [1.887,53] US [1.935,275]
10 If yes, could you describe the date you made the change in policy and the reason for the change?
days before C? days—i person, 15=1, 20—1, 30—1, 50—1, 60—1],
[30.333,6] US [29.2,21] the reason (optional)
is
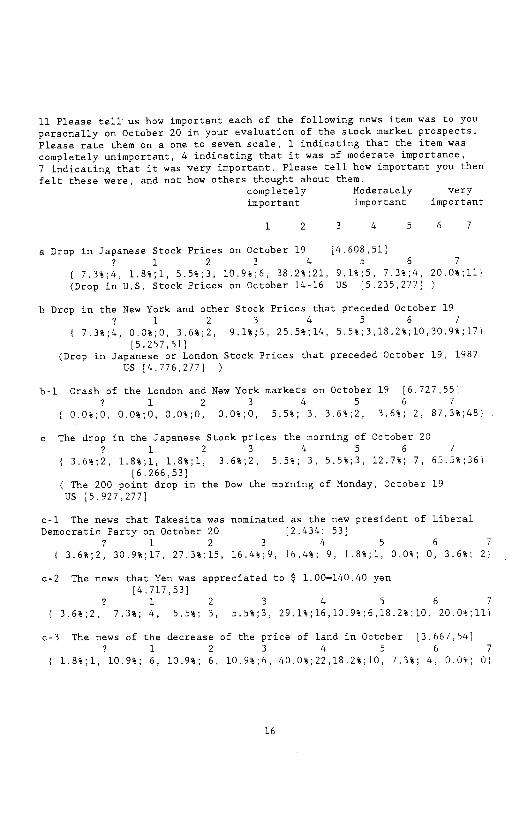
11 Please tell us how important each of the following news item was to you
personally on October 20 in your evaluation of the stock marker prospects. Please rate them on a one to seven scale, 1 indicating that the item was
completely unimportant, 4 indicating that ic was of moderste importance, 7 indicating that it was very important. Please tell how important you then
felt chase were, and not how others thought about them.
completely Moderately very important important important
1 2 3 4 5 6 7
a Drop in Japanese Stock Prices on October 19 [4.608,51] 7 1 2 3 4 5 6 7
7.3%;4, l.8%;l, 5.S%;3, l0.9%;6, 38.2%;21, 9.l%;5, 7.3%;4, 20.0%;ll)
(Drop in U.S. Stock Prices on October 14-16 US [5.235,277]
b Drop in the New York and other Stock Prices that preceded October 19
7 1 2 3 4 5 6 7
7.3%;4, 0.0%;0, 3.6%;2, 9.l%;5, 25.5%;14, 5.5%;3,18.2%;l0,30.9%;17)
[5.257,51] (Drop in Japenese or London Stock Prices that preceded October 19, 1987
US [4.776,277]
b-l Crash of the London and New York markets on October 19 [6.727,55] 7 1 2 3 4 5 6 7
0.0%;0, 0.0%;O, O.0%;O, O.0%;0, 5.5%; 3, 3.6%;2, 3.6%; 2, 87.3%;48)
c The drop in the Japanese Stock prices the morning of October 20 7 1 2 3 4 5 6 7
3.6%;2, 1.8%;l, 1.8%;1, 3.6%;2, 5.5%; 3, 5.5%;3, 12.7%; 7, 65.5%;36) 6 .266, 53]
The 200 point drop in the Dow the morning of Monday, October 19
US [5.927,277]
c-l The news that Takesita was nominated as the new president of Liberal Democratic Party on October 20 [2.434; 53]
7 1 2 3 4 5 6 7
3.6%;2, 30.9%;17, 27.3%;15, 16.4%;9, 16.4%; 9, l.8%;l, 0.0%; 0, 3.6%; 2)
c-2 The news that Yen was appreciated to $ 1.00=140.40 yen [4. 717,53]
7 1 2 3 4 5 6 7
( 3.6%;2, 7.3%; 4, 5.5%; 3, 5.5%;3, 29.l%;16,10.9%;6,l8.2%;i0, 20.0%;1l)
c-3 The news of the decrease of the price of land in October [3.667,54] 7 1 2 3 4 5 6 7
l.8%;l, 10.9%; 6, 10.9%; 6, lO.9%;6, 40.O%;22,18.2%;lO, 7.3%; 4, 0.0%; 0)
16
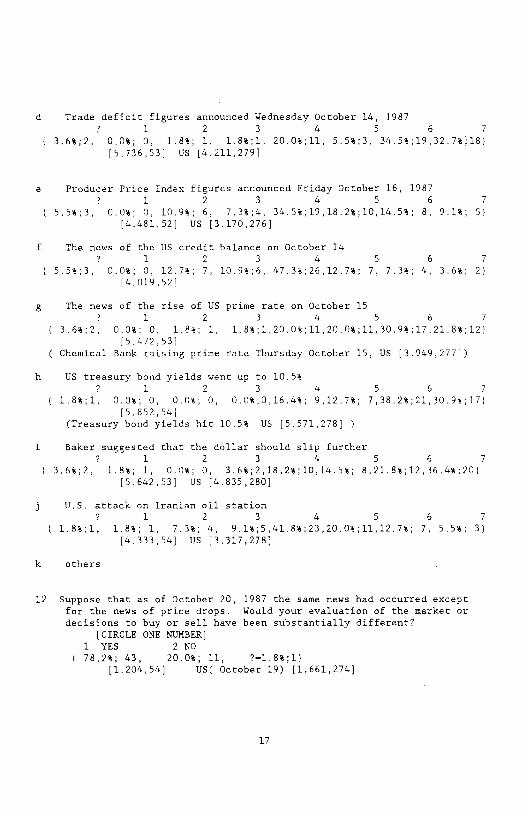
d Trade deficit figures announced Wednesday October 14, 1987 ? 1 2 3 4 5 6 7
3.6%;2, 0.0%; 0, 1.8%; 1, l.8%;l, 2O.O%;11, 5.5%;3, 34.5%;19,32.7%J8) [5.736,531 US [4.211,279]
e Producer Price Index figures announced Friday October 16, 1987
? 1 2 3 4 5 6 7
)5.5%;3, O.O%;O, 10.9%; 6, 7.3%;4, 34.5%;19,18.2%;1O,14.5%; 8,9.1%; 5)
[4.481,52] US [3.170,276]
f The news of the US credit balance on October 14 ? 1 2 3 4 5 6 7
)5.5%;3, 0.0%; 0,12.7%; 7, 1O.9%;6, 47.3%;26,12.7%; 7, 7.3%;4, 3.6%; 2)
[4.019,52]
g The news of rhe rise of US prime rate on October 15 ? 1 2 3 4 5 6 7
3.6%;2, 0.0%; 0, 1.8%; 1, l.8%;l,2O.O%;l1,2O.O%;l1,3O.9%;17,21.8%;12) [5.472,53]
Chemical Bank raising prime rate Thursday October 15, US [3.949,277])
h US treasury bond yields went up to 10.5% ? 1 2 3 4 5 6 7
)l.8%;l, O.0%;0, 0.0%;0, 0.O%;O,16.4%; 9,12.7%; 7,38.2%;21,30.9%;17) [5.852,54)
(Treasury bond yields hit 10.5% US [5.571,278]
Baker suggested that the dollar should slip further 7 1 2 3 4 5 6 7
3.6%;2, 1.8%; 1, 0.0%; 0, 3.6%;2,18.2%;l0,14.5%; 8,21.8%;12,36.4%;2O) [5.642,53] US [4.835,280]
j U.S. attack on Iranian oil station 7 1 2 3 4 5 6 7
l.8%;l, 1.8%; 1, 7.3%; 4, 9.l%;5,41.8%;23,20.0%;11,12.7%; 7,5.5%; 3)
[4.333,54] US [3.317,278]
k others
12 Suppose that as of October 20, 1987 the same news had occurred except for the news of price drops. Would your evaluation of the market or decisions to buy or sell have been substantially different?
[CIRCLE ONE NUMBER] 1 YES 2N0
C 78.2%; 43, 20.0%; 11, ?—l.8%;l) [1.204,54] US( October 19) [1.661,274]
1?
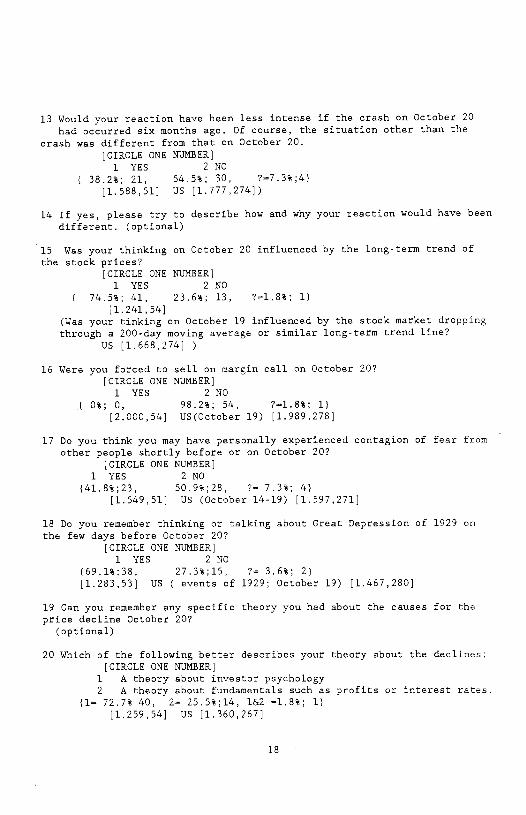
13 Would your reaction have been leaa intense if the crash on October 20
had occurred six months ago. Of course, the situation other than the
crash was different from that on October 20. -
[CIRCLE ONE NUMBER] 1 YES 2ND
38.2%; 21, 54.5%; 30, ?=7.3%;4)
[1.588,51] US [1.777,274])
14 If yes, please try to describe how and why your reaction would have been
different. (optional)
15 Was your thinking on October 20 influenced by the long-term trend of
the atock prices? [CIRCLE ONE NUMBER] 1 YES 2ND
74.5%; 41, 23.6%; 13, ?l.8%; 1)
[1.241,54] (Was your tinking on October 19 influenced by the stock market dropping through a 200-day moving average or similar long-term trend line?
US [1.668,274]
16 Were you forced to sell on margin call on October 20?
[CIRCLE ONE NUMBER] 1 YES 2ND
C 0%; 0, 98.2%; 54, 7—1.8%; 1)
[2.000,54[ US(October 19) [1.989,278]
17 Do you think you may have personally experienced contagion of fear from other people shortly before or on October 20?
[CIRCLE ONE NUMBER] 1 YES 2N0
(41.B%;23, 50.9%;28, 7=7.3%; 4) [1.549,51] US (October 14-19) [1.597,271]
18 Do you remember thinking or talking about Creat Depreaaion of 1929 on the few days before October 20?
[CIRCLE ONE NUMBER] 1 YES 2ND
(69.l%;38, 27.3%;lS, 7=3.6%; 2) ]l.283,53[ US ( events of 1929; October 19) [1.467,280]
19 Can you remember any specific theory you had about the causes for the
price decline October 20?
(optional)
20 Which of the following better deacribes your theory about the declinea: [CIRCLE ONE NUMBER]
1 A theory about inveator psychology 2 A theory about fundamentals such as profits or interest rates.
(1= 72.7% 40, 2— 25.5%;l4, l&2 —1.8%; 1)
[1.259,54] US [1.360,267]
18
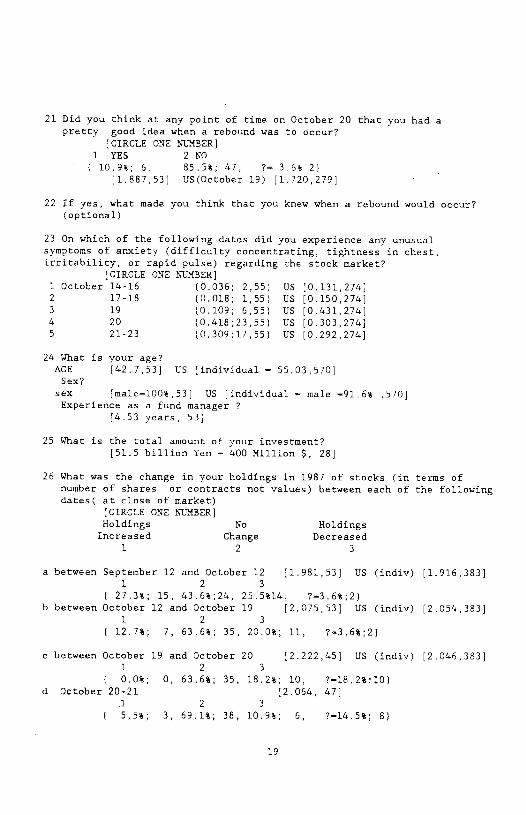
21 Did you think at any point of time on October 20 that you had a pretty good idea when a rebound was to occur?
[CIRCLE ONE NUMBER) 1 YES 2NO 10.9%; 6, 85.5%; 47, ?= 36% 2)
[1.887,53) US(October 19) [1.720,279]
22 If yes, what made you think that you knew when a rebound would occur? (optional)
23 On which of the following dates did you experience sny unusual symptoms of anxiety (difficulty concentrating, tightness in chest, irritability, or rapid pulse) regarding the stock market?
[CIRCLE ONE NUMBER) 1 October 14-16 (0.036; 2,55) US [0.131,274] 2 17-18 (0.018; 1,55) US [0.150,274) 3 19 (0.109; 6,55) US [0.431,274) 4 20 )0.4l8;23,55) US [0.303,274] 5 21-23 (0.309;17,55) US [0.292,274)
24 What is your age? ACE [42.7,53) US [individual — 55.03,570] Sex?
sex )male—100%,53) US [individual male '—91.6% 570) Experience as a fund manager ?
[4.53 yeara, 53)
25 What is the total amount of your investment? [51.5 billion Yen — 400 Million $, 28]
26 What was the change in your holdings in 1987 of stocks (in terms of number of shares or contracts not values) between each of the following dates( at close of market)
[CIRCLE ONE NUMBER) Holdings No Holdings Increaaed Change Decreased
1 2 3
a between September 12 and October 12 [1.981,53) US (mdiv) [1.916,383) 1 2 3
(27.3%; 15, 43.6%;24, 25.5%l4, ?—3.6%;2) b between October 12 and October 19 [2.075,53) US (mdiv) [2.054,383)
1 2 3
12,7%; 7, 63,6%; 35, 20.0%; 11, ?'—3.6%;2)
c between October 19 and October 20 [2.222,45) US (mdiv) )2.046,383) 1 2 3
0.0%; 0, 63.6%; 35, 18.2%; 10, ?—18,2%;l0) d October 20-21 [2.064, 47)
1 2 3
5.5%; 3, 69.1%; 38, 10,9%; 6, 7—14.5%; 8)
19
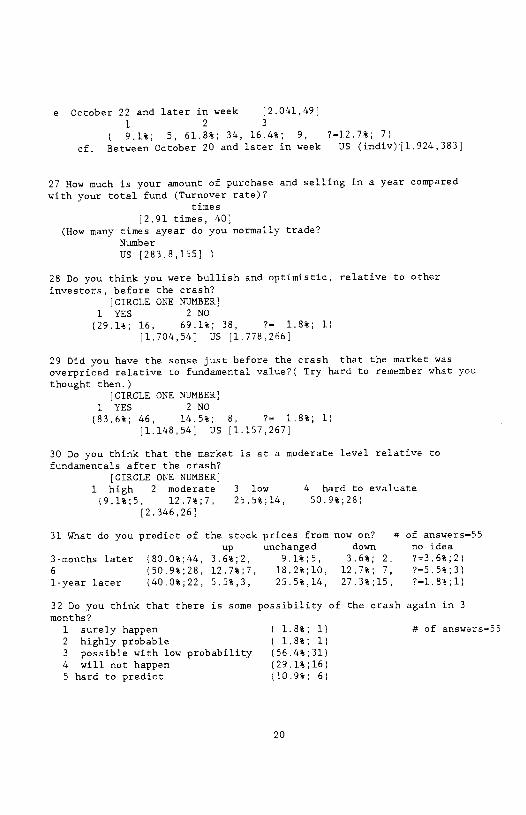
e October 22 and later in week [2.041,49] 1 2 3
9.1%; 5, 61.8%; 34, 16.4%; 9, ?=12.7%; 7)
cf. Between October 20 and later in week US (indiv)Tl.924,383[
27 How much is your amount of purchase and selling in a year compared with your total fund (Turnover rate)?
times
[2.91 times, 40] (How many times ayear do you normally trade?
Number US [283.8,155]
28 Do you think you were bullish and optimistic, relative to other
investors, before the crash?
[CIRCLE ONE NUMBER) 1 YES 2NO (29.1%; 16, 69.1%; 38, ?= 1.8%; 1)
[1.704,54] US [1.778,266]
29 Did you have the sense just before the crash that the market was
overpriced relative to fundamental value?( Try hard to remember what you
thought then.) [CIRCLE ONE NUMBER]
1 YES 2ND (83.6%; 46, 14.5%; 8, ?- 1.8%; 1)
[1.148,54] US [1.157,267]
3D Do you think that the market is at a moderate level relative to fundamentals after the crash?
[CIRCLE ONE NUMBER] 1 high 2 moderate 3 low 4 hard to evaluate (9.l%;5, l2.7%;7, 25.5%;14, 50.9%;28)
[2.346,26]
31 What do you predict of the stock prices from now on? # of answers55 up unchanged down no idea
3-months later (8O.O%;44, 3.6%;2, 9.l%;5, 3.6%; 2, ?'=3.6%;2)
6 (SO.9%;28, 12.7%;?, l8.2%;1D, 12.7%; 7, ?-=5.5%;3)
1-year later (4D.D%;22, 5.5%,3, 25.5%,l4, 2?.3%;15, ?1.S%;l)
32 Do you think that there is some possibility of the crash again in 3
months? 1 surely happen ( 1.8%; 1)
2 highly probable C 1.8%; 1)
3 possible with low probability (56.4%;31) 4 will not hsppen (29.l%;l6) 5 hard to predict [lD.9%; 6)
# of answers=55
20
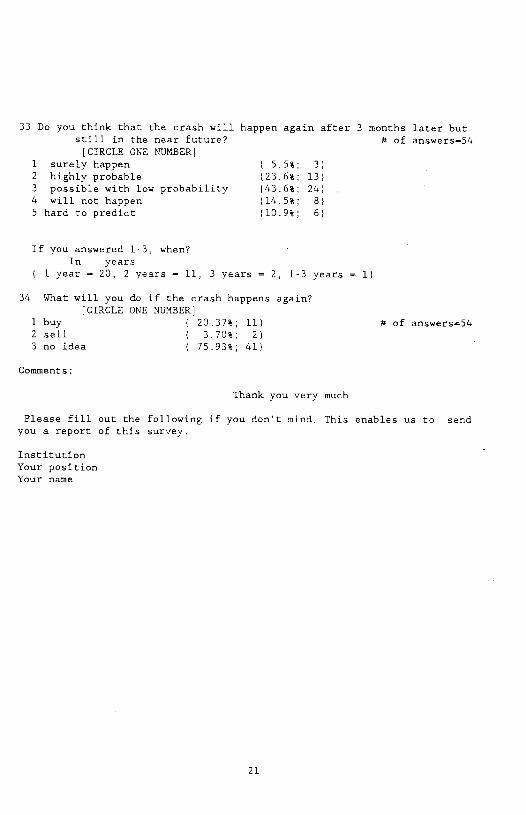
33 Do you think that the crash will happen again after 3 months later but still in the near future? * of answers=54 [CIRCLE ONE NUMBER)
1 surely happen C 5.5%; 3) 2 highly probable (23.6%; 13) 3 possible with low probability (43.6%; 24) 4 will not happen (14.5%; 8)
5 hard to predict (10.9%; 6)
If you answered 1-3, when? In years
1 year 20, 2 years — 11, 3 years = 2, 1-3 years 1)
34 What will you do if the crash happens again? [CIRCLE ONE NUMBER)
1 buy C 20.37%; 11) * of answers—54 2 sell
( 3.70%; 2)
3 no idea C 75.93%; 41)
Comments:
Thank you very much
Please fill out the following if you don't mind. This enables us to send
you a report of this survey.
Institution Your position Your name
21
REFERENCES
Brady Nicholas F. , Chairman, Report of the Presidential Teak Force on Market
Mechanisms, U. S. Government Printing Office, Washington, 1988.
Leland, Hayrie EOn the Stock Market Crash and Portfolio Insurdnce,"
reproduced, 1987 (forthcoming, Journal of Economic Perspectives).
Pound, John, and Robert J. Shiller, "Are Institutional Investors
Speculators?" Journal of Portfolio Management, 198?.
Shiller, RobertJ .," Investor Behavior in the October 198? Stock Market Crash: Survey Evidence," NBER Working paper #2446, November 1987).
Shiller, Robert J .,"Portfolio Insurance and Other Investor Fads as Factors
in the 1987 Stock Market Crash," forthcoming, Stanley Fischer, ed. , NBER
Macroeconomics Annual, 1988.
Tautsui, Yoahiro, "Tests of Causality between the New York and Tokyo Stock
Exchanges," reproduced, 1988.
Working Group on Financial Markets, Interim Report, U. S. Government
Printing Office, May, 1988.
22


![Additive Manufacturing of Anatomical Phantoms [11] Yoshiro ... · PDF fileEstablish a Design Guide to Support Panty Hose, ... Geomagic Studio 12 (Geomagic Inc., ... parametric surfaces](https://img.pdfslide.net/doc/110x75/5abcf1967f8b9af27d8e9250/additive-manufacturing-of-anatomical-phantoms-11-yoshiro-a-design-guide-to.jpg)