Embed Size (px)
Citation preview

K. R. Shanmugam
MADRAS SCHOOL OF ECONOMICSGandhi Mandapam Road
Chennai 600 025 India
April 2015
AN INTER-COUNTRY ANALYSIS ON GROWTH OF NON-BANK FINANCIAL INTERMEDIARIES
WORKING PAPER 100/2015

i
An Inter-Country Analysis on Growth of Non-Bank Financial Intermediaries
K.R. Shanmugam
Director and Professor, Madras School of Economics [email protected]

ii
WORKING PAPER 100/2015
April 2015
Price : Rs. 35
MADRAS SCHOOL OF ECONOMICS
Gandhi Mandapam Road Chennai 600 025
India
Phone: 2230 0304/2230 0307/2235 2157
Fax : 2235 4847/2235 2155
Email : [email protected]
Website: www.mse.ac.in

iii
An Inter-Country Analysis on Growth of Non-
Bank Financial Intermediaries
K.R. Shanmugam
Abstract
Non-Bank Financial Institutions (NBFIs) or shadow banks are internationally recognized as financial intermediaries. There have been debates in the literature on the exact relation (complementary or substitutability) between non-banking and banking sectors and between financial sector development/liberalization and economic growth. This study analyzes these issues using the data from 25 major nations in the world during 2006-13 and panel data methodology. Results of the study suggest that (i) NBFIs hold nearly 22 percent of the total financial system assets; (ii) both credit risk and funding risk associated with interconnectedness between banks and non-banks sectors was larger for NBFIs than for banks in almost all nations; (iii) banks and Non-banking institutions are competing each other; (iv) financial sector represented by banking sector plays a significant role in determining GDP growth of nations, thereby confirming the Schumpeterian idea of finance spurring growth and (v) the economic growth and non-banking sectors growth are positively related, supporting the Robinsonian conjecture of economic growth leading to more dynamic financial sector development. The NBFI regulation is generally underdeveloped in almost all countries. The most nations do not have policy instruments that are specially designed for dealing with systemic risks associated with NBFIs. A perpetual challenge for financial regulators and supervisors in various nations is to choose appropriate regulatory mechanism suited to their countries. Keywords: Non-Bank Financial Sector, Regulation, Systemic Risk,
Global Economies
JEL Codes: E44, G21

iv
ACKNOWLEDGEMENT Earlier version of this paper was presented at Fifth MSE faculty seminar in March 2015. The comments received from Dr. N.S Siddharthan are gratefully acknowledged.

1
INTRODUCTION
The financial system of any country consists of (i) financial markets, (ii)
financial intermediaries and (iii) financial instruments or financial
products. These components facilitate the transfer of funds. They are, in
general, not always mutually exclusive. Non-Bank Financial Institutions
(NBFIs) or non-bank businesses or shadow banks are internationally
recognized as financial intermediaries and defined as ―credit
intermediation outside the conventional banking system and constitute
1/4th of total financial intermediaries (like insurance companies, mutual
funds, market makers, and other financial services providers) world wide
(IMF, 2014). 1
While the shadow banking takes vastly different forms across
countries, the NBFIs assets (in major 25 nations) amount to US $
62601.6 billion (in 2013). The USA has the largest NBFIs assets (US $
25203 billion), followed by the UK (US $ 9293.5 billion). Among the
BRICS, India has the third largest shadow banking sector next only to
China and Brazil (FSB, 2014).
The NBFIs provide several forms of financial services (within the
economic system), serve as competitors to banks and specialize in
sectors or groups. For instances, in India, the growth of Non-Banking
sector laid foundation for the development of road transport sector
because they function mainly in the business of providing finance of the
purchase of transport vehicles and good traffic is handled by the Road
transport sector.
1 Generally, the non-bank businesses refer to non-deposit taking financial intermediaries only for
current accounts and in some countries they include differing characteristics including deposit
taking, but not providing credit services like postal saving entities in USA, Japan and Italy. While
the terms NBFIs and NBFCs (Non-Banking Financial Companies) are generally used interchangeably, technically there lies a difference. The term NBFC is more suited to India as the
definition of NBFC includes companies incorporated under the Companies Act 1956.

2
The non-banks play a complementary role in the financial
inclusion agenda in many countries including India. They can also
complement banks by expanding access to credit, i.e., to under-banked
communities, sub prime customers and low rated firms or by supporting
market liquidity, maturity transformation and risk sharing (Claessens et.
al., 2012). For example, securitization mobilizes illiquid assets and
structured finance techniques can be used to tailor risk and return
distributions to better fit the needs of ultimate investors. Thus, they
bring the much-needed diversity to the financial sector, thereby
diversifying the risks and increasing liquidity in the markets that promote
the financial stability.
Like the Banking sector that has always been highly regulated,
the NBFIs are facing increased regulatory restrictions in recent years in
many nations. However, due to their simplified sanction procedures,
flexibility and timeliness in meeting the credit needs and low cost
operations, the NBFIs are getting an edge over banks in providing
funding. Regulatory arbitrage is another reason for why NBFIs find a
place. The regulatory arbitrage enables less regulated NBFIs to offer
financial products at prices that are cost inefficient if offered by regulated
banking institutions. As a result, customers and consumers receive more
efficient services.
Despite their advantages, the 2008 financial crisis brought out
the role of the shadow banking as a source of systemic risk. As the banks
in general avail short-term funds for traders and commerce, the NBFIs
have emerged to cater to the needs of medium and long-term credit and
often borrow funds from banks and extend them as loans to customers.
During the crisis period, in many advanced economies, money market
mutual funds, securitization vehicles etc were highly leveraged or had

3
large holdings of illiquid assets and vulnerable to runs when investors
withdrew large quantities of funds at short notice. This led to fire sales of
assets that intensified financial turmoil by reducing asset values and
helped spreading the stress to banks (IMF, 2014).
Thus, the recent crisis identified the NBFIs as the major source of
systemic risk through their significance as a source of credit and liquidity
in the economy and their interconnectedness with banking system
(Dudley, 2009). Experts of this field believe that the only way to control
these risks is through proper regulation. Too little or no regulation can
lead to crisis. On the other hand, too strict or inappropriate regulation
can hinder innovation and development. Getting the right balance is a
perpetual challenge for financial regulators and supervisors not only in
developing nations, but also in developed/advanced nations. As the data
or information on this sector is limited, policy makers in various nations
initiated increased efforts to better understand this sector and identify
information needed to develop robust monitoring system.
At the 2010 Seoul Summit, the G20 Leaders requested the
Financial Stability Board (FSB) to make recommendations to strengthen
the oversights and regulation of the shadow banking system along with
other international bodies. The FSB (2011) published its first report:
―Shadow Banking-Scoping the Issues.‖ Subsequently, it brought out its
Global Shadow Banking Monitoring Reports for the years 2012, 2013 and
2014. While the FSB collected the data from 25 major nations with
operations of NBFIs, it in its report mostly provides the aggregate level
analysis for USA, UK, Euro nations and others. It does not do any
empirical exercise to identify the factors determining the growth of NBFIs
and to analyze the relation between the economy growth and growth of
banking and non-banking sectors. While IMF (2014) analyzes this
relationship, it uses the data from 1999 to 2011. As the definition of

4
NBFIs has changed significantly in many nations from 2006-07, the
analysis based on the combined data during 1999-2011 may be biased.
Against this backdrop, this study aims to shed some light on the
relationship between growth of non-banking sector and growth of
economy and growth of banking sector, using the data for 25 nations
during 2006-2013. The rest of this study proceeds as follows: The next
two sections explain the theory, the methodology and the data sources.
Then analysis of data and empirical results of the study are presented
and discussed. The final Section provides the concluding remarks.
THEORY AND MODEL
While the literature on the relation between financial development and
economic growth is vast, there has been a debate on the exact
relationship between them. One set of literature led by the seminal works
of McKinnon (1973) and Shaw (1973) argue that ―the cross-country
capital flows as well as the progressive development of domestic financial
activities contributes to better availability of savings for investment
purposes. Intensified and more advanced financial market transactions
permit for better, more efficient risk diversification between alternative
uses. All this will lead to enhanced economic opportunities and faster
output growth. Thus, finance development/liberalization can exert a
positive impact on growth as interest rate level changes towards the
competitive market equilibrium, while resources are efficiently allocated‖.
Another group of literature views that ―financial liberalization may
turn to be excessively selective, leaving smaller businesses, or small
economies without sufficient access to finance‖ (Stiglitz, 2000). Studies
such as World Bank (2001) and Basu and Srinivasan (2002) report
country-specific evidence of financial flows disproportionally flooding only
in some selected economies of Latin America and Asia.

5
Thus, the inconclusiveness at the conceptual ground is
substantially mirrored in the empirical evidence. See Edison et. al.,
(2004), Andersen and Tarp (2003) and Gibson and Tsakalotos (1994) for
a comprehensive survey of the literature on the effects of capital account
liberalization on economic growth. Also see Pagano (1993) and Levine et.
al., (1999) for a review of theoretical and empirical works on the link
between financial development and growth.
Another dimension of the debate, namely the direction of
causality has been raised in some studies starting from Goldsmith (1958,
1969) and Patrick (1966). Since then, arguments for supporting both
Schumpeterian idea of finance spurring growth (Schumpeter, 1912) and
Robinsonian conjecture of economic growth leading to more dynamic
financial sector development (Robinson, 1952) have been made in
theoretical and empirical literatures. Greenwood and Jovanovic (1990)
also rediscover this two-way relationship in their theoretical model
(Gehringer, 2013).
While the study by IMF (2014) analyzes the relationship between
NBFIs growth and GDP growth, it ignores the following two important
issues, namely the exact causal relationship between the two and
changing definition of NBFIs sector. The present study attempts to
overcome these limitations.
This study specifies the NBFIs growth equation as:
NBFIgit = 1 + 2 GDPgit + 3 ln BATit + i + t + it (1)
where, GDPgit is GDP real growth of nation i in time t ;
NBFIgit is the Annual Rate of Growth of NBFIs Asset (real) in nation i in
year t ;
BAT is banks‘ asset (real) in nation i at time t ;

6
i - country specific (unobserved heterogeneity) effect ; and
t - time specific effect.
The standard panel data model - fixed effects or random effects
model estimation procedure can be used to estimate the equation (1).
The fixed effects model assumes that the unobserved heterogeneity
factor and independent variables already included in the equation (1) are
correlated while the random effects model assumes that there is no such
correlation. The choice between the two methods of estimation depends
on the Hausman‘s statistics. Similarly, the choice between one way (i.e.,
only country specific effects) and two-way effects (country specific as
well as temporal effects) models depends on the standard Chow test.
As there is a simultaneity issue because the GDP growth is
endogenous and may be correlated with error in equation (1), the
solution is a panel 2SLS model estimation wherein the GDP growth
variable is replaced by its fitted values from the auxiliary regression:
GDPgit = β1 + β 2 ln GDPi,t-1 + β 3 ln BATit + β 4 NBFIgit + t + i + ΰit (2)
DATA
This study uses the data on NBFIs compiled by the FSB for its Report
―Global Shadow Banking Monitoring Report 2014‖ from the following 25
major countries during 2006-2013: (1) Argentina, (2) Australia, (3) Brazil,
(4) Canada, (5) Chile, (6) China, (7) France, (8) Germany, (9) Hong
Kong, (10) India, (11) Indonesia, (12) Italy, (13) Japan, (14) Korea, (15)
Mexico, (16) Netherland, (17) Russia, (18) Saudi Arabia, (19) Singapore,
(20) South Arica, (21) Spain, (22) Switzerland, (23) Turkey, (24) UK and
(25) USA.2 These 25 nations account for nearly 80 percent Global GDP
2 Shadow banking monitoring data base is available in
http://www.financialstabilityboard.org/2014/11/global-shadow-banking-monitoring-report-2014/.
The FSB compiled the data supplied by national jurisdictions based on the balance sheets of the

7
and 90 percent of Global Financial system assets. The countries-
Germany, France, Italy, Netherland and Spain constitute the Euro-area.
The GDP (real) and CPI inflation data are also from World Bank website
and World Economic Outlook sources. Using the CPI inflation data, the
implicit deflator is derived and using this, the real values of NBFIs asset,
banks asset etc are computed.
RESULTS
An Overview of Financial Systems of 25 Major Countries: This
section primarily aims to provide a systematic account of size,
composition and trends of major global financial system.3 Countries differ
in terms of economic development measured in terms of per capita
income (Chart 1).4 The top 3 nations in terms of per capita figure (in
2013) are: Switzerland (US $ 90760), Australia (US $ 65390) and
Singapore (US $ 54040). The poorest nations are: India (US $ 1570),
Indonesia (US $ 3580) and China (US $ 6560). India‘s per capita income
is only 1.73 percent of Switzerland‘s per capita income, which is the
highest among the sample nations.
financial system, as recorded in national financial accounts (i.e., Flow of Funds). For data source
and limitations, see the report: FSB (2014). 3 The financial system plays a key role in the smooth and efficient functioning of the economy. Its
most fundamental contribution is to channel resources from individuals and companies with surplus resources to those with resource deficits. In doing so, the financial system not only
satisfies the savings needs of the country, but also facilitates the accumulation of investment capital that is critical to growth and development. It also revolves the risk preferences of
individuals and companies (Carmichael and Pomerleano, 1999). 4 The Countries also differ in terms of the size of GDP. The USA ranks first with the nominal GDP of
US $ 16768 billion, followed by China (US $ 9622.5 billion), and Japan (US $ 4547.1 billion).
The GDP of India is US $ 1889.7 billion only (not shown).

8
Chart 1: Economic Indicator: Per Capita Income (2013) in US $
Source (Basic Data): World Bank Website.
In terms of size of financial markets, USA (US $ 81269.4 billion)
has the largest capital market, followed by UK (US $ 34151.8 billions)
and Japan (US $ 30991.2 billions).5 Netherland has the highest financial
assets-GDP ratio (1325.1 percent), followed by UK (1278.5 percent) and
Hong Kong (1129.9 percent). The bottom 3 nations with low ratio are:
Argentina (69.6 percent), Indonesia (79.1 percent) and Mexico (115.6
percent). The ratio is 147.7 percent in India. The Euro-area accounts for
nearly 21 percent of the total financial assets and its financial assets-GDP
ratio is 534.5 percent (Table 1).
5 The total financial assets comprise the assets of central banks, banks, insurance companies, pension
funds, public financial institutions, financial auxiliaries and other financial intermediaries (or
NBFIs).
0
20000
40000
60000
80000
100000In
dia
Indon
esia
Ch
ina
Sou
th A
fric
a
Mex
ico
Turk
ey
Bra
zil
Ru
ssia
Arg
enti
na
Ch
ile
Kore
a
Sau
di
Ara
bia
Spai
n
Ital
y
Hon
g K
on
g
UK
Fra
nce
Japan
Ger
man
y
Net
her
land
Can
ada
US
A
Sin
gap
ore
Aust
rali
a
Sw
itze
rlan
d
15
70
35
80
65
60
71
90
99
40
10
97
0
11
69
0
13
85
0
14
59
1
15
23
0
25
92
0
26
26
0
29
92
0
35
86
0
38
42
0
41
68
0
43
46
0
46
33
0
47
27
0
51
06
0
52
20
0
53
47
0
54
04
0
65
39
0
90
76
0

9
Table 1: Financial Indicators
Countries Financial Asset (Nominal)
Value in 2013 (USD billion)
As Percent of GDP
Average Growth (2006-13)
Argentina 357.0 69.6 9.7
Australia 5111.7 367.4 11.8
Brazil 4913.2 237.6 19.5
Canada 8580.7 485.2 9.8
Chile 612.5 233.9 12.1
China 34427 357.8 24.1
France 17244 591.6 7.4
Germany 16280.6 431.2 4.5
Hong Kong 3096.9 1129.8 12.1
India 2790.9 147.7 15.6
Indonesia 589.4 79.1 16.6
Italy 8027 373.1 6.8
Japan 30991.2 683.1 2.4
Korea 5421.2 400.5 9.3
Mexico 1423 115.6 9.6
Netherland 11747.4 1325.1 8.9
Russia 2746.6 134.7 23.8
Saudi Arabia 1389.2 185.6 15.6
Singapore 2329.6 790.6 11.1
South Africa 1064.2 330.7 6.3
Spain 6193.3 441.8 7.6
Switzerland 6226.4 920 10.9
Turkey 1105.6 151.1 13.3
UK 34151.8 1278.5 7.0
USA 81269.4 484.7 4.9
Total 288089.6 473.2 7.3 Euro-area 59492.3 534.5 6.7 Source (Basic Data): FSB (2014).
During 2006-13, the total (global) financial assets grew at an
average rate of 7.3 percent and in euro area, it grew at 6.7 percent

10
(Table 1). In USA, UK and Japan it grew at 4.9 percent, 7 percent and
2.4 percent respectively. However, it grew at 24.1 percent in China, 23.3
percent in Russia, 19.5 percent in Brazil, 16.6 percent in Indonesia and
15.6 percent in India. As the financial asset growth is relatively high in
low income countries as compared to rich nations, it is an evident that
convergence happens and poor economies are catching up with rich ones
in terms of financial sector development.
Relative to GDP, the banks‘ assets is the largest in Hong Kong
(797.2 percent) and is the lowest in Argentina (30.1 percent). In India,
the banks‘ asset is 88.8 percent of GDP. In six countries – Argentina,
India, Indonesia, Mexico, Russia, and Saudi Arabia, the banks‘ asset-GDP
ratio is less than 100 percent (Table 2).
In 14 out of 25 nations, banks hold a larger share of financial
system assets, accounting for at least half of the financial system assets.
Among these 14 nations, Singapore ranks first with banks share of 76.4
percent, followed by China (72.1 percent) and Hong Kong (70.6 percent).
Only in Netherland and USA, banks hold less than 30 percent of total
financial assets of their respective countries. In India, the banks‘ share is
more than 60 percent (Chart 2). On a total assets basis, China‘s banking
system is the largest among 25 nations and USA and UK are the second
and the third largest (Table 2).
While the global financial systems remain predominantly bank-
based (with banks share of 46.9 percent), the NBFIs hold nearly 22
percent of the total financial system assets (Chart 2). In Netherland, the
NBFIs hold 57.3 percent of total financial assets and in Euro-area, they
hold 23.3 percent. The NBFIs hold 12 percent in India and 8.7 percent in
China. In Saudi Arabia, they merely hold about 2 percent of total financial
assets.

11
Table 2: Size of Banks and NBFIs (2013)
Countries Banks Assets NBFIs Assets
USD Billion
As Percent of GDP
USD Billion
As Percent of GDP
Argentina 154.3 30.1 28.2 5.5
Australia 2729.4 196.2 737.6 53.0
Brazil 2099.9 101.5 1120.5 54.2
Canada 3909.3 221.1 2157.1 122.0
Chile 267.3 102.1 71.7 27.4
China 24824.1 258.0 2998.6 31.2
France 10236.2 351.2 2721.5 93.4
Germany 9664.9 256.0 2582.2 68.4
Hong Kong 2185.0 797.2 200.9 73.3
India 1677.2 88.8 335.1 17.7
Indonesia 334.4 44.9 53.3 7.2
Italy 5036.8 234.1 861.7 40.1
Japan 16484.2 363.3 3635.2 80.1
Korea 2460.9 181.8 1478.9 109.3
Mexico 512.0 41.6 287.2 23.3
Netherland 2812.6 317.2 6730.9 759.2
Russia 1874.7 91.9 84.1 4.1
Saudi Arabia 490.9 65.6 26.2 3.5
Singapore 1780.8 604.5 128.8 43.7
South Africa 359.2 111.6 192.7 59.9
Spain 4011.9 286.2 975.5 69.6
Switzerland 2573.6 380.3 1768.0 261.2
Turkey 772.2 105.5 109.8 15.0
UK 17793.8 666.1 9293.5 347.9
USA 20204.1 120.5 25202.8 150.3
Total 135249.6 222.2 62601.6 102.8
Euro -area 31762.3 285.4 13871.8 124.6 Source (Basic Data): FSB (2014).

12
Chart 2: Share of Banks and NBFIs in the Total Financial System
Assets (2013)
0.0
10.0
20.0
30.0
40.0
50.0
60.0
70.0
80.0
Net
her
land
US
A
Sou
th A
fric
a
Sau
di
Ara
bia
Mex
ico
Sw
itze
rlan
d
Bra
zil
Arg
enti
na
Ch
ile
Kore
a
Can
ada
UK
Japan
Aust
rali
a
Indon
esia
Fra
nce
Ger
man
y
India
Ital
y
Spai
n
Ru
ssia
Turk
ey
Hon
g K
on
g
Ch
ina
Sin
gap
ore
Tota
l
Euro
A
rea
23
.9
24.9
33.7
3
5.3
36.0
41.3
42.7
43.2
43.6
45.4
45.6
52.1
53.2
53.4
56.7
59.4
59.4
60.1
62.7
64.8
68.3
69.8
70.6
72.1
76.4
46.9
53.4
Banks' Share(%)
0.0
10.0
20.0
30.0
40.0
50.0
60.0
Sau
di
Ara
bia
Ru
ssia
Sin
gap
ore
Hon
g K
on
g
Arg
enti
na
Ch
ina
Indon
esia
Turk
ey
Ital
y
Ch
ile
Japan
India
Aust
rali
a
Spai
n
Fra
nce
Ger
man
y
Sou
th A
fric
a
Mex
ico
Bra
zil
Can
ada
UK
Kore
a
Sw
itze
rlan
d
US
A
Net
her
land
Tota
l
Euro
A
rea
1.9
3
.1
5.5
6
.5
7.9
8
.7
9.0
9
.9
10
.7
11
.7
11
.7
12
.0
14
.4
15
.8
15
.8
15
.9
18
.1
20
.2
22
.8
25
.1
27
.2
27
.3
28
.4
31.0
57.3
2
1.7
2
3.3
NBFIs' Share (%)

13
The NBFIs assets relative to GDP in the 20+Euro area group of
nations increase to 102.8 percent (in 2013). In absolute term, the NBFIs
assets in all these nations amount to US $ 62601.6 billion. The USA has
the largest NBFIs sector, amounting to US $ 25202.8 billion, a 40.3
percent of total NBFIs assets in the globe (Chart 3). The United Kingdom
has the second largest NBFIs sector, amounting to US $ 9293.5 billion, a
14.9 percent share of 20+Euro group total. The Euro-area has the third
largest NBFIs sector, accounting to US $ 13871.8 billion, a 22.16 percent
share. Combined together, the euro-area, USA and UK represent 77.4
percent of total global NBFIs assets in 2013. This compares with their
modest share (51.6 percent) in terms of global banks assets.
Chart 3: Country’s Share (Percent) in Total NBFIs Assets in 25
Nations (2013)
Source (Basic Data): FSB (2014).
US
A,
40
.26
UK
, 1
4.8
5
Net
her
lan
d, 1
0.7
5
Jap
an, 5
.81
Ch
ina,
4.7
9
Fra
nce
, 4
.35
Ger
man
y,
4.1
2
Can
ada,
3.4
5
Sw
itze
rlan
d,
2.8
2
Kore
a, 2
.36
Bra
zil,
1.7
9
Sp
ain
, 1
.56
Ital
y,
1.3
8
Au
stra
lia,
1.1
8
Ind
ia, 0
.54
M
exic
o, 0
.46
Oth
ers,
1.4
3

14
The NBFIs assets amount to US $ 26.2 billion in Saudi Arabia and
US $ 28.2 billion in Argentina (Table 2). China is one of the 8 nations
with less than 10 percent share of NBFIs in the total financial system
while India is one among nine countries with 10-20 percent share of
NBFIs (Chart 2). It is noticed that in India, the NBFIs hold assets worth
of US $ 335.1 billion. However, its share in the total NBFIs asset in the
globe is only 0.54 percent (Chart 3). Interestingly, 10 other countries
(Argentina, Chile, Hong Kong, Indonesia, Mexico, Russia, Saudi Arabia,
Singapore, South Africa and Turkey) have fewer shares than India‘s
share.
During 2006-13, NBFIs assets (nominal) in the 20+euro area
grew at an average rate of 7.4 percent (Chart 4). China recorded the
highest growth of 128.4 percent. The other top two nations with higher
growth were Russia (40.2 percent) and India (36.6 percent). In top 3
nations with larger quantum of NBFIs assets –USA, UK and Netherlands-
the NBFIs‘ asset grew only at 3.9 percent, 11.5 percent and 12 percent
respectively. In Euro area, the growth rate was only 8.4 percent.
Composition of NBFIs: Table 3 presents the shares of sub-sectors of
NBFIs, namely money market funds, financial companies, structured
financial vehicles, hedge funds, equity funds, fixed income funds, broker-
dealers, real estate investment funds/trusts, trust companies and other
investment funds.6
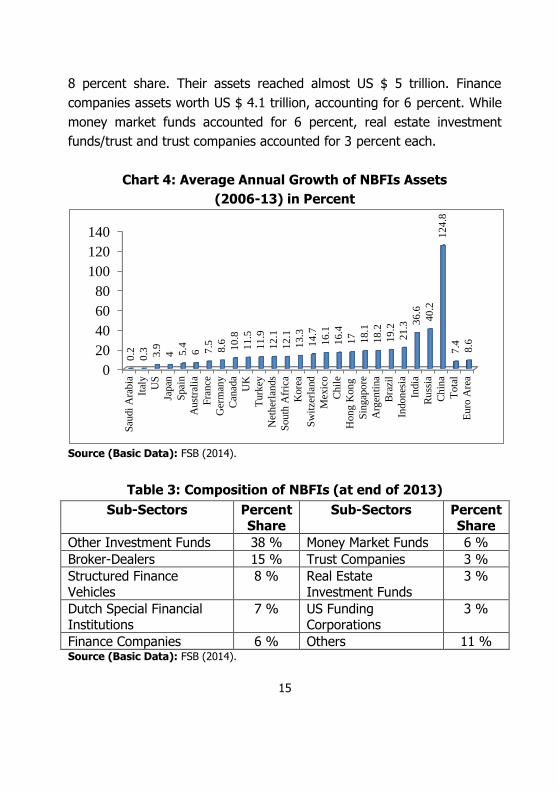
Other investment fund is the largest sub-sector of NBFIs with 38
percent share. The total assets of this sector amounts to US $ 24 trillion
(at end of 2013). The second largest subsector is the broker-dealers.
Their assets amounted to US $ 9.3 trillion, accounting for 15 percent of
total NBFIs assets. The structured finance vehicle is the third largest with
6 This section is primarily based on FSB (2014).
15
8 percent share. Their assets reached almost US $ 5 trillion. Finance
companies assets worth US $ 4.1 trillion, accounting for 6 percent. While
money market funds accounted for 6 percent, real estate investment
funds/trust and trust companies accounted for 3 percent each.
Chart 4: Average Annual Growth of NBFIs Assets
(2006-13) in Percent
Source (Basic Data): FSB (2014).
Table 3: Composition of NBFIs (at end of 2013)
Sub-Sectors Percent Share
Sub-Sectors Percent Share
Other Investment Funds 38 % Money Market Funds 6 %
Broker-Dealers 15 % Trust Companies 3 %
Structured Finance Vehicles
8 % Real Estate Investment Funds
3 %
Dutch Special Financial Institutions
7 % US Funding Corporations
3 %
Finance Companies 6 % Others 11 % Source (Basic Data): FSB (2014).
0
20
40
60
80
100
120
140
Sau
di
Ara
bia
Ital
y
US
Japan
Spai
n
Aust
rali
a
Fra
nce
Ger
man
y
Can
ada
UK
Turk
ey
Net
her
lands
Sou
th A
fric
a
Kore
a
Sw
itze
rlan
d
Mex
ico
Ch
ile
Hon
g K
on
g
Sin
gap
ore
Arg
enti
na
Bra
zil
Indon
esia
India
Ru
ssia
Ch
ina
Tota
l
Euro
Are
a
0.2
0.3
3.9
4 5.4
6 7.5
8.6
10
.8
11
.5
11
.9
12
.1
12
.1
13
.3
14
.7
16
.1
16
.4
17
18
.1
18
.2
19
.2
21
.3 36
.6
40
.2
12
4.8
7.4
8.6

16
Systemic Risks and Interconnectedness Between Banks and
NBFIs: Systemic risks can spill over from NBFIs to banking sector and
vice versa. This interconnectedness can take many forms, including direct
and indirect linkages. The direct linkages, for example, can be created if
NBFIs that form part of the banks‘ credit intermediation chain are owned
directly by banks or benefit directly from banks support. Funding
interdependence is another source of direct linkage as is the holding of
each others assets such as debt securities. Indirect linkage may exist
through a market channel as both banks and NBFIs may invest in similar
assets. These connections can create a contagious channel through
which the stress in one can transmit to the other.
There are many ways to capture the potential risks stemming
from the interconnectedness between banks and NBFIs. Two such
measures are: direct credit exposures and funding dependence on each
other (FSB, 2012). Conceptually, both banks and NBFIs pose credit and
funding risks to each other. The FSB (2014) suggests a methodology to
calculate the direct measures of credit exposure and funding dependence
based on aggregate balance sheet bilateral exposure between two
sectors (assets and liabilities of banks to NBFIs and NBFIs to banks).
Table 4 presents the details of banks‘ assets and liabilities to NBFIs (at
end of 2013) for selective nations.
The UK has the highest credit risk for banks of 16 percent,
followed by Netherland (5.4 percent), Italy (5.3 percent), Indonesia (3.7
percent) and Spain (3.7 percent). Brazil has the largest funding risk (19.1
percent) for banks. Other countries with higher funding risks for banks
are: UK (16.3 percent), Chile (11 percent), Netherland (7.7 percent), and
Switzerland (6.9 percent). The credit risk and funding risk for banks in
India are 2.8 percent and 4.1 percent respectively. Russia has the highest
credit risk for NBFIs due to their exposure to the banking sector of 52.1

17
percent, followed by Italy (30.9 percent), UK (30.6 percent), Indonesia
(23.5 percent), and Hong Kong (23 percent).
Table 4: Banks’ Assets and Liabilities to NBFIs
Countries Banks
Assets to OFIs
Banks
Liabilities to OFIs
Banks
Assets to OFIs
Banks
Liabilities to OFIs
As a Percent of Bank's
Assets, at end 2013
As a Percent of NBFIs
Assets, at end 2013
Argentina 1.3 n.a 6.9 n.a
Australia 3.0 5.4 11.3 19.9
Brazil 2.5 19.1 4.8 35.7
Canada 2.4 2.3 4.3 4.1
Switzerland 2.8 6.9 4.0 10.0
Chile 1.6 11.0 6.0 40.9
Spain 3.7 3.7 15.4 15.3
UK 16.0 16.3 30.6 31.3
Hong Kong 2.1 n.a 23.0 n.a
Indonesia 3.7 6.7 23.5 41.7
India 2.8 4.1 13.8 20.4
Italy 5.3 1.1 30.9 6.6
Mexico 0.5 3.0 0.9 5.4
Netherland 5.4 7.7 2.2 3.2
Russia 2.3 3.9 52.1 87.4
Saudi Arabia 0.1 0.2 2.8 3.7
Turkey 1.8 2.2 12.7 15.5
Euro Area 7.9 7.4 11.2 10.5
South Africa 1.0 n.a 1.9 n.a Source (Basic Data): FSB (2014).
In India, this risk is measured at 13.8 percent. Russia also has
the highest funding risk for NBFIs (of 87.4 percent) due to their reliance
with banking sector as a source of funding. Other nations with higher
funding risk for NBFIs are: Indonesia (41.7 percent), Chile (40.9
percent), Brazil (35.7 percent), UK (31.3 percent), and India (20.4

18
percent). Only in Canada, Italy, Mexico, Netherland, and Saudi Arabia,
this risk is less than 10 percent. Finally, it is noted that the risk
associated with interconnectedness between two sectors was larger for
NBFIs than for banks in almost all nations.
Size of Insurance and Pension Funds: The Regional Consultative
Group for Asia of FSB in its recent report: Report on Shadow Banking in
Asia (2014a) redefines the NBFIs that include OFIs (other financial
institutions which is basically the NBFIs used above), PFIs (government
owned financial institutions providing specialized services), Insurance
companies (engaging in the business of underwriting insurance, receiving
premiums and paying insurance benefits) and Pension Finds (generally
funds set up to pay the pension benefits of employees after their
retirement). Therefore, we can review the growth of insurance sector and
pension funds during 2006-13 and redefine the NBFIs as NBFIs* that
include the insurance companies, pension finds and PFIs. The insurance
companies hold 9.5 percent of total financial assets while pension funds
hold 9.2 percent. During 2006-13, the global insurance companies assets
grew at 5.26 percent per annum while the pension fund grew at 6.2
percent (Table 5).
The top 5 nations with larger insurance companies‘ assets are:
USA, Japan, France, UK and Germany. These 5 countries account for
nearly 68 percent of the total global insurance companies assets. The
USA, The UK, Netherland, Australia, and Japan are top 5 nations in terms
of larger pension funds assets and they jointly account for 87.4 percent
of total pension funds assets in the globe. In India, the insurance
companies hold 11.1 percent of total financial assets in the county while
the pension funds hold only 0.2 percent. During 2006-13, insurance
companies‘ assets in India grew at 15.9 percent per annum while the
pension funds asset grew at 68.8 percent (which is the second highest in

19
the globe next only to China with 119.5 percent growth). Table 6 shows
the size (at end of 2013) and growth of NBFIs* (redefined NBFIs) assets
in 25 nations during 2006-13.
Table 5: Size of Insurance Companies and Pension Funds (2013)
Countries Insurance Companies Assets Pension Funds Assets
US $ billion
Percent of Total Assets
Growth (Percent)
During
2006-13
US $ billion
Percent of Total Assets
Growth (Percent)
During
2006-13
Argentina 13 3.7 0.76 50.5 14.2 11.3
Australia 160.7 3.1 10.64 1,369.5 26.8 15.4
Brazil 236.5 4.8 22.19 312.2 6.4 14.3
Canada 700.9 8.2 7.51 1,242.2 14.5 9.2
Chile 51.7 8.4 10.58 170.5 27.8 13.9
China 1,359.5 3.9 28.50 40.9 0.1 119.5
France 2,998.3 17.4 7.86 0 0 -
Germany 2,949.1 18.1 6.07 0 0 -
Hong Kong 210.6 6.8 16.80 103.0 3.3 11.4
India 310.8 11.1 15.87 5.0 0.2 68.8
Indonesia 53.6 9.1 22.73 13.3 2.3 11.2
Italy 841.4 10.5 3.65 50.6 0.6 10.4
Japan 4,050.9 13.1 3.02 1,330.3 4.3 1.9
Korea 731 13.5 12.35 64.6 1.2 10.5
Mexico 69.7 4.9 10.70 163.7 11.5 15.1
Netherland 598.6 5.1 3.11 1,385.4 11.8 7.4
Russia 39.8 1.5 4.56 58.6 2.1 23.5
Saudi Arabia 8.3 0.6 32.66 0 0 -
Singapore 142 6.1 11.61 0 0 -
South Africa 213.7 20.1 4.10 225.1 21.2 7.3
Spain 410.1 6.6 5.68 128.5 2.1 5.6
Switzerland 613.2 9.8 8.98 721.9 11.6 9.1
Turkey 29.2 2.6 14.87 11.8 1.1 43.4
UK 2,965.2 8.7 3.45 2,847 8.3 8.9
USA 7,508.1 9.2 3.85 16,350 20.1 5.2
Total 27,266 9.5 5.26 26,644.9 9.2 6.2
Euro-area 7,797.6 13.1 6.04 1,564.6 2.6 7.3 Source (Basic Data): FSB (2014).

20
Table 6: Size of NBFIs* and Its Growth@
Countries NBFIs*’ Assets
(USD Billion)
Percent Share
in Total Assets
Avg. Growth
Percent (2006-13)
Argentina 91.8 25.7 10.2
Australia 2267.8 44.4 11.0
Brazil 1999.0 40.7 19.0
Canada 4513.9 52.6 9.8
Chile 300.4 49.0 13.5
China 4399.0 12.8 51.7
France 6212.7 36.0 7.4
Germany 5531.3 34.0 7.1
Hong Kong 520.7 16.8 15.1
India 715.8 25.6 20.0
Indonesia 120.1 20.4 20.1
Italy 2190.0 27.3 4.9
Japan 12262.7 39.6 0.6
Korea 2522.6 46.5 12.7
Mexico 715.4 50.3 12.1
Netherland 8715.0 74.2 10.3
Russia 182.5 6.6 38.3
Saudi Arabia 172.3 12.4 8.2
Singapore 270.8 11.6 13.3
South Africa 651.5 61.2 7.2
Spain 1726.4 27.9 6.4
Switzerland 3103.1 49.8 11.9
Turkey 170.9 15.5 13.7
UK 15693.4 46.0 8.4
USA 56991.5 70.1 4.0
Total 132040.6 45.8 5.9
Euro-area 24375.4 41.0 7.9 Source (Basic Data): FSB (2014). @ - NBFIs *- Redefined NBFIs.
The total NBFIs* assets in 20+ Euro area grew at 5.9 percent,
which is less than the NBFIs growth of 7.4 percent. In Euro area alone, it
grew at 7.9 percent as against the NBFIs growth of 8.6 percent in this

21
region. In India and China the NBFIs* assets grew at 20 percent and
51.7 percent respectively. In these nations, the NBFIs assets grew at
36.6 percent and 124.8 percent respectively. It is noticed that only in
Australia, Italy, Saudi Arabia, and Spain the growth of NBFIs* assets are
higher than the growth of NBFIs assets.
Relation Between Growths of NBFIs, Banks and Economy
This section presents the Panel 2SLS estimation results of equations (1)
and (2) discussed in the theory and Model Section. First let us discuss the
GDP growth equation results shown in Table 7. It is basically the panel
conditional convergence model for economic growth suggested by Barro,
Mankiw and Sala-i-Martin (1995). In the preliminary model, we include
the NBFIs real growth variable, but it is not statistically significant at 5
percent.7 Therefore in the final model, it is dropped. The Hausman
statistics supports the one-way fixed effects model.
As expected, the -convergence coefficient (i.e., 2) is negative
and statistically significant at 1 percent level as predicted by the theory.
This means that there is a negative association between GDP growth and
initial GDP, providing a strong evidence for conditional convergence
among the nations. The speed of convergence (the rate at which the
economy converges towards its steady state income) is -0.164. This is
the responsiveness of the average growth rate to the gap between ln
GDP* (steady state income) and ln GDP0 (initial income). By our empirical
setting, this rate is the same for all nations.
The bank asset variable has a positive and significant impact on
the GDP growth at 5 percent level of significance. This result provides a
strong support for the Schumpeterian idea of finance spurring growth.
The top 3 nations having larger intercepts (unobserved heterogeneity
7 Even in the 2SLS estimation, it is not significant and so it is dropped in the final model.

22
effects) are: Indonesia, Korea, and Japan. Countries with low intercepts
are: Turkey, Singapore and Netherlands.
Table 7: Panel Conditional Convergence (One Way Fixed Effects)
Model Results (Dependent Variable: Real GDP growth of Sample Countries)
Variables Coefficients Abs. t Values
Ln GDPi,t-1 -0.1644 5.235
Ln Bank Assetsit 0.0383 2.388
R Square [F statistics] 0.5531 [8.24]
Hausman Statistics 31.06
Country Specific Effects
Argentina 0.8825 6.164
Australia 0.9276 5.966
Brazil 0.9141 6.033
Canada 0.9248 5.879
Chile 1.7338 5.729
China 1.2917 6.295
France 0.8925 5.742
Germany 0.9428 5.812
Hong Kong 0.9863 6.024
India 1.5809 5.983
Indonesia 2.2618 5.666
Italy 0.8725 5.704
Japan 1.7930 5.787
Korea 2.0195 5.757
Mexico 1.3516 5.799
Netherlands 0.7437 5.716
Russia 1.5286 5.828
Saudi Arabia 0.9763 6.162
Singapore 0.7000 6.124
South Africa 1.0489 5.935
Spain 0.8343 5.737
Switzerland 0.7578 5.837
Turkey 0.5913 6.106
United Kingdom 0.8375 5.610
United States 1.2249 5.864

23
Table 8 presents the panel data model estimation results of
NBFIs asset growth equation. In model 1, we provide the regular panel
model results. The Hausman statistics supports the two-way fixed effects
model. The bank asset has a negative and significant impact on NBFIs
growth, indicating competitiveness between banks and NBFIs. The GDP
growth is positive, but not significant.
Table 8: Panel Data Model Estimation Results of NBFIs’ Asset
Growth (real) Variables Model 1 Model 2 (2SLS) Model 3
(NBFC*):2SLS
Coefficients t-Values Coefficients t-Values Coefficients t-Values
GDP Growthit 1.3928 1.029 1.8146 2.546 0.882 1.664
Ln Bank Assetsit -0.452 -2.67 -0.4147 -2.478 -0.1383 -1.759
Constant 3.3863 2.746 10.7424 3.477
R2 [F Stat.] 0.5273 [5.41] 0.5422 [5.75] 0.2435 [2.14]
Hausman Stat. 19.91 14.72 22.11
Country Specific Fixed Effects
Argentina -1.4911 -2.313 -3.3183 -3.07 0.5623 1.666
Australia 0.0027 0.02 -1.4636 -2.077 1.098 1.84
Brazil -0.1897 -1.245 -1.7649 -2.321 1.0666 1.954
Canada 0.2379 1.354 -1.1959 -1.727 1.1555 1.853
Chile -1.0458 -2.233 2.9929 1.52 0.7625 1.883
China 1.8419 4.203 2.3954 5.146 1.6666 2.248
France 0.726 1.973 -0.9211 -1.079 1.2962 1.825
Germany 0.7732 1.993 -0.5768 -0.775 1.2999 1.806
Hong Kong -0.0109 -0.086 -1.1154 -2.065 1.0924 1.884
India -0.1621 -0.915 2.615 2.011 0.9949 1.84
Indonesia -1.0292 -2.22 6.5194 1.815 0.7949 1.944
Italy 0.3418 1.413 -1.3445 -1.655 1.1783 1.806
Japan 1.0493 2.047 5.5175 2.532 1.3489 1.753
Korea 0.0252 0.193 5.9668 2.124 1.0974 1.858
Mexico -0.7233 -2.115 0.7909 0.983 0.8504 1.87
Netherlands 0.2322 1.369 -2.3871 -1.932 1.1574 1.873
Russia -0.2261 -1.016 2.4101 1.9 1.1659 2.297
Contd...Table 8

24
Contd...Table 8
Variables Model 1 Model 2 (2SLS) Model 3 (NBFC*):2SLS
Coefficients t-Values Coefficients t-Values Coefficients t-Values
Saudi Arabia -0.9521 -2.731 -2.1876 -3.177 0.7681 1.685
Singapore -0.1155 -0.84 -3.2788 -2.161 1.032 1.819
South Africa -0.8522 -2.305 -1.4318 -3.154 0.7663 1.727
Spain 0.3071 1.433 -1.6769 -1.773 1.159 1.808
Switzerland 0.1424 1.014 -2.4369 -1.997 1.1412 1.903
Turkey -0.8858 -2.338 -4.6323 -2.562 0.8186 1.857
United Kingdom
1.0682 2.133 -0.9761 -0.901 1.3906 1.818
United States 0.9359 1.962 1.4998 2.742 1.3312 1.761
Time Effects
2006 0.0497 0.544 0.0196 0.216 - -
2007 0.2186 2.85 0.1853 2.458 - -
2008 -0.3374 -4.779 -0.3476 -4.972 - -
2009 0.1233 1.217 0.0694 1.009 - -
2010 0.0784 1.011 0.0792 1.12 - -
2011 -0.1096 -1.514 -0.0814 -1.14 - -
2012 0.0353 0.466 0.0674 0.872 - -
2013 -0.0582 -0.791 0.0082 0.101 - -
Model 2 in Table 8 presents the 2SLS panel model results. The
GDP growth is now positive and significant, indicating that on an average
1 percent increase in GDP growth of sample nations leads to 1.81 percent
increase in NBFIs growth. This result provides a strong support for the
Robinsonian conjecture of economic growth leading to more dynamic
financial sector development. As in model 1, the bank asset has a
negative and significant impact on the NBFIs asset growth, confirming
the substitution relation between banks and non-banks sectors in 25
sample nations. Finally, we present the model 3 results in which NBFIs*
growth is the dependent variable (i.e., combined growth of NBFIs
including insurance, pension funds etc.). The Chow test and Hausman
Statistics support one way fixed effects model. The results are more or
similar to results in Model 2. That is, the results in model 3 support that
(i) the Robinsonian conjecture that the economic growth leads to more
25
dynamic financial sector development and (ii) banks and non-banks
sectors are competing each other. However, it is noted these results are
supported by t values only at 10 percent level of significance.
CONCLUDING REMARKS
The NBFIs play an important role in the credit chain by filling credit voids
not covered by other financial intermediaries. Our empirical analysis of
interconnectedness of banks and NBFIs indicate that both credit risk and
funding risk associated with interconnectedness between these two
sectors was larger for NBFIs than for banks in almost all nations. Asian
countries like India in general face not the same shadow banking risks as
other jurisdictions like USA or UK, because Asia is relatively less
developed financial markets, offers less complex financial products and
the scale on non-bank sectors remains small in size and non systemic in
nature.
The empirical evidences of this study strongly support the
Robinsonian conjecture of economic growth leading to more dynamic
financial sector development as the GDP growth variable has a positive
and significant impact on NBFIs growth. Further, banking sector growth
is negatively associated with NBFIs growth, indicating that banks and
non-banks are competitors.
The results of the study also confirm the conditional convergence
of economic growth among nations. This means that in countries with
low level of initial level of GDP, the economic growth is faster as
compared to the growth in countries with larger initial GDP. The speed
of convergence is -0.164. This is the responsiveness of the average
growth rate to the gap between the steady state income and the initial
income. As the financial sector represented by banking sector plays a
significant role in determining GDP growth of nations, the study confirms
26
the prediction of the theory led by the seminar works of McKinnon (1973)
and Shaw (1973) and also confirms the Schumpeterian idea of finance
spurring growth.
The main challenges facing the NBFIs sector is that most nations
do not have policy instruments that are specially designed for dealing
with systemic risks associated with this sector. However, they use policy
tools derived from the general regulatory regime, e.g., consumer
protection rule for NBFIs will have an indirect effect in addressing
systemic risks by imposing limits on certain activities and or types of
risks. A few nations rely on prudential tools provided for banks (FSB,
2012). Some nations use macro-prudential framework to address build-
up of systemic risks of NBFCs. For instances, (i) Reserve Bank of
Australia (RBA) conducts annual monitoring exercise of shadow banking
entities including NBFCs and highlights any risks to the Council of
Financial Regulations for policy actions; (ii) Canadian government
determines which mortgage quality for government insurance, thus
limiting the activities in securitization markets; and (iii) The Financial
Stability Oversight Council in USA requires the Federal Reserve to
regulate specific NBFCs when they are deemed to be ―systematically
important‖ based on the Dodd-Frank Act. These models with appropriate
modifications may suit to many nations in dealing with regulatory issues
relating to NBFIs.
27
REFERENCES
Andersen, T. and F. Tarp (2003), ―Financial Liberalization, Financial
Development and Economic Growth in LDCs‖, Journal of International Development, 15 (2): 189-209. URL:
http://ideas.repec.org/a/wly/jintdv/v15y2003i2p189-209.html.
Barro, Robert J., N. Gregory Mankiw and Xavier Sala-I-Martin (1995),
―Capital Mobility in Neoclassical Models of Growth‖, The American Economic Review, 85(1), 103-115.
Basu, A. and K. Srinivasan (2002), ―Foreign Direct Investment in Africa:
Some Case Studies‖, IMF Working Paper No. 02/61. URL: http://ideas.repec.org/p/imf/imfwpa/02-61.html.
Carmichael, Jeffrey and Michael Pomerleano (1999), ―The Development
and Regulation of Non-Bank Financial Institutions‖, The World Bank Publications.
Claessens, S., S. Djankov, J. Fan and L. Lang (2002), ―Disentangling the Incentive and Entrenchment Effects of Large Shareholdings‖,
Journal of Finance, 57 (6): 2741-2771. URL:
http://ideas.repec.org/a/bla/jfinan/v57y2002i6p2741-2771.html.
Dudley, W.C. (2009), ―Proceedings from the Centre for Economic Policy
Studies (CEPS) Symposium 2009: More Lessons from the Crisis‖.
Edison, J. H., M. W. Klein, L. A. Ricci and T. Slok (2004), ―Capital Account
Liberalization and Economic Performance: Survey and Synthesis‖, IMF Staff Papers, 51 (2): 220-256. URL:
http://ideas.repec.org/p/nbr/nberwo/9100.html.
FSB (2011), ―Shadow Banking: Scoping the Issues-A Background Note of the Financial Stability Board‖, see:
http://www.financialstabilityboard.org/publications/r_110412a.pdf.
FSB (2012), ―Global Shadow Banking Monitoring Report 2012‖, November
2012, Financial Stability Board, http://www.financialstabilityboard.org/publication/r_121118c.pdf.

28
FSB (2014), ―Global Shadow Banking Monitoring Report 2014‖, October
2014, Financial Stability Board, http://www.financialstabilityboard.org/publication/r_141030.pdf.
FSB (2014a), ―Report On Shadow Banking in Asia‖, Regional Consultative
Group for Asia, August 2014, http://www.financialstabilityboard.org/publication/r_140822c.pdf.
Gehringer, A. (2013), ―Financial Liberalization, Growth, Productivity and Capital Accumulation: the Case of European Integration,‖
International Review of Economics and Finance 25: 291-309. URL: http://ideas.repec.org/a/eee/reveco/v25y2013icp291-
309.html.
Goldsmith, R. (1958), ―Financial Intermediaries in the American Economy Since 1900‖, Princeton: Princeton University Press.
Goldsmith, R. (1969), ―Financial Structure and Development‖, New Haven: Yale University Press.
Gibson, H. D. and E. Tsakalotos (1994), ―The Scope and Limits of
Financial Liberalization in Developing Countries: A Critical Survey‖, Journal of Development Studies 30 (3): 578-628.
Greenwood, J. and B. Jovanovic (1990), ―Financial Development, Growth, and the Distribution of Income,‖ Journal of Political Economy 98
(5): 1076-1107. URL: http://ideas.repec.org/p/cvs/starer/88-12.html.
Herring, Richard and Anthony M. Santomero (1999), ―Financial
Regulation in the Global Economy‖, Brookings Institution Press, Washington DC.
IMF (2014), ―Shadow Banking Around The Globe: How Large, And How Risky?‖, Chapter 2 in ‗Global Financial Stability Report: Risk
Taking, Liquidity, And Shadow Banking—Curbing Excess While
Promoting Growth‘.
29
Levine, Ross, Norman Loayza and Thorsten Beck (1999),
―Intermediations and Growth: Causality and Causes‖, World Bank Development Research Group, Washington D.C.
McKinnon, R. I. (1973), ―Money and Capital in Economic Development‖,
Brooking Institution, Washington, D.C.
Pagano, M. (1993), ―Financial Markets and Growth: an Overview‖,
European Economic Review, 37 (2-3): 613-622. URL: http://ideas.repec.org/a/eee/eecrev/v37y1993i2-3p613-622.html.
Patrick, H. T. (1996), ―Financial Development and Economic Growth in Underdeveloped Countries‖, Economic Development and Cultural Change 14 (2): 174-189. URL:
http://www.jstor.org/stable/1152568.
Robinson, J. (1952), ―The Role of Interest and Other Essays‖, London:
Macmillan.
Schumpeter, J. A. (1912), ―Theorie Der Wirtschaftlichen Entwicklung‖,
Leipzig: Duncker and Humblot.
Shaw, E. S. (1973), ―Financial Deepening in Economic Development‖, Oxford: Oxford University Press.
Stiglitz. J. E. (2000), ―Capital Market Liberalization, Economic Growth, and Instability‖, World Development, 28 (6): 1075-1986. URL:
http://ideas.repec.org/a/eee/wdevel/v28y2000i6p1075- 1086.html.
World Bank (2001), ―Global Development Finance 2001‖, The World
Bank: Washington DC.
HOW RISKY?

MSE Monographs
* Monograph 18/2012Performance of Flagship Programmes in Tamil NaduK. R. Shanmugam, Swarna S Vepa and Savita Bhat
* Monograph 19/2012State Finances of Tamil Nadu: Review and Projections A Study for the Fourth State Finance Commission of Tamil NaduD.K. Srivastava and K. R. Shanmugam
* Monograph 20/2012Globalization and India's Fiscal Federalism Finance Commission's Adaptation to New ChallengesBaldev Raj Nayar
* Monograph 21/2012On the Relevance of the Wholesale Price Index as a Measure of Inflation in IndiaD.K. Srivastava and K. R. Shanmugam
* Monograph 22/2012A Macro-Fiscal Modeling Framework for forecasting and Policy SimulationsD.K. Srivastava, K. R. Shanmugam and C.Bhujanga Rao
* Monograph 23/2012Green Economy – Indian PerspectiveK.S. Kavikumar, Ramprasad Sengupta, Maria Saleth, K.R.Ashok and R.Balasubramanian
* Monograph 24/2013Estimation and Forecast of Wood Demand and Supply in TamilanduK.S. Kavi Kumar, Brinda Viswanathan and Zareena Begum I
* Monograph 25/2013Enumeration of Crafts Persons in IndiaBrinda Viswanathan
* Monograph 26/2013Medical Tourism in India: Progress, Opportunities and ChallengesK.R.Shanmugam
* Monograph 27/2014Appraisal of Priority Sector Lending by Commercial Banks in IndiaC. Bhujanga Rao
* Monograph 28/2014Fiscal Instruments for Climate Friendly Industrial Development in Tamil NaduD.K. Srivastava, K.R. Shanmugam, K.S. Kavi Kumar and Madhuri Saripalle
* Monograph 29/2014Prevalence of Undernutrition and Evidence on Interventions: Challenges for IndiaBrinda Viswanathan.
* Monograph 30/2014Counting The Poor: Measurement And Other IssuesC. Rangarajan and S. Mahendra Dev

MSE Working Papers
Recent Issues
* Working Paper 89/2014Testing the Expectations Trap Hypothesis: A Time-Varying Parameter ApproachNaveen Srinivasan
* Working Paper 90/2014Analyzing the Pathway to Improve Tiger Conservation in India Zareena Begum. I and Amanat K. Gill
* Working Paper 91/2014A New Approach to Construct Core InflationSartaj Rasool Rather, S. Raja Sethu Durai and M. Ramachandran
* Working Paper 92/2014Energy Use Patterns And Firm Performance: Evidence From Indian IndustriesSantosh Kumar Sahu
* Working Paper 93/2014Women's Malnutrition In India: The Role Of Economic And Social StatusShikha Dahiya and Brinda Viswanathan
* Working Paper 94/2014Asymmetric Price Adjustment - Evidence For IndiaSartaj Rasool Rather, S. Raja Sethu Durai and M. Ramachandran
* Working Paper 95/2014Volatility Spillover Between Oil And Stock Market ReturnsB. Anand , Sunil Paul and M. Ramachandran
* Working Paper 96/2015A Dynamic Economic Model of Soil Conservation Involving Genetically Modified CropAmrita Chatterjee
* Working Paper 97/2015Entrepreneurial Choice of Investment Capital For House-Based Industries: A Case Study in West BengalShrabani Mukherjee
* Working Paper 98/2015Technology Import, R & D Spillover And Export: A Study of Automobile Sector in IndiaSantosh K. Sahu and K. Narayanan
* Working Paper 99/2015Inflation Forecasting and the Distribution of Price ChangesSartaj Rasool Rather, Sunil Paul and S. Raja Sethu Durai
* Working papers are downloadable from MSE website http://www.mse.ac.in
$ Restricted circulation