Embed Size (px)
Citation preview
Working Paper 268September 2011
Zap It to Me: The Short-Term Impacts of a Mobile Cash Transfer Program
Abstract
Conditional and unconditional cash transfers have been effective in improving development outcomes in a variety of contexts, yet the costs of these programs to program recipients and implementing agencies are rarely discussed. The introduction of mobile money transfer systems in many developing countries offers new opportunities for a more cost-effective means of implementing cash transfer programs. This paper reports on the first randomized evaluation of a cash transfer program delivered via the mobile phone. In response to a devastating drought in Niger, households in targeted villages received monthly cash transfers as part of a social protection program. One-third of targeted villages received a monthly cash transfer via a mobile money transfer system (called zap), whereas one-third received manual cash transfers and the remaining one-third received manual cash transfers plus a mobile phone. We show that the zap delivery mechanism strongly reduced the variable distribution costs for the implementing agency, as well as program recipients’ costs of obtaining the cash transfer. The zap approach also resulted in additional benefits: households in zap villages used their cash transfer to purchase a more diverse set of goods, had higher diet diversity, depleted fewer assets and grew more types of crops, especially marginal cash crops grown by women. We posit that the potential mechanisms underlying these results are the lower costs and greater privacy of the receiving the cash transfer via the zap mechanism, as well as changes in intra-household decision-making. This suggests that m-transfers could be a cost-effective means of providing cash transfers for remote rural populations, especially those with limited road and financial infrastructure. However, research on the broader welfare effects in the short- and long-term is still needed.
JEL Codes: O1Keywords: Africa, cash transfers, intra-household bargaining, information technology, mobile money
www.cgdev.org
Jenny C. Aker, Rachid Boumnijel, Amanda McClelland, and Niall Tierney

Zap It to Me: The Short-Term Impacts of a Mobile Cash Transfer Program
Jenny C. Aker, Rachid Boumnijel, Amanda McClelland, and Niall Tierney
Jenny C. Aker, Department of Economics and The Fletcher School, Tufts University, 160 Packard Avenue, Medford, MA 02155; [email protected]. Rachid Boumnijel, Amanda McClelland, Niall Tierney, Concern Worldwide; [email protected]; [email protected]; [email protected]. We thank Concern Worldwide in Niger for their support in all stages of this project and would especially like to thank Adamou Hamadou and the data collection team in Niger. We greatly appreciate comments from Randall Akee, Steven Block, Alain de Janvry, Charles Kenny, Stephan Klasen, Alan Gelb, Christopher Ksoll, Jake Kendall, Julie Schaffner, Gabrielle Smith, Frank-Borge Wietzke and participants at seminars at the University of Gottingen. We are grateful for financial support from the European Commission, Irish Aid, Concern Worldwide, the Hitachi Center and Tufts University. All errors are our own.
CGD is grateful to it funders and board of directors for support of this work.
Jenny Aker et al. 2011. “Zap It to Me: The Short-Term Impacts of a Mobile Cash Transfer Program.” CGD Working Paper 268. Washington, D.C.: Center for Global Development. http://www.cgdev.org/content/publications/detail/1425470
Center for Global Development1800 Massachusetts Ave., NW
Washington, DC 20036
202.416.4000(f ) 202.416.4050
www.cgdev.org
The Center for Global Development is an independent, nonprofit policy research organization dedicated to reducing global poverty and inequality and to making globalization work for the poor. Use and dissemination of this Working Paper is encouraged; however, reproduced copies may not be used for commercial purposes. Further usage is permitted under the terms of the Creative Commons License.
The views expressed in CGD Working Papers are those of the authors and should not be attributed to the board of directors or funders of the Center for Global Development.

1
1. Introduction
Conditional and unconditional cash transfers have been an important component of
social protection policies in developing countries since the 1990s (World Bank 2006,
World Bank 2009, DFID 2011). While there is widespread evidence of the effectiveness
of such programs in improving development outcomes, the costs of such programs are
rarely discussed. Yet many cash transfer programs present logistical, operational and
security challenges, especially in countries with limited physical and financial
infrastructure, as they require carrying cash in small denominations from urban centers
to remote rural areas. These costs can affect the cost effectiveness of cash transfer
programs as compared with other types of interventions.
The introduction of mobile-phone based money transfer systems (m-transfers) in many
developing countries offers an alternative means of providing such cash transfers. By
allowing the money to be transferred via a mobile phone, such programs could
potentially reduce the costs to implementing agencies of providing cash transfers to
remote populations, especially in areas with few financial institutions. Furthermore, m-
transfer systems may also prove easier for cash transfer recipients to collect and use
their transfers, provided they have ready access to m-transfer service providers.1
Beyond the cost savings, the m-transfer system itself may lead to additional benefits for
program recipients. Research on the impact of m-transfer systems in Kenya and
Rwanda suggests that households increased their access to financial services
(Morawczynski and Pickens 2009, Mbiti and Weil 2011) and informal private transfers
between individuals (Blumenstock, Eagle and Fafchamps 2011, Jack and Suri 2011),
thereby allowing households to better manage shocks. Furthermore, the greater relative
privacy of the m-transfer approach could reduce sharing among households within the
village, thereby leaving more disposable income available for the household (Jakiela and
Ozier 2011).
We report the results of a randomized cash transfer program in Niger, where some
program recipients received a cash transfer via a m-transfer system (called Zap).
Overall, our results suggest that the technology strongly reduced the variable
1 Cost-saving measures may also cause a deterioration in program performance along other dimensions. For
example, the switch from cash currency to m-transfers might increase costs for recipients who cannot “cash
out” their m-transfer, access m-transfer agents or use the technology.

distribution costs to the implementing agency, as well as costs to the program recipients
in accessing their cash transfer. The m-transfer approach also resulted in additional
benefits for program recipients: households in zap villages spent the cash transfer on
more types of items, sold fewer non-durable assets, consumed more diverse foods and
cultivated more diverse crops as compared to those receiving a manual cash transfer.
These effects do not appear to be driven by baseline differences in household
characteristics, differential attrition or take-up, distribution of the mobile phone
handset or different impacts of the cash transfer delivery mechanism on prices effects.
Rather we posit that these effects are largely explained by the time savings for program
recipients, greater privacy of the zap transfer mechanism and a shift in women’s
influence within the household.
This paper is broadly related to a body of research on the impact of information
technology on a variety of development outcomes (Jensen 2007, Aker 2010) and m-
money in particular (Jack and Suri 2011, Blumenstock, Eagle and Fafchamps 2011, Mbiti
and Weil 2011). Yet unlike existing research in the field, this paper uses a unique
experimental design to distinguish the impact of m-transfers from the impact of the
mobile phone itself, and provides detailed cost information on each cash transfer
mechanism.
The rest of the paper proceeds as follows. Section II describes the situation in Niger and
m-transfer systems in general. Section III describes the research design. Section IV
describes the different datasets and estimation strategy. Section V outlines a
theoretical framework of the impact of mobile money on household well-being,
whereas Section VI provides estimates of the impact of the program. Section VII
addresses some of the potential mechanisms and Section VIII discusses alternative
explanations. Section IX provides a cost-benefit analysis of the zap intervention, and
Section X concludes.
2. Background
2.1. Drought and Food Crises in Niger
Niger, a landlocked country located in West Africa, is one of the poorest countries in the
world. With a per capita GNP of US$230 and an estimated 85 percent of the population
living on less than US$2 per day, Niger is one of the lowest-ranked countries on the
United Nations’ Human Development Index (UNDP 2010). As the country spans the
Saharan, Sahelian and Sudano-Sahelian agro-ecological zones, rainfall ranges from 200
millimeters (mm) per year in the northern regions to 800 mm in the south between May
and August. Precipitation varies substantially across the country both within and across
years (Nicholson, Some and Kone, 2000). Niger experienced six droughts between 1980
and 2005 (Government of Niger 2007).

A majority of households in Niger depend upon rainfed agriculture, with staple food
crops consisting of millet, sorghum and fonio, and cash crops including cowpeas,
peanuts, cotton and sesame. Inter-annual deviations in rainfall are positively associated
with fluctuations in agricultural output, as yields depend upon the timing and quantity
of rainfall.
Because of the correlation between rainfall and grain output, drought is positively
correlated with food crises and famine. An estimated one-third of the country’s
population died during the “great famine” of 1931, with approximately 250,000
drought-related human fatalities occurring in the Sahelian region between 1968-1974
and 1983-84. In 2005, an estimated 2.4 million Nigeriens were affected by severe food
shortages, with more than 800,000 of these classified as critically food insecure (FEWS
NET 2005). Niger also suffered from both drought and harvest failures in 2009/2010,
with 2.7 million people classified as vulnerable to extreme food insecurity (FEWS NET
2010). Rural households in Niger typically deal with such shocks by reduced
consumption, asset depletion, tree-cutting for firewood and charcoal sales and seasonal
migration.
2.2. Mobile Money
Mobile phone technology has reduced the costs of communicating information over
long distances in many parts of the developing world. This transformation has been
particularly dramatic in sub-Saharan Africa, where investments in other infrastructures
such as power, roads and landlines are limited. In Niger, there were 13 mobile phone
subscribers per 100 people in 2010, as compared to fewer than .2 landline for every 100
people. The road network is equally poor: Despite the fact that Niger is one of the
largest countries in Africa, the total road network was estimated to be 15,000 km as of
2005, of which only 8 percent were paved. There is less than 1 bank for every 100,000,
making it one of the most “unbanked” countries in sub-Saharan Africa (CGAP 2010).
Since 2005, a variety of m-transfer systems have emerged in 80 developing countries in
Africa, Asia and Latin America. These systems typically involve a set of applications that
facilitate a variety of financial transactions via mobile phone, including transmitting
airtime, paying bills and transferring money between individuals. Most m-transfer
systems allow the user to store value in an account accessible by the handset, convert
cash in and out of the stored value account, and transfer value between users by using a
set of text messages, menu commands, and personal identification numbers (PINs)
(Aker and Mbiti 2010). A “pseudo account” can be established by purchasing
“electronic money” (e-money) from an agent, usually a third party or someone who
works for the mobile phone operator or bank. The user can then send e-money to
another recipient with a phone, who then withdraws the e-money from their local
transfer agent. Fees are generally charged for each transaction.

The first m-transfer system in Niger was introduced in January 2010. Known as Zap, the
product was developed by the primary mobile phone service provider (Zain, now Bhartia
Airtel) in multiple countries. Initial coverage, usage and growth of Zap was limited in
2010 and geographically focused in the capital city (Niamey) and regional capitals. The
cost of making a $USD45 transfer using Zap cost $1.50 during this period.2
3. Research Design
In 2010, an international non-governmental organization, Concern Worldwide,
developed a humanitarian program in response to the 2009/2010 Niger drought and
food crisis. In an attempt to prevent asset depletion and reduce malnutrition among
drought-affected households, the program provided unconditional cash transfers to
approximately 10,000 households during the “hungry season”, the five-month period
before the harvest and typically the time of increased malnutrition. Program recipients
were to receive an average of 22,000 CFA ($USD 45) per month for five months, for a
total of $USD 215. In an effort to facilitate the disbursement of cash in remote areas,
Concern decided to implement a pilot study across 116 villages in 6 communes of the
Tahoua region.
3.1. Cash Transfer Interventions
Three interventions were ultimately chosen for the pilot program. The reference was
the standard manual cash intervention, whereby beneficiary households received
unconditional cash transfers of 22,000 CFA per month (approximately $US45).3 The
total value of the transfer over the five-month period was approximately 2/3 of the total
annual GDP per capita. Payments were made on a monthly basis, whereby cash was
counted into envelopes and transported via armored vehicles to individual recipients.
Rather than distributing the cash in each village, a central village location was chosen for
groups of 4-5 villages. Program recipients had to travel to their designated location on a
given day to receive the cash transfer.4
2To make a transfer between $20-$40 cost $1.50; to transfer more than $USD40 cost $3 per transfer.
3While the program encouraged program recipients to attend health centers, this was not a condition for
receiving the actual transfer. Thus, the program was a de facto unconditional cash transfer program.
4Program recipients in cash and placebo villages were informed of the date and location of their cash
transfer via a phone call a few days’ prior to the transfer. While Concern tried to ensure that the cash
distribution points were as close as possible to each village, it was not possible to have a distribution point
in every village.

The two additional interventions were variants of the basic intervention, one of which
was aimed at reducing the costs of distributing cash to remote, sparsely-populated and
in some cases insecure rural areas. Program recipients in the second group (zap)
received their cash transfer via the mobile phone. After receiving the electronic
transfer, recipients had to take the mobile phone to an m-transfer agent located in their
village, a nearby village or a nearby market to obtain their physical cash. As less than 30
percent of households in the region owned mobile phones prior to the program,
Concern also provided program recipients with mobile phones, as well as the Zap
account, and paid for the transfer charges. The second intervention thereby differs
from the manual cash intervention with respect to the transfer delivery mechanism, as
well as the provision of the handset and the m-transfer technology.5
In an effort to disentangle the impact of the change in delivery mechanism from that of
receiving a mobile phone, the third group (placebo) mirrored the manual cash
intervention, but also provided a mobile phone. Like the manual cash group, program
recipients received $US45 in physical cash on a monthly basis and had to travel to a
meeting point to receive their cash. However, like the zap group, program recipients
also received a mobile phone (which was “Zap” enabled), yet did not receive their
transfer via the mobile phone.
Comparing the placebo and cash groups should allow us to disentangle the additional
effect of having a mobile phone. Comparing the zap and placebo groups should allow us
to detect the additional effect of m-transfer delivery mechanism (as compared with the
manual cash delivery), since both groups were provided with mobile phones. However,
these comparisons rely upon the assumption that the treatment effects are additive,
which not be valid in this context.
3.2. Experimental Design
Prior to the introduction of the program, Concern Worldwide identified 116 “food
deficit” villages in the Tahoua region, those classified by the Government of Niger as
5 While Zap was introduced into Niger in January 2010, there were a limited number of zap agents in rural
areas. Consequently, Concern Worldwide worked with Zain (now Bhartia Airtel) to ensure that Zap agents
were registered within the program area. Agents were either registered in the village, in neighboring
villages or in nearby markets. On the day of the cash transfer, program recipients would receive a special
“beep” on their mobile phone, informing them that the transfer had arrived. The program recipient could
then travel to a local agent (at her discretion) and show the value on the phone. The m-transfer agent
would then remove the value of the cash transfer and “cash out”, paying the value of the cash transfer to
the program recipient
having produced less than 50 percent of their consumption needs during the 2009
harvest. Of these, some villages were prioritized for the zap intervention based upon
their population size and proximity to skirmishes near the Niger-Mali border, thereby
reducing the sample size to 96 villages. The remaining eligible villages were randomly
assigned between the basic (manual cash), placebo and zap interventions. In all, 32
villages were assigned to the cash group, 32 to the placebo group and 32 to the zap
group. A map of the project areas is provided in Figure 1.
An ideal evaluation would have also included a pure comparison (non-cash) group, plus
a group with access to mobile phones and m-money (but no cash). Due to the
humanitarian nature of the intervention and the political situation at the time of the
crisis, there was no pure comparison (non-cash) group. Hence, while we can estimate
the causal effect of the zap and placebo interventions as compared to the manual cash
intervention, we cannot estimate the causal impact of the cash transfer program in this
context. Yet a substantial body of empirical evidence documents the impact of
conditional and unconditional cash transfer programs in a variety of emergency and
development contexts (World Bank 2009, Baird, McIntosh and Ozler 2011, DFID 2011).
Within each food deficit village, household-level eligibility was determined by two
primary criteria: 1) the level of household poverty (determined during a village-level
vulnerability exercise); and 2) whether the household had at least one child under five.
The number of recipient households per village ranged from 20 to 75 percent of the
village population. In all villages, the cash transfer was provided to the woman. The
study timeline is presented in Figure 2.
4. Data and Estimation Strategy
4.1. Data
The data come from two primary sources. First, a comprehensive household survey of
more than 1,200 program recipients was conducted in all 96 villages. The baseline
survey was conducted in April 2010, with a follow-up survey in December 2010. The
research team located over 98 percent of households for the follow-up survey. Both the
attrition rates and the distribution of attriting households’ characteristics were similar
across the treatment groups (Table A1).
The household survey collected detailed information on household food security,
demographics, asset ownership, agricultural production and sales, mobile phone
ownership and usage, uses of the cash transfer and village and household-level shocks.
As the surveys were conducted during a humanitarian crisis and over a short time
frame, the research team was mindful of the time burden on respondents. As a result,
the household surveys did not include a detailed income and expenditure module. We

use the household-level data to measure the impact of the cash delivery mechanism on
a subset of development outcomes and behaviors, using proxy income measures.
The second dataset includes is weekly agricultural price information from over forty-five
markets for a variety of goods between May 2010 and January 2011, as well as the date
of each cash transfer in each village. We use these data to test for different effects of
the cash transfer delivery mechanism (zap or manual cash) on local market prices, as
these price effects could directly and indirectly affect household welfare.
4.2. Pre-Program Balance of Program Recipients
Table 1 suggests that the randomization was successful in creating comparable groups
along observable dimensions. Differences in pre-program household characteristics are
small and insignificant. Average household size was nine, and a majority of respondents
were members of the Hausa ethnic group. Less than 15 percent of households had any
form of education, and 72 percent of households were in monogamous marriages. Less
than thirty percent of households owned a mobile phone prior to the start of the
program, yet 63 percent of respondents had used a mobile phone in the few months
prior to the baseline.
Table 2 provides further evidence of the comparability of the different interventions for
key outcomes, namely food security, agricultural production, migration and coping
strategies. Over 90 percent of households relied upon agriculture as a primary income
source, and approximately 50 percent had at least one seasonal migrant in the past
year. A strong majority (97 percent) of households had experienced drought, and
household diet diversity was 3 (out of 12 categories of foods).6
4.3. Estimation Strategy
To estimate the impact of the zap program on a variety of outcomes, we first use a
simple reduced form regression specification comparing outcomes in the post period.
This takes the following form:
(1) Yiv = 0 + 1zapv + 2placebov + X’iv0 + R + iv
6Overall, we made over 75 comparisons and find 10 variables that are statistically significant at the 10
percent level, 4 that are statistically significant at the 5 percent level and 1 at the 1 percent level. These
results are in-line with what we would expect from random assignment (Barrera-Osorio, Bertrand, Linden,
and Perez-Calle, 2011).

The variable Yiv represents the outcome of interest (food security, coping strategy,
assets, agricultural production and sales) of individual or household i in village v. zapv is
an indicator variable for whether the village participated in the m-transfer program,
whereas placebov is an indicator variable for whether the village was in the placebo
group. R are geographic fixed effects at the commune level. To improve precision, we
include a vector of household baseline covariates, X’iv0, such as ethnicity, marital status
and household size. The error term consists of iv, which captures unobserved individual
or household characteristics or idiosyncratic shocks. We cluster the error term at the
village level. The coefficients of interest are 1 and 2, which capture the average impact
of the two treatments as compared to the basic cash intervention. We also test
whether these coefficients are equal.7
While a simple differences specification will tell us the magnitude of the difference
among the three interventions in the post period, we also use a difference-in-
differences approach as a robustness check.
5. Theoretical Framework
The m-transfer system, as compared with the manual cash transfer, could potentially
impact household outcomes through six primary mechanisms. First, by altering the
costs involved in obtaining the transfer, the zap program could affect the time use of
program recipients. If the m-transfer mechanism reduced program recipients’ transport
and opportunity costs involved in obtaining the transfer, then this would reduce lost
income to zap program recipients. If, however, the new technology made it more
difficult for program recipients to access their cash – either due to the limited number
of m-transfer agents or difficulty in using the technology – this could have increased
costs for the zap households and reduced participants’ ability to access the cash
transfer.
Second, as households in zap villages did not have to travel to a pre-arranged location –
but could “cash out” from any m-transfer agent – households could have changed the
location and timing of their cash transfer expenditures. For example, zap households
could have been more likely to make purchases within the village rather than in an
7Two villages that were originally assigned to one intervention received a different intervention, due to
management oversight. Nevertheless, villages were classified by their initial intervention, so the estimated
program effect is the impact of being offered the treatment (intention to treat) not the impact of the
treatment itself. Most results are robust to measuring the impact of the treatment itself.

external market, thereby allowing women greater freedom to spend the cash transfer
themselves.
Third, since m-transfers reduce the observability of the amount and timing of the cash
transfer, this could have affected inter-household sharing of the cash transfer, thereby
leaving more income available for the household (Jakiela and Ozier 2011). This could
have also implicitly and explicitly signaled that the transfer belonged to the woman
within the household, thereby increasing women’s bargaining power, changing intra-
household decision-making and the allocation of resources (Doepke and Tertilt 2011).
Fourth, access to the m-transfer technology could have increased households’
familiarity with financial transfer services and access to informal private transfers. This
could have facilitated households’ ability to send or receive transfers outside of the
village, conditional on the availability of the m-transfer service for both parties.
Improved access to such transfer mechanisms could thereby help households to better
cope with risks and shocks, potentially affecting investment or consumption decisions
(Blumenstock, Eagle and Fafchamps 2011, Jack and Suri 2011).
Finally, since the zap program was new and involved a training on how to use the
technology, program recipients could have simply been better informed about the
program, including the time, date and frequency of the cash transfers. This could have
enabled households to more efficiently plan their use of the cash transfer throughout
the duration of the program.
Whichever of these channels is most important, it is important to note that the impacts
outlined in this paper are only for the short-term, ie, immediately after the program.
Some of these effects imply behavioral changes that might only be observed several
years after the program or are difficult to test using survey data. Nevertheless, we
attempt to provide insights into the mechanisms at work in Section 7.
6. Results
6.1. Did the Zap Intervention Reduce Distribution and Recipients’
Costs?
A key motivation for using the zap approach in Niger was to reduce the costs of the
implementing agency in providing the cash transfer, as well as those of program
recipients in obtaining the cash transfer. Figures 3 and 4 show the relative costs to each
party.
Figure 3 shows the per-recipient cost of each transfer mechanism for Concern
Worldwide, including fixed and variable costs. The primary initial investment costs of

the program included expenses for identifying program recipients, purchasing mobile
phones and training recipients in using the mobile phones, the latter of which were only
for the zap intervention. Variable costs for the manual cash distributions included
transport and security costs, as well as costs associated with organizing the cash into
individual envelopes. The average per recipient cost was US$12.76 in cash/placebo
villages and US$13.65 in zap villages, or $.90USD more per recipient. Excluding the cost
of the mobile phones, the per-recipient cost of the zap intervention falls to $8.80 per
recipient. Thus, while the initial costs of the zap program were significantly higher,
variable costs were 30 percent higher in the manual cash distribution villages. 8
Figure 4 shows the recipients’ transport and opportunity costs related to obtaining the
cash transfer. As both the placebo and manual cash groups received the cash transfer
via the same mechanism, we pool the two groups and compare means between the zap
and cash/placebo villages. Overall, program participants in zap villages incurred
significantly fewer costs for obtaining the cash transfer. Whereas cash and placebo
program recipients travelled an average of 4.04 km roundtrip to obtain the transfer, zap
program recipients only travelled .9 km to “cash out” at the nearest agent, with a
statistically significant difference at the 1 percent level. This is equivalent to an
opportunity cost savings of 30 minutes for each cash transfer, or 2.5 hours over the
entire program. Based upon an average daily agricultural wage of USD $3.60, this time
savings would translate into USD $.92 over the cash transfer period. This is equivalent to
2.5-3 kilograms of millet, enough to feed a family of five for one day.
6.2. How did Program Recipients Use the Cash Transfer?
The uses of the cash transfer that the cash transfer recipients reported might be
instructive about the kinds of effects of different cash transfer delivery mechanisms that
we might expect. As Concern Worldwide did not stipulate that the cash transfer be
used for a specific purpose, nor was it conditional on a particular behavior, recipients
were free to spend the cash transfer how they wished. Overall households in the
manual cash villages used their transfer to purchase 4.12 different categories of goods,
including staple grains (99%), cowpeas (42%), meat (40%), oil (70%), condiments (70%),
health expenses (28%), seeds (20%), school fees (7%), reimbursing debts (7.4%) and
labor costs (2%). (Respondents could list more than one use of the cash transfer, so the
total can exceed 100%.) This suggests that cash transfer recipients primarily used the
transfer to ensure immediate consumption needs, but also to make limited agricultural
8This includes amortized fixed costs for the mobile phones over the program period. If the program had
been extended to 12 months, the per-recipient costs would be relatively equal.

investments and avoid longer-taking children out of school and becoming further
indebted.
Table 3 shows the different uses of the cash transfer by intervention group. Overall,
the results paint a picture of more diverse uses of the cash transfer by zap households.
Households in zap villages purchased .86 more types of food and non-food items as
compared with both the cash and placebo groups, with a statistically significant
difference between each pair. Program participants in the zap group were 20
percentage points more likely to purchase non-staple grains (such as rice and corn), 9
percentage points more likely to purchase cowpea and 13-16 percentage points more
likely to purchase meat, condiments and oil as compared with those in the cash and
placebo groups (Panel A).
Table 3 (Panel B) shows that the uses of the cash transfer for non-food items, namely
school fees, health expenses and clothing. While relatively fewer households used the
transfer for these uses, there was no difference between the zap, placebo and cash
groups in using the cash transfer for these purposes. Thus, while the zap program led to
more diverse food purchases, especially those associated with a more diverse diet, it did
not lead to different health or education expenditures in changes.
6.3. Did the Zap Intervention Affect Household Coping Strategies and
Food Security?
Table 4 presents the results from a regression of Equation (1) for a variety of food
security indicators and commonly-used coping strategies in Niger, including asset
decapitalization. The household diet diversity score and asset data were collected in
December 2010, three months after the end of the program, whereas the coping
strategy data were recall data from the hungry period. Therefore, these results point to
a (short-term) persistent impact of the program.
The results in Table 4 are broadly correlated with the different uses of the cash transfer
by intervention group observed in Table 3. Household diet diversity is .16 points higher
in the zap villages as compared with the cash and placebo villages, although there is only
a statistically significant difference between the zap and placebo groups (Panel A).
When assessing the impact on specific food groups, there was no impact of the program
on the consumption of staple foods, namely grains and cowpeas. However, households
in zap villages were 4-5 percentage points more likely to consume fruits -- and 6-12
percentage points more likely to consume fats than households in cash and placebo
villages, a 28-percent increase. While the impact on fat consumption is primarily driven
by differences between the zap and placebo groups, there is a marginal (statistical)
difference between the zap and cash groups.

Panel B assesses the impact of the zap program on the use of particular coping
strategies, particularly those longer-term impacts. The dependent variables in these
regressions include a variety of common coping strategies in the Sahel, such as selling
seeds and land, cutting trees, searching for anthills and reducing the number of meals
per day. Neither selling seeds nor land were commonly used coping strategies among
households in these villages. While households in zap villages used these coping
strategies less frequently than those in the cash and placebo groups, these differences
are not statistically significant at conventional levels. Therefore, it does not appear as if
the m-transfer program affected the use of these coping strategies.
Panel C assesses the impact of the program on asset decapitalization, as asset
accumulation would not have been expected during the program. Overall, households
in zap villages had .45-.66 more asset categories as compared with those in the cash and
placebo groups, 25 percent higher than those in the cash group. These differences are
primarily due to increased mobile phone ownership in the zap and placebo groups.
Excluding the mobile phone, the program did not have an impact upon durable asset
ownership (carts, plows, bikes and mopeds), as there is no statistically significant
difference between the zap, placebo and manual cash groups. However, there was an
impact upon non-durable assets: Excluding mobile phone ownership, households in zap
villages had .15-.24 more non-durable assets (lamps and flashlights) as compared with
the placebo or cash groups. This represents an eleven percent increase, suggesting that
zap households were selling non-durable assets less frequently than those in placebo or
cash villages.
6.4. Did the Zap Intervention affect Agricultural Investment and
Production?
Table 5 presents the results of regressions of Equation (1) for a variety of agricultural
outcomes. Unsurprisingly, the zap program did not have an impact upon the likelihood
of cultivating or land ownership. However, the program did affect crop choices:
Households in zap villages grew .36-.49 more types of crops than those in the placebo
and manual cash villages, a 12-16 percent increase as compared with the cash
intervention (Panel A). These differences are statistically significant at the 5 and 10
percent levels, respectively. These effects are not driven by changes in the likelihood of
growing traditional staple food and cash crops, such as millet, sorghum, cowpeas and
peanuts. Rather, they were due to the cultivation of marginal cash crops: zap
households were 13 percentage points more likely to grow vouandzou and okra, two
cash crops that are primarily grown by women on marginal lands in Niger.9 These
9In fact, vouandzou in Hausa is known as “gojiya mata”, literally translated as the “women’s peanut”.

effects appear to be primarily driven by the zap program, as the differences are
statistically significant as compared with manual cash and placebo groups. As detailed
plot-level data are not available, we do not know whether these crops were grown on
new or existing land.
The changes in crop choice did not translate into different production levels or
marketing strategies across the three groups (Panel B) . There were no differences
across the different interventions in the quantity of grains or cash crops produced, or
the likelihood of selling those crops after the harvest or the quantity sold immediately
after the harvest.
7. Potential Mechanisms
7.1. Did the Zap Intervention Change Awareness, Location and
Timing of Expenditures?
Table 6 provides some evidence of the location, timing and uses of the cash transfer.
For example, the lower costs related to accessing cash via the zap distribution
mechanism could have changed the purchase patterns of program recipients, allowing
them to purchase goods closer to home. Or, the anonymity of the cash transfer via the
m-transfer system could have enabled recipient households to better spread their
expenses over multiple periods. Alternatively, the “innovation” of the m-transfer
technology could have increased program recipients’ awareness of the cash transfer
program, thereby reducing uncertainty about the cash transfer and allowing households
to more optimally allocate expenses across different months. Finally, as transfers via the
m-transfer system were more difficult for outsiders to observe, this could have allowed
program recipients to spend the cash transfers themselves, rather than providing it to
their spouses. This last mechanism is less likely, however, as socio-cultural norms make
it difficult for women between the ages of 20-45 to travel to markets individually or in
groups.
Overall, the data do not allow us to conclude that the program impact is driven by one
of these mechanisms. Forty-three percent of recipients in the cash villages spent their
transfer at a kiosk within the village, whereas sixty-one percent spent the cash transfer
at a market outside of the village. While this percentage was higher in zap villages, there
is not a statistically significant difference (Panel A). Only 25 percent of cash and placebo
program participants could correctly cite the total amount or duration of the cash
transfer prior to the program, with no statistically significant difference between the zap
and cash/placebo treatments (Panel B). Over 50 percent of manual cash households
spent their transfer all at once, without a statistically significant difference between zap,
placebo and cash villages (Panel C). In addition, there were no effects of the zap
program on sharing norms across the three treatment groups. Overall, this suggests
that the zap intervention did not change where or when program recipients’ spent the
cash transfer, whether they shared the cash transfer or their overall awareness of the
program.
7.2. Did the Zap System Increase Households’ Access to Private
Transfers?
By having access to the m-transfer (zap) technology, program recipients in zap villages
could have received informal private transfers from migrants and other family members
more easily, thereby augmenting the income increase derived from the transfer. Table
7 shows the results of regressions for a variety of indicators related to private money
transfers (person-to-person). While households in both zap and placebo villages were
more likely to receive remittances (due to higher rates of migration), this did not affect
the frequency or amount of remittances transferred to the household during this
period. Moreover, households in all villages primarily received remittances via Western
Union (34 percent) or friends (53 percent), with less than 5 percent of households
receiving remittances via the m-transfer technology. This is supported by data on the
percentage of program recipients who used zap to make money transfers – very few
used the m-transfer technology, and there were no statistically significant differences
between the three groups. This provides evidence that the results are not driven, at
least in the short-term, by the impact of the m-transfer technology on private transfers.
7.3. Did the Zap Intervention Change Intra-Household Decision-
Making?
Table 8 provides suggestive evidence of intra-household decision-making with respect
to the cash transfer.10 The program was implemented an area of Niger where socio-
cultural norms do not permit younger, married women belonging to the Hausa ethnic
group to travel to markets, either individually or in groups. This is in contrast to cultural
norms in the Fulani and Toureg groups, where women often travel to markets to sell
dairy products and purchase food items. For this reason, we would not expect to find
strong average effects of the program on women’s control over the cash transfer, but
might find heterogeneous effects across different ethnic groups.
10 In order to formally test for differences in intra-household bargaining, we would ideally want to test
outcomes across each of the three interventions between households with male and female program
recipients. As all program recipients were women, we are unable to do this, and thus can only compare
proxy indicators for intra-household decision-making across the three interventions, conditional on the
program recipient being a woman.

Program recipients (women) reported that they were responsible for spending the cash
transfer in over 53 percent of household. Among the remaining households, the cash
transfer was primarily spent by the program recipients’ husband or son (Panel A). Yet
almost all recipients (99 percent) stated that they were consulted on the use of the cash
transfer. A slightly higher percentage stated that they were involved in the zap and
placebo groups, with a statistically significant difference between the zap and placebo
group. However, the magnitude of this impact is small.
In light of the difficulty in observing intra-household bargaining, Panels B and C attempt
to separate out these effects by ethnic group, which have different intra-household
roles and responsibilities. Panel B shows the results for the Fulani and Toureg ethnic
groups (17 percent of recipients), whereas Panel C shows the results for the Hausa
ethnic group (83 percent of recipients).
Zap program recipients in Fulani and Toureg households were 10 percentage points
more likely to be responsible for spending the cash transfer as compared with the
manual cash group, and 4 percentage points more likely than households in the placebo
groups. Given the small sample size, it is difficult o detect a statistically significant effect,
although the magnitude of the coefficient is larger than the coefficients for the Hausa
ethnic group. When looking at the uses of the cash transfer for education and health
expenses, Fulani and Touareg zap recipients were 17 percentage points more likely to
use the transfer to pay for health fees, as compared with 1 percentage in Hausa zap
recipients. There are no strong differences for school fees or spending in markets
outside of the village, although on average a higher percentage of Fulani and Touareg
households spent the transfer outside of the village.
These results, taken together with more diverse uses of the cash transfer, greater diet
diversity and increased cultivation of women’s cash crops, provide some suggestive
evidence that the zap mechanism could have changed intra-household decision-making,
thereby allowing women to have greater control over the spending of the cash transfer
and engage in consumption and production decisions. Nevertheless, these results are
suggestive at best, and more research is needed.
7.4. Did the Zap Program Change Mobile Phone Usage?
Beyond the mechanisms identified above, it is possible that the zap program could have
changed zap households’ access to information via the mobile phone, thereby affecting
agricultural practices and diet diversity. Furthermore, even if the zap program did not
affect households’ likelihood of sending or receiving private transfers via the mobile
phone, the handset could have facilitated communications with migrants and their
ability to request remittances via other channels.

Table 9 shows the impact of the program on mobile phone ownership and usage for
each type of intervention. Unsurprisingly, the zap program increased mobile phone
ownership and the frequency of usage since the last harvest, with a statistically
significant difference between the zap and cash villages, as well as between the zap and
placebo villages. While respondents in zap villages were more likely to make calls or
send and receive beeps as compared to placebo and cash villages, there was not a
statistically significant difference in their probability of receiving a call, writing or
receiving SMS or transferring money via the m-transfer system (Panel A). Overall,
households in zap villages were more likely to communicate with friends and family
members within Niger and to communicate a shock, but there is not a statistically
significant difference between the zap and placebo groups. Taken together, these
results suggest that households in zap villages used the phone in more active ways as
compared to those in the placebo and cash groups. Nevertheless, there were no
differences in the reasons for communicating via mobile phone. This seemingly
contradictory result suggests that recipients in zap households viewed the mobile phone
as their personal property (as evidenced by greater usage), rather than a household
resource.
8. Alternative Explanations
There are several threats to the validity of the above findings. First, the zap intervention
could have resulted in differential uptake of the program, thereby affecting the
intention to treat estimates. For example, if zap households had more difficulty in
finding m-transfer agents or using the technology, they might have been less likely to
access the cash transfer. Or, if households in zap villages were more motivated to stay
in the program because of the presence of the new technology, then there could have
been differential attrition across the three groups. A means comparison of the three
groups for each of these outcomes shows that there are no differential effects in
attrition, the probability of receiving the cash transfer or shocks across groups (Table
A1).
The previous results thus far have tested for the impact of the zap intervention on
specific development outcomes. In Figure 4 and Tables 3-5, we examine the impact of
the zap program on 35 different outcomes, both with and without controls. This raises
concerns that the observed effects cannot be attributed to the zap intervention, but are
rather simply observed by chance among all of the different outcomes. Following
Gibson, McKenzie and Stillman (2010), we use the Bonferroni correction for multiple
testing. Using a family-wise error rate of 10 percent, and assuming that all 35 outcomes
are one family, the Bonferroni p-value would therefore be .0029. The outcomes that
are significant at this level are the cost of obtaining the cash transfer, the different uses
of the cash transfer (number of food and non-food items, other grains, condiments and

oil), the impact on non-durable assets and likelihood of growing vouandzou and okra.
Thus, we are confident that the zap intervention affected recipients’ cost in obtaining
the cash transfer, as well as their recipients’ use of the transfer and sales of non-durable
assets. Perhaps more surprisingly, we find that the likelihood of producing marginal
cash crop remains. Yet none of the food security or crop diversity outcomes are
significant when correcting for multiple testing.
A final alternative explanation to the interpretation of the above findings is the potential
differential effects of the cash transfer mechanism on prices. For example, if the
manual cash transfer mechanism put greater inflationary pressure on local markets as
compared with the zap transfer mechanism, this could reduce the value of the cash
transfer in those villages and decrease the number of goods purchased or consumed.
Or, if the zap transfer increased prices more quickly and producers were price elastic,
this could have increased incentives for households to cultivate certain crops.11
Since the intervention occurred at the village level, village-level price data would be
optimal for investigating these impacts (Cunha, Di Giorgi and Jayachandran 2010). Yet a
majority of purchases in rural Niger and among program recipients take place in weekly
markets – many of which are located 5-10 km from the village – weekly market price
data were collected. The randomized nature of the program implies that some markets
were linked to both manual cash and zap villages, thereby making it difficult to
differentiate the impact of each and necessarily ensuring that the stable unit treatment
value assumption is violated.
Despite the data limitations, our analysis treats each market as a local economy and
examines food prices as the outcome. Using weekly price data between May and
December 2010 from over 45 markets in the region, we estimate the impact of the cash
transfer delivery mechanism on weekly prices by using the following regression:
(2) ln(pij,t) = α + β1zapj,t + β2cashj,t + φln(pij,t-1) + θt + θj + εij,t
where ln(pij,t) is the log price of agricultural good i in market j at week t, zapj,t is an
indicator variable equal to one if a village within a 10 km-radius of the market received a
transfer via zap during week t, 0 otherwise; cashj,t is an indicator variable equal to one if
a village within a 10-km radius of the market received a manual cash transfer during
week t, 0 otherwise; ln(pij,t-1) is the lagged price of agricultural commodity i; θt is a time
trend, either monthly or weekly, and θj are market-level fixed effects, which will capture
11 For a discussion of the potential impact of mobile money on the velocity of money and inflation, see Jack,
Suri and Townsend (2010).

characteristics such as market size, road quality and infrastructure. Ideally, the
specification should also include the percentage of households in the village receiving
the cash transfer, as we would expect larger income effects in villages with a higher
density of cash transfers. As the market-level fixed effects are correlated with the
lagged dependent variable, we use the Arellano-Bond estimator to derive consistent
estimates.
Table 10 presents the results of these regressions, first pooling for any cash transfer and
then by the type of cash transfer delivery mechanism (zap or manual cash). Overall, the
presence of a cash transfer in a particular market area during the week did not have a
statistically significant impact upon food prices (Column 2). Thus, we fail to reject that
the cash transfer increased prices as compared with normal trends.
Columns (3) and (4) disentangle the impact of the program by the cash transfer delivery
mechanism. While the results are qualitatively similar to those in Column 1, this
suggests that the zap mechanism had a stronger impact upon millet and rice prices as
compared to the manual cash transfer mechanism. A zap transfer in a neighboring
village during a particular week increased millet prices (per 100-kg bags) by 1 percent
and rice prices (per kg) by 2-3 percent as compared with no cash transfer for the week.
The impact on certain quantities of grains is unsurprising, as households would
traditionally use the transfer to purchase bags of millet and smaller quantities of rice.
Alternatively, the manual cash transfer mechanism increased cowpea prices by 7
percent as compared with no cash transfer. Nevertheless, there is only a statistically
significant difference between the two types of cash transfer mechanisms for cowpeas.
These effects have ambiguous welfare implications. As all households were net
consumers of grains during this period, an increase in millet and rice prices would have
reduced consumer welfare for households living near those markets affected by the zap
transfer. While this could potentially increase incentives to produce rice and millet, this
is extremely unlikely, as rice is not produced in this zone, producers are highly price
inelastic and there was no evidence of an increase in the cultivation or sale of millet.
Similarly, while the increase in cowpea prices in cash villages could have decreased
welfare in villages near those markets, this represents a small percentage of the
consumption basket as compared with staple grains. The price effect could have
induced producers to grow and sell more cowpea during the following agricultural
season. There is some evidence of this, as producers in placebo villages grew more
cowpea, were more likely to sell cowpeas and increased the quantity sold. However,
these price increases would have increased welfare for program recipients in manual
cash and placebo villages.
Taken together, the price effects suggest that the previous results are a lower bound for
the impacts of the zap intervention on recipient households. At the same time, these

larger price effects could have had adverse effects on consumption of non-recipients
living in the village and region, as it increased millet prices by 200 CFA per 100-kg bag
during this time period, equivalent to 1 kg of millet. This highlights the importance of
conducting full welfare analyses in any impact evaluation, and suggests that price
effects should be monitored closely in future manual cash and m-transfer programs.
9. Cost-Benefit Analysis of the Zap Intervention
A natural question related to the use of a new approach is whether the expected
benefits outweigh the additional costs. This is especially the case in a country such as
Niger, where, despite widespread growth in mobile phone coverage over the past
decade, m-transfer systems are still relatively new. Thus, using an m-transfer system to
distribute cash transfers can require significant up-front investments for governmental
and non-governmental organizations, including ensuring access to the mobile phone
handset and m-transfer technology. It also implies that a network of m-transfer agents
already exists in the distribution areas, thereby requiring partnerships with mobile
phone operators. In this section, we explore whether a m-transfer program should be a
priority for governmental and non-governmental institutions for cash transfer programs.
A full cost-benefit analysis of the zap program would require estimates of both the
social and private returns to the cash transfer program. As we do not have information
on household income and expenditure patterns, we instead focus on the monetary
value of a narrow range of benefits. In addition, a proper cost-benefit analysis would
use a causal estimate of the impact of the cash transfer program. As we do not have a
pure comparison group, we are unable to do this, but we can still calculate whether the
additional gains due to the zap intervention are worth the additional costs.12
As outlined in the Figure 3, the average per recipient cost over the life of the project was
US$12.76 in cash/placebo villages and US$13.65 in zap villages, or $.90USD more. While
there was a range of benefits from the zap intervention, we focus on two for the cost-
12Dhaliwal, Duflo, Glennerster and Tulloch (2011) outline the relative advantages and
disadvantages of cost benefit and cost effectiveness analyses. While the cost effectiveness analysis
(showing the program effect on one outcome measure) is preferred in many contexts, we use a cost benefit
analysis for several reasons. First, as the program was an unconditional cash transfer, it had effects on
multiple outcomes, which are difficult to capture in one indicator. Second, as m-transfers were new in
Niger and in the program region, the program required significant initial investments (including purchase
mobile phones), which would not be required in contexts where m-transfer services have been in existence
for several years.

benefit analysis: the monetary value of the reduced opportunity costs of program
recipients’ time (a value of $USD .91) and the increased cultivation of cash crops. Using
average household okra production and the market price for okra during the program
period, the average value of this okra production in zap households would have been
$USD5. This suggests that the cost-benefit ratio is greater than one, meaning that the
additional costs of the zap intervention yielded an equivalent or higher monetary
benefit for zap program recipients. If the program yields benefits in the longer-term,
perhaps by allowing households to send and receive more informal transfers or access
formal financial services, this could potentially yield a higher rate of return.
10. Conclusion
Cash transfer programs are an important part of the social protection policies in many
developing countries. While there is significant evidence on the impact of such
programs on improving specific outcomes, there is more limited evidence on their
impact in humanitarian contexts, as well as their cost-effectiveness as compared with
other types of interventions. This is particularly important in countries where
distributing cash involves significant logistical, operational and security costs.
An intervention that provided a cash transfer via the mobile phone strongly reduced the
costs of program recipients in obtaining the cash transfer, and reduced the
implementing agency’s variable costs associated with distributing cash. This suggests
that mobile telephony could be a simple and low-cost way to deliver cash transfers. In
addition, we observe that those in the m-transfer group bought more types of food and
non-food items, increased their diet diversity, depleted their non-durable assets at a
slower rate and produced a more diverse basket of agricultural goods. These
differences are primarily due to the m-transfer intervention, and not to the presence of
the mobile phone, suggesting that a program that simply distributes mobile phones
might not yield the same impacts. This effects appear to be due to the reduced costs of
the program and the greater privacy of the m-transfer mechanism, which are potentially
linked with changes in intra-household decision-making.
The m-transfer approach may be limited in its application to all contexts. First, it will
only be effective in cases where telecommunications infrastructure currently exists,
which could limit its utility in remote areas. Second, in areas with high rates of illiteracy
– as is the case in Niger – program recipients might not able use the m-transfer
technology on their own, implying that they might need help from other family
members, friends or m-transfer agents. This could potentially limit the use of the
technology by program recipients for informal private transfers or in accessing other
mobile financial services, but could be beneficial for the household as a whole. And
finally, the short-term impacts of the program might not persist in the longer-term.

Despite these caveats, the widespread growth of mobile phone coverage, cheaper
mobile phone handsets and m-money services in developing countries suggests that
these constraints could be easily overcome. In addition, the benefits of the program in a
context such as Niger -- a country with limited investment in power, roads and landlines,
low literacy rates and one of the highest rates of financial exclusion in sub-Saharan
Africa -- suggests that the approach could thrive in less marginalized contexts.

References
Aker, Jenny C. 2010. “Information from Markets Near and Far: Mobile Phones and
Agricultural Markets in Niger.” American Economic Journal: Applied Economics, 2(3): 46–
59.
Aker, Jenny C. and Isaac M. Mbiti. 2010. “Mobile phones and economic development in
Africa.” Journal of Economic Perspectives, 24(3): 207–232.
Baird, Sarah, Craig McIntosh and Berk Ozler. Forthcoming. “Cash or Condition?
Evidence from a Randomized Cash Transfer Program.” Quarterly Journal of Economics.
Barrera-Osorio, Felipe, Marianne Bertrand, Leigh L. Linden, and Francisco Perez-Calle.
2011. "Improving the Design of Conditional Transfer Programs: Evidence from a
Randomized Education Experiment in Colombia." American Economic Journal: Applied
Economics, 3(2): 167–95.
Blumenstock, Joshua, Nathan Eagle and Marcel Fafchamps. 2011. “Risk Sharing Over
the Mobile Phone Network: Evidence from Rwanda.” Unpublished manuscript,
University of California-Berkeley.
Cunha, Jesse M., Giacomo De Giorgi and Giacomo De Giorgi and Seema Jayachandran.
2011. “The Price Effects of Cash Versus In-Kind Transfers.” Unpublished manuscript.
Dhaliwal, Iqbal, Esther Duflo, Rachel Glennerster, Caitlin Tulloch. August 2011.
“Comparative Cost-Effectiveness Analysis to Inform Policy in Developing Countries: A
General Framework with Applications for Education.” Abdul Jameel Poverty Action
Lab.
De Janvry A, Sadoulet E, Pantelis Solomon and Renos Vakis. 2006. “Uninsured Risk and
Asset Protection: Can Conditional Cash Transfer Programs Serve as Safety Nets?” World
Bank Discussion Paper 0604. World Bank Publications: Washington, D.C.
DFID. April 2011. “Cash Transfers Evidence Paper.” Evidence Paper Policy Division.
London, UK.
Doepke, Matthias and Michele Tertilt. 2011. “Does Female Empowerment Promote
Economic Development?” Unpublished manuscript.
Jack, William, Tavneet Suri and Robert Townsend. 2010. “Monetary Theory and
Electronic Money: Reflections on the Kenyan Experience.” Economic Quarterly. Volume
96, Number 1: 83–122
Jack, William and Tavneet Suri. 2011. “The Risk-Sharing Benefits of Mobile Money.”
Unpublished manuscript.
Jakiela, Pamela and Owen Ozier. 2011. “Does Africa Need a Rotten Kin Theorem?
Experimental Evidence from Village Economies.” Unpublished manuscript.
Jensen, Robert. 2007. “The Digital Provide: Information (Technology), Market
Performance, and Welfare in the South Indian Fisheries Sector.” Quarterly Journal of
Economics, 122(3): 879–924.
Gibson, John, David McKenzie and Steven Stillman. Forthcoming. “The Impacts of
International Migration on Remaining Household Members: Omnibus Results from a
Migration Lottery Program.” Review of Economics and Statistics.
Mbiti, Isaac M. and David Weil. 2011. “Mobile Banking: The Impact of M-Pesa in
Kenya.” NBER Working Paper No. w17129.
Morawczynski, Olga and Mark Pickens. 2009. “Poor People Using Mobile Financial
Services: Observations on Customer Usage and Impact from M-PESA.” CGAP:
Washington, D.C.
World Bank. 2009. Conditional Cash Transfers: Reducing Present and Future Poverty.
World Bank Publications: Washington, DC.

Figure 1. Map of Villages in the Project Area

25
Figure 2. Timeline of Data Collection and Project Implementation
Year January March April May June July August September October November December
2010
Village
selection
Identification
and selection
of program
recipients
Program
preparation
Baseline
household
and village-
level survey
in 96
treatment
villages
Hungry season
Monthly cash transfers in 116 villages
Harvest period
Midterm
household
and village-
level
survey
Price data collected in 45 markets in all communes
2011
Final
household
and village-
level survey
in 96
treatment
villages
Hungry season
Harvest period

26
Figure 3. Impact of the Cash Transfer Delivery Mechanism on Distribution Costs ($USD
per program recipient)
0.00
2.00
4.00
6.00
8.00
10.00
12.00
14.00
16.00
Zap Manual cash/placebo
Zap Manual cash/placebo

Figure 4. Impact of the M-Money Program on Program Recipients’ Costs of Obtaining
the Cash Transfer
0
0.5
1
1.5
2
2.5
Distance (km) to Cashpoint Distance (hours) to Cash Point
Cost-Effectiveness of Zap versus Manual Cash
Distribution: Distance
Cash/Placebo Mobile Money

Table 1: Baseline Individual and Household Covariates (by Program Status)
Cash
Zap-Cash
Placebo-Cash
Zap-Placebo
Mean (s.d.)
Coeff (s.e.)
Coeff (s.e.)
Coeff (s.e.)
Panel A: Socio-Demographic Characteristics
Age of respondent 34.32 0.37 -2.29* 2.66*
(11.96) (1.60) (1.36) (1.50)
Respondent is household head 0.13 0.05 -0.00 0.05
(0.34) (0.04) (0.03) (0.04)
Polygamous household 0.28 0.02 0.00 0.02
(0.45) (0.04) (0.04) (0.04)
Respondent is member of Hausa ethnic group 0.83 -0.12 0.08 -0.19**
(0.38) (0.08) (0.07) (0.08)
Number of household members 9.34 -0.64 -0.40 -0.24
(4.92) (0.62) (0.46) (0.56)
Number of household members over 15 3.53 0.07 -0.05 0.12
(2.09) (0.25) (0.19) (0.24)
Respondent has some education 0.15 -0.08** -0.03 -0.05*
(0.36) -0.03 (0.03) (0.03)
Panel B: Household Income Sources and Assets Agriculture is an income source 0.97 -0.02 -0.01 -0.01
(0.16) (0.02) (0.02) (0.02)
Livestock is an income source 0.62 0.01 -0.08 0.09
(0.48) (0.05) (0.06) (0.06)
Remittances are an income source 0.35 -0.03 -0.04 0.01
(0.48) (0.04) (0.04) (0.04)
Number of income source categories 2.46 -0.03 -0.19 0.16
(1.07) (0.10) (0.11) (0.10)
Number of asset categories 3.59 -0.04 -0.18 0.14
(1.56) (0.17) (0.17) (0.17)
Panel C: Mobile Phone Ownership and Usage Household owns mobile phone 0.29 -0.01 -0.06 0.05
(0.45) (0.04) (0.05) (0.05)
Respondent is owner of mobile phone 0.25 -0.05 -0.07 0.00
(0.43) (0.07) (0.06) (0.00)
Respondent has used mobile phone since last harvest 0.63 -0.02 -0.05 0.03
(0.48) (0.05) (0.05) (0.05)
Used phone to make call since last harvest 0.29 -0.07* -0.06 -0.01
(0.45) (0.04) (0.05) (0.05)
Used phone to send or receive m-money transfer 0.01 0.01 0.01 0.01
(0.00) (0.01) (0.01) (0.01)

Panel D: Shocks Household experienced drought in past year 0.99 -0.00 0.01 -0.01
(0.12) (0.01) (0.01) (0.01)
Household experienced crickets in past year 0.82 -0.06 -0.07 0.01
(0.27) (0.05) (0.05) (0.05)
Notes: This table presents a comparison of individual and household covariates in each of the different treatment areas. Column 1 shows the mean and s.d. of the basic treatment (cash) households, whereas Columns 2 and 3 show the average difference between the different treatments and the cash households. Column 4 shows the average difference between the zap and placebo treatment households. Heteroskedasticity-consistent s.e. clustered at the village level are presented in parentheses. *** significant at the 1 percent level, ** significant at the 5 percent level, * significant at the 10 percent level.

Table 2: Baseline Individual and Household Outcomes (by Program Status)
Cash
Zap-
Cash
Placebo-
Cash
Zap-
Placebo
Mean
(s.d.)
Coeff
(s.e.)
Coeff
(s.e.)
Coeff
(s.e.)
Panel A: Food Security Outcomes and Coping Strategies
Number of months of household food provisioning (scale of 6) 1.9 0.12 0.03 0.08
(1.56) (0.16) (0.17) (0.16)
Household diet diversity index (scale of 12) 3.07 -0.10 -0.31 0.21
(2.04) (0.21) (0.19) (0.21)
Reduced meals 0.46 0.06 0.10 -0.04
(0.50) (0.09) (0.08) -0.08
Panel B: Migration and Remittances
One household member migrated since the last harvest 0.49 0.01 0.01 -0.01
(0.50) (0.06) (0.05) (0.05)
Number of household members who migrated since last
harvest 0.64 0.05 0.06 -0.01
(0.80) (0.10) (0.08) (0.10)
Number of remittances received 2.11 -0.28 -0.18 -0.09
(1.27) -0.17 (0.22) (0.22)
Received remittance via m-money transfer (zap) 0.05 -0.00 0.01 -0.02
(0.21) (0.03) (0.03) (0.03)
Panel C: Agricultural Production and Livestock
Cultivate land 0.98 -0.01 -0.00 -0.01
(0.13) (0.01) (0.01) (0.01)
Produce millet 0.97 -0.00 0.01 -0.02
(0.18) (0.01) (0.01) (0.01)
Quantity of millet produced (kg) 269 4.20 -35.42 39.63
(354) (48.70) (46.00) (44.66)
Produce cowpea 0.87 -0.00 -0.02 0.02
(0.34) (0.04) (0.04) (0.04)
Quantity of cowpea produced (kg) 10.81 2.03 0.48 1.55
(32) (2.87) (3.19) (3.51)
Sold millet 0.04 -0.00 0.00 -0.01
(0.19) (0.02) (0.02) (0.02)
Sold cowpea 0.00 0.02** 0.01* 0.01
(0.00) (0.01) (0.00) (0.01)
Practice livestock 0.71 0.01 -0.09 0.10*
(0.46) (0.06) (0.06) (0.06)

Notes: This table presents a pre-treatment comparison of individual and household outcomes in each of
the different treatment areas. Column 1 shows the mean and s.d. of the basic treatment (cash)
households, whereas Columns 2 and 3 show the average difference between the different treatments and
the cash households. Column 4 shows the average difference between the zap and placebo treatment
households. Heteroskedasticity-consistent s.e. clustered at the village level are presented in parentheses.
*** significant at the 1 percent level, ** significant at the 5 percent level, * significant at the 10 percent
level.

Table 3: Uses of the Cash Transfer
(1) (2) (3) (4) (5)
Cash
average
Zap-
Cash
Placebo-
Cash
Zap-
Placebo
Zap-
Both
Panel A: Uses of Cash Transfer for Food Items
Number of food and non-food items purchased with cash
transfer 4.12 0.86*** 0.03 0.83*** 0.85***
(2.64) (0.28) (0.26) (0.27) (0.24)
Transfer used to buy staple grains (millet, sorghum) 0.99 -0.01 -0.00 -0.00 -0.00
(0.05) (0.01) (0.01) (0.01) (0.01)
Transfer used to buy other grains (corn, rice) 0.58 0.20*** -0.02 0.22*** 0.21***
(0.50) (0.05) (0.05) (0.06) (0.05)
Transfer used to buy cowpea 0.42 0.09* -0.02 0.11** 0.10**
(0.49) (0.05) (0.05) (0.05) (0.05)
Transfer used to buy condiments 0.7 0.13*** 0.00 0.13*** 0.13***
(0.46) (0.05) (0.04) (0.05) (0.04)
Transfer used to buy oil 0.7 0.16*** 0.00 0.16*** 0.16***
(0.46) (0.05) (0.05) (0.05) (0.04)
Transfer used to buy meat 0.4 0.15*** -0.02 0.17*** 0.16***
(0.49) (0.04) (0.04) (0.05) (0.04)
Panel B: Uses of Cash Transfer for Non-Food Items
Pay school fees .07 -0.00 -0.01 0.01 0.00
(0.25) (0.02) (0.02) (0.02) (0.02)
Pay health expenses .29 0.02 -0.02 0.05 0.03
(0.45) (0.03) (0.04) (0.04) (0.03)
Buy clothes .04 0.01 0.02 -0.01 0.00
(0.19) (0.01) (0.02) (0.02) (0.01)
Notes: This table presents a simple difference comparison of households in each of the different treatment areas.
Column 1 shows the mean and s.d. of the basic treatment (cash and placebo) households, whereas Column 2 shows the
difference between the zap treatment and the cash/placebo treatment. Heteroskedasticity-consistent s.e. clustered at
the village level are presented in parentheses. *** significant at the 1 percent level, ** significant at the 5 percent
level, * significant at the 10 percent level.

Table 4: Impact on Food Security, Coping Strategies and Assets
(1) (2) (3) (4) (5)
Cash
average
Zap-
Cash
Placebo-
Cash
Zap-
Placebo
Zap-
Both
Mean
(s.d.)
Coeff
(s.e.)
Coeff
(s.e.)
Coeff
(s.e.)
Coeff
(s.e.)
Panel A: Food Security
Household diet diversity score (out of 12) 3.07 0.16 -0.26 0.43** 0.30
(2.04) (0.21) (0.15) (0.19) (0.18)
Consumption of:
Grains 0.96 -0.01 -0.01 -0.01 -0.01
(0.20) (0.01) -0.01 -0.01 (0.01)
Legumes 0.19 0.06 -0.02 0.08 0.07
(0.35) (0.05) (0.04) (0.05) (0.04)
Fruit 0.05 0.04*** -0.01 0.05*** 0.04***
(0.22) (0.01) (0.01) (0.01) (0.01)
Fats 0.32 0.06 -0.06 0.12** 0.09*
(0.47) (0.05) (0.04) (0.05) (0.04)
Panel B: Coping Strategies
Sell land 0.03 -0.01 0.02 -0.03 -0.02
(0.17) (0.03) (0.02) (0.02) (0.02)
Cut trees 0.16 -0.03 -0.02 -0.01 -0.02
(0.37) (0.04) (0.03) (0.04) (0.03)
Search anthills 0.02 -0.02 -0.00 -0.01 -0.02
(0.13) (0.02) (0.01) (0.01) (0.01)
Panel C: Durable and Non-Durable Goods
Number of asset categories owned (out of 12) 3.59 0.66*** 0.20 0.46*** 0.56***
(1.56) (0.14) (0.13) (0.13) (0.12)
Durable assets 0.2 0.03 -0.01 0.04 0.04
(0.58) (0.05) (0.03) (0.04) (0.04)
Non-durable assets 1.85 0.15* -0.09 0.24*** 0.20***
(0.96) (0.08) (0.09) (0.07) (0.07)
Notes: This table presents the difference in difference estimates for each of the different treatment areas. Column 1
shows the mean and s.d. of the basic treatment (cash) households in the pre-treatment period, whereas Columns 2
and 3 show the DD estimator between the different treatments and the cash households. Column 4 shows the DD
estimator for zap and placebo treatments. Column 5 compares the zap treatment with the joint placebo/cash
treatment. Heteroskedasticity-consistent s.e. clustered at the village level are presented in parentheses. ***
significant at the 1 percent level, ** significant at the 5 percent level, * significant at the 10 percent level.

Table 5: Impact on Agricultural Outcomes
(1) (2) (3) (4) (5)
Cash average
Zap-Cash
Placebo-Cash
Zap-Placebo
Zap-Both
Mean (s.d.)
Coeff (s.e.)
Coeff (s.e.)
Coeff (s.e.)
Coeff (s.e.)
Panel A: Agricultural Production Cultivated in past growing season 0.98 0.01 0.01 0.01 0.01
(0.13) (0.01) (0.01) (0.01) (0.01)
Own land 0.89 -0.00 -0.00 0.01 0.01
(0.31) (0.02) (0.02) (0.02) (0.02)
Types of crops grown 4.44 0.49** 0.12 0.36* 0.42**
(2.31) (0.19) (0.19) (0.21) (0.18)
Use improved seeds 0.18 0.06 0.07 -0.01 0.03
(0.39) (0.05) (0.05) (0.05) (0.04)
Grow millet 0.97 0.00 0.00 0.00 0.00
(0.18) (0.00) (0.00) (0.00) (0.00)
Grow cowpea 0.87 0.06 0.03 0.03 0.05
(0.33) (0.04) (0.04) (0.04) (0.04)
Grow vouandzou or gombo 0.53 .17*** 0.07 0.09* 0.13***
(0.50) (0.05) (0.05) (0.05) (0.05)
Quantity cowpea produced (kg) 10 -0.41 -1.69 1.28 0.44
(32) (5.18) (4.45) (6.62) (5.52)
Quantity vouandzou and okra produced 5.25 0.15 0.64 0.49 -2.21
(14.70) (2.82) (3.36) (4.59) -3.57
Panel B: Agricultural Marketing Sell millet 0.04 0.03 -0.01 0.04 0.03
(0.02) (0.04) (0.04) (0.04) (0.04)
Sell cowpea 0.00 0.02 0.01 0.01 0.01
(0.00) (0.01) (0.01) (0.02) (0.02)
Sell vouandzou or okra 0.01 0.01 0.01* 0.00 0.00
(0.10) (0.01) (0.00) (0.01) (0.00)
Quantity millet sold (kg) 92 -5.45 -8.84 3.40 -0.41
(175) (8.23) (9.34) (7.22) (6.24)
Quantity cowpea sold (kg) 27.1 -2.01 14.15 -16.16 -14.77
(32) (20.77) (14.57) (25.94) (24.75)
Notes: This table presents the difference in difference estimates for each of the different treatment areas. Column 1 shows the mean and s.d. of the basic treatment (cash) households in the pre-treatment period, whereas Columns 2 and 3 show the DD estimator between the different treatments and the cash households. Column 4 shows the DD estimator for zap and placebo treatments. Column 5 compares the zap treatment with the joint placebo/cash treatment. Heteroskedasticity-consistent s.e. clustered at the village level are presented in parentheses. Regressions control for seed distribution village. *** significant at the 1 percent level, ** significant at the 5 percent level, * significant at the 10 percent level.

Table 6: Location, Knowledge and Timing of Cash Transfer Expenses
(1) (2) (3) (4) (5)
Cash
average
Zap-
Cash
Placebo-
Cash
Zap-
Placebo
Zap-
Both
Panel A: Location and Timing of Expenditures
Spent transfer at kiosk in village 0.43 0.03 -0.05 0.09 0.06
(0.49) (0.06) (0.05) (0.06) (0.05)
Spent transfer at market within village 0.22 0.06 0.06 -0.00 0.03
(0.42) (0.08) (0.07) (0.08) (0.07)
Spent transfer at market outside village 0.61 -0.04 -0.05 0.01 -0.01
(0.49) (0.08) (0.07) (0.08) (0.07)
Spent money all at once 0.54 -0.00 -0.01 -0.00 -0.01
(0.50) (0.04) (0.04) (0.04) (0.04)
Panel B: Knowledge of Cash Transfer
Knew amount of cash transfer 0.27 0.03 0.03 -0.00 0.02
(0.44) (0.06) (0.05) (0.06) (0.06)
Knew duration of cash transfer 0.26 -0.01 -0.08 0.07 0.03
(0.44) (0.05) (0.05) (0.06) (0.05)
Panel C: Sharing of Cash Transfer
Shared cash transfer 0.18 0.05 0.02 0.03 0.04
(0.38) (0.04) (0.04) (0.04) (0.03)
Shared with friend or family within village 0.91 0.01 0.03 -0.02 -0.01
(0.30) (0.05) (0.06) (0.06) (0.04)
Notes: This table presents a simple difference comparison of households in each of the different treatment areas.
Column 1 shows the mean and s.d. of the basic treatment (cash) households, whereas Column 2 shows the difference
between the zap treatment and the cash treatment. Column 3 shows the difference between placebo and cash, Column
4 shows the difference between zap and placebo, and Column 5 shows the difference between Zap and Cash/Placebo.
Heteroskedasticity-consistent s.e. clustered at the village level are presented in parentheses. *** significant at the 1
percent level, ** significant at the 5 percent level, * significant at the 10 percent level.

Table 7. M-Money and Private Transfers
(1) (2) (3) (4) (5)
Cash
average
Zap-
Cash
Placebo-
Cash
Zap-
Placebo
Zap-
Both
Mean
(s.d.)
Coeff
(s.e.)
Coeff
(s.e.)
Coeff
(s.e.)
Coeff
(s.e.)
Received remittances as income 0.35 0.09** 0.04 0.05 0.07**
(0.48) (0.04) (0.04) (0.04) (0.03)
Amount of remittances received for last transfer (CFA) 22057 -423 2163 -2586 -1277
(16630) (3446) (2524) (3147) (3059)
Number of remittances since last harvest 2.11 0.19 0.12 0.06 0.13
(1.28) (0.22) (0.25) (0.24) (0.19)
Received remittance via Western Union .34 -0.09 -0.04 -0.05 -.06
(0.48) (0.08) (0.07) (0.08) (0.07)
Received remittance via friend 0.53 0.01 -0.02 0.04 .02
(0.50) (0.10) (0.10) (0.11) (0.09)
Received remittance via zap 0.05 0.01 0.02 0.02 0.01
(0.21) (0.03) (0.03) 0.03 (0.03)
Transferred credit via Zap 0.00 -0.00 -0.00 -0.00 -0.00
(0.01) (0.01) (0.01) (0.01)
Notes: This table presents a simple difference comparison of households in each of the different treatment areas.
Column 1 shows the mean and s.d. of the basic treatment (cash) households, whereas Column 2 shows the
difference between the zap treatment and the cash treatment. Column 3 shows the difference between placebo
and cash, Column 4 shows the difference between zap and placebo, and Column 5 shows the difference between
Zap and Cash/Placebo. Heteroskedasticity-consistent s.e. clustered at the village level are presented in parentheses.
*** significant at the 1 percent level, ** significant at the 5 percent level, * significant at the 10 percent level.

Table 8: Intra-Household Decision-Making
(1) (2) (3) (4) (5)
Cash
average
Zap-
Cash
Placebo-
Cash
Zap-
Placebo
Zap-
Both
Panel A: Decision-Making Regarding Cash Transfer
Respondent responsible for spending cash transfer 0.53 -0.01 -0.03 0.02 0.00
(0.49) (0.04) (0.04) (0.04) (0.03)
Respondent involved in decision-making of transfer 0.99 0.01* 0.01* 0.00 0.01
(0.10) (0.01) (0.01) (0.01) (0.01)
Panel B: Results for Fulani and Touareg Ethnic Groups
Respondent responsible for spending cash transfer 0.52 0.10 0.10 0.06 0.08
(0.50) (0.12) (0.12) (0.09) (0.09)
Used transfer to pay health expenses 0.19 .17*** .20*** -0.03 0.07
(0.40) .05 .07 (0.07) (0.07)
Used transfer to pay for school fees 0.05 -0.02 -0.02 0.01 -0.01
(0.21) (0.02) (0.04) (0.04) (0.03)
Spent transfer at market outside village 0.81 -0.03 0.09 -0.12 -0.07
(0.40) (0.10) (0.08) (0.08) (0.08)
Panel C: Results for Hausa Ethnic Group
Respondent responsible for spending cash transfer 0.53 -0.01 -0.05 0.04 0.01
(0.50) (0.04) (0.04) (0.04) (0.03)
Used transfer to pay health expenses 0.31 0.01 -0.05 0.06 0.03
(0.46) (0.04) (0.04) (0.04) (0.03)
Used transfer to pay for school fees 0.08 -0.00 -0.01 0.01 0.00
(0.26) (0.02) (0.02) (0.02) (0.02)
Spent transfer at market outside village 0.57 -0.03 -0.07 0.04 0.01
(0.50) (0.10) (0.08) (0.09) (0.09)
Notes: This table presents a simple difference comparison of households in each of the different treatment areas.
Column 1 shows the mean and s.d. of the basic treatment (cash) households, whereas Column 2 shows the difference
between the zap treatment and the cash treatment. Column 3 shows the difference between placebo and cash,
Column 4 shows the difference between zap and placebo, and Column 5 shows the difference between Zap and
Cash/Placebo. Heteroskedasticity-consistent s.e. clustered at the village level are presented in parentheses. ***
significant at the 1 percent level, ** significant at the 5 percent level, * significant at the 10 percent level.

Table 9: Impact of Mobile Money on Mobile Phone Ownership and Usage
(1) (2) (3) (4) (5)
Cash average
Zap-Cash
Placebo-Cash
Zap-Placebo
Zap-Both
Mean (s.d.)
Coeff (s.e.)
Coeff (s.e.)
Coeff (s.e.)
Coeff (s.e.)
Panel A: Mobile Phone Ownership Respondent owns a mobile phone 0.25 0.71*** 0.61*** 0.10 0.27***
(0.07) (0.08) (0.09) (0.07)
Used mobile phone since last harvest 0.63 0.31*** 0.13** 0.18*** 0.25***
(0.05) (0.05) (0.05) (0.04)
Made calls 0.29 0.33*** 0.21*** 0.12* 0.22***
(0.06) (0.06) (0.06) (0.06)
Received calls 0.98 -0.04 -0.01 -0.03 -0.03
(0.03) (0.03) (0.04) (0.03)
Wrote or received SMS 0.01 0.01* 0.008 0.003 0.007
(0.01) (0.01) (0.01) (0.01)
Sent or received a "beep" 0.06 0.14*** 0.04* 0.09*** 0.12***
(0.03) (0.03) (0.03) (0.03)
Transferred credit via Zap 0.00 -0.00 -0.00 -0.00 -0.00
(0.01) (0.01) (0.01) (0.01)
Received credit via Zap 0.01 0.45*** 0.01 0.44*** 0.44***
(0.06) (0.02) (0.06) (0.06)
Panel B: Uses of Mobile Phones Communicate with family/friends inside Niger 0.24 0.18*** 0.13** 0.04 0.11*
(0.06) (0.05) (0.06) (0.06)
Communicate with commercial contacts inside Niger 0.00 -0.00 0.01 -0.01 -0.01
(0.01) (0.01) (0.01) (0.01)
Communicate with family/friends outside Niger 0.46 0.01 0.03 -0.02 0.00
(0.07) (0.07) (0.07) (0.06) Used mobile phone to Communicate death/ceremony 0.27 0.16*** 0.15*** 0.00 0.08*
(0.05) (0.05) (0.05) (0.04)
Used mobile phone to share general information 0.59 0.03 0.07 -0.04 -0.00
(0.06) (0.06) (0.07) (0.06)
Used mobile phone to ask for help/support 0.27 0.08 0.07 0.01 0.05
(0.05) (0.05) (0.05) (0.04)
Notes: This table presents the difference in difference estimates for each of the different treatment areas. Column 1 shows the mean and s.d. of the basic treatment (cash) households in the pre-treatment period, whereas Columns 2 and 3 show the DD estimator between the different treatments and the cash households. Column 4 shows the DD estimator for zap and placebo treatments. Column 5 compares the zap treatment with the joint placebo/cash treatment. Heteroskedasticity-consistent s.e. clustered at the village level are presented in parentheses. *** significant at the 1 percent level, ** significant at the 5 percent level, * significant at the 10 percent level.

Table 10: Impact of Cash Transfers on Agricultural Prices
(1) (2) (3) (4)
Dependent variable: Log of
prices Price
Any cash
transfer
Zap
transfer
Cash
Transfer
Mean (s.d.)
Coeff
(s.e.)
Coeff
(s.e.)
Coeff
(s.e.)
Millet (tia) 381 -0.00 0.01 -0.02
(140) (0.01) (0.01) (0.02)
Millet (100-kg bag) 22,480 0.01 0.01** 0.00
(3442) (0.01) (0.01) (0.01)
Sorghum (tia) 359.76 0.01 0.04 -0.01
(129) (0.02) (0.02) (0.02)
Cowpea (tia) 403 -0.00 -0.00 -0.00
(241) (0.01) (0.02) (0.01)
Cowpea (60-kg bag) 18721 -0.00 -0.02 0.07***
(4775) (0.01) (0.03) (0.02)
Rice (1 kg) 431.29 0.01 0.03*** -0.02
(37) (0.01) (0.01) (0.01)
Rice (50-kg bag) 19,527 -0.00 0.02* -0.02**
(3447) (0.01) (0.01) (0.01)
Vegetable oil (1 liter) 883.73 0.01 0.01 0.01
(170) (0.02) (0.03) (0.02)
Spaghetti (1 kg) 634 0.00 0.01 -0.01
(40) (0.01) (0.01) (0.01)
Notes: "Any cash transfer" is a binary variable equal to 1 at time t if there was a
cash transfer during that week, 0 otherwise. "Zap transfer" is equal to 1 in week t if
there was a zap transfer during that week, 0 otherwise. Column 1 shows the mean
and s.d. of the agricultural commodity over the period, whereas Column 2 shows
the impact of any transfer on prices. Columns 3 and 4 shows the coefficients for
the zap and cash transfers, respectively. Heteroskedasticity-consistent s.e.
clustered at the market-level are presented in parentheses. *** significant at the 1
percent level, ** significant at the 5 percent level, * significant at the 10 percent
level.
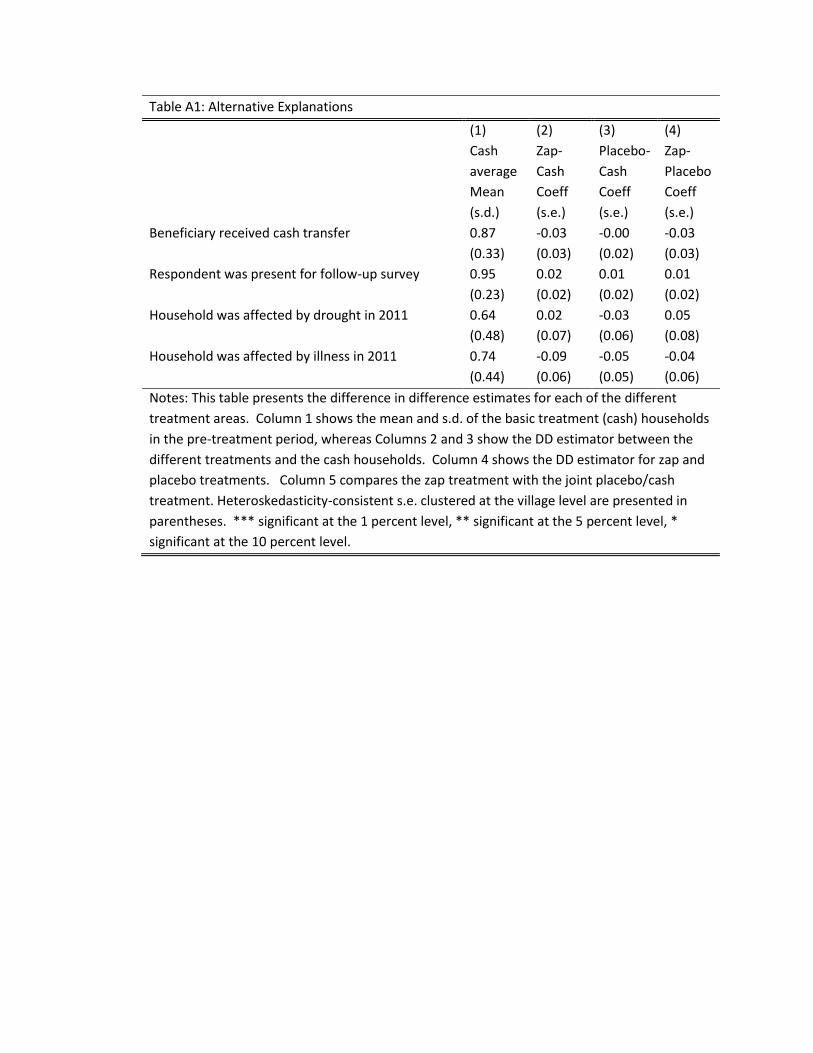
Table A1: Alternative Explanations
(1) (2) (3) (4)
Cash
average
Zap-
Cash
Placebo-
Cash
Zap-
Placebo
Mean
(s.d.)
Coeff
(s.e.)
Coeff
(s.e.)
Coeff
(s.e.)
Beneficiary received cash transfer 0.87 -0.03 -0.00 -0.03
(0.33) (0.03) (0.02) (0.03)
Respondent was present for follow-up survey 0.95 0.02 0.01 0.01
(0.23) (0.02) (0.02) (0.02)
Household was affected by drought in 2011 0.64 0.02 -0.03 0.05
(0.48) (0.07) (0.06) (0.08)
Household was affected by illness in 2011 0.74 -0.09 -0.05 -0.04
(0.44) (0.06) (0.05) (0.06)
Notes: This table presents the difference in difference estimates for each of the different
treatment areas. Column 1 shows the mean and s.d. of the basic treatment (cash) households
in the pre-treatment period, whereas Columns 2 and 3 show the DD estimator between the
different treatments and the cash households. Column 4 shows the DD estimator for zap and
placebo treatments. Column 5 compares the zap treatment with the joint placebo/cash
treatment. Heteroskedasticity-consistent s.e. clustered at the village level are presented in
parentheses. *** significant at the 1 percent level, ** significant at the 5 percent level, *
significant at the 10 percent level.