Embed Size (px)
Citation preview

A n E SRC R esea rch P r o j e c t
Working Paper 4
Designing a Local Governance Performance Index (LGPI ):
a problem-solving approach in Tanzania
Anna Mdee, Patricia Tshomba & Andrew Mushi
August 2017

2
Contents Executive Summary .......................................................................................................................................... 3
1 What type of Local Governance Performance Index (LGPI) could work in Tanzania? ........... 5
2 Blurred lines of accountability and blame in Tanzanian local governance .................................. 8
3 Selecting the final list of indicators for the pilot LGPI .................................................................. 13
4 Baseline Data – the next step in a process ..................................................................................... 21
5 Next steps- what does this all mean? .............................................................................................. 33
6 References .............................................................................................................................................. 35
Table of figures
Figure 1: Delivery of public services in Tanzania .................................................................................... 10
Figure 2: Proposed indicators for use in a Local Governance Performance Index ........................ 12
Figure 3: Overview of Citizen Perception Survey- Kigoma Ujiji April 2017 .................................... 23
Figure 4: Kigoma-Ujiji citizen survey- physical infrastructure .............................................................. 24
Figure 5: Kigoma-Ujiji citizen survey- social services ............................................................................ 24
Figure 6: Kigoma-Ujiji citizen survey- economic development and resources ................................ 25
Figure 7: Kigoma-Ujiji citizen survey- political ........................................................................................ 25
Figure 8: Kigoma-Ujiji Frontline worker survey ..................................................................................... 26
Figure 9: Kigoma-Ujiji District Council Data ........................................................................................... 27
Figure 10: Overview of Mvomero Citizen Survey, April 2017 ............................................................ 28
Figure 11: Mvomero citizen survey -physical infrastructure ................................................................ 29
Figure 12: Mvomero citizen survey-social services ................................................................................ 29
Figure 13: Mvomero citizen survey-Economic Development and Resources ................................. 30
Figure 14: Mvomero citizen survey- political........................................................................................... 30
Figure 15: Mvomero frontline worker survey results ........................................................................... 31
Figure 16: Mvomero District Council Data ............................................................................................. 32
Summary of Tables
Table 1: Phase 1 data collection .................................................................................................................... 9
Table 2: outlines the data collection process for the initial phase of narrowing down the
indicators: ........................................................................................................................................................ 13

3
Executive Summary
Creating a Local Governance Performance Index (LGPI) in Tanzania
A three-year DFID-ESRC funded project researched the process of designing and implementing
a local government performance index through collaborative research in two Districts of
Tanzania (Mvomero and Ujiji-Kigoma), with the aim of understanding whether such an index
could improve local governance, accountability and service delivery.
It found that a LGPI has the potential to do these things, but as a tool for collaborative problem-
solving working, and not as a mechanism of external judgement and quantification.
This research suggests that the LGPI should:
Be cautious about accountability myths
Many accountability and governance interventions are built on two assumptions. Firstly, that the
provision of information relating to service delivery, e.g. the publication of budgets will enable
citizens to demand service improvements. Secondly, that citizens and, more broadly, civil society
are ready and able to demand improved service delivery and accountability from government.
Whilst both of these assumptions have validity on a theoretical level, they more often than not
disintegrate when tested against local political and systemic realities.
Work with political and systemic realities
Therefore, it is necessary to work from where political and systemic realities are, and not where
we wish them to be. Policies and stated intentions of accountability and good governance can
exist only on paper and in political rhetoric. Working from where institutions are is necessary to
address some of the blockages and contradictions that work against improvements in service
delivery.
Untangle blame and accountability
Accountability myths suggest that accountability is simple and direct: that citizens can demand
that government fulfils its duties. However, in reality lines of actual accountability are far more
complex, with the blame for poor service delivery being directed in multiple and contradictory
directions.
Be a collaborative problem-solving tool
For a LGPI to work in such a context, it cannot adopt the accountability myths; this would
replicate all of the problems already recognized in previous accountability interventions. The LGPI
will work best as a tool for starting the conversations on why service delivery is like it is in a
particular context. It must build a coalition of stakeholders to disentangle blame and responsibility
for service delivery performance, starting from an agreed baseline of indicators relating to local
governance and service delivery. Our aim is that the LGPI becomes a tool for collaborative
problem-solving.

4
This working paper details the process of creating a LGPI in Mvomero and Kigoma-Ujiji Districts
of Tanzania. It is organized into 5 sections. Section 1 locates the research in relation to a wider
literature and evidence base. Section 2 outlines phase 1 of the research and our attempts to make
visible political and systemic realities, and untangle blame and accountability in service delivery,
and to come up with a potential set of indicators that help to do this. Section 3 details the
collaborative process of refining the indicators in the Districts and the process for collecting
baseline data. Section 4 then presents the baseline data, but crucially does not attempt to
interpret it. This is not our data, but it belongs with the Districts. Section 5 therefore sets out
what we would recommend might happen next in the processes of advancing from research to
action through embedding the LGPI as a collaborative problem-solving tool. in the two pilot
districts.
5
1 What type of Local Governance Performance Index (LGPI) could
work in Tanzania?
In 2014, the University of Mzumbe in Tanzania, in partnership with the Foundation for Civil
Society and INTRAC, launched a three-year research project to explore the viability and value
of creating a local governance performance index at the district level in Tanzania. This research
was funded by the UK Economic & Social Research Council (ESRC) and the Department for
International Development (DFID).
The overarching research question was:
To what extent might a local governance performance index, informed by civil
society and citizen participation, lead to improvements in pro-poor service delivery
and local governance in Tanzania?
The research had two specific components: 1) formulating and piloting a LGPI using indicators
selected to reflect improvements in pro-poor service delivery and local governance; and 2)
analysing the institutional and political interactions involved in this process.
The process of creating and testing a LGPI started by questioning the relationship between
institutions of local governance, notions of good governance and performance, and the potential
indicators that might make comparative judgment of local governance performance possible (see
working papers 1 and 2).
Since writing the original proposal and coming to the end of this research, the academic and
literature and evidence in this area has developed rapidly. When we began, indicators and indexes
were seen as a tool for good governance, naming and shaming poor performance, and therefore
driving increased compliance with good governance principles through institutional reform.
Whilst this view does remain influential, there is increasing criticism of the results of this
approach. There are three critical bodies of literature in which this research is located:
1.1 Public sector reform and the decline of the ‘good governance’ solution
The dominance of New Public Management (NPM) and instrumental institutional reform as
mechanisms for improving governance are increasingly questioned. Influential work such as that
of Andrews et al (2013), Andrews (2015a,b), Buntaine et al (2017), Levy (2015) and Booth et al
(2013) details a wide gap between policy adoption (of the principles of good governance and
increased accountability) and implementation.
This requires a much greater focus on the political economy of how institutions work, on how
they are incentivized and naturalised, on how programmes are managed and led and not on their
form, on processes of iterative and adaptive reform, and on models of the interaction of individual
and collective agency (and away from principal agent models) (Andrews 2013, 2015a, 2015b,
Brinkerhoff & Brinkerhoff 2015, Guinn & Straussman 2017,Lund 2006).

6
Therefore, an effective LGPI should not replicate existing governance indexes in reproducing
indicators of ‘good’ governance, but rather operate as a tool to fit processes of iterative and
adaptive reform.
1.2 Accountability: untangling blame and responsibility
The idea of citizen- and civil society-driven accountability is also increasingly contested. Much of
the donor and INGO driven accountability work is founded on assumptions that increasing
information availability and citizen voice will be sufficient to hold governments to account.
However, our fieldwork and review of available evidence supports the work of Fox (2007, 2015,
2016), Hickey & King (2016) and Tembo & Chapman (2014) in suggesting that:
• Transparency (of information) is not enough; citizens and civil society often lack the ‘bite’
to change systems, and civil society interlocutors tend to dominate the process
• Voice needs representation and not only aggregation, and may be limited by fear
• The state needs to be able to act in response- but may be constrained by institutional
capacity
• The causal chain between transparency, participation and accountability is only as strong
as its weakest link.
Understanding blame and not just accountability is also critical in shedding light on how
institutions operate and how they evolve. Blame comes out very strongly as a theme in this
research, as is explained in section 2. Blame and blame avoidance play a role in how accountability
and responsibility work in practice. Hood (2007) cautions that targets and indicators can become
used in game playing related to the avoidance of blame in public institutions. Therefore, before
starting the process of creating the LGPI we found it necessary to explore existing lines of blame.
1.3 Indicators and indexes: what are they for and how should they be used?
Quantitative targets and indicators can distort service delivery and accountability, with focus
driven to the target itself, rather than the processes and relationships behind it.
An index is formed from the aggregation of a set of indicators. Indicators act as proxy
representations of institutional performance, conditions and context, and hence they should be
viewed with caution. Recent studies such as Jerven (2013), Merrey & Wood (2015), Merrey
(2016) and Chabbott (2014) demonstrate how indicators can take on a life of their own, coming
to dominate processes and debates, rather than drawing attention to the processes behind them.
Jerven (2013) also highlights critical limitations of the data behind many indicators.

7
Therefore, for the LGPI, the quantification of indicators for external scrutiny and comparison is
not the purpose of the index. The indicators are rather ways into problem solving around
particular issues, and the indicators should also evolve as situations change. Indicators can also
be used to draw attention to particular issues, for example, the inclusion of more marginalized
groups. Again, however, even these indicators need to be consciously questioned as to whether
they draw attention to how problems of inclusion might be actively solved, rather than passively
reported on, or whether they lead to manipulation through box-ticking exercises.

8
2 Blurred lines of accountability and blame in Tanzanian local
governance
Phase 1 of the research began with a critical review analysing the conceptual discussions and
evidence base relating to good governance, governance indicators and indexes, social
accountability mechanisms and initiatives. The evidence search did prioritise materials on
Tanzania, but also considered materials relating to the broader research questions. Whilst a range
of evidence was collected (including peer reviewed journal articles, policy reports, working
papers and other grey literature), we maintained a focus on local governance, holistic public
service delivery indicators, and indexes where they existed. We drew on donor- and NGO-
generated literature on social accountability mechanisms (e.g. scorecards, public expenditure
tracking) and initiatives where these contained sufficient detail, conceptual rigour and analysis of
relevance to creating a holistic local governance performance index.
Findings from the literature research are detailed in working papers 1 and 2.
The more recent literature outlined in section 1 as an introduction to this paper, further supports
the approach that we chose to take.
Our starting assumptions were that:
• We must map out how local governance works in practice, rather than in theory.
• Causal assumptions on citizen access to information and civil society holding government
to account are flawed and contested. Similarly, a check-list approach to creating ‘good
governance’ has failed to deliver robust institutional change.
• Local governance is complex and has multiple channels- lines of accountability may be
stated in policy, but are likely to vary in practice.
Our methodology was based on an ethnographic approach, which collects data from multiple
sources, on repeated occasions. Questions in interviews and focused groups are semi-structured
or unstructured guided by the aim of elucidating how local governance works in practice. Data
and analysis are an iterative process, so themes arising in the data are then explored through
further data collection. Thematic analysis (the process of identifying what is emergent from the
data) is done through a process of discourse analysis and triangulation. This means analysing what
people say and what they do, but also cross-checking this with other sources.
So in order to understand how local governance works in the two districts we began a process
of mapping local service delivery, accountability and governance from the individual citizen up to
the national level. This process began through selecting four villages and streets (Vijiji and mitaa)
in four wards in each District, purposively sampled to cover different characteristics of the
District (see full details in working paper 3). We then continued the process to the Ward (Kata)
and then the District (Wilaya), Region (Mkoa) and Nation (Taifa). At each level, data collection
encompasses any actors engaged in accountability, governance and service delivery.

9
Table 2.1 provides an overview of the data collection in the phase 1 process which ran over the
first two years of the project.
Table 1: Phase 1 data collection
Level Sampling Methods Numbers
Wananchi (citizens) Purposive- disaggregated by
age, gender and wealth
Life-history
Semi-structured interviews
Service perception survey
20 in each ward (80
per District)
312- total
Transect walk and mapping Key public infrastucture Transect mapping with key
informants
Multiple in each
location
Frontline workers, e.g.
Teachers, Health workers,
Extension staff, CSO staff
Key informants Semi-structured interviews
Village mapping
5 in each ward (20 per
District)
Village government (Village
Executive Officer (VEO),
Village Chair and
Councillors
Key informants Semi-structured interviews
Village mapping
Focused group discussions
5 in each ward (20 per
District)
1 in each ward
Ward (Ward Executive
Officer (WEO) and
Councillors)
Key informants Semi-structured interviews 4 wards in each
District
District- Executive and
Civil society
representatives
Key informants Semi-structured interviews
Focused group discussions
Collaborative action
research discussion and
establishment of working
group
10-15 per District
1 per District
Region Key informants Semi-structured interviews 3 per region
National- MPs,
representatives of national
ministries, civil society
representatives
Key informants Semi-structured interviews 15- Local
Government, Health,
Education,
Agriculture, National
NGOs
Academics

10
From the initial data and research, we generated figure 1 which maps out the different actors
operating in relation to local governance and service delivery, i.e. the effective ‘rules in theory’.
It demonstrates the complexity of the theoretical lines of accountability.
Figure 1: Delivery of public services in Tanzania
11
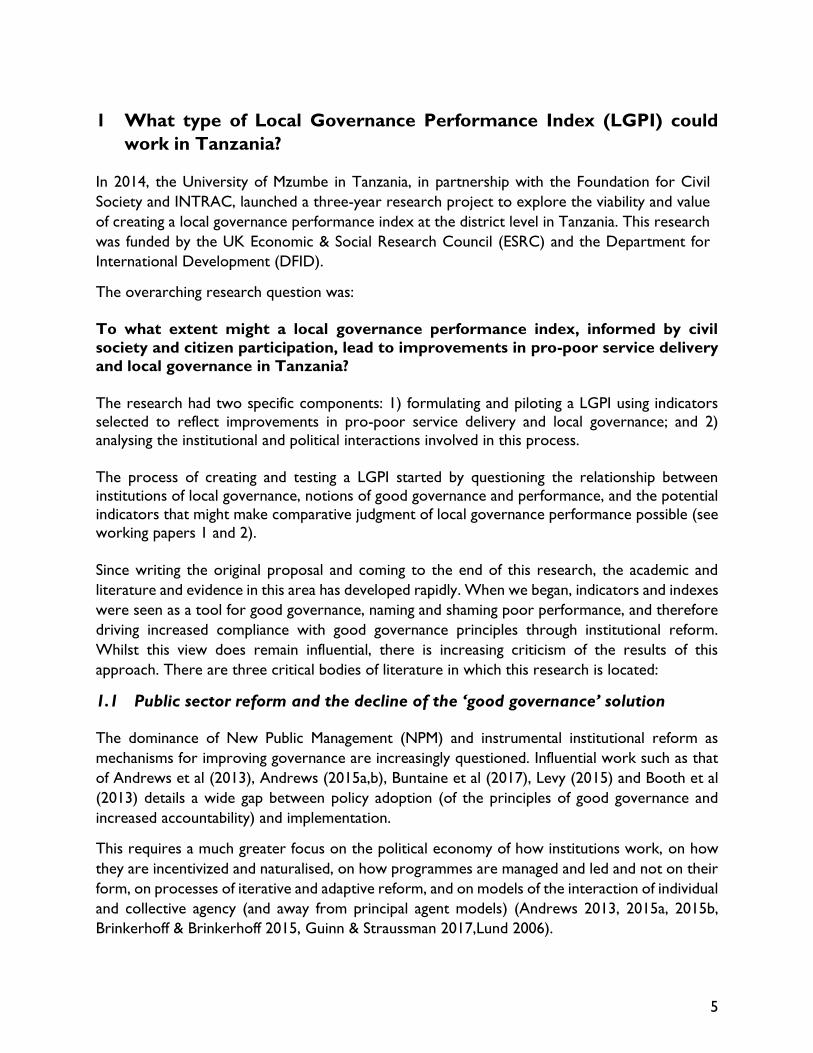
The key conclusions from phase 1 (detailed in working paper 3) were that:
➢ Accountability for performance in the delivery of public services in these two districts is
very complex, and there is a lot of confusion about roles and responsibilities. More and
more expectations are placed on the village/street level
➢ Blame for the lack of progress goes in all directions, by all actors, including some citizens
who blame themselves for failing to deliver development activities.
➢ Different stakeholders (citizens, village and district leaders, local officials, civil society
organisations, frontline workers) have very different views about who should be
responsible for development, about what the local government is responsible for, and
about how different elected and appointed people in local government should be held
accountable for their performance.
➢ Working on the basis of ‘rules in theory’ (that is, how local government should work, how
accountability should work) alone is unlikely to bring about significant changes in
performance at the local level because of many obstacles throughout the system. These
obstacles include systemic obstacles (e.g. limited resources, lack of infrastructure and
information) as well as human obstacles (e.g. ingrained perceptions, fears of reprisal).
So while local governance has theoretical lines of accountability, in practice these lines are very
blurred. It is therefore hard to see how local government can be held directly to account for
service delivery when the responsibilities of local government are far from clear. The process of
designing the Local Governance Performance Index (LGPI) needs to consider these contested
and blurred lines of accountability.
However, the data suggests a strong desire to address this problem. The research revealed
consensus that local government should be accountable for its performance, and participants in
the research welcomed the participatory process and the emerging findings. We therefore see
potential in using a LGPI as a collaborative problem-solving tool, that helps to move from a list
of complaints about problems that local officials and representatives have limited capacity to
resolve, to a collective understanding between citizens and local government about where
blockages lie, and what they can do together to overcome them.
The bottom-up, participatory research and reflection process collected perspectives of citizens
and local officials about key areas of development and service delivery that matter most to them
in their lives and work. This enabled the research team, during a workshop in Mvomero and
Kigoma-Ujiji in 2015, to draw out a long list of potential indicators for a prototype LGPI.
These indicators were broadly under the headings of: physical infrastructure; social services;
livelihoods and resources; and political processes as summarized in figure 2 below. The interactive
research process then led the research team to return to the Districts (wards, villages and
citizens) to refine the long list of indicators through a discursive and interactive process, and to
then test a shorter list of indicators through baseline data collection.

12
Figure 2: Proposed indicators for use in a Local Governance Performance Index
Roads Power Water
Health care Welfare Education Justice
Land Farming Livestock
Effectiveness Representation
So
cia
l S
erv
ices
L
iveli
ho
od
s
& R
eso
urc
es
Po
liti
cal
In
frast
ruct
ure
13
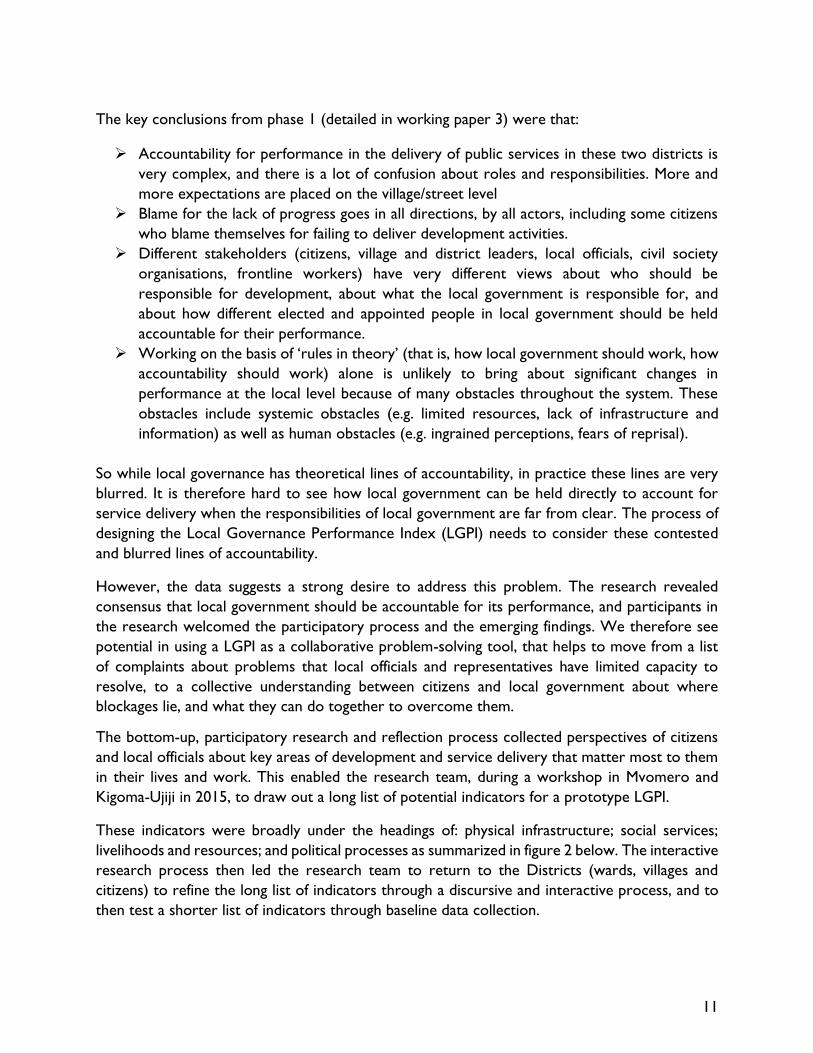
3 Selecting the final list of indicators for the pilot LGPI
The aim of phase 2 was to refine the long-list of indicators and gather baseline data. An additional
aim of phase 2 was to trigger a process of sharing the phase 1 findings while stimulating a
collaborative and engaging dialogue, so that the district council (DC), civil society organizations
(CSOs), councillors and citizens could explore ways to adopt and adapt the process.
From November 2016 to March 2017 further research was conducted in both Districts in the
form of interactive and discursive workshops with key stakeholders. Additional focused group
discussions (FGD) and interviews also took place in the villages with a purposive sample of the
original interviewees. The overall purpose of this consultation was to refine the long list of
indicators of local governance to a shorter list on which baseline data could be gathered.
The process asked two fundamental sets of questions:
• Which of these indicators are the right ones? Do they capture important elements of local
governance and service delivery, and also aspects of inclusive access to services? What is
the potential impact of the LGPI?
• What data is available? Can it be accessed and shared? If it is not already available, how
will it be gathered and shared?
Table 2 outlines the multiple methods of data collection used in this phase.
Table 2: Data collection for phase 2
Level Sampling Methods Numbers
District – elected
councillors & MPs
Key informants Interactive workshop
1 in each district
(9-10 individuals in
each)
District – officials Key informants Interactive workshop
1 in each district
District – civil society
representatives
Key informants Interactive workshop 1 in each district
(numbers: 9 & 10)
Village – community
respondents (citizens and
village leaders)
Purposive, diversity of age,
religion; disaggregated by
gender
Two villages/streets in
each district (4 sites in
total) – selected from the
original 4 for accessibility
and follow-up purposes
Focused group
discussions
1 males; 1 females; 1
village leaders
(3 FGDs in each
village/street)
Numbers: 8-11
people in each FGD

14
3.1 Resolving challenges for the LGPI approach
Conducting this type of interactive research requires that research assistants (RA) are themselves
active and engaged researchers, capable of facilitating a discussion in relation to the wider
research aims. Therefore, the RAs must be more than enumerators, and so require considerable
training and orientation. Throughout this research, we have worked with at least four active and
locally-based RAs. Their local knowledge and the trust that they have built in the Districts is an
important component of this approach.
One of the challenges for some of the RAs was to be facilitators and not trainers during FGDs
and workshops. RAs sometimes struggled with the idea of only facilitating the discussion without
trying to educate participants on the subject of local governance, e.g. who should be part of the
local government, or what is accountability. They also had to overcome nervousness from
respondents about not giving the answers they thought the RAs were expecting or wanting.
respondents. Some RAs also struggled to write up the notes in English in such a short period.
The workshops were in KiSwahili and some words have a very different meaning in English and
do not make sense in direct translation.
Although the FGDs in general were very participatory and interactive, there were some tensions
between groups who have in the past been ready to blame each other for weak service delivery,
notably District Officials and Civil Society organisations. District Councillors also appeared to be
highly aware of their own power within the locality and keen to demonstrate it. This experience
does not mean that the councillors were not committed or did not want the project; it is just a
way that they will often use to show they are the ones in power.
The greatest difficulty of refining the indicators occurred not because most stakeholders did not
approve of the proposed indicators, but because most of these stakeholders have an embedded
mentality of ‘empowering ‘the citizens. For example, it was very difficult to get the CSO
participants to understand why the indicators might also include questions for local government
on their capacity. Most CSO respondents appear to believe that if citizens are not ‘empowered’
then the indicators will not lead to change, nor will development take place. There is very little
understanding that even the most empowered citizens can only claim what is available.
There are also many layers of issues that can lead to failure in this model of accountability. Among
them are the capacity and competence challenges of the local government, such as councillors
and village leaders (all untrained and unpaid) and the lack of resources. One civil servant in Kigoma
explained; “It is a duty of a local leader to fulfill his/her responsibilities by evoking positive results through
availability of resources; scarcity of resources may hinder the whole process of being accountable.”
The workshops and FGDs made visible the necessity of bringing different stakeholders together
to understand why a service or responsibility is not delivered, rather than having a list of
complaints of what government did not do according to policy.
15
The workshops also emphasized the limitations of the CSO approach in current practice. CSOs
reported that they tend to end up resolving an issue in parallel with local governance structures.
For example, the locals complain about the lack of clean water, and a CSO organizes a meeting
between citizens and councillors so that they can raise their concerns. Councillors might act on
this one incident; however, the structure in place, such as village leadership, is not part of the
process and leaders cannot learn to use the same technique in the future. The CSOs’ approach
resolves the immediate issue but struggles with sustainability of the project, meaning that when
the funding ends then the support from CSOs ends too.
Some participants in the workshops expressed high expectations for the LGPI. However, without
local engagement in the problem-solving process and tracking of indicators, change is unlikely to
be generated.
3.2 The process of refining and agreeing the indicators
The project and particularly the indicators were welcomed by all stakeholders following a process
of building shared understanding of the findings from phase 1 of the research.
The long-term and iterative nature of this research has built trust in the process, as one
participant in Kigoma said, “These researchers are serious on the issue we discussed here, since last
month I met with them and most of the questions you find on indicators were there in phase one as the
facilitator said.” There was a feeling of hope and trust among stakeholders that this project could
lead to improvement of social services, as they saw issues raised in phase 1 reflected in the
proposed list of indicators.
The interactive discussions to refine the indicators were based on three principles:
• As much as possible, indicators need to link directly to the responsibility of local
government. For example, the provision of electricity services as a whole is not in the
remit of local government. However, the extent to which water and electricity are
available within public institutions such as schools and health centres does relate to the
powers of local government
• Indicators should draw attention to issues of inclusion, e.g. political representation of
women, or access of the poorest to social services
• Data can be gathered in relation to the proposed indicator within the scope of the project,
and within the means of local institutions after the project ends.
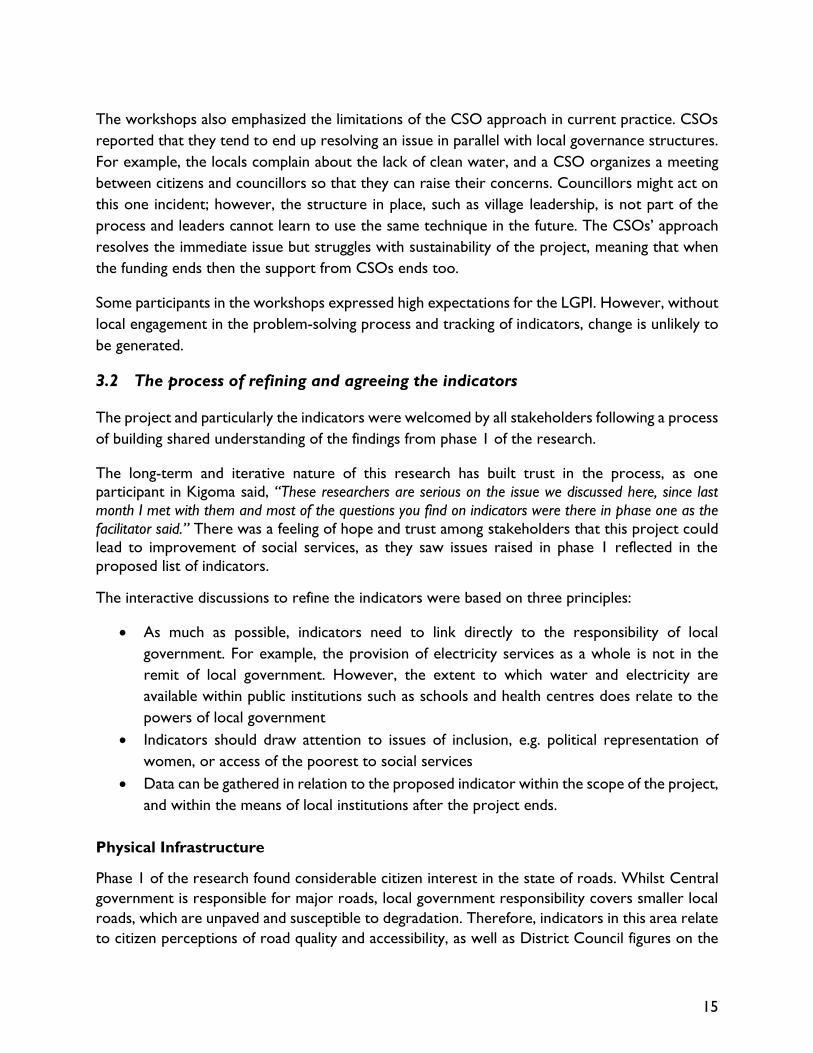
Physical Infrastructure
Phase 1 of the research found considerable citizen interest in the state of roads. Whilst Central
government is responsible for major roads, local government responsibility covers smaller local
roads, which are unpaved and susceptible to degradation. Therefore, indicators in this area relate
to citizen perceptions of road quality and accessibility, as well as District Council figures on the
16
state of their roads. We also recognize the challenge for local government relating to whether
they receive centrally allocated resources for road building by the mid-point of the financial year.
In relation to electricity and other power, the main measure for local government relates to the
connections for public institutions, with further indicators on the proportions of different power
sources, and the affordability of energy sources.
Local government have clear remits in relation to drinking water provision, but are still dependent
on central budgets for resource allocations. Therefore, understanding what proportion of the
budget is received by the mid-point of the financial year provides an indication of how much
resource local government has to act. Statistics on the state of District level access to clean water
should be available, and can be cross-checked against a perception survey of citizens on the safety,
reliability and affordability of water.
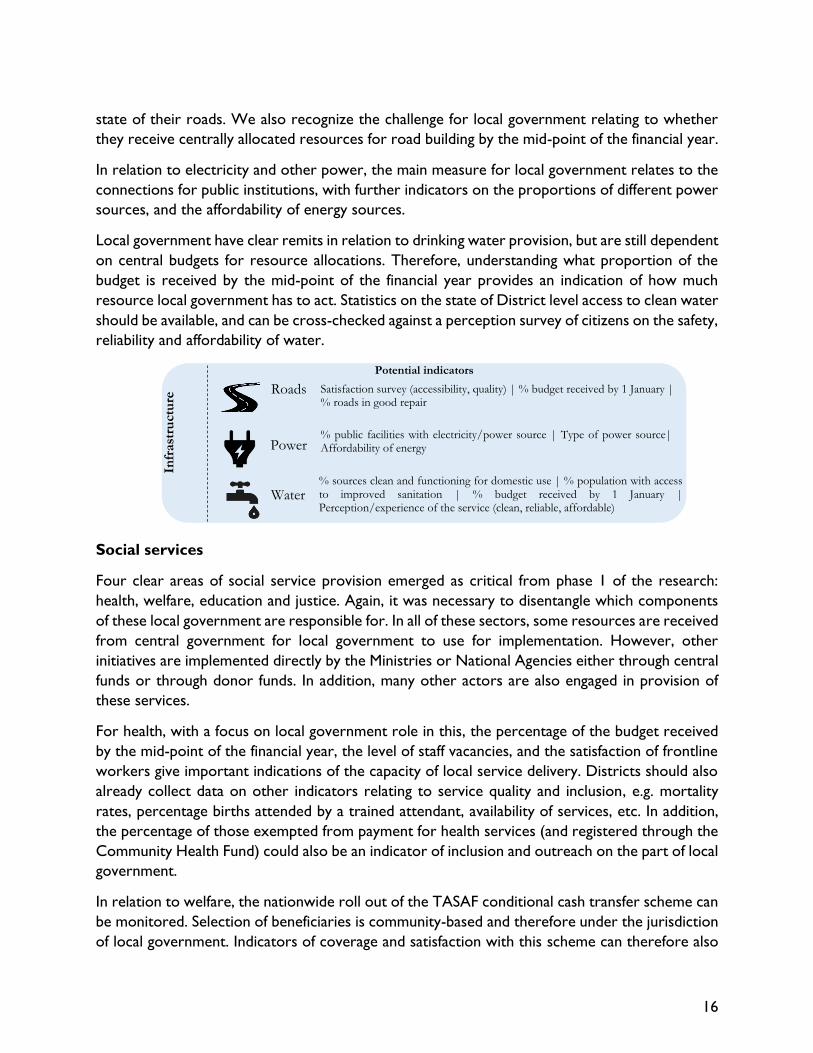
Social services
Four clear areas of social service provision emerged as critical from phase 1 of the research:
health, welfare, education and justice. Again, it was necessary to disentangle which components
of these local government are responsible for. In all of these sectors, some resources are received
from central government for local government to use for implementation. However, other
initiatives are implemented directly by the Ministries or National Agencies either through central
funds or through donor funds. In addition, many other actors are also engaged in provision of
these services.
For health, with a focus on local government role in this, the percentage of the budget received
by the mid-point of the financial year, the level of staff vacancies, and the satisfaction of frontline
workers give important indications of the capacity of local service delivery. Districts should also
already collect data on other indicators relating to service quality and inclusion, e.g. mortality
rates, percentage births attended by a trained attendant, availability of services, etc. In addition,
the percentage of those exempted from payment for health services (and registered through the
Community Health Fund) could also be an indicator of inclusion and outreach on the part of local
government.
In relation to welfare, the nationwide roll out of the TASAF conditional cash transfer scheme can
be monitored. Selection of beneficiaries is community-based and therefore under the jurisdiction
of local government. Indicators of coverage and satisfaction with this scheme can therefore also
Roads
Power
Water
Infr
ast
ruct
ure
Satisfaction survey (accessibility, quality) | % budget received by 1 January | % roads in good repair
Potential indicators
% public facilities with electricity/power source | Type of power source| Affordability of energy
% sources clean and functioning for domestic use | % population with access to improved sanitation | % budget received by 1 January | Perception/experience of the service (clean, reliable, affordable)
17
provide insights into its operation. The ability of local government to coordinate the activities of
NGOs/CBOs is also a local government responsibility and so could be tracked through the
percentage of reports received by local government.
In education, the Ministry of Education remains responsible for staff recruitment; however, local
government can track the percentage of staff vacancies, facilities available in schools, as well as
pass and completion rates disaggregated by gender and potentially by income group. The
satisfaction of frontline staff can also be tracked. Citizen satisfaction with education services can
also be tracked, and particularly the issue of extra contributions required for school attendance.
The area of justice is complex. For example, policing is not the responsibility of local government,
however peace and security at community level is. Community level courts also operate in co-
operation with local government structures. For these reasons, indicators are restricted to citizen
perceptions and experiences of local courts, peace and security, and of corruption. Such
indicators could provide a starting point to localized discussions, for example on the performance
of local courts, and particular challenges to peace and security, e.g. the violence between
pastoralists and farmers in Mvomero.
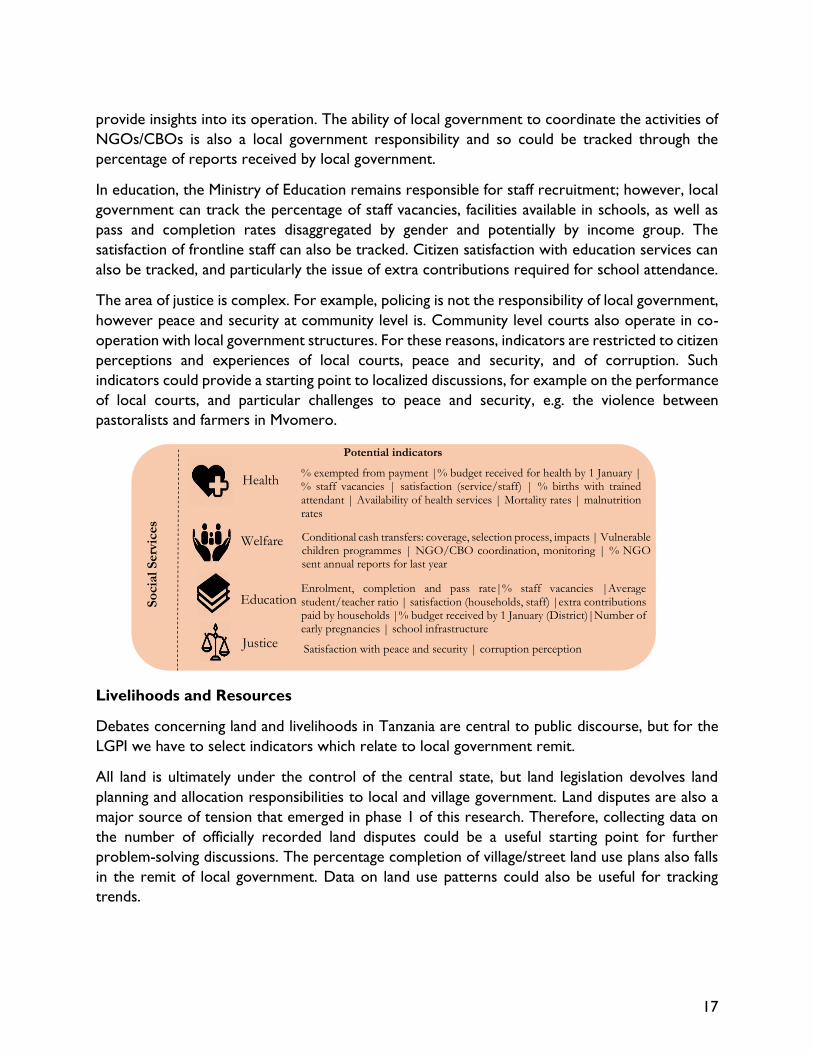
Livelihoods and Resources
Debates concerning land and livelihoods in Tanzania are central to public discourse, but for the
LGPI we have to select indicators which relate to local government remit.
All land is ultimately under the control of the central state, but land legislation devolves land
planning and allocation responsibilities to local and village government. Land disputes are also a
major source of tension that emerged in phase 1 of this research. Therefore, collecting data on
the number of officially recorded land disputes could be a useful starting point for further
problem-solving discussions. The percentage completion of village/street land use plans also falls
in the remit of local government. Data on land use patterns could also be useful for tracking
trends.
Health
Welfare
Education
Justice
So
cia
l S
erv
ices
Potential indicators
% exempted from payment |% budget received for health by 1 January | % staff vacancies | satisfaction (service/staff) | % births with trained attendant | Availability of health services | Mortality rates | malnutrition rates
Enrolment, completion and pass rate|% staff vacancies |Average student/teacher ratio | satisfaction (households, staff) |extra contributions paid by households |% budget received by 1 January (District)|Number of early pregnancies | school infrastructure
Conditional cash transfers: coverage, selection process, impacts | Vulnerable children programmes | NGO/CBO coordination, monitoring | % NGO sent annual reports for last year
Satisfaction with peace and security | corruption perception
18
In relation to livelihoods, local government does hold some responsibility for local economic
development, and employs agricultural extension workers. Therefore, indicators of their capacity
are important, such as whether they have access to transport. Further areas include what
percentage of the budget is received by local government from central government, and what
data is collected on agricultural production. A perception and experience survey of citizens can
also reveal access to inputs, such as the government voucher scheme, and the availability of water
for irrigation. This set of indicators requires adaption to the livelihoods in the local context, and
to recognize dynamics of poverty. For example, tracking the size of land holdings over time might
highlight where land grabbing is taking place. In Kigoma-Ujiji, tracking the number of fisheries
extension officers would have more importance than agricultural extension workers. Additional
indicators could also relate to the collection of local taxation from businesses.
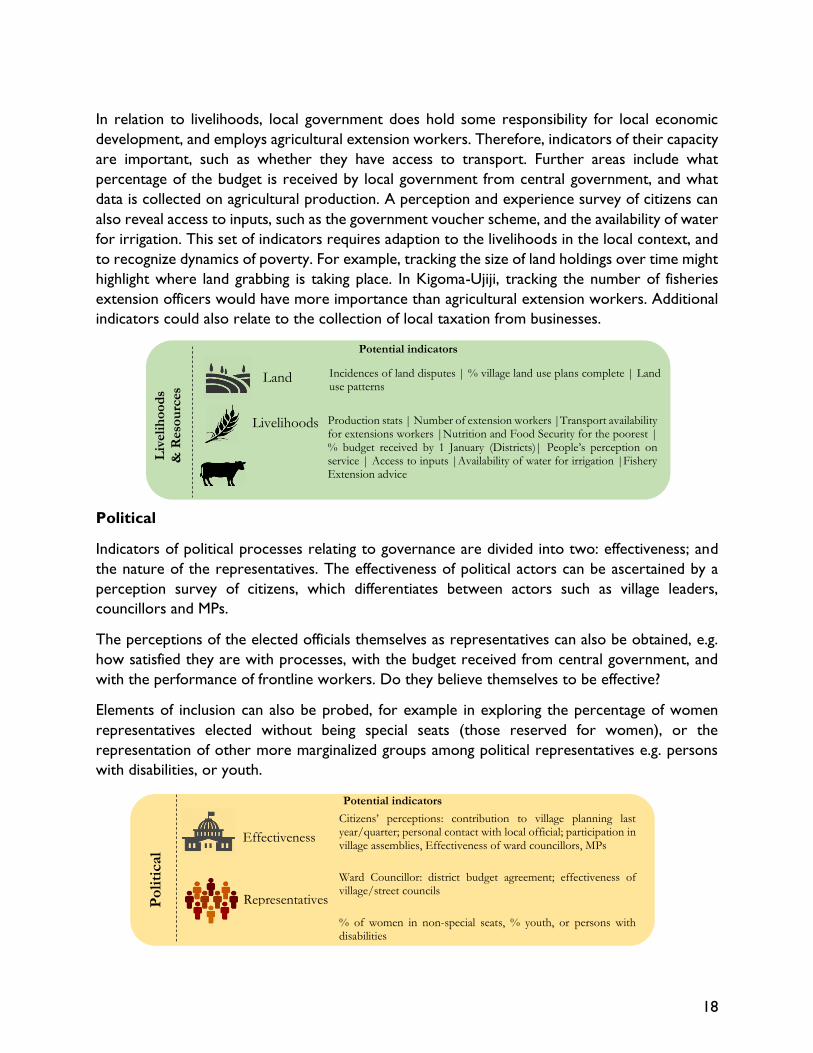
Political
Indicators of political processes relating to governance are divided into two: effectiveness; and
the nature of the representatives. The effectiveness of political actors can be ascertained by a
perception survey of citizens, which differentiates between actors such as village leaders,
councillors and MPs.
The perceptions of the elected officials themselves as representatives can also be obtained, e.g.
how satisfied they are with processes, with the budget received from central government, and
with the performance of frontline workers. Do they believe themselves to be effective?
Elements of inclusion can also be probed, for example in exploring the percentage of women
representatives elected without being special seats (those reserved for women), or the
representation of other more marginalized groups among political representatives e.g. persons
with disabilities, or youth.
Land
Livelihoods
Liv
eli
ho
od
s
& R
eso
urc
es
Potential indicators
Incidences of land disputes | % village land use plans complete | Land use patterns
Production stats | Number of extension workers |Transport availability for extensions workers |Nutrition and Food Security for the poorest | % budget received by 1 January (Districts)| People’s perception on service | Access to inputs |Availability of water for irrigation |Fishery Extension advice
Effectiveness
Po
liti
cal
Citizens’ perceptions: contribution to village planning last year/quarter; personal contact with local official; participation in village assemblies, Effectiveness of ward councillors, MPs
Ward Councillor: district budget agreement; effectiveness of village/street councils
% of women in non-special seats, % youth, or persons with disabilities
Representatives
Potential indicators

19
3.3 What data is already available?
The sustainable operation of the LGPI process cannot be based on an expensive data set, as this
will be a major impediment to its use. Therefore, an LGPI should begin with the data that is
already available in the Districts, wards and villages, and where necessary use a simple survey of
frontline workers and citizens to fill gaps.
There was some concern from workshop participants as to the reliability and trustworthiness of
existing data sources:
“We appreciate the way you have introduced us to the activities of the last phase of this project and we
have understood. These indicators can measure the performance of local government. I am doubtful
whether we will find a reliable ‘person or institution’ who will have the ability/capacity to bring us ‘true’
information – data that are not manipulated!”
Male FGD, Kigoma, general comments
“That is because the reports are produced by the leaders themselves. If this information is from an
independent source, it will show the difference and will be trusted by the citizens.”
Male FGD, Kigoma, general comments
However, most of the stakeholders who commented on the indicators confirmed that we could
collect data for all the indicators listed, and they suggested the following:
“Directors of departments are at the ward level and going to their offices, the information can be accessible
… At the village level, there are different committees and one of them is the water committee formed by
the citizens themselves. They have all the information and you can access it any time it is needed.”
Councillors, Mvomero FGD
3.4 Will making these indicators public will lead to an improvement in services?
Most participants believe that these indicators will lead to an improvement in services for several
reasons: they will create more transparency, start the conversation among the local government
and motivate local governments to act, as they will be aware that people are watching their
actions.
The view that more information will allow people to speak up and hold people to account is
frequently articulated:
“All indicators mentioned directly touch the life of the Vitonga people, and bring a clear picture of what
we need. If these indicators are made public it will help to improve services and hence bring development.”
Vitonga, village leaders FGD

20
“Openness will help in improving social services because silence will have been broken and people will
have the reason to speak up. Also, those who are in a position to provide services will know that all their
actions are all open and being monitored by the public.”
Male FGD, Kigoma
“These indicators show what we need at Mziha. I was very happy when I saw the list, because here at
Mziha we get a lot of problems in our dispensary, especially pregnant women, when you go there at night
the watchman might help you to deliver the baby because when people go to the nurse tells us to ask if
you have 40,000 Tshs; this is to all patients, including those patients who have CHF and those who have
not. If you don’t have that money, that nurse used to tell you to go to Bwagala hospital about 15–20 km
from here.”
Female FGD, Mziha
However, there is also the recognition that the set of indicators can act as a baseline and
startingstarting point for problem-solving:
“Having the indicators will be like the baseline to use in their meetings, stressing services which could be
provided by the district office … At present, there is no baseline to work from to ask and they just discuss
each matter as it comes.”
CSO FGD, Mvomero
Participants also articulate that strong leadership will be required for the index to be adopted
and implemented:
“When our councillor or MP sees these indicators, I believe it will help him wake up and do something.
From the indicators, I believe that when seen by our MP or councillor these indicators will help to give
them a starting point on the way to bringing development in our village. For me, I think these indicators
should be put on the radio and in newspapers, which will help to remind our leaders. I say this because
they have not been to visit us in our village.”
Female FGD, Vitonga
“Making these indicators public is not a problem, but the challenge comes from our leaders, especially
councillors and MPs who fail to come to visit us.”
Male FGD, Vitonga
The outcome from phase 2 was a refined set of indicators on which data could be sought to
create a baseline. More critically, the process again revealed the need to work on mechanisms
for collaborative problem-solving, and that the refining of the indicators had also met a secondary
need of at least setting out the assumptions of different stakeholders. There remains a high level
of distrust and blame between different stakeholders within the system, but again it points to the
potential of the LGPI to perform a role in making visible lines of blame and accountability in order
to begin a collective process of problem solving.
21
4 Baseline Data – the next step in a process
The final step in the research process was to collect a baseline set of data. Our original intention
had been to collect the baseline at an earlier stage and attempt to repeat the process at least
once (after one year) in order to understand processes of change. However, the dynamics of an
election year in Tanzania, and the contested nature of blame and accountability, meant that the
initial process took much longer than anticipated. As a project, we could have designed and
created a set of indicators quickly and easily in a workshop in Dar-es-Salaam, and then simply
collected data on them, without the complexity of an iterative process in the Districts. However,
such a process would not then have the potential to stimulate a collaborative problem-solving
process.
4.1 What is this baseline for?
The baseline is for the Districts to initiate the next step in a conversation. Mzumbe University
and the Foundation for Civil Society in Tanzania will continue to support this process in Mvomero
and Kigoma-Ujiji Districts when this particular research phase is complete.
Baseline data collection
There are three key sources of data for the baseline index:
1. Citizen perception survey relating to the indicators set out in section 3. This was limited
to 100 randomly selected respondents (from our original villages/streets) for this initial
phase in order to pilot and progress the research. However, the sample should be bigger
in later iterations to ensure statistical validity. The perception survey covers all the areas
outlined in the indicator set in section 3.
2. Frontline worker survey using a purposive sample of frontline personnel in different areas
of local government. It is envisaged that such a survey could cover all workers in later
iterations.
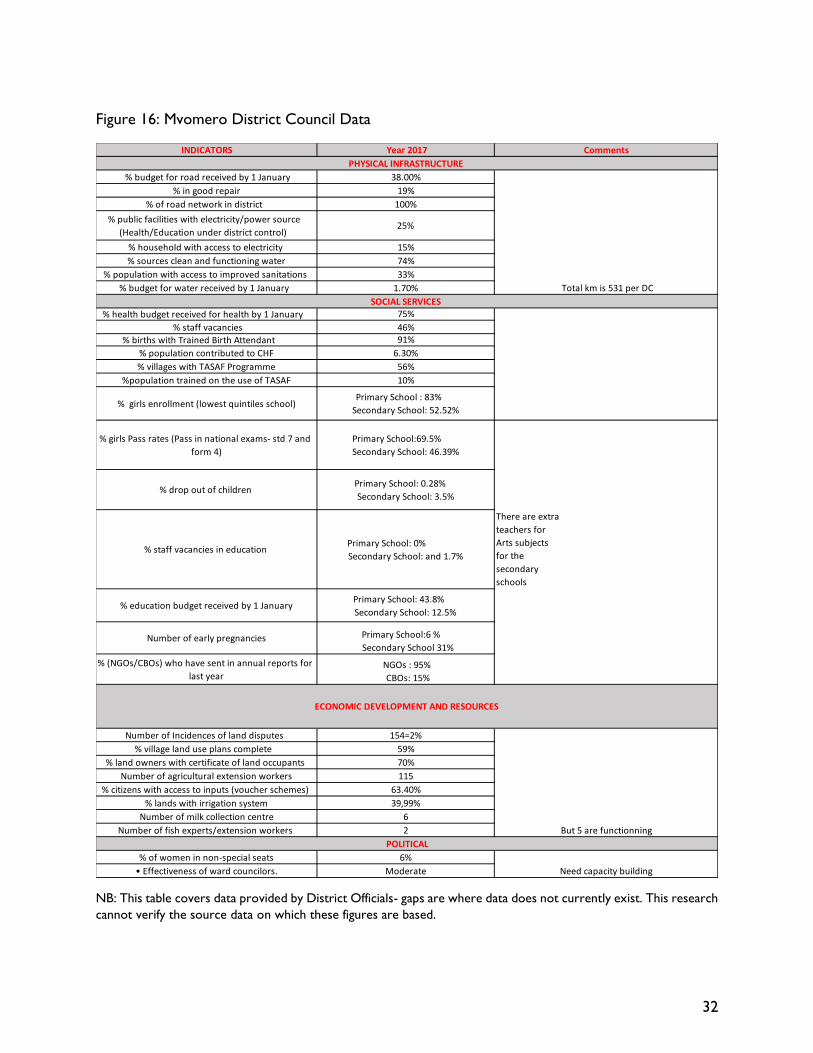
3. Collection of existing District Council, ward and village data for the 2015/6 year. This first
baseline allows us to assess what information exists in relation to the baseline. Figures 9
and 16 show there are gaps in the information held by District Councils. Note that this
research cannot verify the data sources on which these figures are based.
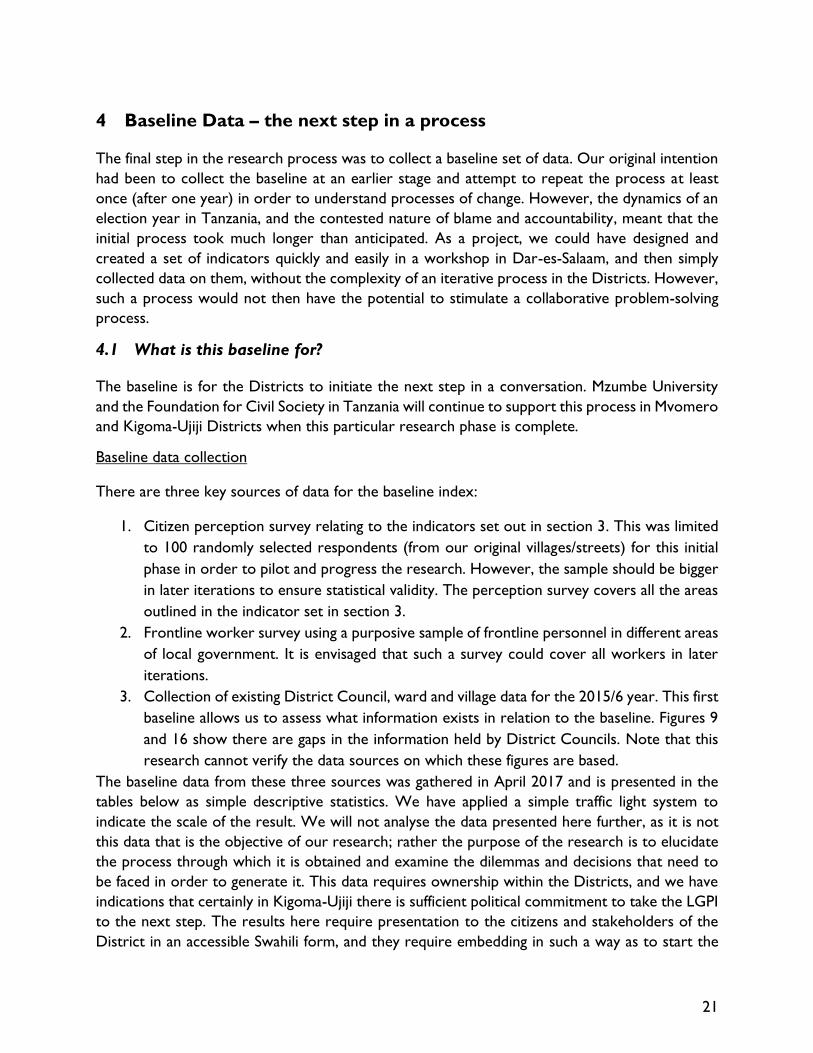
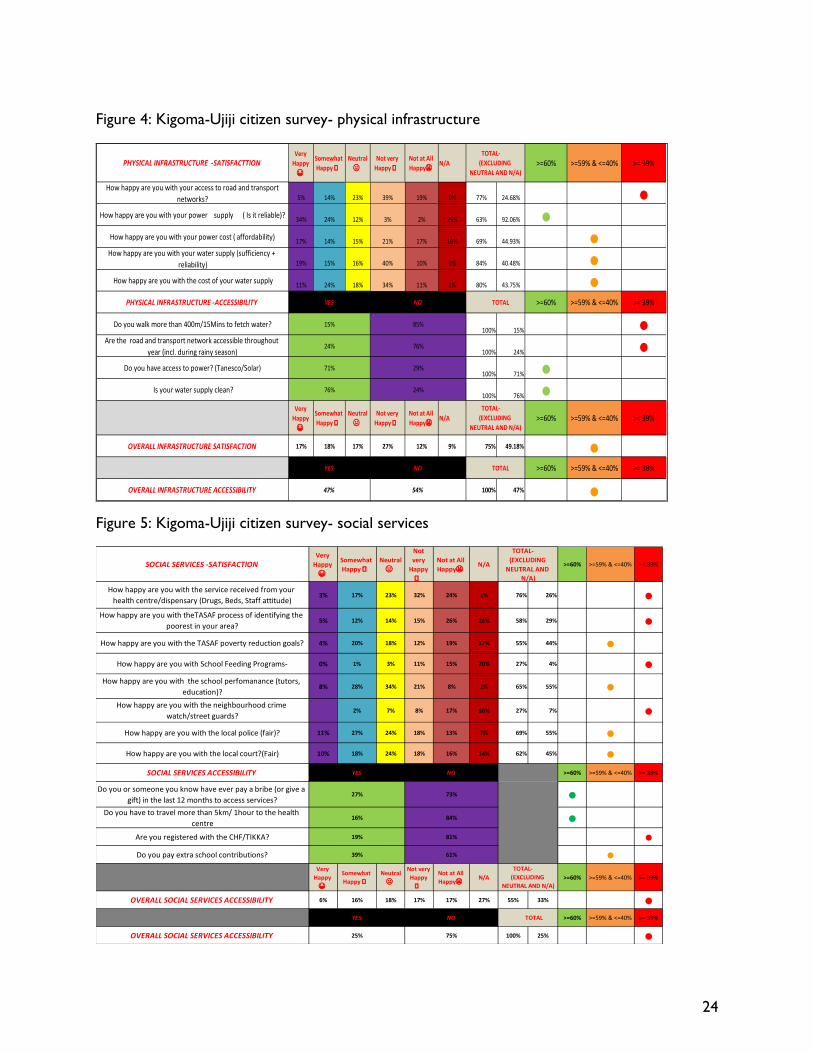
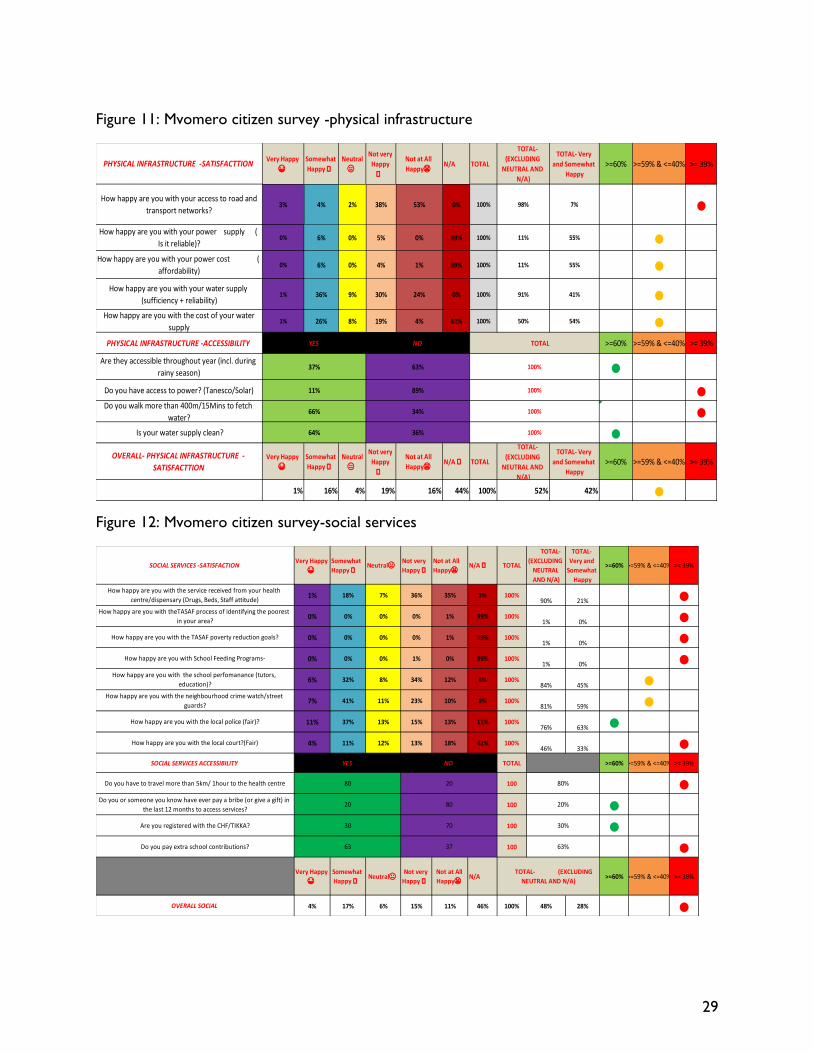
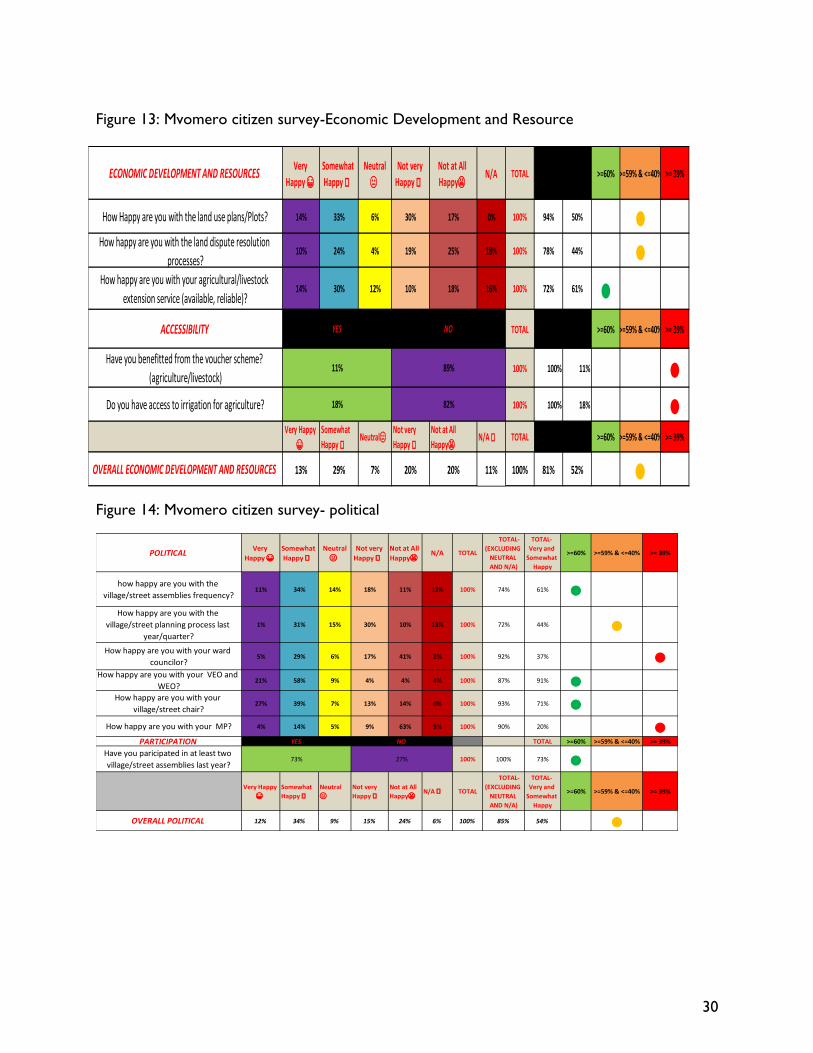
The baseline data from these three sources was gathered in April 2017 and is presented in the
tables below as simple descriptive statistics. We have applied a simple traffic light system to
indicate the scale of the result. We will not analyse the data presented here further, as it is not
this data that is the objective of our research; rather the purpose of the research is to elucidate
the process through which it is obtained and examine the dilemmas and decisions that need to
be faced in order to generate it. This data requires ownership within the Districts, and we have
indications that certainly in Kigoma-Ujiji there is sufficient political commitment to take the LGPI
to the next step. The results here require presentation to the citizens and stakeholders of the
District in an accessible Swahili form, and they require embedding in such a way as to start the

22
process of collective problem-solving. For example, in Kigoma-Ujiji frontline workers appear to
be quite dissatisfied and this could be a focus for beginning a process of collective problem solving
on this issue.
Figures 3 and 10 set out an overview of the citizen perception survey across the four sets of
indicators in Kigoma-Ujiji and Mvomero Districts respectively. We have introduced a crude
colour coding to indicate the level of the result. Figures 4 through to 7 set out the detail of the
four indicator sets in Kigoma-Ujiji, and 11 through to 14 for Mvomero.
Figures 8 and 15 provide an overview of the results of the frontline worker surveys
in Kigoma-Ujiji and Mvomero; and finally, Figures 9 and 16 provide an overview of
District Council data supplied in relation to the indicators set. Gaps in these figures
indicate that data was not provided by the District Council or was not available.

23
Figure 3: Overview of Citizen Perception Survey- Kigoma Ujiji April 2017
Very Happy 😁Somewhat
Happy 🙂Neutral😐
Not very Happy
🙂
Not at All
Happy😠
Not Applicable
🙂TOTAL YES NO
5 14 23 39 19 0 100
100 YES NO
100 YES NO
34 24 12 3 2 25 100
17 14 15 21 17 16 100
19 15 16 40 10 100
100 YES NO
11 24 18 34 11 2 100
100 YES NO
Very Happy 😁Somewhat
Happy 🙂Neutral😐
Not very Happy
🙂
Not at All
Happy😠
Not Applicable
🙂TOTAL
3 17 23 32 24 1 100
100 YES NO
100 YES NO
5 12 14 15 26 28 100
4 20 18 12 19 27 100
100 YES NO
1 3 11 15 70 100
8 28 34 21 8 1 100
2 7 8 17 66 100
11 27 24 18 13 7 100
10 18 24 18 16 14 100
100 YES NO
Very Happy 😁Somewhat
Happy 🙂Neutral😐
Not very Happy
🙂
Not at All
Happy😠
Not Applicable
🙂TOTAL
8 33 13 20 13 13 100
8 17 19 21 14 21 100
1 7 15 8 9 60 100
100 YES NO
100 YES NO
5 12 15 11 9 48 100
Very Happy 😁Somewhat
Happy 🙂Neutral😐
Not very Happy
🙂
Not at All
Happy😠
Not Applicable
🙂TOTAL
100 YES NO
13 28 29 19 10 1 100
4 26 17 34 17 2 100
28 33 11 17 11 100
19 33 26 13 7 2 100
51 24 11 8 6 100
14 24 16 22 22 2 100
1 99
0 100
58 42
39 61
27 73
19 81
76 24
15 85
16 84
How happy are you with your power cost
(affordability)
24 76
71 29
PHYSICAL INFRASTRUCTURE
How happy are you with your access to road and
transport networks?
Are they accessible throughout year (incl.
during rainy season)
Do you have access to power? (Tanesco/Solar)
How happy are you with your power supply (
Is it reliable)?
Do you have access to irrigation for agriculture?
How happy are you with School Feeding Programs-
How happy are you with your water supply
(sufficiency + reliability)
Is your water supply clean?
How happy are you with the cost of your water
supply
Do you walk more than 400m/15Mins to fetch
water?
SOCIAL SERVICES
How happy are you with the service received from
your health centre/dispensary (Drugs, Beds, Staff
attitude)Do you have to travel more than 5km/ 1hour to the
health centre
Are you registered with the CHF/TIKKA?
How happy are you with theTASAF process of
identifying the poorest in your area?
How happy are you with the TASAF poverty
reduction goals?
Do you pay extra school contributions?
ECONOMIC DEVELOPMENT AND RESOURCES
How Happy are you with the land use plans/Plots?
How happy are you with the land dispute
resolution processes?
How happy are you with your agricultural/livestock
extension service (available, reliable)?
Have you benefitted from the voucher scheme?
(agriculture/livestock)
How happy are you with your village/street chair?
How happy are you with your MP?
POLITICAL
Have you participated in at least two village/street
assemblies last year?
how happy are you with the village/street
assemblies frequency?
How happy are you with the village/street planning
process last year/quarter?
How happy are you with your ward councillor?
How happy are you with your VEO and WEO?
How happy are your fish experts (available,
reliable)?
How happy are you with the school perfomanance
(tutors, education)?
How happy are you with the neighbourhood crime
watch/street guards?
How happy are you with the local police (fair)?
How happy are you with the local court?(Fair)
Do you or someone you know have ever pay a
bribe (or give a gift) in the last 12 months to access
services?
24
Figure 4: Kigoma-Ujiji citizen survey- physical infrastructure
Figure 5: Kigoma-Ujiji citizen survey- social services
Very
Happy
😁
Somewhat
Happy 🙂
Neutral
😐
Not very
Happy 🙂
Not at All
Happy😠N/A >=60% >=59% & <=40% >= 39%
5% 14% 23% 39% 19% 0% 77% 24.68% =
34% 24% 12% 3% 2% 25% 63% 92.06% =
17% 14% 15% 21% 17% 16% 69% 44.93% =
19% 15% 16% 40% 10% 0% 84% 40.48% =
11% 24% 18% 34% 11% 2% 80% 43.75% =>=60% >=59% & <=40% >= 39%
100% 15% =
100% 24% =
100% 71% =
100% 76% =Very
Happy
😁
Somewhat
Happy 🙂
Neutral
😐
Not very
Happy 🙂
Not at All
Happy😠N/A >=60% >=59% & <=40% >= 39%
17% 18% 17% 27% 12% 9% 75% 49.18% =>=60% >=59% & <=40% >= 39%
100% 47% =
TOTAL-
(EXCLUDING
NEUTRAL AND N/A)
TOTAL
TOTAL-
(EXCLUDING
NEUTRAL AND N/A)
TOTALYES NO
How happy are you with the cost of your water supply
PHYSICAL INFRASTRUCTURE -SATISFACTTION
How happy are you with your access to road and transport
networks?
How happy are you with your power supply ( Is it reliable)?
How happy are you with your power cost ( affordability)
How happy are you with your water supply (sufficiency +
reliability)
PHYSICAL INFRASTRUCTURE -ACCESSIBILITY YES NO
Do you walk more than 400m/15Mins to fetch water? 15% 85%
Are the road and transport network accessible throughout
year (incl. during rainy season)24% 76%
OVERALL INFRASTRUCTURE SATISFACTION
OVERALL INFRASTRUCTURE ACCESSIBILITY 47% 54%
Do you have access to power? (Tanesco/Solar) 71% 29%
Is your water supply clean? 76% 24%
Very
Happy
😁
Somewhat
Happy 🙂
Neutral
😐
Not
very
Happy
🙂
Not at All
Happy😠N/A >=60% >=59% & <=40% >= 39%
3% 17% 23% 32% 24% 1% 76% 26% =
5% 12% 14% 15% 26% 28% 58% 29% =
4% 20% 18% 12% 19% 27% 55% 44% =
0% 1% 3% 11% 15% 70% 27% 4% =
8% 28% 34% 21% 8% 1% 65% 55% =
2% 7% 8% 17% 66% 27% 7% =
11% 27% 24% 18% 13% 7% 69% 55% =
10% 18% 24% 18% 16% 14% 62% 45% =
>=60% >=59% & <=40% >= 39%
=
=
=
=Very
Happy
😁
Somewhat
Happy 🙂
Neutral
😐
Not very
Happy
🙂
Not at All
Happy😠N/A >=60% >=59% & <=40% >= 39%
6% 16% 18% 17% 17% 27% 55% 33% =
>=60% >=59% & <=40% >= 39%
100% 25% =
TOTAL
TOTAL-
(EXCLUDING
NEUTRAL AND
N/A)
TOTAL-
(EXCLUDING
NEUTRAL AND N/A)
How happy are you with the local court?(Fair)
SOCIAL SERVICES -SATISFACTION
How happy are you with the service received from your
health centre/dispensary (Drugs, Beds, Staff attitude)
How happy are you with theTASAF process of identifying the
poorest in your area?
How happy are you with the TASAF poverty reduction goals?
How happy are you with School Feeding Programs-
How happy are you with the school perfomanance (tutors,
education)?
How happy are you with the neighbourhood crime
watch/street guards?
How happy are you with the local police (fair)?
SOCIAL SERVICES ACCESSIBILITY YES NO
Do you or someone you know have ever pay a bribe (or give a
gift) in the last 12 months to access services?27% 73%
Do you have to travel more than 5km/ 1hour to the health
centre16% 84%
Are you registered with the CHF/TIKKA? 19% 81%
Do you pay extra school contributions? 39% 61%
OVERALL SOCIAL SERVICES ACCESSIBILITY
OVERALL SOCIAL SERVICES ACCESSIBILITY 25% 75%
YES NO

25
Figure 6: Kigoma-Ujiji citizen survey- economic development and resources
Figure 7: Kigoma-Ujiji citizen survey- political
Very
Happy 😁
Somewhat
Happy 🙂
Neutral
😐
Not very
Happy 🙂
Not at All
Happy😠N/A
TOTAL
EXCLUDING
NEUTRAL AND
N/A
>=60% >=59% & <=40% >= 39%
8% 33% 13% 20% 13% 13%55% =
8% 17% 19% 21% 14% 21%42% =
1% 7% 15% 8% 9% 60%
32% =
5% 12% 15% 11% 9% 46%46% =
TOTAL >=60% >=59% & <=40% >= 39%
1% =
1% =
Very
Happy 😁
Somewhat
Happy 🙂
Neutral
😐
Not very
Happy 🙂
Not at All
Happy😠N/A
TOTAL EXCLUDING
NEUTRAL AND N/A>=60% >=59% & <=40% >= 39%
6% 17% 16% 15% 11% 35% 46% =TOTAL >=60% >=59% & <=40% >= 39%
1%=
How happy are your fish experts (available,
reliable)?
OVERALL ECONOMIC DEVELOPMENT AND
RESOURCES
ECONOMIC DEVELOPMENT AND
RESOURCES
How Happy are you with the land use
plans/Plots?
How happy are you with the land dispute
resolution processes?
How happy are you with your
agricultural/livestock extension service
(available, reliable)?
ACCESSIBILITY1% 100%
YES NO
Have you benefitted from the voucher
scheme? (agriculture/livestock)1% 99%
Do you have access to irrigation for
agriculture?0% 100%
ACCESSIBILITY
YES NO
Very Happy
😁
Somewhat
Happy 🙂Neutral😐
Not very
Happy 🙂
Not at All
Happy😠N/A >=60% >=59% & <=40% >= 39%
13% 28% 29% 19% 10% 1% 70% 59%
=
4% 26% 17% 34% 17% 2% 81% 37%
=
28% 33% 11% 17% 11% 0% 89% 69%=
19% 33% 26% 13% 7% 2% 72% 72%=
51% 24% 11% 8% 6% 0% 89% 84%=
14% 24% 16% 22% 22% 1% 82% 46% =
TOTAL >=60% >=59% & <=40% >= 39%
100% 58%=
Very Happy
😁
Somewhat
Happy 🙂Neutral😐
Not very
Happy 🙂
Not at All
Happy😠N/A >=60% >=59% & <=40% >= 39%
22% 28% 18% 19% 12% 1% 81% 61%=
TOTAL EXCLUDING
NEUTRAL AND
N/A. AVERAGE
ACCESSIBILITY
OVERALL POLITICAL
how happy are you with the village/street
assemblies frequency?
How happy are you with the village/street
planning process last year/quarter?
How happy are you with your ward councilor?
How happy are you with your VEO and WEO?
How happy are you with your village/street
chair?
How happy are you with your MP?
YES NO
Have you paricipated in at least two
village/street assemblies last year?58% 42%
POLITICAL
TOTAL EXCLUDING
NEUTRAL AND
N/A. AVERAGE

26
Figure 8: Kigoma-Ujiji Frontline worker survey
Very Happy
😁
Somewhat
Happy 🙂
Neutral
😐
Not very
Happy 🙂
Not at All
Happy😠
Not
Applicable
🙂
TOTAL >=60% >=59% & <=40% >= 39%
0% 14% 54% 11% 21% 0% 1 46% 31% =
0% 7% 46% 14% 29% 4% 1 50% 14% =
0% 14% 54% 18% 14% 0% 1 46% 31% =
7% 18% 32% 25% 18% 0% 1 68% 37% =how happy are you with the staff
training ?
Indicators
How happy are you with the road
in your work area?
How happy are you with your
salary/Allowance?
How happy are you with th work
equipment/facilities ?
TOTAL
EXCLUDING
NEUTRAL AND
N/A. AVERAGE
Very Happy 😁Somewhat
Happy 🙂Neutral😐
Not very
Happy 🙂
Not at All
Happy😠
Not Applicable
🙂TOTAL OCCUPATION TOTAL
0 4 15 3 6 0 28 Engineer1
0 2 13 4 8 1 28 Quantity Surveyor1
0 4 15 5 4 0 28 Electrical Technician2
2 5 9 7 5 0 28 Technician1
Water Engineer 1
Land Surveyor 1
Community
Development Officer 2
Town Planner II 1
Clinical Officer 1
Nurse 3
Head Master 1
Teacher 3
Police 2
Security Guard 2
Ward Executive Officer 1
Mtaa Executive Officer 2
Street Chairperson 1Agriculture Extension
Officer 1
Ward Livestock Officer 1
TOTAL 28
Indicators
How happy are you with the road in
your work area?
How happy are you with your
salary/Allowance?
How happy are you with th work
equipment/facilities ?
how happy are you with the staff
training ?

27
Figure 9: Kigoma-Ujiji District Council Data
NB- This table covers data provided by District Officials- gaps are where data does not currently exist. This
research cannot verify the source data on which these figures are based.
Number of fish experts/extension workers 4
POLITICAL
% of women in non-special seats
• Effectiveness of ward councilors.
% citizens with access to inputs (voucher schemes) 17.40%
% lands with irrigation system 2.10%
Number of milk collection centre N/A
% education budget received by 1 January
Number of Incidences of land disputes 1. Village land use plans relates to villages
and not Urban areas; 2.
Voucher imput relates to farmers and not
general citizens; 3.
Milk collection centers are still in the
formation stage
% village land use plans complete N/A
Number of early pregnancies 0.01%
% (NGOs/CBOs) who have sent in annual reports for
ECONOMIC DEVELOPMENT AND RESOURCES
% land owners with certificate of land occupants
Number of agricultural extension workers 8
% girls Pass rates (Pass in national exams- std 7 and
% drop out of children
% staff vacancies in education
72.10%
%population trained on the use of TASAF 24%
% girls enrollment (lowest quintiles school) 60%
% health budget received for health by 1 January 9% Tasaf refers to Households and not
Villages/Mtaa or Population % staff vacancies 9%
% population with access to improved sanitations
% budget for water received by 1 January
SOCIAL SERVICES
% births with Trained Birth Attendant 91.10%
% population contributed to CHF 0.30%
% villages with TASAF Programme
% sources clean and functioning water 98%
PHYSICAL INFRASTRUCTURE
% budget for road received by 1 January 28%
% in good repair 22%
% of road network in district
% public facilities with electricity/power source Health = 100%;
% household with access to electricity

28
Figure 10: Overview of Mvomero Citizen Survey, April 2017
Very Happy 😁Somewhat Happy 🙂Neutral😐Not very
Happy 🙂
Not at All
Happy😠N/A 🙂 TOTAL YES NO
3 4 2 38 53 0 100
100
100
0 6 0 5 0 89 100
0 6 0 4 1 89 100
1 36 9 30 24 0 100
100
1 26 8 19 4 42 100
100
Very Happy 😁Somewhat
Happy 🙂Neutral😐
Not very
Happy 🙂
Not at All
Happy😠N/A 🙂 TOTAL YES NO
1 18 7 36 35 3 100
100
100
0 0 0 0 1 99 100
0 0 0 0 1 99 100
100
0 0 0 1 0 99 100
6 32 8 34 12 8 100
7 41 11 23 10 8 100
11 37 13 15 13 11 100
4 11 12 13 18 42 100
100
Very Happy 😁Somewhat
Happy 🙂Neutral😐
Not very
Happy 🙂
Not at All
Happy😠N/A 🙂 TOTAL YES NO
14 33 6 30 17 0 100
10 24 4 19 25 18 100
14 30 12 10 18 16 100
100
100
0 0 0 0 0 100 100
Very Happy 😁Somewhat
Happy 🙂Neutral😐
Not very
Happy 🙂
Not at All
Happy😠N/A 🙂 TOTAL YES NO
100
11 34 14 18 11 12 100
1 31 15 30 10 13 100
5 29 6 17 41 2 100
21 58 9 4 4 4 100
27 39 7 13 14 0 100
4 14 5 9 63 5 100
Have you paricipated in at least two village/street
assemblies last year?73 27
80 20
30 70
63 37
How happy are you with the school perfomanance (tutors,
education)?
How happy are you with the neighbourhood crime
watch/street guards?
How happy are you with the local court?(Fair)
How happy are you with the local police (fair)?
How happy are you with School Feeding Programs-
20 80
11 89
18 82
37 63
64 36
66 34
11 89
SOCIAL SERVICES
How happy are you with your MP?
How happy are you with the village/street planning
process last year/quarter?
How happy are you with your ward councilor?
How happy are you with your VEO and WEO?
How happy are you with your village/street chair?
how happy are you with the village/street assemblies
frequency?
POLITICAL
Do you or someone you know have ever pay a bribe (or
give a gift) in the last 12 months to access services?
ECONOMIC DEVELOPMENT AND RESOURCES
How Happy are you with the land use plans/Plots?
How happy are you with the land dispute resolution
processes?
How happy are you with your agricultural/livestock
extension service (available, reliable)?
Have you benefitted from the voucher scheme?
(agriculture/livestock)
Do you have access to irrigation for agriculture?
How happy are your fish experts (available, reliable)?
Do you pay extra school contributions?
PHYSICAL INFRASTRUCTURE
How happy are you with your access to road and
transport networks?
Are they accessible throughout year (incl. during
rainy season)
How happy are you with your power supply ( Is it
reliable)?
How happy are you with your power cost ( affordability)
Do you have access to power? (Tanesco/Solar)
How happy are you with the service received from your
health centre/dispensary (Drugs, Beds, Staff attitude)
Do you have to travel more than 5km/ 1hour to the health
centre
Are you registered with the CHF/TIKKA?
How happy are you with theTASAF process of identifying
the poorest in your area?
How happy are you with the TASAF poverty reduction
goals?
How happy are you with your water supply (sufficiency +
reliability)
Is your water supply clean?
How happy are you with the cost of your water supply
Do you walk more than 400m/15Mins to fetch water?
29
Figure 11: Mvomero citizen survey -physical infrastructure
Figure 12: Mvomero citizen survey-social services
Very Happy
😁
Somewhat
Happy 🙂
Neutral
😐
Not very
Happy
🙂
Not at All
Happy😠N/A TOTAL
TOTAL-
(EXCLUDING
NEUTRAL AND
N/A)
TOTAL- Very
and Somewhat
Happy
>=60% >=59% & <=40% >= 39%
3% 4% 2% 38% 53% 0% 100% 98% 7% =
0% 6% 0% 5% 0% 89% 100% 11% 55% =
0% 6% 0% 4% 1% 89% 100% 11% 55% =
1% 36% 9% 30% 24% 0% 100% 91% 41% =
1% 26% 8% 19% 4% 42% 100% 50% 54% =>=60% >=59% & <=40% >= 39%
=
==
=Very Happy
😁
Somewhat
Happy 🙂
Neutral
😐
Not very
Happy
🙂
Not at All
Happy😠N/A 🙂 TOTAL
TOTAL-
(EXCLUDING
NEUTRAL AND
N/A)
TOTAL- Very
and Somewhat
Happy
>=60% >=59% & <=40% >= 39%
1% 16% 4% 19% 16% 44% 100% 52% 42% =
100%
TOTAL
PHYSICAL INFRASTRUCTURE -SATISFACTTION
How happy are you with your access to road and
transport networks?
How happy are you with your power supply (
Is it reliable)?
How happy are you with your power cost (
affordability)
How happy are you with your water supply
(sufficiency + reliability)
PHYSICAL INFRASTRUCTURE -ACCESSIBILITY
36% Is your water supply clean? 64%
OVERALL- PHYSICAL INFRASTRUCTURE -
SATISFACTTION
Do you walk more than 400m/15Mins to fetch
water?66% 34%
How happy are you with the cost of your water
supply
YES NO
100%
100%
100%
Do you have access to power? (Tanesco/Solar) 11% 89%
Are they accessible throughout year (incl. during
rainy season)37% 63%
Very Happy
😁
Somewhat
Happy 🙂Neutral😐
Not very
Happy 🙂
Not at All
Happy😠N/A 🙂 TOTAL
TOTAL-
(EXCLUDING
NEUTRAL
AND N/A)
TOTAL-
Very and
Somewhat
Happy
>=60% >=59% & <=40% >= 39%
1% 18% 7% 36% 35% 3% 100%90% 21% =
0% 0% 0% 0% 1% 99% 100%1% 0% =
0% 0% 0% 0% 1% 99% 100%1% 0% =
0% 0% 0% 1% 0% 99% 100%1% 0% =
6% 32% 8% 34% 12% 8% 100%84% 45% =
7% 41% 11% 23% 10% 8% 100%81% 59% =
11% 37% 13% 15% 13% 11% 100%76% 63% =
4% 11% 12% 13% 18% 42% 100%46% 33% =
TOTAL >=60% >=59% & <=40% >= 39%
100 =100 =100 =100 =
Very Happy
😁
Somewhat
Happy 🙂Neutral😐
Not very
Happy 🙂
Not at All
Happy😠N/A >=60% >=59% & <=40% >= 39%
4% 17% 6% 15% 11% 46% 100% 48% 28% =
TOTAL- (EXCLUDING
NEUTRAL AND N/A)
80%
20%
30%
63%
SOCIAL SERVICES ACCESSIBILITY YES NO
Do you pay extra school contributions? 63 37
How happy are you with the neighbourhood crime watch/street
guards?
How happy are you with the local police (fair)?
How happy are you with the local court?(Fair)
Do you have to travel more than 5km/ 1hour to the health centre 80 20
How happy are you with the TASAF poverty reduction goals?
How happy are you with School Feeding Programs-
How happy are you with the school perfomanance (tutors,
education)?
OVERALL SOCIAL
Do you or someone you know have ever pay a bribe (or give a gift) in
the last 12 months to access services?20 80
Are you registered with the CHF/TIKKA? 30 70
SOCIAL SERVICES -SATISFACTION
How happy are you with the service received from your health
centre/dispensary (Drugs, Beds, Staff attitude)
How happy are you with theTASAF process of identifying the poorest
in your area?
30
Figure 13: Mvomero citizen survey-Economic Development and Resource
Figure 14: Mvomero citizen survey- political
Very
Happy 😁
Somewhat
Happy 🙂
Neutral
😐
Not very
Happy 🙂
Not at All
Happy😠N/A TOTAL
TOTAL-
(EXCLUDING
NEUTRAL
AND N/A)
TOTAL-
Very and
Somewhat
Happy
>=60% >=59% & <=40% >= 39%
11% 34% 14% 18% 11% 12% 100% 74% 61% =
1% 31% 15% 30% 10% 13% 100% 72% 44% =
5% 29% 6% 17% 41% 2% 100% 92% 37% =21% 58% 9% 4% 4% 4% 100% 87% 91% =27% 39% 7% 13% 14% 0% 100% 93% 71% =4% 14% 5% 9% 63% 5% 100% 90% 20% =
TOTAL >=60% >=59% & <=40% >= 39%
100% 100% 73% =
Very Happy
😁
Somewhat
Happy 🙂
Neutral
😐
Not very
Happy 🙂
Not at All
Happy😠N/A 🙂 TOTAL
TOTAL-
(EXCLUDING
NEUTRAL
AND N/A)
TOTAL-
Very and
Somewhat
Happy
>=60% >=59% & <=40% >= 39%
12% 34% 9% 15% 24% 6% 100% 85% 54% =OVERALL POLITICAL
POLITICAL
73% 27%Have you paricipated in at least two
village/street assemblies last year?
how happy are you with the
village/street assemblies frequency?
How happy are you with the
village/street planning process last
year/quarter?
How happy are you with your ward
councilor?
How happy are you with your VEO and
WEO?
PARTICIPATION YES NO
How happy are you with your
village/street chair?
How happy are you with your MP?
Very
Happy 😁
Somewhat
Happy 🙂
Neutral
😐
Not very
Happy 🙂
Not at All
Happy😠N/A TOTAL >=60% >=59% & <=40% >= 39%
14% 33% 6% 30% 17% 0% 100% 94% 50% =10% 24% 4% 19% 25% 18% 100% 78% 44% =14% 30% 12% 10% 18% 16% 100% 72% 61% =
TOTAL >=60% >=59% & <=40% >= 39%
100% 100% 11% =100% 100% 18% =
Very Happy
😁
Somewhat
Happy 🙂Neutral😐
Not very
Happy 🙂
Not at All
Happy😠N/A 🙂 TOTAL >=60% >=59% & <=40% >= 39%
13% 29% 7% 20% 20% 11% 100% 81% 52% =
ECONOMIC DEVELOPMENT AND RESOURCES
OVERALL ECONOMIC DEVELOPMENT AND RESOURCES
How happy are you with the land dispute resolution
processes?
How happy are you with your agricultural/livestock
extension service (available, reliable)?
Have you benefitted from the voucher scheme?
(agriculture/livestock)11%
Do you have access to irrigation for agriculture? 18%
ACCESSIBILITY YES NO
89%
82%
How Happy are you with the land use plans/Plots?

31
Figure 15: Mvomero frontline worker survey results
Very
Happy 😁
Somewhat
Happy 🙂Neutral😐
Not very
Happy 🙂
Not at All
Happy😠
Not
Applicable
🙂
TOTAL OCCUPATION TOTAL OCCUPATION TOTALOCCUPATIO
NTOTAL
0 10 0 9 9 0 28 Teacher 3 VEO 2District
Engineer1
0 8 0 10 6 4 28Nurse and
Midwive2
Extension
Officer-
Livestock
2 Technician 1
2 9 0 8 9 0 28Medical
Attendant1 agriculture 1 Town Planer 1
2 9 0 8 9 0 28 Village chairman 2Tasaf
Coordinator1 TOTAL 28
2 9 0 3 8 6 28 street guard 2
Community
Development
Officer
1
Headteacher 1 Clinician 1
TPF Officer 1extension
Officer1
Electrical
Technician1
Water
Technician1
Land Officer 1 Water Engineer 1
how happy are you with the staff
training ?
INDICATOR
How happy are you with the road in
your work area?
How happy are you with your
salary/Allowance?
How happy are you with th work
equipment/facilities ?
how happy are you with the staff
training ?
Very
Happy 😁
Somewhat
Happy 🙂
Neutral
😐
Not very
Happy 🙂
Not at All
Happy😠
Not
Applicable
🙂
TOTAL >=60% >=59% & <=40% >= 39%
0% 36% 0% 32% 32% 0% 100% =
0% 29% 0% 36% 21% 14% 100% =
7% 32% 0% 29% 32% 0% 100% =9% 41% 0% 14% 36% 0% 100% =
4% 34% 0% 28% 31% 4% 100% =
Indicator
How happy are you with the
road in your work area?
How happy are you with your
salary/Allowance?
How happy are you with th
work equipment/facilities ?how happy are you with the
staff training ?
>=60% >=59% & <=40% >= 39%
OVERALL
32
Figure 16: Mvomero District Council Data
NB: This table covers data provided by District Officials- gaps are where data does not currently exist. This research
cannot verify the source data on which these figures are based.
There are extra
teachers for
Arts subjects
for the
secondary
schools
% health budget received for health by 1 January
% budget for road received by 1 January
% in good repair
% of road network in district
% public facilities with electricity/power source
(Health/Education under district control)
% household with access to electricity
ECONOMIC DEVELOPMENT AND RESOURCES
75%
%population trained on the use of TASAF
Primary School: 0%
Secondary School: and 1.7%
% girls enrollment (lowest quintiles school)
% staff vacancies in education
% (NGOs/CBOs) who have sent in annual reports for
last year
Total km is 531 per DC
Number of fish experts/extension workers
% of women in non-special seats
• Effectiveness of ward councilors.
% girls Pass rates (Pass in national exams- std 7 and
form 4)
% drop out of children
% education budget received by 1 January
% village land use plans complete
% land owners with certificate of land occupants
Number of agricultural extension workers
% citizens with access to inputs (voucher schemes)
% lands with irrigation system
Number of milk collection centre
POLITICAL
But 5 are functionning
Need capacity building
6
2
6%
Moderate
Number of Incidences of land disputes
Number of early pregnancies
% staff vacancies
% births with Trained Birth Attendant
% population contributed to CHF
% villages with TASAF Programme
Primary School: 0.28%
Secondary School: 3.5%
Comments
PHYSICAL INFRASTRUCTURE
SOCIAL SERVICES
154=2%
59%
70%
115
63.40%
39,99%
10%
Primary School : 83%
Secondary School: 52.52%
Primary School:69.5%
Secondary School: 46.39%
Primary School: 43.8%
Secondary School: 12.5%
Primary School:6 %
Secondary School 31%
NGOs : 95%
CBOs: 15%
38.00%
19%
100%
25%
15%
74%
33%
1.70%
INDICATORS Year 2017
46%91%
6.30%
56%
% sources clean and functioning water
% population with access to improved sanitations
% budget for water received by 1 January

33
5 Next steps- what does this all mean?
We do not analyse the results of the index here, as it lies beyond the objectives of this
project. This is knowledge that belongs in the Districts, to be contextualized and made sense of
there. Here we provide a series of recommendations for different stakeholders about how to
engage with the research findings.
5.1 For Citizens
Citizens are considered here as all of those residing in the two Districts, and also includes the
volunteers who represent both citizens and state at the hamlet and village levels. This includes
Village Chairpersons and Ward Councillors, and those who play community service roles through
religious and other collective activities. At this level the state and citizens intersect, and it is
difficult to separate them. The information within the index could provide a means of problem
solving issues of concern across the District. Most essentially, it may enable a common
framework for discussions about where responsibility lies for service delivery, thus breaking the
deadlock in the cycles of blame. Village and street councils could gain more clarity over their
responsibilities, as well as articulating problems and gaps.
5.2 For the Districts
The index provides an opportunity for collaborative problem-solving. It should not threaten the
District leadership, but reveal to them where problems lie, and where the gaps are. The District
Council (Executive and Elected Representatives) should lead this process, working closely with
other actors. Without the leadership of senior politicians and council officers, then the LGPI will
not work as a problem-solving tool across the District.
District Councils must not be tempted to try to massage the data used in the index. The
indicators are not for game-playing, but are entry points for discussion.
5.3 For national government
We do not recommend that this index be used to compare the performance of different local
governments, although we recognise that it could be used in this way. However, this risks
increasing the pressure for Districts to focus on how to use the index for political ends, rather
than focusing on problem-solving through it.
This is not to say that an index of this nature cannot be used in other Districts. The process can
be replicated and adapted for other contexts.

34
5.4 For civil society organisations
Many accountability initiatives have the founding assumption that ‘civil society’ is the legitimate
and correct form of agency to mobilise the views of citizens and to hold local government to
account. However, this research forces us to ask the question: what is the legitimacy of civil
society to play this role?
The research shows that CSOs were not visible in these two districts at the ward/village/street
level, and that District CSOs have quite embedded perceptions about the responsibilities of
citizens and local leaders in relation to accountability that connect more with the ‘rules in theory’
than what is possible in practice. Many such District CSOs are reliant on donor funded projects
and programmes, and their interests are shaped by quite heavily by donor agendas. Along with
district officials, the CSOs that were involved in the research went through a process of mutual
blaming for lack of transparency and accountability.
CSOs need to reflect on their roles, and work with local government and other non-state and
citizen actors to use the index as a tool of collaborative problem-solving, and as a framework for
shared data collection and reflection.
National level CSO bodies could undertake a proactive initiative to use the LGPI index in
governance programme work. For example, they could work with CSOs who have been involved
in the project in Mvomero and Kigoma-Ujiji and help them to continue the process of
collaboration with local government around the index. This could be tracked over a period of
time as an innovative approach to supporting good governance with the prospect of a significant
story of change. This could be undertaken in collaboration with Mzumbe University. They could
also use the findings in learning exercises in other districts in Tanzania where CSOs are involved
in social accountability projects with local government. Tanzanian Universities as institutions that
are in a good position to bring all key players together and to play a facilitative and supporting
role.
5.5 For donors
We do not recommend that this index be scaled up through donor funding, although we
encourage donors to engage with the findings in their governance programmes in Tanzania. The
index can only have an impact if it is adopted as a process within the Districts themselves. This
requires political commitment from those with sufficient weight and standing to enable the use
of the index as a problem-solving tool.
Donors should think very hard about how local accountability and governance initiatives are
funded: whose interests and issues do they represent, and on what assumptions are they founded?
Do they work with how change happens in practice (and not simply in theory)?

35
6 References
Andrews, M., Pritchett, L. and Woolcock, M., 2013. Escaping capability traps through problem driven iterative
adaptation (PDIA). World Development, 51, pp.234-244.
Andrews, M., 2015a. Doing complex reform through PDIA: Judicial sector change in Mozambique. Public
Administration and Development, 35(4), pp.288-300.
Andrews, M., 2015b. Explaining positive deviance in public sector reforms in development. World Development, 74,
pp.197-208.
Brinkerhoff, D.W. and Brinkerhoff, J.M., 2015. Public sector management reform in developing countries:
Perspectives beyond NPM orthodoxy. Public Administration and Development, 35(4), pp.222-237.
Buntaine, M.T., Parks, B.C. and Buch, B.P., 2017. Aiming at the Wrong Targets: The Domestic Consequences of
International Efforts to Build Institutions. International Studies Quarterly.
Chabbott C. 2014. Institutionalizing Health and Education for All: Global Goals, Innovations, and Scaling Up. Teachers
College Press: New York.
Fox, J.A., 2015. Social accountability: what does the evidence really say?. World Development, 72, pp.346-361.
Fox, J., 2007. The uncertain relationship between transparency and accountability. Development in practice, 17(4-5),
pp.663-671.
Fox, J., 2016. Scaling accountability through vertically integrated civil society policy monitoring and advocacy.
Brighton: institute of Development Studies
Guinn, D.E. and Straussman, J.D., 2017. A Modest Defense of Politically Engaged Best Practices: The Case of
Legislative Strengthening. Governance, 30(2), pp.177-192.
Hickey, S. &King, S. (2016) Understanding Social Accountability: Politics, Power and Building New Social Contracts,
The Journal of Development Studies, 52:8, 1225-1240, DOI:10.1080/00220388.2015.1134778
Hood, C., 2007. What happens when transparency meets blame-avoidance?. Public Management Review, 9(2), pp.191-
210.
Levy, B., 2015. Governance reform: Getting the fit right. Public Administration and Development, 35(4), pp.238-249.
Lund, C., 2006. Twilight institutions: public authority and local politics in Africa. Development and change, 37(4),
pp.685-705.
Merry, S.E. & Wood, S., 2015. Quantification and the paradox of measurement: Translating children’s rights in
Tanzania. Current Anthropology, 56(2), pp.217-218.
Merry, S.E., 2016. The seductions of quantification: Measuring human rights, gender violence, and sex trafficking. University
of Chicago Press.
Nilsson, A., C. Kipobota Myamba (2015) End of Programme Evaluation of Forum Syd’s Social Accountability
Programme in Tanzania (SAPT) 2010-2014 Final Report, SIDA
Tembo, F. and Chapman, J., 2014. In Search of the Game Changers: Rethinking Social Accountability. London: Overseas
Development Institute.
Yanguas, P. and Bukenya, B., 2016. ‘New’approaches confront ‘old’challenges in African public sector reform. Third
World Quarterly, 37(1), pp.136-152.