Embed Size (px)
Citation preview
Health Care Expenses: Poor, Near Poor, and Low income People in the United States CivilianNoninstitutionalized Population, 2002
Diana Z. Wobus and Gary Olin
Agency for Healthcare Research and Quality Working Paper No. 05016
July 2005
Suggested citation: Wobus DZ, Olin G. Health Care Expenses: Poor, Near Poor, and Low incomePeople in the United States Civilian Noninstitutionalized Population, 2002. Agency for HealthcareResearch and Quality Working Paper No. 05016, July 2005, http://gold.ahrq.gov.
AHRQ Working Papers provide preliminary analysis of substantive, technical, and methodologicalissues. The papers have not undergone external peer review. They are distributed to sharevaluable experience and research. Comments are welcome and should be directed to theauthors. The views expressed are those of the authors and no official endorsement by theAgency for Healthcare Research and Quality or the Department of Health and Human Services isintended or should be inferred.
Health Care Expenses: Poor, Near Poor, and Low income People in the United States Civilian Noninstitutionalized Population, 2002 Diana Wobus and Gary Olin July 2005
ABSTRACT
This report provides estimates of health care expenditures for poor, near poor, and low income people in the United States; i.e., people whose income is less than 200 percent of the Federal Poverty Line. It highlights the characteristics of poor or near poor and low income persons and their expenditures for health care. The estimates are from the 2002 Medical Expenditure Panel Survey (MEPS) and cover the U.S. civilian noninstitutionalized population. While providing an overview of total health care expenses for the population, the report focuses on estimates of expenses for hospital services, office-based medical provider services, and prescription medicines. Detailed comparisons are made by type of service, source of payment, and selected demographic characteristics of the population. All differences between estimates discussed in the text are statistically significant at the 0.05 level.
Diana Wobus, Ph.D. Westat 1650 Research Blvd. Rockville, MD 20850 [email protected]
Gary Olin, Ph.D. Center for Financing, Access, and Cost Trends Agency for Healthcare Research and Quality 540 Gaither Road Rockville, MD 20850 E-mail: [email protected]
2
Introduction
This report uses the 2002 Medical Expenditure Panel Survey (MEPS) to provide
estimates of health care expenditures for the United States civilian noninstitutionalized
population stratified by income level and selected demographic characteristics. The population
is divided into three income groups according to the Federal Poverty Line (FPL): the poor or
near poor (at or below 125 percent of FPL), the low income (125 percent to 200 percent of FPL),
and the middle or high income (above 200 percent of FPL). The primary focus is on
comparisons of hospital services, office-based medical provider services, and prescription
medicines received by the poor or near poor and the low income.
Expenditures for these services, which are defined as direct payments for health services
and care received during the year, include out-of-pocket payments by individuals and payments
by private insurance, Medicare, Medicaid, and other sources. Hospital expenses include both
facility charges and physician fees. Ambulatory care (outpatient, emergency room, or office-
based services) includes expenses for physician and non-physician services. Payments for over-
the-counter drugs are not included in the estimates. All mean and median expenses are estimated
at the person level for persons with expenses. All differences between estimates discussed in the
text are statistically significant at the 0.05 level.
Table 1 of the report shows the distribution of the U.S. civilian noninstitutionalized
population by income group and selected demographic characteristics. Tables 2-4 contain
estimates of health care use and expenditures by income group and type of service. These tables
show that use and expenditures by the poor or near poor and low income groups are often
substantially different from those for the middle or high income group. For that reason, tables 5-
3
7 highlight the characteristics of the combined population of poor, near poor, and low income
persons and their health care expenditures.
Selected Population Characteristics
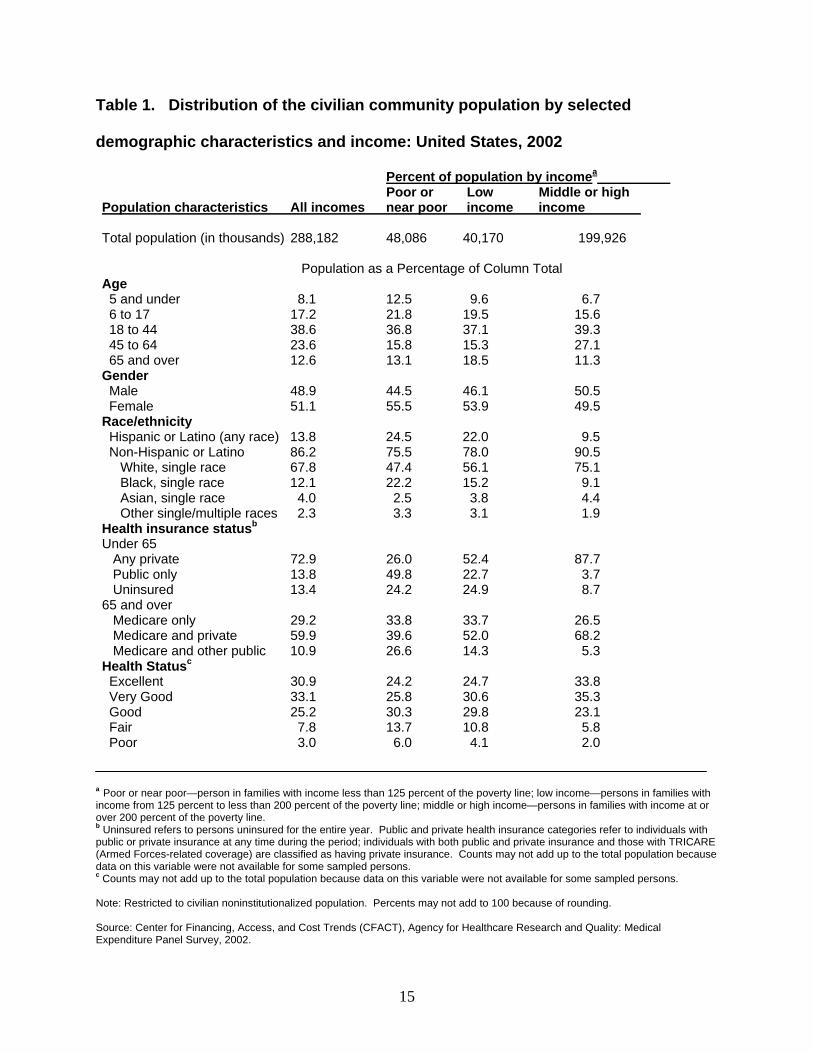
Table 1 shows the distribution of the population by income and selected demographic
characteristics. Of the 288 million civilian noninstitutionalized people in 2002, over 88 million
were poor or near poor (48 million) or low income (40 million). People characterized as poor,
near poor, or low income constituted 30.6 percent of the total population. In comparison to the
middle or high income group, the poor or near poor and low income groups had higher
representations of children and elderly, females, racial and ethnic minorities, uninsured and
public-only insured persons, and persons in poor or fair health.
Children under 6 represented 8.1 percent of the population, but the poor or near poor and
the low income groups had higher proportions of children in this age group (12.5 percent and 9.6
percent). Children age 6 to 17 represented 17.2 percent of the population but had higher
representation in the poor or near group (21.8 percent) and the low income group (19.5 percent).
At the upper end of the age continuum, the elderly (age 65 and over) represented 12.6 percent of
the population, but had higher representation in the low income group (18.5 percent).
Females representing 51.1 percent of the total population had higher representation in the
poor or near poor (55.5 percent) and low income (53.9 percent) groups. Hispanics (of any race)
represented 13.8 percent of the total population, but had higher representation in the poor or near
(24.5 percent) and the low income (22.0 percent) groups. Blacks, single race, also had higher
representation in the poor or near poor (22.2 percent) and the low income (15.2 percent) groups
than they did in the total population (12.1 percent).
4
Nearly three quarters of the non-elderly population had private insurance (72.9 percent)
for all or part of the year, with the rest split between uninsured all year (13.4 percent) or public-
only insurance for all or part of the year (13.8 percent). Compared to all non-elderly persons, the
poor or near poor and low income groups had high proportions of people with public-only
insurance (49.8 percent and 22.7 percent) and uninsured people (24.2 percent and 24.9 percent).
Medicare beneficiaries in the 65 and over age group included 29.2 percent with Medicare
only, 59.9 percent with supplemental private insurance, and 10.9 percent with other public
insurance. Medicare only coverage was more common among people in the poor or near poor
and low income groups (33.8 percent and 33.7 percent) than it was among people in the middle
or high income group (26.5 percent). In addition, compared to the middle or high income group,
the poor or near poor and low income groups had higher proportions of beneficiaries with other
public insurance and lower proportions with supplemental private insurance.
Self-reported health status also varied by income group. Overall, 10.8 percent of the
population reported being in poor or fair health, but the percentage was higher in the poor or near
poor and low income groups (19.7 percent and 14.9 percent).
Total Health Care Expenses
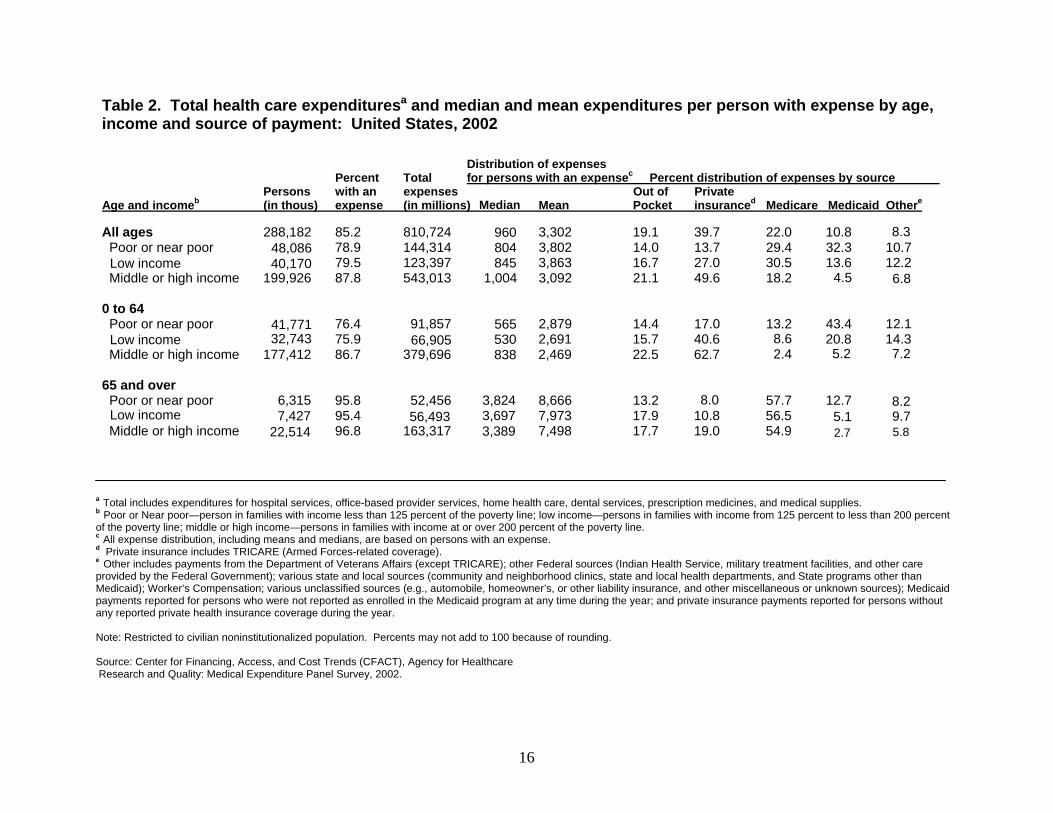
Table 2 shows, by age and income group, health care expenditures for all types of health
care, including hospital services, office-based services, home health care, dental services,
prescription medicines, and medical supplies, and the distribution of payments by source. In
2002, 85.2 percent of the total population had health care expenses. This group spent $810.7
billion on health care, with a median expense of $960 and a mean expense of $3,302 per person
5
with an expense. Median expenses were substantially lower than mean expenses because a small
proportion of the population had a large proportion of the total expenses.
The proportion of persons with an expense was larger in the middle or high income group
(87.8 percent) than it was in the other two income groups (78.9 percent for the poor or near poor
and 79.5 percent for the low income group). However, variation in the proportion of persons
with an expense was confined to the income groups containing people under the age of 65. The
proportion of persons age 65 and over with an expense was the same in each of the three income
groups (approximately 96 percent).
Table 2 also shows the percent of expenses paid by source. In the aggregate, 19.1 percent
of all health care expenses were paid out of pocket, 39.7 percent by private insurance, 22.0
percent by Medicare, 10.8 by Medicaid, and 8.3 percent by other sources. Within the 0-64 year-
old age group, the poor or near poor and low income groups paid relatively less out of pocket
(14.4 percent and 15.7 percent) compared to the middle or high income group (22.5 percent).
Medicaid paid the largest share of expenses for poor or near poor persons (43.4 percent), while
private insurance paid the largest share for middle or high income persons (62.7 percent).
Within the 65 and older age group, Medicare paid the largest share of expenses regardless
of income (54.9 to 57.7 percent of total expenses), but other payment shares varied by income
group and source. Low income people paid about the same share out of pocket (13.2 percent) as
Medicaid paid for them (12.7 percent). Middle or high income people paid about the same share
out of pocket (17.7 percent) as private insurance paid for them (19.0 percent).
6
Core Service Use by Type of Service and Income
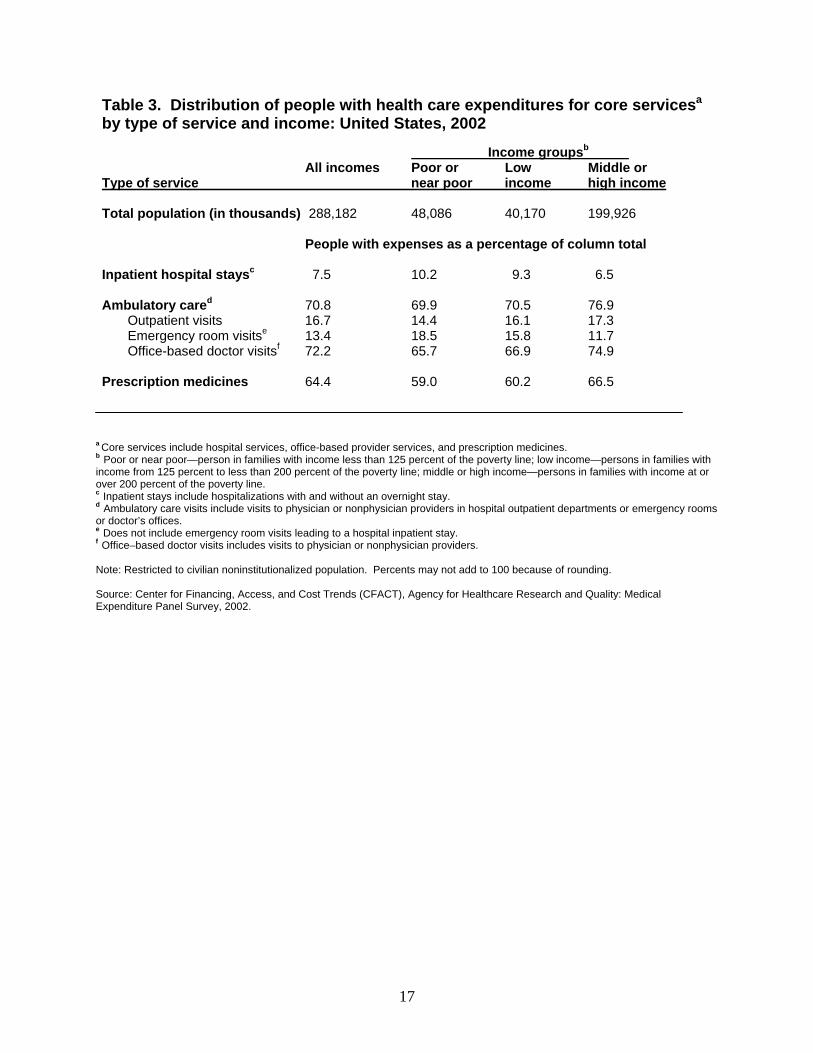
Table 3 shows the proportion of people with expenses for hospital inpatient, outpatient,
or emergency room services, office-based medical provider services, and prescription medicines.
These services accounted for approximately 85 percent of all health expenditures in 2002, but the
proportion of people with an expense varied by income group and type of care. The poor or near
poor and low income groups had a higher proportion of people with hospital inpatient expenses
(10.2 percent and 9.3 percent) than the middle or high income group (6.5 percent), and a higher
proportion of the poor or near poor group (18.5 percent) and the low income group (15.8 percent)
had emergency room expenses compared to the middle or high income group (11.7 percent).
However, the proportion of the poor or near poor group (65.7 percent) and the low
income group (66.9 percent) with office-based doctor expenses was less than that of the middle
or high income group (74.9 percent). Similarly, the proportion with prescription medicine
expenses was lower in the poor or near poor group (59.0 percent) and the low income group
(60.2 percent) than it was in the middle or high income group (66.5 percent). The poor or near
poor group also was less likely than the middle or high income group to have expenses for
hospital outpatient services (14.4 percent versus 17.3 percent).
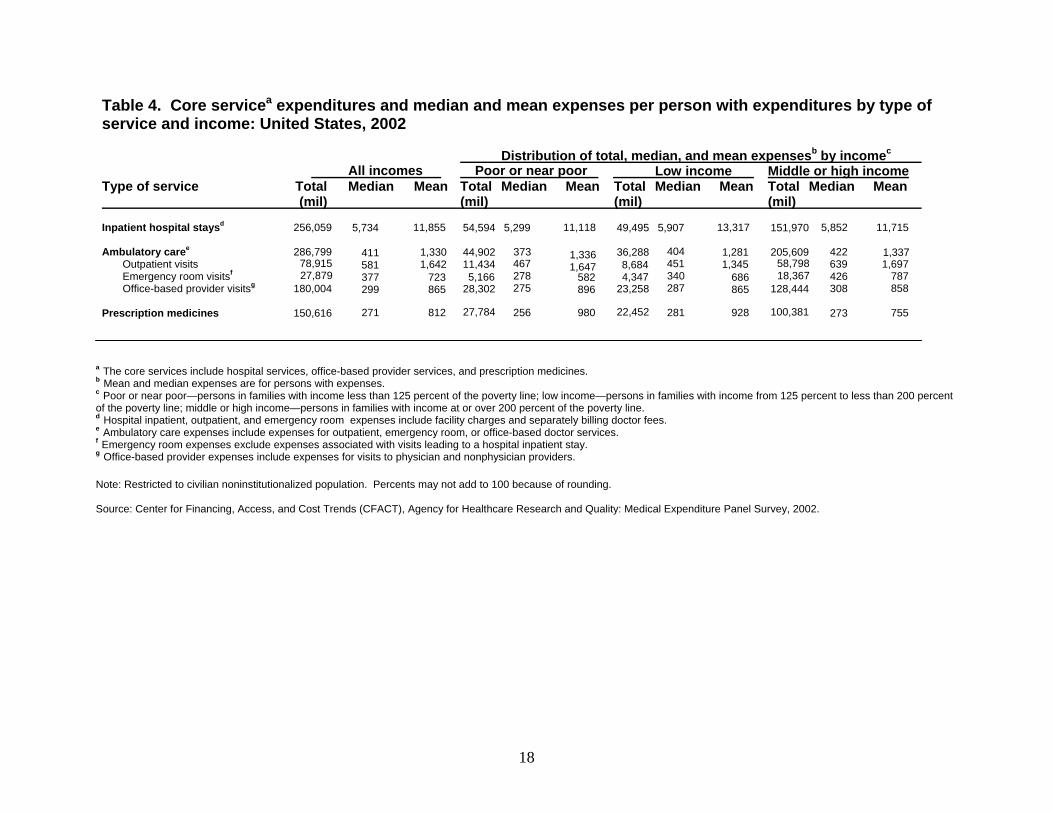
Core Service Expenses by Type of Service and Income
Table 4 shows, by income group, expenses for inpatient hospital services, ambulatory
care services, and prescribed medicines. Median and mean expenses for persons with outpatient
and emergency room expenses varied by income group. For outpatient services, the low income
group had a lower mean expense per person with an expense ($1,345) than the poor or near poor
($1,647) and the middle or high income ($1,697) groups, while the middle or high income group
7
had higher median expense per person with an expense ($639) than the poor or near poor ($467)
and the low income ($451) groups. For emergency room services, the mean expense per person
with an expense was higher for the middle or high income group ($787) than for the poor or near
poor ($582) and the low income ($686) groups. The median expense per person with an expense
was also substantially higher for the middle or high income group ($426) than that for the poor
or near poor ($278) and the low income ($340) groups.
Expenses for people with office-based provider services and prescription medicines also
varied across the income groups. The median expense per person with an expense for office-
based health care was higher for the middle or high income group ($308) than for the other two
income groups ($275 for the poor or near poor group and $287 for the low income group). For
persons with prescription medicine expenses, the middle or high income group had lower mean
expense ($755) than both the poor or near poor ($980) and the low income ($928) groups.
A Closer Look at the Poor, Near Poor and Low Income
Tables 2 to 4 provide estimates of health care use and expenses by income group. The
estimates for the poor or near poor and low income groups are often substantially different from
those for the middle or high income group. Although insurance coverage can vary substantially
between the poor or near poor and the low income groups, the remainder of this report focuses
on health expenditures for the combined population of poor, near poor, and low income people
stratified by selected demographic characteristics.
8
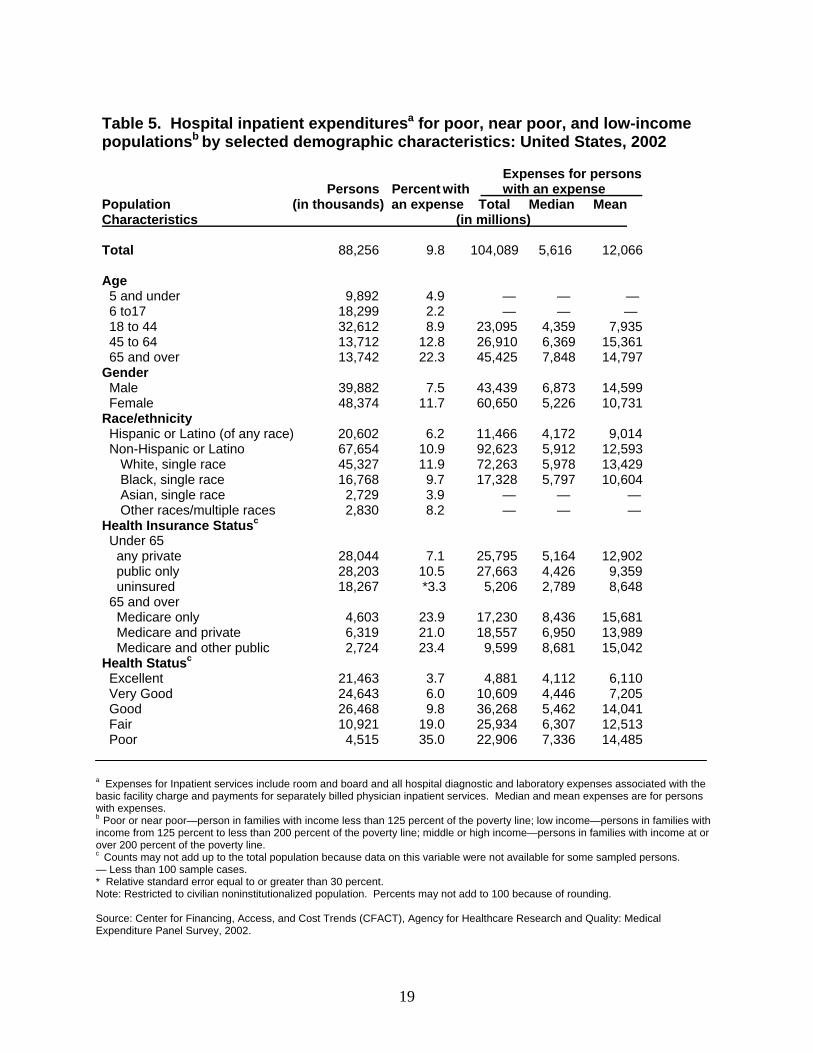
Hospital Inpatient Expenses
Nearly 10 percent of the poor, near poor and low income people had hospital inpatient
expenses in 2002 (Table 5). The total inpatient expense for this group was $104.1 billion, and
the median and mean were $5,616 and $12,066 for persons with expenses. Among adults, a
higher proportion of elderly people age 65 and over (22.3 percent) had inpatient expenses than
did 45-64 year-olds (12.8 percent) or 18-44 year-olds (8.9 percent). Median inpatient expenses
per person with an expense were higher for the elderly ($7,848) and 45-64 year-olds ($6,369)
than for 18-44 year-olds ($4,359). Mean expenses per person with an expense also were higher
for the elderly ($14,797) and 45-64 year-olds ($15,361) than for 18-44 year-olds ($7,935).
A higher proportion of females (11.7 percent) had inpatient expenses than males (7.5
percent). However, among people with expenses, median and mean expenses were higher for
males ($6,873 and $14,599) than for females ($5,226 and $10,731).
Hispanics (of any race) were less likely to have inpatient expenses than non-Hispanics
(6.2 percent versus 10.9 percent). Median and mean expenses per person with an expense were
lower for Hispanics ($4,172 and $9,014) than for non-Hispanics ($5,912 and $12,593). Whites,
single race, were more likely than Blacks, single race, to have inpatient expenses (11.9 percent
versus 9.7 percent). Whites, single race, also had higher mean expenses per person with an
expense than Blacks, single race ($13,429 versus $10,604).
Among people under age 65, the public-only insurance group (primarily Medicaid) was
most likely to have inpatient expenses (10.5 percent), followed by the privately insured (7.1
percent) and the uninsured (3.3 percent). The median expense per person with expenses was
lower for the uninsured ($2,789) than for the privately insured ($5,164) and the publicly insured
9
($4,426), but the mean expense per person with expenses was the same for all three insurance
categories.
People in excellent health were least likely to have inpatient expenses (3.7 percent), while
those in poor health were most likely (35.0 percent). Median and mean expenses per person with
an expense also were higher for those in poor health than for those in excellent or very good
health.
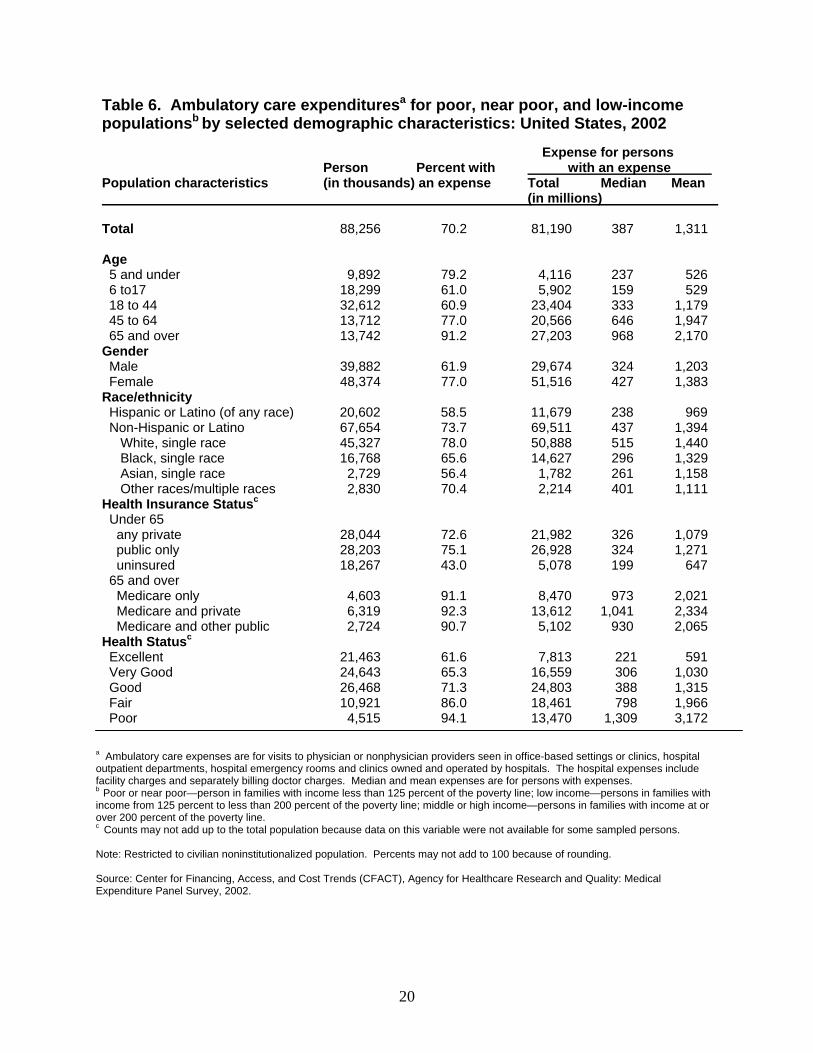
Ambulatory Care Expenses
Over 70 percent of the poor, near poor, and low income people had ambulatory care
expenses, totaling more than $81 billion with a median expense of $387 and a mean expense of
$1,311 for persons with expenses (Table 6). Among adults age 18 and over, 91.2 percent of the
elderly had ambulatory care expenses, followed by 77.0 percent of the 45-64 year-olds and 60.9
percent of the 18-44 year-olds. Among children, the 0-5 year-olds were more likely to have
ambulatory care expenses (79.2 percent) than the 6-17 year-olds (61.0 percent).
The mean expense per person with an expense was highest for the elderly ($2,170),
followed by 45-64 year-old adults ($1,947) and 18-44 year-old adults ($1,179). Children had the
lowest mean expense ($526 to $529).
Females were more likely to have ambulatory care expenses (77.0 percent) than males
(61.9 percent). The median expense per person with an expense also was higher for females
($427) than for males ($324).
Hispanics (of any race) were less likely to have ambulatory care expenses than non-
Hispanics (58.5 percent versus 73.7 percent). Median and mean expenses per person with an
expense also were lower for Hispanics ($238 and $969) than they were for non-Hispanics ($437
10
and $1,394). Among non-Hispanics, Whites, single race, had the highest proportion of people
with expenses (78.0 percent) and Asians, single race, had the lowest proportion (56.4 percent).
Whites, single race, and Other Races had higher median expenses per person with an expense
($515 and $401) compared to Blacks, single race, and Asians, single race ($296 and $261).
For people under 65, the uninsured were less likely to have ambulatory care expenses
(43.0 percent) than the publicly insured (75.1 percent) and the privately insured (72.6 percent).
In addition, uninsured people with expenses had lower median and mean expenses compared to
both publicly and privately insured people.
People in poor health were mostly like to have ambulatory care expense (94.1 percent),
while those in excellent health were least likely (61.6 percent). Median and mean expenses per
person with an expense also were highest for those in poor health ($1,309 and $3,172) and
lowest for those in excellent health ($221 and $591).
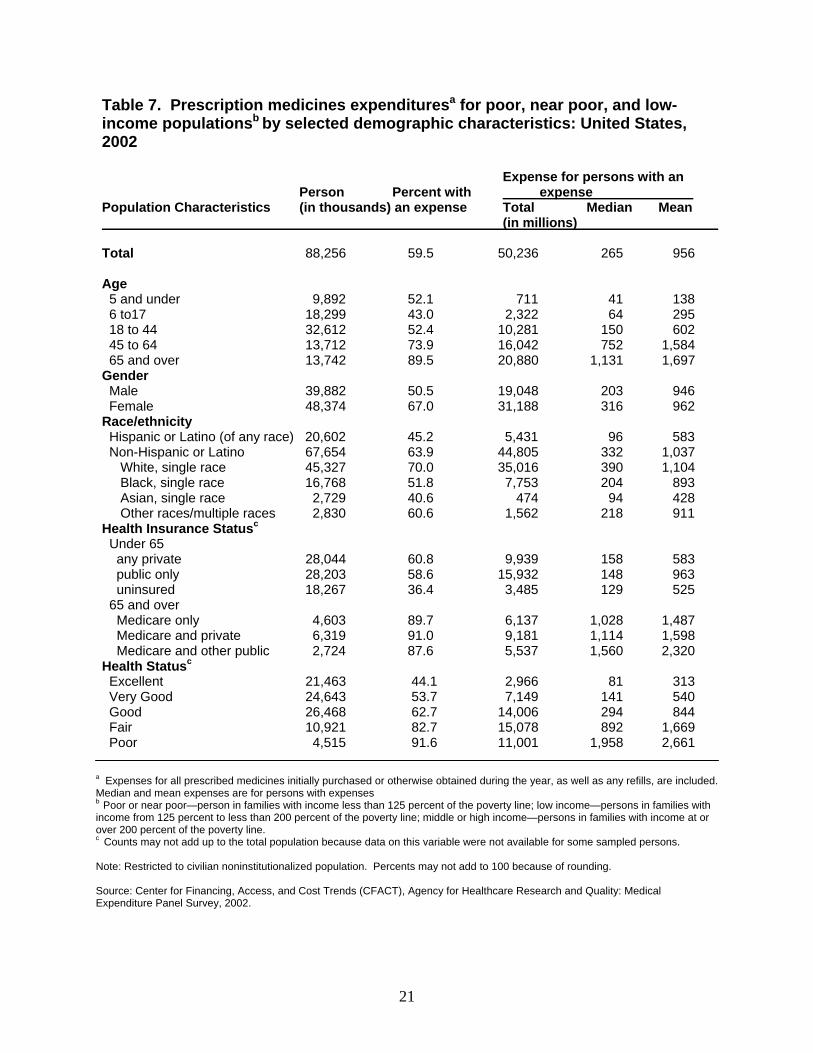
Prescription Medicine Expenses
Prescription medicine expenses for poor, near poor, and low income people were more
than $50 billion in 2002, with a a median expense of $265 and a mean expense of $956 per
person with an expense (Table 7). The elderly were most likely to have prescription medicine
expenses (89.5 percent), while 6-17 year-old children were least likely (43.0 percent). The
median expense for the elderly ($1,131) was higher than that for 45-64 year-olds ($752), and the
mean expense for persons with expenses was highest for 45-64 year-olds ($1,584) and the
elderly ($1,697).
11
Females were more likely than males to have prescription medicine expenses (67.0
percent versus 50.5 percent). In addition, the median expense per person with an expense was
higher for females ($316) than for males ($203).
Hispanics (of any race) were less likely than non-Hispanics to have prescription medicine
expenses (42.5 percent versus 63.9 percent). The median and mean expenses per person with an
expense were higher for non-Hispanics ($332 and $1,037) than for Hispanics ($96 and $583).
Whites, single race, were most likely to have prescription medicine expenses (70.0 percent),
while Hispanics and Asians, single race, were least likely (45.2 percent and 40.6 percent).
Median and mean expenses per person with an expense were highest for Whites, single race
($390 and $1,104) and lowest for Asians, single race ($94 and $428).
The proportion of people under the age of 65 with prescription medicine expenses was
higher for the privately insured (60.8 percent) and the publicly insured (58.6 percent) than for the
uninsured (36.4 percent). The mean expense per person with an expense was higher among
those with public insurance ($963) than for the privately insured ($583) or the uninsured ($525).
Elderly Medicare beneficiaries with other public insurance also had high mean and median
expenses per person with an expense compared to other elderly Medicare beneficiaries.
Prescription drug expenditures tracked inpatient and ambulatory care expenditures by
health status. Those in poor health were mostly like to have a prescription expense (91.6
percent) and those in excellent health were least likely (44.1 percent). Median and mean
prescription medicine expenditures also were notably higher for people in poor health ($1,958
and $2,661) than they were for people in excellent health ($81 and $313).
12
Summary
In 2002, nearly 31 percent of the U.S. civilian noninstitutionalized population was poor,
near poor, or low income. This group included 44 million people with an income below 125
percent of Federal poverty threshold (the poor and near poor) and another 40 million people with
an income at 125 to 200 percent of Federal poverty threshold (the low income). Compared to the
middle or high income population, the poor or near poor and low income groups had larger
proportions of children, women, Hispanics (of any race) and Blacks (single race), uninsured
people, and people in fair or poor health.
Poor or near poor and low income people were more likely to have hospital inpatient and
emergency room expenses than middle or high income people. They were less likely to have
hospital outpatient and office-based doctor expenses and prescription medicine expenses. In
addition, expenditures per person with an expense tended to vary by income. Comparisons of
total health care expenditures among people under age 65, for example, showed that the poor or
near poor had a lower median expense per person with an expense and a higher mean expense
per person with an expense than those in the middle or high income group.
Health care expenditures also varied within the combined population of poor, near poor,
and low income people. Non-Hispanics (as a group) always had higher mean and median
expenses per person with an expense than Hispanics had for hospital and ambulatory care
services and prescription medicines. In the non-Hispanic group, Whites, single race, had higher
mean inpatient expenses per person with an expense than Blacks, single race. In addition,
differences in median and mean expenses per person with an expense were observed within the
poor, near poor, and low income population when it was stratified by characteristics such as
gender, health insurance status, or health status.
13
References
Cohen J. Design and methods of the Medical Expenditure Panel Survey Household Component.
Rockville (MD):Agency for Health Care Policy and Research; 1997. MEPS Methodology Report
No. 1. AHCPR Pub. No. 97-0026.
Cohen SB. Sample design of the 1997 Medical Expenditure Panel Survey Household
Component. Rockville (MD):Agency for Healthcare Research and Quality; 2000. MEPS
Methodology Report No. 11. AHRQ Pub. No. 01-0001.
Cohen SB. Design strategies and innovations in the Medical Expenditure Panel Survey. Medical
Care 2003; 41(7):5-12.
Ezzati-Rice, T. M., et al. (2004). Health care expenses in the United States, 2000. Research
Findings #21. Rockville (MD): Agency for Healthcare Research and Quality.
Selden TM, Levit KR, Cohen JW, et al. Reconciling medical expenditure estimates from the
Medical Expenditure Panel Survey and the NHA, 1996. Health Care Financing Review 2001
Fall; 23(1):161-78.
Zuvekas SH, Cohen JW. A guide to comparing health care expenditures in the 1996 MEPS to the
1987 NMES. Inquiry 2002 Spring; 39(1):76-86.
14
Percent of population by incomea Poor or
near poor Low income
Middle or high income Population characteristics All incomes
Total population (in thousands) 288,182 48,086 40,170 199,926
Age 5 and under
Population as a Percentage of Column Total
8.1 12.5 9.6
6.7
6 to 17 17.2 21.8 19.5 15.6 18 to 44 38.6 36.8 37.1 39.3 45 to 64 23.6 15.8 15.3 27.1 65 and over 12.6 13.1 18.5 11.3
Gender Male 48.9 44.5 46.1 50.5
Female 51.1 55.5 53.9 49.5 Race/ethnicity
Hispanic or Latino (any race) 13.8 24.5 22.0 9.5 Non-Hispanic or Latino 86.2 75.5 78.0 90.5
White, single race 67.8 47.4 56.1 75.1 Black, single race 12.1 22.2 15.2 9.1 Asian, single race 4.0 2.5 3.8 4.4 Other single/multiple races 2.3 3.3 3.1 1.9
Health insurance statusb Under 65
Any private Public only
Uninsured
72.9 13.8
13.4
26.0 49.8
24.2
52.4 22.7
24.9
87.7 3.7 8.7
65 and over Medicare only Medicare and private Medicare and other public Health Statusc
29.2 59.9
10.9
33.8 39.6 26.6
33.7 52.0 14.3
26.5 68.2 5.3
Excellent 30.9 24.2 24.7 33.8 Very Good
Good 33.1
25.2 25.8
30.3 30.6
29.8
35.3 23.1
Fair 7.8 13.7 10.8 5.8 Poor 3.0 6.0 4.1 2.0
Table 1. Distribution of the civilian community population by selected
demographic characteristics and income: United States, 2002
a Poor or near poor—person in families with income less than 125 percent of the poverty line; low income—persons in families with income from 125 percent to less than 200 percent of the poverty line; middle or high income—persons in families with income at or over 200 percent of the poverty line.b Uninsured refers to persons uninsured for the entire year. Public and private health insurance categories refer to individuals with public or private insurance at any time during the period; individuals with both public and private insurance and those with TRICARE (Armed Forces-related coverage) are classified as having private insurance. Counts may not add up to the total population because data on this variable were not available for some sampled persons. c Counts may not add up to the total population because data on this variable were not available for some sampled persons.
Note: Restricted to civilian noninstitutionalized population. Percents may not add to 100 because of rounding.
Source: Center for Financing, Access, and Cost Trends (CFACT), Agency for Healthcare Research and Quality: Medical Expenditure Panel Survey, 2002.
15
Percent distribution of expenses b y source
All ages Poor or near poor
Low income Middle or high income
288,182 48,086 40,170
199,926
85.2 78.9 79.5 87.8
810,724144,314123,397543,013
960 804 845 1,004
3,302 3,802 3,863 3,092
19.1 14.0 16.7 21.1
39.7 13.7 27.0 49.6
22.0 29.4 30.5 18.2
10.8 32.3 13.6
4.5
8.3 10.7 12.2 6.8
0 to 64 Poor or near poor
Low income Middle or high income
41,771 32,743
177,412
76.475.986.7
91,857 66,905379,696
565
530 838
2,879
2,691 2,469
14.4 15.7 22.5
17.0 40.662.7
13.2
8.6 2.4
43.4 20.8 5.2
12.1 14.3 7.2
65 and over Poor or near poor
Low income Middle or high income
6,315
7,427 22,514
95.895.496.8
52,456 56,493163,317
3,824 3,697
3,389
8,666
7,973 7,498
13.2 17.9 17.7
8.0
10.8 19.0
57.7 56.5 54.9
12.7 5.1
2.7
8.2 9.7 5.8
Table 2. Total health care expendituresa and median and mean expenditures per person with expense by age, income and source of payment: United States, 2002
Distributio expn enof sesfor person s with an expense
Percentwith an expense
Totalexpenses (in millions) Median
c
Persons (in t hous)
Out of Pocket
Private insuranceAge and incomeb Mean d Medicare Medicaid Othere
a Total includes expenditures for hospital services, office-based provider services, home health care, dental services, prescription medicines, and medical supplies. b Poor or Near poor—person in families with income less than 125 percent of the poverty line; low income—persons in families with income from 125 percent to less than 200 percent of the poverty line; middle or high income—persons in families with income at or over 200 percent of the poverty line. c All expense distribution, including means and medians, are based on persons with an expense. d Private insurance includes TRICARE (Armed Forces-related coverage). e Other includes payments from the Department of Veterans Affairs (except TRICARE); other Federal sources (Indian Health Service, military treatment facilities, and other care provided by the Federal Government); various state and local sources (community and neighborhood clinics, state and local health departments, and State programs other than Medicaid); Worker’s Compensation; various unclassified sources (e.g., automobile, homeowner’s, or other liability insurance, and other miscellaneous or unknown sources); Medicaid payments reported for persons who were not reported as enrolled in the Medicaid program at any time during the year; and private insurance payments reported for persons without any reported private health insurance coverage during the year.
Note: Restricted to civilian noninstitutionalized population. Percents may not add to 100 because of rounding.
Source: Center for Financing, Access, and Cost Trends (CFACT), Agency for Healthcare Research and Quality: Medical Expenditure Panel Survey, 2002.
16
Income groups Poor or
near poor Low income
Middle or high income
Total population (in thousands) 288,182 48,086 40,170 199,926
Table 3. Distribution of people with health care expenditures for core servicesa
by type of service and income: United States, 2002 b
All incomes Type of service
People with expenses as a percentage of column total
Inpatient hospital staysc 7.5 10.2 9.3 6.5
Ambulatory cared
Outpatient visits Emergency room visitse
Office-based doctor visitsf
70.8 16.7 13.4 72.2
69.9 14.4 18.5 65.7
70.5 16.1 15.8 66.9
76.9 17.3 11.7 74.9
Prescription medicines 64.4 59.0 60.2 66.5
a Core services include hospital services, office-based provider services, and prescription medicines. b Poor or near poor—person in families with income less than 125 percent of the poverty line; low income—persons in families with income from 125 percent to less than 200 percent of the poverty line; middle or high income—persons in families with income at or over 200 percent of the poverty line. c Inpatient stays include hospitalizations with and without an overnight stay. d Ambulatory care visits include visits to physician or nonphysician providers in hospital outpatient departments or emergency rooms or doctor’s offices. e Does not include emergency room visits leading to a hospital inpatient stay. f Office–based doctor visits includes visits to physician or nonphysician providers.
Note: Restricted to civilian noninstitutionalized population. Percents may not add to 100 because of rounding.
Source: Center for Financing, Access, and Cost Trends (CFACT), Agency for Healthcare Research and Quality: Medical Expenditure Panel Survey, 2002.
17
256,059 5,734 11,855 54,594 5,299 11,118 49,495 5,907 13,317 151,970 5,852 11,715
286,799 78,915 27,879
180,004
411 581 377
299
1,330 1,642
723 865
44,902 11,434 5,166
28,302
373 467
278 275
1,336 1,647
582
896
36,288 8,684 4,347
23,258
404 451 340 287
1,281 1,345
686
865
205,609 58,798 18,367
128,444
639 308
422
426
1,337 1,697
787 858
150,616 271 812 27,784 256 980 22,452 281 928 100,381 273 755
Poor or near poor
Total (mil)
Mean Mean Median
Table 4. Core servicea expenditures and median and mean expenses per person with expenditures by type of service and income: United States, 2002
Distribution of total, median, and mean expensesb by incomec
All incomes Low income Middle or high income Type of service Median Mean Total
(mil) Median Total
(mil) Median Total
(mil) Mean
Inpatient hospital staysd
Ambulatory caree
Outpatient visits Emergency room visitsf
Office-based provider visitsg
Prescription medicines
a The core services include hospital services, office-based provider services, and prescription medicines. b Mean and median expenses are for persons with expenses. c Poor or near poor—persons in families with income less than 125 percent of the poverty line; low income—persons in families with income from 125 percent to less than 200 percent of the poverty line; middle or high income—persons in families with income at or over 200 percent of the poverty line.d Hospital inpatient, outpatient, and emergency room expenses include facility charges and separately billing doctor fees. e Ambulatory care expenses include expenses for outpatient, emergency room, or office-based doctor services. f Emergency room expenses exclude expenses associated with visits leading to a hospital inpatient stay. g Office-based provider expenses include expenses for visits to physician and nonphysician providers.
Note: Restricted to civilian noninstitutionalized population. Percents may not add to 100 because of rounding.
Source: Center for Financing, Access, and Cost Trends (CFACT), Agency for Healthcare Research and Quality: Medical Expenditure Panel Survey, 2002.
18
Total 88,256 9.8 104,089
5,616
12,066
Age 5 and under 9,892
4.9
— — — 6 to17 18,299 2.2 — — — 18 to 44 32,612 8.9 23,095 4,359 7,935 45 to 64 13,712 12.8 26,910 6,369 15,361 65 and over 13,742 22.3 45,425 7,848 14,797
Gender Male 39,882 7.5 43,439 6,873 14,599
Female 48,374 11.7 60,650 5,226 10,731 Race/ethnicity
Hispanic or Latino (of any race) 20,602 6.2 11,466 4,172 9,014
Non-Hispanic or Latino 67,654 10.9 92,623 5,912 12,593 White, single race 45,327 11.9 72,263 5,978 13,429 Black, single race 16,768 9.7 17,328 5,797 10,604 Asian, single race 2,729 3.9 — — — Other races/multiple races
cHealth Insurance Status 2,830
8.2 — — —
Under 65 any private 28,044 7.1 25,795 5,164 12,902 public only 28,203 10.5 27,663 4,426 9,359
uninsured 18,267 *3.3 5,206 2,789 8,648 65 and over
Medicare only 4,603 23.9 17,230 8,436 15,681 Medicare and private 6,319 21.0 18,557 6,950 13,989
Medicare and other publiccHealth Status
2,724
23.4 9,599 8,681 15,042
Excellent 21,463 3.7 4,881 4,112 6,110 Very Good 24,643 6.0 10,609 4,446 7,205
Good 26,468 9.8 36,268 5,462 14,041 Fair 10,921 19.0 25,934 6,307 12,513 Poor 4,515 35.0 22,906 7,336 14,485
Table 5. Hospital inpatient expendituresa for poor, near poor, and low-income populationsb by selected demographic characteristics: United States, 2002
Expenses for persons with an expense Persons
(in thousands) Percent with
an expense Total (in millions)
Population Characteristics
Median Mean
a Expenses for Inpatient services include room and board and all hospital diagnostic and laboratory expenses associated with the basic facility charge and payments for separately billed physician inpatient services. Median and mean expenses are for persons with expenses. b Poor or near poor—person in families with income less than 125 percent of the poverty line; low income—persons in families with income from 125 percent to less than 200 percent of the poverty line; middle or high income—persons in families with income at or over 200 percent of the poverty line. c Counts may not add up to the total population because data on this variable were not available for some sampled persons. — Less than 100 sample cases. * Relative standard error equal to or greater than 30 percent. Note: Restricted to civilian noninstitutionalized population. Percents may not add to 100 because of rounding.
Source: Center for Financing, Access, and Cost Trends (CFACT), Agency for Healthcare Research and Quality: Medical Expenditure Panel Survey, 2002.
19
Total 88,256 70.2 81,190
387
1,311
Age 5 and under 9,892 79.2 4,116 237 526 6 to17 18,299 61.0 5,902 159 529 18 to 44 32,612 60.9 23,404 333 1,179 45 to 64 13,712 77.0 20,566 646 1,947 65 and over 13,742 91.2 27,203 968 2,170
Gender Male 39,882 61.9 29,674 324 1,203
Female 48,374 77.0 51,516 427 1,383 Race/ethnicity
Hispanic or Latino (of any race) 20,602 58.5 11,679 238 969 Non-Hispanic or Latino 67,654 73.7 69,511 437 1,394
White, single race 45,327 78.0 50,888 515 1,440 Black, single race 16,768 65.6 14,627 296 1,329 Asian, single race 2,729 56.4 1,782 261 1,158 Other races/multiple races
cHealth Insurance Status
2,830 70.4 2,214 401 1,111
Under 65 any private 28,044 72.6 21,982 326 1,079 public only 28,203 75.1 26,928 324 1,271
uninsured 18,267 43.0 5,078 199 647 65 and over
Medicare only 4,603 91.1 8,470 973 2,021 Medicare and private 6,319 92.3 13,612 1,041 2,334
Medicare and other publiccHealth Status
2,724 90.7 5,102 930 2,065
Excellent 21,463 61.6 7,813 221
591 Very Good 24,643 65.3 16,559 306 1,030
Good 26,468 71.3 24,803 388 1,315 Fair 10,921 86.0 18,461 798 1,966 Poor 4,515 94.1 13,470 1,309 3,172
Table 6. Ambulatory care expendituresa for poor, near poor, and low-income populationsb by selected demographic characteristics: United States, 2002
Expense for persons with an expense Person
(in thousands)Percent with an expense Population characteristics Total
(in millions)Median Mean
a Ambulatory care expenses are for visits to physician or nonphysician providers seen in office-based settings or clinics, hospital outpatient departments, hospital emergency rooms and clinics owned and operated by hospitals. The hospital expenses include facility charges and separately billing doctor charges. Median and mean expenses are for persons with expenses. b Poor or near poor—person in families with income less than 125 percent of the poverty line; low income—persons in families with income from 125 percent to less than 200 percent of the poverty line; middle or high income—persons in families with income at or over 200 percent of the poverty line. c Counts may not add up to the total population because data on this variable were not available for some sampled persons.
Note: Restricted to civilian noninstitutionalized population. Percents may not add to 100 because of rounding.
Source: Center for Financing, Access, and Cost Trends (CFACT), Agency for Healthcare Research and Quality: Medical Expenditure Panel Survey, 2002.
20
Population Characteristics
Person Percent with an expense (in thousands)
Expense for persons with an expense
Total (in millions)
Median Mean
Total 88,256 59.5 50,236
265
956
Age 5 and under 9,892 52.1 711 41 138 6 to17 18,299 43.0 2,322 64 295 18 to 44 32,612 52.4 10,281 150 602 45 to 64 13,712 73.9 16,042 752 1,584 65 and over 13,742 89.5 20,880 1,131 1,697
Gender Male 39,882 50.5 19,048 203 946
Female 48,374 67.0 31,188 316 962 Race/ethnicity
Hispanic or Latino (of any race) 20,602 45.2 5,431 96 583 Non-Hispanic or Latino 67,654 63.9 44,805 332 1,037
White, single race 45,327 70.0 35,016 390 1,104 Black, single race 16,768 51.8 7,753 204 893 Asian, single race 2,729 40.6 474 94 428 Other races/multiple races
cHealth Insurance Status 2,830 60.6 1,562 218 911
Under 65 any private 28,044 60.8 9,939 158 583 public only 28,203 58.6 15,932 148 963
uninsured 18,267 36.4 3,485 129 525 65 and over
Medicare only 4,603 89.7 6,137 1,028 1,487 Medicare and private 6,319 91.0 9,181 1,114 1,598
Medicare and other publiccHealth Status
2,724 87.6 5,537 1,560 2,320
Excellent 21,463 44.1 2,966 81 313 Very Good 24,643 53.7 7,149 141 540
Good 26,468 62.7 14,006 294 844 Fair 10,921 82.7 15,078 892 1,669 Poor 4,515 91.6 11,001 1,958 2,661
Table 7. Prescription medicines expendituresa for poor, near poor, and low-income populationsb by selected demographic characteristics: United States, 2002
a Expenses for all prescribed medicines initially purchased or otherwise obtained during the year, as well as any refills, are included. Median and mean expenses are for persons with expenses b Poor or near poor—person in families with income less than 125 percent of the poverty line; low income—persons in families with income from 125 percent to less than 200 percent of the poverty line; middle or high income—persons in families with income at or over 200 percent of the poverty line. c Counts may not add up to the total population because data on this variable were not available for some sampled persons.
Note: Restricted to civilian noninstitutionalized population. Percents may not add to 100 because of rounding.
Source: Center for Financing, Access, and Cost Trends (CFACT), Agency for Healthcare Research and Quality: Medical Expenditure Panel Survey, 2002.
21
Technical Appendix
The data source for this report is the Medical Expenditure Panel Survey (MEPS), an
ongoing annual survey of the civilian noninstitutionalized population that collects detailed
information on health care use and expenditures (including sources of payment), health
insurance, health status, access, and quality. MEPS also collects detailed demographic and
economic information on the people in the households surveyed. Expenditure data in MEPS are
obtained from both the household interview and the Medical Provider Component, which
collects data from a sample of respondents’ hospitals, physicians, home health care providers,
and pharmacies. (See the section “MEPS Expenditures Methodology” in this appendix for more
details.)
More information about MEPS can be found at http://www.meps.ahrq.gov. Detailed
descriptions of the survey and its methodology have been previously published (Cohen JW,
1997; Cohen SB, 2000; Cohen SB, 2003).
Definitions
Expenditures. Expenditures in this report refer to what is actually paid for health care
services. More specifically, in MEPS, expenditures are defined as the sum of direct payments for
care received, including out-of-pocket payments for care received and payments made by private
insurance, Medicare, Medicaid, and other sources. Payments for over-the-counter drugs and
alternative care services are not included in MEPS total expenditures. Indirect payments not
related to specific medical events, such as Medicaid Disproportionate Share and Medicare Direct
Medical Education subsidies, are also not included.
22
This definition of expenditures differs somewhat from that used in predecessor surveys,
the 1987 National Medical Expenditure Survey and the 1977 National Medical Care Expenditure
Survey, in which charges rather than payments were used to measure medical expenditures.
Users who wish to compare the expenditure data presented in this report with data from the 1987
survey should consult Zuvekas and Cohen (2002).
Types of services. The expenditures for total health services (Table 2) represent all types
of services defined in MEPS, including hospital, office-based, home health, dental services,
prescription medicines, and medical supplies. The expenditures for the core services presented
in this report represent a subset of the services, including the following:
• Hospital inpatient services. This category includes room and board and all hospital
diagnostic and laboratory expenses associated with the basic facility charge, payments for
separately billed physician inpatient services, and emergency room expenses incurred
immediately prior to inpatient stays. Expenses for reported hospital stays with the same
admission and discharge dates are also included. Expenses for newborns who left the
hospital on the same day as the mother are included in the mother’s record.
• Hospital outpatient services. This category includes expenses for visits to both
physicians and other medical providers seen in hospital outpatient departments, including
payments for services covered under the basic facility charge and those for separately
billed physician services.
23
• Emergency room services. This category includes expenses for visits to medical
providers seen in emergency rooms (except visits resulting in a hospital admission).
These expenses include payments for services covered under the basic facility charge and
those for separately billed physician services.
• Office-based medical provider services. This category includes expenses for visits to
medical providers seen in office-based settings or clinics.
• Prescription medicines. This category includes expenses for all prescribed medications
initially purchased or otherwise obtained during 2000, as well as any refills.
Sources of payment. Estimates of sources of payment presented in this report represent
the percentage of the total sum of expenditures paid for by each source. Sources of payment are
classified as follows:
• Out of pocket by user or family.
• Private insurance-Includes payments made by insurance plans covering hospital
and medical care (excluding payments from Medicare, Medicaid, and other public
sources). Payments from Medigap plans or TRICARE (Armed-Forces-related coverage)
are also included. Payments from plans that provide coverage for a single service only,
such as dental or vision coverage, are not included.
24
• Medicare-A federally financed health insurance plan for the elderly, persons receiving
Social Security disability payments, and most persons with end-stage renal disease.
Medicare Part A, which provides hospital insurance, is automatically given to those who
are eligible for Social Security. Medicare Part B provides supplementary medical
insurance that pays for medical expenses and can be purchased for a monthly premium.
• Medicaid-A means-tested government program jointly financed by Federal and
State funds that provides health care to those who are eligible. Program eligibility
criteria vary significantly by State, but the program is designed to provide health
coverage to families and individuals who are unable to afford necessary medical care.
• Other-Includes payments from the Department of Veterans Affairs (except
TRICARE); other Federal sources (Indian Health Service, military treatment facilities,
and other care provided by the Federal Government); various State and local sources
(community and neighborhood clinics, State and local health departments, and State
programs other than Medicaid); Workers’ Compensation; various unclassified sources
(e.g., automobile, homeowner’s, or other liability insurance, and other miscellaneous or
unknown sources); Medicaid payments reported for persons who were not reported as
enrolled in the Medicaid program at any time during the year; and private insurance
payments reported for persons without any reported private health insurance coverage
during the year.
25
Age. The respondent was asked to report the age of each family member as of the date of
each interview. In this report, age is based on the sampled person’s age as of December 31st of
the reported year. If data were not collected at the end of the year because the sampled person
was out of scope (e.g., deceased or institutionalized), then age at the time of the last inscope
interview(s) was used.
Race/ethnicity. New standards for racial and ethnic classifications were used by the U.S.
Census Bureau in the 2000 decennial census. All other Federal programs adopted the new
standards by 2003. These changes conform to the revisions of the standards for the classification
of Federal data on race and ethnicity promulgated by the Office of Management and Budget
(OMB) in October 1997. For 1996 through 2002, racial and ethnic classifications were Hispanic,
white non-Hispanic, black non-Hispanic, and other non-Hispanic. As of 2003, the racial and
ethnic classifications are Hispanic or Latino, white non-Hispanic or Latino single race, black
non-Hispanic or Latino single race, and other single race/multiple race non-Hispanic or Latino.
Health insurance status. Individuals under age 65 were classified into the following three
insurance categories based on household responses to health insurance status questions
administered during Rounds 1-3 of the MEPS Household Component.
• Any private health insurance-Individuals who, at any time during the year, had insurance that
provides coverage for hospital and physician care (other than Medicare, Medicaid, or other
public hospital/physician coverage) are classified as having private insurance. Coverage by
TRICARE (Armed-Forces-related coverage) is also included as private health insurance.
26
Insurance that provides coverage for a single service only, such as dental or vision coverage, is
not included.
• Public coverage only-Individuals are considered to have public coverage only if they met both
of the following criteria:
• They were not covered by private insurance at any time during the year.
• They were covered by one of the following public programs at any point during the
year: Medicare, Medicaid, or other public hospital/physician coverage.
• Uninsured-The uninsured are defined as people not covered by Medicare, TRICARE,
Medicaid, other public hospital/physician programs, or private hospital/physician insurance at
any time during the entire year or period of eligibility for the survey. Individuals covered only by
noncomprehensive State-specific programs (e.g., Maryland Kidney Disease Program, Colorado
Child Health Plan) or private single-service plans (e.g., coverage for dental or vision care only,
coverage for accidents or specific diseases) are not considered to be insured.
Individuals age 65 and over were classified into the following three insurance categories:
• Medicare only.
• Medicare and private.
• Medicare and other public.
27
Income. Each year persons were classified according to their family’s income. In this
report, income is expressed in terms of poverty status, the ratio of the family’s income to the
Federal poverty thresholds, which control for the size of the family and the age of the head of the
family. In this report, the following classification was used.
• Poor or Near Poor-Persons in families with income less than 125 percent of the poverty line,
including those whose losses exceeded their earnings, resulting in negative income.
• Low income-Persons in families with income from 125 percent to less than 200 percent of the
poverty line.
• Middle or High income-Persons in families with income at or over 200 percent of the poverty
line.
In MEPS, personal income from each household member was summed to create family
income. Potential income sources asked about in the survey interview include annual earnings
from wages, salaries, bonuses, tips, and commissions; business and farm gains and losses;
unemployment and Workers’ Compensation payments; interests and dividends; alimony, child
support, and other private cash transfers; private pensions; individual retirement account (IRA)
withdrawals; Social Security and Department of Veterans Affairs payments; Supplemental
Security Income and cash welfare payments from public assistance; TANF (Temporary
Assistance for Needy Families, formerly known as Aid to Families with Dependent Children or
AFDC); gains or losses from estates, trusts, partnerships, C corporations, rent, and royalties; and
a small amount of other income.
28
Perceived health status. In every round of MEPS, the respondent was asked to rate the
health of every member of the family. The exact wording of the question is as follows: “In
general, compared to other people of (PERSON)’s age, would you say that (PERSON)’s health is
excellent, very good, good, fair, or poor?” In the tables, this variable usually reflects responses to
the last interview for the calendar year (Round 3 or Round 5). However, if no response was
obtained from that interview, then reported health status was based on the most recent of the
prior two interviews. A small proportion of persons had no valid response for health status on
any of the three interviews.
Sample Design
Each year, the MEPS Household Component (HC) sample is drawn from those
households that completed the prior year’s National Health Interview Survey (NHIS). For
example, households selected for participation in MEPS Panel 7 (beginning in 2002) completed
interviews in the 2001 NHIS, the sample for MEPS Panel 6 (beginning in 2001) was drawn from
the 2000 NHIS, and so on. Because NHIS is used as a sampling frame, the MEPS design is not
only nationally representative of the civilian noninstitutionalized population, but also includes an
oversampling of Hispanics and blacks. NHIS is conducted by the National Center for Health
Statistics (NCHS), Centers for Disease Control and Prevention.
MEPS collects data via an overlapping panel design. Each household completes five
interviews (“rounds” of data collection) over a period of 21/2 years, providing data for two full
calendar years. Data from Rounds 1, 2, and 3 provide information for the first year of estimation,
and data from Rounds 3, 4, and 5 provide data for the second year of estimates. The estimates in
29
this report for calendar year 2002 were based on data collected from Rounds 3, 4, and 5 of
MEPS Panel 6 and Rounds 1, 2, and 3 of MEPS Panel 7. (Note that the reference period for
Round 3 of a MEPS panel overlaps two calendar years.) In MEPS, a single respondent provides
most of the information on the health care experience of the entire family via computer-assisted
personal interviewing (CAPI).
The MEPS response rate reflects response to both MEPS and NHIS. The overall response
rate for MEPS Panel 6 in 2001, including the NHIS response rate, was 64.0 percent. The overall
response rate for Panel 7 in 2002, including the NHIS response rate, was 65.6 percent. The
response rate for 2002 MEPS annual estimates after combining both panels was 64.7 percent.
Accuracy of Estimates
The estimates of total expenditures in each table are based on 37,418 sampled persons.
They were weighted to develop population estimates for a total of 288,181,763 persons who
were in the U.S. civilian noninstitutionalized population for part or all of 2002. All expenditures
for persons who were in the target population for the full year, from January 1 through December
31, 2002, were included in the estimates. People with part-year information include newborns;
people who died during the year; and people who resided in an institution, were in the military,
or lived outside the country for part of the year. Expenditures for deceased persons were
measured for the period from January 1 through the date of death, while those for newborns were
measured from the date of birth through December 31. Expenses incurred during periods of full-
time active-duty military service, institutionalization, or residency outside the country were not
included.
30
Tests of statistical significance were used to determine whether the differences between
populations exist at specified levels of confidence or whether they occurred by chance.
Differences were tested using Z-scores having asymptotic normal properties at the 0.05 level of
significance. Only statistically significant differences between estimates are discussed in the text.
However, it should be noted that each individual significance test was conducted at the 0.05
level, which does not control the error rate for all significance tests conducted simultaneously at
the 0.05 level.
The statistics presented in this report are affected by both sampling error and sources of
nonsampling error, which include nonresponse bias, respondent reporting errors (response
errors), interviewer effects, and data processing misspecifications. The nonsampling errors, such
as response errors, are difficult to measure, but every effort is made to minimize such errors at
each step of the MEPS operation. The sampling error, however, can be measured by the variance
of the estimator. A Taylor-series approach in SUDAAN is used to produce appropriate standard
errors for weighted estimates from MEPS with its complex survey design. Standard errors for
the MEPS estimates in this report are shown in Tables A-G. The MEPS person-level estimation
weights include nonresponse adjustments and poststratification adjustments to population
estimates derived from the Current Population Survey based on cross-classifications by region,
MSA status, age, race/ethnicity, and sex. For a detailed description of the MEPS survey design,
sample design, estimation strategies, and methods used to minimize sources of nonsampling
error, see JW Cohen (1997), SB Cohen (1997), and SB Cohen (2003).
Estimates presented in the tables are rounded as follows:
31
• Percentages are rounded to the nearest 0.1 percentage point.
• Mean and median expenditures are rounded to the nearest dollar.
• Total expenditures are rounded to the nearest million dollar unit.
Some of the estimates for population totals of subgroups presented in the tables will not add
exactly to the overall estimated population total as a consequence of rounding.
MEPS Expenditures Methodology
Expenditure estimates in this report are based on the sum of total payments for medical
events in 2002 reported in the MEPS HC. The HC collected annual data on the use of and
associated expenditures for office- and hospital-based care, emergency room services, home
health care, dental services, prescription medicines, and vision aids and other medical equipment
and services. In addition, the MEPS Medical Provider Component (MPC) collected expenditure
data from a sample of medical and pharmaceutical providers that provided care and medicines to
sample people in 2002. Expenditure data collected in the MPC are generally regarded as more
accurate than comparable data collected in the HC and were used to improve the overall quality
of MEPS expenditure data in this report. For a more detailed description of the MPC, see
Machlin and Taylor (2000).
Expenditure data were imputed to replace missing data, provide estimates for care
delivered under capitated reimbursement arrangements, and adjust household-reported insurance
payments because respondents were often unaware that their insurer paid a discounted amount to
the provider. This section contains a general description of the approaches used for these three
situations. A more detailed description of the editing and imputation procedures is provided in
32
the documentation for the MEPS event-level files, which are available through the AHRQ Web
site at http://www.meps.ahrq.gov/. For more information on the approach used to impute missing
expenditure data on prescription medicines, see Moeller, Stagnitti, Horan, et al. (2001).
Missing data on expenditures were imputed using a weighted sequential hot-deck
procedure for most medical visits and services. In general, this procedure imputes data from
events with complete information to events with missing information but similar characteristics.
For each event type, selected predictor variables with known values (e.g., total charge;
demographic characteristics; region; provider type; and characteristics of the event of care, such
as whether it involved surgery) were used to form groups of donor events with known data on
expenditures, as well as identical groups of recipient events with missing data. Within such
groups, data were assigned from donors to recipients, taking into account the weights associated
with the complex MEPS survey design. Only MPC data were used as donors for hospital-based
events, while data from both the HC and MPC were used as donors for office-based physician
visits.
Because payments for medical care provided under capitated reimbursement
arrangements and through public clinics and Department of Veterans Affairs (VA) hospitals are
not tied to particular medical events, expenditures for events covered under those types of
arrangements and settings were also imputed. Events covered under capitated arrangements were
imputed from events covered under managed care arrangements that were paid based on a
discounted fee-for-service method, while imputations for visits to public clinics and VA
hospitals were based on similar events that were paid on a fee-for-service basis. As for other
events, selected predictor variables were used to form groups of donor and recipient events for
the imputations.
33
An adjustment also was applied to some HC-reported expenditure data because an
evaluation of matched HC/MPC data showed that respondents who reported that charges and
payments were equal were often unaware that insurance payments for the care had been based on
a discounted charge. To compensate for this systematic reporting error, a weighted sequential
hot-deck imputation procedure was implemented to determine an adjustment factor for HC-
reported insurance payments when charges and payments were reported to be equal. As for the
other imputations, selected predictor variables were used to form groups of donor and recipient
events for the imputation process.
In some situations, it was reported that one charge covered multiple contacts between a
sampled person and a medical provider (e.g., obstetrical services, orthodontia). In these
situations, total payments for the fee (sometimes called a flat or global fee) were included if the
initial service was provided in 2002. For example, all payments for an orthodontist’s fee that
covered multiple visits over 3 years were included if the initial visit occurred in 2002. However,
if a 2002 visit to an orthodontist was part of a flat fee for which the initial visit occurred in 2001,
then none of the payments for the flat fee were included. Most of the expenditures for medical
care reported by MEPS participants were associated with medical events that were not part of a
flat-fee arrangement.
Sample respondents sometimes reported medical events for which no payments actually
were made. This situation could occur for several reasons, including when free care or a free
sample of medicine was provided, bad debt was incurred, no charge was made for a followup
visit (e.g., after a surgical procedure), or care was covered under a flat-fee arrangement
beginning in an earlier year. These types of events were treated as valid $0 payments when
developing the estimates contained in this report.
34
Because of methodological differences, caution should be used when comparing the
estimates in this report with data from other sources. National health care expenditures from
MEPS, for example, are lower than the expenditures for personal health care typically cited from
the National Health Accounts (NHA) of the Centers for Medicare & Medicaid Services. The
primary reasons for the differences are that the NHA include a wider variety of expenses and
also include expenses for people who are not part of the community population. A comparison of
MEPS and NHA estimates for comparable expenditures and population has been previously
published (Selden, Levit, Cohen, et al., 2001).
35
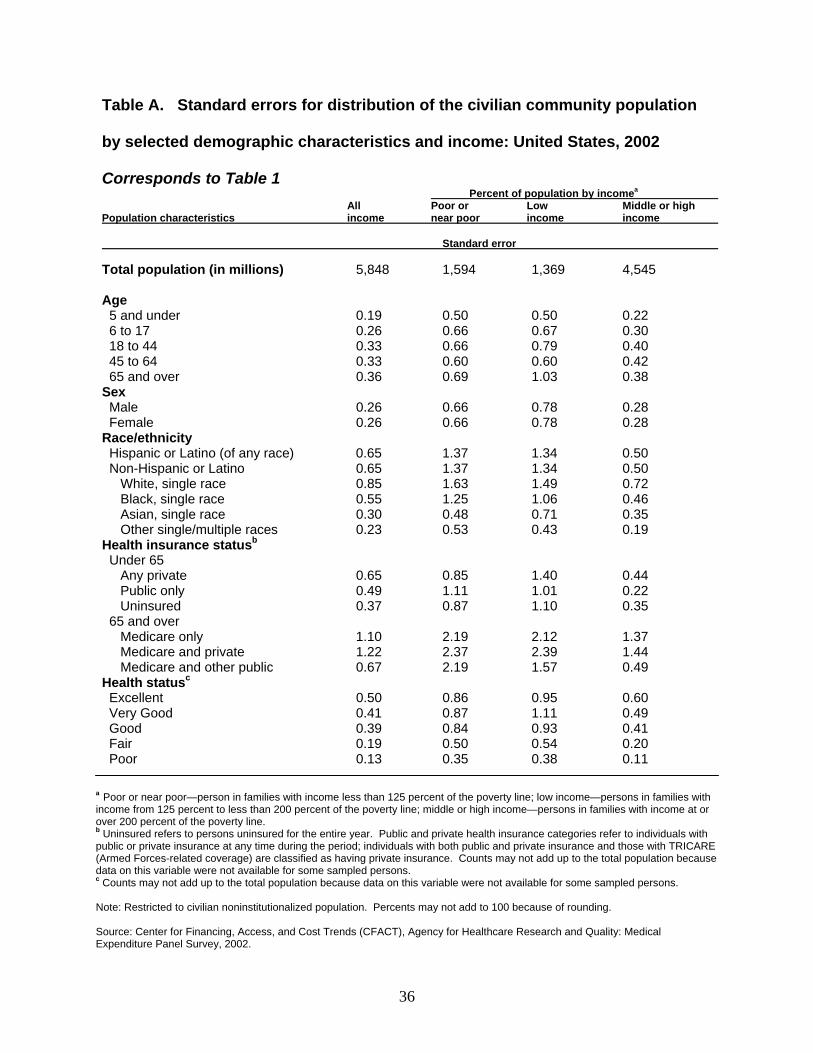
Table A. Standard errors for distribution of the civilian community population
by selected demographic characteristics and income: United States, 2002
Corresponds to Table 1 Percent of population by incomea
Population characteristics Allincome
Poor ornear poor
Lowincome
Middle or high income
Standard error
Total population (in millions) 5,848 1,594 1,369 4,545
Age 5 and under 0.19 0.50 0.50 0.22 6 to 17 0.26 0.66 0.67 0.30 18 to 44 0.33 0.66 0.79 0.40 45 to 64 0.33 0.60 0.60 0.42 65 and over 0.36 0.69 1.03 0.38
Sex Male 0.26 0.66 0.78 0.28 Female 0.26 0.66 0.78 0.28
Race/ethnicity Hispanic or Latino (of any race) 0.65 1.37 1.34 0.50 Non-Hispanic or Latino 0.65 1.37 1.34 0.50
White, single race 0.85 1.63 1.49 0.72 Black, single race 0.55 1.25 1.06 0.46 Asian, single race 0.30 0.48 0.71 0.35 Other single/multiple races
Health insurance statusb0.23 0.53 0.43 0.19
Under 65 Any private 0.65 0.85 1.40 0.44 Public only 0.49 1.11 1.01 0.22 Uninsured 0.37 0.87 1.10 0.35
65 and over Medicare only 1.10 2.19 2.12 1.37 Medicare and private 1.22 2.37 2.39 1.44 Medicare and other public
Health statusc0.67 2.19 1.57 0.49
Excellent 0.50 0.86 0.95 0.60 Very Good 0.41 0.87 1.11 0.49 Good 0.39 0.84 0.93 0.41 Fair 0.19 0.50 0.54 0.20 Poor 0.13 0.35 0.38 0.11
a Poor or near poor—person in families with income less than 125 percent of the poverty line; low income—persons in families with income from 125 percent to less than 200 percent of the poverty line; middle or high income—persons in families with income at or over 200 percent of the poverty line.b Uninsured refers to persons uninsured for the entire year. Public and private health insurance categories refer to individuals with public or private insurance at any time during the period; individuals with both public and private insurance and those with TRICARE (Armed Forces-related coverage) are classified as having private insurance. Counts may not add up to the total population because data on this variable were not available for some sampled persons. c Counts may not add up to the total population because data on this variable were not available for some sampled persons.
Note: Restricted to civilian noninstitutionalized population. Percents may not add to 100 because of rounding.
Source: Center for Financing, Access, and Cost Trends (CFACT), Agency for Healthcare Research and Quality: Medical Expenditure Panel Survey, 2002.
36
195 0.78 1.86 1.89 1.95
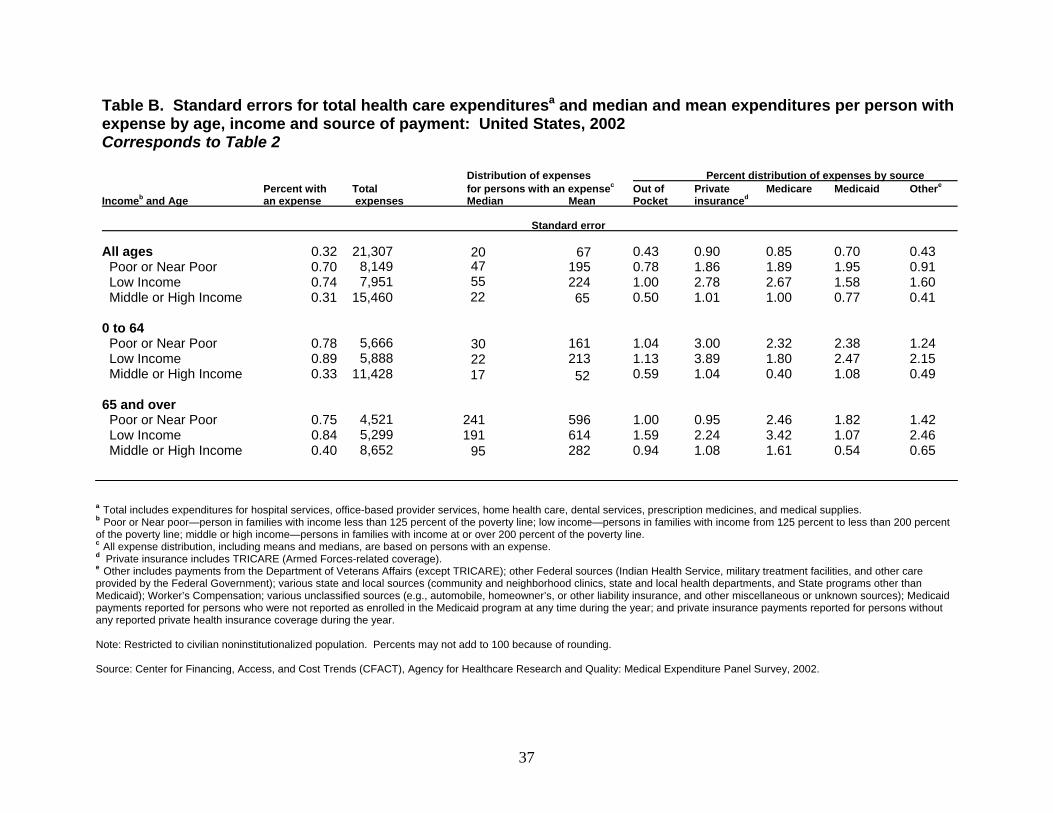
Table B. Standard errors for total health care expendituresa and median and mean expenditures per person with expense by age, income and source of payment: United States, 2002 Corresponds to Table 2
Distribution of expenses Percent distribution of expenses by source
Incomeb and Age Percent with an expense
Total expenses
for persons with an expensec
Median Mean Out of Pocket
Private insuranced
Medicare Medicaid Othere
Standard error
All ages Poor or Near Poor
0.32 0.70
21,307 8,149
20 47
67 0.43 0.90 0.85 0.70 0.43 0.91
Low Income 0.74 7,951 55 224 1.00 2.78 2.67 1.58 1.60 Middle or High Income 0.31 15,460 22 65 0.50 1.01 1.00 0.77 0.41
0 to 64 Poor or Near Poor 0.78 5,666 30 161 1.04 3.00 2.32 2.38 1.24 Low Income 0.89 5,888 22 213 1.13 3.89 1.80 2.47 2.15 Middle or High Income 0.33 11,428 17 52 0.59 1.04 0.40 1.08 0.49
65 and over Poor or Near Poor 0.75 4,521 241 596 1.00 0.95 2.46 1.82 1.42 Low Income 0.84 5,299 191 614 1.59 2.24 3.42 1.07 2.46 Middle or High Income 0.40 8,652 95 282 0.94 1.08 1.61 0.54 0.65
a Total includes expenditures for hospital services, office-based provider services, home health care, dental services, prescription medicines, and medical supplies. b Poor or Near poor—person in families with income less than 125 percent of the poverty line; low income—persons in families with income from 125 percent to less than 200 percent of the poverty line; middle or high income—persons in families with income at or over 200 percent of the poverty line. c All expense distribution, including means and medians, are based on persons with an expense. d Private insurance includes TRICARE (Armed Forces-related coverage). e Other includes payments from the Department of Veterans Affairs (except TRICARE); other Federal sources (Indian Health Service, military treatment facilities, and other care provided by the Federal Government); various state and local sources (community and neighborhood clinics, state and local health departments, and State programs other than Medicaid); Worker’s Compensation; various unclassified sources (e.g., automobile, homeowner’s, or other liability insurance, and other miscellaneous or unknown sources); Medicaid payments reported for persons who were not reported as enrolled in the Medicaid program at any time during the year; and private insurance payments reported for persons without any reported private health insurance coverage during the year.
Note: Restricted to civilian noninstitutionalized population. Percents may not add to 100 because of rounding.
Source: Center for Financing, Access, and Cost Trends (CFACT), Agency for Healthcare Research and Quality: Medical Expenditure Panel Survey, 2002.
37
Emergency Room visits
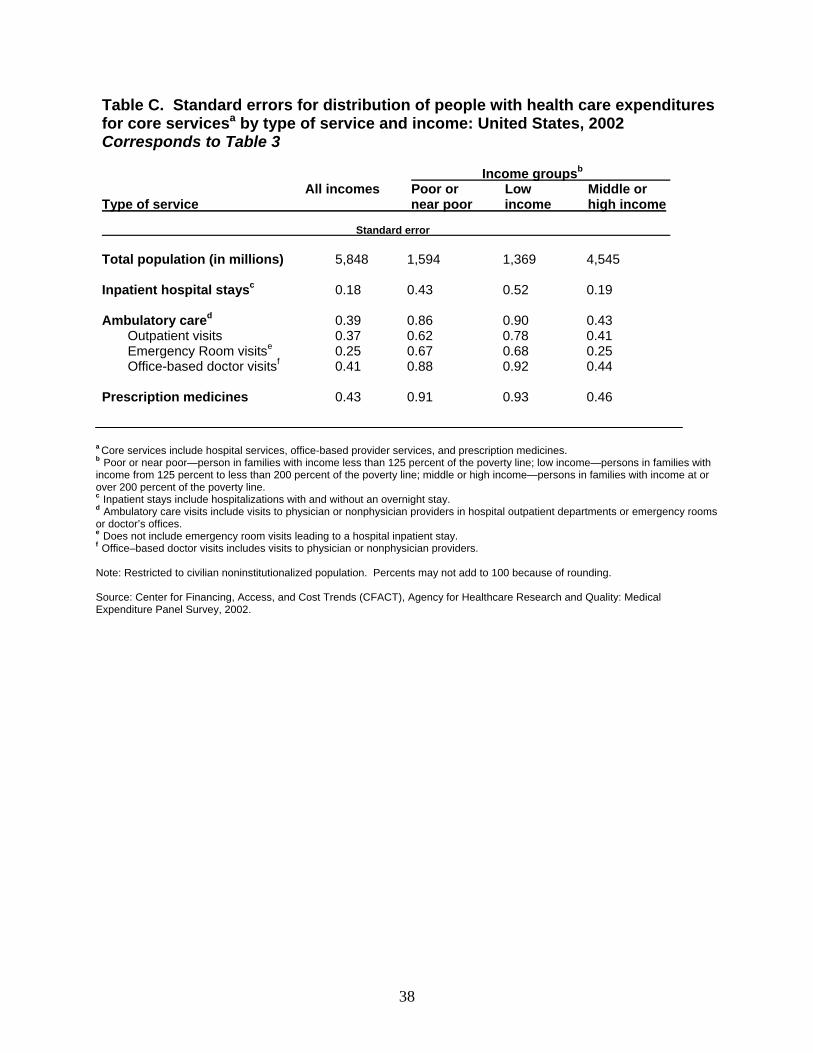
Table C. Standard errors for distribution of people with health care expenditures for core servicesa by type of service and income: United States, 2002 Corresponds to Table 3
Income groupsb
All incomes Poor or Low Middle or Type of service near poor income high income
Standard error
Total population (in millions) 5,848 1,594 1,369 4,545
Inpatient hospital staysc 0.18
0.43 0.52 0.19
Ambulatory cared
Outpatient visits e
Office-based doctor visitsf
0.39 0.370.25 0.41
0.860.620.670.88
0.90 0.78 0.68 0.92
0.43 0.410.250.44
Prescription medicines 0.43 0.91 0.93 0.46
a Core services include hospital services, office-based provider services, and prescription medicines. b Poor or near poor—person in families with income less than 125 percent of the poverty line; low income—persons in families with income from 125 percent to less than 200 percent of the poverty line; middle or high income—persons in families with income at or over 200 percent of the poverty line. c Inpatient stays include hospitalizations with and without an overnight stay. d Ambulatory care visits include visits to physician or nonphysician providers in hospital outpatient departments or emergency rooms or doctor’s offices. e Does not include emergency room visits leading to a hospital inpatient stay. f Office–based doctor visits includes visits to physician or nonphysician providers.
Note: Restricted to civilian noninstitutionalized population. Percents may not add to 100 because of rounding.
Source: Center for Financing, Access, and Cost Trends (CFACT), Agency for Healthcare Research and Quality: Medical Expenditure Panel Survey, 2002.
38
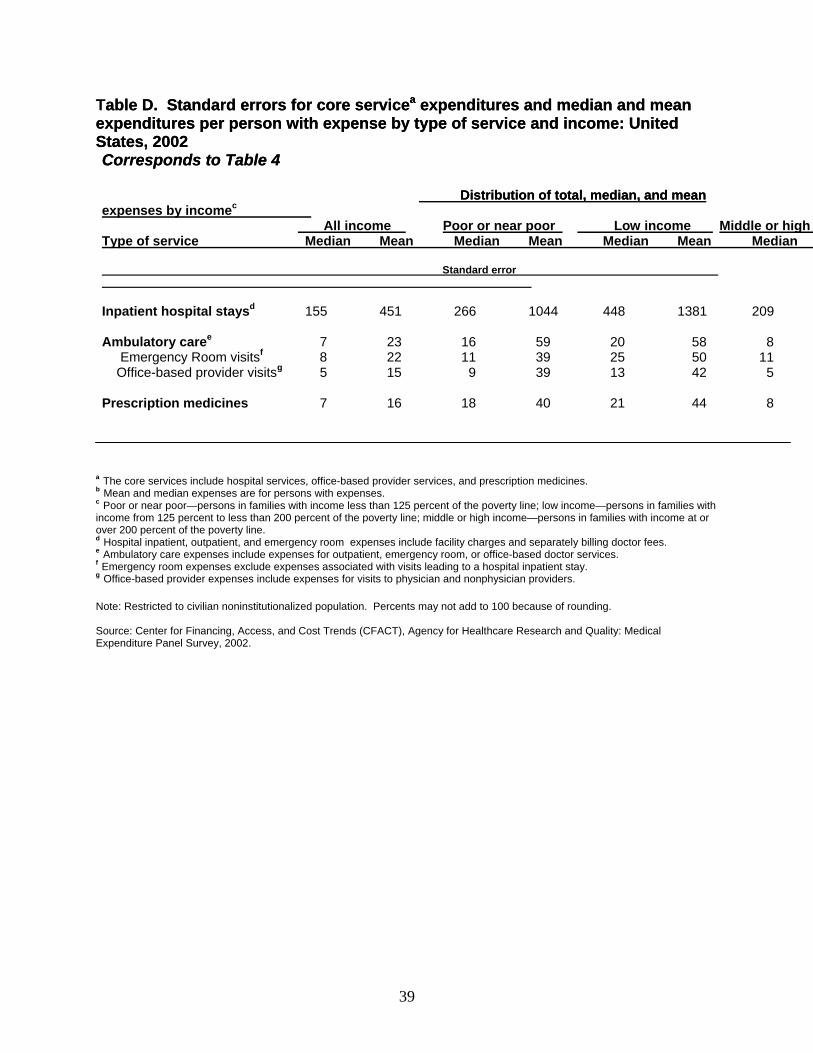
Table D.able D. SSttandard errors for core serviceandard errors for core serviceaa expenditures and median and meanexpenditures and median and mean expenditures per person wexpenditures per person wiith eth exxpense bypense by type of service and income: Unitedtype of service and income: United States, 2002States, 2002 Corresponds to Table 4Corresponds to Table 4
DistribuDistributiontion of toof total, median, and meantal, median, and mean expenses by incomec
Type of service All income
Median Mean Poor or near poor
Median Mean Low income Middle or high
Median Mean Median
Standard error
Inpatient hospital staysd 155 451 266 1044 448 1381 209
Ambulatory caree
Emergency Room visitsf
Office-based provider visitsg
7 8 5
23 22 15
16 11 9
59 39 39
20 25 13
58 50 42
8 11 5
Prescription medicines 7 16 18 40 21 44 8
a The core services include hospital services, office-based provider services, and prescription medicines. b Mean and median expenses are for persons with expenses. c Poor or near poor—persons in families with income less than 125 percent of the poverty line; low income—persons in families with income from 125 percent to less than 200 percent of the poverty line; middle or high income—persons in families with income at or over 200 percent of the poverty line.d Hospital inpatient, outpatient, and emergency room expenses include facility charges and separately billing doctor fees. e Ambulatory care expenses include expenses for outpatient, emergency room, or office-based doctor services. f Emergency room expenses exclude expenses associated with visits leading to a hospital inpatient stay. g Office-based provider expenses include expenses for visits to physician and nonphysician providers.
Note: Restricted to civilian noninstitutionalized population. Percents may not add to 100 because of rounding.
Source: Center for Financing, Access, and Cost Trends (CFACT), Agency for Healthcare Research and Quality: Medical Expenditure Panel Survey, 2002.
39
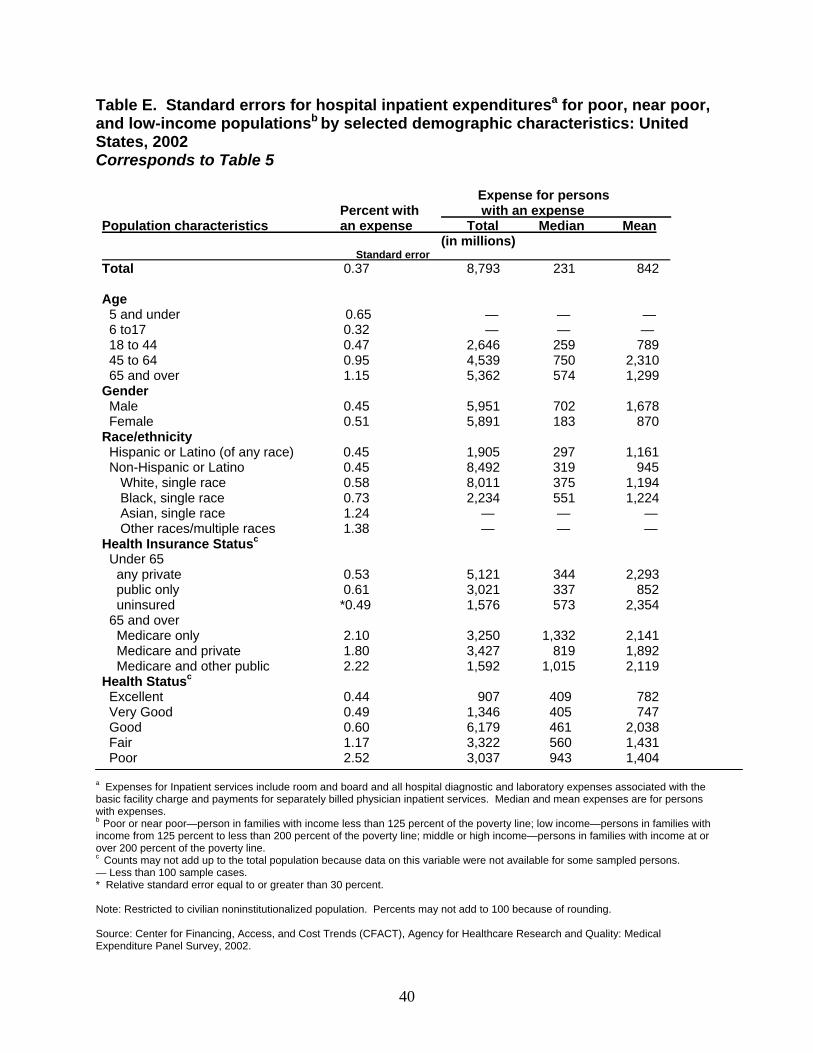
Table E. Standard errors for hospital inpatient expendituresa for poor, near poor, and low-income populationsb by selected demographic characteristics: United States, 2002 Corresponds to Table 5
Population characteristics Percent with an expense
Standard error
Expense for persons with an expense
Total (in millions)
Median Mean
Total 0.37 8,793 231 842
Age 5 and under 0.65 — — — 6 to17 0.32 — — — 18 to 44 0.47 2,646 259 789 45 to 64 0.95 4,539 750 2,310 65 and over 1.15 5,362 574 1,299
Gender Male 0.45 5,951 702 1,678 Female 0.51 5,891 183 870
Race/ethnicity Hispanic or Latino (of any race) 0.45 1,905 297 1,161 Non-Hispanic or Latino 0.45 8,492 319 945
White, single race 0.58 8,011 375 1,194 Black, single race 0.73 2,234 551 1,224 Asian, single race 1.24 — — — Other races/multiple races
Health Insurance Statusc 1.38 — — —
Under 65 any private 0.53 5,121 344 2,293 public only 0.61 3,021 337 852
uninsured *0.49 1,576 573 2,354 65 and over
Medicare only 2.10 3,250 1,332 2,141 Medicare and private 1.80 3,427 819 1,892 Medicare and other publicHealth Statusc
2.22 1,592 1,015 2,119
Excellent 0.44 907 409 782 Very Good 0.49 1,346 405 747 Good 0.60 6,179 461 2,038 Fair 1.17 3,322 560 1,431 Poor 2.52 3,037 943 1,404
a Expenses for Inpatient services include room and board and all hospital diagnostic and laboratory expenses associated with the basic facility charge and payments for separately billed physician inpatient services. Median and mean expenses are for persons with expenses. b Poor or near poor—person in families with income less than 125 percent of the poverty line; low income—persons in families with income from 125 percent to less than 200 percent of the poverty line; middle or high income—persons in families with income at or over 200 percent of the poverty line. c Counts may not add up to the total population because data on this variable were not available for some sampled persons. — Less than 100 sample cases. * Relative standard error equal to or greater than 30 percent.
Note: Restricted to civilian noninstitutionalized population. Percents may not add to 100 because of rounding.
Source: Center for Financing, Access, and Cost Trends (CFACT), Agency for Healthcare Research and Quality: Medical Expenditure Panel Survey, 2002.
40
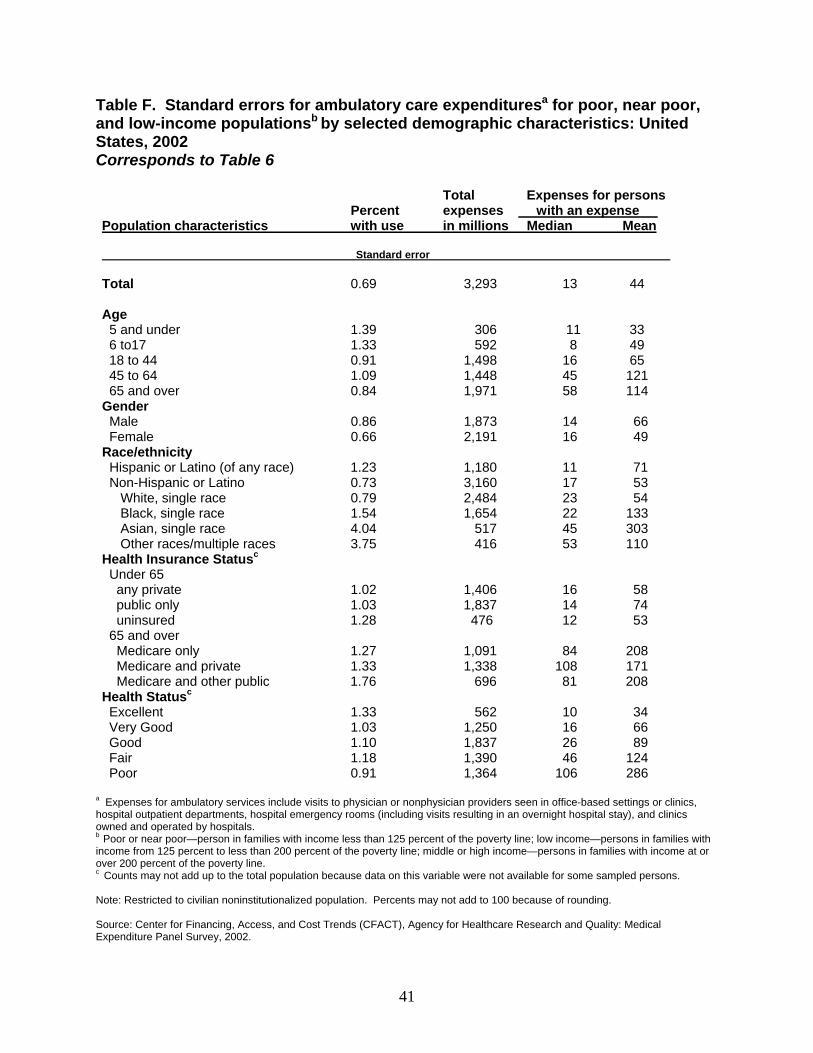
Table F. Standard errors for ambulatory care expendituresa for poor, near poor, and low-income populationsb by selected demographic characteristics: United States, 2002 Corresponds to Table 6
Population characteristics Percent with use
Total expenses in millions
Expenses for persons with an expense
Median Mean
Standard error
Total 0.69 3,293 13 44
Age 5 and under 1.39 306 11 33 6 to17 1.33 592 8 49 18 to 44 0.91 1,498 16 65 45 to 64 1.09 1,448 45 121 65 and over 0.84 1,971 58 114
Gender Male 0.86 1,873 14 66 Female 0.66 2,191 16 49
Race/ethnicity Hispanic or Latino (of any race) 1.23 1,180 11 71 Non-Hispanic or Latino 0.73 3,160 17 53
White, single race 0.79 2,484 23 54 Black, single race 1.54 1,654 22 133 Asian, single race 4.04 517 45 303 Other races/multiple races
Health Insurance Statusc3.75 416 53 110
Under 65 any private 1.02 1,406 16 58 public only 1.03 1,837 14 74
uninsured 1.28 476 12 53 65 and over
Medicare only 1.27 1,091 84 208 Medicare and private 1.33 1,338 108 171 Medicare and other public Health Statusc
1.76 696 81 208
Excellent 1.33 562 10 34 Very Good 1.03 1,250 16 66 Good 1.10 1,837 26 89 Fair 1.18 1,390 46 124 Poor 0.91 1,364 106 286
a Expenses for ambulatory services include visits to physician or nonphysician providers seen in office-based settings or clinics, hospital outpatient departments, hospital emergency rooms (including visits resulting in an overnight hospital stay), and clinics owned and operated by hospitals. b Poor or near poor—person in families with income less than 125 percent of the poverty line; low income—persons in families with income from 125 percent to less than 200 percent of the poverty line; middle or high income—persons in families with income at or over 200 percent of the poverty line. c Counts may not add up to the total population because data on this variable were not available for some sampled persons.
Note: Restricted to civilian noninstitutionalized population. Percents may not add to 100 because of rounding.
Source: Center for Financing, Access, and Cost Trends (CFACT), Agency for Healthcare Research and Quality: Medical Expenditure Panel Survey, 2002.
41
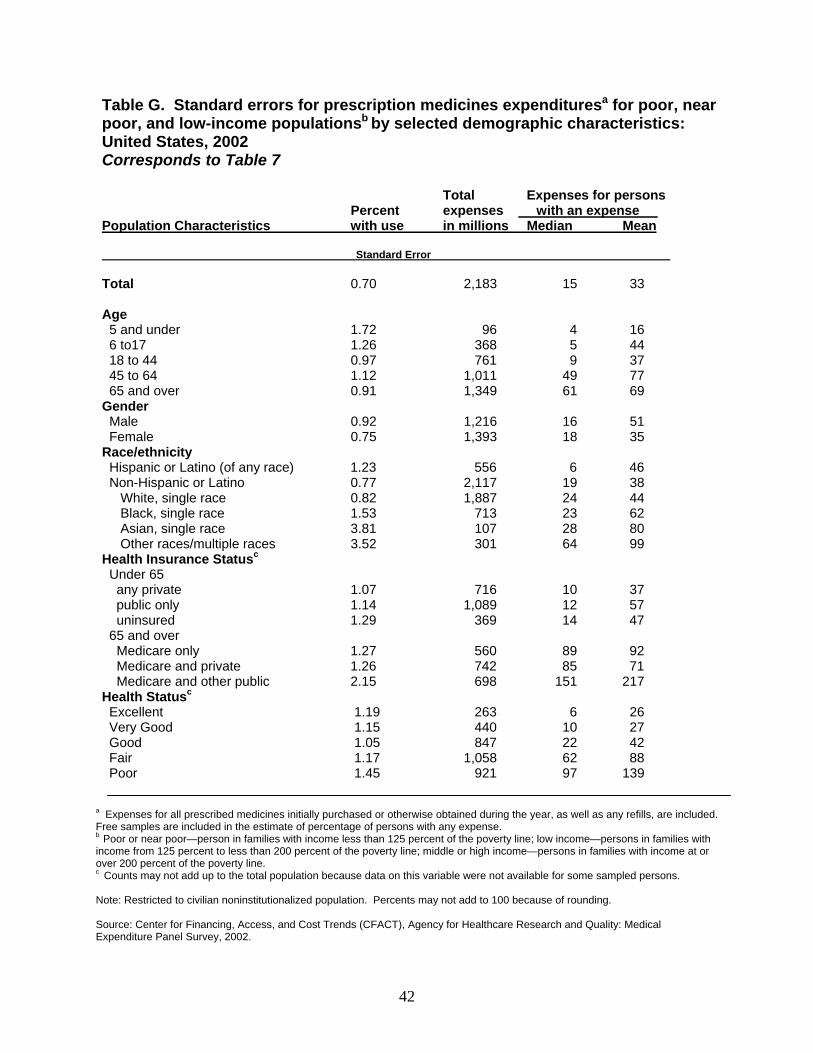
Table G. Standard errors for prescription medicines expendituresa for poor, near poor, and low-income populationsb by selected demographic characteristics: United States, 2002 Corresponds to Table 7
Population Characteristics Percent with use
Total expenses in millions
Expenses for persons with an expense
Median Mean
Standard Error
Total 0.70 2,183 15 33
Age 5 and under 1.72 96 4 16 6 to17 1.26 368 5 44 18 to 44 0.97 761 9 37 45 to 64 1.12 1,011 49 77 65 and over 0.91 1,349 61 69
Gender Male 0.92 1,216 16 51 Female 0.75 1,393 18 35
Race/ethnicity Hispanic or Latino (of any race) 1.23 556 6 46 Non-Hispanic or Latino 0.77 2,117 19 38
White, single race 0.82 1,887 24 44 Black, single race 1.53 713 23 62 Asian, single race 3.81 107 28 80 Other races/multiple races
Health Insurance Statusc3.52 301 64 99
Under 65 any private 1.07 716 10 37 public only 1.14 1,089 12 57
uninsured 1.29 369 14 47 65 and over
Medicare only 1.27 560 89 92 Medicare and private 1.26 742 85 71 Medicare and other public Health Statusc
2.15 698 151 217
Excellent 1.19 263 6 26 Very Good 1.15 440 10 27 Good 1.05 847 22 42 Fair 1.17 1,058 62 88 Poor 1.45 921 97 139
a Expenses for all prescribed medicines initially purchased or otherwise obtained during the year, as well as any refills, are included. Free samples are included in the estimate of percentage of persons with any expense. b Poor or near poor—person in families with income less than 125 percent of the poverty line; low income—persons in families with income from 125 percent to less than 200 percent of the poverty line; middle or high income—persons in families with income at or over 200 percent of the poverty line. c Counts may not add up to the total population because data on this variable were not available for some sampled persons.
Note: Restricted to civilian noninstitutionalized population. Percents may not add to 100 because of rounding.
Source: Center for Financing, Access, and Cost Trends (CFACT), Agency for Healthcare Research and Quality: Medical Expenditure Panel Survey, 2002.
42