Embed Size (px)
Citation preview

Supported by
WORKING PAPER – REPORT D7.2 Methodologies for Integration of Energy Performance
and Life-Cycle Costing Indicators into Property Valuation Practice
Authors: Bienert, Sven KPMG Austria
Schützenhofer, Christian KPMG Austria
Leopoldsberger, Gerrit Dr. Leopoldsberger + Partner
Bobsin, Kerstin Dr. Leopoldsberger + Partner
Leutgöb, Klemens e7
Hüttler, Walter e7
Popescu, Daniela TU Iasi
Mladin, Emilia-Cerna TU Iasi
Koch, David FH Kufstein
Edvardsen, Dag Fjeld SINTEF
Full title of the project: Improving the market impact of energy certification by
introducing energy efficiency and life-cycle cost into
property valuation practice
Acronym of project: IMMOVALUE
Co-ordinator: KPMG Financial Advisory Services GmbH
Dr. Sven Bienert
Project website: www.immovalue.org
WORK PACKAGE 7 WORKING PAPER REPORT D7.2
1
IMMOVALUE – IEE/07/553/SI2.499204 Page 1
I. Table of Content
I. TABLE OF CONTENT 1
II. GLOSSARY 6
III. INDEX OF FIGURES AND TABLES 9
1 INTRODUCTION 13
2 BACKGROUND 15
3 AIMS AND TARGETS OF THE REPORT 18
4 DEFINITION AND EXPLANATION OF THE “GREEN VALUE”
TERMINOLOGY 20
4.1 “Sustainability” in a broader sense 21
4.2 Definition of “Green Building” 22
4.3 Terminology of “Energy-Efficient Buildings” 24
4.4 “Green Value” terminology 24
5 OVERVIEW ON VALUATION APPROACHES, ENERGY
PERFORMANCE CERTIFICATES AND LCCA APPROACHES
(DELIVERABLE D5.1) 28
5.1 Analysis of Valuation Approaches 28
5.1.1 Valuation Approaches 29
5.1.2 International Research - “Green/energy-efficient achieves an added Value” 31
5.1.2.1 Non-European research results 31
5.1.2.2 European research results 33
5.1.2.2.1 Swiss Valuation Model - ESI Valuation 33
5.1.2.2.2 German Ecologic Rent Tables 35
5.1.2.3 Survey of Roland Berger 39
5.1.2.4 Critical remarks - The applicability of the recent research results 40
WORK PACKAGE 7 WORKING PAPER REPORT D7.2
2
IMMOVALUE – IEE/07/553/SI2.499204 Page 2
5.1.3 Possible Linkages to property valuation 41
5.2 Analysis of Energy Performance Certificates 44
5.2.1 Basics for Valuers 44
5.2.1.1 Calculated energy use 45
5.2.1.2 Measured energy use 46
5.2.2 Starting points for an integration of EPC into property valuation 47
5.2.2.1 No direct use of EPC due to large differences throughout Europe 47
5.2.2.2 Link between EPC and the information needed for property valuation 50
5.2.2.3 EPC improves data quality for property valuation purposes 52
5.3 Analysis of Life-Cycle Costing 54
5.3.1 Basics for valuers 55
5.3.1.1 Cost data classifications in LCCA 55
5.3.1.2 Deflator in LCCA 58
5.3.1.3 LCCA reflects only internalised costs 58
5.3.1.4 Simplifications of LCCA in practice 58
5.3.1.5 Use of LCCA at present 59
5.3.1.6 Service Life Planning 59
5.3.2 Starting points for integration of LCCA into property valuation 60
5.3.2.1 Integrating risk analysis into the LCC 61
5.3.2.2 Possible simplifications 62
5.3.2.3 LCCA supporting software tools 63
5.3.3 Will valuers more frequently use LCC in the future? 64
5.4 Gap between current valuation approaches and EPC resp. LCCA (deliverable
5.1) 65
5.4.1 State of the art in valuing energy-efficient resp. green buildings 65
5.4.2 Gap and required investigations 67
5.4.2.1 Gap between valuation and energy performance certificates 68
5.4.2.2 Gap between valuation and LCC 69
5.4.2.3 Required future tasks 69

WORK PACKAGE 7 WORKING PAPER REPORT D7.2
3
IMMOVALUE – IEE/07/553/SI2.499204 Page 3
6 INTEGRATION OF LCC AND EPC INTO PROPERTY
VALUATION APPROACHES (DELIVERABLE D5.2) 71
6.1 General requirements of valuation methodologies for integration in practice 71
6.2 Fundamental challenge when „putting an added value on green buildings“ 73
6.2.1 General Discussion 74
6.2.2 Willingness to pay vs. technical aspects and costs 77
6.2.3 Evolution of green value 80
6.2.4 Rising use of green building rating tools 84
6.2.5 Rising sensibility for Corporate Social Responsibility 87
6.2.6 Knowledge deficit of property valuers regarding sustainability issues 89
6.2.7 Country practice vs. European-wide common practice 90
6.3 Qualitative Integration into valuation process 92
6.3.1 Descriptive Integration of Energy Efficiency 93
6.3.2 Possible Considerations of data available from EPC 97
6.3.2.1 EPC is available 97
6.3.2.2 EPC is not available 98
6.4 Quantitative integration into valuation process 100
6.4.1 General background concerning the valuation approaches 100
6.4.2 Operating Cost as major link between valuation and EPC/LCCA 103
6.4.2.1 Deriving energy cost from the EPC 104
6.4.2.2 Using cost difference 104
6.4.3 Income related Approaches 106
6.4.3.1 Main green value drivers 108
6.4.3.2 Derivation/modification of basic approach for integration 110
6.4.3.2.1 Methodology for developed markets 117
6.4.3.2.2 Methodology for opaque markets 135
6.4.3.3 Case Study 1 – Evidence from econometric analysis for the case of a
developed market 143
6.4.3.3.1 Effect of energy performance for office buildings 143
6.4.3.3.2 Residential real estate - omitted variable bias 152

WORK PACKAGE 7 WORKING PAPER REPORT D7.2
4
IMMOVALUE – IEE/07/553/SI2.499204 Page 4
6.4.3.4 Case Study 2 – Basic makeshift for opaque markets 158
6.4.4 Sales comparison Approach 162
6.4.4.1 Derivation/modification of basic approach for integration 163
6.4.4.1.1 Methodology for developed markets 163
6.4.4.1.2 Methodology for opaque markets 170
6.4.4.2 Case Study 171
6.4.5 Cost Approach 175
6.4.5.1 Main green value drivers 178
6.4.5.2 Derivation/modification of basic approach for integration 179
6.4.5.3 Methodology for developed markets 183
6.4.5.4 Approach for “undeveloped/emerging markets” 192
6.4.5.5 Case Study 1 – Basic makeshift for transparent markets 196
6.4.5.6 Case Study 2 – Basic makeshifts for opaque markets 199
7 ROADMAP FOR IMPLEMENTATION (DELIVERABLE D5.3) 203
7.1 General Circumstances and requirements for implementation 203
7.2 Main obstacles for integration into property valuation standards 204
7.3 If the above mentioned obstacles are kept in mind avoided as much as possible,
there is a realistic opportunity to receive qualitative feedback, improvement
ideas, and broader acceptance of the approaches. Selected roadmap for
transformation and implementation 205
IV. BIBLIOGRAPHY 208
V. APPENDIX A : EXAMPLES OF LCCA MODELS FOR THE
CALCULATION OF OPERATIONAL COST OF BUILDINGS 221
a) Norwegian LCC calculator: Main cost drivers in an LCC perspective 222
b) Austrian LCCA tool of e7 and M.O.O.CON 231
VI. APPENDIX B 239
Acknowledgement 239

WORK PACKAGE 7 WORKING PAPER REPORT D7.2
5
IMMOVALUE – IEE/07/553/SI2.499204 Page 5
Legal disclaimer 240

WORK PACKAGE 7 WORKING PAPER REPORT D7.2
6
IMMOVALUE – IEE/07/553/SI2.499204 Page 6
II. Glossary
AAP Average Adjustment Parameter
ABGR Australian Building Greenhouse Rating
AI Appraisal Institute
AMM Additive Mixed Regression Model
ANEVAR Asociatia Nationala A Evaluatorilor Din Romania
API Australian Property Institute
ASB Appraisal Standards Board
ARE Austrian Real Estate Experts
Betr.KV Betriebskostenverordnung
BIIS “Bundesverband der Immobilien-Investment-
Sachverständigen e.V.”
BIM Building Information System
BLUE Best linear unibiased estimator
BREEAM Building Research Establishment Environmental
Assessment Method
CAPM Capital Asset Pricing Model
CASBEE Comprehensive Assessment System of Building
Environmental Efficiency
CBRE CB Richard Ellis
CCRS Center for Corporate Responsibility and Sustainability
CPD Continued Professional Development
CREIS Neumann & Partner CREIS Real Estate Solutions
CSR Corporate Social Responsibility
DCF Discounted-Cash-Flow
DGNB “Deutsche Gesellschaft für Nachhaltiges Bauen”
DIN Deutsches Institute für Normung e.V.
EEA European Environment Agency
ECSD Energy Cost Saving Potential
EPBD European Energy Performance of Building Directive
EPC Energy Performance Certificate
ERV Estimated Rental Value
ESD Ecological Sustainable Development

WORK PACKAGE 7 WORKING PAPER REPORT D7.2
7
IMMOVALUE – IEE/07/553/SI2.499204 Page 7
ESI Economic Sustainability Indicator
EVS European Valuation Standards
FCA Full-Cost Accounting
GBCA Green Building Council of Australia
GCV Gross Calorific Value
GDV Gross Development Value
Gif Gesellschaft für immobilienwirtschaftliche Forschung e.V.
GWR Geographically Weighted Regression
HWB “Heizwärmeenergiebedarf”
IMT Institute for Market Transformation
ImmoWertV “Immobilienwertermittlungsverordnung”
IPCC International Panel on Climate Changes
IRR Internal Rate of Return
IVS International Valuation Standards
IVSC International Valuation Standards Committee
KVP Key Valuation Parameter
LBG “Liegenschaftsbewertungsgesetz”
LCC Life-Cycle Costing
LCCA Life-Cycle Cost Analysis
LEED Leadership in Energy and Environmental Design
MLF Mortgage Lending Value
NABERS National Australian Built Environment Rating System
NIY Net Initial Yield
NOI Net Operating Income
NTF Norges Takseringsforbund
NYSERDA New York State Energy Research and Development
Authority
MAR Market Adjustment Rate
OIB Österreichisches Institut für Bautechnik
OLS Ordinary least squares
ÖII Österreichisches Institute für Immobilienbewertung und
Bewertungsstandards
PINZ Property Insitute of New ZealandRAF
RAF Rent Adjustment Factor

WORK PACKAGE 7 WORKING PAPER REPORT D7.2
8
IMMOVALUE – IEE/07/553/SI2.499204 Page 8
RICS Royal Institution of Chartered Surveyors
ROI Return on Investment
RPI Responsible Property Investment
SAP SAP Aktiengesellschaft
TBL Triple-Bottom-Line
TEGoVA The European Group of Valuers’ Associations
TIAVSC The International Assets Valuation Standards Committee
UK United Kingdom
US/USA United States of Amerika
USGBC U.S. Green Building Council
USP Unique Selling Proposition
USPAP Uniform Standard of Professional Appraisal Practice
V “Vervielfältiger” / Multiplier
VAT Value Added Tax
VEA Valuation Estimation Adjustment
VPA Valuation Parameter Adjustment
WAF Weighted Adjustment Factor
WAPEC Weighted Adjustment for valuation Parameter Effecting
Characteristics
WBCSD World Business Council on Sustainability Development
Y Yield
YP Year’s Purchase / Multiplier

WORK PACKAGE 7 WORKING PAPER REPORT D7.2
9
IMMOVALUE – IEE/07/553/SI2.499204 Page 9
III. Index of Figures and Tables
Figure 1: TBL Timeline – major steps forward 22
Figure 2: Illustration of “Sustainable Real Estate” 23
Figure 3: The Valuation Process 31
Figure 4: Calculation Example Rent Table Berlin 37
Figure 5: Linkage between sustainability features and value 39
Figure 6: Advantages to owners and occupiers 41
Figure 7: Possible Linkages within the Valuation Approaches 42
Figure 8: System boundaries for different energy performance indicators 46
Figure 9: Different system boundaries of measured and calculated energy use 47
Figure 10: Detailed comparison of the calculation method for the energy performance of
buildings between France and Flandern. 49
Figure 11: Link between energy performance from an EPC and property valuation
perspective. 50
Figure 12: Obstacles for a full integration of green features 76
Figure 13: Former “vicious circle” of energy efficiency in real estate economy 77
Figure 14: “Green” Kontratjew cycle? 80
Figure 15: Possible evolution concerning premium vs. discount of energy-efficient buildings
82
Figure 16 Shifts in building stock energy class under Transformation case 83
Figure 17 Green building movement 83
Figure 18 History of LEED registered buildings 85
Figure 19 History of LEED certified buildings 85
Figure 20: Overview of current LEED projects in some European countries 86
Figure 21: World Green Building Council 86
Figure 22: CSR and corporate reporting today 88
Figure 23: General findings / Background 91
Figure 24: Possible Structure of the Building Description Nowadays versus Future 94
Figure 25: Possible Structure of the Valuation - Nowadays versus Future 97
Figure 26: General approach for quantifying property valuation adjustment methodology 101
Figure 27: Transparent vs. opaque property markets 102
Figure 28: Theoretical linkages within the Direct Capitalisation Approach 107
Figure 29: Theoretical potential rent premium 111

WORK PACKAGE 7 WORKING PAPER REPORT D7.2
10
IMMOVALUE – IEE/07/553/SI2.499204 Page 10
Figure 30: Hedonic price function vs. implicit price function 120
Figure 31: Indifference curves vs. bid-curves 122
Figure 32: Hedonic price function 123
Figure 33: Illustration on full-Spline basis 130
Figure 34: Illustration of B-Spline vs. P-Spline 130
Figure 35: Example of WAPEC for market rent (ERV) 137
Figure 36: Example WAPEC for yield adjustment 141
Figure 37: Example WAPEC for particular characteristics which directly influence value 142
Figure 38: Effects of energy costs on monthly rent per sqm 147
Figure 39: Numerical example – estimation of RAF 150
Figure 40: Numerical example – direct cap approach in developed markets 151
Figure 41: Effects of covariates year of construction and condition of the flat 154
Figure 42: Effects on estimated parameters 156
Figure 43: Effects of hwb on monthly rent per sqm 157
Figure 44: Exemplary WAPEC for rent adjustment 159
Figure 45: Numerical example – Estimation of CSP 160
Figure 46: Application of the VPA to determine the ERV 161
Figure 47: Market Value impact of non-energy-efficient buildings 161
Figure 48: M Scale of reference values (heating and hot-water) for residential buildings from
Germany. 169
Figure 49: Values of the Edemand, Eexpected and ESP for heating. Case study. 172
Figure 50: General Cost Approach 176
Figure 51: Process of integration in developed markets (Cost Approach) 183
Figure 52: BKI – cost category in connection to property type (costs in €/m² BGF) 187
Figure 53: BKI – Quantification of energy efficiency 188
Figure 54: Possible classification of Austrian energy certification 191
Figure 55: Process of integration in developed markets 192
Figure 56: Process of integration in undeveloped markets 193
Figure 57: Example of WAPEC for Adjustment based on market evidence 195
Figure 58: Case 2: Example of WAPEC for Adjustment based on market evidence 200
Figure 59: Critical Obstacles for Implementation into Valuation Standards 204
Figure 60: Roadmap for Implementation into Valuation Standards 206

WORK PACKAGE 7 WORKING PAPER REPORT D7.2
11
IMMOVALUE – IEE/07/553/SI2.499204 Page 11
Table 1: Results of published empirical non-European case studies 32
Table 2: Practical Example ESI Market Valuation 34
Table 3: Energetic characteristics considered in the rent table of Berlin 37
Table 4: Results of published empirical European case studies 38
Table 5: Explanation of energy performance indicators 46
Table 6: List of indicators in energy performance certificates 49
Table 7: Information needed to integrate energy efficiency indicators in property valuation 51
Table 8: Classification of economic data for an economic performance assessment of
buildings 57
Table 9: Current numbers of certified and registered buildings (as of April 2009) 84
Table 10: Possible Summary of the Output-Data of the EPC 98
Table 11: Main Operating Cost items 104
Table 12: Overview of green value drivers – income related approach 109
Table 13: Dependency of bias due to correlation of covariates 133
Table 14: Description of key variables used for regression 144
Table 15: Categories for building quality 145
Table 16: Results of linear regression analysis 146
Table 17: Correlation of energy per square meter with buildings’ quality 148
Table 18: Effects of applying different models 148
Table 19: Categories of the Austrian EPC-energy efficiency classes 152
Table 20: Description of binary variables 153
Table 21: Demand of heat due to building condition and age 155
Table 22: Correlation of buidlings’ condition and year of construction with hwb 155
Table 23: Results of linear regression for year of construction, hwb and condition 156
Table 24: Permitted annual heating demand for residential buildings 168
Table 25: Permitted annual heating demand for residential buildings 169
Table 26: Examples of results for non-residential buildings (metered consumption) 170
Table 27: Market value calculated by sales comparison approach. 173
Table 28: Detailed calculation of depreciations/appreciations due to ESP for heating. 174
Table 29: The Application of the cost related approach 177
Table 30: Main green value drivers 179
Table 31: Integration of technical and market effects 182
Table 32: Extra costs to go green vary by region 185
Table 33: BKI – cost categorys 300/400 186

WORK PACKAGE 7 WORKING PAPER REPORT D7.2
12
IMMOVALUE – IEE/07/553/SI2.499204 Page 12
Table 34: Indicators to quantify markets awareness for energy efficiency 194
Table 35: Calculation adjustment factor – type of house: passive 197
Table 36: Calculation adjustment factor – type of house: low energy efficiency 197
Table 37: Case 1: Different type of houses (passive/low) 199
Table 38: Case 1: Adjustment for valuation object 1 200
Table 39: Case 1: Adjustment for valuation object 2 201
Table 40: Case 2: Same type of houses (low/low) 202

WORK PACKAGE 7 WORKING PAPER REPORT D7.2
13
IMMOVALUE – IEE/07/553/SI2.499204 Page 13
1 Introduction
In 2002 the member state of the European Union started an integration of the European
Energy Performance of Buildings Directive (EPBD) into national legislation. According to
the directive, “Energy Performance Certificates” (EPC) shall be available for new and
existing buildings all over Europe.
Building sector accounts for 30 % of energy use
One of the main reasons why the European Union established the EPBD is the fact that
buildings account for 30-40 %1 of the world’s energy consumption and for a significant
amount of the overall carbon emission. If the real estate industry were to reduce the use of
energy there would be a significant contribution to the stabilisation of the global energy
demand and greenhouse gas pollution. This effort will be a significant contribution to the
international targets according to the Intergovernmental Panel on Climate Change (IPCC) or
the Kyoto-Protocol could be achieved.2
Awareness is growing
Investors, developers and tenants are key actors in assessing the energy efficiency of a
building and the reduction of energy costs. They have also started paying attention to various
issues like corporate social responsibility (CSR)3, responsible property investment (RPI)4, or
ecological sustainable development (ESD). In addition, during the last few years several
specialised sustainable asset funds have been initiated, such as iii-investment, IVG AG,
Cordea Savills or the Bowfonds Asset Management Fund. All of them take sustainability and
energy-efficient building performance into account as factors in their investment or rental
decision processes as well as the fund set up process. The awareness and understanding has
become more and more evident. This change in practise has also been driven by the growing 1 WBCSD (2009), p.6 2 Cf. WBCSD (2009) 3 „Corporate social responsibility“ (Waddock and Graves, 1997) describes companies voluntary choice to
integrate social and environmental issues into corporations daily business to behave ethical and improve social
conditions by considerations about input (e.g. raw material sources), internal process (e.g. environmentally
friendly production), and publicity (e.g. community relations) aspects. 4 „Responsible property investment“ (RPI) defines investors choice to “maximize the positive effects and
minimizing the negative effect of property ownership, management and development on society and natural
environment” (Pivo and McNamara, 2005).

WORK PACKAGE 7 WORKING PAPER REPORT D7.2
14
IMMOVALUE – IEE/07/553/SI2.499204 Page 14
awareness for Climate Changes, high oil prices and rising energy costs, documented in
various studies.
Property valuation is behind
As a consequence, real estate valuation experts already agree that these changes will have an
impact on the real estate industry and market structures as well as the methods and tools used
to analyse real estate. Nevertheless one cannot give a quick and easy answer to these
challenges due to lack of practical experience and valid data.
Yet, real estate professionals are aware of challenges confirmed in discussions between
professionals and some research projects are already trying to identify, quantify and measure
the market impact of green and energy-efficient building features (see also Chapter 5.1).
Development of guidance for property valuation
Due to the lack of relevant studies and information regarding the link between green
buildings’ energy performance and property valuation, the independent-trans-European
project “IMMOVALUE” has been initiated in 2008. The project aims to determine and define
common and accepted approaches and methodologies on how new developments such as
EPC/EPBD as well as life-cycle costing (LCC) and analysis (LCCA) could be integrated in
today’s and future practice of property valuation.

WORK PACKAGE 7 WORKING PAPER REPORT D7.2
15
IMMOVALUE – IEE/07/553/SI2.499204 Page 15
2 Background
To ensure the aims and objectives of the IMMOVALUE project remain independent,
investigations on existing valuation methodologies, energy performance and certificates and
life-cycle cost analysis were carried out before starting to derive methodologies which
integrate green building features to property valuation.
Existing studies for Anglo-American markets
To begin, the report summarizes the main results of existing studies. They serve as a starting
point for the results presented in this report. Existing studies on linkages between
international, European and national valuation practice and EPC and LCC assessment refer
mostly to countries such as Australia5, the US6 and the UK7.Yet so far no specific
methodology for an integration of green building features into property valuation practice is
available. There is, however, a common understanding of which factors (e.g. rents, yields,
etc.) that green attributes might influence and therefore have to be adjusted if building
performance features related to sustainability will be considered explicitly in property
valuation practice. Furthermore, a few valuation institutions such as e.g. the Royal Institution
of Chartered Surveyors (RICS) in the UK have already started to hand out general valuation
guidance with reference to green building aspects in general, in order to stimulate and boost
the recognition and awareness of the importance of the integration of building performance
aspects into the property valuation practice.
Energy certificates as an ambiguous source of information
A second field of preparatory analysis on energy performance certificates shows that, due to
various existing and differing national EPCs and the assessment used for generating
illustrated indicators, there is no or just limited directly comparable EPC-data available. The
information and data received from the EPC therefore needs to be transferred and adjusted in
order to assure useful, valid and reliable information that can be integrated into property
5 Cf. Bowman, R., Wills, J. (2008); Boyd, T. (2005) 6 Cf. Kats, G. et al. (2003); Miller, N., Spivey, J. and A. Florance (2008); Eichholtz, P., Kok, N. and J.M.
Quigley (2008); Miller, N. (2010); Pivo, G. and Fisher, J.D. (2010) 7 Cf. Sayce, S., Ellison, L. (2003); RICS (2005); Fuerst, F., McAllister, P. (2008); Fuerst, F. and McAllister, P.
(2010); Fuerst, F., et al (2010); Chegut, A., et al. (2010)

WORK PACKAGE 7 WORKING PAPER REPORT D7.2
16
IMMOVALUE – IEE/07/553/SI2.499204 Page 16
valuation. Therefore the proper integration of energy data into property valuation practice
may rely on two challenges:
(1) experts for energy performance certificates have to participate, and
(2) a certain standardized process or format has to be established to implement
information out of the EPC or other energy performance results to fit for property
valuation calculation schemes.
Integration of energy efficiency and LCC is no easy task
Results of the third preparatory analysis provided an overview of different LCC
methodologies for buildings and how LCC essentially can be used within property valuation.
As part of the survey, different LCC-tools were reviewed and examined to address the general
applicability and linkages between LCC and property valuation practices. Furthermore,
suggestions have been made to quantify in which way LCC can be used to affect the different
valuation approaches.
Comprehensive feed-process
The modified methodology for property valuation set out in this report has been tested on a
group of pilot projects to ensure the applicability and practicality of the developed
modifications8. Additionally, the outcome of this report is the resulted from an extensive
review process involving well-known international and national property valuation
associations and experts such as RICS, US Appraisal Institute (AI), TEGoVA (The European
Group of Valuers’ Associaton), German BIIS (Bundesverband der Immobilien-Investment-
Sachverständigen e.V.), Norwegian NTF (Norges Takseringsforbund), the Romanian
ANEVAR (Asociatia Nationala A Evaluatorilor Din Romania), or the Austrian ÖII
(Österreichisches Institute für Immobilienbewertung und Bewertungsstandards), ARE
(Austrian Real Estate Experts) etc. to ensure a widespread acknowledgement and acceptance
of the property valuation society. The comments of these experts have been integrated in this
present report at hand.
Legal framework supports awareness
8 Bienert, Sven et. al.: IMMOVALUE Report on the Pilot-Project and Survey Results, Vienna, July 2010,
www.immovalue.org

WORK PACKAGE 7 WORKING PAPER REPORT D7.2
17
IMMOVALUE – IEE/07/553/SI2.499204 Page 17
From another perspective, since EPCs are mandatory in the European Union and therefore
must be available for new as well as already existing buildings, the accessibility of energy-
efficient building performance indicators will increase and lead to a higher transparency as
well as provoke property investors and occupiers to start to compare these measures of
building performances. This will consequently lead investors, developers and tenants to
further consider buildings’ energy performance and other related aspects in their decision
making process. Thus, the property markets’ behaviour will change in the mid and long run
and will most likely justify a premium for the market values of green buildings, or possibly a
discount for conventional buildings. Especially in an economic downturn, it might be useful
to increase energy efficiency in order to reposition the property and increase values.
Different publications in different countries stress the current absence of valid and reliable
evidence regarding value and sustainability issues.9 Investors and users will not respond to
sustainability features and issues effectively without reliable benchmarks and hard facts.10
9 Cf. Warren-Meyers, G., Reed, R. (2009); Madew, R. (2006); Lorenz, D., Lützkendorf, T. (2008a) 10 Cf. Sayce, S., Ellison, L. (2003) ; Sayce, S. (2010)

WORK PACKAGE 7 WORKING PAPER REPORT D7.2
18
IMMOVALUE – IEE/07/553/SI2.499204 Page 18
3 Aims and Targets of the Report
Based on the results and findings of the preceding investigations, the authors of this report
will find ways to modify approaches and give guidance to ensure the appropriate integration
of a buildings’ energy performance and energy-efficiency indicators derived from EPC, LCC
or LCCA within property valuation. The project partners of IMMOVALUE will focus mainly
on direct rather than indirect impacts and differences within the three basic and internationally
used property valuation methodologies – the cost approach, the sales comparison approach,
and the income related approach.
To assure the quality of these overall target intensive investigations concerning the potential
gaps and pitfalls between property valuation, EPC and LCCA have been carried out.
The report also suggests ways in which property valuers can handle energy efficiency and
performance issues in general and derive the key indicators required from EPC and
LCC/LCCA and estimate their value impact even if non-transparent market circumstances
with only limited market information and evidence, etc. exist. Furthermore this report reveals
not only ways to calculate the quantitative impact of sustainable features but also points out
qualitative aspects which one must describe within the valuation report to assure a transparent
and comprehensible examination, integration and estimation of the properties’ market value.
To sum up the outlined main objectives, this report answers the following questions:
(1) What is a „Green Value“? How can sustainable buildings be differentiated from
their non-Green-Peers? (see Chapter 4)
(2) What are the must-knows of a value dealing with energy efficiency and LCC? (see
Chapter 5)
(3) Is it possible to get feasible and meaningful figures out of EPCs and LCCA and if
so, will the market demonstrate representative and significant evidence?
(4) What are the gaps and pitfalls between EPC or LCCA and property valuation, and
how valuers can overcome these obstacles? (see Chapter 5.4.2)
(5) What is the general background a valuer must have in mind to avoid wrong
calculations/interpretations when dealing with the topic? (see Chapter 6)
(6) What are in general the main key information derived from EPC or LCCA and
which are in general suitable for the integration into property valuation practice? (see
Chapter 5.2)
(7) Ways in which valuers can integrate and link information related to buildings energy
performance and efficiency within the main property valuation approaches (sales

WORK PACKAGE 7 WORKING PAPER REPORT D7.2
19
IMMOVALUE – IEE/07/553/SI2.499204 Page 19
comparison, cost related and income related approach) in manner? (see Chapter 6.4.4
and 6.4.3)
(8) How can one implement the findings within the legislative framework? (see Chapter
7)
(9) What can be done to consider buildings’ energy performance within property
valuation practice even if implementation-inhibitive circumstances (e.g. lack of market
evidence, etc.) exist? (see Chapter 6.3 and 6.4.3.2.2).
(10) What are the future challenges and task to stimulate and strengthen the importance
of buildings’ energy performance within property valuation? (see Chapter 6.1 and 6.2).

WORK PACKAGE 7 WORKING PAPER REPORT D7.2
20
IMMOVALUE – IEE/07/553/SI2.499204 Page 20
4 Definition and Explanation of the “Green Value”
Terminology
To file IMMOVALUE and especially this report into the overall context of recent
international discussion and publication regarding sustainability issues in the real estate
industry, an introductory analysis by factoring the buildings’ energy performance aspects into
Key Facts and Findings
• The sustainability agenda is a wide-spread approach which one must examine using
sophisticated methods. Whereas “energy-efficient” just refers to using less energy
resources to provide the same level of service, “green” or “sustainability”
encompasses further aspects such as building quality, thermal quality (e.g. indoor
air quality, etc.), energy performance (e.g. energy consumption), carbon dioxide
(CO2) emission, reusability of building materials, connection to local public
transportation, social impacts (e.g. extended productivity), etc.
• Green buildings always include a life-cycle perspective.
• Sustainability in a broader sense focus on social, economic and environmental
aspects, including intergenerational justice and internalization of negative external
effects.
• Regarding the “Green Value”, which one can defined as: “the net additional value
obtainable by a green building in the market compared to conventional or non-green
properties”, the formerly debated “Null-Hypothesis” (no impact of green building
features on property values) can be already proven as being wrong due to various
accepted scientific studies.
• The core of the following report mainly refers to possibilities of integrating energy
performance and efficiency aspects derived from EPC and LCCA and therefore the
report only represents a part of the total green value of a green building.
• Two aspects need to be highlighted to avoid misunderstanding: First values do not
make the market, the rather use market evidence. And second cost is not necessarily
value.

WORK PACKAGE 7 WORKING PAPER REPORT D7.2
21
IMMOVALUE – IEE/07/553/SI2.499204 Page 21
the broader “framework” of sustainability and green building aspects is given under this
chapter.
4.1 “Sustainability” in a broader sense
Climate change, the increasing numbers of environmental hazards and ecological disasters as
well as rising oil prices have driven the sustainability movement forward. Consequently, a
paradigm change on a broad scale throughout all industries has evolved and public attention is
continuously rising.
Due to these developments the sustainability topic (also called green issues) has also found its
way into the real estate industry and has inspired real estate academics and professionals to
intensively carry out scientific studies and surveys. As a result, one can see the rising
momentum and importance of “green building” or “sustainable building.”
To understand the consequences and impacts that the rising importance of sustainability might
provoke within the real estate industry, the report provides a short explanation the general
concept of sustainability.
Triple Bottom Line (TBL) to describe sustainability
While the terminology of sustainability has existed for decades, the debates concerning the
wide-ranging term of sustainability remain open. Most of the interpretation of sustainability
encompasses and refers to the widely recognised and consensual accepted three main
dimension of sustainability11: namely ecological, social and economical characteristics and
aspects (also known as the “Triple Bottom Line”), which has to be seen as a permanently
evolving approach. This Triple Bottom Line approach is based on the origin and widely
accepted Brundtland’s definition of sustainability developments, which will be described
later. The following timeline illustrates the major steps within the TBL framework:
11 Eklington, J. (1994), pp.90-100

WORK PACKAGE 7 WORKING PAPER REPORT D7.2
22
IMMOVALUE – IEE/07/553/SI2.499204 Page 22
John
Stu
art M
ill
19. Jhd. Seit 1968
Clu
b of
Rom
e
1987
Bru
ndtla
nd-R
epor
t
1992
Rio
-Con
fere
nce
/ A
gend
a 21
1997
Wor
ld C
limat
eC
onfe
rnce
Kyo
to
Mill
eniu
mta
rget
s
2000
UN
-Klim
akon
fere
nzen
K
open
hage
n / M
exik
o
2009 / 2010
TBL Timeline
Figure 1: TBL Timeline – major steps forward
4.2 Definition of “Green Building”
To understand the widespread facets which define green buildings, one must establish a sense
and sensitization for the meaning of what describes a green building. The recent number of
existing definitions for green buildings shows the current uncertainty about the characteristics
of a green or sustainable building.
Efficient use of resources
For example according to Kats (2003) a “green” or “sustainable building” “uses key resources
like energy, water, materials and land much more efficiently than buildings that are simply
built to code, …are cost effective and reduces operations as well as maintenance cost,
…creates healthier work, learning and living environments, …contribute comfort and
productivity”.12
In contrast, the report also discusses the significance of green or sustainable buildings in the
light of broader aspects such as RPI or ESD, which go back to the widely accepted general
definition of sustainability by Brundtland. In the late 80s, Brundtland13 defined sustainability
12 Kats, E., et al. (2003), p. V 13 Brundtland Commision (1978)

WORK PACKAGE 7 WORKING PAPER REPORT D7.2
23
IMMOVALUE – IEE/07/553/SI2.499204 Page 23
as “a development that meets the needs of the present without compromising the ability of
future generations to meet their own needs."14,15
Broader definition includes external effects
This means that the concept of green buildings also takes into account social, ecological and
environmental issues and effects caused either by the property itself or the surrounding
environment. Therefore a broader definition relates more to potentially negative external
effects and aspects of intergenerational justice that might arise.
For the purpose of this report the definition of the Royal Institution of Chartered Surveyors
(RICS) fits best. RICS defines a green building as a property that “displays characteristics that
minimise environmental impact through all parts of the buildings life-cycle and focuses on
improved health for its occupiers, optimise utility for their owners and occupiers and the
wider public, whilst minimising the use of natural resources and environmental impact”.16 A
good illustration of sustainability within the property industry might be the following graph:
Sustainable
Real Estate
Basis for various green building
certification systemsEnvironment
• Reduced CO2 emission ofproperties• Reducing the LCC-total energydemand
Society
• Increasing employess‘ productivity
• employees ‚comfort• employees‘ health• employess‘ satisfaction
Economy
• Reducing propertiesLCC• Reduced repair andmaintenance cost in comparison toconventional properties
Figure 2: Illustration of “Sustainable Real Estate”
14 Digital report of Brundtland, G.H. (1987) available on http://www.un-documents.net/wced-ocf.htm 15 Brundtland’s definition contains two concepts – “the concept of ‚needs‘, in particular the essential needs of the world's poor, to which overriding priority should be given; and the idea of limitations imposed by the state of technology and social organization on the environment's ability to meet present and future needs” 16 RICS Valuation Standards Board (2008), p.5

WORK PACKAGE 7 WORKING PAPER REPORT D7.2
24
IMMOVALUE – IEE/07/553/SI2.499204 Page 24
4.3 Terminology of “Energy-Efficient Buildings”
Beside these green buildings definitions, the term “energy-efficient building” is often used
misleadingly as a synonym for green or sustainable buildings. While energy-efficiency only
refers to using less energy resources to provide the same level of service, green or
sustainability encompasses further aspects such as building quality, thermal quality (e.g.
indoor air quality, etc.), energy performance (e.g. energy consumption), carbon dioxide (CO2)
emission, reusability of building materials, connection to local public transportation, social
impacts (e.g. extended productivity), etc.
Energy-Efficiency as part of a Green Building
Therefore it is necessary to clearly differentiate between a building which is “just” energy-
efficient and a green building. Even if there is no common definition for “green” or
“sustainable” buildings, there is a consensus in the building and real estate industry that green
buildings minimise primary energy demand and consumption (conservation of energy) and
therefore use resources such as energy more efficiently, which also leads to lower CO2
emission. Consequently, energy-efficiency is an essential feature of a green building.
4.4 “Green Value” terminology
In line with the ongoing debate related to the sustainability movement within the real estate
industry, market participants questioned whether all aspects surrounding “sustainable”
buildings could be properly reflected in the properties market value.
Therefore the impact of green property features on property value is now the center of
attention. Even though research on this topic is just emerging, one can already rule out the
statement that there is no correlation between properties’ market value and its green building
features also called the so called “Null-Hypothesis.”. The awareness for a market-proven
added value of green buildings is growing due to a number of recent scientific papers and
survey. In this context the fundamental results e.g. by U.S.-American University of San Diego
in cooperation with the CoStar Group17, or the University of California18, as well as by the
Australian Green Building Council19 (GBCA) or the University of Melbourne20 and few 17 Cf. Miller, N., Spivey, J. and Florance, A. (2008) 18 Cf. Eichholtz, P., Kok, N. and Quigley, J.M. (2008) 19 Cf. Bowman, R., Wills, J. (2008)

WORK PACKAGE 7 WORKING PAPER REPORT D7.2
25
IMMOVALUE – IEE/07/553/SI2.499204 Page 25
European institutions such as the RICS in the UK, the Center for Corporate Responsibility
and Sustainability21 (CCRS) in Switzerland or the German Institute for housing and
environment (IWU) in cooperation with the department of housing in Darmstadt22 (Germany)
– which constitute some market evidence for the impact of energy efficiency and green
building features on property rents and values are of particular interest.
Studies reveal added value for green buildings
Some results e.g. by Jones Lang LaSalle23, Parker24, or Fuerst and McAllister25 already
conclude that there is a growing consensus of the need for a discount on conventional
buildings’ value rather than a value-premium for green properties, since green buildings will
become the market standard requirement and therefore a “must have” in the mid to long run.
Discount or premium - a question of time?
Similar to the idea that there are various green building definitions, there is no commonly
accepted “Green Value” terminology. After taking into account the findings from preceding
explanations, the definition of RICS which describes the Green Value as the “net additional
value obtainable by a green building in the market”26 compared to conventional or non-green
properties, seems to be the most accurate one. This definition of green value is also in line
with the terminology of the market value according to the IVSC (International Valuation
Standards Committee), which is the “estimated amount for which a property should exchange
on the date of valuation between a willing buyer and a willing seller in an arm’s length
transaction after a proper marketing wherein parties had each acted knowledgeably, prudently,
and without compulsion.”27
Green Value as part of the Market Value
20 Cf. Robinson, J. (2005), p.6 21 Cf. Meins, E., et al. (2008); and Meins, E., et al. (2007) 22 Cf. Amt für Wohnungswesen Darmstadt (2008) 23 Cf. Jones Lang LaSalle (2006), p.6 24 Cf. Parker, D. (2008) 25 Cf. Fuerst, F., McAllister, P. (2008), p.10, 26 RICS (2005), p. 2 27 IVSC (2007), p.27

WORK PACKAGE 7 WORKING PAPER REPORT D7.2
26
IMMOVALUE – IEE/07/553/SI2.499204 Page 26
Thus, the Green Value represents an integral part of the overall market value. However, one
can only both aspects theoretically – as in the case of building and land values which both
make up the overall market value and can also not be separated. Furthermore, it is essential to
understand two fundamental principles before discussing Green Values:
(1) “Valuers do not make the market” – Valuers do not “make” the market; they are
look for market evidence to use for a specific valuation. Therefore speculating what
might happen in the future and attempting to price in something that has yet to occur is
not useful. Some professionals think it might be appropriate to add a premium to a
properties market value just because the EPC, or other green building assessment tools
and labels such as LEED28, BREEAM29 or Energy Star are in place. This of course has
nothing to do with proper property valuation. Valuers cannot add premiums if the
market does not support this premium with significant evidence.
(2) “Cost is not Value” – The costs for constructing a green building or upgrading
existing conventional properties to e.g. energy-efficient buildings do not necessarily
lead to a Green Value and vice versa. This means that a green or sustainable property
with identical costs of construction (and land) and identical certification (e.g. LEED,
BREEAM, EPC), etc. can still have a totally different added value in different locations,
just because the willingness to pay revealed by consumers in different markets might
vary substantially. Therefore one need to keep in mind that evidence from other markets
concerning price variations for green features might not be relevant.
On order to remain consistent with the previously stated definition of green buildings and the
green value terminology, one must explicitly state that the core of this report mainly refers to
the possibilities for integration of energy performance especially the energy-efficiency aspects
of a property and therefore only represents a part of the total green value. This is achieved
through the use of EPC- and LCCA-data as well as other elements (e.g. investments for
energy performance improvements, etc.) to acquire suitable indicators and input variables for
property valuation while remaining flexible enough to leave room for the implementation of
further green building features.
In this context, one must mention that the rising concept of “Green Lease” arrangements is
not studied within this report, even if such issues might have an impact on property valuation.
28 “Leadership in Energy and Environmental Design“ established by the U.S. Green Building Council. 29 „Building Research Establishment Environmental Assessment Method“ established by the UK-based Building
Research Establishment Ltd.

WORK PACKAGE 7 WORKING PAPER REPORT D7.2
27
IMMOVALUE – IEE/07/553/SI2.499204 Page 27
In general, a green lease refers to an emerging concept that integrates ESD, CSR issues, etc.
in the lease contract between owner and tenant of a sustainable/energy-efficient property.
Green lease arrangements regulate various aspects mainly related to green or energy-efficient
building standards, operational controlling and audit procedures related to energy
performance measurements. It also relates to incentive and penalty clauses etc. due to agreed
upon service and energy performance levels.

WORK PACKAGE 7 WORKING PAPER REPORT D7.2
28
IMMOVALUE – IEE/07/553/SI2.499204 Page 28
5 Overview on valuation approaches, energy performance
certificates and LCCA approaches (Deliverable D5.1)
5.1 Analysis of Valuation Approaches
Key Facts and Findings
Valuation Process
• Even thought different valuation methods exit in each country, European Valuation
Standards (EVS) form the basis for a generally accepted and harmonized European
procedure.
• Three main internationally accepted valuation approaches are always part of the entire
process: sales comparison approach, cost approach, income related approaches (direct
capitalization or DCF).
• No matter which approach forms the basis for the calculation: market data and market
evidence are always needed to calculate the value.
Empirical Studies
• Non-European studies (Australia & USA): some evidence for certified sustainable
buildings (LEED, Energy Star, Green Star) isolates effects for income producing
commercial properties. They focus exclusively on the income approach.
• European studies (Switzerland & Germany): Swiss Economic Sustainability Indicator
(ESI) valuation considers sustainable characteristics and their future development
within the exit cap rate of the DCF-approach. German ecologic rent tables for specific
cities illustrate possible rental premiums or discounts for the characteristic of energy-
efficiency of a building. Whereas the Swiss approach is mainly a scoring model, the
German is based on empirical data.
• Comparability and Significance for other sub-markets of the research results have to
be critically remarked. Most studies focus mainly on premiums (rather than discounts).
Linkages for property valuation
• Some possible linkages within the existing valuation approaches could be identified
for the implementation of different aspects of energy-efficient building characteristics.

WORK PACKAGE 7 WORKING PAPER REPORT D7.2
29
IMMOVALUE – IEE/07/553/SI2.499204 Page 29
• Quantification depends on empirical market evidence, which is often the missing
element.
Conclusion
• Currently sustainability features/aspects as well as EPC or LCC and investigations on
such topics are not reflected, considered or even mentioned in the property valuation
reports; –such aspects have to be taken into consideration in the future.
• Research is still in an early stage focusing on empirical analysis and on the integration
of environmental aspects into the income approach.
5.1.1 Valuation Approaches
In general, property valuation is associated with the three main approaches: the sales
comparison approach, the cost related approach and the income related approach all over the
world.30 In Europe the European Valuation Standards (EVS) as well as the methods RICS
professionals (so called “Red Book”) use, form the basis for a harmonized and generally
accepted procedure to value a property. With the exception of some national particularities
and different notations, all valuers use the same basic approaches. Further, one can
differentiate the income related approach into the methods of direct capitalization and
discounted cash flow (DCF).
Worldwide valuers use variations of the three basic valuation methods
The direct capitalization approach uses the estimated achievable market rents less outgoings
divided by a cap rate/yield to derive the market value.31 The DCF approach in contrast
analyses the first 10 years of revenues and costs in detail on a yearly basis and assumes that
the property will be sold after this holding period for a so called “Terminal Value”. The cash
flows are calculated in detail for every single year of the holding period. Therefore, the valuer
must estimate rental growth rates, inflation rates, occupancy rates etc. on a yearly basis.32 The
essential advantage of the more complex DCF-Approach is that the assumptions are more
transparent and detailed.
30 Cf. Gelbtuch (1997): p. ix. 31 Cf. Appraisal Institute (2008b), p. 377 seqq. 32 Cf. Hungria-Garcia (2004): p. 19 et seqq.

WORK PACKAGE 7 WORKING PAPER REPORT D7.2
30
IMMOVALUE – IEE/07/553/SI2.499204 Page 30
In contrast to the above shortly explained income approaches the sales comparison approach
uses sales data/transaction prices, which are comparable to the subject property being valued.
In most cases the difficulty in applying this approach is the lack of existing comparable data.33
The cost approach is deriving the (depreciated) replacement costs of the property being valued
taking into account the quality of fittings, the cost level of the region, the age etc.34
Figure 3 illustrates the entire valuation process. One should select the appropriate valuation
method after a detailed preliminary analysis, data selection and collection.35 The calculation
itself is therefore only one part of the whole process, which is documented in the valuation
report. The valuation report communicates the different steps of the valuation process from
the research and data collection to conclusion and final estimate of the market value.36
33 Cf. Appraisal Institute (2008b), p. 300. 34 Cf. ibid p. 377. 35 Cf. IVSC (2007), p. 170. 36 Cf. ibid.

WORK PACKAGE 7 WORKING PAPER REPORT D7.2
31
IMMOVALUE – IEE/07/553/SI2.499204 Page 31
Figure 3: The Valuation Process37
All applicable valuation approaches use data and information sources that feature market
evidence to estimate the market value.38 Market evidence is essential for all approaches.
The valuer is also dependant on market evidence to consider and quantify added values within
property valuation due to enhanced energy-efficient features of a property. The following
section will point out the most prominent published research results regarding the
investigation of the terminology of an “added value” due to energy efficiency, respectively
sustainability of real estate.
5.1.2 International Research - “Green/energy-efficient achieves an added Value”
5.1.2.1 Non-European research results
Some organizations such as the Green Building Council of Australia (GBCA)39, the Royal
Institution of Chartered Surveyors (RICS)40, the New York State Energy Research and
Development Authority (NYSERDA)41 and economic scientists all over the world42 have
produced a wide range of case studies to verify the effect sustainable features on property
values. Most studies and scientific papers deal with the different available sustainability
certification systems like the American LEED, the British BREEAM or the Australian Green
Star and their impact on values, which may be achieved due to a certain rating level. These
international well-known sustainability labels are going beyond the aspect of energy-
efficiency and therefore beyond what the IMMOVALUE project is primary looking at.
Still these international publications identify key variables as the main drivers leading to an
added value, the so-called “Green Value” of a property in comparison to a non-sustainable
respectively non-green peer group.
Table 1 illustrates the different published potential key variables and the quantitative results
of the empirical studies.43
37 Cf. IVSC (2007), p. 171. 38 Cf. ibid p. 170. 39 Cf. Bowman, R., Wills, J. (2008). 40 Cf. RICS Valuation Standards Board (2008), Corps, C. (2005). 41 Cf. Institute for Market Transformation (2003). 42 Cf. e.g. Warren-Myers, G., Reed, R. (2009), Sayce, S., Ellison, L. (2003), Miller, N., Spivey, J., Florance, A.
(2008), Lorenz, D., Lützkendorf, T. (2003 - 2008), Pitts, J., Jackson, T. (2008). 43 Cf. Pitts, J., Jackson, T. (2008), p. 117.

WORK PACKAGE 7 WORKING PAPER REPORT D7.2
32
IMMOVALUE – IEE/07/553/SI2.499204 Page 32
Table 1: Results of published empirical non-European case studies
Three of the illustrated case studies used the same dataset, the CoStar’s national dataset,
which includes 2 million properties with around 42.9 billion square feet (around 4 billion
square meter) of commercial space. The difference between them is the usage of the data, the
used sample sizes, and the application of variables and therefore the complexity of the
analysis. Miller et al. for example included control variables as location, size and age into the
hedonic regression model. The positive results were tested and the results show that they are
not significant at the 10 % level.44
Eichholtz et al. choose a similar hedonic framework for analyzing the effect of certification on
contractual rents. They found some rent premium (see Table 1). This increases as they reflect
lower vacancy rates with adjusted rents. But especially the premium for LEED-certified
buildings has to be used cautious while they also fail to be significant at the 10 % level.45
Non-European research focused on income approach
Fürst and McAllister were analyzing the effect of LEED- and Energy Star certification with
two different hedonic models: the rent model and the transaction price model. The price
44 Cf. Fürst, F., McAllister, P. (2008), p. 16. 45 Cf. Fürst, F., McAllister, P. (2008), p. 16.; Fürst, F., McAllister P. (2010)

WORK PACKAGE 7 WORKING PAPER REPORT D7.2
33
IMMOVALUE – IEE/07/553/SI2.499204 Page 33
premium of about 31 % for LEED-certified buildings seems to be extraordinary. The authors
themselves stated that the results seem to be “[…] indicative of a ‘hot’ market […]”.46
In summary, all existing empirical studies tried to find hard evidence that the green features of
a building reflected a higher market value. They all used commercial market data sets, in most
cases focusing on the office market; therefore the studies only analyze the impact of different
potential parameters within the income approach.
Only few European research initiatives
All above mentioned research results illustrate specific property markets outside the European
continent. Therefore the following section describes a methodology that was established in
Switzerland along with the consideration of energy efficiency within the German qualified
rent tables. These rental tables were established as the legal basis for landlords to raise net
rents for residential floor area. The results are based on empirical data of the local rental
markets, which were updated over the years.
5.1.2.2 European research results
5.1.2.2.1 Swiss Valuation Model - ESI Valuation
Instead of the in section 5.1.2 mentioned American and Australian research results the Swiss
Center of Corporate Responsibility and Sustainability (CCRS) established a so called
Economic Sustainability Indicator (ESI).47 ESI measures the properties risk to achieve an
increase respectively a decrease of value on the basis of long-term future developments.48
CCRS uses the DCF-approach to include specific long-term risks as seen in a sustainability
perspective. ESI identfies risks, which may occur between the date of sale (e.g. end of year
10) and the end of the economic lifetime of the building (e.g. year 35 or 40).49 So it isolates
and values the uncertainty, which is not automatically included explicitly in the cash flow
calculation of the so-called holding period of the property.50 Five groups of sustainability
features were identified to quantify ESI:
(1) Flexibility and applicability
46 Cf. ibid p. 23. 47 Meins, E., Burkhard, H.-P. (2007); Holthausen, N., Christen, P. (2009). 48 Meins, E., Burkhard, H.-P. (2009): p. 4, p. 12. 49 Cf. p. 4, p.13. 50 Cf. p. 13.

WORK PACKAGE 7 WORKING PAPER REPORT D7.2
34
IMMOVALUE – IEE/07/553/SI2.499204 Page 34
(2) Dependency of energy and water
(3) Accessibility and mobility
(3) Security and
(4) Healthiness and Comfort.51
The results of the sub criteria must then be aggregated to ESI and quantified through a risk-
based weighting model that implicates three main elements: scenarios, probabilities of
occurrence and dimension.52 Hence the ESI reflects the property’s future risk, which one
should consider within the estimation the exit cap rate of the DCF-approach.53 ESI was
specified for multi-family houses, office and retail spaces.54
DCF Model and Risk adjustment in Swiss Approach
Researchers published three practical examples with corrections of value for different
property types. Thereby the calculation of ESI are dependent on the classification of the
different characteristics within the five sustainability groups as sustainable (1), average new
construction (0) and non-sustainable (-1).55 With the aid of sensitivity analysis CCRS
calculated the maximum change in value for sustainable respectively non-sustainable
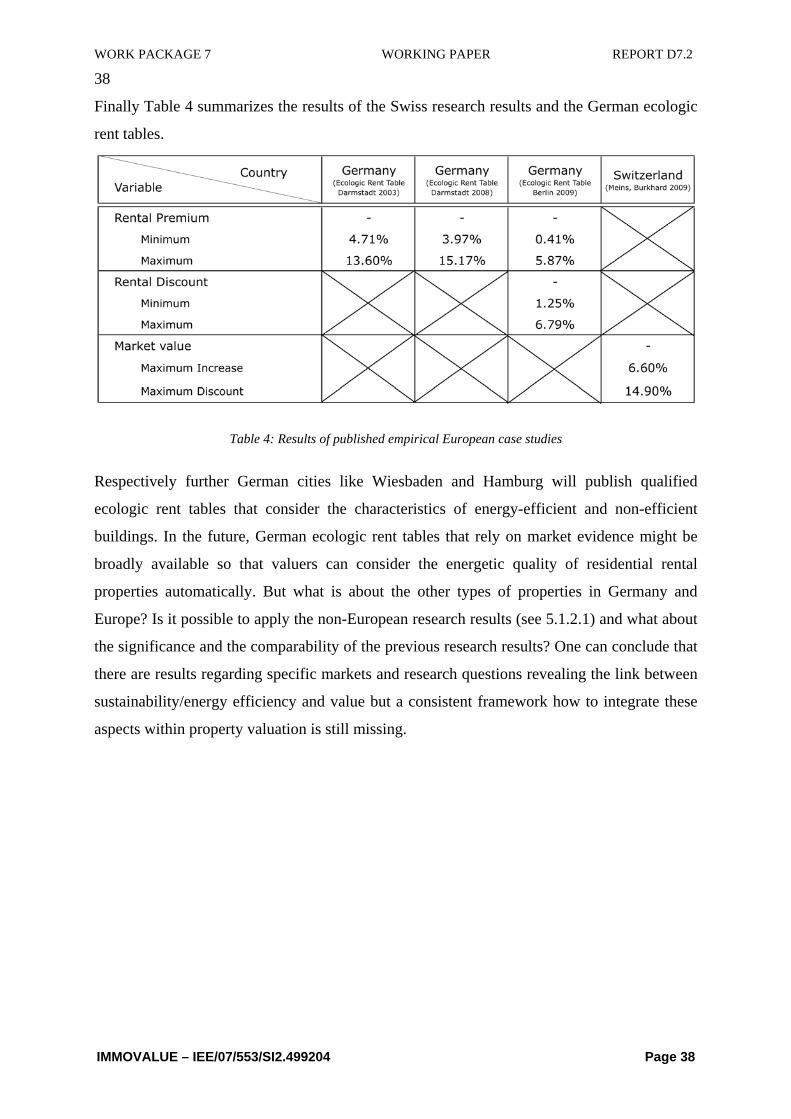
buildings. The analyses resulted in a maximum added value of 6.60 % and a maximum
discount of value up to 14.90 %. Via multiplication of the estimated ESI and the maximum
change of value the correction factor can be quoted.56
Table 2: Practical Example ESI Market Valuation
CCRS tested the use of ESI within the property valuation during the past one and a half years
with the aid of independent property valuers. The pilot projects certify the applicability and
51 Cf. ibid p.4, p. 9. 52 Cf. ibid. p. 14 et seqq. 53 Cf. ibid p. 13. 54 Cf. ibid. 55 Cf. ibid. 56 Cf. ibid. p. 18.

WORK PACKAGE 7 WORKING PAPER REPORT D7.2
35
IMMOVALUE – IEE/07/553/SI2.499204 Page 35
the practicability in the daily business of a property valuer. The time needed to calculate ESI
during the pilot projects ranged from a half to three hours dependent on the starting position
of the valuer.57 CCRS will investigate if the method is also applicable for the certified LEED-
and BREEAM-properties. Researchers established the the method specifically for the Swiss
property market. If one were to apply the the ESI property valuation method to other markets,
the specific characteristics and framework conditions should be revised accordingly.58
5.1.2.2.2 German Ecologic Rent Tables
In Germany, landlords use rent tables (so called “Mietspiegel”) as the legal basis to increase
net rents for residential floor area. Real empirical data updated over the years by surveys
forms the basis.
In 2003 the City of Darmstadt established the first ecologic rent table for the estimation of
local comparable residential rented floor area.59 In 2008 the City of Darmstadt published a
revised rent table and adjusted the impact of energy-efficient characteristics of buildings.60
In cooperation with the Institute of Living and Environment (“Institut für Wohnen und
Umwelt”) in Darmstadt the first result of the research project was the statistical proof that
buildings that featured good thermal performance (“gute wärmetechnische Beschaffenheit”)
were able to achieve a rental-premium compared to energy inefficient buildings of up to 0.37
€/m²/pm.61 The aim of the cooperation between the City of Darmstadt and the Institute of
Living and Environment was to investigate the impact of the thermo technical quality of
residential buildings. The research was carried out during the preparation of the rent table for
Darmstadt. The analyses resulted in a practicable and useful way of integrating the energetic
characteristics into the qualified rent table with the aid of information out of the EPC.62
Rental-premium of up to 0.37 or 0.49 €/m²/pm
If a building is able to fulfil the conditions required to achieve the designation of
“average/upgraded thermo technical quality” net rent compared to non energy-efficient
buildings goes up about 0.37 €/m² or even 0.49 €/m² for living space in Darmstadt due to the
57 Cf. ibid p. 18. 58 Cf. idid p. 19. 59 Amt für Wohnungswesen Darmstadt (2003), p. 3. 60 Amt für Wohnungswesen Darmstadt (2008), p. 3. 61 Knispel, J., Alles, R. (2003), p. 1. 62 Amt für Wohnungswesen Darmstadt (2003) and (2008).

WORK PACKAGE 7 WORKING PAPER REPORT D7.2
36
IMMOVALUE – IEE/07/553/SI2.499204 Page 36
rent table published in 2008.63 According to the results the premium is dependent on the base
rent.
Darmstadt and Berlin as early-adapters
Recently (July 2009) the city of Berlin published a new qualified rent table, which also
includes the aspect of energy-efficiency.64 The table described different rental ranges
dependent on the year of construction, location and rental space. To include the aspect of
energy efficiency the authors developed a guidance note in order to calculate the rent for a
specific property. The characteristic of energy efficiency is part of the overall building
characteristics. Therefore the valuer can use the tabular templates that are integrated within
the rent table. The following characteristics are only part of the rating scheme for building
characteristics, which potentially result in an increase or decrease in value (Table 3).
Table 3Every matched characteristic stands for a decrease or an increase in value.65 Thus the
valuer must carry out an auxiliary calculation. In the end a maximum 20 % increase or
decrease can occur due to specific building characteristics.
63 Amt für Wohnungswesen Darmstadt (2008), p. 11. 64 Senatsverwaltung für Stadtentwicklung Kommunikation Berlin (2009), p. 14. 65 Cf. ibid p. 15.

WORK PACKAGE 7 WORKING PAPER REPORT D7.2
37
IMMOVALUE – IEE/07/553/SI2.499204 Page 37
Table 3: Energetic characteristics considered in the rent table of Berlin66
So if you have an average rent of 6.57 €/m² per month in the range between 5.85 €/m² and
7.80 €/m² and the insulation of the building is insufficient, the rent would decrease about 20
% in the range of 6.57 €/m² and 5.85 €/m². This means that the rent would decrease by about
0.14 €/m² and would achieve 6.43 €/m². Vice versa the rent would increase about 20 % in the
range of 6.57 €/m² and 7.80 €/m² up to 6.82 €/m² if the energy consumption of the building
was less than 80 kWh/(m²a). On one hand, these two examples describe a decrease of 2.13 %
and on the other an increase of 3.81 % of the net rental income per m² per month. For a better
understanding see the structured calculation example in Figure 4.
Figure 4: Calculation Example Rent Table Berlin67
Finally, these qualified residential rent tables are based on empirical regional real data. The
premium of energy-efficient or the discount of non-efficient buildings depends on the base
rent in Darmstadt and additionally, in Berlin, on the range between the minimum and the
average as well as between the average and the maximum.
Empirical Data as basis for adjustments
66 Cf. ibid p. 18. 67 Senatsverwaltung für Stadtentwicklung Kommunikation (2009), p. 12 et seq.
WORK PACKAGE 7 WORKING PAPER REPORT D7.2
38
IMMOVALUE – IEE/07/553/SI2.499204 Page 38
Finally Table 4 summarizes the results of the Swiss research results and the German ecologic
rent tables.
Table 4: Results of published empirical European case studies
Respectively further German cities like Wiesbaden and Hamburg will publish qualified
ecologic rent tables that consider the characteristics of energy-efficient and non-efficient
buildings. In the future, German ecologic rent tables that rely on market evidence might be
broadly available so that valuers can consider the energetic quality of residential rental
properties automatically. But what is about the other types of properties in Germany and
Europe? Is it possible to apply the non-European research results (see 5.1.2.1) and what about
the significance and the comparability of the previous research results? One can conclude that
there are results regarding specific markets and research questions revealing the link between
sustainability/energy efficiency and value but a consistent framework how to integrate these
aspects within property valuation is still missing.

WORK PACKAGE 7 WORKING PAPER REPORT D7.2
39
IMMOVALUE – IEE/07/553/SI2.499204 Page 39
Value
Yield
Rents
BetterImage …
Higher productivityfor tenants
Low erOPEX/ energy
use
Figure 5: Linkage between sustainability features and value
5.1.2.3 Survey of Roland Berger
In an online survey (dated April 2010) among 40 big real estate companies in Germany,
Switzerland and Austria the strategy consultant Roland Berger evaluated (among other issues)
the willingness to pay for environmental/sustainability features of assets68. 70 % of real estate
investors answered that they are willing to accept higher average investment cost of 8.9 % for
sustainable buildings resp. refurbishment. On the tenants side the answers reveal that 86 % are
willing to accept higher rents by average 4.5 % if the object is “sustainable”. Altogether the
survey shows an increasing awareness and weight of energy efficiency and sustainability
issues among real estate companies. However, one must stress that the results show only
intentions and not realised transactions. Nevertheless one can conclude that during the
duration of the IMMOVALUE project the awareness of consumers and their willing to pay
for sustainability rose significantly. This latest study by Roland Berger illustrates therefore
this development of a gradually but steadily changing market sentiment.
68 Roland Berger Strategy Consultants, Nachhaltigkeit im Immobilienmanagement, Kurzfassung, April 2010, http://www.rolandberger.at/media/pdf/Roland_Berger_Nachhaltigkeit_im_Immobilienmanagement_20100413.pdf

WORK PACKAGE 7 WORKING PAPER REPORT D7.2
40
IMMOVALUE – IEE/07/553/SI2.499204 Page 40
5.1.2.4 Critical remarks - The applicability of the recent research results
Although researchers were able to find some empirical evidence, all of the mentioned (non-
European) results are not quite significant because of the small sample sizes in comparison to
the national and internationally reviewed markets.69 Muldavin for example states that the
results of the above-mentioned studies must be handled critically regarding their applicability
for other sub markets, in particular the ones that rely on the CoStar data set. He states that
analysis must be more detailed and on a property specific level
The established Swiss valuation methodology which uses the ESI was tested within real pilot
projects. The results certify the credibility and practicability of the methodology.70 However it
remains to be seen whether this approach is applicable due to specific adaptations for certain
European indeed for international property markets. Thus, the process may require further
testing. Moreover the valuation method used to include the issue of sustainability was only the
DCF-approach. It might be more interesting if the ESI valuation is applicable for the other
valuation approaches. Furthermore, the scoring is only empirical to a certain extent, and
therefore market based.
With the exception of the Swiss methodology, a review of existing research papers didn’t give
a hint as to how valuation could include sustainable and energy efficiency characteristics.
Qualitative surveys and analysis demonstrate that experts and market participants expect a
premium or a discount based on the degree of sustainability/energy efficiency and the
respective certifications of the properties. However, due to the lack of data and comparable
information, no one is able to give a clear indication about the quantitative mid- and long term
impacts of sustainability on a national or international level. Further national research projects
like the one by University of Stuttgart have just been initiated in 2010.71
Nevertheless, one can identify some of the linkages within the several valuation methods
where property valuers and the market participants from all over the world expect the effects
which may arise in the near future due to the sustainability and energy efficiency discussion.
Linkages are always related to the benefits of owners and occupiers:
69 Warren, C. (2009), p. 8; Muldavin, S. (2008), p. 4 et seqq. 70 Meins, E., Burkhard, H.-P. (2009), p. 18. 71 Cf. Schäfer, H., et al (2010)

WORK PACKAGE 7 WORKING PAPER REPORT D7.2
41
IMMOVALUE – IEE/07/553/SI2.499204 Page 41
BENEFITSOWNERS OCCUPIERS
Reduced operating costsEnhanced brandMitigation of future regulatory impactsReporting to stakeholdersTenant retentionIncreased rentsDifferentiated position of assetShorter letting up periodsIncreased market shareHigher net revenue return
Reduced operating costsEnhanced brandMitigation of future regulatory impactsReporting to stakeholdersEmployer of choice, employee
retentionEnhanced building environmentImproved productivityDecrease their footprint on the planetStronger tenant/owner/manager
relationship
Figure 6: Advantages to owners and occupiers
5.1.3 Possible Linkages to property valuation
Figure 3 summarizes all imaginable linkages within the existing valuation approaches to
include the aspects of energy efficiency of buildings:

WORK PACKAGE 7 WORKING PAPER REPORT D7.2
42
IMMOVALUE – IEE/07/553/SI2.499204 Page 42
● ●
●
● ●
● ●
● ●
●
● Adjustments ●
● ●
● ●
● ●
● ●
● ●
● ●
● ●
● ●Discounted Cash Flow from Sales Better expected marketability due to an improved energy efficiency level will be reflected in an adjusted exit yield/cap rate.
Non-efficient buildings may reduce the remaining economic lifetime due to economic inefficiency.
Operating Expenses may decrease, e.g. because of special capital expenditures to improve energy efficiency during the investment period.
Annual Operating and Capital Expenses
Discount Rate/ Terminal Cap Rate Discount Rates may decrease due to declined risks of energy-efficient buildings.
Direct consideration of enhenced thermal quality, longer remaining economic lifetime and upgraded marketability of energy-efficient buildings.
Adjustments
Consideration of special features concerning e.g. renewable energy sources (photovoltaics) within the building.
Adjustments (due to Specific Building Components)
Discounted Cash Flow Annual Operating Gross Income(holding period e.g. 10 years)
Rents may increase (adjusted growth rates), lease terms will elongate due to the better marketability and the narrow markets.
Operating Expenses may decrease, while tenants and landlords may benefit.
Annual Operating Expenses
Yield will decrease due to higher marketability, lower vacancy rates and therefore the lower risk in comparison to non-efficient buildings.
Yield/ Cap Rate
Direct Capitalization Rents may increase due to good thermal quality standards of a building while non-energy efficient decrease.
Annual Potential Gross Income
Non-efficient buildings may achieve lower sales prices.
Longer remaining economic lifetime and therefore less depreceation than for non-efficient buildings.
Depreciation
Upgrade of energy-efficient building due to the tight market and the better marketability.
Cost related Approach Replacement Costs may be higher for energy-efficient buildings (e.g. special materials).
Replacement Costs of a building
Possible Effects
Sales Comparison Approach Energy-efficient buildings may achieve higher sales prices.
Possible Linkage
Sales Prices of Comparable Properties
Valuation Approach
Figure 7: Possible Linkages within the Valuation Approaches
As stated above, some differences may already exist between energy-efficient and non-
efficient buildings respectively sustainable and non-sustainable. The questions that arise in
this context are:

WORK PACKAGE 7 WORKING PAPER REPORT D7.2
43
IMMOVALUE – IEE/07/553/SI2.499204 Page 43
(1) Is it possible to get some feasible and meaningful figures out of the pan-European
liable EPC’s and realized LCCA of energy-efficient buildings and if so will the market
demonstrate representative and significant evidence?
(2) And if so could they be included within existing property valuation methods in day-
to-day business?
The following chapters 5.2 and 5.3 try to answer the first part of the question and illustrate
what data one might extracted from EPC’s and LCCA to support the valuation professionals
with reliable and suitable figures for the consideration of energy-efficiency aspects within the
valuation process.

WORK PACKAGE 7 WORKING PAPER REPORT D7.2
44
IMMOVALUE – IEE/07/553/SI2.499204 Page 44
5.2 Analysis of Energy Performance Certificates
Key Facts and Findings
• In contrast to property valuation, Energy Performance Certificates (EPC) do not
follow a generally accepted and to a large extend identical procedure throughout
Europe.
• Hence the information available in the EPC cannot be used directly for valuation
purposes due to the existence of large differences between EPC methodologies and
thus the included information throughout Europe.
• One can, however, process the “row material” delivered by the EPC further so that it
might be useful for property valuation. In this case it improves the data quality for
property valuation mainly in the following areas: (1) energy consumption level for
the operation of the building (transferable to energy cost level), (2) technical
equipment of the building (described in detail in most data sets for EPC), (3)
modernisation needs of the building (transferable into modernisation costs), and (4)
overall energy quality compared to other buildings (label schemes of the EPC).
5.2.1 Basics for Valuers
Two principal types of energy ratings for buildings have to be differentiated:
(1) The calculated energy use,
(2) The measured energy use.
The calculated energy rating can be either
(1) Standard: based on conventional climate, use, surroundings and occupant-related
input data, defined at national level and given in a national annex.
(2) Tailored: calculated with specific climate, occupancy, and surroundings data
adapted to the purpose of the calculation. It can be either calculated for planned
buildings (design rating) or for existing (already built) buildings.
National bodies determine under what conditions the design energy rating can be considered
as or converted to a calculated energy rating for the actually realised building.

WORK PACKAGE 7 WORKING PAPER REPORT D7.2
45
IMMOVALUE – IEE/07/553/SI2.499204 Page 45
5.2.1.1 Calculated energy use
The calculation direction goes from the demand to the source (e.g. from the building energy
needs to the primary energy). For the assessment of the energy performance of buildings there
are several energy performance indicators:
Energy performance indicator
System boundary Explanation
Heat transfer coefficient (U-Value)
Building element level
Energy loss through building element
Net energy demand (heat demand, cooling demand, hot water demand)
Used rooms in the conditioned floor area
Heat to be delivered to or extracted from a conditioned space by a heating or cooling system to maintain the intended temperature during a given period of time, not taking into account the technical building systems
Final energy demand The whole building Total energy, supplied to the building through the system boundary, to satisfy the uses taken into account (heating, cooling, ventilation, domestic hot water, lighting, appliances etc.), taken into account the technical building systems
Primary energy demand
Building and energy production
Primary resource energy divided by delivered energy, where the resource energy is that required to supply of delivered energy, taking account of the resource energy required for extraction, processing, storage, transport, generation, transformation, transmission, distribution, and any other operations necessary for delivery to the building in which the delivered energy will be used.
CO2 Emissions Building and energy production
Quantity of CO2 emitted to the atmosphere for the delivered energy

WORK PACKAGE 7 WORKING PAPER REPORT D7.2
46
IMMOVALUE – IEE/07/553/SI2.499204 Page 46
Table 5: Explanation of energy performance indicators
Used rooms inconditioned floor area
total whole buiding
FINAL ENERGY DEMAND
NET ENERGY DEMAND
Calculationdirection (from thedemand to thesource)
Energy direction(from the source tothe demand)
U-VALUE of a buildingelement
Figure 8: System boundaries for different energy performance indicators72
5.2.1.2 Measured energy use
The measured energy use is based on real energy consumption of the building. To calculate
the measured energy use fte amount of all energy “carriers” must be summed up as accurately
as reasonably practicable, from recorded data, energy bills, or other measurements.
If the measured energy rating is not based on the actual energy use recorded over at least three
full years, a correction of the measured energy is necessary. This correction must ensure that
the energy consumed during the period of measurement is representative for the average local
weather condition.73 Furthermore, one must adjust the results of the measured data if the
building is not used completely. There should not be a benefit for the energy performance due
to occupancy levels in the building.
To compare the results of measured data with the calculated data,system boundaries of the
measurement have to be the same as the ones in the calculation. One must separate energy
uses other than those for building conditioning.
72 DIN 18599 73 To achieve this, the measured energy use for heating and cooling shall be adjusted to the average weather for
the building location.

WORK PACKAGE 7 WORKING PAPER REPORT D7.2
47
IMMOVALUE – IEE/07/553/SI2.499204 Page 47
mea
sure
den
ergy
use
calc
ulat
eden
ergy
use
Figure 9: Different system boundaries of measured and calculated energy use
5.2.2 Starting points for an integration of EPC into property valuation
5.2.2.1 No direct use of EPC due to large differences throughout Europe
One cannot directly use the information available in the energy performance certificates
(EPC) as input parameters for property valuation purposes due to the following reasons:
(1) The types of indicators vary considerably in the EU countries. In the frame of the
project, a comprehensive analysis of the indicators and other information available in
the EPC for Romania, Austria, Germany and England has been made. The
heterogeneity of EPC in these countries is visible in Table 6 below.
(2) Even in cases where energy performance indicators used in the EPC are
denominated by the same term, the content is not the same. The differences arise from
different calculation methodologies applied. Although a set of European standards for
the calculation of energy performance exists, it leaves enough room for national
flexibility. The national embodiment of the European standards causes a huge
heterogeneity in important details that have considerable influence on the final result. In
order to foster a kind of “harmonisation” the IEE-project ASIEPI, among other topics,
carries out a comprehensive analysis comparing the differences in the calculation
methodologies. An example of preliminary analysis results for different energy
performance indicators is given in table 6). In addition, the IEE-project DATAMINE

WORK PACKAGE 7 WORKING PAPER REPORT D7.2
48
IMMOVALUE – IEE/07/553/SI2.499204 Page 48
has examined the differences in input and output data for the energy performance
calculations and has developed a harmonised data set. In any case, researchers have not
developed these approaches far enough for a direct application in property valuation.
The description of the energy performance of a building in different countries and
regions is still far from harmonisation.
(3) If indicators for (measured) energy consumption are used a direct use for property
valuation seems easier. It is important, however, that one be aware that consumption
figures are strongly influenced by the quantity and quality of use in a certain
building and by the climate conditions. To get a “neutral” picture of the thermal-energy
quality of the building for property valuation purposes it is important to know about the
usage and climate parameters behind the measured energy consumption value and to be
able to “normalise” the effect of usage and climate.
Question Answer AT EN GE RO res non res non res res non non dem con con
calculated energy rating o o o o o o measured energy rating o o
Indicator basis
both o Classification (A to G) o o o o o Energy certificate
format No Classification o o o o One label o o o o o o Two labels o o
Number of labels (representing all energy uses) more labels o
net heat demand o o net cooling demand final energy demand o o o o o primary energy demand o o CO2 emissions o o Energy costs o
Type of indicator for the energy efficiency label
Other: energy demand for space heating o o o o o o o o o energy demand for space cooling o o o o energy demand for mechan. ventilation o o o o o o energy demand for domestic hot water o o o o o o o o o energy demand for lighting o o o o o energy production, in part. by RES o o
Other global energy demand indicator
Other: o o standardisation for improvement measures
o o o o o o o Improvements measurements
individual formul. of improvmt. measures
o o o
energy costs included o Energy costs energy costs NOT included o o o o o o o o

WORK PACKAGE 7 WORKING PAPER REPORT D7.2
49
IMMOVALUE – IEE/07/553/SI2.499204 Page 49
res… residential non… non residential
Table 6: List of indicators in energy performance certificates
Figure 10: Detailed comparison of the calculation method for the energy performance of buildings between France and Flandern74.
Figure 10 illustrates the enormous difference between delivered energy as well as primary
energy demand between France and Flanders. The data of this figure is based on the
calculation of one reference building in different countries using the national calculation
method for the energy performance certificate. The delivered energy for the building in
France is around 50 MJ/m², in Flanders around 125 MJ/m². That means in France the
delivered energy is only around 40 % of the value in Flanders for the same reference building.
Therefore, one cannot use the results of the calculations regarding energy performance
certificates directly to calculate the energy costs of a building because certain input
parameters (e.g. usage patterns, comfort levels) and fixed values (e.g. factor for shading from
surroundings etc.) are defined differently for the calculation on national level. Thus a direct
comparison with the actual energy consumption of the building requires careful interpretation.
74 D’Herdt, P., Van Orshoven, D., Wouters, P. (2008)
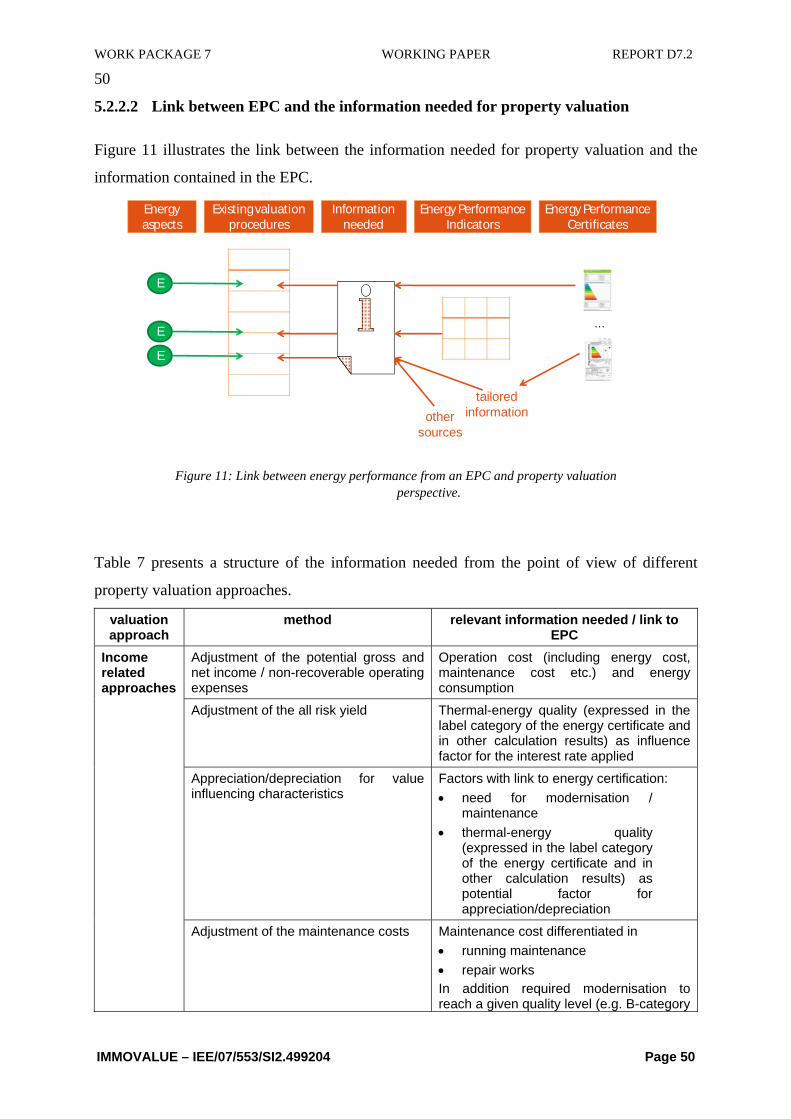
WORK PACKAGE 7 WORKING PAPER REPORT D7.2
50
IMMOVALUE – IEE/07/553/SI2.499204 Page 50
5.2.2.2 Link between EPC and the information needed for property valuation
Figure 11 illustrates the link between the information needed for property valuation and the
information contained in the EPC.
Existingvaluationprocedures
Energyaspects
E
E
E
Information needed
…
EnergyPerformance Indicators
EnergyPerformance Certificates
othersources
tailoredinformation
Figure 11: Link between energy performance from an EPC and property valuation perspective.
Table 7 presents a structure of the information needed from the point of view of different
property valuation approaches.
valuation approach
method relevant information needed / link to EPC
Adjustment of the potential gross and net income / non-recoverable operating expenses
Operation cost (including energy cost, maintenance cost etc.) and energy consumption
Adjustment of the all risk yield Thermal-energy quality (expressed in the label category of the energy certificate and in other calculation results) as influence factor for the interest rate applied
Appreciation/depreciation for value influencing characteristics
Factors with link to energy certification: • need for modernisation /
maintenance • thermal-energy quality
(expressed in the label category of the energy certificate and in other calculation results) as potential factor for appreciation/depreciation
Income related approaches
Adjustment of the maintenance costs Maintenance cost differentiated in • running maintenance • repair works In addition required modernisation to reach a given quality level (e.g. B-category

WORK PACKAGE 7 WORKING PAPER REPORT D7.2
51
IMMOVALUE – IEE/07/553/SI2.499204 Page 51
in energy certificate)
Adjustment of the residual life-time of the building
Construction year of the building and of its equipment
Adjustment of construction costs Construction cost
Adjustment of the age of the building (accrued depreciation)
Construction year of the building resp. of the technical equipment
Appreciations/depreciations for value affecting characteristics
Cost related approaches
Appreciations/depreciations for adjustment to the market value
Factors with link to energy certification: • need for modernisation /
maintenance • thermal-energy quality
(expressed in the label category of the energy certificate and in other calculation results) as potential factor for appreciation/depreciation
Draw comparison by using building of the same energy efficiency level
Labels and other calculation results, that describe the thermal-energy quality of buildings (in order to select comparable buildings)
Appreciations/depreciations derived from the energy efficiency levels
Value comparison approaches
Adjustment of the value influencing characteristics
Factors with link to energy certification: • need for modernisation /
maintenance • thermal-energy quality
(expressed in the label category of the energy certificate and in other calculation results) as potential factor for appreciation/depreciation
Table 7: Information needed to integrate energy efficiency indicators in property valuation
The prevailing part of the information available in the EPC requires additional process steps
to make them usable for property valuation. Taking into account the necessity of additional
processing, the analysis of the EPC from Romania, Austria, Germany and England shows that
in general the energy performance certificates are able to provide information such as:
(1) General data on the energy quality of the building (energy use indicator, energy
label, energy mark) that positions the building within a certain range where the existing
building stock lies currently; for example: on a scale A to G, a building with label B is
above the average, close to the highest standards, while a building with label F is clearly
a poor quality one in the stock. The building value could be influenced accordingly.
(2) Energy cost level for the operation of the building, expressed as a label that ranks
the building within the existing stock, or in present monetary values that are readily
included in any valuation calculation (at least for total occupancy cost of the user).

WORK PACKAGE 7 WORKING PAPER REPORT D7.2
52
IMMOVALUE – IEE/07/553/SI2.499204 Page 52
(3) Difference in energy uses between a real building and a similar one that
complies with the current national energy standards. This indicates either how old
the building is (having high operating costs) or how modern and efficient the minimum
requirements are (having low operating costs).
(4) Year of construction and age of technical equipment from the history of energy
standards, plus depreciation, gives a hint about the building energy quality (operating,
maintenance and repairs costs) relative to the existing stock as well as the building’s
remaining lifetime.
(5) Modernisation costs to bring the building at least to the current minimum
requirements; such information is valuable in assessing the investment needed to be
made sooner or later in order to diminish the risk of over-depreciation on the market.
5.2.2.3 EPC improves data quality for property valuation purposes
The comprehensive analysis on potential links between EPC and property valuation that have
been carried out in the frame of the IMMOVALUE-project make clear that
(1) EPC delivers the “row material” for the property valuation process,
(2) Information related to the energy efficiency of a property is relevant for valuation,
(3) Additional information and analysis is needed to process the results.
Therefore EPC´s are the basis for an improvement in the quality of data used in property
valuation.
Due to the heterogeneity of EPC in the different countries and regions of Europe, quality
assurance in this context implies to make use of
(1) a preferably harmonised set of data from EPC used as input data for property
valuation purposes. The results of the DATAMINE project offer a good starting point in
that respect;
(2) a standardised methodology how to transfer technical data regarding the energy
performance of the building into monetary values. In this context, life cycle cost
assessment is a useful approach.
With respect to the “work flow” of transferring “raw material” from EPC to useful input data
for property valuation two approaches seem possible:
(1) One can involve specific energy performance experts (and potentially LCCA)
directly in processing the data regarding the energy performance of the buildings from
WORK PACKAGE 7 WORKING PAPER REPORT D7.2
53
IMMOVALUE – IEE/07/553/SI2.499204 Page 53
the EPC, however, this method is costly and therefore should be reserved for large-
scale/big valuation projects;
(2) One could establish a certain standardised process or format to transpose
information from the EPC into useable input data for property valuation calculation
schemes. This approach seems feasible mainly for the more direct links between EPC
information and valuation. One example is the link between final energy demand /
measured energy consumption and the energy costs in Euro. Since all valuations are
currency based figures, a purely non-currency based method doesn´t seem helpful.
Finally, one must understand that further information on the building’s energy quality apart
from that gathered through the EPC is available from the reports delivered as a result of
obligatory inspections of heating and ventilation systems. Such reports are more detailed in
relation to the installation performance of the building compared to the energy performance
certificates (including extensions and/or annexes).

WORK PACKAGE 7 WORKING PAPER REPORT D7.2
54
IMMOVALUE – IEE/07/553/SI2.499204 Page 54
5.3 Analysis of Life-Cycle Costing
Key Facts and Findings
• The basic idea behind Life Cycle Costing (LCC) is that one should not only consider
the economic costs relating to the construction and initial purchasing. Rather, is also
important to take into account the costs occurring in the whole remaining life time
of a building such as operating costs, maintenance costs and replacements costs.
• LCC can be done for a whole building, or for a relevant subset of building
components.
• It should, however, be made clear which cost elements are paid by the building
owner resp. investor (non-recoverable costs) and which cost elements are paid by
the tenant (recoverable costs).
• As important element within the LCC approach Service Life Planning (SLP) can be
used to estimate the maintenance intervals and the Residual Service Life (RSL) of a
building component. Using the “Factor method” one can adjust the standardized life
time of a building component depending of the internal and external factors it is
exposed to.
• LCC is relevant for valuation since it provides additional and more precise
information about the expected future costs related to a building. With its focus on
operating cost, one can almost directly plug LCC in the income related approaches
if costs between tenant and landlord were split correctly.
• Furthermore, using scenario analysis it is possible to use LCC as a tool to analyze
uncertainty and risk.
• In practice, however, there are several barriers to the integration of LCC, such as a
need for software-tools that support the management of complex data structures
inherent to LCC analysis of buildings and of course data-transparency itself.
• The LCC Approach fits within the income method framework but doesn´t work well
with the cost approach or direct comparison.
• Little information exists regarding LCC/LCCA and the benefits that these tools
might have for valuation.

WORK PACKAGE 7 WORKING PAPER REPORT D7.2
55
IMMOVALUE – IEE/07/553/SI2.499204 Page 55
5.3.1 Basics for valuers
In the following section general issue relating to LCCA, which are important from a valuer’s
perspective will be shortly described.
5.3.1.1 Cost data classifications in LCCA
LCCA (Life Cycle Cost Analysis) consists of calculating the present value of all costs for the
whole remaining life of a building (LCC, Life Cycle Cost).
These costs include not only the initial investment in the building, but also the running costs
(maintenance, replacement, energy, cleaning etc.) as well as the residual costs when the
building has reached the end of its economic life (residual cost, can be negative if demolition
is necessary and/or cleaning up the site for substances potentially dangerous to the
environment is required). In some European countries there exist national standards and
guidelines for carrying out a LCCA. At the international level the ISO 15686-5 Buildings and
constructed assets - Service life planning - Part 5: Maintenance and life cycle costing sets the
frame. The ISO 15686-5, however, does not include a normative setting for an economic data
structure which means that different approaches are in use in practice. Table 8 shows an
example for a possible structure of cost/income elements which are relevant for an LCCA
analysis.
TC 350 life cycle stage
Cost/Income Category Cost/Income item Example of costs
Before Use Phase
Construction Costs Land costs Cost of the land on which the building stands
Professional Services Costs for project management, architecture, structural/civil/environmental engineering, cost and value management
Site clearance, temporary works
Costs of the activities to prepare the building site for construction
Construction of asset Costs for infrastructure within the surrounding of the building, structure, envelope, services, fitting out, commissioning, handover
Landscaping, external works on the surrounding
Costs for external works such as lawn, trees on the land within the surrounding of the building
Taxes and other costs related to permission to build
Costs for taxes and fees for land and construction of the building

WORK PACKAGE 7 WORKING PAPER REPORT D7.2
56
IMMOVALUE – IEE/07/553/SI2.499204 Page 56
Construction Income
Subsidies and incentives
Income related to sustainability measures such as renewable energy and energy efficiency, including loans
Use Phase
Operational Costs
Building related facility management costs
Costs for regular and routine activities such as cleaning, inspections, caretaking, management of planned service contract, products or materials used for mentioned activities
Building related insurance costs
Costs for insurance for building owner and/or occupier
Regulatory costs Costs for activities such as fire inspections, access inspections, declarations relating to energy performance
Utilities - energy, water, sewage
Costs for energy such as fuel for heating, cooling, power, lighting as well as water and sewage costs
Ground operations Operational costs on the land within the surroundings of the building such as cutting trees, mowing lawn
Taxes and other costs related to building operation
Costs such as local charges and environmental taxes
Operational Income
Subsidies and incentives
Income related to sustainability measures such as renewable energy and energy efficiency, including loans
Sale of assets or elements
Income from disposal of interest in building or salvaged materials
Maintenance Costs
Repairs and replacement of minor components
Regularly maintenance costs defined by value size of area, contract term
Replacement of major system and components
Costs to keep the performance of building elements including design and project management such as exchange roof or facade
Redecoration Costs to keep the performance of the building including design and project management such as renewal of façade
Refurbishment
Costs to improve the performance of a building including design and project management such as new chillers or boilers with higher energy efficiency
Ground maintenance Maintenance costs on the land within the surroundings of the building
Taxes and other costs related to maintenance
Costs for taxes on maintenance goods and services
Maintenance Income (no cost element yet)
End of Life Phase
End of Life Costs
Final condition inspection Cost for inspection after use of the building

WORK PACKAGE 7 WORKING PAPER REPORT D7.2
57
IMMOVALUE – IEE/07/553/SI2.499204 Page 57
Disposal and demolition
Costs for disposal and demolition including pre-demolition inspection, decommissioning, disposal of materials and site clean-up
Reinstatement Costs for reinstatement of site to meet contractual requirements
Taxes and other costs related to end of life of a building
Costs for taxes on goods and services
End of Life Income
disposal and recycling goods
Income from disposal of materials of the building
Asset or elements Income from disposal of interest in land, building or salvaged materials
Table 8: Classification of economic data for an economic performance assessment of buildings75
LCCA needs a vast amount of input data
The table shows that a large amount of information is necessary to carry out a full LCCA. For
all the cost elements mentioned above, LCCA needs additional information concerning the
lifetime perspective (ref. Service Life Planning, SLP, see below), i.e. in which time period
which kind of cost may be expected. And finally LCCA needs to reflect the complexity of the
building itself consisting of a huge amount of building elements and of important systemic
connections between these building elements. Only a comprehensive assessment of all these
constitutes a full LCCA
LCCA is not harmonized
At the moment there exist hardly any standards for LCCA. Pelzeter (2/2007) has shown that
because of this reason relevant differences exist between the calculation methods in use which
lead to considerable differences in the results76. The main differences include the following:
• structuring of data (i.e. the impact-cause model of building characteristics and the
produced cost)
• pricing (i.e. the level of prices and cost for the different categories of construction and
operation cost)
• calculation method itself (e.g. static versus dynamic approaches)
75 Hofer, G., Leutgöb, K. : Input Paper for CEN TC 350 WG 4 Economic Performance Assessment of Buildings,
May 2009 (confidential) 76 Pelzeter, A.: Life cycle cost of real estate - comparison of possible calculation methods, German Journal of
Prooerty Research, 2/2007

WORK PACKAGE 7 WORKING PAPER REPORT D7.2
58
IMMOVALUE – IEE/07/553/SI2.499204 Page 58
Therefore one should always interpret LCCA results against the background of the model
used. Good LCCA always communicate their main assumptions such as discount rate used,
the length of study period and the general structure used in the model.
5.3.1.2 Deflator in LCCA
One needs a deflator to calculate the present value of all these expenses at different points in
time. To determine this deflator (almost always a constant number, but it could also be a
variable number) one must use a risk-adjusted interest rate. The interest rate or better “yield”
used can be different for different companies, but when carrying out a valuation the yield
chosen should reflect the market perception of potential owners and resp. buyers of the
property considered.
Yield for present value of costs calculation
The risk that is partly reflected in the deflator also depends on the sensitivity of the
investment. For example: Taking into account that sensitivity for changes in operational cost
(e.g. energy prices) would influence the deflator because one can assume that an energy-
efficient building is, by definition, less sensitive to changes in energy prices.77 This approach
is therefore in line with income related valuations.
5.3.1.3 LCCA reflects only internalised costs
LCCA usually does not take external effects into account (positive or negative) instead it only
“internalized” costs. If the construction, running or demolition of a building leads to negative
consequences for the environment it is only included if the owner has to pay the full cost (or a
part of it). It is possible, however, to include external cost if one can expect such as cost to be
“internalised” due to changes in the (legislative) framework conditions. If there is a
significant probability of such changes one should take such a change into account.78 Since
externalities are also irrelevant for valuation, this aspect harmonizes.
5.3.1.4 Simplifications of LCCA in practice
It is obvious that doing a full LCCA requires a large amount of input data, but in practice
simplifications can be made. Focussing on the most important elements that influence cost 77 RICS, p.19, 6.15 78 RICS, p.17, 6.4.12
WORK PACKAGE 7 WORKING PAPER REPORT D7.2
59
IMMOVALUE – IEE/07/553/SI2.499204 Page 59
(“cost drivers”) provides an opportunity for one to greatly simplify the task. Software can also
help a great deal. Further, if a rich BIM (Building Information Model) is available for the
building (“as-built” and “as-maintained”) the task can be even simpler and faster.
5.3.1.5 Use of LCCA at present
To a certain degree, LCC is taken into account in the planning phase of a building. However,
the major focus for decision making is still on the initial cost for the developer. The developer
wants to maximize the Residual Value (here: his profit) by subtracting investment costs from
the Gross Development Value (GDV). Therefore: If the LCC approach is not considered
relevant for GDV calculation, this might lead to a decision making process that just minimises
the initial investments costs for a given concept without any reference to the operating costs
the project might have later on.
As refers the use of LCCA in property valuation, based on interviews with several valuation
professionals, we can assume that in valuation practice LCCA is hardly used today.
Knowledge and usage of LCC is poor amongst valuers
Not using LCC leads – from a macro-economic point of view – to sub-optimal decisions in
the design and purchase phase respectively. In a sense, one might call this a “market failure,”
meaning that full information about important aspects of an economic good (the building) is
not available when decisions are made. In the short term this can lead to incorrect price
signals for the buildings being sold and in the long term it could lead to the construction of
“wrong” buildings.
In the future LCC will probably be increasingly used in connection with advanced software
tools for forecasting and risk analysis when it comes to the total (initial, running and final)
cost. One can carry out this kind of analysis for both new and existing buildings. Further,
LCC can not only help developers but also investors to enhance information needed to make a
decision. Not using LCC means a lack of transparency and information.
5.3.1.6 Service Life Planning
Service Life Planning (ISO 1568679) is a method used to determine a reasonable expectation
for the remaining life span (“Residual Service Life”, RSL) of a building or its components to
exceed specific performance. To obtain an estimated service life (ESL) one uses the factor 79 More information about ISO 15686 can be found on Wikipedia: http://en.wikipedia.org/wiki/ISO_15686

WORK PACKAGE 7 WORKING PAPER REPORT D7.2
60
IMMOVALUE – IEE/07/553/SI2.499204 Page 60
method used in ISO 15686-1 to modify an RSL. One must take a number of variables into
account when using the factor method as described in ISO 15686. This is shown in Equation
(1):
ESL = RSL * A * B * C * D * E * F * G (1)
Where:
A = Quality of the component
B = Design level
C = Work execution level
D = Indoor environment
E = Outdoor environment
F = In-use condition
G = Maintenance level.
In principle one may also use other methods (“the probabilistic method” or “the engineering
method”) but they require more information. One the other hand, some have criticized the
factor method for oversimplifying what is inherently a complex problem.
Service Life Planning is relevant for the question at hand because it estimates the residual
service life of a building or its components as well as their respective maintenance frequency.
This is relevant in a LCC perspective since it provides information required to calculate
maintenance and replacement costs (it does not provide cost information directly, but
estimations of RSL and maintenance intervals are necessary to do LCC with high precision).
If a component (or a group of components), based on a LCC/SLP analysis, has a significantly
higher present value of its (partial) LCC cost, one should take it into account. This may be
especially relevant in cases where a building has a very high energy performance, but this
performance is a result of components which in present value are expensive to maintain
and/or replace. If the valuer only addresses the positive sides of these high cost components
(energy performance) and not the negative ones (high replacement/maintenance costs) the
result could be biased.
One practical suggestion may be to use software and key numbers that make it simple for the
valuers to pick items from a list (for instance an A/C system or high performance windows)
when he considers these to be of significant importance for the outcome of the valuation.
5.3.2 Starting points for integration of LCCA into property valuation
LCCA has a special fit for the income related approach in property valuation (see chapters
5.1.1 and 6.4.3), since it is based on discounted cash flow and therefore one can “plug it in”

WORK PACKAGE 7 WORKING PAPER REPORT D7.2
61
IMMOVALUE – IEE/07/553/SI2.499204 Page 61
almost directly. From the point of view of property valuation the following issues are crucial
for an integration of LCCA into property valuation in practice:
(1) The full LCCA approach needs to be downsized to a simplified one which focuses
on running cost of existing buildings, because the vast majority of valuations refer to
existing buildings on the one hand. On the other hand, operating costs are already
explicitly taken into account in the income related approach; therefore LCCA only
improves the data quality on this side. This linkage is further worked out under 6.4.3.
(2) The LCCA needs to be differentiated into one part relating to the costs which the
owner pays for and another part which the tenants pay for (non-recoverable versus
recoverable cost), since this is a crucial issue in property valuation;
(3) LCCA can be increasingly used as a standard tool for sensitivity analysis and
therefore for identifying the risk inherent to potential changes in important cost
parameters.
(4) LCCA must be addressed with a user-friendly software-tool which is able to manage
the vast amount of data that is necessary for such an integrated analysis but at the same
time is flexible enough to be able to handle the different properties a valuer deals with.
Although the LCCA approach has a special link to the income-related valuation approach, in
principle one can also use the information from the LCCA with other valuation approaches. In
the sales comparison approach one can use a LCC (full or simplified) as an adjustment factor.
Further, if one uses the LCC to do a risk/sensitivity analysis then one can use this information
to adjust the yield (because of different risk).
In the following describes some of the abovementioned crucial apects of an integration of
LCCA in property valuation..
5.3.2.1 Integrating risk analysis into the LCC
The valuer can use LCC as a tool to analyze uncertainty by applying scenario analysis. For
example, one might run the LCC calculation with different values for important parameters.
That method provides the valuer with the possibility to calculate how the LCC will change if
energy prices increase by 50 %. It is also possible to use a computer to do a “Monte Carlo”
analysis if one inputs a statistical distribution for important parameters. One can integrate this
type of analysis into valuation as part of the risk.
Increase transparency by LCC Tools

WORK PACKAGE 7 WORKING PAPER REPORT D7.2
62
IMMOVALUE – IEE/07/553/SI2.499204 Page 62
One starting point for integrating risk into LCC might be to look at the willingness-to-pay
(WTP) of an economically rational individual or firm:
One scenario: If the energy prices increases significantly, the WTP for a tenant (the rent) can
increase if the building is highly energy-efficient – while the owner of a highly energy
inefficient building might have to reduce his net rents to keep the occupation rate high. In a
transparent and efficient market a tenant would care about the total amount he pays, not how
the total costs is split between different cost categories.80 If for instance one can show that an
office is 20.000 Euros cheaper than other offices when it comes to the energy costs (paid by
the tenant), an economically rational tenant would be willing to pay approximately 20.000
Euros more in rent (ceteris paribus).
5.3.2.2 Possible simplifications
As mentioned above, a full LCCA requires quite a lot of data and work. However, there might
be some approaches to simplify this while still using the “LCC approach of thinking” as a
basis:
(1) Using "cost drivers" based on standardized LCC-calculations with information from
the energy certificate and a simple estimation of the consequence for other costs: The
idea here is that the valuer can (possibly using software) select alternatives from a list,
and based on this get an acceptable estimate of the total cost of various alternatives. In
addition a direct estimate of the energy costs (based on information from the energy
certificate) and some basic information about the technical installations in a building
can be used to calculate the other costs. For instance: One could use the type and age of
the ventilation system to estimate costs related to the Service Life of this part of a
building’s installations. Based on age and type it is possible to estimate maintenance
and replacement costs (and when they will happen in time). In this way, it might be
possible to get a fairly good estimate of the most important LCC elements of a
building.
(2) Only looking at the cost differences: For the purpose of property valuation a LCC
analysis (simplified or complete) of a few selected aspects of a building might be
enough to get figures with acceptable accuracy. For instance: Two buildings (or the
subject property vs. the comparables) are mostly identical, but they differ in the fact that
80 RICS, p. 15, 5.8.10
WORK PACKAGE 7 WORKING PAPER REPORT D7.2
63
IMMOVALUE – IEE/07/553/SI2.499204 Page 63
one of them has a more advanced ventilation system (with heat recovery) and this
building also has windows with better thermal values. In this case the LCCA can focus
on the cost differences of these two building parts including the following aspects: What
is the residual service life of these two types of components (using the Service Life
Planning approach addressing under 5.3.1)? When do we estimate that they have to be
changed at which cost? What are the maintenance costs? Does the usage of these two
components imply other costs? In addition the valuer can use the information on
calculated energy use (resp. consumption) from the energy certificates. Based on this
approach it is possible to get an estimate of the difference in LCC costs – based on a
comprehensive assessment differing components and building parts and their total
implications for overall costs (energy and other costs).
5.3.2.3 LCCA supporting software tools
In the future valuers will be able to gather a lot more information and computations will be
simplified if well-structures Building Information Models (BIM) are used more frequently. If
this were the case, simplifications might not be necessary and a full LCC may be much easier
to do. With sound data-basis of building related costs and coherent tools for assessment a lot
of the “heavy lifting” connected with LCCA can be done automatically, but of course
competent valuers will still be important – it just simplifies the job and makes LCC much
more accessible for valuation. One might also use the BIM to create the energy certificates
using energy simulation software so that in the future relevant information will be available in
an “as-built” or “as-maintained” BIM.
BIM are helpful for all three major property valuation approaches:
(1) If one uses a BIM based LCC/valuation tool for the Cost Approach then the
identification of plausible replacement costs will be easier. Under certain assumptions
one can do most of the calculations automatically by looking up the relevant values in a
database – and adjustments for cost based valuation taking into account that high energy
performance can imply low depreciation can also be calculated more easily.
(2) If a BIM is available for the Sales Comparison Approach it will be possible to use
software to semi-automatically calculate (a) the value of a property based on key
aspects of other properties that are considered comparable by the software, and (b) how
large the adjustments due to differences in energy performance/LCC aspects should be.

WORK PACKAGE 7 WORKING PAPER REPORT D7.2
64
IMMOVALUE – IEE/07/553/SI2.499204 Page 64
(3) Since the Income Related Approach is closely related to the discounted cash flow
approach used in LCC, this approach is the easiest to integrate with LCC/Energy
performance in. Based on BIM and LCC/SLP software one can estimate the
operating/maintenance/replacements costs and include this information in the DCF
using information from LCC/SLP databases. This approach is described in more detail
under chapter 6.4.3.2.2.
5.3.3 Will valuers more frequently use LCC in the future?
Whether valuers will use LCC in the future depends partly on the demand for this kind of
information in the market place, and also on possible changes in the requirements. Most likely
the adoption of LCC in valuation will depend on the following factors:
The importance of LCC information in estimating the market value of a building: This
depends partly on impact of LCCA on the total estimated value of a building and partly on the
fact that only a well-structured LCCA makes transparent cost differences which at the
moment are not really available for the valuation process.
Normative regulation in the future: Here the question is, if the law or standards will require
this type of information (see chapter 7 on a “road map” for the transfer of the approaches
developed in this report into the normative and standardisation process at different levels.
How time-consuming and difficult will it be to do a LCCA? This depends on development
of software, the availability of cost drivers (derived from a serious a previous analyses), and
availability of coherent and comprehensive Building Information Models for new and existing
buildings.
The level of energy prices and other operating cost elements in the future, and also the
uncertainty of these cost elements.
Training: Will the professionals doing valuation have knowledge and competence to do a
LCCA effectively?
In any case there is a need for easy applicable LCCA tools. Examples of LCCA models for
the calculation of operational cost of buildings are included in Appendix A.

WORK PACKAGE 7 WORKING PAPER REPORT D7.2
65
IMMOVALUE – IEE/07/553/SI2.499204 Page 65
5.4 Gap between current valuation approaches and EPC resp. LCCA
(deliverable 5.1)
5.4.1 State of the art in valuing energy-efficient resp. green buildings
To summarise the previouse chapters in general: there are no detailed investigations that exist
thus far, which describe and illustrate in an appropriate manner how existing property
Key Facts and Findings
• So far there are no specific concrete approaches available that describe how one
could value the energy efficiency and the overall “green” performance of a
property. No detailed guidance exists how theses aspects could be taken into
account in the course of property valuation.
• RICS Valuation Information Paper No. 13 provides a good basis for qualitative
integration.
• Various research projects are underway but clear guidance for daily business is still
missing.
Major current gaps for an integration of EPC and LCC into property valuation are as
follows:
• The energy performance indicators presented in the EPC need interpretation and
cannot be used directly for property valuation purposes.
• Although in principle there is a quite direct link between LCC and valuation
(mainly income related approach), LCC needs simplifications (focus on operating
costs) and support by a well-structured software-tool in order to become applicable
in the property valuation process.
• For valuers it is unclear which part of information from the EPC or from an LCCA
is the important one from the perspective of valuation.
• There exists a general knowledge gap between valuers, energy experts and LCC
experts; therefore knowledge transfer and training are required.

WORK PACKAGE 7 WORKING PAPER REPORT D7.2
66
IMMOVALUE – IEE/07/553/SI2.499204 Page 66
valuation methodologies can be applied with regard to the energy performance and efficiency
of a building.
So far, alternative approaches such as the Triple Bottom Line81, which tries to measure green
features on a more holistic level by taking social, ecological/environmental and community
performance factors (adjacent to economic performance of an asset) into account, is generally
not recognised by the real estate protagonist at the present.
Results like the latest RICS report are in line with the findings of this study. However RICS
guidance is a more general/verbal support for valuers to address the “right thing” but
operational methods for calculations are still not given.
LCC or LCCA itself does not identify further energy performance indicators such as the EPC
which directly influences the property’s value, but can be used as an analysis tool that
supports the valuers in estimating of future benefits due to energy efficiency and other
building related improvements. This might be useful especially within valuation approaches
where an adequate modelling of future cash flows is required (e.g. DCF-approach). Even
though LCCA follows the same structure as the DCF-approach and provides valuable
information one should state explicitly first that carrying out LCCA is not mandatory and
therefore will not be available from every property. Second it is not advisable that LCCA be
especially applied just for valuation purposes since it might be too costly.
“New” valuation methods are not needed
Due to findings of preliminary investigations, it seems to be very likely that the general
valuation methodology will remain unchanged and just few input variables and parameters
need to be modified – or in other words: need to be derived in a new way – to account for
energy-efficiency or sustainability in general. The scope and range of these modifications will
differ:
(1) in time: where we expect a premium for energy-efficient buildings in short to
midterm, we see a discount for non efficient buildings in the long-time perspective.
(2) in location: because the structure of EPC and the property markets differ from
country to country, the modifications of the parameter will also differ. There is no such
thing as a static “European Correction Factor” to the energy-efficient property. Further
on the level of “energy efficiency” of the non-efficient buildings (peer group) differs
also county by country (even old Swedish buildings might have better insulation than
81 Cf. Eklington, J. (1994), p.90-100

WORK PACKAGE 7 WORKING PAPER REPORT D7.2
67
IMMOVALUE – IEE/07/553/SI2.499204 Page 67
those in Italy). Beside the aforementioned, national legal incentives or punishments as
well as consumer sentiment might influence the markets’ perception in different ways.
(3) in relation to society’s expectation: even if the modifications reflect a change in
value, the overall changes might not be as high as politicians and society expect. Other
factors potentially still overlap the influence of energy efficiency and sustainability in
general – like e.g. partly bad economic climate.
Interestingly, the UK government invited RICS to explore the extent to which energy
performance is reflected in the value of a property as a result of the installation of different
energy efficiency and renewable heat and energy technologies. This underlines the rising
importance of incorporating and implementing buildings’ energy performance and efficiency
respectively EPCs and LCCA into property valuation practice.
Clear guidance for daily business is still missing
So far there are no concrete and specific approaches available that describe how energy
efficiency and performance of a property could be valued and taken into account in the course
of property valuation. While a few theoretical elaborations exist, they mostly do not explain
practical implementation and application possibilities. Other more general guidance notes,
like the RICS Valuation Information Paper No. 13,82 are also lacking a well-structured
practical approach.
Even though the LCCA follows the same structure as e.g. the DCF-approach, such aspects are
unconsidered so far.
Instead, it is usual in common valuation practice to use general benchmarks derived from
general sources or just apply a differentiated extrapolation of operating expenses and other
value-relevant life-cycle-costs including energy cost.
5.4.2 Gap and required investigations
When discussing the issue of green or energy-efficient property valuation, one must always
keep the fundamental guiding principal that “valuers just reflect and do not make the
market” in mind as well as taken into account whether or not one has considered
modifications to property valuation approaches due to energy efficiency and performance.
Valuers reflect the market
82 RICS, (2009), p.11ff

WORK PACKAGE 7 WORKING PAPER REPORT D7.2
68
IMMOVALUE – IEE/07/553/SI2.499204 Page 68
The idea of applying a reference building to quantify the extent of which a specific building
achieves a specific green building or energy-efficiency performance standard, as it is often
used in EPCs, seems to be as well an adequate method for application within property
valuation on the first site. However, one must mention that the method of reference building
applied in EPCs refers to a general mean value or energy performance standards, whereas for
valuation purposes the “reference” always refers to a mean of comparable properties.
Comparable property in this case means properties that are in all characteristics completely
like the property being valued (e.g. construction age, use, location, etc.) and just differ with
respect to their energy performance and efficiency aspects or few other aspects that the valuer
may consider for adjustments.
“Reference” building for EPC is not automatically a “Comp” for valuation
The suitability of sustainability issues, LCC and EPC for property valuation still require the
following:
(1) Support the awareness and increase the general understanding of property valuers
regarding sustainability issues, LCC and EPC information that could be used for
property valuation,
(2) Further investigations on the quantitative effect of sustainable and green property
features, etc. are required,
(3) Reveal concrete and hands’ on linkages between LCC and running operating and
maintenance costs, and
(4) The development of a common (“easy to handle”) structure for direct integration of
EPCs in standard valuation processes.
5.4.2.1 Gap between valuation and energy performance certificates
The current major gaps are as follows:
(1) There is no direct link between valuation and EPC, i.e. the energy performance
indicators presented in the EPC need interpretation;
(2) There is no coherent information resp. approach on which parts of the EC should to
be integrated into property valuation;
(3) The quantification of cost indicators for specific energy-efficient building
improvements, etc. is not a valuers’ task but rather that of building construction
engineers and energy experts;

WORK PACKAGE 7 WORKING PAPER REPORT D7.2
69
IMMOVALUE – IEE/07/553/SI2.499204 Page 69
(4) There is a general knowledge gap between valuers and energy experts (valuers don’t
have a clue about energy efficiency and energy experts do not know what valuers need
– therefore some knowledge transfer is required).
5.4.2.2 Gap between valuation and LCC
The current major gaps with regard to the application of LCCA in property valuation are as
follows:
(1) Although in principle there is a quite direct link between LCC and valuation (mainly
income related approach), LCC needs simplifications (focus on operating costs) and
support by a well-structured software-tool in order to become applicable in the property
valuation process;
(2) For valuers it is unclear what information aggregated in usual LCCA tools is
important from the perspective of valuation;
(3) There is a general knowledge gap between valuer and LCC experts (valuers do not
have any experience with LCC and therefore need training in that field).
5.4.2.3 Required future tasks
One must further increase the awareness of the real estate markets in general and its
protagonists (especially the property valuers) towards the increasing relevance of
sustainability issues and green building features in order to derive evidence describing the
relationship and interdependences between property valuation and green building.,
Further, appraisers should use the services of professional education and as well share their
gathered experiences regarding energy efficiency and sustainability in a transparent way with
other experts such as investors, energy experts and other green building protagonists to derive
a common understanding and clear sense for sustainability and green buildings’ principles.
Also, green labels and sustainability rating systems must more clearly address the language of
the appraisal community in order to be better understood.
Additionally, appraisers and all other real estate professionals should collect and share
comparable data and collaborate to push more research work regarding the isolation of value
drivers of green features in order to tear down the existing barriers that “sustainable” or
“green” still face in the real estate industry. If professionals can collect and share comparable
data and compensate for the present lack of information, then reliable and profound

WORK PACKAGE 7 WORKING PAPER REPORT D7.2
70
IMMOVALUE – IEE/07/553/SI2.499204 Page 70
investigations on the relationship between energy-efficient sustainable properties’ worth and
value will be obtained and impartial market evidence found.
Moreover, valuation standards need to address the “new” topic of sustainable building issues
directly in order to help appraisers correctly process the information gathered and show how
the green value contribution of a subject property should be discussed in a specific section
within the valuation reporting. This aspect is deepened with concrete proposals and
approaches in the following chapter 6.
Also regulators and policy makers must help to improve the awareness of a market in
transition and support internalisation of external effects to reach a “fair” market value from a
social perspective. With this respect, the valuation process must more clearly reflect the
increasing importance of CO2 (carbon) emissions. However, the emission is not directly
linked to the energy performance and thus consumption because the CO2 emission also
depends on the energy source used.

WORK PACKAGE 7 WORKING PAPER REPORT D7.2
71
IMMOVALUE – IEE/07/553/SI2.499204 Page 71
6 Integration of LCC and EPC into property valuation
approaches (Deliverable D5.2)
6.1 General requirements of valuation methodologies for integration in
practice
A valuation methodology must fulfil the following criteria:
(1) Encompass the property market situation in different countries,
(2) Provide objective and comprehensible evidence as well as rational constituted
valuation results,
(3) Be easy to handle, fast, feasible, and
(4) Practical and efficient for daily business.
Key Facts and Findings
• This chapter presents in-depths and practical approaches for integration based on
the findings from different valuation approaches, the information received from
energy certificates and from life-cycle cost analyses.
• Since the quantitative calculations represent only part of the valuation report –
albeit the most important one – the chapter also includes a section about the
introduction of energy performance and LCC information into the qualitative
description within the appraisal report.
• Thereupon the chapter presents practically applicable approaches for the integration
of EPC and LCC information into the income related approach, the sales
comparison approach, the cost approach as well as how can use each approach to
calculate property value. For all three approaches the chapter differentiates between
well-developed real estate markets and less developed markets (opaque markets). In
well-developed markets information related to the property market (and therefore
on comparable properties) is transparent and publicly available. In opaque market
this information is only fragmentary and leading to a higher degree of uncertainty.
• Case studies demonstrate the applicability and potential results of the integration
developed for all three valuation approaches.
WORK PACKAGE 7 WORKING PAPER REPORT D7.2
72
IMMOVALUE – IEE/07/553/SI2.499204 Page 72
Therefore it it must also be possible to standardize input parameter and the methodical know-
how. This refers mainly to the harmonization of the valuation methods, the dataset of input
variables, market transparency and consistent terminology.
This means, in regards to the valuation of energy-efficient buildings, that besides including
typical factors such as location (micro and macro), economic situation, qualitative building
factors (architecture, technical standards, construction quality and age, current and alternative
usability aspects, functionality, flexibility, etc.) and quantitative building aspects (rental
income, other income producing cash flows, tenant incentives, occupancy rate and vacancy
loss, non-recoverable operating expenses, etc.), one must also include energy-efficient
building performance aspects explicitly within the valuation process.
Any method developed should be guided by the fundamental valuation principals
In any case; the method or process of the assessment generally needs to identify a benchmark
or a sample that could be differentiated into a non-green-segment and vice versa a peer-group
for green feature.83 This is the minimum requirement for the identification of value premium
or discount for green or energy-efficient buildings. Such a procedure would be in line with
general valuation approaches since the use of a pool of comparables properties (so called peer
group or comps) to identify key valuation parameters is a common and accepted method.
83 Cf. Eichholts, P., Kok, N. andQuigley, J.M- (2008), p.9

WORK PACKAGE 7 WORKING PAPER REPORT D7.2
73
IMMOVALUE – IEE/07/553/SI2.499204 Page 73
6.2 Fundamental challenge when „putting an added value on green
buildings“
Key Facts and Findings
• General Discussion There are three main obstacles for the integration of green
and energy performance features into property valuation: Limit of system, limit of
focus and limit of evidence, methods and practice.
• Willingness to pay In commercial markets, buyer’s willingness to pay and
accept a totally rational decision making process based on pure cost/ benefit
analysis tends to be much higher than in residential housing markets. However, one
must mention that due to the fact that markets do not always behave rationally, the
market majority might not be willing to accept e.g. a higher rent for such properties.
Consequently, valuers are forced to permanently observe the markets’ behaviour
and evolution to avoid misleading valuation assumptions.
• Evolution of Green Value In the long run it will be more obvious that there will
be a value discount for non-energy-efficient properties instead of a value premium
for green or energy-efficient buildings. This is because it is most likely that green or
energy-efficient building standard become the usual building code.
• Knowledge deficit of valuers regarding energy efficiency and green building
aspects It is essential for valuers to have a basic understanding of the principals
of sustainability and energy efficiency and its evolving relationship with properties’
value.
• European-wide vs. country practice Due to the fact that the energy
performance of a property and its building standards (e.g. EPC, mandatory
regulations, etc.) is also dependent, to a certain extent, on national regulations,
ecological and economical climate, etc., a European-wide value impact of green or
energy-efficient buildings will not have the same impact in different countries.
However, it is possible to establish a general framework and implementation
guidance as to how valuers might be able to address energy performance and
efficiency within property valuation.
WORK PACKAGE 7 WORKING PAPER REPORT D7.2
74
IMMOVALUE – IEE/07/553/SI2.499204 Page 74
6.2.1 General Discussion
The following chapters deal with the fundamental problems of “putting a value on green or
energy-efficient properties” and with obstacles that occur when buildings are valued with an
appropriate premium or discount.
Concerning the correct integration of green attributes into property valuation, we identified
three major difficulties:
Limit of system – negative external effects
The first problem called (1) “Limit of System.” The valuer is just focussing on the asset’s
value, which is reflected in the present value of future benefits for the owner of the property.
Hence social welfare in general is not relevant. If, for example, a LEED-certified property has
just sourced its construction material in the neighbourhood, it will get credits for this aspect
since transportation and the resulting pollution were limited. For the purpose of a property
valuation, it is irrelevant if the identical material came from the immediate vicinity or from
other countries. Therefore a lot of features that are associated with “Sustainability” and
“Green” cannot be relevant to the valuer as long as there is no internalisation of positive or
negative external effects. This internalisation could be carried out by policy makers through
regulations, penalties, subventions, tax structures etc. Therefore, all social intangible aspects
that do not meet these needs are not (and should not be) reflected in property valuation.
Limit of focus – productivity of tenants
Second, we identified the problem called (2) “Limit of Focus,” Again intangible values are at
the core of this barrier. Looking at the following RICS figures, one problem might be that the
green industry fails to address the most important benefits in a transparent way. In most cases
landlords communicate energy cost savings instead of productivity gains to the tenant:
(1) Energy costs account for approx. 1 % of the business operating costs,
(2) All real estate costs account for approx. 10 %, and
(3) The staff costs account for approx. 85 % of all business operating costs of an office
tenant.84
All of the benefits to the user of the property can only have a positive impact on real estate
value if tenants show a higher willingness to pay (rent) which will only be the case if they
84 RICS (2005), p.2

WORK PACKAGE 7 WORKING PAPER REPORT D7.2
75
IMMOVALUE – IEE/07/553/SI2.499204 Page 75
understand that their internal productivity or other aspects might outweigh the additional
occupational costs compared to a non-green building..
So far the current awareness of the market for green or energy performance aspects depends
strongly on the property market maturity and therefore differs significant between countries.
For example, a study by Dr. Lübke GmbH85 stated that in Germany only one third of the
office property market addressed energy-efficiency aspects within the decision making
process; whereas two thirds of the market do not reflect such aspects at all.
The first two afore mentioned aspects are not often addressed in discussions concerning the
integration of green features into property valuation primarily due to the fact that they do not
focus on what the valuer can or must do. While the first aspect will only affect values when
policy makers take action, the second aspect regarding intangible benefits to tenants is a task
the real estate industry can accomplish through better communication. However, such
communications should be addressed by agents, landlords or developers and not valuers.
Regardless, it is not the goal of the IMMOVALUE research task or this report to address the
explained problems (1) and (2).
Limit of (enough) market evidence
The third problem we identified is called (3) “Limit of Practise/ Evidence and Methods”. The
question is whether the fast market shifts can still be processed within the traditional valuation
methods and input figures even thought market data is still very limited and comparables are
rare.
Several authors have pointed out the market evidence cannot be caught by empirical analysis
because, by definition, empirical data is historical data. Therefore there exists a considerable
time-lag (usually 1-2 years) which is important when we deal with new market trends such as
energy efficiency or other sustainability issues. Consequently, these new market trends are
underestimated due to the methodology used - and not because of missing market signals86
85 Dr. Lübke GmbH (2008), p.6 86 Meins, E., Burkhard H.-P. (2009), Der Nachhaltigkeit von Immobilien einen Wert geben: ESI
Immobilienbewertung - Nachhaltigkeit inklusive, Zürich.

WORK PACKAGE 7 WORKING PAPER REPORT D7.2
76
IMMOVALUE – IEE/07/553/SI2.499204 Page 76
Cognition
CO2 reductionSaving limited resources Indirect social benefitsPsychological benefits(improved health)
Wellbeing of employeeCorporate responsibilityOccupational health and safetyProductivity of core business
Society in general
Tenant - intangible
Occupational Costs (rent & operative
expenses) Other Lease Terms
Positive/negative external effects of a
property but no sufficient market
value impact
“Limit of System”
Problem Solution Effect
Restrictions/penalties/public grants for negative/positive
external effects by Government
Tenant - tangible
Recognized claimed improvements but
limited market impact
“Limit of Focus”
Transparent communication of
(intangible) benefits and productivity gains
Does it pay off?
and in more detail
Does “ Green” pay off?
Financial figures e.g.:
NOI, ROI, YieldGDV, MLV etc.
“Limit of Practise, Evidence
and Methods”
Figure 12: Obstacles for a full integration of green features
Other authors already pointed out yet other obstacles preventing the integration of energy
efficiency and other green features into the property industry. The most relevant aspect is the
“vicious circle,” which this report will describe only briefly. Although one might think it
obvious that a low energy building is more desirable than a conventional one and that it is
worth paying more to build or rent a low energy building, businesses do not necessarily share
this opion when investing in commercial property. Often, this scenario is caused by an
underestimation of the importance of energy consumption according to a major investigation
of the views of stakeholders in the property business in the UK87. While energy efficiency has
become an important issue in real estate economy, it is still caught to some extent in a
“vicious circle” (compare Figure 4).
“Vicious circle” is slowly disappearing
The introduction of EPC as well as the green discussion and sustainability initiatives gives all
market participants a new impulse as it offers the chance to break this vicious circle. Further,
it is the valuer’s task to improve the communication and understanding of all stakeholders
within this industry by providing transparent reports.88 The authors’ point of view is that there
87 Cf. Wilberforce, R. (2006); Pett, J., et al. (2004) 88 Cf. Myers, G., Reed, R.G., Robinson, J. (2008), p.300

WORK PACKAGE 7 WORKING PAPER REPORT D7.2
77
IMMOVALUE – IEE/07/553/SI2.499204 Page 77
has been a breakthrough in most developed countries for green-property-features and that the
market already left the introductory stages of early adaptors. The benefits for all market
participants are becoming more and more transparent and therefore the vicious circle will
eventually disappear in the future.
User„we would like
to have a broader supply
of greenbuildings.“
Constructionindustry
„we would liketo build greenbuildings but
developers don‘task for them.“
Investor„we would fundgreen buildings, but users are not asking for them.“
Developer„we are
interested in green buildingsbut for investors
they are toexpensive.“
Figure 13: Former “vicious circle” of energy efficiency in real estate economy89
6.2.2 Willingness to pay vs. technical aspects and costs
For valuers, the challenge is to isolate and define whether aspects like energy performance,
efficiency or a better green building rating (label) of green or energy-efficient buildings can
be directly transformed into the (higher) market value of the subject property.
Before digging deeper, one must first understand that there might be a gap between technical
aspects (e.g. investment for improving building equipment like HVAC or chillers, etc.) on the
one side and the willingness to pay for such “greening” improvement by the tenant, property
market, etc. on the other. It may be the case that the investments, improvement, integrated
equipment, etc. are not equitable to the achievable energy efficiency levels or market
premium of that property.
Cost is not value
A lot of the existing research work concentrates on the premium of certain green building
labels (such as LEED or BREEAM, etc.) that might be observed in the marketplace. Future
89 Wade, J., et al. (2003), p.12

WORK PACKAGE 7 WORKING PAPER REPORT D7.2
78
IMMOVALUE – IEE/07/553/SI2.499204 Page 78
work must also focus on the disaggregated input data that makes up the overall value
premium in order to move one step further.
Premium or discounts are dependent on many factors
RICS explains that the green premium has a positive correlation coefficient with the location.
Results indicate that the:
(1) Premium is higher in lower quality locations,
(2) Premium is higher in regions with more extreme weather events.90
Further, some differentiation must be established between:
(1) Markets for private homes/ flats and
(2) Commercial real estate markets (e.g. office or retail properties).
Differentiation between sectors is necessary
The willingness to accept a totally rational decision making process based on pure cost/
benefit analysis tends to exist primarily in commercial markets as opposed to residential
housing markets. Moreover, it is likely that in net lease-orientated property markets (tenant
pays in addition to rent some or all property expenses) evidence of rental changes due to
energy-efficient buildings might be more rapid than in gross lease-orientated markets (tenant
just pay flat rental amount, owner carries all charges incurred by the ownership) because of
the direct monetary benefits for the property investor or owner. Other real estate experts such
as e.g. Reed and Wilkinson91 also share this hypothesis.
Regulated markets behave differently
Furthermore, in some markets the government controls the rent levels and defines rental caps
for certain buildings. If these buildings are highly energy-efficient, tenant may enjoy lower
operating expenses without higher rental income or value for the owner.
Taking the above mentioned aspect into account, one must inevitably focus on the
disaggregated input data instead of having an overall premium for a certain green building
label.
In extreme situations the value premium might be even higher than the green cost due to
psychological effects. For example: a driver purchases an expensive car with a more efficient
90 Cf. Eichholts, P., Kok, N., Quigley, J.M. (2009), p.23 91 Cf. Reed, R.G., Wilkinson, S.J. (2005), p.346

WORK PACKAGE 7 WORKING PAPER REPORT D7.2
79
IMMOVALUE – IEE/07/553/SI2.499204 Page 79
diesel engine although the owner is going to drive 5,000 km per year, thus the higher up-front
investment will not be outweighed by a DCF-pay-off.
In markets with an oversupply the effect will be more intensive than in markets that are rather
undersupplied, since consumers will have to accept less quality to get any product. The
unique economic climate following 2008 also affects consumers’ willingness to pay since
consumer needs in an economic crisis are much more basic.92
Physiological effects & the current market state influence the impact of energy-
efficiency
In example, at Kennet Island the developer St. James investigated the consumers’ willingness
to pay for green residential development (Eddington, 200993) and found out that despite the
fact that there is a significant degree of goodwill towards sustainability a totally rational
approach for pricing was not possible since (1) private owners do not usually perform a full
DCF or LCC analysis to recognize all benefits and (2) banks (at least at that point in time)
tend to not fund more money for the same size of building just because it is sustainable.
Taking the cost/value discussion into account, one must also understand that green-properties
with rental premiums might nevertheless not pay off because the initial cost of the investment
might be much higher than the present value of the rental premium.
To convince developers, investors and users that green premiums are a fact, such premiums
must first be be identified by hard market evidence. The willingness to pay reveals the
benefits. Since incurred cost of energy-efficient improvements do not necessarily translate
into value premiums, one must be careful how to approach the topic
One must perform the assessment of green values in two steps:
(1) Identify if there is any premium (or discount)
(2) Quantify the delta
Further, Myers94revealed another reason why limited market evidence for rental or value
premiums are observable despite the fact that green or energy-efficient buildings are accepted
by the property market.. Myers stated that there are still inherent barriers between design and
construction aspects of green or energy-efficient building that make comparison of green
buildings difficult. As a result, there is little adequate or reliable evidence for value impacts.
92 Cf. WBCSD (2009), p.7 93 Cf. Eddington, C., Berman, D., Hitchcock, D., et al. (2009), p.10 et seqq. 94 Cf. Myers, G., Reed, R. and Robinson, J.M. (2007)

WORK PACKAGE 7 WORKING PAPER REPORT D7.2
80
IMMOVALUE – IEE/07/553/SI2.499204 Page 80
The market does not always behave rationally and therefore it is possible that, even thought
there are figures available which state a premium for green or energy-efficient buildings, the
markets majority might not be willing to accept e.g. a higher rent for such properties.
Consequently, valuers are forced to permanently observe the markets’ behaviour and
evolution to avoid misleading valuation assumptions.
6.2.3 Evolution of green value
The introduction of gradually strengthening regulation (e.g. EPCs) of new and existing
building stock will eventually lead to more awareness regarding a building’s energy
performance and efficiency. This means that labelling and certification systems using
independent information will be used more often, regulations on energy codes will become
stricter and subventions and tax relief might be applied when building energy-efficient
houses. Some experts already claim that the next big growth path – the next Kontratjew cycle
– will be “green”, which would of course further support an increasingly rapid change of
market sentiment and perception of sustainability:
I. Kondratjew II. Kondratjew IV. Kondratjew V. KondratjewIII. Kondratjew VI. Kondratjew
Steam-engine/Cotton wool
Steel/Railway
ElectricalEngineering/Chemistry
Petrochemistry/Automobile
Information technology/Computer
? Sustainablemovement (e.g. green buildings…)
1800 1850 1900 1950 1990 20XX
Figure 14: “Green” Kontratjew cycle?
Gradually increasing transparency might lead to bigger impact on values
Even if there are some examples of green-features that lead to a rising awareness and might
lead to an added green-value as stated previously, there are still a lot of obstacles. Since
markets shifted fairly quickly in some cases, market data is in most regions still limited. Even
though one can see a positive exception within Australia and to some extent the United States
of America, experts still claim that in these markets relevant data is rare95 (For e.g. “Green
95 Cf. Muldavin, S. (2008); or Bienert, S., Schützenhofer, C. and Steixner, D. (2009)

WORK PACKAGE 7 WORKING PAPER REPORT D7.2
81
IMMOVALUE – IEE/07/553/SI2.499204 Page 81
Star” in Australia was introduced in 2000 and now already accounts for approx. 30 % of
newly constructed commercial buildings. In the US already 10 % of all commercial buildings
are to some extent sustainable96).
Changing human needs affect values
In general, the development and evolution of green or energy-efficient properties and the
current situation of valuation will not be a static issue but rather a more a dynamic process,
which means that changes to value happen permanently over time due to changes in property
market’s requirements and needs. Lorenz and Lützkendorf97share this opinion in their
statement that “the value of goods arises from their relationship to human needs, and is not
inherent in the goods themselves. With changes in this relationship, value arises and
disappears.” Nowadays, highly energy-efficient buildings with low energy consumption or a
certified green property are starting to represent a unique selling proposition and therefore are
likely to achieve an added value. However, the premium is likely to decrease over time and
the “product” is likely to become a standard in the future. One can compare this phenomenon
to the market evolution of other high-tech products such as LCD vs. conventional TV or an
integrated air conditioning system in cars.
Today’s unique selling propositions (USP) might be market standard in the future
In the long run it is more likely that there will be a discount for non-energy-efficient
properties instead of a premium for green or energy-efficient buildings (see Figure 15.
96 Bowman, R., Wills, J. (2008), pp.4 et seqq. 97 Cf. Lorenz, D., Lützkendorf, T. (2008b), p.3

WORK PACKAGE 7 WORKING PAPER REPORT D7.2
82
IMMOVALUE – IEE/07/553/SI2.499204 Page 82
Figure 15: Possible evolution concerning premium vs. discount of energy-efficient buildings
Another aspect one must mention in this context is the fact that that all current studies and
debates mainly focus on issues associated with the valuation of new green buildings, whereas
the question of valuation for a non-green building might be another challenge with a much
greater potential for financial impacts on the property market and capital values.98
Improving building and construction techniques will eventually lead to even higher
“green standards”
Another difficulty regarding the inclusion of sustainable and energy efficiency aspects in
property valuation will be the continuous future changes in the construction and design of
green buildings. In 2005 EPC-regulations ranked most of the existing building stock in class 4
and 5..Many expect that due to tougher building codes, higher quality of the used materials
and increasing energy costs new properties will possess a higher standard of energy efficiency
and therefore fall into a better class such as 1 or 2(an average heating demand below 100
kWhpe/m².yr).
98 Cf. Parker, D. (2008), p.552

WORK PACKAGE 7 WORKING PAPER REPORT D7.2
83
IMMOVALUE – IEE/07/553/SI2.499204 Page 83
Figure 16 Shifts in building stock energy class under Transformation case99
All these illustrated changes due to regulatory actions, building trends, etc. will affect the
quantitative impact upon property values. In summary, this implies that one cannot give a
general rule for the quantitative (numeric) impact that fits for all markets on property values,
rents and yields(e.g. always 20 bps premium on yield for non-energetic buildings). The
following figure illustrates the evolution of the development within the building industry
regarding “green buildings”:
Functionality
EnergyQ
uality
Conservative
Use
ofR
esources
EnvironmentalIm
pact
Health
andC
omfort
Construction
andU
ser Costs
Proit/ Return
StabilityofValue -
Grow
thofValue
Low-Energy-House / Passive-House
■
Zero-Carbonbuildings ■ ■
Green Building ■ ■ ■ ■
High Performance Building ■ ■ ■
SustainableProperties ■ ■ ■ ■ ■ ■ ■ ■
Solar houses
Low-Energy-House
Zero-Carbon buildingGreen Building
High Perform. BuildingSustainableProperties
1980
1985
1990
1995
2000
2005
2010
3-L-House
Zero-EnergyHouse
Plusenergiehaus
Figure 17 Green building movement
99 Cf. WBCSD (2009), p.38

WORK PACKAGE 7 WORKING PAPER REPORT D7.2
84
IMMOVALUE – IEE/07/553/SI2.499204 Page 84
6.2.4 Rising use of green building rating tools
In recent years various European property markets have launched a lot of new green building
rating tools. The development of implementation systems is higher if the label or certificate is
compulsory (e.g. EPC, heat insulation ordinance) and not voluntary (like e.g. green building
certification systems like LEED, BREEAM, DGNB). Interestingly, both the government as
well as the industry had a hand the initiation of the labels. Worldwide there are around 20
voluntary rating systems and labels respectively that try to meet the conceptual complexity of
the term “sustainability” as well as create standardized product identification, a seal of
approval, for green and energy-efficient buildings.
Only few international recognised labels
However, most of these labels have only gained prominence at the national and regional level.
Only a few “green rating” labels like BREEAM, LEED, Green Star and CASBEE have
gained international recognition and serve as preferred standard for globally operating
investors. The current numbers of certified and registered buildings according to these
systems are illustrated by the following table.
Current numbers of certified and registered buildingsBREEAM LEED DGNB Green Star CASBEE
Number of units certified ~ 110,000 ~ 2,700 ~ 16 ~ 50 ~ 25Domestic 98% 30% 0% 0% 0%Non-Domestic 2% 70% 100% 100% 100%Number of units registered > 500,000 ~ 20,200 N/A N/A N/A
Table 9: Current numbers of certified and registered buildings (as of April 2009)
As one can see in Table 9 the number of units registered is actually five to ten times higher
than the number of units already certified. The international certification label LEED, for
example, shows an intensive use in the last few years.
Registration boom increased throughout the last couple of years
The number of registered projects has tripled, particularly between the years 2006 and 2007,
with a high proportion of registered buildings outside the United States – another hint that the
broader public already demand greater transparency and cost/benefit analysis of sustainability
aspects.

WORK PACKAGE 7 WORKING PAPER REPORT D7.2
85
IMMOVALUE – IEE/07/553/SI2.499204 Page 85
2005 2006 2007 2008 2009*
Commercial LEED Registered Projects (per year)* as of April 2009
Figure 18 History of LEED registered buildings100
One can expect a considerable increase of certified buildings can be expected in 2010/11 due
to the relatively long time frame between the project start (registration) and the beginning of
operations (certification) of a building. In recent years, the cumulative amount of certified
buildings have developed in a more or less consistent pattern as can been seen in Figure 19.
2005 2006 2007 2008 2009*
Commercial LEED Certified Projects (cumulative)* as of April 2009
Figure 19 History of LEED certified buildings101
Due to the previous non-existence of their own certification and labelling system, a lot of
European countries decided to implement LEED. Here the number of registered and certified
buildings is also rising at a tremendous rate over recent years. While in 2008 there were no
LEED-certified buildings in Germany, as of the middle of 2009 a total number of 74 projects
100 cf. N.N., 2009, www.usgbc.org; RICS Research (2010) 101 Cf. N.N., 2009, www.usgbc.org; UNEP (2010)

WORK PACKAGE 7 WORKING PAPER REPORT D7.2
86
IMMOVALUE – IEE/07/553/SI2.499204 Page 86
registered their buildings and have already begun the necessary documentation. The following
map gives an overview of current LEED projects in some European countries.
Certified: 0Registered: 2
Certified: 1Registered: 74
Certified: 0Registered: 1 Certified: 0
Registered: 1
Certified: 2Registered: 13
Figure 20: Overview of current LEED projects in some European countries102
Additionally, most of the existing green rating tools also cooperate. For instance, LEED,
Green Star and BREEAM are developing a common method of measuring carbon emissions
from new buildings. This cooperative attitude is based on the precedent that the bulk of these
tools were developed and shared using multiple rating groups affiliated through the umbrella
organization “world green building council”:
World Green Building Council
U.S. Green BuildingCouncil
United States United Kingdom Germany/Austria
Figure 21: World Green Building Council
102 Cf. N.N., 2009, www.usgbc.org

WORK PACKAGE 7 WORKING PAPER REPORT D7.2
87
IMMOVALUE – IEE/07/553/SI2.499204 Page 87
Value Impact of green rating tool is comparable to EPC
In the context of property valuation, the questions that arise in this respect are identical to
those in the case of EPC. The valuers need to extract information that reveals and isolates
figures and value drivers resulting from the energy efficiency stated in the label and the labels
overall impact.
Due to recent developments in the field of sustainability and energy efficiency policies (e.g.
introduction of EPCs), Many expect that low energy or passive housing standards become
mandatory and ultimatly the new building standard/code in the long run. How this evolution
will affect the above stated enforcement of voluntary green building rating tools, and further,
whether green building rating tools might lose importance in the long run is unclear.
Furthermore, there is no evidence available so far whether the introduction of EPCs will
influence the currently tremendous enforcement of green building rating tools, or if both tools
will coexist. Many expect that the EPCs will become more important in the long run due to
related mandatory regulations (e.g. EPBD, etc.). Moreover, many also expect that current
EPC will evolve further and may incorporate green building rating criteria and aspects.
6.2.5 Rising sensibility for Corporate Social Responsibility
Another driver which one could be regard as a proxy for the evolution in this process is the
growing interest in corporate social responsibility (CSR) and within this context, corporate
sustainability issues.
CSR has become a normative standard concerned with the integration of environmental,
social and economic business strategies and practices.103 Therefore, CSR describes firms’
choices about inputs (e.g., the source and mixture of raw material), internal processes (e.g. the
treatment of employees), and publicity (e.g., community relations). As Jones, et al.104
conclude, with research that there is no common approach to CSR but rather a considerable
variation in the nature and extent of the CSR issues. The following table illustrates the
difference between CSR reporting and obligatory reporting according to leagal requirements
today:
103 Cf. Jones, P., Comfort, D., Hillier, D. (2006) 104 Ibid, p.148

WORK PACKAGE 7 WORKING PAPER REPORT D7.2
88
IMMOVALUE – IEE/07/553/SI2.499204 Page 88
General business basis, non-financialperformance indicators
Non-financial performance indicatores –especially information concerning environmentand social issues
Sustainability-and CSR-Reprot
Annual Report
Financial Report
Corporate Report
Subject to auditunder national legislation
Principle of„voluntarycommitment“
KPIsFinancial Income-
ROI -EBITDA -
etc. -
KPIs- Carbon Footprint- Use of resources- employee-turnover- Ethical behaviour- etc.
Figure 22: CSR and corporate reporting today105
CSR supports the implementation of sustainability aspects within companies
Although sustainability as a principle within the philosophy of a company is still a voluntary
commitment, it is becoming more and more of an integrated element in companies’ business
plans and annual company statements. Beside monetary key data like turnover, internal rate of
return and non-financial figures like e.g. the status of employee's illness or the reduction of
CO2-emission can demonstrate the success of a company. These aspects enable not only a
sustainable relationship with employees and clients but also engender the trust of investors
and creditors. Prospective firms already know that intelligent clients also set up their buying
decisions on the eco-political and social engagement of their business partners.
One can expect to see regulation requiring large companies to report on social responsibility
as a legal obligation in the future. In some countries non-financial performance indicators are
already regulated by law (e.g. financial accounting changing law in Austria, called
“Rechnungslegungsänderungsgesetz - ReLÄG”).
Major companies just rent LEED-certified properties
In the real estate sector, the issues regarding eco-efficiency are mainly focused on the energy
efficiency of buildings, the provision of a healthy and pleasant indoor air quality and on the
105 Cf. GRI (2002); KPMG (2010)
WORK PACKAGE 7 WORKING PAPER REPORT D7.2
89
IMMOVALUE – IEE/07/553/SI2.499204 Page 89
initial investment and consequent operating inputs chosen to maximize investor returns. Some
internationally-active companies like Siemens, SAP, Marriott, Nokia, Wrigley, etc. have set a
global commitment to just hire or invest in LEED-certified buildings with a minimum
certification level of silver. In addition to the expected reduction in operating costs due to
these properties’ efficiency, such firms also hope to garner a positive image effect and a better
reputation in the market.
6.2.6 Knowledge deficit of property valuers regarding sustainability issues
In order for the valuer to provide adequate information about expected value of a green or
energy-efficient building, it is essential that valuers have a basic understanding of the content
and measurement of various green building features, and buildings’ energy performance and
efficiency. As e.g. Fisher et al 106 conclude, it is important that valuers ensure that they
understand the principle of interdisciplinary focus on sustainability and its relationship with
properties’ worth and value.
Appraiser’s knowledge of sustainability issues needs to be improved
Several observations by e.g Ellison and Sayce107, or Warren-Myers and Reed108 indicate –
regardless of the region and country – that valuers in general have a large knowledge gap in
terms of their background regarding sustainability issues. In particular the tendency to rely on
industry rating tools like the overall result of a green building label seems to be worrying;
taking into account that their understanding of differences between the content of tools/
results is fairly poor. Most research results indicate that the transparent communication of the
green building features and not the applied green building rating tool and its aggregated result
have an impact on the market value.
It is important that valuers overcome the knowledge gaps stated above to improve the
integration of buildings’ energy performance and efficiency into property valuation practices
and linkage to EPCs and LCCA. Valuers could reduce this gap through professional training,
participation at discussions and interaction with energy and sustainability experts.
It is the national and international property valuation association’s task to offer specific
education programs and seminars in the field of real estate sustainability (energy performance
106 Cf. Fisher, R., Coll, L., Pelly, L., Percy, J. (2008) 107 Cf. Ellison, L., Sayce, S. (2006) 108 Cf. Warren-Myers, G., Reed, R. (2009)

WORK PACKAGE 7 WORKING PAPER REPORT D7.2
90
IMMOVALUE – IEE/07/553/SI2.499204 Page 90
and efficiency, carbon emission, LCCA, etc.) and its impact on property markets and property
worth and value.
6.2.7 Country practice vs. European-wide common practice
Energy performance of a property and its building standards (e.g. EPC, mandatory
regulations, etc.) are dependent, to a certain extent, on national regulations, ecological and
economical climate, etc., and therefore vary between countries.
Beside the aforementioned, there are a couple of other reasons why country specific practices
might be necessary:
(1) Different types of indicators used in EPCs (e.g. net heat demand, final energy
demand, carbon dioxide emission),
(2) The general heterogeneity of EPCs (e.g. different illustration and labelling)
(3) Differences in value composition of energy performance indicators (e.g. final energy
consumption) used in EPCs,
(4) Different calculation schemes and methodologies for EPCs.
Besides the differences regarding the EPC, the embodiment and application of LCCA is not
harmonized in Europe. The main reasons for this include the fact that: (1) there are different
methodologies and approaches for LCCA available, and (2) LCCA are voluntary and not
mandatory and therefore are not regulated.
European-wide practice for integration is difficult to achieve
Consequently, evidence for the value impact of green or energy-efficient buildings must be
observed and derived in the specific country and property market. An adaption or application
of market evidence for green value impacts derived from other countries with heterogeneous
market structures is not advisable and would possibly lead to misleading results.
Common framework for European-wide applicable methodologies
Even though there are differences, it is possible to establish a common framework and
implement a guidance note on how valuers might be able to address energy performance and
efficiency respectively EPCs and LCCA within property valuation and its reporting (see
Chapter 6.3 and 6.4). Essential aspects are summarized in the following figure:

WORK PACKAGE 7 WORKING PAPER REPORT D7.2
91
IMMOVALUE – IEE/07/553/SI2.499204 Page 91
Since in principle things are not new. Are there already valuers who handle this aspect in the right way? NO(since some training will be necessary for everyone)
Do we need new valuation methods? NO(since existing tools can display everything)
Could there be a general premium / discount rule ? NO(due to willingness to pay)
Could there be a pan-European approach/ guidance to these aspects? YES
(since the fundamental challenge is the same)
Should we distinguish between developed and less transparent markets? YES
(since data input is required for proper calculation)
Do we also need to revise report structures accordingly? YES
(since the aspects need to be addressed in the text)
Do we need new valuation methods? NO(since existing tools can display everything)
2
Could there be a general premium / discount rule ? NO(due to willingness to pay)
1
Could there be a pan-European approach/ guidance to these aspects? YES
(since the fundamental challenge is the same)
3
Should we distinguish between developed and less transparent markets? YES
(since data input is required for proper calculation)
4
Do we also need to revise report structures accordingly? YES
(since the aspects need to be addressed in the text)
5
6
Figure 23: General findings / Background

WORK PACKAGE 7 WORKING PAPER REPORT D7.2
92
IMMOVALUE – IEE/07/553/SI2.499204 Page 92
6.3 Qualitative Integration into valuation process
Besides the question of how valuers can encompass quantitative considerations, the valuer
may use the descriptive parts of the report to specify and demonstrate the energy efficiency of
the property being valued, and form that basis, perform further calculations.
Due to the issue of necessity to integrate sustainability features in a qualitative manner the
RICS recently published a Valuation Information Paper No. 13, which deals with the topic of
“Sustainability and commercial property valuation.” They stated the previously mentioned
Key Facts and Findings
• Qualitative comments related to energy efficiency as part of the sustainability
characteristics of a property must be integrated in the valuation report by the
valuer.
• Extension of the building description: a separate (sub-) chapter for energy
efficiency/sustainability of the building construction and equipment should be
inserted in the report structure accordingly.
• Especially if solid market evidence regarding teh value impact of good or poor
thermal energy/sustainability characteristics is hardly existing, an in-depht
argumentation and description is essential – especially if input parameters should
reflect the green value impact..
Possible useful information sources for valuers might be:
• Energy Performance Certificate (EPC)
• Sustainability assessment tools (LEED, BREEAM, etc.)
• Publications, e. g. Valuation Information Paper No. 13 published by RICS
• Energy Bills can give hints about energy consumption and accrued costs if the EPC
is not available
• Life Cycle Cost Analysis
• Illustration of the development of the energy costs during the last decade
• Illustration of limitedness of the fossil energy sources

WORK PACKAGE 7 WORKING PAPER REPORT D7.2
93
IMMOVALUE – IEE/07/553/SI2.499204 Page 93
point that “[o]ften it may be difficult for [sustainability factors] to be quantified; nevertheless
it may fall within the remit of the valuer to provide some qualitative comments” on these
issues.109
This quote means that in the event that the market and its participants recognize that energy
efficiency and/or sustainability characteristics have an impact on the market, the valuer must
inform and prepare advice relating to these special issues.110 Actually, if the market already
recognises the importance of sustainability aspects then the inclusion of the quantifiable
aspects of sustainability seems indispensable (in chapter 6.4 different methodologies for this
possible integration are described).
The forthcoming explanations possibilities to integrate energy efficiency into the valuation
report. In the most cases suggestions can be used either for energy efficiency or sustainability
in a broader sense, since both aspects are interdependent and in some cases they cannot easily
separated.
6.3.1 Descriptive Integration of Energy Efficiency
A valuation report provides the documentation of the valuation process (see Section 5.1) and
argumentation for the selection of certain input parameters that the valuer used in the
calculations for any property valued. This report is therefore incomplete if it does not cover
the aspects of energy efficiency and as well sustainability in the future.111 If the valuer cannot
isolate quantitative market evidence in the case of not-transparent markets, the superior or
inferior energy levels ilding must be addressed by the valuer in the descriptive part of the
valuation report. Such information regarding the existing energy qualities/deficits of the
subject property when compared to its peers may support customer’s decision making
processes112 and increase transparency.
In most cases, valuers use a proprietary valuation report that contains a separate chapter with
the description of the building components. This chapter, named “Description of the
Building,” may contain up to 4 subsections (see left side of Figure 24).
In general, the building components (e.g. thermal insulation, type of windows/doors,
heating/cooling installations) that are directly or indirectly related to energy consumption by
users are already included in the valuation report per se. The question arising in this context is 109 RICS (2009): p. 3. 110 Ibid. 111 Cf. Scherr, H. (2009): p.1 et seq. 112 RICS (2009), p. 3.

WORK PACKAGE 7 WORKING PAPER REPORT D7.2
94
IMMOVALUE – IEE/07/553/SI2.499204 Page 94
how valuers can approach sustainability or simply the energy efficiency of the property in a
more easily understood and replicable way.
Figure 24: Possible Structure of the Building Description Nowadays versus Future
One could reasonably include the description of the building and integrate its energy related
features within the chapter “Further Information.” However, in order to underline the
importance of the building’s energy aspects or sustainability issues the valuer should create a
separate subsection that could be named “sustainability/energy efficiency” (see right side of
Figure 20). The introduction of a separate chapter, however, does not detain the valuer from
also addressing sustainability issues in the other chapters of the building description.
Separate chapter for sustainability recommendations
This separate chapter should include the definition of energy efficiency/sustainability in the
context of properties and therefore the three main columns of the Triple Bottom Line model:
the environmental, economical and social features. The definition of sustainability for
commercial buildings published within the Valuation Information Paper No. 13 of the RICS
may be helpful in this context. 113
„[A sustainable] building [...] minimise [s the] environmental impact through all parts of the
building life-cycle and focus [es] on improved health for their occupiers [...]. [...] Sustainable
buildings should optimise utility for their owners and occupiers and the wider public, whilst
minimising the use of natural resources and presenting low environmental impact, including
their impact on biodiversity.“114
Furthermore, there is an increasing number of sustainability assessment codes/tools already in
use like BREEAM, LEED, Green Star, DGNB etc. When one applies such codes to the
113 Cf. RICS (2009), p. 5 et seq. 114 Cf. RICS (2009), p. 6.

WORK PACKAGE 7 WORKING PAPER REPORT D7.2
95
IMMOVALUE – IEE/07/553/SI2.499204 Page 95
property under investigation, the code provides the valuer with important information about
the sustainable quality of the property.115
Besides the building description, one can estimate some quantitative adjustments of some
valuation parameters like e.g. the market rent or the maintenance costs of an office building.
The argumentation regarding the adjustment and its extent is highly correlated with the
corresponding estimation of the particular valuation parameter itself. Therefore one must
explain the adaptation within the descriptive chapter.
The following example is given to facilitate better understanding: Valuation of an office
building with very low primary energy consumption: the EPC exceeds the national
requirements of the comps. The valuer is going to adapt the market rent, i.e. estimates a
premium. The structure of the valuation chapter within the valuation report and the estimation
of the market rent might be adapted as shown on the right-hand side of Figure 25.
Lacking market evidence requires good argumentation and description
The need for proper argumentation and description is particularly true if little market evidence
exists. The lack of market data increases the necessity for further information on sustainability
and energy efficiency effects in order to meet the awareness of the market participants.116 In
this case the descriptive portion if the report is more relevant to argue that the subject property
is “future-proof“ to a greater degree when compared to the rest of the market.
Another opportunity for the valuer to reinforce his or her decision to set a premium may be
e.g. to illustrate the rising energy costs during the last decades, especially in the context of the
worldwide decreased of natural energy resources as well as the advantage of the building
being valued using alternative energy sources such as photovoltaic.117
Highlight Advantages and disadvantages, their middle- and long-term effects to
underpin the adjustment of valuation parameters
At the very least, the valuer must show what advantages and disadvantages may arise due to
the building components that are liable for the thermal quality of a building and the impact on
the future usability of it. In this context, the valuer must assess and discuss some of these
aspects:
115 Ibid p. 6. 116 Ibid. p. 15. 117Cf. RICS (2009)

WORK PACKAGE 7 WORKING PAPER REPORT D7.2
96
IMMOVALUE – IEE/07/553/SI2.499204 Page 96
(1) The floor area in the terms of usability and the possible impact on the overall
running costs.118
(2) Insulation, its special features (e.g. heat bridges, type of windows, etc.) and the
continuity of them in terms of durability, regional and legislative building standards.
(3) Type of energy source with regard in the grade of carbon emissions and the secure
of it is continuity, 119
(4) Water efficiency, especially in locations with scarce water supply, using grey water,
recycling of water, etc., 120
(5) The ability to replace and or perform remedial maintenance on the building
components121(e.g. the upcoming economic effort to replace an oil running heating
system against a pellet heater to reduce operating costs due to rising energy costs).
This list contains only a few possible examples. In principal, the valuer is able to use the
existing building components in comparison to national and/or international building
standards to illustrate which possibilities are given and can be used to upgrade the building
and it’s facilities as the ongoing awareness of energy efficiency and/or sustainability of
buildings improves.
As illustrated, documentation of the market awareness as well as the verification of the
parameter market rent, yield, etc. may be extended with separate chapters like “Awareness
due to Energy Efficiency/Sustainability” and “Adaptation due to/energy
efficiency/sustainability”. 122
118 Ibid, p. 9 119 Ibid, p. 12 120 Ibid 121 Ibid, p. 11 122 Cf. RICS (2009), p.11

WORK PACKAGE 7 WORKING PAPER REPORT D7.2
97
IMMOVALUE – IEE/07/553/SI2.499204 Page 97
Figure 25: Possible Structure of the Valuation - Nowadays versus Future
One of the most important aspects when one assesses sustainability is the level of energy
performance of the building, i.e. its annual energy consumption and GHG emissions
associated the energy the building uses. Such information is now included on a mandatory
basis by European EPC’s (see chapter 6.3.2). One can measure accrued energy costs via from
the energy consumption and the tariffs. Further, LCCA may give additional guidance
regarding the extent of the accruing energy costs during the whole lifetime and the influence
as well as the dimensions of upcoming maintenance costs and special renovation necessary
throughout the lifetime of the building (see chapter 5.3.1).
The report should discuss the following sustainability aspects (preferably in a separate
chapter):
(1) land use,
(2) design and configuration,
(3) construction materials and services,
(4) location and accessibility considerations,
(5) fiscal and legislative considerations and
(6) management and leasing issues.123
The next chapter will gather some possible figures and information that the valuer could
integrate into the valuation report if the EPC of the building being valued is exists and is made
available.
6.3.2 Possible Considerations of data available from EPC
6.3.2.1 EPC is available
When the building EPC is available, the valuer must carefully analyze the information
provided within this document. Furthermore, the valuer should check who issued the EPC not
only to make sure it is an official document but also to ensure the credibility and correctness
of the data published within.124 Thus in order to perform this function, the valuer should be
informed about the format and content of the EPC as well as the national system that supplies
(by local or international experts) and registers EPCs (local authorities, national database).
123 RICS (2009, p. 8 et seq. 124 Cf. Scherr, H. (2009), p.2 et seq.

WORK PACKAGE 7 WORKING PAPER REPORT D7.2
98
IMMOVALUE – IEE/07/553/SI2.499204 Page 98
The valuer can use information from the EPC that can be correlated with the national
standards over the time, such as:
(1) Overall energy quality expressed as an energy mark (0-100) or energy grade (A to
G),
(2) Different annual energy demands/consumptions at final user (final energy) or total
annual energy demand/consumption at the source (primary energy),
(3) Costs of the required energy needed to operate the whole building over one
statistical year,
(4) Level of energy loads in comparison to the current standards in use,
(5) Year of construction: What were the energy related standards at that time? For
example, what was the thermal quality required at that time for the building envelope?
(6) Age and quality (efficiency) of the technical equipment and
(7) Recommended measures for improving the buildings’ energy efficiency
(construction and equipment) and associated annual energy savings and investment
costs.125
, The valuer should be able to assess the energy quality of the subject property in comparison
to the current national energy standards or a given group of comparables based on the
information provided by the EPC in different formats in each EU country. Table 10 illustrates
one possibility how the valuer can use and aggregate EPC information dependent on the
existing main types of energy.
Table 10: Possible Summary of the Output-Data of the EPC
6.3.2.2 EPC is not available
Although already compulsory, there will be still cases where the EPC is not available or not
trustworthy. In this case, the valuer should utilize the basic approach of collecting data and
information through an in-situ visit of the property being valued. The valuer can evaluate
125 Cf. Hofer et al. (2009), p.17.

WORK PACKAGE 7 WORKING PAPER REPORT D7.2
99
IMMOVALUE – IEE/07/553/SI2.499204 Page 99
features based on his or her knowledge or he/she can acquire valuable information from the
building owner, tenants or technical material.126
Inspection, building description / technical equipment and operating expenses deliver
important information
In order to get a rough picture of the building, the valuer may also apply simplified measures
instead of a comprehensive inspection of the building elements. An example is the so-called
“Energy Profile,” an approach developed by the German IWU that requires only a few input
parameters to get preliminary but already quantifiable information about the building energy
performance127.
Furthermore, valuer can get some references about the average energy consumption of the
building with the aid of the effective operating expenses occurred within the last two or three
years.
In addition, the valuer can use the results of LCCA calculations in the descriptive part of
valuation report to contribute to a more complete property valuation.
126 Cf. Scherr, H. (2009): p.1 et seq. 127 Tobias Loga et al., Entwicklung eines vereinfachten, statistisch abgesicherten Verfahrens zur Erhebung von
Gebäudedaten für die Erstellung des Energieprofils von Gebäuden, Darmstadt 2005

WORK PACKAGE 7 WORKING PAPER REPORT D7.2
100
IMMOVALUE – IEE/07/553/SI2.499204 Page 100
6.4 Quantitative integration into valuation process
6.4.1 General background concerning the valuation approaches
Besides the qualitative integration of energy efficiency aspects via explanatory notes, the
main challenge will be reflecting these findings in adequate, quantitative and profound
numerical figures that are suitable for the subject property.
The following approximation technique was chosen in order to find appropriate methods that
valuers can use to handle the buildings’ energy performance and other related aspects. (see
Figure 26). As already mentioned in previous chapters, the scope of this report primarily
focuses on the integration of energy performance information (EPC, LCC, etc.) into property
Key Facts and Findings
• Avoid Redundancies and interdependences when addressing impacts of buildings’
energy performance within property valuation.
• As a first step, develop possible theoretical starting-points for each valuation
approach and search for market evidence.
• Next, try to find an appropriate approach for developed as well as less transparent
(opaque – limited data and market evidence concerning energy-efficient buildings)
markets.
• Adjustment of potential gross income - based on the expectation of increased rents
in case of lower (recoverable) operating cost and vice versa – is assumed to be a
major leverage for the reflection of buildings’ energy performance within property
valuation.
• Since property valuation in general uses information from comparable reference
cases, it is advisable to use cost differences due to specific building characteristics –
e.g. the total potential of reduced operating cost, which in a well-informed and
transparent market should become transferable into increasing gross income.
• In this context it is important to keep in mind that not the total potential energy cost
savings due to energy efficiency might be reflected in the properties market value
(premium), because the tenant might bargain regarding the rent.

WORK PACKAGE 7 WORKING PAPER REPORT D7.2
101
IMMOVALUE – IEE/07/553/SI2.499204 Page 101
valuation and therefore reduces the complexity through blinding out the more holistic
sustainable or green building aspects (e.g. ESD, RPI).
Reduction of complexity
Relevance / Systematisation
Theoretical Linkages to Property Valuation
Market proof Recommendations for adjustments
Green feature
Green impact Linkage to Valuation Approaches
Evidence of market impact
Practical changes of valuation methods
Energy efficiency
Public benefits Income related Approach- …- …- …
- …- …- …
Chapter 6.4.3
Intangible benefits(for the tenant/owner)
Sales Comparison Approach- …- …- …
- …- …- …
Chapter 6.4.4
Tangible benefits(for the tenant/owner)
Cost Approach- …- …- …
- …- …- …
Chapter 6.4.5
Other green building features
-|| -
Avoid Redundances and be aware of
Interdependences
Scop
e of
IMM
OVA
LUE
Typical Property ValuationApproaches in Use
Figure 26: General approach for quantifying property valuation adjustment methodology
First, the valuer must quantify the key tangible and intangible impacts of a buildings’ energy
performance in order to be able to quantify the possible linkages to each of the three basic
property valuation approaches (cost, sales comparison and income approach).. It is also
important that the valuer avoid redundancies as well as be aware of interdependences.
Identify green value drivers for each valuation method
Due to the fact that valuers reflect and do not drive the market, the markets’ maturity in sense
of sensitivity for energy efficiency and related data availability play a substantial role for the
broader acceptance of valuation adjustments due to energy-efficient or other sustainable
building features in the future.
Make sure modified approach can also be applied in less developed markets
Apart from these general obstacles, the following chapters highlight possible ways that
valuers can integrate energy performance features into the various existing valuation
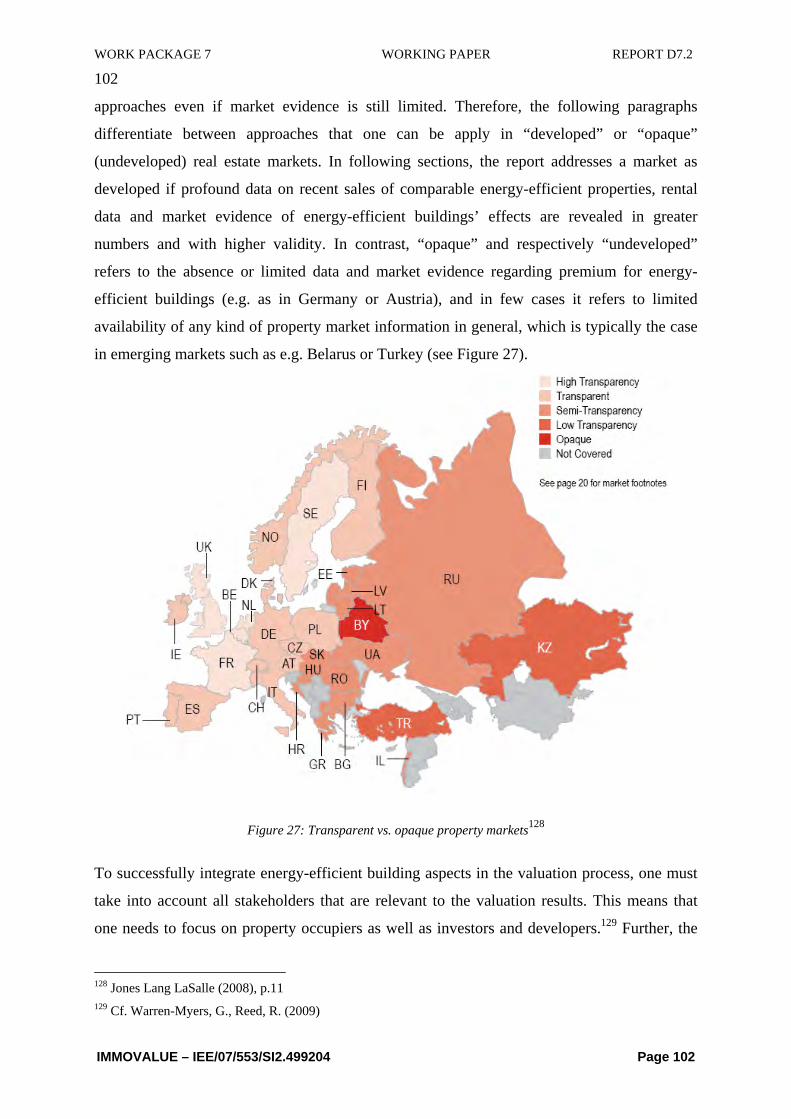
WORK PACKAGE 7 WORKING PAPER REPORT D7.2
102
IMMOVALUE – IEE/07/553/SI2.499204 Page 102
approaches even if market evidence is still limited. Therefore, the following paragraphs
differentiate between approaches that one can be apply in “developed” or “opaque”
(undeveloped) real estate markets. In following sections, the report addresses a market as
developed if profound data on recent sales of comparable energy-efficient properties, rental
data and market evidence of energy-efficient buildings’ effects are revealed in greater
numbers and with higher validity. In contrast, “opaque” and respectively “undeveloped”
refers to the absence or limited data and market evidence regarding premium for energy-
efficient buildings (e.g. as in Germany or Austria), and in few cases it refers to limited
availability of any kind of property market information in general, which is typically the case
in emerging markets such as e.g. Belarus or Turkey (see Figure 27).
Figure 27: Transparent vs. opaque property markets128
To successfully integrate energy-efficient building aspects in the valuation process, one must
take into account all stakeholders that are relevant to the valuation results. This means that
one needs to focus on property occupiers as well as investors and developers.129 Further, the
128 Jones Lang LaSalle (2008), p.11 129 Cf. Warren-Myers, G., Reed, R. (2009)

WORK PACKAGE 7 WORKING PAPER REPORT D7.2
103
IMMOVALUE – IEE/07/553/SI2.499204 Page 103
developed method used to integrate buildings’ energy performance (EPC) and LCCA into any
valuation must be simple or at least easy to understand.130
6.4.2 Operating Cost as major link between valuation and EPC/LCCA
As described in the following chapter 6.4.3.2, one assumes the adjustment of potential gross
income – based on the expectation of increased rents in case of lower (recoverable) operating
cost and vice versa – to be a major leverage for the reflection of energy performance resp.
LCC of a building within property valuation.
In order to use this leverage, it is necessary to go beyond the usually rather rough figures on
operational costs used in current valuations and come up with solid forecast of future
operating cost – differentiated into recoverable and non-recoverable cost. As described in
chapters 5.2 and 5.3, the information available from the EPC and a LCCA serve as a
transparent and traceable basis for such a forecast.
The forecast of operating costs applicable in property valuation mainly includes the following
cost elements (compare also the table on LCC cost categories described under 5.3.1):
cost item description relevance from an EPC/LCC perspective
Building related facility management costs
Costs for regular and routine activities such as cleaning, inspections, caretaking, management of planned service contract, products or materials used for mentioned activities
A precise analysis of costs for cleaning is necessary with respect to the building façade, since different façade systems (with highly different energy performance) may also show high discrepancies in cleaning cost. In addition the cost for inspection and caretaking will increase with increased complexity of the technical systems in the building.
Utilities - energy, water, sewage
Costs for energy such as fuel for heating, cooling, power, lighting as well as water and sewage costs
Cost for energy can be derived from the EPC – using a careful “interpretation” of the figures from the EPC (see in detail below)
Repairs and replacement of minor components
Regularly maintenance costs defined by value size of area, contract term
As a simplification maintenance costs are often calculated as a fixes share of construction cost. In reality, however, maintenance costs are not a direct function of construction cost but depend to a high degree on the complexity of the technical system and on other building characteristics. LCCA can derive solid figures on expected maintenance cost from comparisons with buildings with the same characteristics (at least in some building elements that are
130 Cf. Warren-Myers, G., Reed, R. (2009)

WORK PACKAGE 7 WORKING PAPER REPORT D7.2
104
IMMOVALUE – IEE/07/553/SI2.499204 Page 104
assumed to be “cost drivers”)
Replacement of major system and components
Costs to keep the performance of building elements including design and project management such as exchange roof or facade
For a solid forecast of replacement cost the SLP approach as described in chapter 5.3.1 is very helpful. Also in this case comparisons with buildings that use similar technical solutions for “critical” elements – such as shading systems, ventilation systems etc. – produce traceable cost assumption in this field.
Refurbishment
Costs to improve the performance of a building including design and project management, such as new chillers or boilers with higher energy efficiency
In the context of property valuation this cost elements plays a role mainly in those cases where a refurbishment is needed because of lacking functionality of the old system.
Table 11: Main Operating Cost items
6.4.2.1 Deriving energy cost from the EPC
Deriving energy costs from the EPC in a way that they are useful for property valuation is not
a simple task. The following principles are crucial:
(1) The final energy consumption/demand – expressing the different energy carriers
delivered to the building – is a starting point.
(2) In order to derive actual consumption for a given building one must use the
“tailored” consumption figure that is calculated with climate, occupancy, and
surroundings data adapted to the actual conditions.
(3) If comparison with other buildings is needed, one should use “standard”
consumption figures, based on conventional climate, use, surroundings and occupant-
related input data.
(4) The delivered energy carriers have to be valued with the actual tariffs in the
building or with average energy cost per kWh, which in practice is more applicable
since the EPC usually does not contain information on expected load patterns.
(5) The calculated energy costs derived in the way described above must be cross-
checked with the energy costs from the bills. If there are major differences, the valuer
must investigate and explain them.
6.4.2.2 Using cost difference
A “full” LCC is usually very costly and does not help very much with respect to property
valuation. Since property valuation in general uses information from comparable reference

WORK PACKAGE 7 WORKING PAPER REPORT D7.2
105
IMMOVALUE – IEE/07/553/SI2.499204 Page 105
cases, it is more advisable to focus the LCCA on cost differences due to specific building
characteristics which distinguish the given building from conventional buildings. One can
find a more comprehensive description of this approach in chapter 5.3.2.2
A result which can be immediately integrated within property valuation (mainly when
applying the income related approach) is the so-called “Operating Cost Saving Potential”.
This amount reflects the total potential of reduced operating cost in comparison to a peer-
group. This starting point will be further discussed in chapter 6.4.3.2.2 (income related
approach for opaque markets). However it is important that one consider the possibility of
tenant negotiating within this context. This means that the total potential energy cost savings
due to energy efficiency might not be reflected in the properties market value (premium),
because the tenant might bargain regarding the rent. Further, due to mandatory regulations
(such as e.g. the Austrian tenancy law), just a part of the potential premium or discount of
energy-efficient building characteristics might be applied.
In any case, there is a need for easy applicable LCCA tools. Appendix A includes examples of
LCCA models for the calculation of operational cost of buildings.
WORK PACKAGE 7 WORKING PAPER REPORT D7.2
106
IMMOVALUE – IEE/07/553/SI2.499204 Page 106
6.4.3 Income related Approaches
The income related approach and all its variations are based on the expectation of future rental
income, which implicates that these approaches are used for income producing properties
such as offices or other commercial buildings. Due to the fact that this approach is the most
important valuation approach worldwide, one must pay special attention when quantifying
adequate adjustments to link energy-efficient property features to this approach in order to
achieve acceptance.
Key Facts and Findings
• In general the following valuation parameters within the income valuation seem to
be adequate for an adjustment related to green or energy performance aspects:
(1) Potential gross income
(2) Operating expenses
(3) Lease terms and tenant retention
(4) Remaining economic life-time
(5) Yield / Cap rates
• The way in which energy efficiency and LCC can be integrated in property
valuation as well as the way the above mentioned parameters are influenced is
dependent on the specific property market maturity (which is the markets
willingness to pay for green or energy-efficient buildings).
• DCF might offer more holistic integration possibilities to reflect the impact of
energy efficiency and would also allow to linkage to further LCCA-tools or risk
analysis.
• Main green value drivers can be classified in tangible benefits (e.g. lower energy
costs, maintenance costs, etc.), intangible benefits (e.g. improved occupancy
productivity, lower churn rate, etc.) and public benefits (e.g. tax savings,
subventions, etc.).
• Modification of basic approach seems to be achieved most likely by adjustment of
the potential gross income, the applied yield and the buildings‘economic lifetime.

WORK PACKAGE 7 WORKING PAPER REPORT D7.2
107
IMMOVALUE – IEE/07/553/SI2.499204 Page 107
Widespread use of income approaches underlines the need for proper integration of
green features
In contrast to the cost or sales comparison approach, the income approach offers a broader
range of possibilities for the integration of energy performance information and indicators
from e.g. the EPC and their market implications. As it is illustrated in Figure 28 using the
example of the direct capitalization approach, one can achive such adequate adjustments by
modifying the potential rental income, the operating expenses, the applied yield or
adjustments for other value effecting characteristics.
Figure 28: Theoretical linkages within the Direct Capitalisation Approach
One can further address similar adjustment possibilities within the Discounted-Cash-Flow
approach. In comparison to the direct capitalization approach, the DCF-approach offers more
holistic ways to reflect the impact of energy-efficient building features within the potential
rental income and the operating expenses.

WORK PACKAGE 7 WORKING PAPER REPORT D7.2
108
IMMOVALUE – IEE/07/553/SI2.499204 Page 108
DCF might be very helpful for proper integration
This methodology would also allow possibilities for one to link property valuation to risk
analysis or LCCA tools in order to model operating expenses, etc. One example might involve
using the LCCA as an adequate tool to forecast long term effects related to energy efficiency
improvements and investments. Additionally, risk analysis tools (e.g. Monte-Carlo-
Simulations, etc.) are sufficient makeshifts to display and derive various scenarios for e.g.
growth expectations of energy prices, etc.
In order to decide which adjustments one should apply based on the available information,
valuers must be able to discern which aspects are relevant, in which ways and in what
quantity. Therefore Chapter 6.4.3.1 outlines in a comprehensive overview the different
possibilities.
Furthermore, the quantification of adequate numerical figures for the value impact is
dependent on the property markets’ transparency (developed vs. opaque property markets).
Taking this perception into account, the report will introduce different approaches for
developed as well as opaque (“undeveloped”) markets (see Chapter 6.4.3.2).
6.4.3.1 Main green value drivers
Before beginning any calculation, one needs to understand the most important “green” value
drivers and possible adjustment parameters within the income approach.
Three typical kinds of impacts could be isolated that directly or indirectly influence the
properties’ value: tangible, intangible and public impacts. All of these aspects persuade
different value implications that more or less affect similar valuation parameters as illustrated
in Table 12. As stated in the introduction to Chapter 6.4 (Quantitative integration), we use the
framework developed and displayed in Figure 17.

WORK PACKAGE 7 WORKING PAPER REPORT D7.2
109
IMMOVALUE – IEE/07/553/SI2.499204 Page 109
Integration of energy efficiency and LCC into property valuation practiseOverview of green value drivers
Green feature Green impact Theoretical linkage: added value to owner?
Evidence of market impact
Recommendation for adjustment
Energy efficiency
Energy efficiency Public benefits • Only if tax savings / subventions etc. directly connected to the property are in place.
If applicable easy to assess. Adjustment of income (if clear regulation show s positive effect compared to Peers. BUT penalties for non-green might be more relevant in the future).
Intangible benefits for tenants (Improved occupant productivity, lower churn rate,Increased turnover etc)
• Higher turnover rent if applicable.• Generally increased w illingness to pay higher rent must be tested.• General lease agreements could be more favourable for owner.• Potentially lower vacancy and collection loss.• Potentially decreasing risk of economic obsolescence and therefore lower yield.• Longer economic life.• Higher marketability leads to faster lease up, lower vacancies and lower fluctuation.
Rare market evidence and difficult to isolate so far.
Adjustment of income(only if market impact compared to Peers can be revealed).Reduce vacancy and collection loss slightlyReflect effect of potentially more favourable lease agreements accurate.
Tangible benefit
A) Lower energy costs (for the tenant)
• Higher rent for new leases (but: bargaining and ending top-slice?)• Higher rent for “ prestige” ?• Lower yield for future proved property.
Pure cost cutting effect w ill have an impact but regression etc. must be carried out.
„ Prestige“ probably just a first mover bonus that w ill disappear soon.
Yield impact crucial but hard to isolate. 10 to 20 BP were benchmarks in other markets.
Adjustment of income (notpermanently and not the w hole delta and only if leases are actually negotiable)(Adjustment in case of gross leases of course bigger!)Yield only if at least countryw ide evidence can be stated.
B) Maintenance costs • Both way (higher and lower) might be the case depending on the technical level of the building
Adjustment of maintenance costs in both w ays is possible
Other green building features
Sustainable site development(Water efficiency, etc.)…
…. …. .... ….
Table 12: Overview of green value drivers – income related approach
Tangible refers to direct impacts that effect e.g. energy consumption and costs, maintenance
costs, or capital expenditures due to building improvements related to energy efficiency, etc.
Usually the valuer can extract such information from the EPC, LCCA or other building
information resources. Intangible effects influence valuation parameters indirectly via e.g.
occupants churn rates, tenant retention. These aspects are hard to measure and isolate so far.
Furthermore, there might be impacts of public origin such as tax savings or subventions in the
future due to specific mandatory energy performance standards, which also influence the
value.
Based on the figure above, one could also construe that the adjustment of rental income and
operating expenses are the most likely. However, in which way and to what extent EPCs or
energy efficiency will influence these parameters has yet to be verified and quantified.

WORK PACKAGE 7 WORKING PAPER REPORT D7.2
110
IMMOVALUE – IEE/07/553/SI2.499204 Page 110
Even though various studies have already tried to quantify the impact of green or energy-
efficient properties, they are not usually detailed enough (see Chapter 5.1) and invariably
dependant on their respective market of reference.
The following chapter 6.4.3.2 will analyse the parameters where an adjustment under certain
circumstances is recommended in detail and explain how the valuer can process information.
6.4.3.2 Derivation/modification of basic approach for integration
In general, the income related approach express forecasted and discounted revenues more or
less. The appraiser uses the estimated rental value (ERV) based on market-data and currently
available rental information in order to determine the gross potential income of the property
being valued. The motivation for integrating the EPC at this point of the valuation process
relies on the fact that the energy efficiency level of a building might influence the tenant’s
willingness to pay in the long run.
The following potential linkages are specified to show the range of possible valuation
adjustments within the income related valuation approaches in order to provide the reader
with an overview of how valuers might quantify and integrate such factors into property
valuation.
Adjustment of the potential gross income
First and foremost, if tenants have to pay a lower energy bill then they might be willing to
spend the delta on the actual paid rent (here the potential gross income).131 The basic
hypothesis behind this assumption is the fact that that tenants benchmark their total occupancy
cost rather than just the rental payment (see Figure 29).
This hypothesis is strengthened by the expectation that in gross rent-orientated property
markets where evidence of rental changes due to optimized energy-efficient buildings should
be forced more rapidly than in net rent-orientated markets because of the direct monetary
benefits for the property investor or owner.
131 Eddington, C., Berman, D., Hitchcock, D., et al. (2009), p.3

WORK PACKAGE 7 WORKING PAPER REPORT D7.2
111
IMMOVALUE – IEE/07/553/SI2.499204 Page 111
Tota
l occ
upan
cyco
sts
(fort
enan
t)
Recoverable operating expenses
Rent = gross income toowner
Recoverable operatingexpenses
Δ = max. potential rentpremium to owner
Conventional building Highly energy-efficientbuilding
Rent = gross income toowner
Reduced energy costs
Figure 29: Theoretical potential rent premium
However, tenants will probably bargain. Therefore the reduction might only lead to a
reduction in overall occupancy costs for the tenant but not necessarily to a higher rent for the
landlord.
Furthermore, energy efficiency can also, to a certain extent, influence the non-recoverable
operation expenses ( the costs that cannot be passed on to the tenant) due to the fact that
energy-efficient buildings might achieve longer economic lifetime, increase tenant retention
and therefore reduce vacancy rates and imply lower maintenance costs.
Also, higher demand fo with energy efficient buildings might lead to a higher tenants’
willingness to pay just because these buildings are more “prestigious/desirable,” while rents
for buildings of a poor thermal quality tend to decrease. In this case the question is for how
long the tenant might want to pay this premium, since every new product or idea will lose its´
“bonus” over time.
Also, it is very important that one consider the fact that all of the above mainly refers to new
lettings / new tenants. During the term of a rental contract there will probably only be a few
cases where the chance to increase the rent just because the thermal quality has been
improved. In a lot of countries more obstacles of this kind might arise. There could, for
instance, be laws in place which prevent the owner from increasing the rent for new leases if
the house has a certain age no matter how much the owner invested in sustainable features.
To what extent the net rental income will increase compared to non-green/non-energy-
efficient comps is not predictable on a general level. The market will set “new” prices for
energy-efficient buildings and inefficient buildings. Furthermore, one must consider a number
of different factors, e.g. the location of the building: Retail units in top-locations tend to be

WORK PACKAGE 7 WORKING PAPER REPORT D7.2
112
IMMOVALUE – IEE/07/553/SI2.499204 Page 112
leased at a higher price and show lower vacancy rates, regardless of the thermal quality. On
the other hand, in times of oversupply for “standard” buildings, energy efficiency will play a
crucial role in marketability. Both arguments reflect the fact that the relevance of energy
efficiency will be dependent on different factors like market state, vacancies, location, usage
etc.
However, since most markets today do not reflect good results concerning energy savings in
the sense of higher revenues, valuers should not estimate this fact pro-actively by pricing in
assumed reactions of the market. A fundamental principle behind this is that an appraiser must
reflect the market and current state but must not influence it. As long as nobody knows how
the new transparency achieved by EPCs will affect the market, valuers must observe and
analyse market behaviour.The fact that the rental income reflected in the valuation process
today must also account the future rental growth which might be linked to energy efficiency
might also be viewed at “tricky”. This leads to another possible adjustment, the yield, since
rental growth within the income approach (except DCF-Models) is incorporated in the yield
applied (see adjustment of yield).
Adjustment of lease terms
In general, the lease agreement should be discussed in connection with the rental income that
results based on these agreements. However, the simple direct capitalization approach fails to
reflect certain lease terms in the valuation process. Since these might be influenced by green
building features respectively green lease terms, this is therefore a strong argument for the
application of more advanced techniques like DCF when it comes to:
(1) Shorter lease up periods,
(2) Tenant retention, or
(3) Longer leases.
Long rentals are in some cases - for the government or big companies - a substitute for the
higher rents they can avoid when leasing energy-efficient buildings.
Adjustment of the non-recoverable operating expenses and vacancies
The potentially lower vacancy rate will lead to higher overall revenues and could therefore be
discussed in connection with the rental income (see adjustment of the potential gross income).
Moreover this will lead to a lower vacancy and collection loss which ranges e.g. in German
and Austria for ordinary building between 3 % and 4 % of the potential gross income. Since
these expenses reflect the fluctuation and overall quality of tenants, these aspects must be

WORK PACKAGE 7 WORKING PAPER REPORT D7.2
113
IMMOVALUE – IEE/07/553/SI2.499204 Page 113
influenced. Indeed, the possibility of attracting class-A-tenants with a good economic
background and a chance to increase the probability of renewal of lease agreements are often
stated arguments for green buildings.
This hypothesis is based on the assumption that the marketability of buildings of a high
thermal quality will (probably) increase in the future (while that of buildings of a poor will
decrease) - this leads to lower (higher) vacancy rates.
Again, the amount of reduction will be market driven and cannot be a general result.
Since other operating expenses that might be discussed in this section only refer to the non-
recoverable expenses, there is little left where one could identify a positive impact on. While
the costs for vacant units (which are likely to decrease anyway) should be lower, but
administration costs will probably remain unchanged.
The effects we discussed above mainly refer to changes on the demand side of the market.
The introduced approaches are based on the assumption that the availability of the energy
certification will raise consumers’ awareness regarding the energy efficiency of buildings and
consequently shift consumers’ demand. On the other hand there are effects in context of
energy certification, which do not result from the market-side but from the technical quality of
properties. Maintenance costs are an example for a technical influence and refer to the
expenses of keeping a property in a good state of repair. The idea of adjusting the
maintenance costs in context of energy certification is that e.g. buildings in a good efficiency
level are in top-condition and therefore cause lower maintenance costs. Or, as the other side of
the coin, cause higher costs because of sophisticated technical equipment like heat pumps or
solar heating systems.
Maintenance costs must be derived from the qualities and the condition of the technical
equipment, independent from the energy certificate or energy efficiency itself. Therefore, the
introduction of the energy certificates itself will not change anything. On the other hand, one
should mention that an energy certificate provides a significant amount of data that could be
useful for the derivation of the “correct” maintenance costs. Thus, a more detailed calculation
of the maintenance costs using LCCA will become more important in the future.
Probability of (re)letting
An important issue already reported by different real estate market players is the fact that
letting of sustainable assets is, on average, easier when compared to conventional buildings.
In the DCF methodology, one can model periods of (re)letting in detail, thus giving an

WORK PACKAGE 7 WORKING PAPER REPORT D7.2
114
IMMOVALUE – IEE/07/553/SI2.499204 Page 114
additional value to those assets which show longer letting periods, quicker reletting and
shorter periods of vacancies.
Adjustment of the remaining economic life
In comparison to the Anglo-Saxon income approach, where just a yield/cap rate is used to
express a year’s purchase (which encompasses the remaining economic lifetime implicitly),
the German or Austrian income approach uses a so called “Liegenschaftszinssatz” /
”Kapitalisierungszinssatz”, which reflects the remaining economic lifetime explicitly to
estimate a specific multiplier (“Vervielfältiger”). The remaining economic life of a building is
the period of time for which one can expect in the future. This life can be further extended by
carrying out several refurbishments or reduced due to insufficient maintenance etc. However,
the potential changes due to energy-efficient building characteristics are impossible to
measure at this stage. Since properties which offer an up-to-date (high) standard are to some
extent more “future-proof,” one can expect that the remaining economic lifetime is longer as
opposed to conventional comps.
But it is also necessary to mention that - assuming a comprehensive market change will take
place in the upcoming years - there will be a potential influence from the market side, but
relating to non-green/non-energy-efficient properties. To give an example: if one assumes that
buildings of a certain poor thermal quality are not marketable in the future, the result would
manifest in the form of a reduction of the remaining economic life caused by the demand-side
of the market.
Adjustment of Yield
If the effects are related to the overall risk and not already reflected in the rent or other
aspects, then it may be appropriate for the valuer to make an adjustment of the applied yield
concerning these long-term effects.
The derivation of the yield is one of the most important parts when one applies direct
capitalisation as well other, non standardized approaches like e.g. the discounted cash flow
method. The idea of integrating the energy certification at this point of the appraisal process
will affect transparency concerning energy efficiency and ultimately change the demand side
of the market to some extent. Buildings of a good thermal quality will have a lower risk
concerning marketability while buildings of a poor thermal quality will probably suffer. The
attribute “Future proofed” against rising energy costs and economic obsolescence results in a
lower risk profile and therefore a lower yield. This argument is not redundant to higher

WORK PACKAGE 7 WORKING PAPER REPORT D7.2
115
IMMOVALUE – IEE/07/553/SI2.499204 Page 115
income, since the likelihood of a better growth prospect needs to be reflected in the yield even
so if at the present, the income profile has not changed to a great extent. On the other hand the
appraiser must of course avoid redundancies in his valuation.
Finding the “right” yield is the crucial point for every valuation and in a lot of European
countries the applied all risk, terminal, equated, equivalent and so on yields are potentially the
most vulnerable part for the valuer - on the other hand it’s “his professional judgment” and
therefore the explanation is just his “market feeling.” We have analysed valuations for assets
worth more than 6 Billion Euro of various valuation companies and no matter how profound
the market research performed, the best explanation for the yield is in most cases just the net
initial yield for three comparables (without a proper definition for the NIY in most cases). The
point is that there is still a huge gap between theoretically profound calculations of yields and
practical application as well as available market data. This leads to the fact that even if green-
/energy efficiency features were priced in by adjusting the yield, we must be realize that for
appraisers, this will be very difficult to accomplish in valuation practice. Furthermore, the
possible adjustment of yields seems to be less then preferable because of a lack of market
evidence in light of the fact that energy-efficient building features on property yields might be
overestimated.
In the case of DCF calculations, it has been suggested that only the terminal yield should be
adjusted, because the discount rate does not encompass e.g. growth rates of energy costs, etc.
implicitly.
Implication for comparables
A fundamental task when one performs a good property valuation is to find enough
comparable data – not only when applying the sales comparison approach – and analyse this
data to derive input figures which could be used within the valuation of the subject property.
The essential rule to ensure that the outcome is correct is therefore: do compare apples with
apples! Comparables must have the same building characteristics in terms of location,
technical equipment, condition etc. and also with respect to the green-features such as the
typical energy efficiency level of comparable properties. However, with the introduction of
yet another aspect which needs to be comparable, valuation will inevitably become far more
complex.
The solution could be to use statistical analysis to a certain extent. Unfortunately such
advanced analytic tools require a high level of market maturity and transparency (so-called
“developed markets”), which in general is not the case.

WORK PACKAGE 7 WORKING PAPER REPORT D7.2
116
IMMOVALUE – IEE/07/553/SI2.499204 Page 116
Regardless, the following subchapters try to establish appropriate and practical methods that
valuers can use to handle energy efficiency within property valuation in a quantitative manner
in line with the common existing valuation standards. Nevertheless, one must recognize that
there is a difference between a valuation in transparent markets (developed market) and
situation where just rare market data (opaque markets) is observable.

WORK PACKAGE 7 WORKING PAPER REPORT D7.2
117
IMMOVALUE – IEE/07/553/SI2.499204 Page 117
6.4.3.2.1 Methodology for developed markets
Key Facts and Findings
Basic description of proposed income approach adjustment
• In transparent property markets where market evidence for the value impact of
energy-efficient buildings and related data in great numbers with high validity,
econometric and statistical methods (such as hedonic pricing models (OLS) and
regression analysis) can be applied to derive the quantitative impact factors for the
relationship between properties’ energy performance and markets’ willingness to
pay for it (e.g. quantitative impact on various green value drivers such as rental
income, operating expenses, applied yield or remaining economic life-time).
• Due to the fact that the advanced econometric methods (semiparametric models,
penalized least squares (PLS), spatial effects, Splines) go beyond the scope of
ordinary day-to-day property valuation practices and therefore require (1) a huge
sample of totally transparent and comparable information and (2) statistical know-
how, it is recommended that national property valuation committees and
associations (such as e.g. RICS, BIIS, ANEVAR, NTF or ÖII), who have access to
such information, should assure access to such analytic results for the specific
property market and property type.
• These valuation impact factors provided by national organisations can then be used
directly within the income related approach by valuers and serve as a benchmark
for them.
Short rationale for the proposed methodologies
• Due to the fact that the markets’ willingness to pay for green or energy-efficient
buildings plays the key role and can be derived in developed and transparent
markets by simple market observation and more sophisticated analysis, the
application of econometric and statistical approaches therefore seems to be the most
appropriate method.
Expected impacts on property value
• On the basis of empirical case studies (see Chapter 6.4.3.3 and 6.4.3.4) an impact of
buildings energy performance on achievable rental income in German and Austrian

WORK PACKAGE 7 WORKING PAPER REPORT D7.2
118
IMMOVALUE – IEE/07/553/SI2.499204 Page 118
property markets could be observed compared to non-energy-efficient comps.
In developed markets, as it was already mentioned previously, information regarding real
estate rental data from recent sales of comparable properties can be used by the valuer to to
derive estimated rental values, etc. and can be found in great numbers and with a high
validity. This data is therefore qualified enough for application in statistical methods in order
to isolate market levels / effects that could be regarded as relevant for the derivation of a value
for a specific property being valued. This means that in order to quantify adequate numerical
figures for the value impact of EPCs, valuers could carry out econometrics and statistical
analytic tools. Futher, this method seems to be the most reliable method to isolate the rental
premium of an energy-efficient building in developed markets.
One strongly recommended method that seems to be the most adequate is the application of
regression analysis, which describes the structure of dependency between two or more
characteristics. To understand the fundamentals of such analytical tool, this report will explain
the main features of the classical linear regression (so-called Ordinary Least Squares, OLS).
For example, hedonic pricing models, which describe the impact of location and other
building characteristics on the price or rent for a property-- often applied in real estate
economics--could be a useful approach to derive market evidence for the relationship between
properties’ energy performance and the markets’ willingness to pay for it.
Application of hedonic pricing model
In economic theory, real estate is considered a differentiated or composite good, meaning that
although buildings or flats consist of a wide range of characteristics that make each object
unique, they are regarded as being one commodity as they are traded in bundles on an implicit
market. The explicit market, with observed prices and transactions, is for the bundles
themselves and includes several implicit markets for the property's
characteristics.132Originally developed for automobiles by Court133, hedonic pricing models
have been used extensively in applied economics since the seminal work of Rosen134. Other
often cited classic references include Lancaster135 and Griliches136. The theoretical
132 Cf. Sheppard, S. (1999) 133 Cf. Court, A.T. (1939) 134 Cf. Rosen, S. (1974) 135 Cf. Lancaster, K. (1966)

WORK PACKAGE 7 WORKING PAPER REPORT D7.2
119
IMMOVALUE – IEE/07/553/SI2.499204 Page 119
underpinnings are well described e.g. in Follain and Jimenez137 as well as Sheppard. In his
2002 paper, Malpezzi138 presented a review of the hedonic price literature, and Sirmans et
al.139 provided a review of specifications and characteristics that have most frequently been
used in hedonic pricing studies.
Since a property is fixed in space, by selecting a specific object, a household implicitly
chooses many different goods and services. Therefore, in the concept of implicit markets it is
supposed that dwelling characteristics are traded in bundles. The explicit market, with
observed prices and transactions, is for the bundles themselves and includes several implicit
markets for the property’s characteristics.140 A hedonic price function describes how the
quantity and quality of these characteristics determine its price in a particular market.
According to hedonic price theory, differentiated goods like real estate are valued for their
utility-bearing characteristics.141 Since a property is fixed in space, by selecting a specific
object, a household implicitly chooses many different goods and services. The price that is
paid may depend on structural and location attributes and varies over time. The implicit prices
for the various characteristics are supposed to clear the market, i.e. to lead to equilibrium of
supply and demand for those characteristics. The households or firms that want to rent or buy
real estate represent the consumers (demand), and the owners of the flats represent the
production side and determine the level of supply. This equilibrium is summarized by what is
called a hedonic price function, which describes how the existence, quantity and quality of a
certain characteristics determine the price of the object (so this function can be regarded as a
reduced form of supply and demand). It is therefore important to notice that the price
functions for one market cannot be easily transferred to another market, as they are the result
of particular market conditions.142
For ease of discussion, we will limit our remarks on residential real estate. Let us now assume
that a particular property is described by its vector of k characteristics
),...,,( 21 kzzz=Z (2)
136 Cf. Griliches, Z. (1971) 137 Cf. Follain, J., Jimenez, E. (1985) 138 Cf. Malpezzi, S. (2002) 139 Cf. Sirmans, G., et al. (2005) 140 Cf. Sheppard, S. (1999) 141 Cf. Rosen, S. (1974) 142 Cf. Day, B. (1999)

WORK PACKAGE 7 WORKING PAPER REPORT D7.2
120
IMMOVALUE – IEE/07/553/SI2.499204 Page 120
where we assume that these characteristics are "goods" for simplicity. If a household buys a
particular flat, it selects a set of values for each of these (structural and location)
characteristics. Therefore, the price of the flat is a function of the whole bundle of
characteristics, or
)(ZPP = (3)
This function is known as the hedonic price function. Due to the assumption that
differentiated goods cannot be easily untied and the resulting impossibility of arbitrage,
marginal prices of property characteristics are not constant. 143 Furthermore, the price of one
characteristic may depend on the quantity of another. Therefore, we might expect to observe
nonlinear relationships between the market price and its measured attributes.
To illustrate this interrelationship, consider the left panel of Figure 30, which shows how the
price of the flat changes if the quantity of a certain characteristic, e.g. the area of the flat, is
increased, all other characteristics held constant. Obviously, we face decreasing marginal
prices of this characteristic.
Figure 30: Hedonic price function vs. implicit price function
The right panel of this figure displays the marginal prices (i.e., the partial derivative of the
hedonic price function with respect to characteristic z1), or
i
iz zPzp
i δδ )();( _
ZZ = (4)
143 Cf. Rosen, S. (1974)

WORK PACKAGE 7 WORKING PAPER REPORT D7.2
121
IMMOVALUE – IEE/07/553/SI2.499204 Page 121
This function is also sometimes called the implicit price function of the characteristic, as the
amount households are willing to pay for a characteristic is revealed to us indirectly through
the price of the whole property. 144
As mentioned above, the hedonic price function is the result of the interaction of supply and
demand on the property market. Rosen145 derives this equilibrium under the following
assumptions:
(1) Individual households are price takers.
(2) Households only purchase one property.
Households choose the characteristics of the flat and a composite good or numeraire (x) to
maximize their utility function
);,( sZ xU (5)
where s represents the characteristics of the household, under the budget constraint
)(ZPxy += (6)
where y is the household income.
Maximizing the utility function with respect to zi, i = 1,…, k and x gives the conditions for
optimal household choice of residential location
),( iZ −= izx
z zpUU
i
i (7)
where the partial derivative of the hedonic price function with respect to characteristic zi is
ratio of marginal utilities, which is called bid function by Rosen146. One can interpret this as a
marginal rate of substitution, so it is the slope of the indifference curve of a household. It
represents the rate at which households give up money in order to get more of a flat attribute.
Taking the budget constraint into account explicitly, we can write the hedonic price function
as
),( uxy sΖ;−=θ (8)
where y is the household income and θ is the bid function, the total amount a household could
pay on a flat given the choice of x. One can interpret the bid function as "the maximum
amount that a household would pay for a property with attributes Z such that they could
achieve the given level of utility, u, with their income, y."147 The right panel of Figure 31
144 Cf. Day, B. (1999) 145 Cf. Rosen, S. (1974) 146 Cf. Rosen, S. (1974) 147 Day, B. (1999), p.34

WORK PACKAGE 7 WORKING PAPER REPORT D7.2
122
IMMOVALUE – IEE/07/553/SI2.499204 Page 122
shows such bid curves. It is easy to see that bid curves can be represented as indifference
curves by just flipping the vertical axis (see the left panel of this figure), so they express
indifference relationships.
Figure 31: Indifference curves vs. bid-curves
However, notice that the budget constraint is not linear. The optimal choice for each
household is therefore the point of tangency between the highest bid curve and the budget
constraint, resulting in the optimal bundle of flat characteristics composite goods for every
household. Therefore, as discussed above, marginal prices are not constant. Since households
do not have the same income or preferences, the optimal choices "move" along the budget
constraint (of course achieving different utilities), which makes the bid curve identifiable.
Similarly, we can derive what Rosen148 calls the offer function for the supply side. We now
deal with profit instead of utility. Otherwise said, "the offer function describes the rent the
landlord would need to receive in order to achieve a profit of π." 149 Again different suppliers
will provide different bundles of characteristics that make the offer curve identifiable.
If we bring the choices of consumers and of suppliers together in the property market, we can
derive market equilibrium: The market clears in the hedonic price function, where demand
equals supply (see Figure 32). The hedonic price function is therefore called a joint envelope
function of all individual optimal bid and offer functions.
148 Cf. Rosen, S. (1974) 149 Day, B. (1999), p.41

WORK PACKAGE 7 WORKING PAPER REPORT D7.2
123
IMMOVALUE – IEE/07/553/SI2.499204 Page 123
Figure 32: Hedonic price function
However, although bid and offer functions are theoretically identifiable under certain
assumptions, the complexity of hedonic markets and the unavailability of supply and demand
shifters usually make it necessary to concentrate on the reduced form of the hedonic price
function in our empirical analysis.
Application of different Regression Analysis
The term regression was originally introduced by the famous Sir Francis Galton (1822 –
1911) and described the fact that in large populations a recurrence to the mean value of all
values was observable.150
In the following paragraphs, we will review the statistical concepts used to study the effect of
energy efficiency on rents.
The Linear Regression Model
Basically, a regression model consists of a deterministic as well as a stochastic component.
The deterministic component describes the influence of what is called an explanatory
variable(s) (also called covariate, independent variable, control variable, or regressor; these
names are used interchangeably henceforth) on an explained variable (also called dependent
150 For a complete discussion of the history of regression see Stigler, (1988)

WORK PACKAGE 7 WORKING PAPER REPORT D7.2
124
IMMOVALUE – IEE/07/553/SI2.499204 Page 124
variable, response variable, predicted variable, or regressand; again used interchangeably).
151 In matrix notation, we will denote the explanatory variables as nx1 vectors x0, x1, …, xk,
where x0 is a vector of ones in a model with intercept, or as nx(k+1) matrix X, the dependent
variable as y and the stochastic component as u, both nx1 vectors, where n describes the
number of observations. Hence, the deterministic part of the model displays the notion of a
causal effect with an additional amount of random noise. The notion of ceteris paribus (which
means “other (relevant) factors being equal”) plays an important role in causal analysis. If
other factors are not held fixed, one cannot know the causal effect of a characteristic, say,
energy efficiency, on the explained variable, say rents per square meter.
The stochastic component, called error term or disturbance, represents other factors not
captured in the study design. However, it is important to notice that the disturbance should not
contain any interpretable structure.
Therefore, we can write the regression model as
uXβy += (9)
For a single observation, the relationship can be written as
ikikiii uxxxy +++++= ββββ ...22110 .152 (10)
This simple model states that the influence on y is determined by x plus an individual error u.
The coefficient β0 denotes the intercept, β1, …, βk the slope parameters of the function. If we
only have the intercept and one explanatory variable, the model is called a simple or bivariate
linear regression model.
In order to find the best fitting function i.e. the function that minimizes the error term, several
attempts are possible. The Ordinary Least Squares (OLS) method tries to find the best fitting
function by minimizing the squares of the individual error term. This is described in the
following equation.153
( )∑=
=⋅−−n
iii niforxy
1
210,
1min20
Κββββ
(11)
This method was originally introduced 1805 by Adrien Marie Legendre (1752-1833) with
further contributions by Carl Friedrich Gauss (1777 – 1855). The OLS method yields the
parameters b1 and b0 as estimates for β0 and β1. It can be shown that the OLS estimator is the
151 See Wooldridge (2006), pp. 22-23 152 In this case, of course we can omit xi0 153 Stocker, H. (2007), pp.83-110

WORK PACKAGE 7 WORKING PAPER REPORT D7.2
125
IMMOVALUE – IEE/07/553/SI2.499204 Page 125
best linear unbiased estimator (BLUE) 154 under the following conditions (referred to as the
Gauss-Markov-Assumptions):155
(1) Assumption No. 1 – Linearity of Parameters
This assumption basically states that the true relationship between the explanatory variable
and the explicated variable is linear in parameters. For k Parameters this can be written as:
ikikiii uxxxy +++++= ββββ ...22110 (12)
This assumption seems very restrictive but by transforming the variables appropriately one
can model nonlinear relationships.
(2) Assumption No. 2 – Random Sampling
Basis for the regression is a random sample of size n.
(3) Assumption No. 3 – Sample Variation in the Explanatory Variable
This assumes that the independent variables are deterministic and the data generating process
generating x is independent from the one generating the y variable. This also implies that
E(uixi) = 0.
(3) Assumption No. 4 – Zero Conditional Mean
The error terms of the population have the conditional mean of zero.
0)()( =≡ iii uExuE (13)
(4) Assumption No. 5 – Homoscedasticity
This means that all ui have the same variance of σ². This assumption is not necessary for the
regression itself, but for inference on the regression parameters.
In order for these assumptions to hold, one must find a a correct model. This means that
dependent and independent variables must be in correct functional form in order to estimate a
linear relationship in the parameters. A common model specification designed to address the
nonlinearity in hedonic price functions takes the log or semi-log form, which furthermore
mitigates the problem of heteroscedasticity. 156
As a (semi-)log model, we define a model with a logarithmically explained variable and
logarithmic or linear explanatory variables. Consider the model
154 This means that: E(b) = β as well as Var(b) < Var(b*) where b* is the estimate of any other linear estimation
process 155 this closely follows Wooldridge (2006), pp. 51 f 156 Cf. Malpezzi, S. (2002)

WORK PACKAGE 7 WORKING PAPER REPORT D7.2
126
IMMOVALUE – IEE/07/553/SI2.499204 Page 126
u+++= agepsqmenergypsqmrent 210 )_ln()_ln( βββ (14)
where ln(.) is the natural logarithm, rent_psqm is the rent per square meter, energy_psqm is
the energy costs per sqare meter, and age is the age of the building. In this model, one can
interpret the coefficient β1 as the elasticity of rent per square meter with respect to energy
costs per square meter. If the coefficient is -0.1, then an increase in energy costs per square
meter of 100 % reduces rents by 10 %. The coefficient β2 is sometimes called semi-elastic,
meaning that if it is multiplied by 100, it gives an estimate for the percentage change in rent
per square meter if age is increased by one unit. For example, if this coefficient is 0.01, then
one year of further age results in 1 % of rent decrease.
Nevertheless, as stated e.g. by Martins-Filho and Bin157, a frequent concern in hedonic price
literature is the adequacy of parametric specifications. This specification problem arises
because economic theory does not provide clear guidance concerning the functional form of
the dependence of price on quality.158 As explained e.g. in Wallace159, this suggests that
functional forms used to estimate hedonic prices should allow for the possibility of
nonlinearity in the hedonic price functions.
In light of the potentially serious consequences of functional misspecification, there have been
some attempts to estimate hedonic price models using semi- or nonparametric methods. The
fundamental goal of these approaches is a flexible modeling of the influence of continuous
covariates on the dependent variable. Semiparametric and nonparametric approaches for real
estate can be found e.g. in Pace160, or Clapp161.
157 Cf. Martins-Filho, C., Bin, O. (2005) 158 Cf. Anglin, P.M., Gencay, R. (1996) 159 Cf. Wallace, N. (1996) 160 Cf. Pace, R. (1998) 161 Cf. Clapp, J.M. (2004)

WORK PACKAGE 7 WORKING PAPER REPORT D7.2
127
IMMOVALUE – IEE/07/553/SI2.499204 Page 127
Semiparametric Models
In a semiparametric model, the covariates are partitioned into the two parts X1, which
contains the continuous covariates, and X2, which contains categorical and linear covariates.
Hence we estimate a model of the form
),(~
,)(2I0u
uβXXy 21
σΝ
++= f (15)
where f(.) is a nonparametric function of the continuous covariates and β are parameters of the
binary (categorical variables have been decomposed into dummies) or linear covariates.
P(enalized)-splines as first proposed by Eilers and Marx162 is a well established approach for
modeling nonlinear effects of unknown shape. First, the range of a particular covariate z is
divided into m equally spaced intervals bounded by the 1+m equidistant knots
max121min zz m =<<<= +κκκ Κ . Then, a spline )(zf has the following two properties: in each
of the intervals the spline f is a polynomial of degree l , and at the knots (the interval
boundaries) the spline is 1−l times continuously differentiable. The second assumption
ensures that the polynomial pieces fit together smoothly (at least for 0>l ). Typically 3=l is
assumed.
Splines of degree l can be represented by a linear combination of a set of lmh += basis
functions )( ilj zB , hj ,,2,1 Κ= at a given observation iz (De Boor, 2001)
)()()( 2211 ilhhi
li
li zBzBzBf βββ +++= Κ (16)
It is convenient for further analysis to write the basis functions into a matrix Z containing
elements )(],[ ij zBji =Z , where the value of the j -th basis function at the i -th observation is
in i -th row and j -th column. Analogously, the parameters are stacked into a vector β and
the whole effect of covariate z can be written in matrix notation as Zβf = .
The crucial point in modeling nonlinear relationships through splines is the determination of
the number (and position) of knots. Too few result in an overly restrictive spline that might
not be able to capture the true variability of the data. On the contrary, a too large number of
knots tends to produce statistical artifacts based on an overfit to the data. In order to overcome
these difficulties, Eilers and Marx163 have proposed a penalization (P-spline) approach. To
start, a moderately large number of equidistant knots (usually between 20 and 40) are chosen 162 Cf. Eilers, P.H.C., Marx, B.D. (1996), pp.89-121 163 Cf. Eilers, P.H.C., Marx, B.D. (1996), pp.89-121

WORK PACKAGE 7 WORKING PAPER REPORT D7.2
128
IMMOVALUE – IEE/07/553/SI2.499204 Page 128
to guarantee enough flexibility. Next, a roughness penalty is imposed by punishing large (first
or second order) squared differences between two adjacent coefficients jβ and 1+jβ . This can
be accomplished in a frequentist setting by penalized least squares (PLS).
The PLS approach incorporates an additional term that penalizes deviations
∑∑ ∑+== =
Δ+⎟⎟⎠
⎞⎜⎜⎝
⎛−=
h
kjj
kn
i
h
ji
ljji uBy
1
2
2
1 1
)()()PLS( βλβλ , (17)
where kΔ is the k -th difference operator and λ governs the trade-off between smoothness
and fit to the data. First order differences ( 1=k ) penalize abrupt jumps between successive
parameters, second order differences ( 2=k ) penalize deviations from the linear trend. The
larger (smaller) λ is the more (less) influence gets the penalization term and the smoother
(rougher) is the resulting function. In matrix notation, the penalization term can be rewritten
as
βKββDDβ kkk
h
kjj
k ''')(1
2 λλβλ ==Δ∑+=
, (18)
where kD is a difference matrix of order k and kK is referred to as a penalty matrix.
Therefore, the penalized least squares equation can be rewritten as
KββZβyZβy ')()'()PLS( λλ +−−= . (19)
Minimizing this expression with respect to β yields the PLS estimator
ZyKZZβ 1)'(ˆ −+= λ . (20)
The estimated vector of function values ))'(ˆ,),(ˆ(ˆ1 nufuf Κ=f can then be written as
yZKZZZβZf ')'(ˆˆ 1−+== λ . (21)
The choice of the smoothing parameter λ is crucial as we may obtain quite different fits by
varying the smoothing parameter. In a frequentist setting, the smoothing parameters are either
chosen by minimizing some goodness of fit criterion (e.g. AIC, GCV etc.), see e.g. Wood164
for details; alternatively, one may rewrite the model as a linear mixed model. Inference for the
smoothing parameters is based on the restricted maximum likelihood; see Fahrmeir et al.165,
or Ruppert et al.166 for details. In this paper, inference is based on a fully Bayesian version of
164 Cf. Wood, S. (2006) 165 Cf. Fahrmeir, L., Kneib, T., Lang, S. (2004) 166 Cf. Ruppert, D., Wand, M.P., Carroll, R.J. et al. (2003)

WORK PACKAGE 7 WORKING PAPER REPORT D7.2
129
IMMOVALUE – IEE/07/553/SI2.499204 Page 129
P-splines as proposed by Lang and Brezger167. The Bayesian version defines priors for the
regression coefficients and the smoothing parameters and therefore allows simultaneous
estimation of the function f and the amount of smoothness governed by the smoothing
parameter. We used the software package BayesX for estimation; see Brezger et al.168. The
homepage of BayesX (http://www.stat.uni-muenchen.de/~bayesx/bayesx.html) contains also a
number of tutorials.
In order to illustrate the P-spline approach, we show the construction of a P-spline of degree
3=l for a simulated dataset that incorporates an abrupt jump. The data was generated
according to the model
ε+= )(xfy ,
where
⎩⎨⎧
−<≤−
= else 3 + 0.1x - 0.2x + 0.5x - x +0.1)+ln(x - )2/sin(2
0x0.5 if 1.5- 3 + 0.1x - 0.2x + 0.5x - x +0.1)+ln(x - )2/sin(2 )( 432
432
ππππ
xf
,
and
)5.0,0(~ 2Nε .
(22
)
First, one calculates a full spline basis for a given number m of intervals (in this case,
10=m , giving a total of 13=+= lmh basis functions). As one can easily see in the
following Figure 33, each of these functions has non-zero values in 1+l intervals and
overlaps with l2 adjacent basis functions. Vertical lines indicate the position of the inner
knots. Note that we have to expand the number of knots to 1++ lm in order to define the set
of basis functions in every interval of the range of area.169
167 Cf. Lang, S., Brezger, A. (2004), pp.183-212; and Brezger, A., Lang, S. (2006), pp.947-991 168 Cf. Brezger, A., Kneib, T., Lang, S. (2005a), pp.1-22; and Brezger, A., Kneib, T., Lang, S. (2005b) 169 Cf. Fahrmeir, L., Kneib, T., Lang, S. (2007)
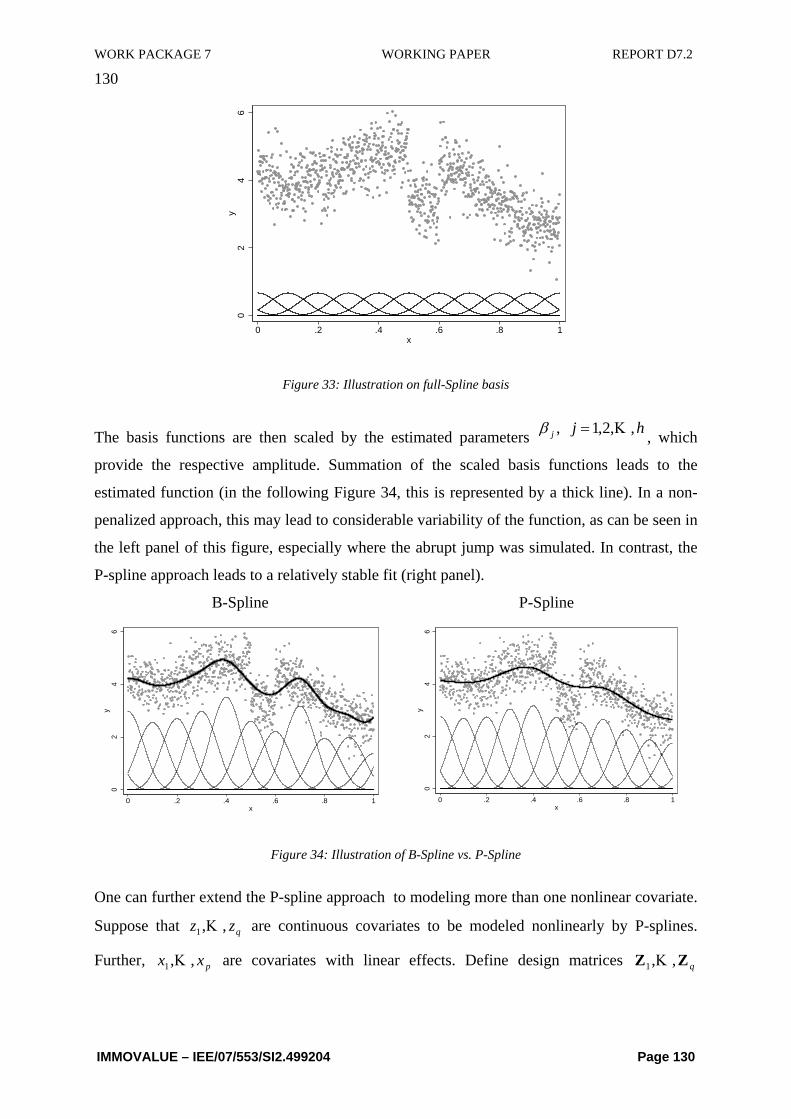
WORK PACKAGE 7 WORKING PAPER REPORT D7.2
130
IMMOVALUE – IEE/07/553/SI2.499204 Page 130
02
46
y
0 .2 .4 .6 .8 1x
Figure 33: Illustration on full-Spline basis
The basis functions are then scaled by the estimated parameters hjj ,,2,1, Κ=β , which
provide the respective amplitude. Summation of the scaled basis functions leads to the
estimated function (in the following Figure 34, this is represented by a thick line). In a non-
penalized approach, this may lead to considerable variability of the function, as can be seen in
the left panel of this figure, especially where the abrupt jump was simulated. In contrast, the
P-spline approach leads to a relatively stable fit (right panel).
B-Spline
02
46
y
0 .2 .4 .6 .8 1x
P-Spline
02
46
y
0 .2 .4 .6 .8 1x
Figure 34: Illustration of B-Spline vs. P-Spline
One can further extend the P-spline approach to modeling more than one nonlinear covariate.
Suppose that qzz ,,1 Κ are continuous covariates to be modeled nonlinearly by P-splines.
Further, pxx ,,1 Κ are covariates with linear effects. Define design matrices qZZ ,,1 Κ

WORK PACKAGE 7 WORKING PAPER REPORT D7.2
131
IMMOVALUE – IEE/07/553/SI2.499204 Page 131
corresponding to the q continuous covariates and a design matrix X for the remaining
covariates with linear effects. In matrix notation we obtain the model
εηεXαβZβZy +=++++= qqΚ11 (23)
where sβ is the vector of regression coefficients for the s -th nonlinear term of covariate sz ,
the vector α contains the regression coefficients of linear effects, and η is the predictor
vector. The parameters are estimated by minimizing the extended PLS criterion
∑ ∑= =
+−=n
i
q
sssssiiq y
1 1
'21 )(),PLS( βKβληλλ Κ , (24)
where sK is the penalty matrix of the s -th nonlinear term. The smoothing parameters
involved are again estimated by minimizing a goodness of fit criterion, using the connection
to linear mixed models or via a fully Bayesian approach, see the literature cited above.
Spatial Effects
Along with the spatial fixation of real estate comes considerable interest in dealing with
spatial dependence and variation in hedonic price equations. Therefore, one could model the
relationships between observations as functions of their locations. Basically, there are two
spatial phenomena that could affect hedonic price equations: Spatial autocorrelation and
spatial heterogeneity.170 A comprehensive review of various spatial or spatiotemporal
econometric models and recent developments is given in LeSage and Pace171 as well as
Anselin, Florax, and Rey172. is The spatial regression family isvery popular in this context and
was made so by Anselin173. Spatial autoregressive (SAR) models allow for both spatially
lagged dependent variables and spatially lagged disturbance terms. However, there is a wide
range of alternative models, especially semiparametric and nonparametric spatial approaches
that are particularly appropriate in modeling spatial heterogeneity. Prominent examples are
kriging (e.g. Cressie174), 2D tensor product spatial smoothing (e.g. Wood175), approaches
170 Also under these circumstances, the Gauss Markov assumptions are violated. 171 Cf. LeSage, J., Pace, R. (2004) 172 Cf. Anselin, L., Florax, R.J., Rey, S.J. (2004) 173 Cf. Anselin, L. (1988) 174 Cf. Cressie, N.A.C. (1993) 175 Cf. Wood, S. (2006)

WORK PACKAGE 7 WORKING PAPER REPORT D7.2
132
IMMOVALUE – IEE/07/553/SI2.499204 Page 132
based on spatial penalization (Besag & Kooperberg176; Fahrmeir, Kneib, & Lang177), and
geographically weighted least squares (GWR; Fotheringham, Brundson, & Charlton178).
In the case study using the CREIS dataset, a city-specific dummy variable (an unconstrained
fit) or by a city-specific random intercept can capture special heterogeneity. In the first case,
one could create dummy variables for every city. As in many cities, we only have one
observation but this would lead to large variation in the estimates for the dummy parameters.
Therefore, we decided to generate dummy variables only for cities where we have more than
4 observations.
One can estimate city-specific random intercepts d0γ by adding an additional term 00γZ γ in
(1) and by adding the ridge type penalty 00 '0
γγγλ in the PLS criterion (2), where the matrix
0γZ is an incidence matrix with entries 1 in row i and column j if observation i is in city j .
The effect of the penalty is to shrink estimated parameters d0γ towards zero. Hence the
penalty prevents possibly large variation in the estimates for d0γ due to the large number of
city specific parameters. For sufficiently large sample sizes within each city the estimated
parameters automatically tend toward an unconstrained fit.
Omitted variables
Another important problem in regression analysis is the topic of omitted variables. This is also
called the problem of excluding a relevant variable or underspecifying the model. In the case
of omitted variables, OLS is biased, and hence the results of the respective regression analysis
are not valid. This is specifically true for most hedonic regression studies, where energy
efficiency does not play any role. In order to illustrate this problem, we start with the case
where the true population model has two explanatory variables,
iiii uxxy +++= 22110 βββ (25)
where x1 is, say, the condition or age of the building and x2 the energy efficiency. Now
suppose that due to ignorance or data unavailability, we only estimate a model excluding x2,
specifying the simple regression model
110~~
ii xy ββ += . (26)
Deriving the OLS estimator for the slope parameter of this model, we get 176 Cf. Besag, J., Kooperberg, C. (1995) 177 Cf. Fahrmeir, L., Kneib, T., Lang, S. (2007) 178 Cf. Fotheringham, A., Brundson, C., Charlton, M. (2002)

WORK PACKAGE 7 WORKING PAPER REPORT D7.2
133
IMMOVALUE – IEE/07/553/SI2.499204 Page 133
∑
∑
=
=
−
−=
n
ii
n
iii
xx
yxx
1
211
111
1
)(
)(~β . (27)
Plugging in the true model for yi and taking expectations yields179
∑
∑
=
=
−
−+= n
ii
n
iii
xx
xxxE
1
211
1211
211
)(
)()~( βββ , (28)
which is not generally equal to β1.The estimate is therefore biased. The ratio multiplying β2
has a simple interpretation; it is the slope coefficient from the regression of x2 on x1.
Therefore, the two covariates are correlated, the stronger the bias. The direction of this bias is
displayed in Table 13:
Corr(x1,x2) > 0 Corr(x1,x2) < 0
β2 > 0 positive bias negative bias
β2 < 0 negative bias positive bias
Table 13: Dependency of bias due to correlation of covariates
In the case of real estate, the condition or age of a building is likely to be correlated with
energy efficiency, which is why it is likely for most studies to exhibit such a bias due to the
negligence of energy efficiency.
Concluding notes
Ascan be noted from the above illustrated and explained statistical analysis, one must mention
that such advanced interpretation methods to derive valuation input parameters go beyond the
scope of usual property valuation practice and (1) require a huge samples of totally
transparent and comparable property information that are usually not available to property
valuers in practice and (2) can only be performed with advanced statistical training.
Consequently, one cannot expect valuers to extract statistically significant results and to
perform such detailed analysis within the valuation process.
179 See Wooldridge (2006), pp. 90- 91)

WORK PACKAGE 7 WORKING PAPER REPORT D7.2
134
IMMOVALUE – IEE/07/553/SI2.499204 Page 134
To solve this obstacle it would be useful if such analysis were carried out and contributed by
national committees of valuation experts or other real estate associations (e.g. RICS, etc.),
who have a access to a large amount of market information and related datasets. The German
local “Gutachterausschüsse” are a good example of a possible organization that would be
capable of performing such calculations. Property valuers could subsequently use this
quantified and specific evidence regarding the relation between energy performance and
potentially other sustainability criteria and its impact on market rents theoretically as a direct
adjustment parameter for the valuation of the subject property (see Case Study 1).
However, as recent RICS research180 shows, even a “centralised” preparation of data will be
difficult simply because of serious problems in obtaining complete data sets. In order to
conduct hedonic modelling on price effects of energy efficiency / sustainability performance
of buildings the following key data are needed:
• Asset (rental and capital) values and prices;
• Asset attributes influencing rental and sale prices (e.g. age, size, location, lease terms,
different aspects of building quality;
• Asset environmental/energy performance or rating
Although this data is available in principle for many countries and regions, it tends to be split
in very different databases and there are likely substantial costs involved in when trying to
linking these databases due to definitional problems (different definitions of similar items in
different sources).
Another issue is that empirical market analysis always lags behind the market. This is an
important issue for uprising topics such as energy efficiency and sustainability in the real
estate markets. In fact it gives a picture rather on how markets have been 1-2 years before
than on how they are in the moment of the subject valuation.
180 Fuerst, Allister, de Wetering, Wyatt: Establishing a data framework for the investigation of the price effects
of eco-labelling commercial property assets, University of Reading, RICS Research Report May 2010

WORK PACKAGE 7 WORKING PAPER REPORT D7.2
135
IMMOVALUE – IEE/07/553/SI2.499204 Page 135
6.4.3.2.2 Methodology for opaque markets
Key Facts and Findings
Basic description of proposed valuation approach
• In opaque property markets one cannot apply advanced statistical methods as it is
hard to find reliable evidence of the value impact of green or energy-efficient
buildings. Still, it is useful to quantify the degree to which the property market
seems to be already influenced by green or energy-efficient building developments.
• An appropriate way to quantify this degree could be provided by applying a newly
developed scoring model – the so called WAPEC (Weighted Adjustment for
Valuation Parameter Effecting Characteristics) as illustrated below:
Significant Medium Neutral
Criteria 1Criteria …Criteria n
XCriteria 1XCriteria…
Criterian
XCriteria 1Criteria …Criteria n
Degree of Market Influence
+/-66-100% +/-66-33% +/-33-0%
Market Adjustment rate (MAR)+/-… %
Weighted Adjustment Factor (WAF) in %
x x
Average AdjustmentParameter (AAP)
+/-… %
Valuation EstimationAdjustment (VEA)
+/-… %
• The result of the easy-to-handle scoring model is an adjustment factor in percent
that a valuer can use to adjust the market data of comps for the subject property
being valued.
Short rationale for the proposed approach
• One of the main reasons why a kind of scoring model was suggested as basis for the
WAPEC was the fact that such tools have already been used and applied under
different circumstances within property valuation and therefore can be seen as an
accepted and generally well-known technique
Expected impact on property valuation
• We expect that due to the adjustability and flexible applicability of the WAPEC, the
majority of European property valuers will be in favour of an adjustment scheme
WA
PEC
-sch
eme

WORK PACKAGE 7 WORKING PAPER REPORT D7.2
136
IMMOVALUE – IEE/07/553/SI2.499204 Page 136
such as the WAPEC-methodology because of the possible adaptability, flexibility
and applicability.
• The WAPEC-model gives guidance for the valuer to process his thoughts regarding
the integration of energy efficiency and other sustainability issues into his valuation
in a structured and transparent way.
In the case of an opaque property market and the related lack of market evidence and
information, alternative ways to derive and handle energy efficiency and sustainability aspects
within the valuation process are required. An opaque market can be a market where all comps
are non-efficient or a market where sales and rental data is not fully available to the public.
So far there are no ascertained approaches or guidelines available that describe how valuers
could methodologically include energy/environmental performance even if the necessary
market evidence were available.
To establish the linkage to property valuation in a useful way it is essential that one
comprehend that in an opaque market the key to quantifying the value impact of buildings’
energy performance relies on the degree to which the market appears to have already been
influenced by said technologies.
Scoring model to guide the valuer and provide a structured process
A scoring model could be one possible and appropriate way to quantify the extent to which an
opaque market focuses on energy efficiency as well as energy-efficient buildings respectively.
The idea of using scoring models or profiles is not new; these tools are already used within
the valuation processes for different tasks – (e.g. adjustment for quality of location181) and
therefore can be seen as generally accepted techniques to handle intangible effects.
Easy to handle adjustment factor for daily business
Therefore, the so-called “Weighted Adjustment for Valuation Parameter Effecting
Characteristics” (WAPEC) was developed for the daily practice of valuers. By isolating the
importance of energy efficiency (and potentially other sustainability aspects) within a specific
property market due to various predefined aspects and characteristics the appraiser can derive
an indication to which degree energy efficiency and/or other related issues already affect the 181 See also Kleiber, W., Simon, J., Weyers, G. (2002), p.1241; Real Estate Norm Netherlands Foundation
(1992), pp.2

WORK PACKAGE 7 WORKING PAPER REPORT D7.2
137
IMMOVALUE – IEE/07/553/SI2.499204 Page 137
property markets. This indication is expressed through the so-called “Market Adjustment
Rate” (MAR), which the valuer can use to describe the quantity of the markets’ attention and
willingness to pay for energy-efficient buildings. The valuer needs to fill in a scoring model
that addresses different aspects like price elasticity, economic (market) conditions, consumer
awareness, etc.. The MAR ranges from “neutral” (0 %) to high impact” (100 %). It is
important to understand that the developed scoring model is not a complete and full
enumeration of all green aspects and therefore the valuer can still be adap and apply the
method for every single green-value-driver.
The following scoring model (Figure 26) shows how valuers are able to reflect the potential
changes for the estimated rental value (ERV ≈ market rent).
Key Valuation Parameter Market maturity
Market rent -low price elasticity- tenants do not pay attention on sustainability and energy eff iciency at all- m edia does not recognise green buildings benefits at all- m ajority of property m arket is not willing to pay rent prem ium for green buildings
- suffering econom ic situation
- …
- building achieve green building requirem ents
- m arket does not postulate green buildings- no effect on occupier dem and
- …
x x+/- [%] --> AAP derived from m arket evidence / valuers expectations due to replicable argum entat ion or est im ation
x x+/- [%] --> Valuers estim ation adjustm ent due to probability of occurrence, uncertainty, etc. regarding the AAP
= =
+/- [%] --> = MAR x AAP x VEA
x
= [€/m² p.m.]
- …
Low adjustment
- …
neutralMedium adjustment
+/- 25-50 %
- …
Significant adjustment
+/- 75-100 %
[€/m² p.m]
Key Valuation Parameter (KVP)
- …
+/- 0-25 %
- high price elast icity - high awareness of tenants for sustainability and energy eff iciency- om nipresence of green building issues in the m edia- high m arket sensit ivity for operating expenses and energy costs (especially in gross rent-orientated property
k t )- good general econom ic condit ions- …
- building does not achieve energy perform ance standards/codes- m arket postulate green building standards/codes- high obsolescene and potential loss of occupier dem and
Opaque (Emerging) Market --> Premium for energetic building (primarilly in emerging market)
Market adjustment rate (MAR)
Average adjustment parameter (AAP)*
Valuers estimation adjustment (VEA)* *
-->Discount for non-energetic building (mainly in further developed markets)
--> Weighted Adjustment Factor (WAF)
- …
+/- 50-75 %
Valuation Parameter Adjustment [VPA]
Figure 35: Example of WAPEC for market rent (ERV)
Operational cost differences set the margin
In addition to the verification of the MAR by applying the scoring model, valuers must also
quantify the maximum range of willingness to pay for energy performance or other
sustainability issues. In a rational property market one can describe this using the “Average
Adjustment Parameter” (AAP). If only energy efficiency is relevant for the AAP (given in
percent of the evaluated parameter at market level), the maximum amount would be the
WORK PACKAGE 7 WORKING PAPER REPORT D7.2
138
IMMOVALUE – IEE/07/553/SI2.499204 Page 138
“Energy Cost Saving Potential” (ECSP). The ECSP in percent is derived by applying the
ratio between the gap of expected cost for energy consumption of a reference building
(comparable group of properties) in comparison to the property being valued (subject
property) and the annual rental income. The reference building in this case refers to the mean
of comparable buildings at the date of valuation.
The approach can be expressed in the following equations:
( ) ( )
12
-1i
,,1i
,,
×
×× ∑∑= ==
M
ieisubieiref
r
EEECSP
pp (29)
where:
irefE , - final energy consumption of specific energy carrier i of reference building (e.g.
average of comparables) [kWh/m² a]
isubE , - final energy consumption of specific energy carrier i of the property being valued
[kWh/m² a]
iep , - average price for energy carrier i [€/kWh]
Mr - observable market rent of the comparable properties [€/m² p.m.]
When setting the energy prices one can use the actual prices as well as expected prices,
depending on whether there is an assumption that energy price increases would outreach
average price increases. A more detailed description on how the calculate energy costs based
on energy performance figures given in the EPC is included in chapter 6.4.2.1.
As this procedure of estimating the AAP still implies uncertainty regarding the probability of
occurrence, valuers have in addition option when appling another adjustment factor called
“Valuation Estimation Adjustment” (VEA), which expresses the probability of occurrence
as an expected percentage.
If valuers have estimated the MAR, AAP and the related VEA accordingly, the “Weighted
Adjustment Factor” (WAF) - expressing the degree to which market rent for the subject
property has to be adjusted (compared to the comparables) - can be quantified by simply
multiplying these variables.
VEAAAPMARWAF ××= (30) where: MAR - states the valuer’s estimation of the property market maturity regarding the degree of
energy efficiency and other aspects that already affect the property market.

WORK PACKAGE 7 WORKING PAPER REPORT D7.2
139
IMMOVALUE – IEE/07/553/SI2.499204 Page 139
AAP - is derived from market evidence (if existing) or the valuer’s expectations due to
replicable argumentation or estimation. VEA - expresses the valuer’s estimated adjustment due to the probability of occurrence,
uncertainty, etc. regarding the AAP.
The valuer can then apply the calculated WAF to the key valuation parameters (in this case
the observable market rent per m² per month) in order to derive a numerical “Valuation
Parameter Adjustment” (VPA). An example how the explained adjustment can be applied
in practice is illustrated in chapter 6.4.3.4 (Case Study 2).
Concluding, one might note that the calculated saving potential is not representative due to the
fact that the energy consumption of the subject and the comparable buildings are influenced
and dependent by the occupiers’ behaviour of usage and therefore can differ from the actual
energy consumption. While, this might be the case, one should also note that in accordance
with renowned valuation standards, valuers always assume that the owner or occupiers of a
property act, maintain and use a property in a proper manner (idea of “highest and best
use”182).
Further one should understand that if data availability allows, it is advisable to go beyond the
pure energy cost and include the other relevant operating cost elements such as costs
relating to cleaning, inspection, maintenance, replacement etc. (see in detail chapter 6.4.2), to
determining the AAP. Using an LCC approach one can derive the “Operating Cost Saving
Potential” (OCSP) expressed along the lines of the approach described above:
( ) ( )
12
-1i
,1i
,
×
∑∑===
M
isubiref
r
OCOCOCSP (31)
where:
OCref operating cost element of a reference building (e.g. average of comparables)
OCsub operating cost element of the subject property
i certain operation cost category (e.g. maintenance, cleaning, energy consumption etc.)
Mr observable market rent of comparable properties[€/m² p.m.]
Summarising the proposed approach consists of two parts: (see also Figure 29 on page 111).
182 Cf. IVSC (2007), p.79

WORK PACKAGE 7 WORKING PAPER REPORT D7.2
140
IMMOVALUE – IEE/07/553/SI2.499204 Page 140
• First, the potential rent premium must be assessed by analysing operational cost
differences between the subject and comparables. This is based on the assumption that
lower operational costs can be transferred to higher rents - but only to a certain degree!
• The market conditions need to be assessed in order to derive the extent to which rents
can be increased due to lower operational costs. The valuer can perform this in a
structured and transparent way by applying the score-card developed in the frame of
this project.
Valuers need easily applicable LCCA tools in order to calculate cost differences. Therfore,
appendix A includes several examples of LCCA models applicable to the calculation of
operational costs of buildings.
Other application possibilities of the WAPEC approach
Besides using the WAPEC to estimate adequate market rent, valuers could also adjust other
key valuation parameters (main green value drivers as explained in chapter 6.4.3.1) such as
the applied yield or other issues with a direct influence on value in a similar way (see Figure
36 and Figure 37).
However, the adjustment of the applied yield (see Figure 36) would be, critical because the
method tends to produce overestimated results. Valuers must be aware that the maximum
yield adjustments and gap between conventional building and green buildings (which
encompass more aspects than just energy efficiency) might be as low as 50 to 75 basis points
as stated by e.g. Bowman and Wills183. From another perspective, institutions such as the New
Research Bank (California) report that they apply a 0.125 % discount rate and a higher loan to
value ratio for green building developments.184Therefore one should only take an adoption
into considerations if reliable evidence for yield adjustments is available.
183 Cf. Bowman, R., Wills, J. (2008), p.28 184 Cf. Valhouli, C.A. (2008), p.42
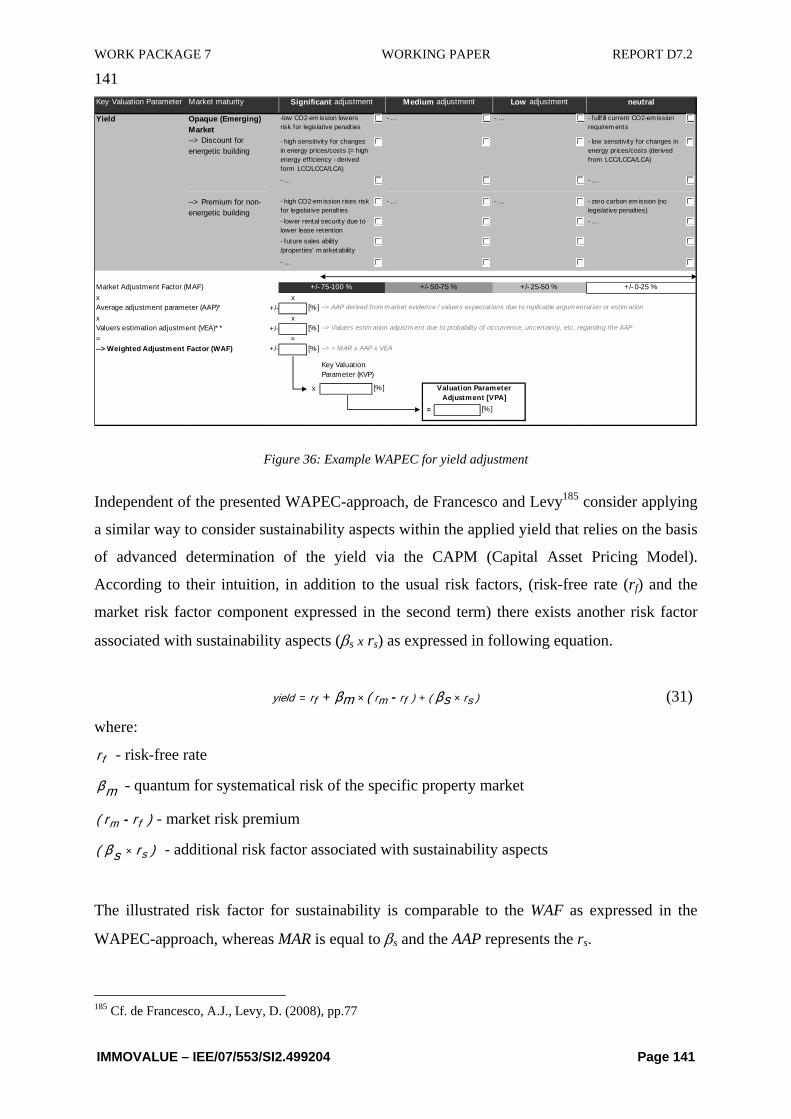
WORK PACKAGE 7 WORKING PAPER REPORT D7.2
141
IMMOVALUE – IEE/07/553/SI2.499204 Page 141
Key Valuation Parameter Market maturity
Yield - fullf ill current CO2-em ission requirem ents
- low sensit ivity for changes in energy prices/costs (derived from LCC/LCCA/LCA)
- …
- zero carbon em ission (no legislative penalt ies)- …
x x+/- [%] --> AAP derived from m arket evidence / valuers expectations due to replicable argum entat ion or est im ation
x x+/- [%] --> Valuers estim ation adjustm ent due to probability of occurrence, uncertainty, etc. regarding the AAP
= =+/- [%] --> = MAR x AAP x VEA
x
= [%]
Significant adjustment Medium adjustment Low adjustment neutral
+/- 0-25 %
Valuers estimation adjustment (VEA)* *
Key Valuation Parameter (KVP)
[%] Valuation Parameter Adjustment [VPA]
Market Adjustment Factor (MAF) +/- 75-100 % +/- 50-75 % +/- 25-50 %
Opaque (Emerging) Market--> Discount for energetic building
- high CO2-em ission rises risk for legislative penalties
- …--> Premium for non-energetic building
- high sensit ivity for changes in energy prices/costs (= high energy eff iciency - derived form LCC/LCCA/LCA)
- …
-low CO2-em ission lowers risk for legislative penalt ies
- lower rental security due to lower lease retent ion - future sales ability /properties' m arketability
- …
- …
- …
--> Weighted Adjustment Factor (WAF)
Average adjustment parameter (AAP)*
- …
Figure 36: Example WAPEC for yield adjustment
Independent of the presented WAPEC-approach, de Francesco and Levy185 consider applying
a similar way to consider sustainability aspects within the applied yield that relies on the basis
of advanced determination of the yield via the CAPM (Capital Asset Pricing Model).
According to their intuition, in addition to the usual risk factors, (risk-free rate (rf) and the
market risk factor component expressed in the second term) there exists another risk factor
associated with sustainability aspects (βs x rs) as expressed in following equation.
)sr()frmrfryield sβ(mβ ×+×= + - (31)
where:
fr - risk-free rate
mβ - quantum for systematical risk of the specific property market
)rr( fm - - market risk premium
)rsβ( s× - additional risk factor associated with sustainability aspects
The illustrated risk factor for sustainability is comparable to the WAF as expressed in the
WAPEC-approach, whereas MAR is equal to βs and the AAP represents the rs.
185 Cf. de Francesco, A.J., Levy, D. (2008), pp.77

WORK PACKAGE 7 WORKING PAPER REPORT D7.2
142
IMMOVALUE – IEE/07/553/SI2.499204 Page 142
Another possible application of the WAPEC is related to direct energy efficiency investments
which might be necessary because of specific building standards of a certain quality required
by the market in order to achieve a certain rent. On the other hand, it is also possible that non-
energy-efficient buildings could be threatened by tax penalties, etc. If this is the case, valuers
have to estimate to what extent such aspects influence the market value of a property.
Therefore, the WAPEC could be an appropriate way to estimate an adequate weighted
adjustment factor (see Figure 37) Key Valuation Parameter Market maturity
appreciation/ depreciation
- no tax savings/subventions/etc. direct ly linked to property- rem aining life-t im e equates to conventiuonal buildings
- …
- no energet ic im provem ents required- …
x x+/- [%] --> AAP derived from m arket evidence / valuers expectations due to replicable argum entat ion or est im ation
x x+/- [%] --> Valuers estim ation adjustm ent due to probability of occurrence, uncertainty, etc. regarding the AAP
= =+/- [%] --> = MAR x AAP x VEA
x
= [€]
Significant adjustment Medium adjustment Low adjustment neutral
- longer rem aining econom ic lifetim e
- …
- required investm ents for achieving energet ic building
- … - …
- …
+/- 0-25 %
Average adjustment parameter (AAP)*
Valuers estimation adjustment (VEA)* *
--> Weighted Adjustment Factor (WAF)
Market adjustment rate (MAR)
Key Valuation Parameter (KVP)
[€] Valuation Parameter Adjustment [VPA]
+/- 75-100 % +/- 50-75 % +/- 25-50 %
- tax savings/subventions/etc. direct ly connected to property
- …
- …Opaque (Emerging) Market --> Premium for energetic building
--> Discount for non-energetic building
Figure 37: Example WAPEC for particular characteristics which directly influence value
Limits of the WAPEC approach
The WAPEC scoring is designed to calculate the differences in technical construction
between the peer group and the subject property.
Hence the WAPEC table has certain limitations concerning its applicability. Consider the
following example: The market has a strong demand for passive houses and regards them as a
prestige object, resulting in an over demand of these buildings. Consequently, the cost value
is below the market value. However, this implies that building a passive house on an
undeveloped site is strictly cheaper than buying a house on the market. Yet, since the house as
such is comparable and reproducible, this is counter intuitive and has no sound economic
reasoning. Therefore, the higher market value cannot result from the fact that the customer is
looking for a passive house but rather the fact that he is looking for a passive house at this
particular location. Having uncovered this mechanism it is straightforward to obtain a market
adjustment by monitoring recent sales.

WORK PACKAGE 7 WORKING PAPER REPORT D7.2
143
IMMOVALUE – IEE/07/553/SI2.499204 Page 143
6.4.3.3 Case Study 1 – Evidence from econometric analysis for the case of a developed
market
6.4.3.3.1 Effect of energy performance for office buildings186
The following survey is an original study. It is based on empirical data of office buildings
collected for benchmarking purposes by CREIS Real Estate Solutions. The CREIS database
consists of various building attributes and service charges187 (explanatory variables) as well as
average rents per square meter. The following table describes the variables used for this study.
The attributes and costs were collected on the basis of legal requirements (e.g. BetrKV, 2004;
DIN 277, 2005; DIN 18960, 1999; DIN 31051, 2003 etc.), that make the results traceable and
convertible.
As the data was originally collected by a questionnaire, the original data was changed into a
dataset that one could be statistically investigate first. For this purpose, all the labels of
categorical variables that were represented with alphabetic characters were transformed into
numbers. Therefore, the dummy variable elevator (existence of an elevator), originally
labelled yes-no was changed to 1-0. Covariates air and quality were also encoded by dummy
variables. The variable describing the city where the building is located was also encoded by
numbers in alphabetical order. Furthermore, there were two ordinal variables with three
categories, each also labelled by characters: Air condition (air) and building quality (quality).
The first variable describes whether a building is equipped with full air condition (i.e., if air
condition comprises heating, cooling, humidification and dehumidification), partial air
condition (compared to full air condition, at least one of the functions is not contained) or no
air condition.
The original sample consists of 1578 observations, collected from 2000 to 2005 in 94 German
cities. As the response variable was only collected from 2002 onwards and still not
mandatory, the sample size was reduced to 532 observations in 57 cities. The following Table
14 describes the variables used in the regression.
186 We thank Neumann und Partner GbR for the provision of the data used in this study. 187 Service charges may be defined as the costs of area provision and management allocable to the tenant (see
Jones Lang LaSalle, 2000 - 2005).

WORK PACKAGE 7 WORKING PAPER REPORT D7.2
144
IMMOVALUE – IEE/07/553/SI2.499204 Page 144
Variable Description Mean/frequency
Std.-Dev. Min Max
rent_psqm Average rent per sq.m. (NGF) per month 13.72 5.81 2.56 38.73ngf Netto Grundfläche (NGF), net floor space of
all floors of a building 14,037.05 13,310.16 370.53 115,278.00
age Age of the building, duration since the last redevelopment
14.37 13.39 0.00 113.00
quality Quality of the building 1.17 0.59 0 2quality_h Dummy for high quality of the building 28% 0 1
quality_m Dummy for medium quality of the building 62% 0 1
quality_l Dummy for low quality of the building (reference)
11% 0 1
elev Dummy for the existence of an elevator 99% 0 1
air Air condition of the building 0.56 0.70 0 2full_air Dummy for full air condition 12% 0 1
part_air Dummy for partial air condition 31% 0 1no_air Dummy for no air condition (reference) 56% 0 1
maint_psqm maintenance costs per sq.m. per month 0.427 0.504 0.004 4.827energy_psqm energy costs (heating, electricity) per sq.m.
per month0.839 0.624 0.104 5.510
other_psqm other service charges per sq.m. per month 1.700 0.667 0.316 4.373year Year of entry into the database 2,003.63 1.16 2,002.00 2,005.00city_no No of the city the building is located in 1 57
Table 14: Description of key variables used for regression
The variable quality needs to be further explained. Its categories “basic/low,” “fair/medium”
and “high” depend on various items (see Table 15). One must mention that the description of
this variable partly overlaps with other variables (elevator and air). This is likely to cause
multicollinearity and therefore reduces the expressiveness and significance of these variables.
Furthermore, one may recommend collecting each item of this variable separately, as that may
lead to different effects on different cost categories. For example, a structured body shell may
lead to higher heating energy consumption, while a curtain wall façade may have contrary
effect. Since both express high qualities, the total effect of this category is blurred.

WORK PACKAGE 7 WORKING PAPER REPORT D7.2
145
IMMOVALUE – IEE/07/553/SI2.499204 Page 145
Basic Fair High
Body Shell, Space Concept
Simple body shell
structure, fixed space
concept
Simple or structured body
shell, flexible space
concept
Structured body shell,
flexible space concept
Façade Perforated façade,
ribbon windows, basic
materials (e.g. plaster
finish)
Ribbon windows, curtain
wall façade, medium
quality materials
Curtain wall façade, high-
quality materials (e.g.
glass)
Floor, Electricity supply
Solid floors, single
sockets or dedo trunking
Dedo trunking or
integrated floor ducts
Double-bottomed floors,
hollow floors, ducts or
floor containers
Ceiling, Lighting
Solid ceilings,
suspended ceilings with
integrated lights
Suspended ceilings with
integrated high-quality
lights
Suspended ceilings with
direct as well as indirect
lighting
Heating energy supply
Stationary heating,
natural ventilation
Stationary heating, some
air conditioning in special
areas
Innovative heating
system, partial or full air
conditioning
Other equipment
Data transmission
network, access control,
smoke detectors
As before, in addition:
lifts, emergency power
generator
As before, in addition:
central building control
and video-based security
systems
Table 15: Categories for building quality
Additionally, the variable age (difference between the year of data collection and year of
construction/redevelopment) was introduced in order to make the effects of the age of the
building comparable across the whole sample and get a “cross section view”. If the building
has been redeveloped, the year of redevelopment was used for the calculation of the age of the
building, otherwise the year of construction. With respect to a possible time trend concerning
the general cost level, dummies for the year of entry were introduced as control variables.
We first establish a theoretical (“deterministic”) relationship for the regression analysis.
Theoretical considerations tell us which functional form should be applied (a log- or semi-log
specification, see above). This yields the model:

WORK PACKAGE 7 WORKING PAPER REPORT D7.2
146
IMMOVALUE – IEE/07/553/SI2.499204 Page 146
u+++++
++++
++++=
∑∑==
)_ln()_ln()ln())ln(
__
___)_ln(
35343332
31
11
10
765
43210
psqmotherpsqmenergymaint_psqmngf
nocityyearageairpart
airfullelevmqualityhqualitypsqmrent
jjj
iii
ββββ
ββββ
βββββ
(32)
where all metric variables except age are transformed logarithmically. Furthermore, we
control for a time effect (year) and the city the building is located in. Specifically, we
generate dummy variables if more than 4 observations occur in the respective city.
The results of this linear regression analysis are presented in the following table (the dummy
variable coefficients capturing locational heterogeneity are not shown in Table 16. Linear Model
Number of obs 532F( 33, 498) 10.58Prob > F 0.0000R-squared 0.4121Adj R-squared 0.3732Root MSE 0.3115
logrent_psqm Coef. Std. Err. t P>| t|_cons 2.615 0.210 12.43 0.000logngf -0.058 0.018 -3.19 0.002age -0.002 0.001 -2.09 0.038logmaint_psqm -0.020 0.018 -1.07 0.285logenergy_psqm -0.095 0.035 -2.73 0.007logother_psqm 0.270 0.042 6.38 0.000year_2003 0.044 0.043 1.03 0.304year_2004 -0.023 0.041 -0.57 0.569year_2005 -0.107 0.040 -2.67 0.008quality_h 0.357 0.064 5.62 0.000quality_m 0.125 0.053 2.34 0.019elev -0.142 0.145 -0.98 0.326full_air 0.104 0.057 1.82 0.069part_air 0.093 0.036 2.58 0.010
Table 16: Results of linear regression analysis
The F-statistics show that the model is highly significant. With an adjusted R² of 37 %, it
gives a reasonable fit to the data. Furthermore, energy costs seem to have a significant effect
on rents per square meter: Ceteris paribus, 100 % higher energy costs per square meter reduce
rent per square meter by 9.5 %. This result holds on a 5 %-significance level.
However, although we have a rough idea of which functional form to apply in the hedonic
regression model from theoretical considerations, it seems fruitful to apply the additive mixed

WORK PACKAGE 7 WORKING PAPER REPORT D7.2
147
IMMOVALUE – IEE/07/553/SI2.499204 Page 147
regression model AMM as described in Fahrmeir, et al.188. We use a semiparametric approach
in order to deal with nonlinearity in regression parameters and a random city effect term to
incorporate spatial heterogeneity as described in the last subsection.
Therefore, we estimate the model
u+++++
++++
++++=
∑∑==
))_(ln())_(ln())(ln())(ln(
__
___)_ln(31
11
10
765
43210
psqmotherfpsqmenergyfmaint_psqmfngff
nocityyearageairpart
airfullelevmqualityhqualitypsqmrent
jjj
iii ββββ
βββββ
(33)
Taking a closer look at the semiparametric effect of energy costs per square meter, we find a
rather pronounced nonlinearity. The following Figure 38 evaluates the effect of monthly
energy costs per square meter at the sample mean rent per square meter (which is
approximately 13.72 Euro). Interestingly, in the domain of 0.2 to 2 Euro per sqm, there seems
to be a “zone of indifference”, meaning that an increase in energy costs does not seem to have
any effect on rents per sqm. However, as energy costs increase further, there is a noticeable
effect on rents per square meter – a decrease from 14.0 Euro to 13.2 Euro per sqm (~5.8 % of
the mean).
1313
.514
14.5
15E
ffect
on
mea
n re
nt p
er s
qm
0 1 2 3 4 5energy_psqm
Figure 38: Effects of energy costs on monthly rent per sqm
Another possibly interesting question could be how the omission of the covariate energy costs
would impact the estimates of the other covariates. As we know from the theoretical
188 Cf. Fahrmeir, L., Kneib, T., Lang, S. (2004)

WORK PACKAGE 7 WORKING PAPER REPORT D7.2
148
IMMOVALUE – IEE/07/553/SI2.499204 Page 148
considerations above, we know that the bias is more pronounced the higher the omitted
variable is correlated with the included variables. The correlation structure shows that energy
per square meter is particularly correlated with the quality of the building and the existence of
an air condition.
Correlation with energy_psqm
quality_h 0.148 quality_m -0.099 full_air 0.442 part_air 0.005
Table 17: Correlation of energy per square meter with buildings’ quality
It turns out that an underspecified model (omitting energy costs) results in a different
parameter estimation for quality and particularly for air condition. Specifically, the estimated
parameter for medium quality decreases by 13 %. The estimated parameter for full air
condition even decreases by 93 %.
varname full model
omitted difference
quality_h 0.307 0.315 3% quality_m 0.134 0.117 -13% full_air 0.069 0.005 -93% part_air 0.051 0.042 -17%
Table 18: Effects of applying different models
Interpretation of presented regression results and link to property valuation
One m ust note regarding the above shown regression that there are three main critical aspects
regarding the applied dataset. First of all, the stated impact of energy cost based changes is
based on the agreed rent due to lease conditions and does not reflect the specific market rent,
which is usually the basis for property valuation. Second, the regression is carried out on
historical energy consumption and does not reveal the current energy demand. Furthermore,
the stated energy costs represent historical costs and do not reflect the current prices for
energy sources.
In fully transparent and developed markets (as defined previously) the quantified impact of
energy cost on the achievable rent for a property could be directly integrated in a proper
manner into property valuation. Otherwise valuers have to estimate the impact to appraise and
evaluate possible effects (see methodology for opaque markets).

WORK PACKAGE 7 WORKING PAPER REPORT D7.2
149
IMMOVALUE – IEE/07/553/SI2.499204 Page 149
To give an impression of how valuers can integrate the above stated specific result of the
regression analysis in an appropriate way (if a developed market is given) we created the
following simplified example with subsequent assumptions:
To show the direct market value impact of the stated correlation between energy costs (energy
efficiency) and rent in the example is based on the assumption of the following aspects. In
general one must assume that the degree of energy efficiency is derived by the difference
between the energy demand of the subject property in contrast to the average energy demand
of a peer group. The applied peer group exists only of comparable properties (comp 1, comp 2
and comp 3), which represent the same kind of property in similar location and have
equivalent size measures, age etc., and just differ in their energy efficiency and demand
respectively (assuming that there is a linear relationship between energy demand and energy
costs). To simplify the following case study, one further assumes that the estimated non-linear
rent reduction due to better energy efficiency (see results of regression analysis above) can be
applied in a linear manner to the market rent and current energy prices.
Given this framework, valuers can calculate the rental impact by taking the results of the
regression analysis as a basis to express a “rent adjustment factor” (RAF) as follows:
1095.0-
+⎟⎟⎠
⎞⎜⎜⎝
⎛=
×
×××
epeer
esubjepeer
c
cc
EEE
RAF (34)
Subject Property • Rentable Area 800 m² • Energy demand 135 kWh/m².a • Costs for energy 0.05 €/kWh • Non-recoverable operating expenses 15000 € p.a. • Equivalent Yield (incl. inflation, growth of energy costs, etc.) 6.00 % • No special construction damage, significant maintenance demand.
Peer Group (comps) Comp. 1: • Energy demand [kWh/m².a] 65 kWh/m².a • Rent [€/m² p.m.] 13.5 €/m² p.m.
Comp. 2: • Energy demand [kWh/m².a] 50 kWh/m².a • Rent [€/m² p.m.] 14.5 €/m² p.m.
Comp. 3: • Energy demand [kWh/m².a] 85 kWh/m².a • Rent [€/m² p.m.] 13.0 €/m² p.m.
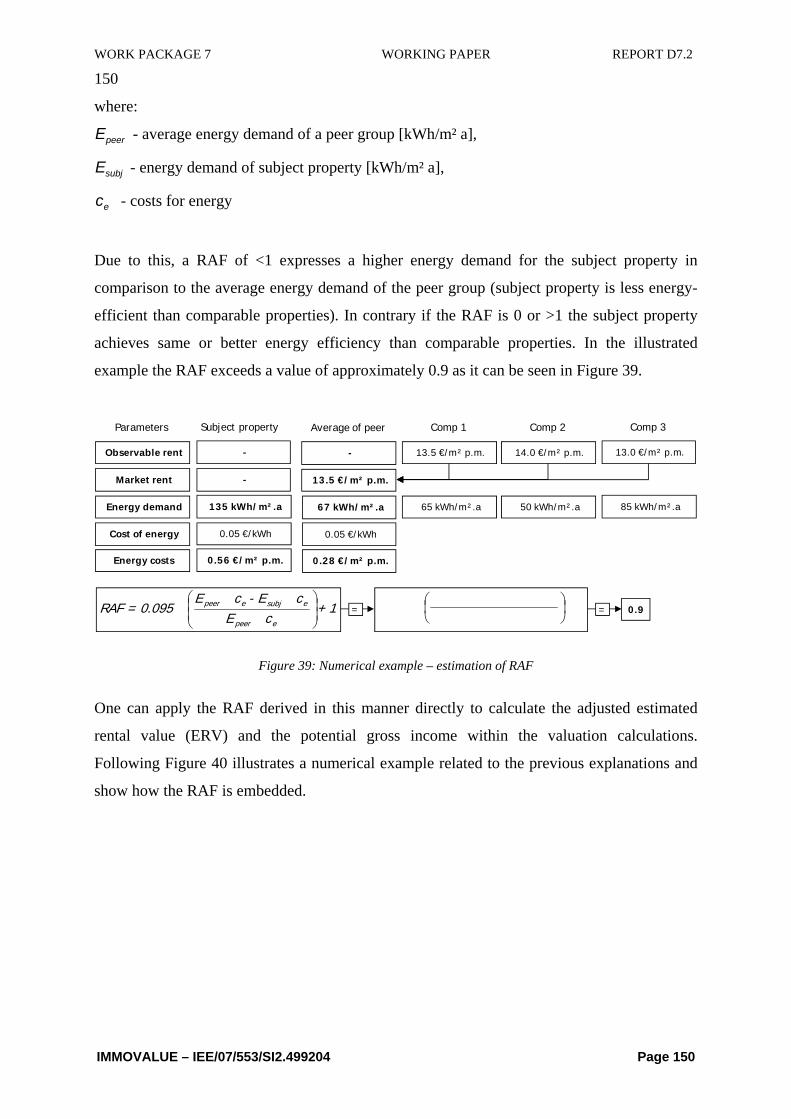
WORK PACKAGE 7 WORKING PAPER REPORT D7.2
150
IMMOVALUE – IEE/07/553/SI2.499204 Page 150
where:
peerE - average energy demand of a peer group [kWh/m² a],
subjE - energy demand of subject property [kWh/m² a],
ec - costs for energy
Due to this, a RAF of <1 expresses a higher energy demand for the subject property in
comparison to the average energy demand of the peer group (subject property is less energy-
efficient than comparable properties). In contrary if the RAF is 0 or >1 the subject property
achieves same or better energy efficiency than comparable properties. In the illustrated
example the RAF exceeds a value of approximately 0.9 as it can be seen in Figure 39.
⎟⎠⎞
⎜⎝⎛
1+cE
cE -cE0.095=RAF
epeer
esubjepeer
⎟⎟⎠
⎞⎜⎜⎝
⎛
Observable rent
Parameters
Market rent
Energy demand
Cost of energy
Energy costs
-
Subject property
-
135 kWh/m².a
0.05 €/kWh
0.56 €/m² p.m.
-
Average of peer
13.5 €/m² p.m.
67 kWh/m².a
0.05 €/kWh
0.28 €/m² p.m.
13.5 €/m² p.m.
Comp 1
65 kWh/m².a
14.0 €/m² p.m.
Comp 2
50 kWh/m².a
13.0 €/m² p.m.
Comp 3
85 kWh/m².a
= = 0.9
Figure 39: Numerical example – estimation of RAF
One can apply the RAF derived in this manner directly to calculate the adjusted estimated
rental value (ERV) and the potential gross income within the valuation calculations.
Following Figure 40 illustrates a numerical example related to the previous explanations and
show how the RAF is embedded.

WORK PACKAGE 7 WORKING PAPER REPORT D7.2
151
IMMOVALUE – IEE/07/553/SI2.499204 Page 151
Lettable Area
x
Market rent
RAF
Annual Potential Gross Income
x 12 x
=
-
Non-recov. Operating Expenses
÷
Equivalent Yield
Income Value
=
+/-
Adjustments
Market Value
=
800 m²
x
13.5 €/m² p.m.
0.9
116 980 €
x 12 x
=
-
15 000 €
÷
6.00 %
1 699 670 €
=
+/-
0 €
1 699 670 €
=
800 m²
x
13.5 €/m² p.m.
1.0
129 600 €
x 12 x
=
-
15 000 €
÷
6.00 %
1 910 000 €
=
+/-
0 €
1 910 000 €
=
Input ParameterSubject Property
(Energy demand exceed 135 kWh/m².a)
Average of Peer(Energy demand exceed
67 kWh/m².a)
Figure 40: Numerical example – direct cap approach in developed markets
In conclusion, the exemplary calculation implicates just one possible quantified impact of
energy-efficient buildings – namely on the achievable rent. Consequently one must carry out
further regression analysis in order to quantify more valid impact factors which might be
applied in a similar way as shown in the example above.
Therefore when summarising the results of the case study, one must mention that the rental
effects on the basis of the results from the regression analysis are higher than the gap between
the energy costs of the subject property and the reference building. This is due to the fact that
the market data used implies a willingness to pay for energy-efficient buildings, which is
higher than the energy cost saving potential. That means that in the observed market energy-
efficient buildings are still a unique selling proposition (USP) and do not express the standard.
Therefore they achieve higher rental premiums than a rational occupant might pay. Another

WORK PACKAGE 7 WORKING PAPER REPORT D7.2
152
IMMOVALUE – IEE/07/553/SI2.499204 Page 152
reason for this may be due to possible omitted variables as stated in chapter 6.4.3.2.1 as well
as possible uncertainty within the used data base.
6.4.3.3.2 Residential real estate - omitted variable bias189
The considerations above showed us that the omission of a relevant covariate such as energy
costs or energy efficiency result in biased estimates. However, in most studies concerning
energy efficiency, if there are any, deal with commercial real estate and do not take residential
property into account. Based on a study by Brunauer et al. (2009), we try to get an impression
of how the omission of a relevant energy-specific covariate (e.g. “energy efficiency” as
measured in the the buildings’ specific demand of heat (HWBBGF, Ref per sqm).
As described in Steixner et al.190, the buildings’ annual demand is the amount of heat that
must be provided to keep the temperature of the heated rooms at the required level (OIB,
2007) and applies to the heated gross floor area related to a standard climate (3400 degree
days). The demand is categorized in energy efficiency classes: “A++” indicates a highly
efficient building of no or a very low heat-consumption, respectively class “G” marks a very
high heating energy demand of more than 250 KWh/m²a. The following Table 19 shows the 9
energy efficiency classes of the Austrian energy certification (OIB, 2007). Klasse HWBBGF, Ref
A++ ≤ 10 kWh/m²a
A+ ≤ 15 kWh/m²a
A ≤ 25 kWh/m²a
B ≤ 50 kWh/m²a
C ≤ 100 kWh/m²a
D ≤ 150 kWh/m²a
E ≤ 200 kWh/m²a
F ≤ 250 kWh/m²a
G > 250 kWh/m²a
Table 19: Categories of the Austrian EPC-energy efficiency classes
The data set used for this study covers 8767 rental flats in Vienna from the 1st of January 2004
to the 14th of February 2007. It includes offered rent (in Euro values per month incl. VAT and
service charges, excl. heating and energy costs, which are usually paid by the tenant),
189 We thank ERES NETconsulting-Immobilien.NET GmbH (www.immobilien.net), who act as a sponsor of this
project, for the provision of the data used in this study. 190 Cf. Steixner, D., Brunauer, W., Lang, S. (2007)

WORK PACKAGE 7 WORKING PAPER REPORT D7.2
153
IMMOVALUE – IEE/07/553/SI2.499204 Page 153
continuous variables such as floor size of the flat and indication of the time of letting, integer
variables such as the floor in which the flat is located, its current condition (captured in 4
categories) and its year of construction (10 categories) as well as binary variables such as
identifying whether the unit has a terrace, a balcony, a garage or a parking lot (see the
following Table 20).
Variable DescriptionScale Type Mean Std.-Dev. Min Max
logrent_psqm log of rent per sqm. of apartment [EUR per sqm.] ratio 2.08 0.29 0.81 3.00
Area floor size of the flat [sqm.] ratio 85.06 38.67 24 200 Terr existence of a terrace binary 0.18 0.38 0 1 Balk existence of a balcony binary 0.14 0.34 0 1 Gar existence of a garage binary 0.14 0.34 0 1 Park existence of parking lot binary 0.03 0.17 0 1 Elev existence of an elevator binary 0.70 0.46 0 1
Noelev
no elevator in 3rd floor or higher (interaction variable) binary 0.09 0.29 0 1
Cond condition of the apartment ordinal 2.18 0.53 1 4
Floor number of floor the apartment is located in ordinal 2.81 1.72 0 6
yearconst year of construction ordinal 1938 46.22 1815 2006 Distr number of district nominal 1 23 End time index variable [days] interval 07/12/2005 316 01/01/2004 14/02/2007
Table 20: Description of binary variables
While most studies examine the effects of these characteristics on total rents, Brunauer et al.
(2009) follows Fahrmeir et al. (2004) and chooses to examine the effects on rents per sq. m.
mainly for the following reasons:
First, using this specification we try to explain the structure of the supposedly decreasing
marginal returns of additional floor size in detail. More specifically, we find substantially
decreasing effects of additional floor size in our data.
Second, rent per sq. m. is especially interesting in the context of the Austrian rental law,
which imposes upper limits for this ratio depending on dwelling and building characteristics.
Therefore, the achievable rent per sq. m. is an important benchmark for policy makers as well
as market participants on both the supply and demand side.
Brunauer et al. (2009) estimate a semiparametric model using P-splines (see above): Non-
linear effects of continuous covariates as well as a smooth time trend are modelled non-
parametrically through P-splines. Unobserved district-specific heterogeneity is modelled in
two ways: first, by location specific intercepts with the postal code serving as a location

WORK PACKAGE 7 WORKING PAPER REPORT D7.2
154
IMMOVALUE – IEE/07/553/SI2.499204 Page 154
variable. Second, in order to permit spatial variation in the nonlinear price gradients, in a two-
stage procedure they introduce multiplicative scaling factors for nonlinear covariates. While
Brunauer et al. (2009) focus on the spatial aspects of hedonic price models, we try to describe
the consequences of an omitted covariate for energy efficiency and therefore do not need to
estimate a second stage.
For our purposes, we focus on two covariates in this study: the year the building was built
(left panel of the following Figure 41) and the condition of the flat (right panel).
7.5
88.
59
9.5
10
1800 1850 1900 1950 2000yearconst
year of construction, ev. at mean
Figure 41: Effects of covariates year of construction and condition of the flat
Brunauer et al. (2009) explain the effect of the year of construction as follows:
“…Furthermore, heating costs could also have an effect on rents per sq. m.: Recall that
heating costs are not included in offered rents in our dataset. Therefore, the higher the heating
costs of a flat, the lower the rent a tenant should be willing to pay for it. Buildings constructed
before First World War tend to exhibit rather good thermal quality due to their massive
structural design, while buildings constructed afterwards up to the 1960s are usually of a
lower constructive quality. Additionally, energy-efficient building has become more and more
popular during the last 15 years (e.g. due to an increasing amount of subsidies), which could
also partly explain the strong increase of rents for relatively new buildings.” Additionally, the
effect of the condition of the flat may be strongly correlated with the energy efficiency of the
building.
Hence, energy efficiency seems to be a relevant omitted variable, and it is therefore desirable
to get an impression of the size of its effect on rents per sqm. We use the covariates year of
construction and condition to construct the new explanatory variable for demand of heat,
which we call hwb.

WORK PACKAGE 7 WORKING PAPER REPORT D7.2
155
IMMOVALUE – IEE/07/553/SI2.499204 Page 155
In order to construct this new variable, we figured out realistic numbers for hwb, which are
shown in the following Table 21.
low up low up low up low up< 1890 30 100 80 120 100 150 130 200
1890-1913 30 100 80 170 100 200 150 2501914-1945 30 100 100 200 120 200 150 2501946-1975 30 100 100 200 120 200 150 2501976-1984 30 100 40 100 50 100 70 1201985-1994 30 80 50 80 60 80 70 1001995-2000 30 60 30 70 40 70 50 802001-2007 20 50 30 60 30 60 40 70
faircond
year
new/ renov. very good good
Table 21: Demand of heat due to building condition and age
In Table 21, “low” defines the lower bound and “up” 98 % quantile of a χ²(6) distribution of
the demand of heat measured in kWh/m² p.a.191
This procedure resulted in the following correlation structure (see Table 22):
new/ renov. -0.253very good -0.253good 0.319fair 0.261
< 1890 -0.0011890-1913 0.3831914-1945 0.1821946-1975 0.4061976-1984 -0.1681985-1994 -0.2301995-2000 -0.4832001-2007 -0.433
cond
ition
year
Correlation with hwb
Table 22: Correlation of buidlings’ condition and year of construction with hwb
We then conducted a linear regression on the model
191 We chose a χ²(6) distribution because it is bounded to the left and randomly generates some “outliers” to the
right. Furthermore, it has a positive skew, which is also what we expect of energy performance indicators.

WORK PACKAGE 7 WORKING PAPER REPORT D7.2
156
IMMOVALUE – IEE/07/553/SI2.499204 Page 156
u+++++++++
++++++++=
∑∑==
)hwbln(distryearareaareaareaendnoelev
elevterr4cond3cond1condgarbalcpark)rent_psqmlog(
43
42
20
19
14
313
21211109
876543210
ββββββββ
βββββββββ
jjj
iii
(35)
For simplicity, we display the results of this regression for only the covariates of interest in
the following table, namely condition, year of construction and hwb (see Table 23).
logrent_psqm Coef. Std. Err. t P>t logrent_psqm Coef. Std. Err. t P>tyear1 -0.035 0.014 -2.54 0.011 year1 -0.002 0.017 -0.09 0.927year2 -0.106 0.007 -14.18 0.000 year2 -0.065 0.014 -4.51 0.000year3 -0.138 0.014 -9.59 0.000 year3 -0.090 0.020 -4.42 0.000year4 -0.074 0.009 -8.74 0.000 year4 -0.027 0.017 -1.60 0.110year5 -0.047 0.013 -3.75 0.000 year5 -0.031 0.013 -2.36 0.018year6 -0.043 0.011 -4.04 0.000 year6 -0.029 0.011 -2.57 0.010cond1 0.014 0.011 1.24 0.216 cond1 -0.010 0.013 -0.75 0.456cond3 -0.116 0.006 -18.69 0.000 cond3 -0.110 0.007 -16.81 0.000cond4 -0.286 0.016 -17.63 0.000 cond4 -0.267 0.017 -15.50 0.000
lnhwb -0.043 0.013 -3.31 0.001
Omitted variable Included variable hwb
Table 23: Results of linear regression for year of construction, hwb and condition
The estimated parameter for ln(hwb) is -0.043, meaning that the elasticity of demand of heat
is -4.3 %. This parameter is significant on a 5 % level. The effect on the estimated parameters
is furthermore displayed in the following Figure 42.
Figure 42: Effects on estimated parameters
Moreover, it would be interesting to estimate a nonparametric function for hwb. Therefore,
we conducted a semiparametric regression on the model including the newly constructed
covariate. The estimated function is displayed in the following Figure 43, for which we
evaluated hwb at the mean of rents per sqm.

WORK PACKAGE 7 WORKING PAPER REPORT D7.2
157
IMMOVALUE – IEE/07/553/SI2.499204 Page 157
9.2
9.3
9.4
9.5
Effe
ct o
n re
nt p
er s
qm
0 50 100 150 200 250hwb
Figure 43: Effects of hwb on monthly rent per sqm
Final notes
In conclusion, one must mention that the illustrated results of the regression analysis under
chapter 6.4.3.3.2 are hypothetical. The figures therefore just demonstrate and answer the
question “what would happen, if...?“ on the basis of a theoretical scenario. Furthermore, the
regression refers to a dataset that includes collected information from properties which where
built a long time before governments and society started to pay attention to issues like energy
efficiency and energy performance standards for properties, etc.
Referring to the results of the two regression analysis carried out under chapters 6.4.3.3.1
(German market data) and 6.4.3.3.2 (Austrian market data), one should further note the
varying intensity of impact of a buildings’ energy efficiency. This observation implicates and
strengthens the hypothesis that the markets’ willingness to pay for buildings’ energy
performance varies between locations, market maturity (data availability), etc.

WORK PACKAGE 7 WORKING PAPER REPORT D7.2
158
IMMOVALUE – IEE/07/553/SI2.499204 Page 158
6.4.3.4 Case Study 2 – Basic makeshift for opaque markets
Based on the results stated in chapter 6.4.4.1.2, we created the following simplified example
to demonstrate how such adjustments could be derived and handled in a practical way. In the
following case the adjustment due to energy performance will be linked to the estimation of
the applying market rent, as it is believed to be the most adequate adjustment parameter to
integrate energy efficiency into property valuation.
The case study is carried out under following assumptions:
Subject Property (Office)
• Rentable Area 800 m²
• No special construction damage, significant maintenance demand.
• Mainly use fuel oil as energy source
• Overall Energy demand 90 kWh/m².a
• Overall price for energy 0.10 €/kWh
• Non-recoverable operating expenses 8000 €
• Equivalent Yield (incl. inflation, growth of energy costs, etc.) 6.00 %
Property Market situation
No profound evidence of direct impact of energy-efficient buildings on rents or property values is available,
but markets’ awareness for energy efficiency and the general sustainability topic gain momentum and
importance.
Peer Group (comps office buildings)
Comparable properties mainly use renewable fuels as energy source (overall price for energy approx. 0.05
€/kWh).Comp. 1:
• Overall Energy demand [kWh/m².a] 50 kWh/m².a
• Rent [€/m² p.m.] 7,3 €/m² p.m.
Comp. 2:
• Overall Energy demand [kWh/m².a] 45 kWh/m².a
• Rent [€/m² p.m.] 7,5 €/m² p.m.
Comp. 3:
• Overall Energy demand [kWh/m².a] 60 kWh/m².a
• Rent [€/m² p.m.] 7,0 €/m² p.m.

WORK PACKAGE 7 WORKING PAPER REPORT D7.2
159
IMMOVALUE – IEE/07/553/SI2.499204 Page 159
Due to the stated lack of evidence, property valuers must first evaluate the current property
market situation in order to determine if and to what extent the market already recognises let
alone cares about energy efficiency and energy-efficient buildings in general.
These investigations discovered that:
(1) the property market already recognised the importance of energy and resource
efficient properties and started to take sustainability topics into account due to rising
energy prices, etc.
(2) EPC’s are mandatory, energy performance standards are introduced and property
owners as well as tenants start to realise the relationship between EPC, energy
efficiency and cost saving potentials.
The above stated market aspects lead valuers to evaluate the market maturity by applying the
WAPEC-approach as illustrated in Figure 44: Key Valuation Parameter Market maturity
Market rent -low price elasticity- tenants do not pay attention on sustainability and energy eff iciency at all- m edia does not recognise green buildings benefits at all- m ajority of property m arket is not willing to pay rent prem ium for green buildings
- suffering econom ic situation
- …
- building achieve green building requirem ents
- m arket does not postulate green buildings- no effect on occupier dem and
- …
- …
Low adjustment
- …
neutralMedium adjustment
+/- 25-50 %
- …
Significant adjustment
+/- 75-100 %
- …
+/- 0-25 %
- high price elast icity - high awareness of tenants for sustainability and energy eff iciency- om nipresence of green building issues in the m edia- high m arket sensit ivity for operating expenses and energy costs (especially in gross rent-orientated property
k t )- good general econom ic condit ions- …
- building does not achieve energy perform ance standards/codes- m arket postulate green building standards/codes- high obsolescene and potential loss of occupier dem and
Opaque (Emerging) Market --> Premium for energetic building (primarilly in emerging market)
Market adjustment rate (MAR)
-->Discount for non-energetic building (mainly in further developed markets)
- …
+/- 50-75 %
Figure 44: Exemplary WAPEC for rent adjustment
As a result, the observed market already achieved a 60 % significant “medium” rating and
therefore one can rate it with a market adjustment rate (MAR) of approx. 55 %.
Next, valuers have to estimate the maximum energy cost saving potential (ECSP) of the
subject property in relation to a reference building (which illustrates an average from a peer
group of comparable properties) in order to quantify the maximum rental impact (see Figure
45) of properties’ energy efficiency expressed as the average adjustment parameter (AAP).

WORK PACKAGE 7 WORKING PAPER REPORT D7.2
160
IMMOVALUE – IEE/07/553/SI2.499204 Page 160
( ) ( )12
p-p
M
1iie,isub,
1iie,iref,
r
EE=ECSP
×
∑∑==
××
Observable rent
Parameters
Market rent
Overall Energy demand
-
Subject property
-
90 kWh/m².a
-
Reference building
7.3 €/m² p.m.
52 kWh/m².a
7.3 €/m² p.m.
Comp 1
50 kWh/m².a
7.5 €/m² p.m.
Comp 2
45 kWh/m².a
7.0 €/m² p.m.
Comp 3
60 kWh/m².a
127.30
0.10900.0552
×
×−×= = -7,3%
Average price for overall energy 0.10 €/kWh 0.05 €/kWh
Figure 45: Numerical example – Estimation of CSP
To simplify the case study one assumed that the overall energy demand equals the sum of
consumption of various energy sources (∑Ei), and the average price for overall energy equals
the average of the sum of the price for various energy sources (pe,i). In this case study the
subject property is less energy-efficient and its energy resources face higher prices.
On the basis of the estimated MAR and AAP (in the this case equals to ECSP), the valuer can
calculate the weighted adjustment factor (WAF), which illustrates the specific adjustment of
the observed key valuation parameter (KVP) – here the KVP is the market rent.
Following the displayed Equation (36) below the WAF exceed -4.0 % and lead to a VPA
(valuation parameter adjustment) of approx. -0.30 €/m² p.m (Equation (37)).
VEAAAPMARWAF ××= 100%%) (-7,3% 55 ××= % -4,0= (36)
KVPWAFVPA ×= 7,30%) (-4,0 ×= p.m.€/m² -0.30= (37)
The estimated VPA then can be directly integrated as an adjustment parameter to derive the
estimated rental value (ERV) as illustrated in Figure 46, on which the market value of the
subject property is calculated (Figure 47).

WORK PACKAGE 7 WORKING PAPER REPORT D7.2
161
IMMOVALUE – IEE/07/553/SI2.499204 Page 161
Market rent
+/-
VPA
Estimated Rental Value (ERV)
7.30 €/m² p.m
-
0.30 €/m² p.m.
7,00 €/m² p.m.
7.30 €/m² p.m.
+/-
0.00 €/m² p.m.
7.30 €/m² p.m.
Subject Property(Energy demand exceed
90 kWh/m².a)
Reference Building(Energy demand exceed
52 kWh/m².a)
= ==
Figure 46: Application of the VPA to determine the ERV
Lettable Area
x 12 x
Estimated rental Value
Annual Potential Gross Income
=
-
Non-recov. Operating Expenses
÷
Equivalent Yield
Income Value
=
+/-
Adjustments
Market Value
=
800 m²
7.00 €/m² p.m.
67 200 €
=
-
8 000 €
÷
6.00 %
986 667 €
=
+/-
0 €
986 667 €
=
800 m²
7.30 €/m² p.m.
70 080 €
=
-
8 000 €
÷
6.00 %
1 034 667 €
=
+/-
0 €
1 034 667 €
=
Input ParameterSubject Property
(Energy demand exceed 90 kWh/m².a)
Reference Building(Energy demand exceed
52 kWh/m².a)
x 12 xx 12 x
Figure 47: Market Value impact of non-energy-efficient buildings

WORK PACKAGE 7 WORKING PAPER REPORT D7.2
162
IMMOVALUE – IEE/07/553/SI2.499204 Page 162
6.4.4 Sales comparison Approach
Key Facts and Findings
Basic description of the methodologies
• The methodologies proposed to be used in the sales comparison approach are based on
the idea that the Energy Saving Potential of a building (ESP) represents a feature to be
taken into consideration in valuation procedures, The Energy Saving Potential is the
difference between the annual energy demand presented in the EPC and a certain
reference energy demand (the so-called “expected energy demand”).
• The proposed methodology considers the net present value of the ESP, adjusted in
accordance to market trends, as a substitute for depreciations/appreciations due to
low/high energy efficiency.
Short rationale for the proposed methodologies
• Previous works on finding a solution about the impact of energy policies on valuation
procedures indicate that new methodologies that accept the energy efficiency level as
significant in the real-estate market rely on the calculation of the modified operating
costs.
• This kind of procedure is allowed in valuation methodologies as substitute for
information on market preferences and may be used until more market data is
available.
Expected impacts on property value
• The proposed methodologies underline extra-value resulting from reduced operating
costs.
• The expected impact is recognition of owing highly energy-efficient buildings as a
marketable benefit.
The sales comparison approach is based on the idea that identical houses should have
identical prices. This approach uses transaction prices of highly comparable and recently sold
or currently for sale properties. Firstly, the appraiser must investigate and analyze market data
in order to extract quantitative information. Then, he has to estimate the degree of similarity
or differences between the subject property and the comparable sales by considering various

WORK PACKAGE 7 WORKING PAPER REPORT D7.2
163
IMMOVALUE – IEE/07/553/SI2.499204 Page 163
elements of comparison. Finally, adjustments are applied to the sale price of each comparable
property to derive the best-estimated value for the subject property.
6.4.4.1 Derivation/modification of basic approach for integration
The sales comparison approach is applicable if similar properties have recently been sold or
are currently for sale in the subject property’s market. It is highly recommended for valuation
of condominiums, especially if they are owner-occupied. In the case of single family houses,
it is recommended just for typical, standardized objects, like semidetached houses. For the
valuation of multifamily-houses it should have just a supportive role.
6.4.4.1.1 Methodology for developed markets
In developed (i.e. transparent or with available databases) markets, appraisers are supposed to
have access to a large database with information concerning transaction prices of property
sales and rents, etc. Main real estate characteristics should be found in these databases for a
wide range of buildings: age, location, number of floors, useful surface area, facilities,
improvements, etc. By using statistical analysis tools, such as regression analysis, the valuer
can analyse the influence of each factor and estimate market value for subject properties.
Identify differentiating criteria for sales comparison approach
The problem remains, how exactly should one perform real estate valuation that includes
building energy efficiency information given the fact that a good valuation means well
supported differentiating criteria. The subject is complex and it becomes even more so when a
European/international methodology is needed, especially when the very concept of what a
highly energy-efficient building means is different in each country.
Energy demand of buildings – especially the energy demand for heating – is to a certain
extent correlated to the age of the buildings. Every country has well established appraisal
methodologies for taking into consideration the age of the building in valuation process.
Therefore a new appraisal methodology including the energy efficiency input must not
interfere with the usual calculation of depreciations/appreciations due to the age of the
building. In other words, the age and the energy efficiency must be independent inputs. This

WORK PACKAGE 7 WORKING PAPER REPORT D7.2
164
IMMOVALUE – IEE/07/553/SI2.499204 Page 164
principle is important in any valuation methodology, no matter how simple or complicated it
is, or how developed or undeveloped the studied markets are.
Avoidance of redundancies and isolating of effects is a complicated task
In terms of energy efficiency, age intervenes with the energy codes valid for constructions at
the time of building erection. One may calculate the design energy demand by considering the
energy demand indicator included in the construction codes valid at the time of building
completion with the useful area of the building and climate conditions. The difference
between the current energy demand/consumption and the design value is associated with age
deteriorations as well as subsequent energy efficiency investments (if any). In order to
exclude age as a comparison criterion, the average energy demand/consumption of buildings
of similar type, size, and age (when data is available) may be subtracted from the current
energy demand/consumption of the investigated building to point out energy efficiency
deviation from an average case. Thus, one may calculate the depreciations/appreciations of
value produced strictly by differences in energy efficiency separate from
depreciations/appreciations of the building’s value produced by age. If the subject property
and the comparables were constructed within the same construction codes, the age of the
building and the ESP are independent inputs, so they can be used in studies based on linear
regression analysis. The choice of the statistical technique depends significantly on the
relationship between inputs. For instance, the classic least squares method (OLS) requires
independence of input variables (Montgomery et al, 1994).
Energy demand as main criteria
The methodology presented here is based on the idea that the difference, named Energy
Saving Potential (ESP), between the energy demand of the studied building (Edemand),
presented in the EPC and a reference value for energy demand, the so-called “expected energy
demand (Eexpected),” represents a feature to be taken into consideration in valuation procedures
(Popescu et al., 2009). One can use this idea in sophisticated methods such as statistical
analysis using data from developed markets or in the simple direct sales comparison approach
using several buildings, as is the current practice in opaque markets.
For each type “j” of energy demand (i.e. gas, electricity, district heating, solar etc), the ESP
of a building is
( ) ( ) ( ) jexpectedjRESdemandj EEEESP −−=
(38)

WORK PACKAGE 7 WORKING PAPER REPORT D7.2
165
IMMOVALUE – IEE/07/553/SI2.499204 Page 165
where:
ESP specific annual energy saving potential [kWh/m².year];
Edemand specific annual energy demand [kWh/m².year];
ERES specific annual energy produced by renewable energy sources (RES) which do not
cause running energy cost (e.g. solar-thermal energy) [kWh/m².year];
Eexpected specific annual expected energy demand (demand in a certain reference case
[kWh/m².year];
A positive ESP indicates a low energy efficiency; by contrast, a negative ESP evidences a
superior energy performance.
The calculation of the specific annual expected energy demand for a building is based on
certain reference figures. These references can be either extracted from the EPC or from
prescription in the building codes.
Convert energy savings into present value
Similar to the methodology proposed for the income approach, that of the comparison
approach is based on the calculation of the modified operating costs. Although this may or
may not fully reflect the willingness to pay more for a better energy performance, the
procedure is allowed in valuation methodologies as a substitute for information on market
preferences and therefore may be used until more market data is available.
The methodology presented here considers that the net present value of the total costs of ESP
during a chosen time-interval generates depreciations/appreciations due to energy efficiency:
( )[ ] ( )( ) ⎟
⎟⎠
⎞⎜⎜⎝
⎛
⋅+
−+⋅⋅= ∑
= iiiCESPNPV T
TJ
jjEjESP
111
1 (39)
where:
NPFESP net present value of costs of Energy Saving Potential [EUR]
(CE)j energy tariff for each type “j” of energy (e.g., thermal, electricity, gas) EUR/kWh];
T remaining economic lifetime of property [years]
i all risk yield (derived from property market)
The issue of setting a “correct” price for the different energy carriers is crucial. In principle,
one can use current prices as well as expected prices, depending on whether there is an
assumption that energy price increases would outreach average price increases. A more

WORK PACKAGE 7 WORKING PAPER REPORT D7.2
166
IMMOVALUE – IEE/07/553/SI2.499204 Page 166
detailed description on how the calculate energy costs based on energy performance figures
given in the EPC is included in chapter 6.4.2.1.
In order to find the premium/discount of value for energy efficiency, one can apply a market
adjustment in accordance with the willingness to pay for energy performance. Therefore one
might calculate value of ESP with the following equation:
ESPESP NPVAV ⋅= (40)
where A is a market adjustment for the willingness to pay for energy efficiency. The
coefficient A is considered to be 0-25 % for low awareness among tenants of sustainability
and energy efficiency, 25-75 % for medium awareness and 75-100 % for high awareness.
Alternatively, one could also use the score-card methodology proposed under chapter
6.4.3.2.2
The value added due to better energy efficiency may be very different from the net present
value of the total costs of ESP if the chosen time interval is wrong. The time interval N must
reflect the willingness to wait for payback of value added due to higher energy efficiency.
Finding the “right” time interval is the crucial point of this methodology. It is also the most
vulnerable because it is based on the experience and judgement of the valuer. According to
RICS’s study, “Green Value, Green buildings, growing assets,” a “rapid payback resulting
from lower operating costs is increasingly recognized as the most marketable benefit of
building green” (Davies R., 2005).
The expected energy demand as reference value
As a general rule, the proposed methodology requires that the comparables must be
constructed within same construction standards/codes as the subject property that they are of
the same type and are located in the same area. In this case, one might calculate the ESP of
each building using equation (38), and the corresponding depreciations/appreciations of
comparables may be calculated using equation (40).
Futher, one may consider two options when defining the expected energy demand for the
building.
The first option is to consider the expected energy demand of each building is that extracted
from the EPC for each type of energy. The problem is that if differences between the expected
energy demands of comparables are important, the proposed methodology calculates
depreciations/appreciations for them, which is hazardous.

WORK PACKAGE 7 WORKING PAPER REPORT D7.2
167
IMMOVALUE – IEE/07/553/SI2.499204 Page 167
The second option is to consider that the expected energy demand is equal to the average
expected energy demands for m reference cases (Eref)
( )j
m
iirefjexpected E
mE ⎟
⎟⎠
⎞⎜⎜⎝
⎛= ∑
=1
1
(41)
In general, reference cases are buildings constructed within the same construction codes as the
subject property and the comparables. This method is adequate for developed markets that can
offer data regarding the expected energy demands of sufficient buildings.
The expected energy demand for a building (Eexpected) is based on the reference rates extracted
from the EPC or from construction codes. The reference energy demands and the reference
building are concepts issued from the Energy Performance of Buildings Directive, which
stipulates that “the energy performance certificate for buildings shall include reference values
such as current legal standards and benchmarks in order to make it possible for consumers to
compare and assess the energy performance of the building.” In practice, each European
country uses different approaches for the definition of references. The EPC’s of some
countries include reference rates for each building, others for a peer group of buildings. One
must adapt the proposed methodology according the specific country’s approach when
presenting references. In the following, we present several examples of different country
approaches and how to deal with them for the proposed sales comparison approach. Further
information on country approaches can be found in the country reports on the site of EDBD
Buildings Platform (http://www.buildingsplatform.org/cms/).
Proposed application for the case of England and Wales
The EPC from England and Wales is two label certificate with two scales: one for the energy
demand of the studied building and one for the potential energy demand if all cost effective
measures were installed.
The residential building certificate is accompanied by a report, which includes cost-effective
recommendations to improve the energy ratings. Indicative paybacks are listed for each
improvement. In the case of domestic properties, indicative paybacks are categorized as lower
cost - typically up to £500 and higher cost - typically over £500.
The non-domestic EPC also provides two benchmarks. Cost effective recommendations for
non-domestic properties are categorized as: short term - payback less than three years,
medium term - payback between three and seven years and long term - payback more than
seven years. Other recommendations are based on the assessor’s knowledge.

WORK PACKAGE 7 WORKING PAPER REPORT D7.2
168
IMMOVALUE – IEE/07/553/SI2.499204 Page 168
Proposed application for the case of Romania
The Romanian EPC has two energy marks (on a scale from 20 to 100) and two energy scale
levels (in the range from A to G): for the studied building and for the so-called reference
building. The reference building is a fictive construction that corresponds to the building in
question regarding geometry, orientation, and terms of use, however all the building envelope
elements and installations correspond to the current legal standards regarding energy features.
The studied building may be superior, equal or inferior to the reference building in terms of
different energy demands.
Proposed application for the case of Austria
The Austrian EPC does not contain reference values but rather a system of requirements
implemented for all kinds of buildings (except historical buildings).
The valuer can easily calculate the maximum permitted net heating demand per year m²
denoted HWBBGF,WG,max,Ref, depending on the geometry (characteristic length lc) of the
building because all the necessary data, volume and area of the building can be found in the
EPC or are known by the appraiser from the property documents of the building. This valuer
can then serve as reference value and as basis for the calculation of the so-called “expected
energy demand” for the proposed sales comparison approach.
The maximum net heating demand per year and m2 for residential buildings (new construction
and major renovations) is presented in Table 24.
New (up to 31.12.2009) HWBBGF,WG,max,Ref =
26 * (1 + 2.0/lc) [kWh/m2year]
But not above 78.0 [kWh/m2year]
New (after 1.01.2010) HWBBGF,WG,max,Ref =
19 * (1 + 2.5/lc) [kWh/m2year]
But not above 66.5 [kWh/m2year]
Major renovation (up to 31.12.2009)
HWBBGF,WG,max,Ref =
34 * (1 + 2.0/lc) [kWh/m2year]
But not above 102.0 [kWh/m2year]
Major renovation (after 1.01.2010)
HWBBGF,WG,max,Ref =
25 * (1 + 2.5/lc) [kWh/m2year]
But not above 87.5 [kWh/m2year]
Table 24: Permitted annual heating demand for residential buildings
The upper limit for net heating demand for non-residential buildings (new construction and
major renovations) is presented in Table 26.

WORK PACKAGE 7 WORKING PAPER REPORT D7.2
169
IMMOVALUE – IEE/07/553/SI2.499204 Page 169
New (up to 31.12.2009) HWBBGF,WG,max,Ref =
9* (1 + 2.0/lc) [kWh/m2year]
But not above 27.0 [kWh/m2year]
New (after 1.01.2010) HWBBGF,WG,max,Ref =
6.5 * (1 + 2.5/lc) [kWh/m2year]
But not above 22.75 [kWh/m2year]
Major renovation (up to 31.12.2009)
HWBBGF,WG,max,Ref =
11 * (1 + 2.0/lc) [kWh/m2year]
But not above 33.0 [kWh/m2year]
Major renovation (after 1.01.2010)
HWBBGF,WG,max,Ref =
8.5* (1 + 2.5/lc) [kWh/m2year]
But not above 30.0 [kWh/m2year]
Table 25: Permitted annual heating demand for residential buildings
Proposed application for the case of Germany
The German EPC is calculated according to EnEv2007 and it considers reference rates for
heating+hot water and for lighting+cooling.
For residential buildings, a fixed scale of reference values of energy for heating and
preparation of warm water is presented in the EPC (Figure 40).
Figure 48: M Scale of reference values (heating and hot-water) for residential buildings from Germany.
According to DIN V 18599, the energy demand of the reference-building for air- conditioning
and lighting has not fixed limits for the primary energy demand. It refers to a fictive reference
construction that corresponds to the building in question regarding geometry, orientation and
terms of use.
The reference values for non-residential buildings take into account the individual terms of
use and define the maximum value of the scale. The German Federal Ministry of Transport,
Building and Urban Development has introduced two official announcements about
simplified data recording simultaneously to the EnEV 2007. The announcement applying to

WORK PACKAGE 7 WORKING PAPER REPORT D7.2
170
IMMOVALUE – IEE/07/553/SI2.499204 Page 170
non-residential buildings also contains the reference values for different/mixed uses. A few
examples of heating/hot water and electricity reference values for metered consumption of
non-residential buildings are shown in Table 27. Reference value heating/hot water
Reference value electricity
Building use (examples)
kWh per m2 and year Office buildings, heated 135 55 Office buildings, air conditioned 190 155 Hotels (medium class) 120 95 Restaurants 320 135 Cinemas 150 75 Shops, non food small 210 70 Shops, food, small 160 90 Department-stores, air conditioned 85 150 Hospitals, large (> 1000 hospital beds) 230 100
Table 26: Examples of results for non-residential buildings (metered consumption)
6.4.4.1.2 Methodology for opaque markets
The calculated value of a building using the direct sales comparison approach is derived by
comparing the property being appraised to other properties, applying appropriate units of
comparison and finally making adjustments to the sale prices of the comparables based on the
criteria of comparison. The sales comparison approach needs comparable buildings for its
calculations of the market value of the subject property being valued.
Opaque markets are characterized by a reduced number of comparables. The main problem in
using the sales comparison approach is that it is very difficult to find comparables that have
an EPC and/or are energy efficient. Undeveloped markets usually have a reduced number of
EPC. This represents a certain limit on the proposed methodology.
Moreover, the proposed methodology requires that the subject property and the comparables
are built within the same construction codes, no matter if the markets are transparent or
opaque. This requirement further limits the choice of comparables, which might generate
additional problems.
For opaque markets, the first option, considering for each type of energy that the expected
energy demand of each building is that extracted from the EPC, seems to be the only one
possible. An alternative would be for one to consider that the expected energy demand to be
used in equation (38) is equal to the average reference rates of comparables.
If the market is semitransparent, a reasonable number of cases are available and the second
option, considering that the expected energy demand is equal to the average expected energy
demands for m references cases (Eref) may be used according to Equation (41). Since a

WORK PACKAGE 7 WORKING PAPER REPORT D7.2
171
IMMOVALUE – IEE/07/553/SI2.499204 Page 171
reasonable number of cases are available, one may use the second option, considering that the
expected energy demand is equal to the average expected energy demands for m references
cases (Eref) may be used in Equation (41),
6.4.4.2 Case Study
During a valuation process in a less developed market, adjustments of value are set by
corrections between the subject property and comparable properties. In the following contains
an example that shows how appreciations/depreciations due to ESP for heating are calculated.
It is a case study from Romania, which EPC contains information about the annual heating
energy demand of the studied building and about the annual heating energy demand of a
reference building. The annual expected energy demand is considered to be the heating
energy demand for the reference building, Eref, extracted from the EPC.
The subject property denoted 1 is a block of flats, built in 1981, which have undergone only
running maintenance since that year. Walls are made of bricks with reinforced-concrete
frames. There is no thermal insulation in the walls and the windows are double-glazed with
thermal insulated p.v.c. frames. The space heating energy demand is 260 kWh/m2year. The
space heating energy demand of the reference building is 80 kWh/m2year.
The comparable denoted as building 2 is an apartment situated inside a building, the
envelope of which was thermally insulated. The level of energy efficiency for the reference
building was not reached because heating installations were not changed and the general
maintenance is poor. The cost of the rehabilitation was EUR 11,500. The space heating
energy demand is 105kWh/m2year. The space heating energy demand of the reference
building is 75 kWh/m2year.
The comparable denoted as building 3 is an apartment that has no thermal insulation on the
opaque external walls, but the windows are triple-glazed with energy-efficient PVC frames; in
addition, an individual performing heating system was installed. Further, 1,200 EUR were
spent replacing old wooden windows with the modern ones. The new heating system
installation cost EUR 1,500. The space heating energy demand of building 3 is 230
kWh/m2year. The space heating energy demand of the reference building is 80 kWh/m2year.
The apartment from building 4 did not suffer any improvement since it was built. There is no
insulation in the walls, windows are double-glazing with wooden frames and the heating
radiators are old. The space heating energy demand of is 285 kWh/m2year. The space heating
energy demand of the reference building is 85 kWh/m2year.

WORK PACKAGE 7 WORKING PAPER REPORT D7.2
172
IMMOVALUE – IEE/07/553/SI2.499204 Page 172
No renewable energy sources are used in any of the buildings included in the analysis.
Figure 41 presents the heating annual energy demands (Edemand), the heating annual expected
energy demands (Eexpected) and the Energy Potential Savings (ESP) for heating in the
following cases: subject property denoted 1, comparables denoted 2, 3, 4.
0
50
100
150
200
250
300
kWh/
m2
year
Eexpected 80 75 80 85
Edemand 260 105 230 285
ESP 180 30 150 200
1 2 3 4
Figure 49: Values of the Edemand, Eexpected and ESP for heating. Case study.
Figure 41 points out that comparables 2 and 3 are more energy efficient than the subject
property, since the ESP of buildings 2 and 3 is lower while comparable 4 has a lower energy
efficiency since the ESP of building 4 is higher compared to the subject property.
Part of a Romanian appraisal report with the proposed methodology implemented is presented
in Table 28. The analysis assumes the thermal energy tariff of 0.107 EUR/kWh, the economic
life of the building is 50 years, the yield is 7 % and the correction for the willingness to pay is
0.75 [see eq. (39)].
Details regarding the calculation of corrections generated by the energy efficiency are
presented in Table 29. Differences between the VESP of each comparable building (i) and the
VESP of the subject property are taken into consideration as corrections. Corrections are
needed to derive how much the value of the comparable would be if it were similar to the
subject property.

WORK PACKAGE 7 WORKING PAPER REPORT D7.2
173
IMMOVALUE – IEE/07/553/SI2.499204 Page 173
Comparable assets Comparison elements Subject propertyBuilding 1 Building 2 Building 3 Building 4
Price (EUR) 105000 110000 112000
Useful are (mp) 77.63 77 80 78
Correction (EUR) +859 -3259 -531
Adjusted price (EUR) 105859 106741 111469
Property rights Full Integral Integral integral
Correction (EUR) 0 0 0 0
Adjusted price (EUR) 105859 106741 111469
Conditions of financing Market Market Market Market
Correction (EUR) 0 0 0
Adjusted price (EUR) 105859 106741 111469
Market conditions 04. 2009 03. 2009 03. 2009 03. 2009
Correction (EUR) 0 0 0
Adjusted price (EUR) 105859 106741 111469
Age (year of construction) 1981 1976 1977 1984
Correction (EUR) +5610 +4569 -3511
Adjusted price (EUR) 111469 111310 107958
Floor/ height conditions 2/10 3/8 6/7 4/7
Correction (EUR) +2117 +7472 +5573
Adjusted price (EUR) 113586 118782 113531
Location same same same same
Correction (EUR) 0 0 0
Adjusted price (EUR) 113586 118782 113531
Indoor design investments
Correction (EUR) -400 -200 -400
Adjusted price (EUR) 113186 118582 113131
ESP [kWh/m².year] 180 30 150 200
ESPNPV [EUR/m2] 213 31 161 249
Correction (EUR) -10579 -3004 2116
Adjusted price (EUR) 102607 115578 115247
Selected compared value 115247 EUR
Table 27: Market value calculated by sales comparison approach.
The following calculation was used in the valuation of energy efficiency presented in Table
29.

WORK PACKAGE 7 WORKING PAPER REPORT D7.2
174
IMMOVALUE – IEE/07/553/SI2.499204 Page 174
Comparable assets Subject property
Building 1 Building 2 Building 3 Building 4
Eref /Edemand for heating [kWh/m².year] 80/260 75/105 80/230 85/285
( ) ( )expectedEEESP demand −= [kWh/m².year] 180 30 150 200
T [years] 22 17 18 25
( )( ) ⎟
⎟⎠
⎞⎜⎜⎝
⎛
⋅+
−+
iii
T
T
111
11.06 9.76 10.06 11.65
ESPNPV [EUR/m2] 213.04 31.34 161.45 249.39
VESP [EUR/m2] 159.78 23.50 121.09 187.04
subjectsubjectESPcompESP SVVCorrection ⋅−= )( -10579 -3004 2116
Table 28: Detailed calculation of depreciations/appreciations due to ESP for heating.

WORK PACKAGE 7 WORKING PAPER REPORT D7.2
175
IMMOVALUE – IEE/07/553/SI2.499204 Page 175
6.4.5 Cost Approach
Key Facts and Findings
• The cost approach is driven by two main effects. The technical effect and the market
effect. The technical effect contains the technical characteristics and the cost related
implications of these parameters. The latter effect comprises the market effect and thus
the demand side. This parameter does not include any costs and adjusts for the
willingness to pay.
• The technical effect is reflected by the replacement costs, which are market driven
themselves, and/or adjustments (other value affecting characteristics). The adjustments
based on the market effect, however, are based on market evidence.
• The following process for integration can be constituted:
• Technical effect: The quantification is the same for “developed” and “undeveloped”
markets. Therefore, it must be clear which type of construction leads to a good energy
efficiency level. A higher quality usually leads to higher costs. E.g. a building with a
thermal insulation has higher replacement costs than a building with the same features
without thermal insulation.
• Market effect: The quantification is different for “developed” and “undeveloped”
markets.
(1) Developed market: One must derive the ratio between the market value (the real
transaction price) and the calculated cost value from past transactions. If both values
are known, there are two ways to calculate the adjustment – a) Simple linear regression,
and b) Compare same buildings
(2) Undeveloped (opaque) market: One might use a scoring model in order to
quantify the market effect related to energy efficiency in the opaque market. The
scoring model is a tool to get a feeling how important energy efficiency in the observed
market is. Furthermore the tool helps to quantify the effect.

WORK PACKAGE 7 WORKING PAPER REPORT D7.2
176
IMMOVALUE – IEE/07/553/SI2.499204 Page 176
Of all three main approaches, the cost approach is the least frequently used because the cost
approach is not able to reflect the market in most cases.192 Nevertheless, many countries still
use it as an accepted valuation approach. The cost approach uses the replacement costs of the
property being valued. 193 The market value is the sum of the land value and the total
replacement costs of a new building reduced by the accrued depreciation. Cost related
approaches are applicable if there are no comparable values and it is used in markets where
market actions can not be observed. 194 Therefore this method is particularly applied to the
appraisal of special purpose properties or financial statements. In general, the cost approach is
used for properties where the costs play the dominant role. The basic concept of the cost
approach is shown in Figure 50.
Figure 50: General Cost Approach
192 Cf. Leopoldsberger, G. Thomas, M., Walbröhl, V. (2007), p. 520 193 Cf. EVS (2007) p. 36 194 Cf. Bienert, S., Reinberg, M. (2007) p. 477

WORK PACKAGE 7 WORKING PAPER REPORT D7.2
177
IMMOVALUE – IEE/07/553/SI2.499204 Page 177
The cost approach’s use is not used equally distributed across Europe. In some countries it is
used more often (e.g. Austria and Germany) but in others it is rarely used (like United
Kingdom or Romania).
The purpose of the cost approach within specific countries is summarized in Table 29: the
application of the cost related approach. Austria Germany Norway Romania United Kingdom
Single houses
Semidetached
houses
Owner occupied
factory buildings or
warehouses
Same like Austria Reference value
for residential and
commercial real
estate
Rarely used
Only for properties
which are not
normally bought or
sold
Owner occupied
properties
Properties which are
not normally bought
or sold
Table 29: The Application of the cost related approach
Generally the cost related approach does not dominate valuation as strongly as the income
approaches. Table 29 shows that the procedure discussed in this chapter is particularly used
to value owner occupied properties. Especially in Austria and Germany the approach is
mainly used for one-family houses. The method of the cost related approach is quite the same
for all countries. The difference lies in the amount of the construction costs. However these
not only vary between nations, figures also show a considerable variation between regional
districts within one country. But the construction costs are not the only ones that are different.
The market perceptions from single characteristics differ between regional areas as well.
Hence it is impossible to model consistently quantified adjustments for all countries.
Therefore this report will show the structure behind integrating the effects of energy
performance certificates. While the integration developed will be the same in all countries, the
quantification of these effects will be different for each country.
In the cost approach one can classify the main value drivers into two categories – the
technical effects and the market effects. These two effects represent the adjustments that are
necessary in order to match construction costs and the actual value of the building. As seen in
an economic context: the technical parameter provides the supply side i.e. it represents the
object and its specific characterizations, which are offered at the market. Therefore the market
parameter focuses on the demand side where the focus lies in the analysis of the demand
structure and its implication on the value of the building.
The cost approach is based on the replacement costs, i.e. the technical aspects are the focus of
the valuation. In fact, these costs refer to the construction costs of the object at the point in

WORK PACKAGE 7 WORKING PAPER REPORT D7.2
178
IMMOVALUE – IEE/07/553/SI2.499204 Page 178
time the valuation is undertaken, reflecting current economic and technical aspects.195 The
technical adjustment parameter can be defined based on this specification. This parameter
contains the technical characteristics as a whole. As described above this might also be
interpreted as the supply side. The quantification results from the cost side. The technical
parameter is obtained by comparing the actual building and a theoretical implementation of
e.g. a thermal improvement.
The second effect comprises the market effect and contains the demand side. This parameter
does not include any costs and only considers the market. This parameter takes in account the
issue of the diverging “technical value” and the market value. How high is the willingness to
pay e.g. for a house with an excellent thermal insulation? In other words the market parameter
reflects the demand e.g. for a house in Austria with an EPC of Level A++ compared to Level
D, but equal construction costs and size.
The main question is how these parameters might be integrated into the cost approach? The
integration of technical parameters can be done more easily. All technical effects may be
calculated and integrated through the additional costs resulting from the higher quality of the
material used to erect the building. For example, the additional cost of excellent thermal
insulation may be calculated and thus lead to higher replacement costs for the building. This
consideration of high-quality components is already common practice in property valuation.
Therefore a valuer can use the EPC as an indication for higher replacement costs.
The market effect provides a direct connection to the demand side of the market. The main
issue here is to what extent the energy efficiency of LCC optimized houses will be honored by
the market. The consumer (renter/buyer) generates the willingness to pay for special features
that are reflected in the market prices. However, one must consider this effect with the aid of
an adjustment based on market evidence. The market effect cannot be generally quantified as
the quantification is individual for each single region.
In order to get an idea as to which effects influence the valuation it is important to know what
the main green value drivers are. Therefore the first step for the valuer is to identify them
before the allocation of technical or market effects is carried out.
6.4.5.1 Main green value drivers
In order to generate a quantification of the ‘green’ influence, it is essential to identify the main
green value drivers related to the cost approach. Table 30 gives an overview of the main value
195 Cf. Funk, M., Koessler, C., Stocker, G. (2007) p. 270

WORK PACKAGE 7 WORKING PAPER REPORT D7.2
179
IMMOVALUE – IEE/07/553/SI2.499204 Page 179
drivers identified within the cost related approach. The classification follows as it was
explained in previous chapter and classified by:
(1) Public benefit
(2) Intangible benefits
(3) Tangible benefits
G reen f e ature G reen im p act T h eoretical l i n kage: a d ded va lue t o ow n er?
Ev i dence o f m a rket im p act R e commendation f o r a d justment
E n ergy e f fic iency
E n ergy e f fic iency P u b lic b enefits •Only if tax savings / subventions etc. directly connected to the property. Public benefits which leads to reduce the build ing costs.
If applicable easy to assess. R e placement co s ts( if clear regulation shows positive effect compared to Peers. BUT penalties for non-green m ight be more relevant in the future)
I n t angib le b enefits f or u ser (Improved occupant productivity, lower churn,H igher well be etc.
•H igher accoutrements – higher well be.•Generally increased w illingness to pay higher value must be tested.•Green build ing as a marketing activity•Longer econom ic life.•H igher marketability leads to faster sale
Rare market evidence and difficu lt to iso late.
R e placement co s ts (higher accoutrements leads to higher costs)
A d justment b as ed o n market
T a n gib le b e nefits f o r u ser
Lower energy costs (for the user)
•Lower energy cost because of higher quality•H igher marketability for “prestige”?
Pure cost cutting effect w ill have an impact in the valuationThe market effect is not clear - must be carr ied out.„Prestige“ probably just a first mover bonus that w ill disappear soon
R e placement co s ts (higher quality leads to higher costs)
A h ig h er m arketabil ity –A d justment b as ed o n market
( I n t he c o s t a pproach is n o d i rect l in k t o in come!)
Ta n gib le b e nefits f o r u ser
Maintenance costs
•Both way (higher and lower) m ight be the case depending on the technical level of the build ing
R e placement co s ts
A d justment ( f or va lue a f f ecting ch arac ter is tics)
A d justment b as ed o n market
Table 30: Main green value drivers
Table 30 intends to give a general overview of the main value drivers of the cost approach.
The next chapters will explain a detailed classification of the effects and the possibility of
such effects respective integration into the cost approach.
6.4.5.2 Derivation/modification of basic approach for integration
While modifying the basic approach one must keep the following statement in mind.
Upgrading a property to the highest thermal standard technically feasible and subtracting the
value before the renovation does not reflect the gain in value since no investor/owner would
look at the situation this way.196 Cost to upgrade does not necessarily equal value. This fact 196 Cf. Davis Langdon (2009): Upgrade to good medium standard as a most likely szenario.

WORK PACKAGE 7 WORKING PAPER REPORT D7.2
180
IMMOVALUE – IEE/07/553/SI2.499204 Page 180
shows the need for the valuer to separately integrate the technical effect and the market effect.
The modification must contain both effects to get the actual market value.
The cost approach offers four theoretical options when integrating the effects of the energy
certification:
(1) Replacement costs
(2) Adjustments (other value affecting characteristics)
(3) Deprecation
(3) Adjustment based on market evidence
Upon closer examination there are actually two possibilities that one must examine, the
technical aspects (replacement costs and adjustments and other value affecting characteristics)
and the market aspect (Adjustment based on market evidence).
However there could also be a third method of integration: the depreciation. Valuers might
favor the inclusion of depreciation in the sense that the deprecation contains not only the
technical aspects of the building, but also the remaining economic lifetime. From this point of
view it might be possible for the valuer to integrate the influence out of the market. E.g. one
might assume that buildings of a certain poor thermal quality will not be marketable in the
future. This fact would result in a reduction of the remaining economic lifetime. This situation
might occur if energy efficiency is bad, i.e. generate very high energy costs, which may lead
to a high vacancy rate and the remaining economic lifetime drop to de facto zero.197 Currently
there is no way of quantifying the influence on the remaining economic lifetime with respect
to the EPC.
Therefore the inclusion in this parameter is not preferred at the moment.
While at the first glance another way of integrating energy efficiency might be calculating the
future gains when compared to the higher costs of energy investments. However, the
calculation of energy savings and transfer to e.g. a present value does not agree with the cost
approach. By definition the cost approach only regards cost and therefore neglects possible
future gains. Hence by application the valuer accpts this systematic implicitly and must not
combine it with others. Future gains discounted to a present value are the hallmark of income
related approaches.
The valuer can integrate the market effect in a better and more comprehensible way by using
adjustments based on market evidence. From the technical side an integration into deprecation
197 Cf. Kleiber, W., Simon, J. (2007), p.1850

WORK PACKAGE 7 WORKING PAPER REPORT D7.2
181
IMMOVALUE – IEE/07/553/SI2.499204 Page 181
due to properties’ age seems not to be a reasonable possibility either. While thermal
renovation improves the overall quality of a building, not every renovation necessarily
improves the thermal quality. Even if a building is refurbished, the energy efficiency has no
effect on the remaining economic lifetime. One should not confuse cause and effect. A
building in good condition with high quality thermal component can have a positive effect on
the fictive age of the building and consequently on the efficiency level, but not vice versa.
Therefore the valuer can better integrate the market- and technical effect within other
positions in the valuation approach. However one should be cautious concerning possible
redundancies. In a valuation process redundancies are not allowed. This means that a single
effect can only be considered once; so the splitting into market and technical effect is far more
important. Both effects can be seen as a single effect that must be considered separately.
Similarly, both effects need a statement in the valuation report for their application.
The valuer can integrate the technical effect into the replacement costs and/or adjustments
(other value affecting characteristics). The integration depends on the construction
parameters. If a certain design construction is included in the level of quality of standardized
replacement costs, the integration of this design is already ensured through the use of this
parameter. Only constructions that are not included in the level of quality must be adjusted for
by the valuer(through other value affecting characteristics). As far as the market effect is
concerned, there is only one clear possibility for integration: adjustment based on market
evidence. The following Table 31 reviews the integration of the market and technical effects
into the cost related approach.

WORK PACKAGE 7 WORKING PAPER REPORT D7.2
182
IMMOVALUE – IEE/07/553/SI2.499204 Page 182
Table 31: Integration of technical and market effects
Table 31 shows only the general possibility. A common solution for the cost approach for all
countries or regions is impossible because of the different characteristics of the regional and
national property markets.
In this context, the valuer must differentiate between developed and undeveloped/emerging
markets. This differntiation leads to two different procedures to integrate the energy
certification into the cost approach. The developed market in this context is characterized as a
very transparent market, where market data - and in particular market data about the “green
value” of energy-efficient properties - are available. In this scenario, the appraiser only
requires the right data and experience to integrate this information into the valuation process.
In contrast, undeveloped markets have little to no market data regarding the quantifiable value
of a “green building.” In this case it is much more difficult for the valuer to integrate
information into the cost approach. The huge difference between the developed and the
undeveloped market with regards to the cost approach is the quantification of the market
effect sincethe procedure to quantify the technical effect for both markets is nearly the same.
Therefore this report will give a detailed description in the following sections.

WORK PACKAGE 7 WORKING PAPER REPORT D7.2
183
IMMOVALUE – IEE/07/553/SI2.499204 Page 183
6.4.5.3 Methodology for developed markets
A market is regarded as developed if sophisticated data on energy efficiency buildings’
attributes is available to the valuer. It is easier to quantify the market effect of energy-efficient
buildings which provides easy access to the information that the valuer can be use for
valuation. In general this information is available in two types. The easiest and more
comfortable may be described as the situation, where the country’s information about the
adjustment of the market effect are published. The quantification information is current and
available for the appraiser to integrate it into the valuation with the aid of the cost approach.
The second possibility might be the situation wherein the data are available in “raw form.”
Such data include the transaction price, the calculated cost value, the EPC and the
characteristics of the property. This implies that the valuer must calculate the adjustment
based on market evidence. The following chapters explain the two ways of calculating
adjustments further.. Figure 51 demonstrates the process of integration in developed markets.
Figure 51: Process of integration in developed markets (Cost Approach)
The first step to obtain the relevant information is to acquire the energy certification and
analyze it. Each country has a specific energy certification, hence the information from the
energy certifications are different. However, all EPCs have one thing in common. One can use
them as an indicator for as to how efficient or inefficient the energy consumption of a
building is. If the building has a good energy certification the valuer needs to analyze why. It
needs to be clear what type of construction leads to a high level of energy efficiency. The

WORK PACKAGE 7 WORKING PAPER REPORT D7.2
184
IMMOVALUE – IEE/07/553/SI2.499204 Page 184
valuer can then split this type of building configuration in order to evalute the effect of
construction (insulation of façade) and the effect of structural engineering (solar heating
system).
In Germany e.g. the replacement costs (NHK or BKI) are split into construction (300
Bauwerk – Baukonstruktion) and structural engineering (400 Bauwerk – Technische Anlagen)
accordingly to the standards of DIN 276. These two types of costs are listed in detail in the
DIN 276-1.198 If an effect leads to a posative energy performance is not included in this list,
the valuer must account for the technical effect in the adjustments. Furthermore, it is possible
that the equipment was overpriced and/or such equipment might not be necessary to reach a
specific level of energy efficiency. Consider a house with an efficient heating technology and
a facade with a thermal insulation, both categories may lead to a higher level of thermal
efficiency, for example, from medium to high quality. This in turn influences the costs, which
are higher for the high quality compared to the medium quality. After this step, the valuer
should integrate all technical effects connected to this issue into the valuation process where
the resulting value of the property is based on costs. Because of the different local
characteristics a specific quantification seems not meaningful.
The recently published study by CBRE shows that in 2009 the additional costs associated
with the development of a low-energy building compared to a basic house raise the
construction costs by approximately 2 % to 3 %. The construction of a greener and even more
energy-efficient building designed to achieve higher standards of accreditation is likely to add
between 5 % and 7.5 % to the construction costs. The development of a zero-carbon building
(even higher than levels of BREEAM and LEED accreditation) adds a construction cost
premium of around 12.5 %199. The costs of developing a green building, relative to those of a
conventional one, ranges between 2 % and 7 % depending on the level of accreditation.200 The
study by Kats 2003 based on 33 office and school buildings suggests only 0.6 % higher costs
for LEED certification, 2.1 % for silver, 1.8 % for gold and 6.5 % for platinum
certification.201 The survey by Miller, Spivey and Florance 2008 shows a table of extra costs
for LEED certifications by region of the USA.202
198 Cf. DIN 276-1 (1993), pp.5 199 Cf. CBRE (2009), p.3 200 Cf. CBRE (2009), p.14 201 Cf. Kats, G., et al, (2003), p.15 202 Cf. Miller, N., Spivey, J., Florence, A. (2008), p.12

WORK PACKAGE 7 WORKING PAPER REPORT D7.2
185
IMMOVALUE – IEE/07/553/SI2.499204 Page 185
Market Platinum Gold Silver UCSB Ave. 7.8% 2.7% 1.0%
San Francisco 7.8% 2.7% 1.0%
Merced 10.3% 5.3% 3.7%
Denver 7.6% 2.8% 1.2%
Boston 8.8% 4.2% 2.6%
Houston 9.1% 6.3% 1.7%
Table 32: Extra costs to go green vary by region203
One may notice on closer examination that a huge difference exists between the different
American cities used in the survey. One factor affecting the cost to go green is the effects of
the mandates and incentives provided by local governments, utilities, other non-profit
organisations, trusts and foundations. If a city such as San Francisco requires gold
certification by 2012 on office projects larger than 50.000 square feet, the marginal costs of
achieving LEED certification up to the gold level becomes zero since there will be no
alternative.204
This aspect and the fact that these studies have been conducted outside Europe, leads to the
opinion, that these quantifications should be used carefully. In addition these studies do not
only take the energy efficiency into account, they are focusing on a broader range of green
building aspects. Due to the aforementioned, one should not apply these figures completely
for the purposes discussed in this analysis.
It is essential that the valuer examine European studies to get an overview of the
quantification of energy efficiency. There are only a few that are applicable in this context.
Belz and Egger (2000)205 gives a general overview for different studies combining energy
efficiency and construction costs. They quote a study from Germany (1994) finding that low
energy consumption houses (Niedrigenergiehaus: energy indicator heat demand (HWB) <
50kWh/m²/a) have about 4 % higher construction costs than normal buildings. However, the
study pointed out that there is a high margin of deviation, what means that there is a huge
potential to build cheaper. Belz and Egger (2000) also analyzed a study from Switzerland
(2000) that came to the conclusion that houses with a lower heat demanded energy indicator
(lower amount of heat demanded energy consumed per unit) (HWB) of 45 kWh/m²/a have
203 Cf. Miller, N., Spivey, J., Florence, A. (2008), p.12 204 Cf. Miller, N., Spivey, J., Florence, A. (2008), p.10 205 Cf. Belz, F., Egger, D. (2000), pp.6

WORK PACKAGE 7 WORKING PAPER REPORT D7.2
186
IMMOVALUE – IEE/07/553/SI2.499204 Page 186
about 9 % higher investment costs. This study also noticed a high volatility in cost, which
varied between 4 % and 13 %. All studies conclude that primary additional thermal insulation,
building services and windows with higher insulation are the main cost drivers.206 A Study
from Austria 207 found 7 % higher costs for upgrading from a Niedrigenergiehaus (heat
demanded energy indicator (consumed per unit) (HWB) < 50 kWh/m²/a) to a passive house
standard for social residential buildings. This study also included the costs of living space
ventilation.
One can derive another example of the quantification of energy efficiency from the previously
mentioned BKI costs. The subsequent example shows an easy way to quantify the technical
effect. One can obtain higher energy efficiency with better thermal insulation. In particular,
the thermal insulation affects the properties of the façade. The BKI costs describe this cost
type as 330 external wall. The following table shows the costs for single respectively double
houses. In addition, the costs for category 420 (heat generation) are also listed.
Type of single/ double house cost type from
[€/m² BGF] to
[€/m² BGF] Mean
[€/m² BGF] low with cellar 330 external wall 141,29 252,84 186,44 medium with cellar 330 external wall 195,21 427,28 280,25 medium with no cellar 330 external wall 234,36 483,21 336,96 high with cellar 330 external wall 263,44 398,95 323,95 high with no cellar 330 external wall 346,92 470,34 406,35 passive house 330 external wall 337,56 568,89 433,75 low with cellar 420 heat generation 39 64 50 medium with cellar 420 heat generation 48 117 72 medium with no cellar 420 heat generation 54 115 73 high with cellar 420 heat generation 78 110 90 high with no cellar 420 heat generation 79 158 129 passive house 420 heat generation 22 72 45
Table 33: BKI – cost categorys 300/400208
The Table 33 shows that there are relatively huge differences between the types of houses.
One can better observe this effect in the following Figure 52, where the x-axis shows the type
of houses and the y-axis gives the information about the costs.
206 Cf. Belz, F., Egger, D. (2000), p.8 207 Cf. Schöberl, H., et al, (2004), p. 153 208 Cf. BKI (2008)

WORK PACKAGE 7 WORKING PAPER REPORT D7.2
187
IMMOVALUE – IEE/07/553/SI2.499204 Page 187
Figure 52: BKI – cost category in connection to property type (costs in €/m² BGF)
Table 33 and Figure 52 show the highest, lowest costs and the mean of the cost type 330
(external wall). One can also track the additional costs for better external wall constructio to
the cost type 300, and thus 300+400, which are the basis of the BKI. However, cost types
300+400 are not representative of the complete construction costs. Categories like coverage
of the area or ancillary construction costs are missing.
Of course the adjustment factor is highly dependent on the basis used. The calculated
adjustment factor over the 300 category is higher than the factor based on 300+400 that, by
definition, must be higher than 300.
Consider the following example. Two identical buildings in the single houses with a low
quality thermal quality category that only differ in the thermal insulation. (one building's
properties for the external wall are like single houses with medium quality) This difference
leads to 5 % higher costs compared to the cost type 300+400. The factor based on cost type
300 might be 9 % in this case. In an extreme case of a low quality house where the external
wall has the properties like a passive house, this might lead to approximately 15 % higher
costs compared to the cost type 300+400.

WORK PACKAGE 7 WORKING PAPER REPORT D7.2
188
IMMOVALUE – IEE/07/553/SI2.499204 Page 188
Again we must emphasize that there is a huge deviation between lowest and highest costs.
These results match the findings of the studies from Belz and Egger (2000). The following
Figure 53 gives a small conclusion of the calculation of the additional costs.
Figure 53: BKI – Quantification of energy efficiency
The previous classification is only a very rough approximation and cannot be directly
included into the valuation process. Rather than delivering a basis for valuation, this only
serves as an indicator for past construction costs. These adjustments must not be included if
the energy efficiency is included at other levels in the valuation process. Adjustments are only
necessary if discrepancies within the different levels exist. This could be the case where the
quality of the wall deviates from the quality of the rest of the buildings. Such a situation
explicitly leads to the need of an adjustment of the BKI values. However, this method is
restricted to the previous mentioned cases only. <tt is advisable to calculate replacement costs
following the standardized methods of the BKI or NHK since energy efficiency is already
included in these categories.
Often enough, however, the cost of a property often does not equate to the willingness to pay
of the consumer so one must also consider the market aspects. A valuer should perform the
adjustment based on market evidence. Such a quantification of market evidence could come
from current regional publications or calculations with available data. The probability that
current regional adjustments based on market evidence are published is very low. If there is a
good database for market evidence on green or energy-efficient buildings is available, the
valuer can calculate market effect.

WORK PACKAGE 7 WORKING PAPER REPORT D7.2
189
IMMOVALUE – IEE/07/553/SI2.499204 Page 189
In general, the calculation of adjustments based on market evidence is one of the most
difficult tasks in the valuation process. It hinges on the the local property market’s current
situation and the ability for the valuer to identify the ratio between the real market value and
the calculated cost value.209 The ability for the valer to calculate adjustments based on market
evidence is not a problem specific to the context of energy efficiency, it is also a general
problem for valuation a a whole. The literature gives two types of calculations based on the
same idea. For both calculations the valuer must know the real market value and the cost
value. However, it is a huge challenge to identify both pieces of information. One can obtain
the market value from the contracts, but the cost value in a valuation report.. If a valuer
prepares many reports, the valuer has both values. However, if valuer does not have any
information about the local market, he has to obtain information from other valuers.
The first approach depends on an easy linear regression model where the cost value and
market value are set in relation to each other.
(48)
Y contains the market value; x is the cost value and is the error term, which contains all
factors not explainable. The prime reason for performing this regression is the parameter ,
which can be interpreted as the adjustment.210 If has a value above one, the cost value is
lower than the market value. In contrast, a value lower than one means that the cost value is
higher than the market value. This means that the market is not willing to pay the full
calculated cost value. If the parameter and are known the market value can be
calculated by adopting the cost value (X). The calculation of the market value ( ) follows like
this:
(49)
The second method to calculate the market premium is more common. The method, which
follows Kleiber211 and the market premium respectively, adjustement can be calculated as
follows.
(50)
209 Cf. Simon, J., et al.. (2004), p.467 210 Cf. Simon, J., et al.. (2004), p.473 211 Cf. Kleiber, W., Simon, J. (2007), p.1911

WORK PACKAGE 7 WORKING PAPER REPORT D7.2
190
IMMOVALUE – IEE/07/553/SI2.499204 Page 190
Consequently, one must derive the market adjustment from the local property market.
However, the market must contain ample available data that statisfy multiple requirements.
The valuer has to know the cost value and the market value from past comparable transactions
to calculate the adjustment for the local property market. Therefore the valuer must be able to
obtain not only the values of past transactions but the valuer must also pay have access to
other relevant characteristics. If there are enough transactions, the valuer can calculate the
adjustment factor like this:212
(51)
In a transparent market such as Germany the valuer can obtain these indicators from the so-
called German committee of valuation experts, the Gutachterausschüssen. One must then
calculate an adjustment factor for each transaction. If there are enough observations, the mean
can be calculated and the adjustment used. If the adjustment factor is bigger than one, the
market value is higher than the cost value. This investment is less than the intrinsic value of
the object. If the adjustment factor is lower than one, the intrinsic value is higher and the
market reflects lower value than the costs. One should note that the the market factor is
calculated from past transactions and has no direct connection to future prospects. The market
value can now be calculated by the cost value multiplied by the adjustment factor.
(52)
The adjustment factor refers to the building and the land so there is no way of distinguishing
between the two. This case clarifies that the adjustment factor is one entity and It is
impossible to distinguish different effects. Therefore, a clear classification for the diverse
effects is not possible. By taking this into accout it is vital to regard the rule of conformity of
the system. In general this involves two facets:213
(1) Conformity of the valuation approach
(2) Identical input parameters
When using factors that were empirically derived, the method of derivation has to be the same
as the one in the current valuation approach. Hence, to calculate the cost value of the object,
the valuation approach must be completely identical to the valuation process used to calculate
212 Cf. Kleiber, W., Simon, J. (2007), p.1912 213 Cf. Kleiber, W., Simon, J. (2007), p.1912

WORK PACKAGE 7 WORKING PAPER REPORT D7.2
191
IMMOVALUE – IEE/07/553/SI2.499204 Page 191
the adjustment factor. However, the method is not the only aspect that must remain the smae.
The input parameters must also be nearly the same in order to get consistent results . The
market factors of the cost value are primary dependent of:214
(1) Sort of the building
(2) Age of the building and depreciation type
(3) Level of the cost value
(4) Status of the country
(5) Characteristic of the building
Figure 54: Possible classification of Austrian energy certification
In order to isolate the market effect, the valuer may onlycompare buildings with the same
characteristics for the same reason. It might be more easy for a valuer to collect and
categorize the buildings in the right way with the help of a description sheet such as the
following.
214 Cf. Kleiber, W., Simon, J. (2007), p.1913

WORK PACKAGE 7 WORKING PAPER REPORT D7.2
192
IMMOVALUE – IEE/07/553/SI2.499204 Page 192
Figure 55: Process of integration in developed markets
This process guarantees that identical parameters are compared and that the market effect
from the energy side can be identified.
However, one should emphasize that the technical effect should be identified and calculated
first. The valuer should also check if the costs are integrated in the standardized replacement
costs or not. If the additional costs are not integrated they have to be integrated by
adjustments (other value affecting characteristics). The next step is more difficult than the
quantification of the technical effects. There are two possibilities to obtain quantified market
effect. If there are market adjustments available from the advisory committee
(Gutachterausschuss) the systematic for calculating adjustments has to be disclosed. If the
system is equal to the own valuation the adjustment can be adopted directly. If there are no
adjustments available from advisory committees, the valuer must calculate the adjustments.
This can only be done if representative data exists. One can calculate the adjustments via the
method described above. In this context it must be mentioned that this can be only established
in developed respectively transparent markets.. So a solution must also be developed for
undeveloped respectively emerging markets.
6.4.5.4 Approach for “undeveloped/emerging markets”
On one hand, the label developed market describes a market where limited data concerning
green/energy-efficient buildings available (e.g. Germany, Austria, etc.) and on the other hand,
there are markets that in general have limited availability of property market data (e.g.
Emerging markets like Romania, SEE-countries, etc.). For the emerging markets, data

WORK PACKAGE 7 WORKING PAPER REPORT D7.2
193
IMMOVALUE – IEE/07/553/SI2.499204 Page 193
availability is difficult in general let alone specific problem of valuing energy-efficient
buildings. In principle, however, the approach for both cases is the same.
Figure 56: Process of integration in undeveloped markets
The first and second steps are the same as in the approach for “developed markets.” In this
sense, analyzing the energy certification and identification of the technical effect does not and
cannot differ from the work previously mentioned. If there are no standardized replacement
costs like the NHK or BKI in Germany, the valuer can adjust the costs with country specific
factors. For example, the BKI from Germany can be used for Austria if they are adjusted with
a published local factor.215 So the NHK from Germany can be used for the Austrian market
and therefore must be adapted with the published factor for Austria. In extreme cases it might
be necessary for the valuer to obtain offers from local developers and construction companies.
The huge difference between the two markets lays in how the value r identifies of the market
effect. Because there is no market data available, the valuer cannot obtain a direct
quantification. One must derive the market effect from so called “soft facts”. The valuer
should use these soft facts as an instrument to get an overview as to how green buildings are
observed in the market. Examples of soft fact that a valuer could use might include: oil price,
public opinions in local newspapers, availability of energy in the region, market structure etc.
Since the price of heating oil and pellets or other heating resources move in correspondence to
the oil price. If the oil price is high, heating costs are high as well. Therefore, the public gets 215 BKI, (2008)

WORK PACKAGE 7 WORKING PAPER REPORT D7.2
194
IMMOVALUE – IEE/07/553/SI2.499204 Page 194
more sensitive to the energy topic. Some analyses show that consumers react to rising energy
costs with a rise in overall cost awareness.216 Time period also plays a huge role, especially
concerning the price of oil. In the short run, however, falling oil prices may inhibit the
adoption of green buildings by reducing the absolute scale of the achievable cost saving. So if
the oil price is low the demand for energy-efficient buildings will also be low.217 A study from
Tayler Wessing shows that consumers are increasingly adopting a more holistic, long-term
approach to the costs of a building. In the long run, a good energy certification has a higher
impact on the willingness to pay.218
A valuer can use local newspapers as another indicator of the relevance of energy-efficient. If
the newspapers publish a lot about topics like energy, energy certification, green buildings,
etc., one can interpret this to mean that public interest lays in green/energy-efficient buildings.
For integrating green factors into property valuation, the appraiser needs a high knowledge
about the market structure. If the local market is dominated by high demand, the energy
efficiency may not be as important as in a market where a huge supply exists. In an offer
driven market, sellers can use the energy certification as a marketing instrument to increase
the marketability. However, in areas where the energy sector is central, cheap and
independent from the international market, energy efficiency is not a huge topic among
consumers. One such example might include rural areas that organize their heating system
centrally with their forest industry. Indicator effect Sensitive of energy certification
Oil price Oil price rising up ↑
Public opinion Many articles about energy -
green
↑
Market structure Offer-driven market ↑
Demand-driven market ↓
Table 34: Indicators to quantify markets awareness for energy efficiency
A clear quantification of the market effect is very difficult in undeveloped markets. The
valuer must observe and audit all previously mentioned aspects critically. In addition to these
aspects, valuers should obtain the opinions of local market actors like real estate agents,
216 IZ, (2008), p.11 217 Eddington, C., Berman, D., Hitchcock, D., et al. (2009), p.14 218 Barnett, K., Fitzpatrick, D., Garthwaite, H., et al. (2009), p.31

WORK PACKAGE 7 WORKING PAPER REPORT D7.2
195
IMMOVALUE – IEE/07/553/SI2.499204 Page 195
developers or real estate administrators. Table 36 can only be used to get a feeling for market
structure.
One possible and appropriate way for a valuer to quantifying the market effect in an opaque
market focusing on energy efficiency might be through the use of a scoring model. For that
reason a so-called “weighted adjustment for valuation parameter effecting characteristics”
(WAPEC) was established by IMMOVALUE as a first indicator for property valuers, which
is also used in a different way in the income approach.
The idea for this scoring model is based on the additional costs between reference buildings in
the market and the valuated building. The remainder is the basis for the calculation. This
value is referred to as AAP. This amount is then multiplied by the “market adjustment rate”
(MAR), which can be seen as quantification for the markets’ attention and resulting from the
willingness to pay for energy-efficient buildings. In other words the AAP is weighted by the
MAR. Hence the adjustment is the product of MAR times
AAP.Key Valuation ParameteMarket maturity
Additional costs -high price elasticity- high awareness of users for sustainability and energy efficiency- omnipresence of green building issues in the media
- market postulate green buildings standards/codes
- good general economic condit ions- …
x x+/- [€] --> AAP derived from remaining amount between reference buildings and valuation building
x x+/- [%] --> Valuers estimation adjustment due to probability of occurrence, uncertainty, etc. regarding the AAP
= =
+/- [€] --> = MAR x AAP x VEA
= [€]
- media does not recognise green buildings benefits at
ll- majority of property market is not willing to pay higher costs for green buildings
+/- 25 - 75 % +/- 0 - 25 % +/- 0 %
--> Weighted Adjustment Factor (WAF)
Adjustment based on Market Evidence
Market adjustment rate (MAR) +/- 75 - 100 %
Average adjustment parameter (AAP)*
Valuers estimation adjustment (VEA)**
- …
Opaque (Emerging) Market --> Discount for energetic building
--> Premium for non-energetic building
-low price elasticity- tenants do not pay attention on sustainability and energy eff iciency at all
Significant adjustment Medium adjustment Low adjustment neutral
- suffering economic situat ion
Figure 57: Example of WAPEC for Adjustment based on market evidence
At the maximum the adjustment equals the AAP and zero at a minimum. One must use
thefollowing approach when using the scoring model:
(1) Identify the market situation with WAPEC (MAR)
(2) Identify typical market rating in relation to energy efficiency (reference buildings)
(3) Compare rating between reference buildings and valuated object
(4) Calculate costs (remaining amount) between reference buildings and valuation
building (AAP)

WORK PACKAGE 7 WORKING PAPER REPORT D7.2
196
IMMOVALUE – IEE/07/553/SI2.499204 Page 196
(5) Multiply the remaining amount (AAP) with the market adjustment rate (MAR) and
Valuers estimation adjustment (VEA).
(6) Use the WAF (in €) as adjustment based on Market evidence
A word of warning, if the valuated building has a higher level of energy efficiency than the
reference buildings and energy efficiency does not play a role in the market, this method leads
to a discount. However the method will also lead to a discount if the valued building has a
lower level of energy efficiency than the reference buildings and energy efficiency plays a
role in the market.
The following chapter features two case studies that further explain the previous contentions
with the aid of valuation examples. The first case shows two different types of houses.
The first house is a passive house and the second a low thermal quality level house. The
technical effect is directly integrated into the replacement costs. In the second case the
buildings have the same characteristics except for the energy efficiency. In this case the
replacement costs are the same, but the building with the higher energy efficiency features a
higher premium. The first case study shows the calculation of an adjustment based on market
evidence in a transparent market. In the second case study shows an adjustment based on
market evidence derived from an undeveloped market.
6.4.5.5 Case Study 1 – Basic makeshift for transparent markets
In this case, there is available information about cost value and transaction prices of current
transactions. The calculation assumes that the characteristics of the buildings (e.g. size,
location, etc.) with the exception of energy efficiency levels, are the same. Therefore we
impose a ceteris paribus condition with an exception for this one key characteristic so thet the
adjustment factors for the two buildings can be calculated like this:

WORK PACKAGE 7 WORKING PAPER REPORT D7.2
197
IMMOVALUE – IEE/07/553/SI2.499204 Page 197
Table 35: Calculation adjustment factor – type of house: passive
Table 36: Calculation adjustment factor – type of house: low energy efficiency
In this case, the adjustment factor for the passive house is higher than for a non-energy-
efficient building. This indicates a lower willingness to pay for energy efficiency. The costs
for a passive house are too high and not honoured by the market in the full height.
Cost value + value of land
Transaction prices HWB Adjustment factor same properties like
valuation object 420.000 336.000 10 0,80 Yes 390.000 331.500 15 0,85 Yes 360.000 306.000 10 0,85 Yes 310.000 279.000 8 0,90 Yes
Average Adjustment factor 0,85
Cost value + value of land
Transaction prices HWB Adjustment factor same properties like
valuation object
280.000 280.000 180 1,00 Yes 250.000 225.000 200 0,90 Yes 290.000 275.500 160 0,95 Yes 270.000 256.500 170 0,95 Yes
Average Adjustment factor 0,95

WORK PACKAGE 7 WORKING PAPER REPORT D7.2
198
IMMOVALUE – IEE/07/553/SI2.499204 Page 198
Case 1: Different type of houses (passive/low)
Generel Information
energy indicator heat demand 10 kWh/m².a 180 kWh/m².a
year of construction 2006 2006
Remaining economic lifetime 77 years 77 years
Total area in local size unit (BGF)
180 m² 180m²
Price per m² (Area = 600m²) 200 €/m² 200 €/m²
Type/level passive standard Low thermal quality standard
Assumptions valuation
Replacement costs (new) in €/m² BGF
Cost type 300+400 1140 €/m² 710 €/m²
Ancillary construction costs (%) 30% 28%
Calculation
Replacement costs (new) of the building
266 760 € 163 584 €
Further adjustments none none
Depreciation factor 77/80 = 0.96 77/80 = 0.96
Value of building in € 256 089 € 157 041 €
Value of Land in € 120 000 € 120 00 €

WORK PACKAGE 7 WORKING PAPER REPORT D7.2
199
IMMOVALUE – IEE/07/553/SI2.499204 Page 199
Value of property in € based on costs
376 089 € 277 041 €
Adjustment based on market evidence (factor)
0.85 (see calculation adjustment factor)
0.95 (see calculation adjustment factor)
Market Value 319 676 €
~ 320 000 €
263 189 €
~ 263 000 €
Table 37: Case 1: Different type of houses (passive/low)
Case 1 shows that the whole technical effect is already integrated in the replacement costs.
Therefore no further adjustment needs to be done by the valuer concerning the technical
effect. However, the market effect does differ between the two buildings. In this case the
market does not honor the passive house in a sense that the value is lower than the costs. This
leads to an adjustment factor of 0.85. In contrast the low thermal quality standard house has
an adjustment factor of only 0.95. In this case the market value between a passive house and a
low standard house is € 57 000.
6.4.5.6 Case Study 2 – Basic makeshifts for opaque markets
Contradictory to a transparent market, there is no detailed information on energy efficiency or
EPC available in case two. Due to the lack of evidence, appraisers first have to evaluate the
current property market situation to determine if, and to which extend, the market already
recognizes and cares about energy efficient buildings in general.
According to these investigations the valuer found that:
(1) The property market and media already recognised the importance of energy and
resource efficient properties and started to establish a broad sense for sustainability
agendas due to rising energy prices, etc.
(2) The reference buildings that the market accepts have an energy indicator heat
demand of 50 kWh/m².a.
The above stated market aspects lead valuers to evaluate the market maturity by applying the
WAPEC-approach as illustrated in Figure 58:

WORK PACKAGE 7 WORKING PAPER REPORT D7.2
200
IMMOVALUE – IEE/07/553/SI2.499204 Page 200
Key Valuation ParameteMarket maturityAdditional costs -high price elasticity
- high awareness of users for sustainability and energy efficiency- omnipresence of green building issues in the media- market postulate green buildings standards/codes
- good general economic condit ions- …
x x+/- [€] --> AAP derived from remaining amount between reference buildings and valuation building
x x+/- [%] --> Valuers estimation adjustment due to probability of occurrence, uncertainty, etc. regarding the AAP
= =+/- [€] --> = MAR x AAP x VEA
= [€]
Significant adjustment Medium adjustment Low adjustment neutralOpaque (Emerging) Market --> Discount for energetic building
--> Premium for non-energetic building
- tenants do not pay attention on sustainability and energy eff iciency at all- media does not recognise green buildings benefits at
- majority of property market is not willing to pay higher costs for green buildings
- suffering economic situat ion- …
Market adjustment rate (MAR) +/- 75 - 100 % +/- 25 - 75 % +/- 0 - 25 % +/- 0 %
Average adjustment parameter (AAP)*
Valuers estimation adjustment (VEA)**
--> Weighted Adjustment Factor (WAF)
Adjustment based on Market Evidence
-low price elasticity
Figure 58: Case 2: Example of WAPEC for Adjustment based on market evidence
As result the observed market achieves a “medium” rating and therefore can be rated with a
market adjustment rate (MAR) of approx. 50 %. In the second step, the valuer pointed out that
reference buildings accepted in the market have an energy indicator heat demand of 50
kWh/m².a. Next, the valuer must calculate the the costs (remaining amount AAP)between
reference buildings and the valuation building. The bases for the calculation in this example
are the replacement costs (cost type 300+400). In this case, we assume the replacement costs
at 710 EUR/sqm. We assume 5 % higher replacement costs toupgrade a 50 kWh/m² house to
a 10 kWh/m².a object (object 1). Furthermore, for the second object we assume 10 % higher
replacement costs in order to upgrade a 180 kWh/m².a house (object 2) to a 50 kWh/m².a
object. One must then multiüply the remaining amount (AAP) with the market adjustment rate
(MAR) and the valuers estimation adjustment (VEA). After this process the valuer gets:
Table 38: Case 1: Adjustment for valuation object 1
Valuation object Reference object AAP MAR VEA
10 kWh/m² 50 kWh/m² € 6,400 (5%x 710x180) 0,50 0,8 Adjustment based on market evidence (MAR x APP x VEA) - € 2560

WORK PACKAGE 7 WORKING PAPER REPORT D7.2
201
IMMOVALUE – IEE/07/553/SI2.499204 Page 201
Table 39: Case 1: Adjustment for valuation object 2
The results of this calculations show that for the 10 kWh/m² building there is a discount of €
2,560. So the market does not honor a level of energy efficiency as high as the costs to reach
that level are. In contrast, the 180 kWh/m².a building gets a discount of € 5,120.
Case 2: Same type of houses (low/low) but different energy efficiency
General Information
EPC – market sense: The reference buildings which are accepted in the market have an energy indicator heat demand of 50 kWh/m².
energy indicator heat demand 10 kWh/m².a 180 kWh/m².a
year of construction 2006 2006
Remaining economic lifetime 77 years 77 years
Total area in local size unit (BGF) 180 m² 180 m²
Price per m² (Area = 600m²) 200 €/m² 200 €/m²
Type/level Low standard Low standard
Assumptions valuation
Replacement costs (new) in €/m² BGF
Cost type 300+400 710 €/m² 710 €/m²
Valuation object Reference object AAP MAR VEA
180 kWh/m² 50 kWh/m² € 12,800 (10%x 710x180) 0,50 0,8 Adjustment based on market evidence (MAR x APP x VEA) - € 5120

WORK PACKAGE 7 WORKING PAPER REPORT D7.2
202
IMMOVALUE – IEE/07/553/SI2.499204 Page 202
Ancillary construction costs (%) 28% 28%
Calculation
Replacement costs (new) of the building
163 584 € 163 584 €
Further adjustments 15% (of cost type 300+400)
= 19170 € (106,5 €/m²)
none
Depreciation factor 77/80 = 0.96 77/80 = 0.96
Value of building in € 175 444 € 157 041 €
Value of Land in € 120 000 € 120 000 €
Value of property in € based on costs
295 444 € 277 041 €
Adjustment based on market evidence (factor)
- 2560 € (see calculation) - 5120 € (see calculation)
Market Value 292 884 €
~293 000 €
282 161 €
~282 000 €
Table 40: Case 2: Same type of houses (low/low)
Case 2 shows two identical buildings that only differ in energy efficiency. Both buildings
have the same replacement costs for their standard level. The building with the higher energy
efficiency had an adjustment of 15 % applied for the cost category 300+400. This is because
it costs approximately 15 % more to obtain a 10 kWh/m² standard house from a 180 kWh/m²
object. This integration covers the entire technical aspect. In this case, the market honors the
energy efficiency less than the costs. The energy efficient house has been discounted by 2,560
EUR. This is due to the fact that the market does not honor energy efficiency as one might
expect for 10 kWh/m².a. In contrast, the 180 kWh/m².a house has lower energy efficiency
than the market asks for. Since the market equilibrium lies at 50 kWh/m².a the discount is at
5,120 EUR instead of 12,800 EUR. Therefore a further improvement of the building shell
down to 10 kWh/m².a would not be valuable.

WORK PACKAGE 7 WORKING PAPER REPORT D7.2
203
IMMOVALUE – IEE/07/553/SI2.499204 Page 203
7 Roadmap for Implementation (deliverable D5.3)
7.1 General Circumstances and requirements for implementation
As was mentioned previously, the degree of success when implementing green or energy
efficiency aspects into current property valuation practices depends mostly on the awareness
and willingness to pay for such attributes and ultimately on the empirical evidence the
property market provides. That means that if the market does not pay attention to energy
performance attributes as well as realise the advantages to such attributes, it is hard to
provoke the related changes in property valuation practice. Therefore one of the fundamental
requirements for the implementation of any new aspect and approach is the markets’
sensitivity to such aspects. This awareness must exist in order to realize the aforementioned
changes.
This paradigm shift in the property markets towards sustainability and energy efficient
products can be attributed to rising omnipresence of climate change and related debates in the
public media as well as the fact that governments, industry and key decision makers have
already started to establish incentives (government aid for sustainable developments),
mandatory regulations (e.g. EPBD, building quality standards), intercontinental agreements
and commitments (e.g. Kyoto-Protocol), research programs, etc. to propagate the importance
of properties’ sustainability and energy efficiency.
Therefore it is important that valuers key integrate national and international organisations
responsible for property valuation guidance and standards in order to achieve a broader
acceptance of the property valuation society. It should be obvious, due to the fact that the
majority of European national valuation standards refer to the RICS (Red Book) or TEGoVA
Valuation Standards (EVS), that the valuation should include such organisations in the
establishment of new valuation methodologies or the adaption of the international recognised
methodologies. Whereas standards such as RICS or EVS just publish descriptive guidance
notes for property valuation, a few national standards e.g. the Austrian valuation law and
regulations (LBG, ÖNORM) or the upcoming German valuation ordinance (ImmoWertV
2009) go beyond the descriptive and encompass methodological explanations. Hence this
report illustrates both – a descriptive guidance for the integration of energy
efficiency/sustainable features (see Chapter 6.3) and an investigation of possible valuation
adjustment methodologies (see Chapter 6.4).

WORK PACKAGE 7 WORKING PAPER REPORT D7.2
204
IMMOVALUE – IEE/07/553/SI2.499204 Page 204
7.2 Main obstacles for integration into property valuation standards
Valuers must solve three main critical obstacles (see Figure 47), in addition to the already
mentioned implementation requirements in order to increase the acceptance and achieve an
implementation of different established property valuation adjustment methods. , have to be
solved.
Critical Obstacles Action Useful Tools Solution
Practical Application
Testing of applicabiltiyand reliability of established approach
• Performing Pilot Projects • Receive comprehensive evidence and rational constituted results
• Quantifying and integrating analysis and results to improve applicability
Property Market Acceptance
Review Process • Enforcement of Expert Surveys• Evaluation by valuation experts
• Incorporation of survey results
• Organising expert advisory meetings
• Consideration of feedback and improvement guidance to receive best practice
General Popularity and Recognition
Communication and Dissemination
• Integration of national and international key valuation organisations
• Communication activities to key valuation companies and experts
• Information for valuation customers• Information of broader public
• Co-operation w ith key valuation organisations (RICS, TEGoVA)
• Organising valuation expert meetings
• Participation at trade fairs, conferences, etc.
• Publishing press releases, scientific papers and articles
Figure 59: Critical Obstacles for Implementation into Valuation Standards
First of all it is important that the established adjustments of the valuation approaches are
feasible, reliable and applicable so that that can be easily handled and applied by property
valuers. If the methodology is not simple the chance that the valuer could create misleading
reports is high. Thus it is necessary that the approaches are tested and applied in pilot projects
like the Swiss ESI-Valuation (see Chapter 5.1.2.2.1) and not remain solely as a theoretical
concepts. In addition, it is important to quantify, analyse and integrate the results of
performed pilot projects to improve the applicability in order to produce the best approach. If
an applicable and reliable approach is on-hand, a good basis exists to reach a high acceptance
within the property markets and the valuation society.
To gather and bundle other views and ideas for an integration of energy efficiency and
performance aspects as well as LCCA into property valuation, an review by valuation
professionals and energy experts of the created methodologies and carrying out pilot projects

WORK PACKAGE 7 WORKING PAPER REPORT D7.2
205
IMMOVALUE – IEE/07/553/SI2.499204 Page 205
are recommended and seem to be useful to avoid a misleading development of valuation
approaches, which might not be accepted by the valuers’ society. Furthermore, the review
process also offers feedback and improvement suggestions, which may be necessary to satisfy
valuers’ interest.
Further, lack of popularity and public recognition might serve as another obstacle that could
act as a barrier to implementation despite basic consensus and observable acceptance. To
counteract such risks and pitfalls intensive communication and dissemination activities are
required to spread information and advert to the established approaches. This communication
will be the most effective if it is established via various co-ordinated communication levels
and channels. Dissemination should be done on an individual basis (e.g. participation of
individuals at conferences and trade fairs, publication of papers, etc.) and throughout bundled
channels (i.e. RICS network, national associations, etc.). Furthermore, co-operations with
educational institutions might be an appropriate way to distribute the approaches to a broad
majority of valuers and property market participants.
7.3 If the above mentioned obstacles are kept in mind avoided as much as
possible, there is a realistic opportunity to receive qualitative feedback,
improvement ideas, and broader acceptance of the approaches. Selected
roadmap for transformation and implementation
To succeed in the overall aim of establishing adequate and practical methodologies for
encompassing energy efficiency and LCCA issues into property valuation practice, it is
important to have a clear focus how to tackle the possible obstacles as explained. Therefore a
helpful tool may be to create an implementation roadmap to prevent and reduce such barriers.
Taking the given obstacles into account, the roadmap for transformation and implementation
of the created approaches into national and European-wide standards was established to
follow the subsequent progress (see Figure 51). The roadmap consists of three parts, which
cover the three main implementation obstacles that have to be terminated by explicit
application of adequate tasks and actions. These are in particular (1) the testing and evaluating
of pilot projects in a comprehensive way, (2) the enforcement of a review process by key
valuation experts, and (3) selective communication and dissemination activities.

WORK PACKAGE 7 WORKING PAPER REPORT D7.2
206
IMMOVALUE – IEE/07/553/SI2.499204 Page 206
Testing in Pilot Project
Roa
dmap
for
Impl
emen
tati
on
- Applying and evaluating themethodology in empirical studies.
- Performing a survey to quantifyvaluersestimation of future marketdevelopments.
- Quantifying and analysing the resultsand calibration ofapproachesaccordingly.
Review Process
- Enforcement of Expert Survey regarding applied approach, pilotproject, etc.
- Organising expert advisorymettingsincluding RICS and TEGoVA membersto quantify improvements.
- Establishing of revised approach andguidelines for best practicerecommendations.
Communication andDissemination
- Information and communication ofmethodology to key valuationcompanies and customers
- Information of broader public via tradefairs, participation at conferences, press releases, etc.
Increasing acceptance and possibility for integration intovaluation standards
Figure 60: Roadmap for Implementation into Valuation Standards
Action I – Testing of Pilot Projects
To assure a practical and applicable alternative valuation approach, a testing and evaluating of
pilot projects is necessary to quantify the results and consequences when applying the
established valuation approaches. In addition an electronic expert survey will be enforced and
distributed to valuation experts to quantify the current assessment of buildings energy
efficiency and LCCA aspects within property valuation practice, and the expert’s estimation
of the futures sensitivity of the property market for sustainability and green building issues.
The results and outcomes of the pilot project and expert survey afterwards will be used to
adjust the developed approach to calibrate and improve its applicability.
Action II – Review Process

WORK PACKAGE 7 WORKING PAPER REPORT D7.2
207
IMMOVALUE – IEE/07/553/SI2.499204 Page 207
A comprehensive review of the developed approach and corresponding pilot projects by
mainly property valuation experts from different professional communities (e.g. valuation
companies, valuers’ association, etc.) will be organized in order to improve and better
communicate the drafted approach.
The aim of this review process is to receive recommendations for technical improvements and
information about critical aspects which might embarrass the implementation into valuation
practice and standards. Furthermore this expert review should gain the acknowledgement and
acceptance of the property valuation society regarding the developed approach and should
lead to derived guidelines and best practice recommendations for national and international
valuation standards.
To assure a structured procedure a common questionnaire serving a general structure for the
expert feedback will be prepared. On the basis of the feedback received a conclusion will be
drawn from the theoretical models/approaches and the tested pilot project, which will be
evaluated by an expert advisory committee in a further step. The committee therefore will
discuss the results and conclusions in context of the national and international impacts on the
real estate markets. Outcomes and results of this consultancy will be integrated into a
finalized report, which will be the basis for guidelines and best practice recommendations for
national, RICS and TEGoVA valuation standards.
Action III – Communication and Dissemination
To spread out the tested and review established methodologies, and achieve that these
approaches are seen as important inputs to running standardization processes, communication
and dissemination activities will be targeted to important pressure groups in real estate
valuation practice and business (e.g. professional associations, valuation companies, etc.).
This will be mainly established via different communication and distribution channels as
stated subsequently:
publication of results, surveys and reports on the official website of the IMMOVALUE
project,
participation and dissemination at relevant trade fairs, conferences, seminars, etc.,
contribution of papers at professional real estate journals, and
information of broader public via different media such as press releases and newsletters (since
e.g. EPC concerns the public due to mandatory regulations).

WORK PACKAGE 7 WORKING PAPER REPORT D7.2
208
IMMOVALUE – IEE/07/553/SI2.499204 Page 208
IV. Bibliography
2020 Vision (2008), 2020 Vision: Saving our Energy,
http://www.energy.eu/publications/2007_eeap_en.pdf
Amt für Wohnungswesen Darmstadt (2003), Mietspiegel für Darmstadt 2003 - Zur
Berechnung der ortsüblichen Vergleichsmiete für nicht preisgebundenen Wohnraum,
Darmstadt.
Amt für Wohnungswesen Darmstadt (2008), Mietspiegel für Darmstadt 2008 - Zur
Berechnung der ortsüblichen Vergleichsmiete für nicht preisgebundenen Wohnraum,
Darmstadt.
Anglin, P. M., Gencay, R. (1996), Semiparametric estimation of a hedonic price function.
Journal of Applied Econometrics, Vol. 11, Issue 6, p.633–648.
Anselin, L. (1988), Spatial econometrics: Methods and models, Dordrecht: Kluwer.
Anselin, L., Florax, R. J., Rey, S. J. (2004), Advances in spatial econometrics: Methodology,
tools and applications, Springer, Berlin.
Appraisal Institute (2006), Code of Professional Ethics and Standards of Professional
Appraisal Practice of the Appraisal Institute, 2008th edition, Chicago.
Appraisal Institute (2008), The Appraisal of Real Estate, The Appraisal Insitute, 13th edition,
Chicago.
Appraisal Standards Board (2008), Uniform Standards of Professional Appraisal Practice
(USPAP), 2008-2009 edition, The Appraisal Foundation, Washington D.C.
Australian Property Institute, Property Institute of New Zealand (2008), Australian and New
Zealand Valuation and Property Standards, Australian Property Institute (APN) and Property
Institute of New Zealand (PINZ), 6th edition, Canberra.
Banfi, S., Farsi M., Filippini M, Jakob M. (2008), “Willingness to Pay for Energy-Saving
Measures in Residential Buildings”, Energy economics , Vol. 30, Issue 2, march 2008, p.503-
516

WORK PACKAGE 7 WORKING PAPER REPORT D7.2
209
IMMOVALUE – IEE/07/553/SI2.499204 Page 209
Belz, F., Egger, D. (2000), Nutzen und Kosten von Niedrigenergiehäusern: Empirische
Ergebnisse einer explorativen Studie, IWÖ-Diskussionsbeitrag Nr. 80, University of St.
Gallen, St. Gallen.
Besag, J., Kooperberg, C. (1995), Conditional and intrinsic autoregressions, Biometrika, Vol.
82, p.733-746.
Bienert, S., Schützenhofer, C. and Steixner, D. (2009), Property Valuation and Energy
Performance of Buildings – Approaches for integrating Energy Performance into Valuation
Practice, Scientific Paper presented at the PassiveHouse Symposium 2009, Brussels.
BKI 2008, Teil 1: Statistische Kostenwerte für Gebäude, 2. Auflage,
Baukosteninformationszentrum, Stuttgart.
Bowman, R., Wills, J. (2008), Valuing Green - How green buildings effect property values
and getting the valuation method right, Green Building Council of Australia, Sydney.
Boyd, T. (2005), Can we assess the worth of environmental and social characteristics in
investment properties?, Queensland University of Technology, Brisbane.
Brundtland Commission (1978), Report of the World Commission on Environment and
Development: Our Common Future, Annex of the document A/42/427 – Development and
International Co-operation: Environment, UN General Assembly.
Brezger, A., Kneib, T., Lang, S. (2005a), BayesX: Analyzing Bayesian structured additive
regression models, pp.1-22, in: Journal of Statistical Software (2005), Vol.14, Issue 11,
American Statistical Association, Alexandria.
Brezger, A., Kneib, T., Lang, S. (2005b), BayesX Manuals, Ludwig-Maximilans-University,
Munich, available at http://www.stat.uni-muenchen.de/~bayesx .
Brezger, A., Lang, S. (2006), Generalized structured additive regression based on Bayesian P-
splines, pp.947-991, in: Computational Statistics and Data Analysis, Vol. 50, Issue 4,
Elsevier, Amsterdam.
Chao M., Parker G. (2002), “Recognition of energy costs and energy performance in
commercial property valuation”. Recommendations and Guidelines for Appraisers. Report.
Institute for Market Transformation.

WORK PACKAGE 7 WORKING PAPER REPORT D7.2
210
IMMOVALUE – IEE/07/553/SI2.499204 Page 210
Chegut, A., et al. (2010), The Value of Green Buildings – New Evidence from the United
Kingdom, Scientific Paper for 2010 International AREUEA Meeting, Rotterdam.
Clapp, J.M. (2004), Semiparametric method for estimating local house price indices, Real
Estate Economics, Vol. 32, Issue 1, p.127–160.
Commission for Environmental Cooperation (2008), Green Building in North America –
Opportunities and Challenges, Commission for Environmental Cooperation, Montreal.
Corps, C. (2005), Green Value – Green buildings, growing assets, Royal Institution of
Chartered Surveyors – Canadian Devision (RICS Canada), Canada.
Court, A.T. (1939): Hedonic Price Indexes With Automotive Examples, In: The Dynamics of
Automobile Demand, General Motors, New York.
Cressie, N.A.C. (1993), Statistics for Spatial Data, John Wiley and Sons, New York.
Davies, R. (2005),”Green Value, Green buildings, growing assets”, www.rics.org/greenvalue.
Davis Langdon (2009), Retrogreening offices in Australia – The story to create jobs, Davis
Langdon Research Report, available on http://www.davislangdon.com/upload/StaticFiles/
AUSNZ%20Publications/Technical%20Reports/Retrogreening-offices-in-Australia.pdf
(downloaded on April 30th 2009)
Day, B. (1999), The Theory of Hedonic Markets: Obtaining welfare measures for changes in
environmental quality using hedonic market data (Unpublished Manuscript)., Economics for
the Environment Consultancy, University College London.
de Francesco, A.J., Levy, D. (2008), The impact of sustainability on the investment
environment, in: Journal of European Real Estate Research (2008), Vol. 1, Issue 1, pp.72-87,
Emerald Group Publishing Ltd., Bingley (UK).
D’Herdt, P., Van Orshoven, D., Wouters, P. (2008), Energy performance regulations: small
scale comparison between Flanders, the Netherlands, Germany and France, IEE Project
ASIEPI – Subreport 3.
Dr. Lübke GmbH (2008), Trendguide Büroanmietung Stuttgart, March 2009, Dr. Lübke
GmbH, Frankfurt.

WORK PACKAGE 7 WORKING PAPER REPORT D7.2
211
IMMOVALUE – IEE/07/553/SI2.499204 Page 211
DTZ Research (2005), The Value of Green Buildings - A Study for RICS.
Eddington, C., Berman, D., Hitchcock, D., et al. (2009), Who Pays for Green? – The
Economics of Sustainable Buldings, EMEA ResearchCBRE, London
Eichholtz, P. Kok, N. and Quigley, J. (2009), “Doing well by doing good? An analysis of the
financial performance of green office buildings in the USA”, Published by RICS, London,
United Kingdom.
Eichholtz, P., Kok, N., Quigley, J.M. (2008), Doing well by doing good? Green office
buildings, IBER Working Paper No. W08-001, University of California, Berkeley.
Eichholtz, P., Kok, N., Quigley, J.M. (2009), Doing well by doing good? – An analysis of the
financial performance of green office buildings in the USA, RICS Research Report, March
2009, RICS, London
Eilers, P.H.C., Marx, B.D. (1996), Flexible Smooting using B-splines and penalized
likelihood (with comments and rejoinder), pp.89-121, in: Statistical Science (1996), Vol. 11,
Nr. 2, Institute of Mathematical Statistics, Beachwood
Eklington, J. (1994), Towards the sustainable corporation: Win-win-win business strategies
for sustainable development, pp.90-100, in: California Management Review, Vol. 36, No. 2,
University of California, Berkley.
Ellison, L., Sayce, S. (2006), Assessing sustainability in the existing commercial property
stock – Establishing sustainability criteria relevant for the commercial property investment
sector, Property Management, 2007, Vol. 25, Issue 3, p.287-304, Emerald Group Publishing
Limited, Bingley (UK).
Fahrmeir, L., Kneib, T., Lang, S. (2004), Penalized additive regression for space–time data a
bayesian perspective, Statistica Sinica, Vol. 14, p.731–761.
Fahrmeir, L., Kneib, T., Lang, S. (2007), Regression Modelle, Methoden und Anwendungen,
Springer, Berlin.
Fisher, R., Coll, L., Pelly, L., Percy, J. (2008), Surveying Sustainability: A Short Guide for
the Property Professional, in: The Appraisal Journal, Winter 2008, p.15-22, Chicago (Illinois).

WORK PACKAGE 7 WORKING PAPER REPORT D7.2
212
IMMOVALUE – IEE/07/553/SI2.499204 Page 212
Follain, J., Jimenez, E. (1985): Estimating the Demand for Housing Characteristics: A Survey
and Critique. Regional Science and Urban Economics, Vol. 15, Issue 1, p.77-107.
Fotheringham, A., Brundson, C., Charlton, M. (2002), Geographically Weighted Regression:
The Analysis of Spatially Varying Relationships, Wiley, Chichester.
Fuerst, F., et al. (2010), Establishing A Data Framework For The Investigation Of The Price
Effects Of Eco-Labelling Commercial Property Assets, RICS Research Report, May 2010,
RICS, London.
Fuerst, F., McAllister, P. (2008), Green Noise or Green Value? Measuring the Price Effects of
Environmental Certification in Commercial Buildings, University of Reading, Reading (UK).
Fuerst, F., McAllister, P. (2010), What Is The Effect Of Eco-Labeling On Office Occupancy
Rates In The USA?, FiBRE Series, RICS, London.
Funk, M. et. al. (2007), „Sachwertverfahren“ in: Immobilienbewertung in Österreich“, Bienert
et. al. (2007), Wien
G.E.O. 18/4.03.2009. (2009),“Ordonanta de urgenta nr.18 din 4 martie 2009 privind cresterea
eficientei energetice a blocurilor de locuinte”, Romanian Ministry of Regional Development
and Housing. http://www.mdlpl.ro/_documente/lucrari_publice/
reabilitare_termica/OUG_reabilitare.pdf
Gelbtuch, H. C. et al. (1997), Real Estate Valuation in Global Markets, 1st edition, Appraisal
Institute, Chicago.
Green Paper, (2005), Doing more with less, Green paper on Energy Efficiency,
GRI (2002), Sustainability Reporting Guidelines, Global Reporting Initiative (GRI),
Boston/Massachusetts.
Griliches, Z. (1971), Price Indexes and Quality Change Studies in New Methods of
Measurement, Cambridge, MA: Harvard University Press.
Hansen, J.D. and Slak, M. (2008), “Adaptation investments and homeownership”, Journal of
Housing Economics, vol 17, pp.102-115.

WORK PACKAGE 7 WORKING PAPER REPORT D7.2
213
IMMOVALUE – IEE/07/553/SI2.499204 Page 213
Hinnells, M.. Brigh,t S. Langley, A.. Woodford, L. Schiellerup, P. Bosteels, T. (2008),“The
greening of commercial leases”, Journal of Property Investments&Finance, vol.26, no.6,
2008, pp.541-551.
Houser, T. (2009), Energy Efficiency in Buildings: A Global Economic Perspective, Policy
Brief N° PB09-8, Peterson Institute for International Economics, Washington D.C.
http://ec.europa.eu/energy/efficiency/doc/2005_06_green_paper_book_en.pdf.
Institute for Market Transformation (2003), Recognition and use by appraisers of energy-
performance benchmarking tools for commercial buildings, New York State Energy Research
and Development Authority (NYSERDA), Albany.
IPD (2008), IPD Environment Code – Measuring the Environmental Performance of
Buildings, London.
IVSC (2007), International Valuation Standards, International Valuation Standards
Committee (IVSC), 8th edition, London.
Jank R.(2008), “Net Zero and Low Energy Buildings: -Theory and European Practice”.
EnEff:stadt. Fourth workshop, Energy-Efficient Technologies for Government Buildings New
and Retrofits, 16-18 January 2008, New York, USA.
Jones Lang LaSalle (2006), Assessing the Value of Sustainability, Jones Lang LaSalle
Australia.
Jones Lang LaSalle (2008), From Opacity to Transparency – The Diverse World of
Commercial Real Estate, JLL Real Estate Transparency Index 2008, London.
Jones, P., Comfort, D., Hillier, D. (2006), Corporate Social Responsibility and the UK
construction industry, in: Journal of Corporate Real Estate (2006), Vol. 8, Issue 3, pp.134-
150, Emerald Group Publishing Ltd., Bingley (UK).
Kats, G., et al. (2003), The Costs and Financial Benefits of Green Buildings: A Report to
California’s Sustainable Building Task Force, Capital E, California.
Khan, A. (2002), Hidden Value: Recognizing the Asset Value of High-Performance
Buildings, Institute for Market Transformation, Washington D.C.

WORK PACKAGE 7 WORKING PAPER REPORT D7.2
214
IMMOVALUE – IEE/07/553/SI2.499204 Page 214
Kleiber, W. (2006), WertR 06 -Wertermittlungsrichtlinien 2006 -, Sammlung amtlicher Texte
zur Ermittlung des Verkehrswerts von Grundstücken mit Normalherstellungskosten - NHK
2000, 9th edition, Cologne.
Kleiber, W., Simon, J. (2007), Verkehrswertermittlung von Grundstücken, 5. Auflage,
Bundesanzeiger Verlag, Köln.
Kleiber, W., Simon, J., Weyers, G. (2002), Verkerswertermittlung von Grundstücken, 4th
edition, Bundesanzeiger Verlagsges.mbH, Cologne.
Knispel J., Alles R. (2003), Ökologischer Mietspiegel - Empirische Untersuchung über den
möglichen Zusammenhang zwischen der Höhe der Vergleichsmiete und der
wärmetechnischen Beschaffenheit des Gebäudes, Darmstadt.
KPMG (2010), The Copenhagen Accord – A view of a work in progress, White Paper,
KPMG International, Netherlands.
Lancaster, K. (1966): A New Approach to Consumer Theory, Journal of Political Economy,
Vol. 74, p.132-157.
Lang, S., Brezger, A. (2004), Bayesian P-splines, pp.183-212, in: Journal of Computational
and Graphical Statistics, Vol. 13, Nr.1, American Statistical Association, Alexandria.
LeSage, J., Pace, R. (2004), Spatial and Spatiotemporal Econometrics, Elsevier, Oxford.
Lorenz, D., Lützkendorf, T. (2008a), Sustainability in property valuation: theory and practice,
Journal of Property Investment and Finance, 2008, Vol. 26, Issue 6, p.482-521, Emerald
Group Publishing Limited, Bingley (UK).
Lorenz, D., Lützkendorf, T. (2008b), Next Generation Decision Support Instruments For The
Property Industry – Understanding The Financial Implications of Sustainable Buildings,
Lorenz, D., Trück, S., Lützkendorf, T. (2007), Exploring the relationship between the
sustainability of construction and market value – Theoretical basics and initial empirical
results from the residential property sector, Property Management, 2007, Vol. 25, Issue 2,
p.119-149, Emerald Group Publishing Limited, Bingley (UK).

WORK PACKAGE 7 WORKING PAPER REPORT D7.2
215
IMMOVALUE – IEE/07/553/SI2.499204 Page 215
Madew, R. (2006), The Dollars and Sense of Green Buildings, Green Building Council of
Australia, Sydney.
Malpezzi, S. (2002), Hedonic Pricing Models: A Selective and Applied Review, prepared for
Housing Economics: Essays in Honor of Duncan MacLennan.
Martins-Filho, C., Bin, O. (2005), Estimation of hedonic price functions via additive
nonparametric regression, Empirical Economics, Issue 30, p.93–114.
McGraw-Hill Construction (2005), Green Building SmartMarket Report 2006, McGraw-Hill
Publications, New York.
McGraw-Hill Construction (2008), Green Outlook 2009: Trends Driving Change, McGraw-
Hill Publications, New York.
Meins, E., Burkhard H.-P. (2009), Der Nachhaltigkeit von Immobilien einen Wert geben: ESI
Immobilienbewertung - Nachhaltigkeit inklusive, Zürich.
Meins, E., et al. (2007), Der Nachhaltigkeit von Immobilien einen finanziellen Wert geben –
Economic Sustainability Indicator (ESI), Center for Corporate Responsibility and
Sustainability (CCRS), University of Zurich, Zürich.
Meins, E., et al. (2008), Der Nachhaltigkeit von Immobilien einen finanziellen Wert geben –
Minergie macht sich bezahlt, Center for Corporate Responsibility and Sustainability (CCRS),
University of Zurich, Zürich.
Miller, N. (2010), Does Green Still Pay Off?. V.P. Analytics/CoStar Group, San Diego,
California.
Miller, N., Spivey, J., Florance, A. (2008), Does Green Pay Off?, Burnham-Morres Center of
Real Estate, University of San Diego and CoStar Group, San Diego.Muldavin, S. (2008),
Quantifying “Green” Value: Assessing the Applicability of the CoStar Studies, San Rafael,
California.
Murray, R. (2008), “McGraw-Hill Construction’s Green Outlook 2009: Trends Driving
Change” . Report. 36 pages.

WORK PACKAGE 7 WORKING PAPER REPORT D7.2
216
IMMOVALUE – IEE/07/553/SI2.499204 Page 216
Myers, G., Reed, R. And Robinson, J. (2007), The Relationship Between Sustainability and
the Value of Office Buildings, Paper presented at the 13th Annual Pacific Rim Real Estate
Society Conference (2007), Fermantle (Australia).
Myers, G., Reed, R.G., Robinson, J. (2008), Sustainable Property – The Future Of The New
Zealand Market, Pacific Rim Property Research Journal, Vol. 14, Issue 3, Pacific Rim Real
Estate Society, Sydney
National Institute of Statistics, www.insse.ro
Parker, D. (2008), Valuation of Green Buildings – Is greed becoming fear?, Australian and
New Zealand Property Journal, Vol.1, Issue 7, September 2008, pp.552-560.
Parker, D. (2008), Valuation of Green Buildings – Is greed becoming fear?, Australian and
New Zealand Property Journal, Vol.1, Issue 7, September 2008, pp.552-560.Pace, R. (1998),
Appraisal Using Generalized Additive Models, Journal of Real Estate Research, Vol. 15,
p.77–99.
Pett, J, Guertler, P, Hugh, M and Kaplan, Z (2004), Asset Value Implications of Low Energy
Offices, Association for the Conservation of Energy, London.
Pett, J., et al. (2004), Invisible Property Investment – The report of the project ‘Asset Value
Implications of Low Energy Offices’, The Association for the Conservation of Energy,
London.
Pitts, J., Jackson, T. (2008), Green Buildings: Valuation Issues and Perspectives, in: The
Appraisal Journal, Spring 2008, p.115-118, Chicago (Illinois).
Pivo, G., Fisher, J.D. (2010), Income, Value and Returns in Socially Responsible Office
Properties, University of Arizona.
Pivo, G., McNamara, P. (2005), Responsible Property Investing, in: International Real Estate
Review (2005), Vol. 8, Issue 1, pp.128-143, Fullerton.
Pollakowski, H. O. (1995), “Data sources for measuring house prices changes”, Journal of
Housing Research 6: p377-387.

WORK PACKAGE 7 WORKING PAPER REPORT D7.2
217
IMMOVALUE – IEE/07/553/SI2.499204 Page 217
Popescu, D, Mladin, E.C. Boazu, R. Bienert, S. (2009), “Methodology for real estate appraisal
of green value”, Environmental Engineering and Management Journal, Vol. 8, Issue 3
May/June, pp. 381-386.
Pramerica Real Estate Investors (2009), 2009 Sustainability Report, Pramerica Real Estate
Investors, Parsippany/New Jersey.
Real Estate Norm Netherlands Foundation (1992), Real Estate Norm: a method for measuring
the quality of office building and locations, Real Estate Norm Netherlands Foundation,
Nieuwgein.
Reed, R.G, Wilkinson, S.J. (2005), The increasing importance of sustainability for building
ownership, in: Journal of Corporate Real Estate (2005), Vol. 7, Issue 4, pp.339-350, Emerald
Group Publishing Ltd., Bingley (UK).
RICS Research (2010), RICS Global Property Sustainability Survey Q1 2010, RICS
Economics, London
Robinson, J. (2005), Property Valuation and Analysis applied to Environmental Sustainable
Development, University of Melbourne, Scientific Paper presented at the 11th Annual Pacific
Rim Real Estate Society Conference (2005), Melbourne.
Rosen, S. (1974): Hedonic Prices and Implicit Markets: Product Differentiation in Pure
Competition. Journal of Political Economy, Vol. 82, Issue 1, p.34-55.
Royal Institution of Chartered Surveyors (2005) “Green Values – Green buildings, growing
assets”, RICS, London
Royal Institution of Chartered Surveyors (2007), RICS Valuation Standards, 6th edition,
Wiltshire.
Royal Institution of Chartered Surveyors (2009), Building Sustainability into the Commercial
Property Valuation Process, Valuation Information Paper, No. 13, Royal Institution of
Chartered Surveyors (RICS), London.
Ruppert, D., Wand, M.P., Carroll, R.J. (2003), Semiparametric Regression, Cambridge
University Press, Cambridge.

WORK PACKAGE 7 WORKING PAPER REPORT D7.2
218
IMMOVALUE – IEE/07/553/SI2.499204 Page 218
Sayce, S. et al. (2006), Real Estate Appraisal - From Value to Worth, 1st edition, Oxford.
Sayce, S., Ellison, L. (2003), Integrating sustainability into appraisal of property worth:
identifying appropriate indicators of sustainability, Kingston University (London), Scientific
Paper for the American Real Estate and Urban Economics Association Conference (2003),
Skye (Scotland).
Sayce, S., et al (2010), Is Sustainability Reflected in Commercial Property Prices: An
Analysis of the Evidence Base, RICS Reserach Report January 2010, RICS Reserach,
London.
Schäfer, H, et. al (2010), ImmoWert - Integration von Nachhaltigkeitsaspekten in die
Wertermittlung und Risikobeurteilung von Einzelimmobilien und Gebäudebeständen,
University of Stuttgart, Stuttgart
Schulz, R, (2003), Valuation of Properties and Economic Models of Real Estate Markets,
Dissertation Humboldt-University, Berlin.
Senatsverwaltung für Stadtentwicklung Berlin (editor) (2009), Berliner Mietspiegel 2009 mit
Berliner Betriebskostenübersicht im Anhang, Berlin.
Sheppard, S. (1999): Hedonic Analysis of Housing Markets. In: Paul C. Chesire and Edwin S.
Mills (eds.), Handbook of Regional and Urban Economics, Vol. 3, p.1595-1635.
Simon, J., Kleiber, W., Joeris, D., Simon, T. (2004), Schätzung und Ermittlung von
Grundstückswerten, 8 Auflage, Luchterhand, Darmstadt.
Sirmans, G, Macpherson, D., Zietz, E. (2005): The Composition of Hedonic Pricing Models.
Journal of Real Estate Literature, Vol. 13, Issue 1, p.3-43.
Steixner, D., Brunauer, W., Lang, S. (2007), Demand vs consumption – Analysing the energy
certification for buildings, Journal of Building Appraisal, Vol. 3, Issue 3, p.213- 229.
Stocker, H. (2007), Einführung in die angewandte Ökonometrie, Chapter 3: Eigenschaften des
OLS-Schätzers, pp.83-110 in: University of Innsbruck (2009), available at:
http://www.uibk.ac.at/econometrics/einf/03p.pdf.

WORK PACKAGE 7 WORKING PAPER REPORT D7.2
219
IMMOVALUE – IEE/07/553/SI2.499204 Page 219
TEGoVA (2009), European Valuation Standards 2009 (EVS 2009), The European Group of
Valuers’ Association (TEGoVA), 6th edition, Bruxelles.
TMW Immobilien Weltfonds (2010), 1. Nachhaltigkeitsbericht, TMW Pramerica Property
Investment GmbH, München.
UNEP (2010), Green Buildings and the Finance Sector – An Overview of Financial
Institution Investment in Green Buildings in North America, UNEP Finance Initiative,
Geneva (Switzerland).
Valhouli, C. (2007), Valuing green buildings, research report, The Hammersmith Group, in:
Urban Land (2008), Issue June 2008, p.40-42.
Wade, J., et al. (2003), Energy efficiency in offices: Assessing the situation, The Association
for the Conservation of Energy, London.
Wade, J., Pett J. and Ramsay, L. (2003), Energy Efficiency in Offices: Assessing the
Situaiton, Association for the Convervation of Energy, London.
Wallace, N. (1996), Hedonic–Based Price Indexes for Housing Theory, Estimation, and Index
Construction, Federal Reserve Bank of San Francisco Economic Review, Vol. 3, p.34–48.
Warren-Myers, G., Reed, R. (2009), Sustainability: Measurement and Valuation? – Insight
from Australia and New Zealand, University of Melbourne, Scientific Paper for the 15th
Annual Pacific Rim Real Estate Society Conference (2009), Sydney.
Warren, C. M. (2009), Who needs a Green Star?, University of Queensland (Brisbane),
Scientific Paper for the 15th Annual Pacific Rim Real Estate Society Conference (2009),
Sydney.
WBCSD (2009), Energy Efficiency in Buildings – Transforming the Market, World Business
Council of Sustainable Development (WBCSD), Conches-Geneva.
Wilberforce, R. (2006), Making Invisible Property Investments Attractive, EuroACE (the
European Alliance of Companies for Energy Efficiency in Buildings, Brussels.
Wilberforce, R. (2006), Making Invisible Property Investments Attractive, the European
Alliance of Companies for Energy Efficiency in Buildings, UK.

WORK PACKAGE 7 WORKING PAPER REPORT D7.2
220
IMMOVALUE – IEE/07/553/SI2.499204 Page 220
Wood, S. (2006), An Introduction to Generalized Additive Models with R. Boca, Chapman
and Hall, Raton.
Wouters, P. van Dijk, D. Elsberger, M. Miladinova, G. Maldonado, E. Sutherland, G. (2008),
“Implementation of Energy Performance of Buildings Directive”, Country reports, Brussels.
WORK PACKAGE 7 WORKING PAPER REPORT D7.2
221
IMMOVALUE – IEE/07/553/SI2.499204 Page 221
V. Appendix A : Examples of LCCA models for the calculation of
operational cost of buildings
The following section presents two examples of LCCA models that have already seen practical use
several times and fulfil - at least partly - the following necessary requirementsfor an application of
LCCA in property management:
• The LCCA must be conducted in a simple and quick way;
• The LCCA should deliver results with a limited set of necessary data and even with data lacks
(through the use of default data);
• Cull the impact of users within the LCCA calculation
• The LCCA calculates on the basis technical building characteristics (thus filtering out the
influence of building users and the quality of operational management on operational cost)
• The LCCA includes all relevant operational cost which are depending on the quality of the
building itself.
The first model presented is the Norwegian LCC calculator, which can support the analysis of the
most important cost drivers of a building in an LCC perspective.
The second model is an Austrian tool developed by the consulting companies M.O.O.CON and e7. It
has been originally developed for a better consideration of Life Cycle Costs (LCC) during the
planning phases of buildings. But as refers the application in property valuation and the important role
of cost differences between sustainable buildings and conventional ones the tool is also a useful for the
calculation of reliable and consolidated operational costs.

WORK PACKAGE 7 WORKING PAPER REPORT D7.2
222
IMMOVALUE – IEE/07/553/SI2.499204 Page 222
a) Norwegian LCC calculator: Main cost drivers in an LCC perspective The task carried out in valuation is the estimation of the fair market value of an object. The main focus
of the ImmoValue project is the correspondence between energy performance (as measured by
Energy Certificates) and property value. However, other facts are also important in valuation. One
such factor isthe physical condition of the property.
One approach might be to first estimate the fair price for an object based on its size, location and
purpose – and then to adjust this value based on specific “deviations” from the normal. If there are
specific properties of a building that deviate in a negative way from what is normal, such as a bad roof
that needs to be replaced can be a reason to lower the estimated value of a property. The reason that in
an LCC perspective the needed replacement of the roof will have to be sooner in time than the
reference, and this lowers the estimated value.
In order for valuation professionals to identify and take into account these kinds of cost drivers they
need a little bit of information. First of all they need to know what to look for, what kind of
components can have major LCC-costs relations, if the technical conditions are not favorable?
Secondly, they need to know the approximate replacement- and maintenance cost of these
components.
The Norwegian State Housing Bank (NSHB) has financed a software based LCC calculator (see
appendix). It was created by SINTEF Building and Infrastructure and Multiconsult, and uses Service
Life Planning values from SINTEF and maintenance/replacement costs from Multiconsult. These
estimates are used in this text to indicate how a checklist for surveyors, based on LCC cost drivers, can
be prepared.
Notice that the estimates used in this text should be seen as an example of what type of information
when crating this kind of checklists. More components and further details are necessary for a tool to be
comprehensive, and the estimates and critical factors will differ between geographical locations.
In the following text the LCC calculator is first explained, then two examples shown with focus on
first roofing and then windows.
The LCC Spreadsheet
In the following pages we have a short presentation of the LCC spreadsheet. The spreadsheet itself is
in Norwegian.
Since we are interested in valuation we will examine some important properties regarding the
technical quality of a building.
For each building component the estimated “Residual Service Life” (time before the component
should be replaced, which means new costs) will be a function of the seven following aspects of the
component.

WORK PACKAGE 7 WORKING PAPER REPORT D7.2
223
IMMOVALUE – IEE/07/553/SI2.499204 Page 223
a. Material b. Design c. Craftsmanship d. Indoor climate/environment e. Outdoor climate/environment f. Restrictions in use g. Maintenance standard
These criteria are evaluated in
• Bad, • Normal • Good
Below is a screenshot of the data entry screen of the LCC calculator.
Behind each question mark is a description of the properties and why this (material choice etc.) is

WORK PACKAGE 7 WORKING PAPER REPORT D7.2
224
IMMOVALUE – IEE/07/553/SI2.499204 Page 224
considered bad, normal or good.
The main external building parts and components in the system are:
• Roofing • Chimney (above the roof) • Gutter/drainpipe • Fasade • Windows • Balcony
In the following we will examine two building components to see how their residual service life (RSL)
depends on the critical factors. In order to make the presentation simple only one critical factor will be
changed for each of them.

WORK PACKAGE 7 WORKING PAPER REPORT D7.2
225
IMMOVALUE – IEE/07/553/SI2.499204 Page 225
Roofing. Steel plates (NS3451:2006 nr 232)
1000 m2
Norwegian climate, Oslo.
Critical factor
Corrosion, poor fixing.
Moisture/water damage in the underlay
Estim. life
Maintain. Interv.
Replacem. cost (NOK) per
unit
Maint. Cost
(NOK) per unit
Specifications Specification Factor:1.2 (Good) 39 Na Na Na
Overflatebehandling,
stivhet (tykkelse),
innfestningsmateriale,
underlag
Heat treated steel plate with organic
coating (plastic coating or paint).
Good material stiffness. Attachment of
stainless steel screws with rubber
gasket.
Underlying Ceiling. Use of non-salt-
treated materials.
Specifications Specification Factor*: 1.0 Normal 35 Na Na Na
Heat treated steel plate with organic
coating or paint. Anti corrosion
treatment. Satisfactory / normal
material stiffness. Screw-fastening with
rubber gasket. Ceiling.
Specifications Specification Factor*: 0.8 Bad 35 Na Na Na
Steel plates of steel that rusts slowly
(Cortes), hot galvanized plates with
PVF2 thin layer coating. Poor plate
stiffness. Random fixing terms. material
and type (blind rivets, nails). No ceiling.

WORK PACKAGE 7 WORKING PAPER REPORT D7.2
226
IMMOVALUE – IEE/07/553/SI2.499204 Page 226
With the value “Good” (1.2) and the values for the other building elements placed at ”normal”
(1.0) the following summary report is produced:

WORK PACKAGE 7 WORKING PAPER REPORT D7.2
227
IMMOVALUE – IEE/07/553/SI2.499204 Page 227
Another building part as an example -- a wooden window
Windows, doors, gates. Wooden window (Norwegian Standard NS3451:2006 no 233)
Window (manufacturer: NorDan).
30 units
Critical factor
Avflassing, råteskader, defekte hengsler/beslag
Estim. life
Maintain. Interv.
Replacem. cost (NOK) per unit
Maint. Cost (NOK) per unit
Specifications Valuation/ Specification
Factor:1.2 (Good) 44 4 6000 650
Pressure treated spruce / pine. No
cutting of wood finishing after
treatment. External aluminum cover.
Specifications Valuation/ Specification
Factor: 1.0 Normal 40 4 6000 650
Pressure treated spruce / pine.
Specifications Valuation/ Specification
Factor: 0.8 Bad 36 4 6000 650
Spruce / pine without pressure
treatment, or unknown/undocumented.

WORK PACKAGE 7 WORKING PAPER REPORT D7.2
228
IMMOVALUE – IEE/07/553/SI2.499204 Page 228

WORK PACKAGE 7 WORKING PAPER REPORT D7.2
229
IMMOVALUE – IEE/07/553/SI2.499204 Page 229
For better illustration: Screenshots from the Norwegian LCC calculator
Screenshot showing entry of information. Data entry is finalized when the button “Beregn kostnader”
(English: “Calculate costs”) is pushed.

WORK PACKAGE 7 WORKING PAPER REPORT D7.2
230
IMMOVALUE – IEE/07/553/SI2.499204 Page 230
Overview including a graph showing the results of the calculations
”Behind” the user interface where values can be chosen and changes made exists a matrix containing
all the basic data, descriptions, values, etch. This one is not shown to the user, but can be opened for
qualified users so that they can add their own numbers based on their experience.

WORK PACKAGE 7 WORKING PAPER REPORT D7.2
231
IMMOVALUE – IEE/07/553/SI2.499204 Page 231
b) Austrian LCCA tool of e7 and M.O.O.CON
Consideration of Life Cycle Costs (LCC) during the planning phases of buildings is insufficient. The
the focus of clients for whom a building is being built most often remains on the initial investment
costs. On the other hand, available software tools are complex and the data needed to use them
properly is vague during the early design phase – the phase where cost minimising can be most
efficient. Thus, on the basis of various existing Life Cycle Cost tools, a method and tool has been
developed so that detailed forecasts of expected Life Cycle Costs can be made during early planning
phases.
Methodological Structure
In order to combine the advantage of the fast cost estimation of the top-down method with the
advantage of the accuracy of the bottom-up method it was necessary to take on a new approach.
At the same time, the decision-making process in the planning phase was incorporated into the method
with great detail. In general, decisions are made mainly at the strategic and system levels during the
phase before the construction of a building [15.]
Level of decision in Initiation &
Design Phase
Figure 2: Levels in the decision-making process (Source: Life Cycle Costs in Construction [15])
The goal of the newly developed method was to model the building in such a way that LCC could
already be calculated in the early planning phases. Even, at a point of time when no design for the

WORK PACKAGE 7 WORKING PAPER REPORT D7.2
232
IMMOVALUE – IEE/07/553/SI2.499204 Page 232
building is yet available. To this end both tools for generating the space allocation program and
volume program for the building, as well as data for construction costs and operating costs are
necessary on an aggregated level. This allows for entries to be made at the beginning of planning. In
addition, an energy calculation tool should illustrate the interdependency between the building design,
the facade, and the building equipment system. In this way, no additional calculation tool is needed.
The method and the tools should be designed so that LCC analysis can be carried out well into the
detailed design phase, i.e. when preparing detailed information for construction.
INITIATION PHASE CONCEPT PLANNING PHASE DETAILED DESIGN PHASE
CONSTRUCTION PHASE
REQUIREMENTS
DESIGN SOLUTION OPTIMIZATION OF BUILDING CONCEPT
Che
ck
Che
ck
DEFINITION OF REQUIREMENTS
OPTIMIZATION OF BUILDING COMPONENTS
Figure 3: Areas of application of the LCC tool from initiation through to the detailed design phase (Source:
original illustration)
Option 1: General building data via virtual building model
Avirtual building model was developed for the purpose of modelling the subject property. This virtual
building model is based on the experience of the company M.O.O.CON acquired as part of their client
consulting on office buildings. Based on the requirements of the client’s brief, the virtual building
model can calculate the approximate volume and surface area of the building at a time where no
design drafts for the building have been put forward. Apart from the calculation of volume and surface
area this tool can also optimize usable floor space. Optimising the use of floor space is a powerful
lever for the reduction of construction and operating costs. Through the reduction of conditioned
volume, energy costs can also be reduced.
In this process office spaces and other special areas in the building are combined in different design
variations into floors and building cores and the gross floor space is calculated. Thus, it is possible to
optimize the floor space even at this point of time, which in turn leads to lower follow-up costs (see
figure below).

WORK PACKAGE 7 WORKING PAPER REPORT D7.2
233
IMMOVALUE – IEE/07/553/SI2.499204 Page 233
Figure 4: Output of floor space values per building sector and number of cores. (Source: M.O.O.CON)
Option 2: General building data by using architectural concept
With the introduction of an architectural concept, the data in the virtual building model is changed in
accordance with the significant geometrical dimensions (essential building area data, facade, building
orientation). Therefore the existing data can be optimally used with minimal additional effort related to
data entry.
Relevant areas in office buildings in the decision making process
Concerning the building, the impact of the various usage areas on cost is investigated. Here the focus
is to outline the effect of special areas on cost when compared with main usage “office” spaces. The
primary utilization of an office building, as the names suggest, is for office and administrative use.
The main usage areas are complimented by decentralized spaces such as staircases, elevators,
restrooms, as well as centralized special usage areas such as conference rooms, the lobby, cafeteria(s),
storage areas or carports. The essential system decisions are made based on the main usage which also
generates the main source of costs. Consequently, the building elements for the main usage areas
(“office” spaces) need to be provided at a different level of detail than for the special usage areas.
Based on cost analysis, buildings elements were defined at different levels of detail. Depending on the
influence of the usage, aggregation of the building elements was carried out at a different level. For the
main usage area, “office”, cost relevant issues are compiled at the level of elements (as defined by
Austrian Standard ÖNÖRM B 1801-1[16]), for less cost relevant issues or building elements in less
cost relevant usage areas at the level of cost ranges (as defined by ÖNORM B 1801-1).
Office area Office areaMain core Side core Area with high
standardisation (office):element / quality
Special areas/ categorization in:
simple standardmiddle standardhigh standard
Conference (special area) Lobby, restaurant (special area)
Garage (special area)
Garage (special area)
Store room (special area)
Technikfläche (special area)
Figure 5: Structure of costs for the main usage “office” space and special usage space (Source: original
illustration)

WORK PACKAGE 7 WORKING PAPER REPORT D7.2
234
IMMOVALUE – IEE/07/553/SI2.499204 Page 234
The building elements were consequently compiled from bottom-up aggregated items for the relevant
cost drivers in the office areas (i.e. type of floor, type of heating system). For less relevant costs ranges
and usages in special areas, they were bottom-up aggregated and tested against top-down benchmarks,
as a certain imprecision can be tolerated. Thus the number of elements and consequently the amount of
data entry is reduced significantly.
Calculation costs for defined building elements
Different sources were referred to for an estimate of the investment cost. These sources included the
experiences of the large Austrian construction company Allgemeine Baugesellschaft - A. Porr
Aktiengesellschaft, and the analysis of their AVA software as well as the experiences of the large
Austrian building equipment supplier Axima Gebäudetechnik GmbH and the engineering office
Allplan GmbH. For an assessment of the operating costs the database of Axima Gebäudetechnik
GmbH, the largest building management company in Austria, was analysed. These figures were
integrated into a database that was specially developed for this method.
In order to ascertain the total cost of the elements comprehensive building data is necessary. This can
be gathered based on the virtual building model or the architectural concept. As with the aggregation
of the building elements, it was also necessary to keep the amount of required data to a minimum for
the calculation of comprehensive building data.
Calculation of Life Cycle Costs
Again the results of the analysis of the cost drivers were referred to and an attempt was made to
incorporate only a few significant parameters from the plans. All other data should be calculated by
algorithms based on these entries. The algorithms are derived from planning regulations for office
buildings, fire safety regulations, work space regulations and years of experience of various projects of
M.O.O.CON. The significant parameters for the efficient use of space such as width and structure of
building could be easily entered and changed. The data entry is done through a space allocation and
function program used by M.O.O.CON in the initiation phase. Common measurements of architectural
plans provided at this time are used as a basis during the early planning phases.
Building elements could be defined and associated with investment and operating costs based on the
structure of the usage area as well as significant system decisions, which contribute to the comfort of
the interior (acoustics, visual comfort). For a usage area such as a cafeteria, this meant the definition of
different building elements for different standards at a level of costs ranges (such as “high quality
cafeteria”). For the office areas building elements for flooring, floor construction, office partitions,
hallway dividing walls, noise insulation, etc. were defined. (e.g. office area, flooring, carpeting, high
quality). For the building itself, building elements such as facade, HVAC and many more had to be

WORK PACKAGE 7 WORKING PAPER REPORT D7.2
235
IMMOVALUE – IEE/07/553/SI2.499204 Page 235
defined.
Based on the virtual building model of selected building elements and user specified comfort
guidelines, it is now possible to calculate energy consumption based on the calculation for the energy
certificate complemented by several significant factors such as: the influence of thermal mass,
different usage areas, the taking into account of daylight, the actual energy consumption of different
utilities like lighting, cooling, heating and ventilation.
Thanks to years of experience of the employees of e7 Energie Markt Analyse GmbH very realistic
energy usage scenarios could be compiled. Through the programming of a software interface the entry
of the virtual building model and of the building elements could be directly linked to the energy cost
calculation, making any additional step unnecessary. The linking of the building elements to the use of
energy calculation allows for an additional correlation between building design and heating and
cooling load of the building’s central equipment system. Heating and cooling loads are calculated
through the entry of the buildings volume and facade design. These loads are indicators for the
selection of the dimension of the building equipment systems for heating and cooling. An improved
insulation of the facade contributes directly to lower investment and operating costs of the building
equipment systems. The chosen method of calculating the energy costs also allows for the selection of
alternative energy systems such as heat pumps, photo-voltaic and thermal solar systems.
Based on investment and operating costs provided on a per-element basis (originating from the
building elements) as well as building specific calculated energy costs it is now possible to calculate
LCC using the net present value method or the method of complete financial plans.
By changing significant parameters (inflation, construction cost index, energy cost index, depreciation
period and financing options, etc.) their effect can be simulated. Sensitivity analysis can be done by
changing the entered value for calculations. Cost parameter of the building can be varied in Excel
allowing for a risk analysis of individual parameters to be carried out.
Realization of a LCC Software tool
The different elements are connected to form a complete, functioning tool in the form of software that
was developed by Alpha Carinae KEG in Austria. An array of factors influences the relationships and
recognizes the impact of hi-tech, large, complex system components on one another. These
interdependencies were derived on the basis of expert interviews with those providing the data. The
software user interface incorporates the use of several Excel tools and a costs database.

WORK PACKAGE 7 WORKING PAPER REPORT D7.2
236
IMMOVALUE – IEE/07/553/SI2.499204 Page 236
Figure 6: User interface of the LCC tool (Source: original illustration)
The set-up and follow-up costs of the aggregated building elements are deposited in a database that
can be used and maintained independently from the LCC software.
Figure 7: User interface of the costs database (Source: original illustration)
The software provides results with different degrees of aggregation so that, depending on the required
aspect of optimization, all of the data is available for viewing in various well-sorted overviews and
illustrated with graphics.
Significant expenditures are:
• Construction costs (total/ by cost areas/ by building elements) • Operational costs (total/ by type of costs/ by building elements and cost catagories) • Gross floor area (total/ by utilization areas/ by space) • Energy consumption (total/ by causer (cooling, heating, lighting, work equipment, other) • A graph of LCC

WORK PACKAGE 7 WORKING PAPER REPORT D7.2
237
IMMOVALUE – IEE/07/553/SI2.499204 Page 237
It is possible to compare different variants with each other; specific values of other projects can be
taken up for comparison as well.
Figure 8: Aggregated output of the LCC Tool (Source: original illustration)
Results
In the final test phases investment cost and operating cost data, derived from completed and
operating buildings, were compared with corresponding results generated by the tool.
Through this data it was possible to test the programmed algorithms and the cost estimates
and make any necessary change.
After the testing phase was complete, it was possible to confirm, that the chosen approach
lead to extremely short data entry times. At the same time the cost reliability achievable in
this early planning phase remained within the margins of +/- 10 to +/- 20% for all simulated
projects.
Thus, it could be shown that with sufficient knowledge of significant cost drivers the
simulation effort can be minimised without compromising on data reliability.
Future Prospects
After first applications of the method where results with high cost reliability for existing buildings
were achieved, it is now implemented for the planning of new office buildings.
Nevertheless, there are also other possible areas of application where the developed LCC method
could be implemented: renovation of office buildings, other categories of buildings such as schools,
nursing homes, or residential buildings. In addition, other indicators will be incorporated into the tool:
the rating of ecological materials, comfort, etc. The method and the software will be gradually
expanded over the next years, so that a complete sustainability assessment will be possible in the early

WORK PACKAGE 7 WORKING PAPER REPORT D7.2
238
IMMOVALUE – IEE/07/553/SI2.499204 Page 238
planning phases with minimal effort.

WORK PACKAGE 7 WORKING PAPER REPORT D7.2
239
IMMOVALUE – IEE/07/553/SI2.499204 Page 239
VI. Appendix B
Acknowledgement We would like to thank the European Commission (the executive agency for competitiveness
and innovations – eaci), RICS (The Royal Institution of Chartered Surveyors), gif
(Gesellschaft für Immobilienwirtschaftliche Forschung e.V.), Federal Ministry of Agriculture,
Forestry, Environment and Water Management of the Republic of Austria (BMLFUW) as
well as the Federal Ministry of Economy, Family and Youth of the Republic of Austria
(BMWA), for sponsorship and funding the and the IMMOVALUE-project in general.
Further we would like to thank Neuman und Partner GbR (CREIS) and ERES
NETconsulting-Immobilien.NET GmbH (www.immobilien.net), who act as a sponsor of this
project, for the provision of the data used in this study.

WORK PACKAGE 7 WORKING PAPER REPORT D7.2
240
IMMOVALUE – IEE/07/553/SI2.499204 Page 240
Legal disclaimer The sole responsibility for the content of this publication lies with the authors. It does not
necessarily reflect the opinion of the European Communities. The European Commission is
not responsible for any use that may be made of the information contained therein.
Le contenu de cette publication, n'engage que la responsabilité de son auteur et ne représente
pas nécessairement l'opinion de la Communauté européenne. La Commission européenne
n'est pas responsable de l'usage qui pourrait être fait des informations qui y figurent.
Die alleinige Verantwortung für den Inhalt dieser Publikation liegt bei den AutorInnen. Sie
gibt nicht unbedingt die Meinung der Europäischen Gemeinschaften wieder. Die Europäische
Kommission übernimmt keine Verantwortung für jegliche Verwendung der darin enthaltenen
Informationen.
El contenido de esta publication solo compromete a su autor y no refleja necesariamente la
opinión de las Comunidades Europeas. La Comisión Europea no es responsable de la
utilización que se podrá dar a la información que figura en la misma.