Embed Size (px)
Citation preview
1
MULTI-COMPONENT SYSTEMS PRICING: RATIONAL INATTENTION AND DOWNWARD RIGIDITIES
Sourav Ray*, Charles Wood#, Paul R. Messinger##
Working Paper
(Forthcoming: Journal of Marketing)
Last Revision: March 3, 2012
ABSTRACT
We examine the relative magnitude of price reductions for product systems and their constituent components (e.g. cameras, computers, monitors, lenses etc.) and hypothesize these systematically differ across different systems types. We offer rational inattention as one explanation and document patterns of downward rigidity in online prices of computers and cameras consistent with the view. Our basic argument is that under certain circumstances it is rational for consumers to ignore small price changes. This results in some price rigidity since firms would see no demand effect for small reductions. We suggest this inattention systematically varies across different types of multi-component systems, leading to specific hypotheses about sellers’ pricing behavior. We first check the validity of our theoretical arguments using data from two surveys of individuals and managers. We then examine 669,557 daily price listings for 1,052 different high-end cameras and computers from 102 online vendors and find evidence consistent with our predictions. Using publicly available web traffic data we also find our predicted pricing behavior is aligned with better traffic response for the firm, as expected.
Keywords: Rational Inattention, Systems, Components, Pricing, Price Rigidity, Price Reductions, E-Commerce
* Contact Author.
Associate Professor of Marketing, McMaster University, DeGroote School of Business, 1280 Main Street W.,
Hamilton, ON L8S-4M4, Canada; Phone: 905-525-9140 x 22370; Fax: 905-521-8995; Email: [email protected]
# Assistant Professor of Information Systems Management, Duquesne University, Donahue School of Business, 460
Rockwell Hall, 600 Forbes Ave. Pittsburgh, PA 15282, USA, Phone: (412) 396-1775; Email: [email protected]
## Associate Professor of Marketing, University of Alberta School of Business, Edmonton, AB T6G 2R6, Canada,
Phone: (780) 492-3954; Email: [email protected]

2
ACKNOWLEDGEMENTS
We thank the three anonymous reviewers and the Editor for their constructive feedbacks. We acknowledge the dedicated research assistance of Sundeep Bath, Natalie Gascon, Corinne Razem, Padmasri Suriyakumar and Li Wang of McMaster University. We thank Kersi Antia, Adam Finn, Elko Kleinschmidt and Sharon Ng for commenting on previous versions of the paper. We also thank the audiences at numerous seminars for their constructive comments. These include: the SCEC Conference (Minneapolis), the E-Retailing Symposiums (Hamilton and Edmonton), the Marketing BBL Seminars at McMaster University, and in particular the marketing research seminars at Dpto. de Administración y Economía de la Empresa (University of Salamanca, Spain) and UOIT (Oshawa, Canada). We gratefully acknowledge funding from the Social Sciences and Humanities Research Council (SSHRC) of Canada.

3
“Deep Discounts Draw Shoppers, but Not Profits: … The bargains that drove shoppers to stores were so stunning; analysts said that retailers — already suffering from double-digit sales declines the last two months — would probably see their profits erode even further.” – New York Times article by Stephanie Rosenbloom, Dec 1, 2008
INTRODUCTION
Price reductions attract consumer attention and are perhaps the most widely used retail tactic to drive store traffic and boost sales. Nevertheless, they require care. Small reductions may cut into retail margins without any impact on sales volume. On the other hand, large reductions, as the quote above suggests, may leave money on the table that would have boosted the retailer’s bottom line. Despite such price changes often being a response to changes in the retailer’s business environment (e.g. competition, costs), the desired magnitude of price reductions could stem in part from certain structural properties of the product markets involved. In particular, these structural properties may allow only small price changes reflecting high price rigidity, where price rigidity is a property of prices that refers to their propensity to remain unchanged.
In this paper we focus on multi-component systems and downward rigidities in their prices, by investigating magnitude of price reductions. These systems are characterized by multiple components that are often priced separately (e.g. lenses and camera body) but which are still needed for the “system” (the camera system) to function. The ubiquity of such systems in our daily lives and the non-trivial complexity inherent in the pricing of systems and components create a high level of managerial interest. We elaborate on the structural characteristics of systems markets and on sellers’ incentives to deploy price reductions asymmetrically across systems and components.
In general, it is not difficult to see why retailers might engage in deep price cuts for products well known to consumers. By appealing effectively to the consumer’s greater deal awareness associated with such products, such price cuts may not only result in category expansion (Bronnenberg and Mahajan, 2001) but may also increase store traffic (Moorthy, 2005). Other studies support this relation between product awareness and promotions effectiveness (cf. Pauwels, 2007). At the same time, price cuts are often vehicles to garner consumer attention for the seller and its products, much like promotion signals (Inman and McAlister 1993; Inman, McAlister and Hoyer 1990). So, in a world where consumer attention is costly, it remains an open question whether offering deep price cuts to products already laden with high consumer awareness is desirable.
In this paper, we offer Rational Inattention (RI) as one explanation for the variation in price reductions across different kinds of multi-component systems markets. This predicts deeper price cuts may be redundant for products already associated with high consumer awareness and vice versa; thus offering a counterpoint to some of the results referred to earlier.
Inherent differences across systems markets offer a natural context for different degrees of consumer (in)attention. Some system markets are loosely coupled, where consumers can specify many of the components that make up a system leading to a high degree of mix and match across components and brands. Other systems markets are more tightly coupled which offer far less choice of mixing and matching of the components and where the components are often pre-combined as a complete system for the consumer. For consumers this leads to differing degrees

4
of knowledge and familiarity with prices, and thus differing degrees of effort needed on their part to attend to price changes and reassess their consumption choices. This affects the seller’s pricing decisions.
In systems markets where consumer knowledge makes it rational for consumers to attend to even small changes in component prices, sellers may find large reductions in component prices unnecessary because they could generate consumer attention (and thus affect purchase behavior) even with small reductions. Similarly, where consumer knowledge makes it rational for them to attend to even small changes in systems prices, large reductions in systems prices may be unnecessary with consumer attention generated even with small reductions. Price reductions in systems markets should therefore take into account how consumer inattention varies by systems, with the normatively prescribed pricing behavior associating with better firm level outcomes.
We develop the ideas to generate a number of hypotheses relating to a firm’s price reduction decisions. We follow with a two-part empirical effort – one examining the validity of our empirical context from both seller and buyer perspectives and another testing the hypotheses using a novel combination of online prices and web traffic data. While the first part involved surveys of managers and users, the second part of the empirical effort involved creating and analyzing a unique dataset of 669,557 daily price listings for 1,052 high-end cameras and computers from 102 online vendors that capture practically all pricing activity over a period of 283 days. We then examine the market response implications by using a complementary dataset on web traffic from an independent source.
In terms of substantive contributions, our paper studies price changes in systems markets, a topic which, to the best of our knowledge has not yet been addressed in the systems marketing literature (cf. Wilson et al. 1990; Venkatesh and Kamakura 2003; Ghosh et al. 2006). By examining a seller’s incentives to deploy price reductions asymmetrically across different systems and components, we also contribute to the recent price adjustment cost literature at the heart of asymmetric pricing, where prices are less rigid upwards than downwards (Ray et al. 2006; Müller and Ray 2007; Dutta et al. 2010). More generally, our paper is one of the few that elaborates upon the relevance of rational inattention for retail prices. Thematically, this extends a growing pricing literature in economics and marketing that considers consumers’ selective attention to prices based on the cost and benefit of processing information. This literature includes the “thinking costs” line of work of Shugan (1980), Wathieu and Bertini (2007) and a growing body of economics research concerning the micro level outcomes of rational inattention (Rubenstein, 1993; Chen et al. 2008). Relatedly, we also build on research concerning price bands (cf. Lichtenstein et al. 1988; Kalyanaram and Little 1994), by illustrating their relevance for systems markets.
In the following sections we describe further background literature, the conceptual framework, and the empirical studies. We then discuss the results, contribution and limitations.
BACKGROUND LITERATURE
Marketing researchers have long attempted to estimate the effectiveness of price reductions. Some find that price reductions positively impact sales in the short and long terms (e.g. Dekimpe et al. 1999, Nijs et al. 2001), while others find price reductions may have no effect at all or even negatively impact sales volume over time (e.g. Lal and Padmanabhan 1995, Jedidi et al. 1999). The heterogeneity in results is not surprising given the complex nature of the problem – requiring considerations of the consumer, competitor and the firm.

5
A body of research focusing on consumer factors draws upon the theory of reference price-dependent consumer choice (Tversky and Kahneman 1991; Mazumdar et al. 2005). Another literature attempts to calibrate the effectiveness of price reductions in terms of just noticeable difference (JND) thresholds (Monroe 1973). The related literature on latitude of price acceptance postulates the existence of a band of price changes around a reference price where the consumer does not react by changing her purchase behavior (Lichtenstein et al. 1988, Kalyanaram and Little 1994). Authors like Fibich et al. (2007) and Kalwani and Yim (1992), estimate that price reductions will be noticed by consumers only outside of the range of 15%–30% or more. Others (e.g. Della Bitta and Monroe 1981; Gupta and Cooper 1992) report that discounts of less than 15% are ineffective. Competition is often posed as a key determinant of the effectiveness of a price reduction (Mela et al. 1997; Bronnenberg and Wathieu 1996; Rajiv et al. 2002; Kauffman and Wood 2007). Brand level attributes (Krishnamurthi and Raj 1988, 1991; Sethuraman et al. 1999) and firm capabilities to effect price changes (Ray et al. 2006) are also implicated.
A complementary literature in economics investigates price adjustments, specifically, the causes and consequences of rigidity in prices. Asymmetric rigidity, where prices are less rigid on the way up than down, has been of particular interest (Peltzman 2000). Recent efforts in marketing have contributed to this both theoretically and empirically (cf. Ray et al. 2006; Müller and Ray 2007). In general, “ price adjustments costs” are implicated as a cause for rigidity in individual prices (Dutta et al. 1999, 2010, Levy et al. 2002; Bils and Klenow 2004). A more recent literature particularly relevant to the current paper investigates another source of price rigidity: the “rational inattention” (RI) of economic agents. This perspective focuses on the costs incurred by an economic agent to update and process price related information (Sims 2003; Reis 2006a,b; Mankiw and Reis 2002). Some papers in marketing also develop similar ideas (Shugan 1980; Wathieu and Bertini 2007). The theoretical underpinnings of these lines of thought are similar to the marketing JND literature cited earlier in that both are rooted in the information processing efforts of the consumer. The RI framework explicitly accounts for the consumer’s cost of processing the price information vis-à-vis the benefits accrued to such efforts. The JND account on the other hand, hinges on the cognitive processes that form the consumer’s price perceptions.
Price changes are a particularly challenging marketing problem for multi-component systems. The ubiquity of these systems in our daily lives makes this a major managerial concern. Consider the non-trivial nature of pricing of systems. Among others, it requires consideration of industry-level concerns like technology standardization and compatibility, product market concerns such as co-existence of correlated systems and component markets, brand level concerns like inter-brand mixing and matching, as well as considerations such as variation in consumer-level perceptions across systems and components which may sustain varying levels of (in)attention across different systems. Unfortunately, the literature is mostly silent on these issues. Many papers in economics explore pricing of systems and components (Economides 1989; Matutes and Regibeau 1988, etc.). Yet, few if any, address price changes. In marketing on the other hand, there are only a handful of papers that address systems explicitly (e.g. Wilson et al. 1990, Venkatesh and Mahajan 1997; Venkatesh and Kamakura 2003; Stremersch et al. 2003, Ghosh et al. 2006). But none address price changes per se.
In the following section we first characterize different types of systems. This allows us to apply rational inattention as a framework to investigate price reductions, leading up to specific testable hypotheses about sellers’ pricing practices in different systems contexts.

6
CONCEPTUAL FRAMEWORK
Multi-Component Systems
Multi-component systems are products that have multiple components (e.g., a computer system contains a central processing unit (CPU), a monitor, and an operating System such as Windows; a camera system contains a lens, a flash, and a body). Consumers are often faced with prices at both levels - systems (one price for a fully-functional system) and components (where individual components of the system are priced separately). Market structures associated with systems also differ.
Tightly and Loosely Coupled Systems
Operationally, we define tightly coupled systems as systems that offer only limited component level choice to the customer. Among other things, these systems markets offer limited choice of mixing and matching of components from different suppliers. Therefore, in practical terms most pricing is done at the systems level. An example of a tightly coupled systems market would be that of Cameras. Cameras are typically sold to work out of the box, where the product contains all the functionality to begin taking pictures immediately. While add-ons, such as lenses, flashes, filters etc., are available for some cameras, they are often specific to the particular brand/model and cannot be easily interchanged with others.
As a counterpoint to the above, consider loosely coupled systems, which we define operationally as systems that offer greater component level choice to the customer. These systems markets offer opportunities of mixing and matching components often from different suppliers, resulting in systems that can vary significantly across consumers. In such markets, consumers are exposed to a wide range of component prices to choose from. Computers would be an example of loosely coupled systems. Computer systems often require a high-level of technological specification, such as disk size, software choice and installation, memory, monitor, modem, router or network connection, etc. At the same time, however, the components are usually easily interoperable across different brands and can function in different combinations.i
The economic rationale driving mix and match interoperability have been analytically examined by Matutes and Regibeau (1988), Economides (1989), Venkatesh and Kamakura (2003), etc. The option to mix and match is of value to consumers who can then create systems closer to their idiosyncratic preferences (e.g. HP CPU with NEC Monitor). In the various analytical models, firms in loosely coupled systems markets generally emphasize component level pricing as a means of offering such value. In tightly coupled systems markets, firms may offer some component level prices to span the heterogeneity in consumer tastes, but firm emphasis is often on complete systems prices. This is because decoupling the components to create new systems may be costly or even infeasible (e.g. decoupling a Canon Lens and replacing it with a Pentax one). While similar considerations apply to our analysis of the different systems markets, the current paper focuses on how these differences anchor predictable variation in consumers’ knowledge of different systems and components’ prices. We now elaborate upon rational inattention, as a perspective with particular relevance to explaining how these differences influence the seller’s pricing decisions; specifically price reductions.
7
Rational Inattention (RI)
When firms make any price change the consumer must process the information to estimate her best reaction (e.g. how much to change consumption, whether to switch sellers, whether to negotiate, etc.). If it is costless, consumers would process information from all price changes no matter how small. However, it is not costless. Consumers must put in time and effort to understand the implications of the new price before deciding on their response. Therefore, when the presumed marginal benefits of processing the information are outweighed by the marginal costs associated with such effort, the consumer will rationally ignore the price changes. The key impact of this inattention is that consumers do not respond to small price changes, resulting in locally inelastic demand. Salop (1977) and Rubenstein (1993) theorize how this affects the firm’s pricing practices. Chen et al. (2008) offer evidence consistent with this view.
However, to presume all small price changes of similar magnitude require the same processing effort would not be appropriate. The degree of “smallness” can be highly contextual. In particular, consumer familiarity with some prices may make processing much simpler. For example, price changes in daily use products like cooking oil and breakfast coffee may be more easily noticed and processed by the average consumer than similar changes in less frequently purchased items like gourmet olive oil and specialty tea.
At an individual level, someone who buys printer toner regularly will notice and process price changes in toner prices much more efficiently than someone who buys toner only infrequently. The relative importance of the decision is also a factor. For example, a new home buyer will pay much closer attention to the change in the purchase price of the house she wants to buy, compared to changes in say, her agent’s fees. The latter will be worth processing only when it changes by a large amount.
Indeed, the research literature in marketing on JND and the related construct, latitude of price acceptance, addresses a similar issue. Lichtenstein (1988) found that consumers with greater knowledge of prices have narrower latitudes of price acceptance because they are more likely to “notice” any deviations. Similarly, Kalyanaram and Little (1994) found latitude of price acceptance is narrower for consumers with greater frequency of purchases – the greater frequency presumably resulting in greater familiarity and knowledge of prices and consequently, greater likelihood of “noticing” deviations. Posed in terms of consumer information processing costs, the latitude of price acceptance can be seen to be motivated by the same principle as rational inattention (RI) – the marginal information processing costs being smaller for those already endowed with greater price knowledge and familiarity – hence resulting in a smaller zone of inattention.ii
For marketers concerned with price reductions, this perspective is especially compelling. While large reductions will always get the attention of consumers, the real challenge is to reduce prices by small enough magnitudes. Small price reductions are redundant if consumers will ignore them. At the same time large reductions are unwarranted if smaller reductions will be enough to generate consumer attention. We now apply this perspective to systems.
Rational Inattention and Multi-component Systems
Consumers face different decisions in different systems markets. The predominance of systems level pricing in tightly coupled markets implies that consumers generally encounter more systems prices than individual component prices. Consequently, their average knowledge

8
and familiarity with systems prices are likely to be higher, compared to that of component prices. It follows from the earlier discussion that ceteris paribus, this would result in a lower cost of processing systems price changes when compared to processing component price changes. Thus, effectively, in tightly coupled systems markets, consumers will pay closer attention to systems price changes than to changes in component prices.iii
For loosely coupled markets, the situation is reversed. The greater prominence of component level pricing here implies that consumers generally encounter more component level prices and are more likely to encounter purchase situations where they have to mix and match different components. Consequently, their knowledge and familiarity with prices of components are likely to be higher than of complete systems. It follows that ceteris paribus, this would result in a lower cost of processing price changes of components compared to systems. Thus, effectively, in loosely coupled systems markets, consumers will pay closer attention to component price changes than to changes in systems prices.
The premises behind these insights are well accepted in marketing. The notion that certain pricing practices may be so widespread, as to result in greater consumer familiarity of such prices goes as far back as Ginzberg (1936). Later work explored how knowledge and familiarity of prices impact consumer decisions (Monroe 1973, Lichtenstein 1988, Kalyanaram and Little 1994). We now synthesize the discussions to derive testable hypotheses.
Price Reductions Hypotheses
As Chen et al. (2008) speculate, firms may not only be aware of the regions of inelastic demand related to inattention, but a profit maximizing firm may have little incentives to make small price reductions in that region. Any price reduction by the firm must therefore be large enough for the firm to see any consumer response. It follows that if consumers are more likely to ignore small price changes, as is likely for components in tightly coupled systems markets, firms will have an incentive to implement only deep price reductions for those products. Small reductions would pass under the radar of the consumers and thus not benefit the firm. When price change is costly, it makes such small reductions even less probable. On the other hand, if consumers are likely to pay attention to even small price changes, as is likely for systems in tightly coupled systems, the firms may find deep reductions redundant. Hence, we have:
H1a: In tightly coupled systems markets, price reductions for components are deeper than price reductions for systems.
Similarly, if consumers are more likely to ignore small price changes in systems prices as is likely in loosely coupled systems markets, profit maximizing firms will have an incentive to implement only large price reductions for those products. Correspondingly, because consumers are likely to pay attention to even small price changes for components in loosely coupled markets, the firms may find large price reductions for components redundant. Hence, we have:
H1b: In loosely coupled systems markets, price reductions for systems are deeper than price reductions for components.
Note that H1a and b focus on relative differences in price reductions. The exact magnitudes of these reductions will of course be determined by other important contextual factors like costs, competition, etc.iv Nevertheless, the normative framework underlying the hypotheses suggests better firm outcomes are associated with the predicted pricing patterns. Given our attention centric theory, we focus on received attention as the relevant firm-level outcome.

9
Attention Outcome Hypotheses
From a pragmatic perspective, large price reductions should always generate greater attention than small ones.v Yet, H1a and b suggests specific differences between systems and components in the manner these reductions influence attention, contingent on the type of systems. In tightly coupled markets, deep reductions in systems prices may not have significant marginal impact because small reductions generate sufficient attention. On the other hand, deep reductions in component prices are likely to have significant impact because small reductions may not be enough to generate sufficient attention.
The situation is reversed for loosely coupled markets. Deep reductions in systems prices are likely to have significant impact on attention because small reductions may not generate sufficient attention. However, deep reductions in component prices may not have significant marginal impact on attention because small reductions may be enough to generate sufficient attention. We formalize these hypotheses below before moving on to the empirical section.
H2a: In tightly coupled systems markets, deep reductions in component prices have a larger impact on attention than such reductions in systems prices.
H2b: In loosely coupled systems markets, deep reductions in component prices have a smaller impact on attention than such reductions in systems prices.
EMPIRICAL DESIGN
We examine the hypotheses in the context of two systems: cameras and computers, tentatively characterized as tightly coupled and loosely coupled systems, respectively. We first test for the validity of these characterizations in two complementary studies that look for convergence of supply and demand side perceptions (Studies 1 and 2). Next, we address the data needed, and the specifications, for the hypotheses tests (Study 3). Both price (changes) and suitable firm level attention data are typically difficult to obtain. We address the first by creating a unique dataset of Internet prices of cameras and computers. For the second, we compile an independent secondary dataset of firm level traffic in the form of unique web page visits.
Validation Studies for Systems Characterization: Studies 1 and 2
The underlying economic paradigm that frames our propositions assumes sellers (supply side) take into account end-user (demand side) perceptions in setting their prices. For the proposed pricing patterns to be considered stable, the supply and demand side perceptions of the systems markets must match. If they do, it would also be compelling evidence supporting our characterization of the systems markets and by extension, our pricing framework. In this spirit we conduct two studies, one each on the supply and demand sides. For ease of reference we call these Studies 1 and 2 respectively.vi
Study 1 consisted of a six month long web-based survey of managers in stores that sold cameras and/or computers. A sampling frame of 949 phone numbers was compiled manually from several published listings of retailers in a large North American metropolitan area. Subsequent phone calls qualified 317, finally generating a total of 137 completed responses. In terms of reported sample characteristics, almost 61% sold cameras, 95% sold computers, and 58% sold both. The key respondents consist largely of middle to senior managers who were knowledgeable of in-store customer behavior and decision making.

10
Study 2 involved a survey of 170 business administration majors to explore how cameras and computers are perceived by end users. The sample was almost evenly split between third or fourth year undergraduates and MBAs. The survey was a paper and pencil task that queried respondents about their perceptions of camera and computer systems.
We summarize the relevant results of both studies under three broad topics: (a) market structure; (b) demand and supply side perceptions; and (c) price knowledge consistency. To conserve space, we have created separate Web Appendices that provide details about these studies, including sample characteristics, scale validation, robustness and statistical tests.
(a) Market structure
Our characterization of cameras as tightly coupled and computers as loosely coupled systems presumes specific market structures associated with each. In particular, we expect the camera markets to be more systems dominated with lesser inter-brand mixing and matching. Computers on the other hand are expected to be driven largely by components with a much larger degree of inter-brand mixing and matching.
To explore the validity of these characterizations, we proceeded as follows, using data from Study 1. The responding managers were first asked to identify a typical camera or computer system sold by a store. They were then asked to identify the brands of the components comprising the system. (The components for the Camera systems were given as the Camera Body and Camera Lens. The components of a computer system were given as the Computer CPU and the Monitor.) We then tracked the number of responses that identified a single brand for all the components and the number that identified a multi-brand (mix-and-match) system.
We find that 89% of the camera systems identified were single brand systems, a majority which is consistent with our characterization of cameras as tightly coupled systems. However, 74% of the computer systems identified were mix-and-match systems, a majority which is consistent with our characterization of computers as loosely coupled systems. These observations comport with our characterizations of the two systems markets.
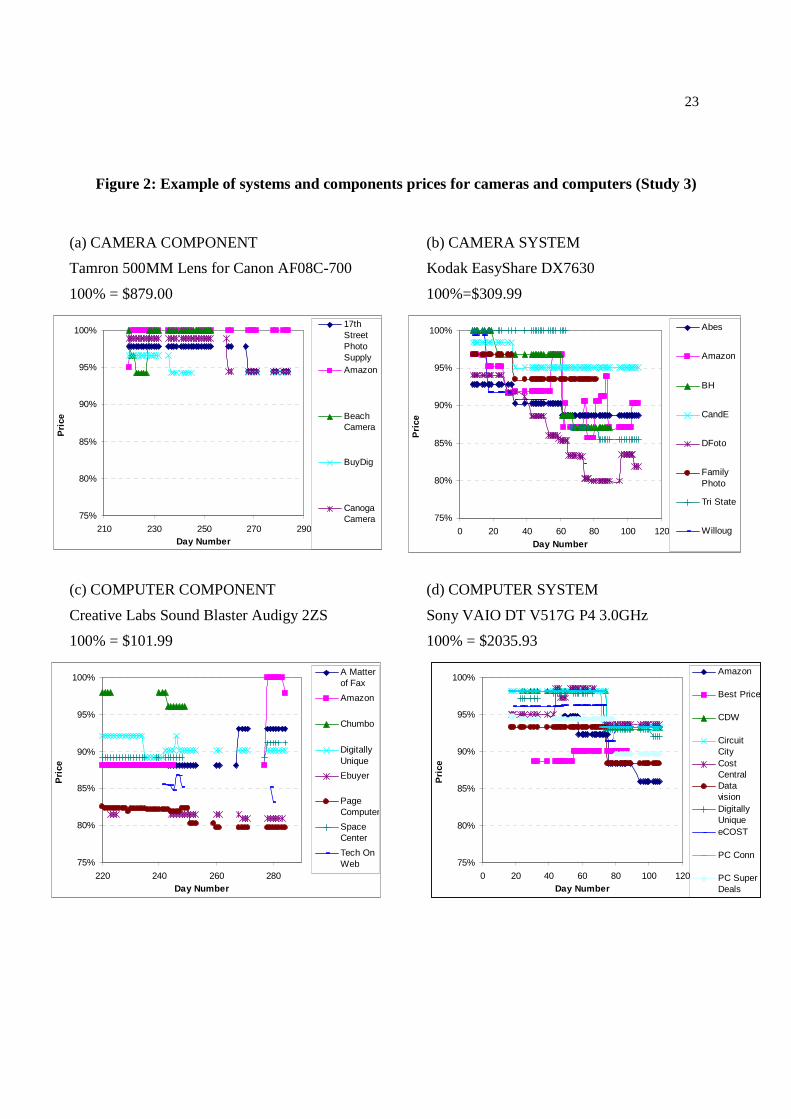
From the same data, based on the number of brand mentions, we also created a proxy for market concentration by calculating the four-firm Herfindahl-Hirschman Index (HHI-4). HHI-4 is the sum of the squares of the four highest market shares (%). A higher number implies greater market concentration. The HHI-4 measures, shown in Table 1, indicate that the camera components markets are more concentrated (HHI-4 of 0.33 and 0.36) than the computer component markets (HHI-4 of 0.16 and 0.14). This yields a qualitatively similar picture of market structure as the earlier observation, with computer markets offering relatively more component choices than cameras, again confirming their characterizations as loosely and tightly coupled systems respectively.vii
[TABLE 1 ABOUT HERE]
(b) Supply and demand side perceptions
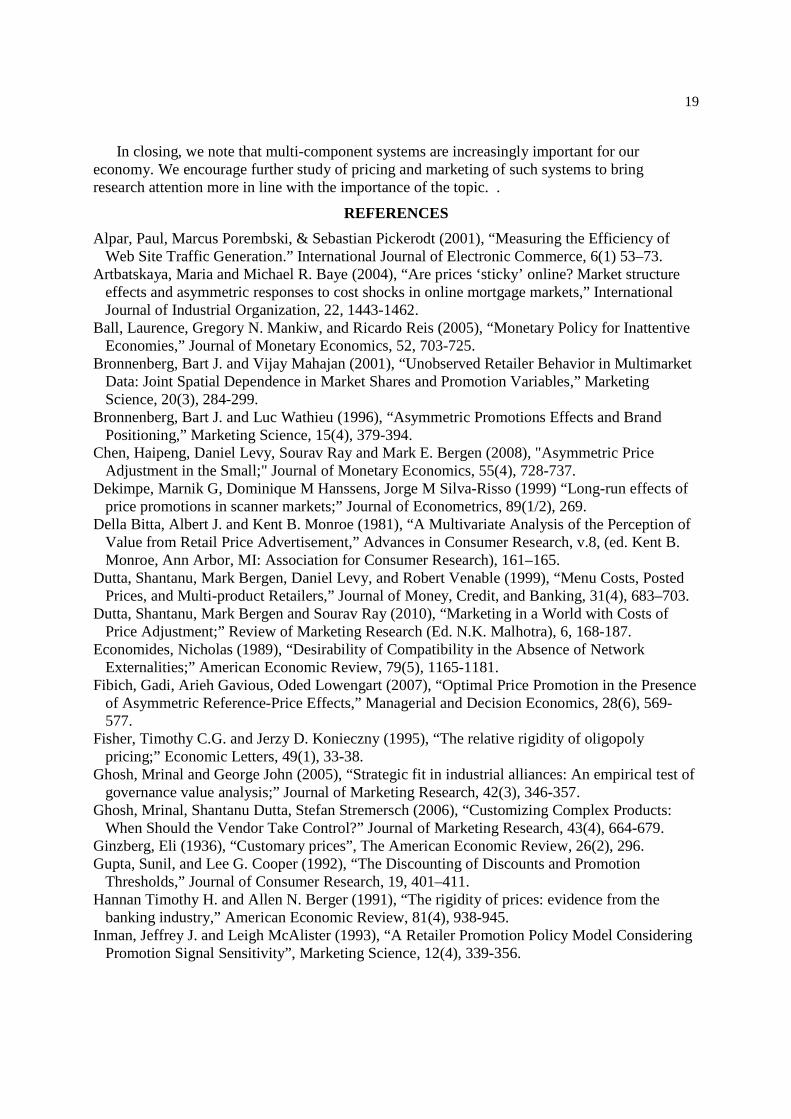
We provide a further check for the validity of the system characterization by directly asking respondents in both Studies 1 and 2 to characterize cameras or computers as tightly or loosely coupled systems. In Study 1, 56% of the responses categorized Cameras as tightly coupled and 73% categorized Computers as loosely coupled. In Study 2, 70% of the responses categorized Cameras as tightly coupled, while 63% categorized Computers as loosely coupled systems. The

11
results are represented graphically in Figures 1(a) and (b). We obtain similar convergence across the studies on a second measure. Using a four-item 7-point Likert type scale computers scored more than cameras on the degree to which they are perceived as loosely coupled systems. Thus each sample individually offers support for our a priori categorization of camera and computer systems. The convergence of perceptions from both the supply and demand sides offers another compelling layer of evidence in support of our characterizations of systems markets.
(c) Price knowledge consistency
One of our key assertions is that consumer inattention is a function of whether systems are perceived as loosely or tightly coupled and that this is a rational outcome related to consumer knowledge and familiarity with the prices. We check the broader nomological validity of this idea in several ways. To save space here we only briefly report the results leaving the details to the Web Appendix for the interested reader.
A reasonable test of the nomological validity of our framework in our context would be to check whether market participants who perceive a system as loosely coupled are likely to be more knowledgeable of component prices than those who perceive a system as tightly coupled. Using a three-item 5-point Likert scale to measure the degree of knowledge of component prices in Study 2, we find this to be the case (Camera: 3.637> 2.571, Computer: 4.109> 3.160). Using a similar scale to measure managers’ perceptions of the degree of consumer knowledge of component prices, we find a similar result in Study 1, though not statistically significant (Cameras: 3.783> 3.333 and Cameras: 4.119> 3.650). See Figures 1(c)-(d).
In addition, in Study 1, we use a two item 5-point Likert scale to measure the manager’s perceptions of consumers’ perceived uncertainty with systems prices, and a five item 5-point Likert scale for a similar measure for component prices. The relative magnitudes are as expected. For Cameras, uncertainty with component prices (4.29) is greater than uncertainty with systems prices (4.10). For Computers, uncertainty with component prices (4.02) is less than that with system prices (4.32), albeit the latter comparison is not statistically significant (Figure 1(e)). For completeness, we also report in Figure 1(f) the results of another study where we use a single item 7-point Likert type scale to measure the manager’s perceptions of consumer awareness of small price change. While the differences are not statistically significant, the magnitudes are consistent with our framework.
[FIGURE 1 ABOUT HERE]
We thus find evidence that consumer knowledge of prices varies across different systems types in a manner consistent with the theory we articulate. This sets up the next study where we investigate pricing practices and conduct our hypotheses tests.
Downward Price Rigidities, Price Change and Attention Hypotheses: Study 3
For Study 3, we collected both primary data from online sellers as well as secondary data on page views from third party sources. We now turn to the data, general patterns of downward price rigidity, measures for different variables, the estimation models and tests of our hypotheses.
Data
We use a customized data-collecting software agent written in Java, and a scheduler used to run the agent program every day, to retrieve data from a popular shop ’bot, www.shopping.com, where thousands of vendors provide daily or hourly information. The agent uses the ’bot to make

12
queries about selected computer and camera systems and components from various vendors (cf. Wood and Ow, 2005). We also manually collected the number of unique page views for each vendor, from www.ranking.com, which ranks web traffic to almost a million sites.
To create the products sample we restricted our considerations only to high end products and first classified them as systems (complete computer and camera systems) or components. Then we randomly selected the products within each, to finally retrieve price information for the eight products in Table 2. In an attempt to restrict our data to products that face similar levels of competition, we only include a product from a vendor if it sold for at least nine days, and had at least one price change. In addition, we only considered products that were sold by at least 15% of the vendors in this study. The resulting dataset contains 29,670 price changes from 669,557 daily price listings over a period of 283 days (from 1/18/2005 to 10/28/2005) from 102 different online stores and for 1,052 different products offered by these vendors.
[TABLE 2 ABOUT HERE]
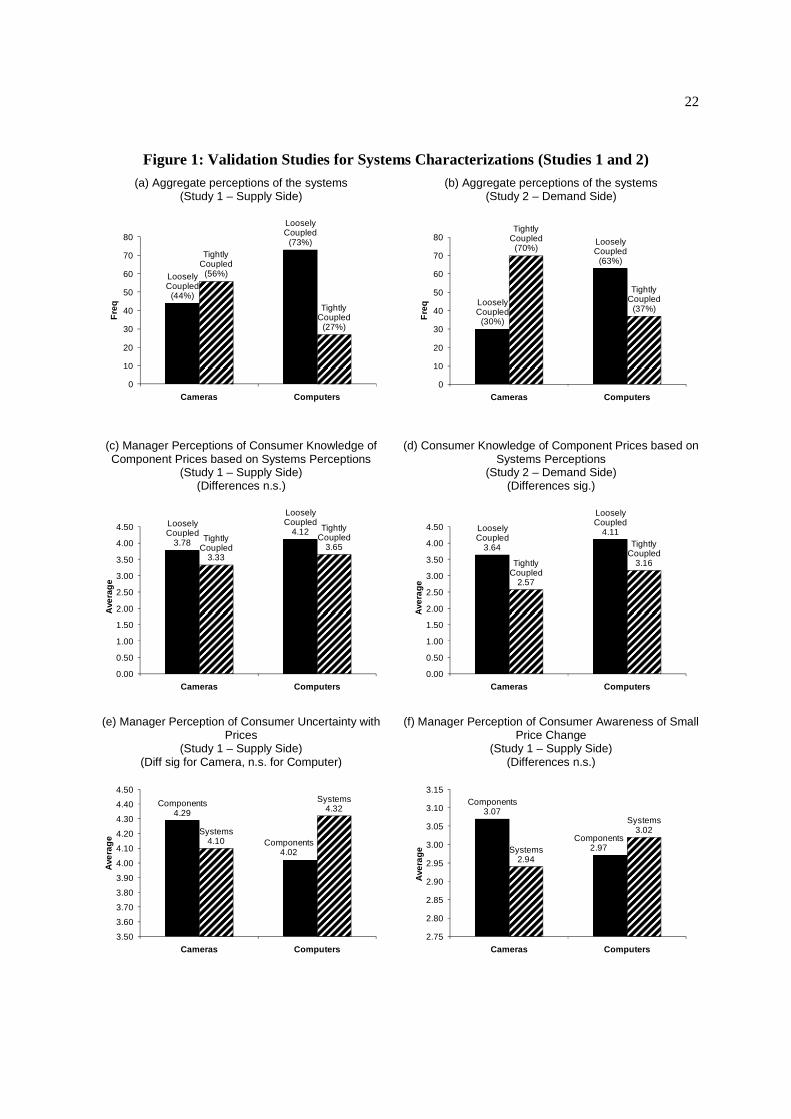
Figure 2 shows some examples of observed pricing patterns. Panels (a) and (b) present examples of the data collected for a camera component (Tamron 500MM Lens for Canon AF08C-700) and a camera system (Kodak EasyShare DX7630). Panels (c) and (d) present the data collected for a computer component (Creative Labs Sound Blaster Audigy 2ZS) and a computer system (Sony VAIO DT V517G P4 3.0GHz). To facilitate comparison, these figures are scaled as a percent of the highest price for the product. Notice that there is a greater tendency for the prices to drop, rather than to rise – a trend that is consistent across a majority of our cases.
[FIGURE 2 ABOUT HERE]
Several observations are pertinent in Figure 2. First, notice from panels (a) and (b) that there are relatively larger price reductions for camera components (median about 5% of the maximum price) than for camera systems (median about 2%). Panels (c) and (d) show the opposite, where the price reductions for the computer components appear smaller compared to that for the computer systems. Notice also that there are several missing data points in Figure 2. This is one of the hazards of this method of data collection requiring (counter-intuitively enough) a significant amount of manual effort.viii
Patterns of Downward Price Rigidity
The patterns observed in the examples hold even when we look at the entire sample. We find that the aggregate rigidity patterns differ between Computers and Cameras. For Computers the average price reductions are 1.54% (Systems) and 1.29% (Components), the difference being significant (t=2.43, p=0.015). For Cameras on the other hand, the average price reductions are 1.76% (Systems) and 2.02% (Components) which is also a significant difference (t=4.32, p=0.000). Hence, for Computers price reductions for systems are more than 19% greater (less rigid) than that for components; while for Cameras price reductions for systems are almost 13% less (more rigid) than that for components. In a purely descriptive sense, therefore, there is almost a 32% spread between the two systems. Of equal interest is that these patterns comport with our hypotheses regarding the firm’s pricing behavior. This is illustrated further through the empirical analyses that follow.

13
Measures
A. Dependent Variables
As the dependent variable for the firm’s pricing decisions, we create a measure of price reductions by taking the absolute value of the percentage price reduction. As a measure of received attention, we use the natural log of the number of times pages have been pulled up for the site. The measure for price reductions is a direct measure, while the measure of attention is a proxy since one can think of several ways of measuring attention (e.g. aided, unaided recall etc.). Note that we are not the first to use page views and site traffic as a measure of success (e.g. Palmer 2002, Alpar et al. 2001) and that many firms set page views as company goals.
B. Independent Variables
The key theoretical independent variables are the nature of the systems markets, and the nature of the products (systems or components). Based on our validation studies, we focus on the Camera and Computer markets as examples of tightly and loosely coupled systems markets, respectively. We identify the product as either a system or component (see Table 2, column 2).
C. Control Variables for Competition, Store and Brand Level Factors
The key control variables we use in our empirical model describe various aspects of competition. A number of studies have documented the impact of competition on price rigidity, albeit with conflicting results (cf. Hannan and Berger 1991; Fisher and Konieczny 1995; Artbatskaya and Baye 2004). Certainly, competition has often been argued as a central driver for price reductions (Mela et al. 1997; Bronnenberg and Wathieu 1996; Rajiv et al. 2002). We account for product, store and brand level competition in our empirical models. We measure product level competition by calculating the number of stores that sell the same product (PercentStores). We use store and brand level fixed effects in our empirical models to control for store and brand level competition and other unobserved variation at those levels. In addition we compute two other variables to control for store level variation in pricing proclivities. Stores may be more or less systems oriented in their pricing approaches. Therefore, one of the variables we compute is the percentage of products sold by the store that are systems (PercentSystem). This is meant to control for any secular tendency to sell systems over components. Similarly, since a number of stores in our sample sell both it cannot be ruled out that certain stores may set their prices more like computer sellers and others more like camera sellers. So another variable we include is the percentage of the products sold by the store that are cameras (PercentCamera).
D. Control Variables for other Contextual factors
To control for the effect of the price levels, we use the natural log of the product price (LN(Price)). We also use the cost of shipping as a percent of the price as another contextual factor (ShippingPercent). These also serve as proxy for any reference price effects (see Mazumdar et al. 2005). Finally, to control for inventory effects we use a tracking variable for whether the product was in or out of stock at the store (OutOfStock). All the variables we use are defined in Table 3.
Empirical Models and Results
Our model estimation and hypotheses testing are done in two stages. First, in Empirical Model 1, we investigate the pricing patterns (hypotheses H1a-b) separately for Cameras (Tightly

14
Coupled) and Computers (Loosely Coupled). Subsequently in Empirical Model 2, we investigate the attention outcomes (hypotheses H2a-b) separately for Cameras and Computers.
Empirical Model 1: Store price changes
The following model is used to estimate the impact of pricing unit (systems or components) on the magnitude of price reductions, accounting for the various control factors discussed earlier.
Abs(∆Price)isbt = α + β1 Systemi + γ1 Priceisbt + γ2 OutOfStockisbt + γ3 ShippingPercentisbt + θ1 PercentStoresi + θ2 (Store Fixed Effects)s + θ3 (Brand Fixed Effects)b + ε1 (1.1)
[TABLE 3 ABOUT HERE]
The key coefficient of interest is β1. Smaller price reductions are predicted for camera systems than for camera components; so we hypothesize that β1<0 for cameras (tightly coupled). Conversely, larger price reductions are predicted for computer systems than for computer components; so we hypothesize that β1>0 for computer (loosely coupled). We estimate the model separately for cameras and computers. Given some large variations in price changes observed in our data, we use the robust regression method using the statistical package Stata. This estimation technique dampens the outliers by reducing their weights and yields consistent estimators. The results are in Table 4 (panels 1a-b).
The results support the hypotheses. β1 is significant for both cameras and computers. In particular, for cameras, β1<0 (-0.00204), i.e. camera systems (component) prices are associated with smaller (larger) price reductions. For computers on the other hand, β1>0 (0.00468), i.e. computer systems (component) prices are associated with larger (smaller) price reductions.
Notice that the coefficients for LN(Price) and PercentStores are negative. We speculate these may capture the idea that higher price levels and greater product competition could be associated with products endowed with greater demand and attention, respectively, thus obviating the need for deeper price cuts. We also find several store and brand fixed effects are significant, suggesting the existence of unobserved store and brand level variables that play a role.
Empirical Model 2: Consumer attention
We now turn to the impact of the stores’ pricing practices on attention outcomes. The general crux of hypotheses H2a-b is that deep price reductions lead to different levels of (in)attention across systems and components contingent on whether the systems market is tightly or loosely coupled. Using Page-views as a proxy for received attention, the model then can be estimated separately for cameras and computers in the following form.
LN(Pageview)s = α2 + β21 Systemi + β22 Abs(∆Price)isbt + β22 (Systemi x Abs(∆Price)isbt) (2.1)
To derive the testable hypotheses, consider the following marginal effects:
∂LN(Pageview)∂Abs(∆Price)
� β22
+β23
System �=β22
+β23
=β22
� for Systems
for Components (2.2)
We start from the baseline expectation that β22+β23>0 and β22>0 because ceteris paribus, it is a fair maxim that large price reductions will generate greater consumer attention regardless of systems or components. However, in our framework we propose specific mechanisms that mute these effects which lead to our testable hypotheses.

15
Specifically, for cameras (tightly coupled) a small reduction in component prices may generate little attention, making the marginal impact of deeper price reductions salient: β22>>0. However, small reductions in systems prices are expected to generate sufficient attention, reducing the marginal impact of deeper price reductions. This mutes the marginal impact (β22+β23), leading to the testable hypothesis, β23<0 (H2a).
For computers (loosely coupled) on the other hand, a small reduction in components prices is expected to generate sufficient attention, muting the marginal impact of deeper reductions (β22). However, small reductions in systems prices may be ineffective, inflating the marginal impact of deeper price reductions: β22+β23 >>0. This leads to the testable hypothesis, β23>0 (H2b).
Notice that the base model as specified in (2.1) suffers from several specification challenges. First, since page views are already store level observations, we cannot simply use store level fixed effects to capture unobserved heterogeneity between the stores. Second, since site traffic could affect pricing decisions, Abs(∆Price) may be an endogenous variable. Third, we have no specific threshold for what constitutes sufficiently deep price reductions.
There is no fool proof way to address the first issue. We include two store level factors to control for any unobserved variation in pricing proclivities at the store level – the percentage of the products sold at the store that are systems (PercentSystem) and the percentage of the products sold in the store that are cameras (PercentCamera). To address the second issue we first run a Wu-Hausman test which does reject the null hypothesis of exogeneity of Abs(∆Price) – (see Appendix). We then implement a three stage least squares procedure by estimating two equations – one for the price change and another for page views. The price change equation is similar to Empirical Model 1 except that we drop the store level fixed effects. The predicted values of this regression are then used to estimate the page view equation. We use the robust regression technique for both estimations.
To address the third issue, we must first address what constitutes a sufficiently deep price reduction in our sample. Note that H1a-b gives us a relative prediction of what constitutes “deep enough” for different systems and components but does not help us calibrate any specific threshold of price changes below which there is little or no attention response. In general, since observed price reductions reflect sellers’ efforts to seek attention; we expect most of the observed price changes to actually be deep enough. Nevertheless, in the absence of a specific calibrated threshold, we let the data speak for itself. Thus, we run our page view analyses on all the predicted price reductions as well as on a restricted sample of reductions that are greater than the 10% percentile threshold. (We also examine the model by restricting the price reductions to those above the 25% and 50% percentile thresholds in the Web Appendix, with similar effects noted.) The following models are estimated separately for cameras and computers, the key parameter being β23. The observed effects are significant for both systems in both samples.
Abs(∆Price)isbt = α + β1 Systemi + γ11 Priceisbt + γ12 OutOfStockisbt + γ13 ShippingPercentisbt + θ11 PercentStoresi + θ12 (Brand Fixed Effects)b + ε2 (2.3)
ĝ = α*1 + β*
11 Systemi + γ*11 Priceisbt + γ*
12 OutOfStockisbt + γ*13 ShippingPercentisbt
+ θ*11 PercentStoresi + θ*
12 (Brand Fixed Effects)b (2.4)
LN(Pageview)s = α2 + β21 Systemi + β22 ĝ + β23 (Systemi x ĝ) + γ21 PercentSystems + γ22 PercentCameras + ε4 (2.5)
16
The results in Table 4, panels 2a,b support hypotheses H2a and b. For cameras β23 <0 (-0.14088 for the entire sample and -0.18778 for the 10%ile) while for computers β23 >0 (2.82047 and 2.92730). Other coefficients are consistent with the baseline expectation that deep reductions generate attention whether systems or components. For cameras: β22 + β23 >0 (for both samples, based on Wald test: t=13.16 and 11.50), and β22 >0 (0.68177 and 0.67843). For computers: β22 + β23 > 0 (based on Wald test: t=106.75 and 98.95); however, β22 is not significant in either sample (consistent with the notion that deep price reductions may be redundant for components in computer markets).ix
For completeness, note the positive coefficients for PercentSystem and PercentCamera. We speculate this reflects that “generalist” consumers, who likely care more for complete systems, outnumber “niche” consumers, who care more for components. Thus stores positioned for the generalist draw more attention by selling more systems. A similar effect may operate for stores with more cameras, which are more likely to be sold as systems anyways, being tightly coupled.
[TABLE 4 ABOUT HERE]
DISCUSSION
To summarize, we examine hypotheses about multi-component systems markets pertaining to firms’ price reductions and attention outcomes. Our conceptual bases borrow from the literature concerning rational inattention of consumers to certain price reductions. Our data consist of two primary surveys, to validate the empirical context, and a novel dataset of internet prices and store traffic. Our results show that downward price rigidity (in terms of price reduction magnitudes) is contingent on the nature of systems markets (tightly or loosely coupled) and that market response measured in terms of attention received by firms is consistent with the normative implications of the theory. In the following paragraphs, we now comment on our contributions to the research literature and managerial practice.
Research Contributions
Research on systems marketing is relatively sparse (notable exceptions being Wilson et al. 1990; Venkatesh and Kamakura 2003; and Ghosh et al. 2006). In particular, despite a rich history in marketing of research on price promotions (cf. Tellis and Zufryden 1995), our understanding of how these operate in multi-component contexts is limited. To the best of our knowledge, ours is the first paper in marketing to broach this issue by examining price adjustments, specifically reductions, in systems markets. We show how price reductions in systems markets differ for complete systems as compared to individual components, recognizing a critical distinction between tightly coupled and loosely coupled systems.
This distinction between loosely and tightly coupled systems offers a more nuanced interpretation of the multi-component landscape, as compared with the traditional mix and match, technological compatibility frameworks (e.g., Matutes and Regebeau 1988). In particular, our characterization helps us frame mixing and matching as a matter of degree, recognizing consumer focus and the limits to knowing everything about a market.
The current paper builds on an emerging literature in marketing around asymmetric price rigidities. While Ray et al. (2006) derive these asymmetries from a consideration of price adjustment costs; we derive these from a consideration of the rational inattention of consumers. Both explanations are relevant to understanding aggregate price rigidities and, hence, may add to

17
the new-Keynesian dialog around microeconomic determinants of such macro phenomena.x Our analysis goes further by illustrating an instance of downward rigidity of prices which is asymmetric across different types of systems; this differs from price rigidity patterns studied in the past.
The current paper also connects to literature in other fields concerning rational inattention to a firm’s pricing decisions. Despite its theoretical foundation in economics (e.g. Salop, 1977; Rubenstein. 1993) and a rich related literature in marketing, the practical market level implications of rational inattention for disaggregate pricing behavior are under-explored. Most associated empirical work is in macroeconomics (cf. Ball et al. 2005; Sims, 2003; Reis 2006a,b). Nevertheless, there is a growing body of literature interested in micro considerations like seller decisions given rational inattention of buyers (e.g. Chen et al. 2008). Wathieu and Bertini (2007) are among the few in marketing who analyze firms’ pricing decisions under assumptions of rational inattention. Our paper builds on their insights by investigating market level outcomes of such consumer processes. In the process, we also expand the latitude of price acceptance line of work (e.g. Kalyanaram and Little 1994) to systems markets by explaining the bases of a systematic variation of price acceptance bands across different systems and components.
Empirically, a contribution of this paper consists of innovative use of data collected from the Internet. New data capture technologies are making increasingly disaggregate data available from multiple sources. These offer opportunities for addressing newer and novel questions. Using data from two different sources, we offer tests not only of our predictions of firms’ pricing behavior, but also of the normative implications of our theory by explaining outcome variation across firms as a function of the deployed pricing patterns (see Ghosh and John 2005 in an industrial marketing context for another example of such approach).
Managerial Contributions
Our paper offers several insights for managers in systems markets, especially for managing price discounts. Our key findings suggest managers should provide larger discounts for components than for systems in tightly coupled markets; the reverse being true for loosely coupled markets. Indeed, our aggregate results show that systems price reductions are 13% smaller than component price reductions for Cameras (tightly coupled) while for Computers (loosely coupled) they are 19% larger.
These results have implications for market building, competitive pricing and inventory management. To build attention and market share, managers should use smaller price discounts for systems (relative to price discounts for components) in tightly coupled markets than in loosely coupled markets. Our results also suggest that during periods of increased price competition, systems (components) are the more effective foci for responding to competitive price cuts in tightly (loosely) coupled systems markets. That is, during these periods, discounts in the form of bundled system prices would be more effective in tightly coupled markets than in loosely coupled ones. When small price cuts are enough to generate attention, managers can combine such price cuts with non-price options to blunt competitive pressures (e.g. creative marketing efforts leveraging the increased attention to cross-sell within the category). In contrast, managers facing the task of clearing excess inventory of components (e.g. when replacement of old models with new ones is impending) should deploy larger discounts in component prices in tightly coupled than in loosely coupled systems markets. Our framework thus helps managers in

18
systems markets ascertain what constitutes a suitable price discount – avoiding discounts that are either so large as to leave money on the table or so small as to not spur any consumer response.
Our framework also suggests tailoring other non-price elements of the marketing mix according to the type of systems. Some of these seem obvious and others may be worthy of future investigation. As an example, we conjecture that advertising will be most effective for tightly coupled systems if it focuses on the whole system. In such markets, education about complete systems would be more important than education about components. (Of course, if there are large enough segments of consumers or service/repair staff that are specialists, managers should also provide information about components targeted to these market segments.) By contrast, for loosely coupled systems, it may be better to use targeted advertising and communications for particular components or for particular segments that require high performance for these components. Education about particular components and guidance about how to choose the optimal mix of components is very important for loosely coupled systems markets.
Along similar lines, we conjecture that the type of systems moderate the effectiveness of store merchandising strategies. More unified presentations of the systems, in groupings demonstrated in the store are suggested for tightly coupled systems, and store merchandise grouped according to various component market departments, for loosely coupled systems.
More broadly, we highlight marketing challenges in systems markets. Systems span a wide range of product types beyond cameras and computers including such diverse categories as personal hygiene (shaving razors and hair care products like hair color, shampoo, conditioner etc.), entertainment (component audio systems, and gaming systems like PlayStation, Wii etc.), home improvement supplies and tools (paint supplies, stapler guns, drywall and flooring kits etc.) and even services (automobile servicing like oil change, professional services like lawn care etc.). The importance of multi-component systems in modern economies underscores the need for specialized research tools for characterizing multi-component systems and managing activities in such markets. In this context, the perceptual and economic measures in Studies 1 and 2 constitute measurement approaches for managers relevant for characterizing systems markets.
CONCLUSIONS
In conclusion, we offer a theory to explain price reductions in systems markets. In this we draw upon rational inattention, emphasizing the distinction between what we call tightly coupled and loosely coupled systems. We then empirically validate the framework. In the process, we weave together insights and methods from marketing, economics and information systems.
Nevertheless, our results are not without limitations which suggest future research directions. Generalization across all systems markets is still an empirical issue. We focus on two product systems, cameras and computers as exemplars of tightly and loosely coupled systems. Many other systems exist. We look forward to similar studies in these other markets. In particular, service systems may have specific structural properties with attendant implications for pricing that may require further broadening of our framework.
We also note that rational inattention constitutes one possible lens for understanding pricing in multi-component systems markets. While we have controlled for several sources of variation in the markets we have studied, including dimensions of competition and several contextual factors, we acknowledge other factors not considered in the current study may also be relevant.
19
In closing, we note that multi-component systems are increasingly important for our economy. We encourage further study of pricing and marketing of such systems to bring research attention more in line with the importance of the topic. .
REFERENCES
Alpar, Paul, Marcus Porembski, & Sebastian Pickerodt (2001), “Measuring the Efficiency of Web Site Traffic Generation.” International Journal of Electronic Commerce, 6(1) 53–73.
Artbatskaya, Maria and Michael R. Baye (2004), “Are prices ‘sticky’ online? Market structure effects and asymmetric responses to cost shocks in online mortgage markets,” International Journal of Industrial Organization, 22, 1443-1462.
Ball, Laurence, Gregory N. Mankiw, and Ricardo Reis (2005), “Monetary Policy for Inattentive Economies,” Journal of Monetary Economics, 52, 703-725.
Bronnenberg, Bart J. and Vijay Mahajan (2001), “Unobserved Retailer Behavior in Multimarket Data: Joint Spatial Dependence in Market Shares and Promotion Variables,” Marketing Science, 20(3), 284-299.
Bronnenberg, Bart J. and Luc Wathieu (1996), “Asymmetric Promotions Effects and Brand Positioning,” Marketing Science, 15(4), 379-394.
Chen, Haipeng, Daniel Levy, Sourav Ray and Mark E. Bergen (2008), "Asymmetric Price Adjustment in the Small;" Journal of Monetary Economics, 55(4), 728-737.
Dekimpe, Marnik G, Dominique M Hanssens, Jorge M Silva-Risso (1999) “Long-run effects of price promotions in scanner markets;” Journal of Econometrics, 89(1/2), 269.
Della Bitta, Albert J. and Kent B. Monroe (1981), “A Multivariate Analysis of the Perception of Value from Retail Price Advertisement,” Advances in Consumer Research, v.8, (ed. Kent B. Monroe, Ann Arbor, MI: Association for Consumer Research), 161–165.
Dutta, Shantanu, Mark Bergen, Daniel Levy, and Robert Venable (1999), “Menu Costs, Posted Prices, and Multi-product Retailers,” Journal of Money, Credit, and Banking, 31(4), 683–703.
Dutta, Shantanu, Mark Bergen and Sourav Ray (2010), “Marketing in a World with Costs of Price Adjustment;” Review of Marketing Research (Ed. N.K. Malhotra), 6, 168-187.
Economides, Nicholas (1989), “Desirability of Compatibility in the Absence of Network Externalities;” American Economic Review, 79(5), 1165-1181.
Fibich, Gadi, Arieh Gavious, Oded Lowengart (2007), “Optimal Price Promotion in the Presence of Asymmetric Reference-Price Effects,” Managerial and Decision Economics, 28(6), 569-577.
Fisher, Timothy C.G. and Jerzy D. Konieczny (1995), “The relative rigidity of oligopoly pricing;” Economic Letters, 49(1), 33-38.
Ghosh, Mrinal and George John (2005), “Strategic fit in industrial alliances: An empirical test of governance value analysis;” Journal of Marketing Research, 42(3), 346-357.
Ghosh, Mrinal, Shantanu Dutta, Stefan Stremersch (2006), “Customizing Complex Products: When Should the Vendor Take Control?” Journal of Marketing Research, 43(4), 664-679.
Ginzberg, Eli (1936), “Customary prices”, The American Economic Review, 26(2), 296. Gupta, Sunil, and Lee G. Cooper (1992), “The Discounting of Discounts and Promotion
Thresholds,” Journal of Consumer Research, 19, 401–411. Hannan Timothy H. and Allen N. Berger (1991), “The rigidity of prices: evidence from the
banking industry,” American Economic Review, 81(4), 938-945. Inman, Jeffrey J. and Leigh McAlister (1993), “A Retailer Promotion Policy Model Considering
Promotion Signal Sensitivity”, Marketing Science, 12(4), 339-356.

20
Inman, Jeffrey J, Leigh McAlister, Wayne D. Hoyer (1990), “Promotion Signal: Proxy for a Price Cut?”, Journal of Consumer Research, 17(1), 74-81.
Jedidi, Kamel, Carl F Mela, Sunil Gupta (1999), “Managing advertising and promotion for long-run profitability”, Marketing Science, 18(1), 1-22.
Kalwani, Manohar U. and Chi Kin Yim (1992), “Consumer Price and Promotion Expectations: An Experimental Study,” Journal of Marketing Research, 29, 90–100.
Kalyanaram, Gurumurthy and John D.C. Little (1994), “An Empirical Analysis of Latitude of Price Acceptance in Consumer Package Goods”, Journal of Consumer Research, 21(3), 408-418.
Kauffman, Robert J. and Wood, C.A. (2007) “Follow the Leader: Price Change Timing and Strategic Pricing in E-Commerce,” Managerial and Decision Economics, 28(7), 679-700.
Lal, Rajiv, V. Padmanabhan (1995), “Competitive response and equilibria”, Marketing Science, 14(3) 101-108.
Levy, Daniel, Shantanu Dutta, and Mark Bergen (2002), “Heterogeneity in Price Rigidity: Evidence from a Case Study Using Micro-level Data,” Journal of Money, Credit, and Banking, 34(1), 197–220.
Lichtenstein, Donald R., Peter H. Bloch and William C. Black (1988), “Correlates of price acceptability”. Journal of Consumer Research, 15(2), 243-252.
Mankiw, Groegory N. and Ricardo Reis (2002), “Sticky Decisions versus Sticky Prices: A Proposal to Replace the New Keynesian Phillips Curve,” Quarterly Journal of Economics, 1295–1328.
Matutes, Carmen and Pierre Regibeau (1988), "Mix and match: product compatibility without network externalities;” Rand Journal of Economics, 19(2), 221-234.
Mazumdar, Tridib, S.P. Raj, Indrajit Sinha (2005), “Reference Price Research: Review and Propositions”, Journal of Marketing, 69(4), 84-102.
Mela, Carl F, Sunil Gupta, Donald R Lehmann (1997), “The long-term impact of promotion and advertising on consumer brand choice”, Journal of Marketing Research, 34(2), 248-261.
Monroe, Kent B. (1973), Buyers' subjective perceptions of price. Journal of Marketing Research, 10(1), 70-80.
Moorthy, Sridhar. (2005), “A General Theory of Pass-Through in Channels with Category Management and Retail Competition,” Marketing Science, 24 (1), 110-122.
Müller, Georg and Sourav Ray (2007), “Asymmetric Price Adjustment: Evidence from Weekly Product-Level Scanner Price Data,” Managerial and Decision Economics, 28(7), 723-736.
Nijs, Vincent R., Marnik G. Dekimpe, Jan-Benedict E.M. Steenkamp, Dominque H. Hanssens (2001), “The category-demand effects of price promotions”, Marketing Science, 20(1), 1-22.
Palmer, Jonathan W. (2002) “Web Site Usability, Design, and Performance Metrics.” Information Systems Research 13 (2), 151-167.
Pauwels, Koen (2007), “How Retailer and Competitor Decisions Drive the Long-Term Effectiveness of Manufacturer Promotions for Fast Moving Consumer Goods,” Journal of Retailing, 83 (3), 297-308.
Peltzman, Sam (2000), “Prices Rise Faster Than They Fall,” Journal of Political Economy, Vol. 108(3), 466–502.
Rajiv, Surendra, Shantanu Dutta and Sanjay K. Dhar (2002), “Asymmetric Store Positioning and Promotional Strategies: Theory and Evidence,” Marketing Science, 21(1), 74-96.
Ray, Sourav, Haipeng Chen, Mark Bergen, Daniel Levy (2006), “Asymmetric Wholesale Pricing: Theory and Evidence,” Marketing Science, 25(2), 131-154.

21
Reis, Ricardo (2006a), “Inattentive Consumers” Journal of Monetary Economics, 53, 1761-1800. Reis, Ricardo. (2006b), “Inattentive Producers,” Review of Economic Studies, 73, 793-821. Rotemberg, Julio (1987), "The New Keynesian Microfoundations." NBER Macroeconomics
Annual 1987, edited by Stanley Fischer. 1987. Rubenstein, Ariel (1993), “On Price Recognition and Computational Complexity in a
Monopolistic Model,” Journal of Political Economy, 101(3), 473-484. Salop, Steven (1977), “The Noisy Monopolist: Imperfect Information, Price Dispersion and Price
Discrimination,” The Review of Economic Studies, 44(3), 393-406. Shugan, Steven. M. (1980), “The Cost of Thinking,” Journal of Consumer Research, 7, 99-111. Sims, Christopher A. (2003), “Implication of Rational Inattention,” Journal of Monetary
Economics, 50, 665–90. Stremersch, Stefan, Allen M. Weiss, Benedict G.C. Dellaert and, RuudT. Frambach (2003),
“Buying modular systems in technology-intensive markets,” Journal of Marketing Research, 40(3), 335-350.
Tellis, Gerard J. and Fred S. Zufryden (1995), “Tackling the Retailer Decision Maze: Which Brands to Discount, How Much, When and Why?” Marketing Science, 14(3), 271-299.
Tversky, Amos and Daniel Kahneman (1991), “Loss aversion in riskless choice: A reference-dependent model”, Quarterly Journal of Economics, 106(4), 1039-1061.
Venkatesh, R. and Vijay Mahajan (1997), “Products with branded components: An approach for premium pricing and partner selection,” Marketing Science, 16(2), 146-165.
Venkatesh, R. and Wagner Kamakura (2003), “Optimal bundling and pricing under a monopoly: Contrasting complements and substitutes from independently valued products,” Journal of Business, 76(2), 211-231.
Wathieu, Luc and Marco Bertini (2007), “Price as a Stimulus to Think: The Case for Willful Overpricing,” Marketing Science, 26(1), pp.118-129.
Wilson, Lynn O., Allen M. Weiss and George John. (1990), “Unbundling of industrial systems,” Journal of Marketing Research, 27(2), 123.
Wood, Charles A. and Terrence Ow (2005), “WEBVIEW: An SQL Extension for Joining Corporate Data to Data Derived from the World Wide Web,” Communications of the ACM, 48(9), 99-104.
22
Figure 1: Validation Studies for Systems Characterizations (Studies 1 and 2) (a) Aggregate perceptions of the systems
(Study 1 – Supply Side)
(b) Aggregate perceptions of the systems (Study 2 – Demand Side)
(c) Manager Perceptions of Consumer Knowledge of Component Prices based on Systems Perceptions
(Study 1 – Supply Side) (Differences n.s.)
(d) Consumer Knowledge of Component Prices based on Systems Perceptions
(Study 2 – Demand Side) (Differences sig.)
(e) Manager Perception of Consumer Uncertainty with Prices
(Study 1 – Supply Side) (Diff sig for Camera, n.s. for Computer)
(f) Manager Perception of Consumer Awareness of Small Price Change
(Study 1 – Supply Side) (Differences n.s.)
LooselyCoupled
(44%)
LooselyCoupled
(73%)Tightly
Coupled(56%)
TightlyCoupled
(27%)
0
10
20
30
40
50
60
70
80
Cameras Computers
Fre
q LooselyCoupled
(30%)
LooselyCoupled
(63%)
TightlyCoupled
(70%)
TightlyCoupled
(37%)
0
10
20
30
40
50
60
70
80
Cameras Computers
Fre
q
LooselyCoupled
3.78
LooselyCoupled
4.12Tightly
Coupled3.33
TightlyCoupled
3.65
0.00
0.50
1.00
1.50
2.00
2.50
3.00
3.50
4.00
4.50
Cameras Computers
Ave
rag
e
LooselyCoupled
3.64
LooselyCoupled
4.11
TightlyCoupled
2.57
TightlyCoupled
3.16
0.00
0.50
1.00
1.50
2.00
2.50
3.00
3.50
4.00
4.50
Cameras Computers
Ave
rag
e
Components4.29
Components4.02
Systems4.10
Systems4.32
3.50
3.60
3.70
3.80
3.90
4.00
4.10
4.20
4.30
4.40
4.50
Cameras Computers
Ave
rag
e
Components3.07
Components2.97Systems
2.94
Systems3.02
2.75
2.80
2.85
2.90
2.95
3.00
3.05
3.10
3.15
Cameras Computers
Ave
rag
e
23
Figure 2: Example of systems and components prices for cameras and computers (Study 3)
(a) CAMERA COMPONENT
Tamron 500MM Lens for Canon AF08C-700
100% = $879.00
(b) CAMERA SYSTEM
Kodak EasyShare DX7630
100%=$309.99
(c) COMPUTER COMPONENT
Creative Labs Sound Blaster Audigy 2ZS
100% = $101.99
(d) COMPUTER SYSTEM
Sony VAIO DT V517G P4 3.0GHz
100% = $2035.93
75%
80%
85%
90%
95%
100%
210 230 250 270 290Day Number
Pri
ce
17thStreetPhotoSupplyAmazon
BeachCamera
BuyDig
CanogaCamera 75%
80%
85%
90%
95%
100%
0 20 40 60 80 100 120Day Number
Pri
ce
Abes
Amazon
BH
CandE
DFoto
FamilyPhoto
Tri State
Willoug
75%
80%
85%
90%
95%
100%
220 240 260 280Day Number
Pri
ce
A Matterof Fax
Amazon
Chumbo
DigitallyUnique
Ebuyer
PageComputer
SpaceCenter
Tech OnWeb 75%
80%
85%
90%
95%
100%
0 20 40 60 80 100 120Day Number
Pri
ce
Amazon
Best Price
CDW
CircuitCityCostCentralDatavisionDigitallyUniqueeCOST
PC Conn
PC SuperDeals
24
Table 1: Market Concentration Measures for Camera and Computer Components (Study 1)
(A) Camera Components
(B) Computer Components
Camera Body
Camera Lens
Computer CPU
Computer Monitor
Brand Freq Valid
%
Brand Freq Valid
%
Brand Freq Valid
%
Brand Freq Valid
%
Canon 19 42.22 Canon 19 45.24
HP 16 30.77 Acer 13 25.00
Nikon 17 37.78 Nikon 16 38.10
Intel 11 21.15 LG 10 19.23
Sony 3 6.67 Sony 3 7.14
Acer 6 11.54 Samsung 9 17.31
Fuji 2 4.44 Fuji 1 2.38
Apple 5 9.62 HP 5 9.62
Kodak 2 4.44 Kodak 1 2.38
Dell 5 9.62 Phillips 5 9.62
Pentax 1 2.22 Pentax 1 2.38
AMD 4 7.69 Apple 3 5.77
Ricoh 1 2.22
Samsung 1 2.38
IBM 2 3.85 Dell 3 5.77
Asus 1 1.92 IBM 2 3.85
Compaq 1 1.92 Generic 1 1.92
Lenovo 1 1.92 Viewsonic 1 1.92
Valid 45 100 Valid 42 100
Valid 52 100 Valid 52 100
(Missing) 92 (Missing) 95
(Missing) 85 (Missing) 85
Total 137 Total 137
Total 137 Total 137
HHI-4: 0.33 HHI-4: 0.36
HHI-4: 0.16 HHI-4: 0.14

25
Table 2: Products and aggregate prices (Study 3)
Product
Description
Product
Category
No. of
Vendors
Avg. no.
of price
changes
per
prod.
Average
Price
S.D. of
prices*
1. Cameras with at least 8.0 megapixel
resolution
Camera
Systems
89 7.1 $826.01 $891.68
2. Computers with a Pentium 4 chip (or
equivalent, as determined by the
shopping.com) and a DVD / CD with
read/write capability
Computer
Systems
59 4.6 $1,079.71 $683.59
3. Computer monitors with a viewing area
of at least 25" and a max resolution of at
least 1280x1024
Computer
Components
27 3.8 $490.97 $553.35
4. PC sound cards (circuit cards) with 7.1
channel surround and a max sample rate
of at least 192 khz
5. PC graphics cards with installed memory
of at least 256 MB
6. Camera zoom lenses with a maximum
focal length of at least 300 mm
Camera
Components
71 4.5 $545.42 $471.74
7. Flash memory sticks with a capacity of at
least 128-255 MB
8. Camera flashes with power output of a
flash unit rated with at least 150 guide
number
* These do not distinguish between price increases and decreases. There are several outliers which affect the magnitude of
these results, and are not controlled for. In later reporting of the data statistics we use robust estimation techniques to
dampen the effect of outliers.

26
Table 3: Variables for Empirical Models (Study 3)
1. Abs(∆Priceisb) : The (absolute) value of the percent reduction in price of Product i sold at Store s, of Brand b.
2. LN(PageViewss) : The natural log of the number of times pages have been pulled up for a site, and is a measure of firm performance.
3. Systemi: Dummy variable indicating whether Product i is a system (e.g., a computer or a camera) or a component (e.g., a sound card or a camera lens).
4. Store Fixed Effectss: Binary variable = 1 if Store is s, 0 otherwise.
5. Brand Fixed Effectss: Binary variable = 1 if Brand is b, 0 otherwise.
6. PercentStoresi : The percentage of stores that sell the Product i – a measure of product level competition.
7. PercentSystems : The percentage of products sold by the Store s that are systems. This is a measure of store level variation in pricing proclivities.
8. PercentCameras : The percentage of products sold by the Store s that are camera products. This is a second measure of store level variation in pricing proclivities.
9. LN(Priceisb): The natural log of the price of Product i sold at Store s, of Brand b. This controls for the overall price magnitude of a product.
10. ShippingPercentisb : The percentage of price for Product i sold at Store s, of Brand b.
11. OutOfStockisb : Dummy variable indicating whether Store s currently stocks Product i, of Brand b.

27
Table 4: Results for Empirical Models (Study 3)
Model 1 Model 2
Variables (1a) Camera (1b) Computer (2a) Camera (2b) Computer
Stage 1
Regression
Stage 3
All price
changes
Stage 3
Price changes
>10%ile
Stage 1
Regression
Stage 3
All price
changes
Stage 3
Price changes
>10%ile
Dependent Variable Abs(∆Price) Abs(∆Price) Abs(∆Price) LN(PageView) LN(PageView) Abs(∆Price) LN(PageView) LN(PageView)
α (Constant) .19491**
.09835**
.52452**
9.02503**
9.02327**
.02321**
8.72192**
8.68757**
System (β1,β11) -.00204* .00468
* -.00238
** .00506
** .00583
** .01721
** -.03486
** -.03626
**
ĝ (β22)
.68177**
.67843**
-.12223 -.15884
System x ĝ (β23) -.14088* -.18777
** 2.82047
** 2.92730
**
LN(Price) -.00422**
-.00100**
-.00131**
-.00096**
OutOfStock -.00357 .00186
** .02075
**
.01016**
ShippingPercent .01035 .00955 .04155
**
.11196**
PercentStores -.00393
** -.00639
** -.01041
**
-.01877**
PercentSystem
.04411**
.04735**
.34365**
.37639**
PercentCamera
.01411**
.01341**
.25417**
.28421**
(Store Fixed Effects)# [75/91] [50/59]
(Brand Fixed Effects)
# [36/37] [12/46] [35/35]
[37/47]
No. of Observations 12007 17658 12005 12008 10807 17661 17661 15894
Prob > F 0 0 0 0
0 0 0 * p ≤ 0.05;
** p ≤ 0.01
# For the fixed effects [75/90] means the number of coefficients that are significant at p≤0.01 (75) out of the number of estimated (90) etc.
Note: to save space, more details about the regression parameters including the standard errors, are in a separate Web Appendix.

28
APPENDIX
The Wu-Hausman Test for endogeneity
We run this test to check whether Abs(∆Price) is exogenous. If it is, we can get consistent coefficients from OLS and there is no need for the instrumental variables approach. The test is run separately for the computer and camera sub-samples.
We first estimate a reduced form model (OLS), using all exogenous variables:
Abs(∆Price)is = α1 + β11 Systemi + γ11 LN(Price)is + γ12 OutOfStockis + γ13 ShippingPercentis + θ11 PercentStoresi + ε3
We save the residual from the above regression as “absprice_res”. Then we estimate the main equation using OLS, where we include absprice_res as a regressor:
LN(Pageview)s = α2 + β21 Systemi + β22 Abs(∆Price)is + β23 (System x Abs(∆Price))is + β24 absprice_resis + γ21 PercentSystems + γ22 PercentCameras +ε4
The null hypothesis (OLS is consistent, Abs(∆Price) is exogenous) is, H0: β24=0. The null hypothesis is rejected for both products. This implies that Abs(∆Price) is likely endogenous.
Table 5: Results of Wu-Hausman Test
Variables (a) Computer (b) Camera
Dependent Variable Abs(∆Price) LN(PageView) Abs(∆Price) LN(PageView)
α (Constant) .0144**
8.7205**
.0302**
9.0131**
System .0039**
.0024 .0004 .0025
LN(Price) -.0002 -.001**
OutOfStock .0106**
.0234**
ShippingPercent .1141**
.0449**
PercentStores -.019**
-.0085**
Abs(∆Price) 3.7489**
.8403**
System x Abs(∆Price) -.571**
-.0035
absprice_res (β24) -3.1138**
-.836**
PercentSystem .303**
.0519**
PercentCamera .2169**
.0157**
H0 (β24): F(1, 17654) = 6215.54;
Prob > F = 0.0000; hence reject H0.
H0 (β24): F(1, 12001) = 74.57;
Prob > F = 0.0000; hence reject H0 ** p ≤ 0.01 (More details of the test including standard errors are in a separate Web Appendix)

29
i Our systems categorization can be easily applied to other technology intensive products, such as kitchen
appliances, automobiles, printers or stereo systems. However, it can also be used to describe less technology intensive products, such as outdoor deck kits, outdoor grills, shelving units, shaving razors etc.
ii In our view, RI and JND are not competing perspectives even if there are important differences centered on the interpretation of agent rationality. The rational bases enable us to propose conditions when some small price changes may not necessarily be ignored. The early JND literature framed it as an individual attribute. The later research in marketing that we refer to, consider contextual factors to make contingent predictions (e.g. based on brands, brand loyalty, store image etc.). Our work may be thought of as similar in spirit to this line of thought.
iii We assume salience of price and high consumer involvement in our research context. Such attention is not inevitable in very low involvement purchase situations or in a context where price plays little role, if any.
iv We incorporate a measure of pragmatism in the hypotheses. Tightly and loosely coupled markets tend to be Systems and Component dominated respectively. Yet firms in either may still procure both complete systems as well as individual components from their suppliers – e.g. driven by supplier incentives like forward buying and bulk discounts. This can lead to excess inventory that the firm must try and sell off. In such situations, the global desirability of a particular strategy (say, systems sales in tightly coupled markets) notwithstanding, locally firms may adopt a different marketing tactic (e.g. component sales).
v This is qualitatively similar to the loss-leader pricing idea. However, substantively our context is quite different. One key difference is that unlike the loss-leader case our focus is only on the focal product and we are neutral to any spill over sales in other products. We thank an anonymous reviewer for bringing up this point.
vi While these two studies can be considered similar to pre-tests, given their importance, we present them as individual studies, albeit parsimoniously. The inspiration for studying both the demand and supply side perceptions are derived from the spirit of rational expectations equilibrium concepts.
vii Note that the relative share positions of the firms remain roughly intact in the camera category, but are disrupted in the computer category. This may be additional evidence of the former being more tightly coupled system than the latter. We thank an anonymous reviewer for this observation.
viii The sheer enormity of the exercise makes it very costly to monitor the data collection in person and on a continuous basis. Sometimes when disruptions like server crashes or internet link failures happen – it may result in missing data points in the period before the disruption is noticed. Further, since the algorithm may fail if the website changes its layout and specification, the researcher still needs to monitor the data collection regularly. Fortunately, these problems were not too severe during our data collection. This notwithstanding, the effort still involved countless hours of checking, sorting and cleaning through the generated data.
ix We also investigate a type of store based heterogeneity by restricting our estimations to those stores who only sell cameras or computers. For cameras, our central result remains unchanged (H2a supported). For computers, we lose too many degrees of freedom and are unable to conduct a similar test.
x New-Keynesian economics postulates microeconomic foundations for such macroeconomic phenomena like aggregate price rigidity. Most of these arguments hinge on the existence of “menu costs” – i.e. the cost of changing prices. See Rotemberg (1987) for a comprehensive discussion.