Embed Size (px)
Citation preview

Working Paper No. 160
Home-based Work in India: A Disappearing Continuum of Dependence?
Jeemol Unni Uma Rani
Gujarat Institute of Development Research Gota, Ahmedabad 380 060 August 2005

1
Abstract In India, the recent decade has seen particularly dynamic changes in the economy due to the economic reforms. This might have had a significant impact on the labour markets and also led to expansion of markets. The growth of home-based work is viewed within the context of expansion of markets due to trade liberalization and increase in co-ordination costs of skilled workers within a firm. We empirically explore whether the expansion of markets and growth have led to the disappearance of home-based work, a particular form of production system, or changed the relationships of dependence of the home-based workers in different sectors of the economy? Further, we explore whether the nature of dependence within home-based work differed in different segments of the product markets such as in the high-growth versus low-growth industries. JEL Classification : D23, E26 Keywords : Home-based work; Labour market; Employment; India
Acknowledgements
This paper is a part of a larger project ‘Impact of Recent Policies on Home-based Work in India’ funded and supported by the Human Development Resource Centre, United Nations Development Programme, New Delhi. We would like to thank Dr. Seeta Prabhu, Kalyani Menon-Sen of HDRC, UNDP, New Delhi, and Ratna Sudarshan, ISST for their constant support and comments on an earlier draft of this paper. We also gratefully acknowledge the detailed comments from an anonymous referee. We would like to thank the faculty, library and administrative staff at GIDR for an academically lively and supportive atmosphere. Special thanks are due to Arti Oza who provided painstaking statistical assistance and catered to our continuous requirements of tabulations and re-tabulations. We alone are however, responsible for any errors in analysis and interpretations.
2
Home-based Work in India: A Disappearing Continuum of Dependence?
Jeemol Unni
Uma Rani
1 Introduction The segmented labour market (SLM) theory considered segmentation as a reflection of the structure of the industrial market. This literature had many variants with later versions considering segmentation of the labour market a consequence of the underlying socio-economic processes, forces or tendencies. The association between the industrial and the market structure being carried over to the labour market was most clearly expressed in the dual labour market (DLM) theory of Doeringer and Piore (1971) a precursor of the segmented labour market theory. The Cambridge school of the SLM characterized the labour market as a supply and demand model breaking away from the neoclassical orthodoxy. They rejected the human capital theory notion that the workers were rewarded according to the well-defined skills that they brought to the market (Craig et.al. 1982: 93-4). The demand for labour was seen in terms of the personal (employer strategy) and impersonal forces of capitalist production, distribution and exchange within the DLM tradition. The demand for labour by employers depended on technology and work organization, the extent and nature of product markets, industrial organization and the imperative of profitability (Fine, 1998: 125). The labour market can thus be seen as a reflection of the interplay of supply and demand factors in the product market. As the market grows, specialization takes place, and diversity in the demand and supply of skills is enhanced. This has been referred to as a process of labour market deepening (Basant and Rani, 2004). Globalisation can lead to significant deepening of the labour market in developing countries like India. However, as specialization increases the demand for certain skills increases and there are more and more jobs available in smaller and smaller segments of the labour market. This is known as thick markets, where there are more frequent transactions or job offers.

3
Ethier (1982) propounded an idea of thick market for a product, whereby larger market demand implied a variety of intermediate inputs, which in turn increased the final output. There are two key restrictions to this model: (i) intermediate inputs are technique or quality specific so that suppliers can sell their intermediates only to final good producing the same quality; (ii) to produce intermediates of a given quality, workers must satisfy a minimum skill-requirement, which increases with the quality produced. There is a trade-off between quality and thick market externality, because better quality goods demand better skilled workers and so fewer workers are able to produce them or the markets are thin for such good quality products. What is interesting and important to us in the model is that it assumes the existence of a continuum of production techniques each associated with a different quality of final goods. These represent different production systems with clusters of suppliers and final producers producing goods of the same quality despite there being a continuum of skills and qualities (Duranton, 20041). Expansion of markets could further activate the different segments of this market. In another influential paper, Becker and Murphy (1992) argue that factors other than expansion of markets are more critical for specialization to take place. These factors include various costs of “coordinating” specialized workers and the amount of general knowledge available. Such co-ordination failures and the greater variety of segments within the labour markets in developing countries, may lead to sub-contracting arrangements between large and small firms to reduce transactions costs within the firm. The large and small firms can draw from the various segments in the labour market, which allows them to reduce costs for the same quality of labour. If intra-firm co-ordination costs are higher for large firms there is likely to be a shift in demand in favour of small firms and other production systems such as home-based work. It is in this context of expansion of markets due to trade liberalization and increase in co-ordination costs of skilled workers within a firm that we view the growth of home-based work in this paper. In India, the recent decade has witnessed dynamic changes in the economy due to the economic reforms put through since 1991. We explore whether the expansion of markets and growth due to the recent policies 1 Duranton (2004) goes on to explain how externalities arising out of thick markets
of skilled labour have a potential impact on wage differentials between skilled and unskilled labour.

4
have led to the disappearance of home-based work, a particular form of production system in India, or changed the relationships of dependence of the home-based workers in different sectors of the economy? Further, we also explore whether the nature of dependence on home-based work differed in different segments of the product markets such as in the high-growth versus low-growth industries. The empirical analysis uses the data from National Sample Survey Organisation, national labour force surveys and enterprise surveys of unorganized manufacturing sector of the last two decades 2. Placing the Home-based Workers Within the Workforce Home-based work is not an analytical category. Nor does home-based work constitute a sector such as agriculture. The traditional sources of data on employment, the Population Censuses and National Labour Force Surveys, classify workers according to three international classification schemes: industry, occupation and activity status classifications. The present activity status classification of the International Classification of Status in Employment (ICSE) 1993, International Labour Organisation (ILO) consists of the following categories: employees, employers, own-account workers, members of producer’s co-operatives, contributing family members, workers not classifiable by status. This form of classification of workers basically follows a dichotomous system, where the workers are classified as either self-employed or wage workers. This dichotomy, however, is unable to represent the realities of the home-based workers and producers due to two reasons. First, the dichotomy is a reductionist categorization of the complex relations of production and distribution characterizing home-based work, where many producers are neither wageworkers nor self-employed, but something in between (Kantor, 2000). Second, the dichotomy is based on legal definitions of worker and self-employed drawn from the Western liberal assumptions of autonomous and self-contained individuals, which cannot be applied to the home-based producers (Prugl and Tinker, 1997). Those who work in the informal economy do so under several employment statuses or work arrangements. Degrees of security, and of vulnerability, are centrally related to employment status. A more realistic classification of workers is presented below (Chaterjee et. al., 2002)
5
Self employed: independent self employed persons • Employers: owner operators of registered and unregistered enterprises who hire
at least one worker on a regular basis; and • Own-account workers: self-employed persons who do not hire any paid workers
on a regular basis. • Unpaid contributing family members, relatives or other members of the
household who work without pay in businesses run by other members of the household.
Dependent Producers: producers who depend on others for the supply of work, raw materials or sale of finished goods • Industrial outworkers who work at home, in another’s home, or in any place
other than the employer/contractor’s premises under sub-contract arrangements, or who are otherwise dependent on manufacturers or merchants for their raw material or sales.
Wage Employee: wageworkers under one or another of the following arrangements: • Salaried workers in registered enterprises: wageworkers on a regular basis for a
registered enterprise with, typically, a written contract, fixed wages or salaries, and with access to a known package of worker benefits. They may be in full-time or part-time or irregular employment.
• Salaried workers in unregistered enterprises: wageworkers on a regular basis
for a single unregistered enterprise without, typically, a written contract, fixed wages, or worker benefits.
• Workers in domestic service for private households. • Casual workers: dependent wageworkers who do not work on a regular basis for
a single employer or enterprise. Home-based workers are to be found in the categories of independent self-employed, including own-account workers, and dependent producers. Wage employees can also be home-based to the extent their place of work is their employer’s home. The homeworkers, also called industrial outworkers or sub–

6
contract workers, are dependent producers and form an in-between category between the self-employed and wageworker. The ILO adopted a Convention on Home Work in 1996, which refers exclusively to homeworkers, a category not included in the ICSE-1993. It defined homeworker as a person who carried out work for remuneration in premises of his/her own choice, other than the work place of the employer, resulting in a product or service as specified by the employer, irrespective of who provided the equipment, material or inputs used. While the self-employed organise all facets of their production or service activity, the dependent producers manufacture products based on the specifications of the parent enterprise or contractor, which also often supplies the raw material. Under the putting-out or sub-contracting system, the dependent producers purchase, repair, and/or maintain their own tools and machines. They sometimes also bear the costs of some inputs (e.g., garment workers buy their own thread), transportation to and from the contractor or firm, and infrastructure (space, utilities, etc.). Manufacturing or retail companies typically “put–out” labour–intensive work that does not require heavy machinery. Although the dependent producers are not directly supervised, they typically do not market final products, or negotiate prices. The employment status of the home-based workers can therefore be seen along a continuum of dependence, from being completely independent to being fully dependent on the contractor/middleman for design, raw material and equipment and unable to negotiate price of the product. They constitute a separate production system forming a different layer or segment both in the product and labour markets. The literature on industrial subcontracting distinguishes between two types of ‘business arrangements’, one that contracts out production without providing raw materials and the other that provides raw materials (Watanabe, 1983). The first is called ‘horizontal subcontracting’. This implies a subcontracting relationship exist, but with more independent production relationships, so that the status is closer to an independent producer. The second is called ‘vertical subcontracting’, which tends to create more of a dependent relationship and the status is closer to a dependent producer. In this paper we view the home-based workers as falling into a continuum of production systems with varying relationship of dependence along the following groups:

7
A. Independent Producer: Own account Worker/Employer working on Household Premises
B. Dependent Producer: Outworkers who work at home, in another’s home, other than the employer/ contractor’s premises under sub-contract arrangements.
• Horizontal sub-contracting: Not dependent on employer/contractor for raw material.
• Vertical Sub-contracting: Dependent on employer/ contractor for raw
material.
C. Wage Worker: Persons working for wages or salaries in enterprises located in the employer’s house. This continuum of production systems and relationships could extent from the informal to the formal sectors of the economy. The status of home-based workers from independent to dependent and the position of the producer in the value added sub-contracting chain together determine the degree of autonomy or control the worker has over the production process. That is, the complex nature of the production relationship between home-based producers and source of the work can be categorised by a continuum of dependence. The market structure is also complex with the home-based workers either having direct contact with the customer or indirect contact through multi-layered chains. The category of self-employed or dependent producer is therefore fuzzy on the ground. This has led to a confusion of whether they are self-employed or wageworkers. 3. Economic Growth and Home-based Work in Manufacturing The economic reforms introduced since 1991 has brought about a number of changes in the Indian economy. These reforms include changes in trade policy like abolition of quantitative restrictions and liberalization of foreign direct investment; industrial policy like the de-reservation of industries for the small scale sector and encouragement of private investment; and simplification of the regulations and laws that govern capital and labour. A major effort and consequence of economic reforms has been to increase competition in the economy. The Indian economy grew at about 6 percent per annum for a number of years in the 1990s leading to an expansion of markets. To get a larger share of the growing markets, the industries
8
could adopt technology intensive strategies to improve productivity or cost cutting strategies to introduce competitive prices. The strategy of reduction in cost to maintain competitiveness could involve an increase in sub-contracting out to smaller firms to reduce transaction costs within the firm. The large firms could sub-contract to the smaller ones, while the smaller firms could sub-contract to even smaller. Each of these segments might constitute separate production systems ranging from the formal to the informal sectors. Home-based work would constitute the bottom segment of this continuum. In this context we put forward the following hypotheses to be investigated: Hypothesis 1: During a period of rapid economic reform, expanding markets and increasing competition, industries could adopt cost-cutting strategies, leading to an increase in home-based work. Hypothesis 2: High growth industries may be expected to adopt technology intensive strategies rather than cost-cutting strategies. High growth industries may not show increase in home-based work. Hypothesis 3: Women worker dominated industries are expected to have a high proportion of home-based workers. Being less technology intensive, these industries may show an increase in home-based workers. For the benefits of economic growth to reach the lower segments of the labour market, generation of productive employment in the informal sector, where the majority of workers are employed, is essential. The growth of value added alone in an industry group is not sufficient to ensure productive employment for the majority of the workers. Employment creation alone is also not beneficial to the workers. Since our primary concern is for generation of productive employment we will define and measure growth and non-growth industries based on growth in value added, employment and labour productivity. Rapid value added growth is essential to ensure positive growth impulse in the industry as a whole. The growth of employment is necessary to ensure that the fruits of this growth of value added percolate to the lower segment of workers. Finally, employment alone at low levels of income is not sufficient to ensure overall well being of the workers. This requires growth with increasing labour productivity or income per worker, that is, industrial growth generating quality employment. Using these three variables we define seven groups of growth versus non-growth industries and classify them into three
9
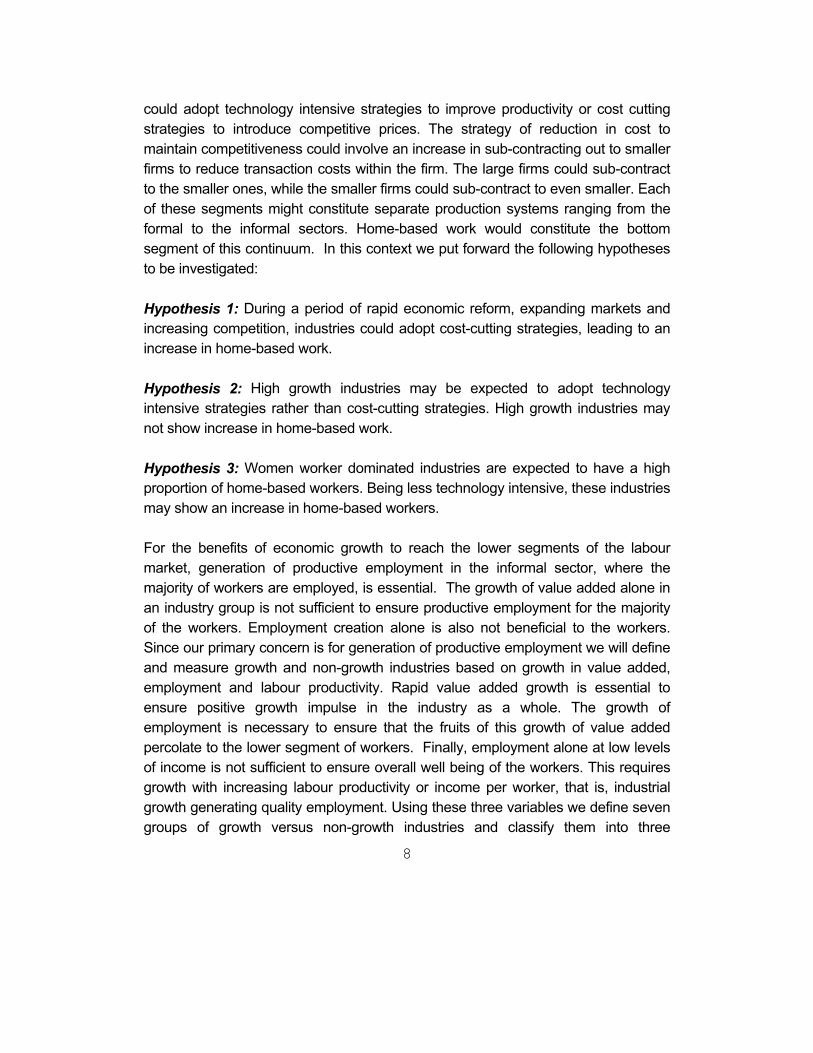
categories as shown in Chart 1. In common parlance an industry with a growing value added over time is considered to be a potentially dynamic and growing sector. By this criterion, the first four groups of industry with growing value added (Chart 1) should be considered as growth industries. However, we give greater importance to growth of employment and preferably productive employment as being beneficial to the economy in the long run.
Chart 1: Categories of Growth Vs. Non-growth Industry Groups
Sub
Group Category A: Growth industries with quality employment
1 2
Growing Value Added, Growing Employment, Growing Labour Productivity
Growing Value Added, Declining Employment, Growing Labour Productivity
Category B: Growth industries with poor quality employment 3 4
Growing Value Added, Growing Employment, Declining Labour Productivity Growing Value Added, Declining Employment, Declining Labour Productivity
Category C: Non-growth industries 5 6 7
Declining Value Added, Growing Employment, Declining Labour Productivity Declining Value Added, Declining Employment, Growing Labour Productivity Declining Value Added, Declining Employment, Declining Labour Productivity
Three categories are designated as follows: Category A consisting of the growth industries with improving quality of employment. There are two groups of industries within it both with growing value added and labour productivity, but one having growing employment and the other with declining employment. Category B consisting of growth industries with declining quality of employment though having growing value added. Category C consisting of the non-growth industries, with declining growth of value added. In terms of generation of employment, the first two industry groups (Category A) are the best, followed by the third and fourth industry groups (Category B). The latter three groups of industries (Category C) can be considered the non-growth performing industries. In an earlier paper we had categorised the industries as growth and non-growth for two time periods, growth in 1989-90 to 1994-95 (early reforms period) over the previous period of 1984-85 to 1989-90 (partial liberalisation) and growth in 1994-95

10
to 2000-01 (period of rapid reforms) over the previous period 1989-90 to 1994-95 (early reforms period) (Unni and Rani, 2003). Focusing on the unorganised2 manufacturing sector, we found that in the first period of reforms compared to the partial liberalisation phase very few industry groups were in Category A and within that in Group 1. However, in the second period, that is the period of rapid reforms, a large number of manufacturing industries in the unorganised sector had grown with quality employment. Further, in the first phase of reforms a large number of unorganised manufacturing industries were in Category C, but in the later reforms period not many industries were left in this category. That is, in the recent phase of rapid reforms the unorganised manufacturing sector seems to have performed very well, with a number of industries growing faster and with good quality employment. We have computed growth rates of value added, employment and labour productivity in the latest period of reforms (1994-95 to 2000-01) for the sub-groups of industries within each Category and the results are revealing. As expected the industries in Category A, groups 1 and 2 have high growth of value added (9.3 and 5.7 percent) and labour productivity (6.3 and 7.0 percent), but relatively lower growth of employment (Table 1). In the case of group 2, employment growth is in fact negative. The industries that performed very well, in Category A, can be grouped into three types of industries: organic industries consisting of food and paper; among inorganic industries, chemical industries including pharmaceuticals and cosmetics etc., and metal-based in intermediate goods industries; and capital goods industries such as machinery. The industries in Category B, group 3, have high growth of value added and employment (about 5 percent each) but negative growth of labour productivity or poor quality employment. These include organic industries such as tobacco, wood products and wearing apparel. Wearing apparels is an industry which has had a phenomenal growth profile over the recent period in terms of value added and
2 In this paper we use the terms unorganized and informal sector interchangeably
though informal is slightly smaller segment of the unorganized sector. This is because data on the manufacturing sector is available for the unorganised sector. In India, the National Accounts Statistics (NAS) has a clear and practical definition of the organized sector. The organized sector units are enterprises in the public (government) sector, private corporate sector and co-operatives, manufacturing units registered under the Indian Factories Act, 1948 or the Bidi and Cigar Workers Act, 1966 and recognized educational institutions. Enterprises that do not belong to any of these categories are unorganized sector units.

11
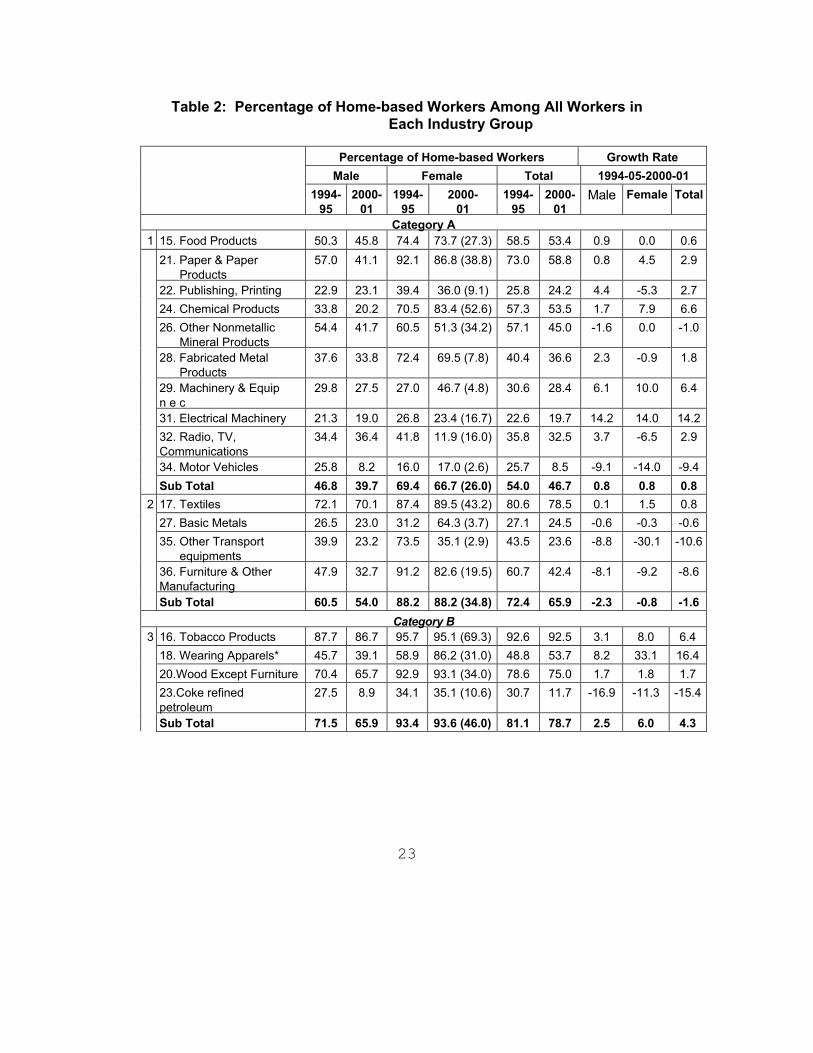
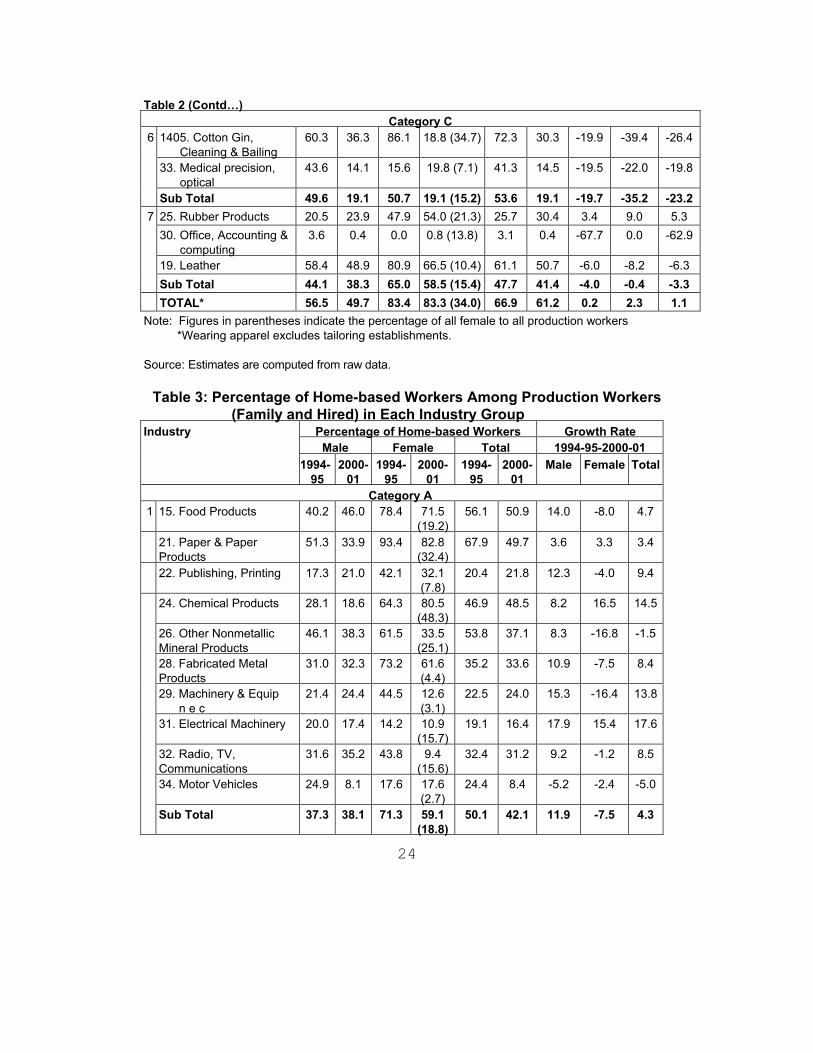
employment, but with declining labour productivity. The employment generated is of poor quality perhaps in the majority of establishments. And finally there are a group of non-growth or non-performing industries in Category C with declining or very low value added and employment growth. Labour productivity was positive in group 6 and negative in group 7 industries. These industries are the non-growth performing industries. These consist of cotton ginning, precision instruments, rubber and plastic products and office, accounting and computing machinery. These latter industries are perhaps faced with stiff competition both internally and from imported goods. We will now discuss in which of these manufacturing industries there has been a growth of home-based work and increasing concentration of home-based workers over the period 1994-95 to 2000-01, that is, in the later period of economic reforms. There are two ways to do this. The first is to look at the aggregate or total home-based workers, including hired and family production workers, managerial, supervisory and working proprietors, both male and female. However, if any industry is following a strategy of cutting costs through sub-contracting out production to home-based workers, this is likely to show in an increase in production workers, both family and hired. Hence we shall also separately analyse the trends disaggregated for production workers alone, separately for men and women. The data on unorganized manufacturing sector for the two years 1994-95 and 2000-01, have a location code which helps us to identify home-based enterprises, coded as ‘premises same as household’s residence’ in 1994-95 and ‘within household premises’ in 2000-01. Hence we can study the change in this form of work for total workers over this period. Since the codes devised in the two surveys were different the data are not perfectly comparable. However, given the lack of any other source of data on home-based workers for more than one time point, we shall analyse these estimates with caution. Aggregate Home-based Work: We have categorized home-based workers by the industry groups in the growth categories presented earlier. The total number of home-based workers including production workers and managerial staff increased at the rate of 1.1 percent per year during the phase of rapid reforms (Table 2). The growth of home-based work was faster among the women, about 2.3 percent compared to men at 0.2 percent. This growth of home-based work was the fastest (4.3 percent) in Category B industries that grew with low quality employment, including tobacco and wearing apparel industries. Women home-

12
based workers also grew faster (6.0 percent) in this category. The only other category where home-based workers grew, that too only marginally, was the top most Category A group 1. The rest of the sub-groups showed a decline in growth of home-based workers. Home-based workers constituted a relatively large share of the workers (about 60 percent) in unorganized manufacturing. The gender differential in the composition of total home-based work is clearly seen by the fact that more than 80 percent of the women workers were home-based. However, the proportion of male home-based workers in manufacturing industries was also quite large, nearly half of the workers. Both male and female home-based workers were the least in the top and bottom industry groups. The middle two industry groups with high growth of value added and with good or poor quality employment growth, were the ones with the larger share of workers being home-based. However, over the recent phase of reforms, overall, there was a decline in the share of home-based work from nearly 67 to 61 percent (Table 2). This decline in share of aggregate home-based work was true for all the growth categories over the period, high with best quality as well as low with poor quality growth, and mainly among men. The share of home-based work among women was more or less maintained in the aggregate, though it declined in the top and bottom two growth-categories of industries. At the two digit-level of industry groups only two industries had an increase in proportion of home-based work over the period and one had a high and constant proportion. The industries registering an increase in proportion of home-based work were wearing apparel (48 to 53 percent) and manufacture of rubber and plastic products (25 to 30 percent), whereas manufacture of tobacco products had a high and constant proportion of home-based work, more than 90 percent. Among women home-based workers there was an increase also in chemical products and basic metals. A more detailed dis-aggregation of the workforce at the three-digit industry groups showed that a number of industries even within the top category of high growth with quality employment had a growth of home-based workers and an increase in their proportion. Some of these industries in the top category were

13
manufacture of glass and glass products, structural metal products, general and special purpose machinery, electrical machinery such as accumulators, cells and batteries, electric lamps and other electric equipment, T.V., and radio receivers, knitted and crocheted textiles and non-ferrous metals. The most striking growth of home-based workers and their proportion was in the wearing apparel industry in Category B, that is, with poor quality employment growth. Production workers: As discussed earlier the impact of reforms on the strategies of the firms are more likely to be displayed by the changes in the production workers, including family and hired workers. Home-based production workers grew at the much faster rate during the phase of recent reforms, 4.7 compared to only 1.1 percent for all workers. The gender composition was however different. While women home-based workers grew faster than male among all workers, among the production workers, male home-based workers grew much faster (11.7 percent per annum) and in fact women home-based workers declined (-2.6 percent) in absolute terms. Among the growth categories women home-based workers showed a positive growth, 4.5 percent, only in Category B, mainly tobacco and wearing apparel. Male production workers in fact grew in all but one category, at 11.9 percent in the top, 6.9 percent in the second sub-group, 18.6 percent in category B and at 4.5 percent in the last category. This has important implications for the strategy adopted by firms and growth of production systems using male home-based workers. The proportion of home-based production workers was the lowest in the top and bottom growth categories. The proportion of home-based workers in total workers, including hired and family workers, like all workers, also showed a decline in the aggregate from 62 to nearly 56 percent (Table 3). Among production workers also, the decline in proportion of home-based work was observed in all the growth categories. However, at least one industry group within each of the growth categories registered an increase in share of home-based production workers. In the top growth category A, manufacture of chemical products had a small increase in share of home-based production work, 46.8 to 48.5 percent. In the middle growth category B, manufacture of wearing apparel had a sharp growth in proportion of home-based work, 44.8 to 53.4, and there was a slight increase in tobacco products. In the bottom growth category C, the manufacture of rubber and plastic products registered a large increase in share of home-based work, 19.6 to 27.4 percent.

14
The gender dis-aggregated change in proportion of home-based work is quite interesting. Here again while the share of home-based production workers among women declined in all growth categories that of male home-based workers grew in the top (A, sub-group 1) and bottom (C and sub-group 7) industry groups (Table 3). However, as noted earlier, the proportion of women home-based workers (more than 80 percent) was much larger than that of male home-based workers (about 45 percent), though the former showed a slight decline over the period. Within the high growth industries with quality employment, category A and group 1, a number of industries at the two-digit level were found to grow with an increase in share of male production home-based workers. These industry groups were intermediate goods such as pre-fabricated metal products, capital goods such as machinery and equipment and consumer goods such as food products, publishing and printing, and radio, T.V. and communication equipment. In this high growth category the only industry group that registered an increase in share of women home-based production workers was the manufacture of chemical products, an intermediate good. In the growth category A and sub-group 2, high good quality growth with declining growth of employment, the manufacture of textile products showed an increase in share of home-based work among both men and women production workers (Table 3). The growth category B, high growth with poor quality employment, had relatively labour intensive industries and with a high proportion of home-based work. Among them, the manufacture of tobacco products registered an increase in share of male and female home-based work. Manufacture of wearing apparel had a large increase in share of women home-based work and manufacture of wood and wood products had a large increase in share of male home-based work. The dominance of home-based work and the large increase in the same itself may have contributed to the decline in quality of employment. The bottom growth category C, sub-group 7, was seen to have a large increase in share of male and female home-based work in the manufacture of rubber and plastic products. The detailed three-digit level industry classification shows more clearly which industries within the broad industry groups are responsible for the growth and
15
increase in share of home-based work. This also shows that at a more dis-aggregated level in many industries, both men and women registered changes in home-based work, which may not be reflected in the aggregate3. In category A, sub-group 1, food products had registered an increase in share of male home-based work. This consisted of dairy products and grain milling, whereas there was an increase in share of women home-based workers in production, processing and preservation of fish, meat, fruit and vegetables. Printing and publishing registered growth and increase in share of male home-based work alone. Chemical products showed growth and an increase in share of women home-based work alone, mainly within the other chemical products, including pharmaceuticals and cosmetics. Manufacture of glass and glass products within other non-metallic products had a growth and large increase in share of women home-based workers, which was not reflected in the aggregate at the two-digit level. Further, while fabricated metal products showed growth and an increase in share of male home-based work, at the dis-aggregated level, home-based women workers grew in numbers and share in structural products and male home-based workers grew in share in other fabricated metal products. Among the capital goods, machinery and equipment, male and female home-based work grew in number and proportion in general purpose machinery, but only male home-based work grew in special purpose machinery; within radio, T.V. and communications, manufacture of radio and T.V. transmitters and receivers showed a slight increase in male home-based work. The growth category A and sub-group 2, showed growth and increase in proportion of home-based work in manufacture of textiles among men. While male home-based work grew in spinning, weaving and finishing, that of female home-based work grew in knitted and crocheted products. Manufacture of jewellery, sports goods, toys etc. in other manufacturing registered an increase in male home-based work, which did not appear in the aggregate two-digit analysis. The increase in share of home-based work in manufacture of rubber and plastics in the last group Category C subgroup 7, is dis-aggregated to show a small
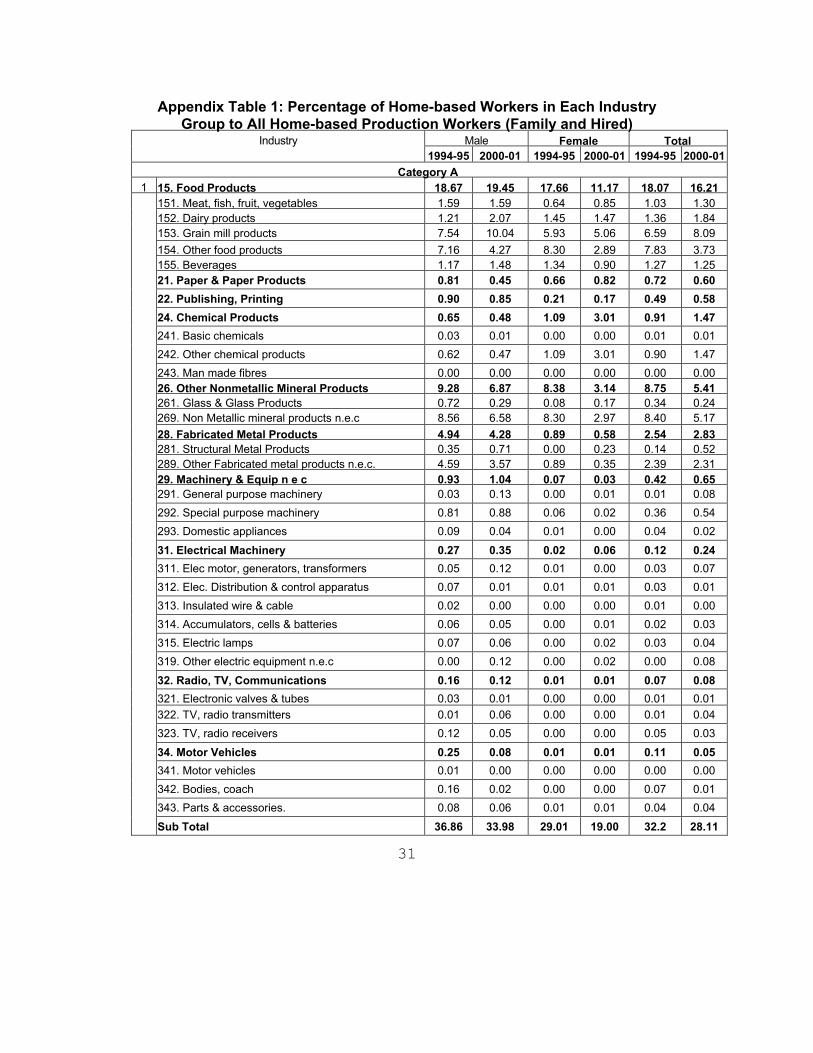
3 In Appendix Table 1 we present the percentage of home-based workers in each
industry group at the three-digit level to all home-based production workers. We refer here only to the sub-groups with at least 0.05 percent of male and female home-based workers.
16
increase in growth and proportion of male home-based work in rubber products and a large increase in male and female home-based work in plastic products. Thus, in the period of rapid reforms, though there was no aggregate shift to home-based production systems, increase in home-based work as a strategy of cost-reduction was used by some of the high growth industries, maintaining good quality employment. At the two-digit level, it is interesting that the increase in share of home-based work is mainly among male production workers. Only in the chemical industry is there a growth of female home-based work. However, if one disaggregates further to the three-digit level, a number of industries are observed to have an increase in share of male and female home-based production work, sometimes in different sub-groups. Although, home-based work did grow in the non-growth industries, mainly in manufacture of plastic products, it is not possible to categorize all home-based production as consisting of low productivity activities. A shift to home-based work, mainly among male workers, was observed largely in high growth industries with good quality employment growth. It is possible that many of these home-based activities involved use of technology or equipment, which ensured relatively better productivity. Women Dominated Industries: Overall in 2001, nearly 27 percent of the production workers in unorganised manufacturing were women. This was much lower than it was in 1994-95 (nearly 45 percent). We consider industries with more than the average 27 percent, of the production workers in 2001 as women dominated industries. (This is indicated in parenthesis for 2000-01 in Tables 2 and 3). In terms of growth categories, the middle groups, value added growth with good (A.2) and low quality employment (B), could be considered as women-dominated industries with more than average of women workers. Both of these groups also had a higher proportion of women home-based workers (more than 85 percent). However, growth category A.2 with good quality employment did not show positive growth in number or an increase in proportion of women home-based workers (Table 3). In category B, growth with low quality employment, the growth in number and the percentage of home-based women workers was mainly in the wearing apparels sector, with a lower growth in numbers in the tobacco sector.

17
At the sub-group level, the women dominated industries were, paper and paper products, chemical products, textiles, tobacco products and wearing apparel. Of these five industries, three recorded a growth in share of female home-based work, namely chemical products, tobacco and wearing apparel (Table 3). At the more detailed three-digit level, the women dominated industries4 were dairy products, paper and paper products, other chemical products, spinning, weaving and finishing, other textiles, knitted and crocheted, tobacco products and wearing apparel except fur. Among these, other chemical products, tobacco products and wearing apparel had positive growth in numbers as well as increase in proportion of women home-based workers during 1994-95 to 2000-01. 4. Continuum of Dependence Personal Profile of the Home-based Workers: In order to understand the personal profile of the home-based workers, we present a comparison with all workers. Nearly half the rural manufacturing workers were home-based compared to only a quarter of the urban workers (Table 4). The higher proportion of home-based work in rural areas was true for men and women workers. While only about 3 percent of children below the age of 15 were working in the manufacturing sector, nearly 6 percent were working as home-based workers and 7 percent in sub-contracted dependent situations (Table 5). Among persons above the age of 60 nearly 5 percent were working in the manufacturing sector, while 7 percent were home-based workers. The percentage of female children in manufacturing was more than double that of male, 7 percent, and similarly so in home-based and sub-contracted work. The majority of the manufacturing sector workers were in the prime age groups of 15 to 29 and 30 to 44 years. Women workers in dependent sub-contract relations tended to be in the younger age group of 15 to 29 years. About 30 percent of the manufacturing sector workers were illiterate and another nearly 30 percent were literate with or without attending primary school (Table 6). The proportion of illiterates was much higher among women manufacturing 4 Only industries with at least 0.05 percent of all women production workers are
listed here.

18
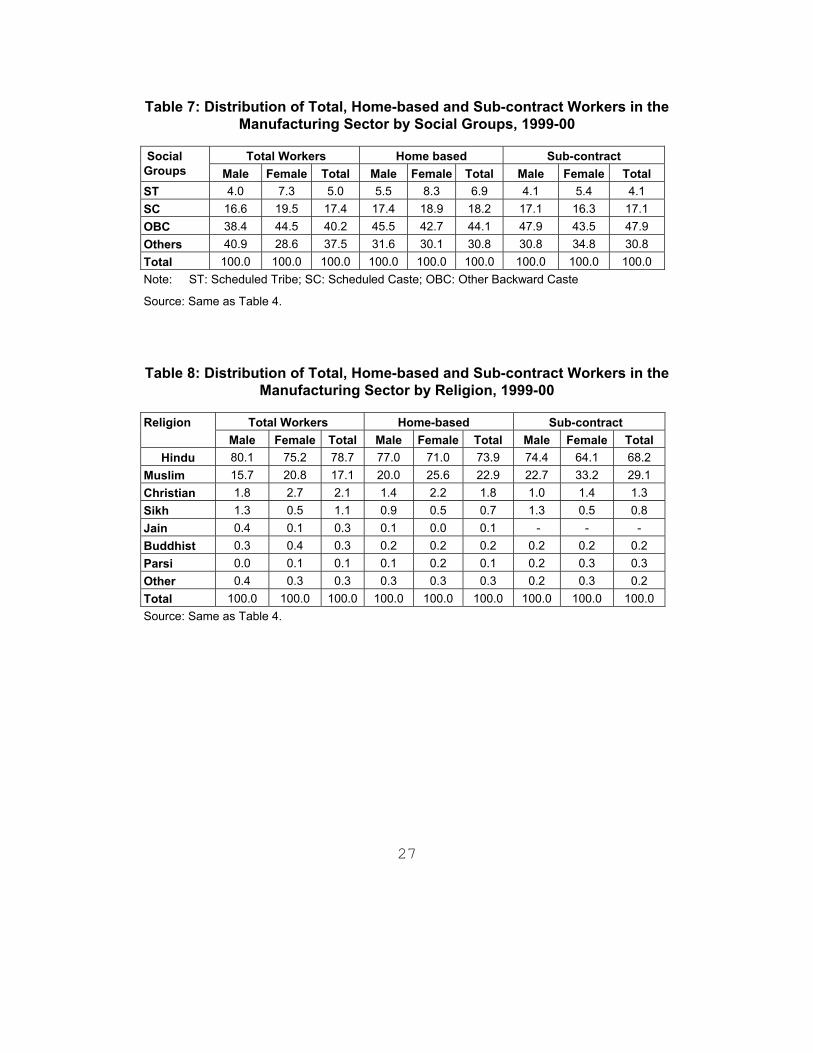
sector workers, 54 percent. The proportion of illiterates was distinctly higher among the home-based workers, both male and female. This was true of the subcontract workers as well. At the other end of the spectrum, male workers with graduation and above were more likely to be manufacturing workers, but not home-based or sub-contract workers. To see if there was any selectivity of home-based work by social groups, we present the distribution by caste groups and religion. Nearly 40 percent of the manufacturing sector workers were from other backward castes, with 37 percent from upper caste and other religions (Table 7). A much smaller percentage of manufacturing sector workers were from scheduled tribes and castes, 5 and 17 respectively. The other backward castes further dominated home-based work and dependent sub-contract work in manufacturing. In fact this was true mainly of the male workers. Hindus and Muslims were mainly involved in the manufacturing sector, almost in proportion to their population size (Table 8). However, the proportion of Muslim home-based and sub-contracted workers was higher than in total manufacturing and this was true for both men and women. As argued in the introduction, home-based workers are not a homogeneous group. They, in fact, form a continuum of production systems and relationships based on the degree of dependence, from fully independent to almost fully dependent. Among them, self-employed workers who organize and are in control of all facets of their production process are the most independent. The rest are in various forms of dependent relationships with other firms, contractors or middlemen. Among all manufacturing workers, the independent and dependent self-employed workers formed almost equally 45 percent each (Table 9). Among the dependent self-employed, only about 9 percent were engaged in horizontal subcontracting, which is a relatively independent status only receiving orders for goods and in complete control of the production process. The rest, 35 percent of the dependent producers were in a much more dependent situation, receiving orders for goods as well as raw materials, credit and/or equipment. Further, in some sense the most dependent were the wage workers who worked for the home-based enterprises in that their jobs were dependent on these self-

19
employed producers. Wage workers constituted about 10 percent of the workers in the home-based enterprises. Gender Differentials: The gender differential in this continuum of dependence relationship was quite striking. The men home-based workers were clearly in more independent relations of production compared to the women. While 52 percent of the men were independent self-employed workers, about 53 percent of the women were the opposite, dependent self-employed producers. Only about 34 percent of the men home-based workers were in dependent relationships. While 12 percent of the men were in horizontal subcontracting, only 6 percent of the women were so. About 22 percent of the men dependent producers were in vertical sub-contracting whereas among women 47 percent were tied through various relations in vertical sub-contracting. The proportion of male wage workers in the home-based units was nearly double that of women, 13 and 7 respectively. Women home-based workers in the manufacturing sector were more likely to work in their own homes than as wage workers in employer’s homes. Another interesting gender differential is observed at the detailed three-digit industry groups (See Unni and Rani, 2005). Most of the industry groups that had shown an increase in the share of home-based male workers such as food products, metal products, general purpose machinery and wood products, had a higher proportion of independent self-employed workers. Interestingly, women in the industry groups that showed an increase in female home-based workers such as chemical products, tobacco products, wearing apparel and plastic products were mainly dependent self-employed producers and most often in the most dependent status of vertical sub-contracting. Differentials by Growth Categories: We had observed earlier that the middle growth categories, A.2 and B, had the highest proportion of home-based workers. In terms of dependent relationships, these middle growth categories also had a higher proportion of self-employed dependent producers compared to the other growth categories. This was particularly true for the women home-based workers, whereas for men this was true only in category A.2. Further, among the dependent producers, vertical sub-contracting or the greatest degree of dependence was also the maximum in these middle growth groups. In contrast

20
the top growth categories had the maximum proportion of home-based workers in the independent self-employed relationship. 5. Conclusions The major argument in this paper is that the labour market in developing countries is a reflection of the production structure in the economy. The various segments of the product market form a continuum of production techniques each producing a different quality of the final goods or intermediate products for the final goods. The labour market also consists of heterogeneous segments with the home-based workers consisting of a continuum of production relationships from the fully independent to the most dependent.
Further, the paper argues that the economic reforms in India led to expansion of markets in the economy. This expansion of markets heightened the economic activity in all the segments of the production systems. The growth of home-based work is seen within this context of expanding markets and an effort at reducing transaction costs of co-ordination within the large firms. While there is an increase in absolute number of home-based workers, their share in the total unorganised manufacturing does not increase, except marginally for male production workers. Thus, overall expanding markets led to an increase in home-based work, but not necessarily a movement towards this form of production system. However, a larger number of growth-oriented industries (in the top growth category) with good quality employment growth had an increase in the share of male home-based workers perhaps indicating an attempt to reduce transaction costs. Among women though the share of home-based work grew in the medium growth industries mainly in manufacture of wearing apparel. When viewed in terms of production systems based on a continuum of dependent relationship, the men were mainly at the most independent extreme as self-employed workers, while the women were in the most dependent status in vertical sub-contracting chains. Home-based workers therefore cannot be placed within a dichotomous classification of self-employed and wage employed workers. Whether home-
21
based workers are categorised as self-employed or wage-employed makes a difference to the process of intervention or at the policy making level to improve the conditions of their work (Prugl and Tinker, 1997). If these workers are wageworkers, then there are grounds to argue for minimum wages and other social benefits to accrue to them just as all wageworkers. If they are self-employed then the policy intervention has to be more in the nature of access to credit and expansion of markets for the products. In both cases collective bargaining is important, with the employers or contractor being the focal point in the former and the government policies of credit, trade and prices of raw materials and final products being the focus of the latter. It is necessary to first understand and record the complex nature of these relationships before any effort can be made at the policy level for these workers.

22
Table 1: Growth rates in Employment, Value Added and Labour Productivity in Unorganised Manufacturing Industry Groups
Value Added Employment Labour Productivity Industry Groups
1984-90
1989-95
1994-01
1984-90
1989-95
1994-01
1984-90
1989-95
1994-01
Category A 1 15. Food Products 0.33 -1.52 6.52 -3.65 0.79 1.69 3.98 -2.30 4.83 21. Paper Products 7.64 -3.95 10.91 10.21 -1.13 5.73 -2.57 -2.83 5.18 22. Publishing, Printing 12.25 -6.04 5.97 12.60 -2.16 3.99 -0.36 -3.89 1.98 24. Chemical Product 10.83 -12.94 8.29 9.62 -9.39 7.63 1.21 -3.55 0.66 26. Other Non-Metals 6.15 1.34 13.43 2.03 -1.81 2.69 4.12 3.15 10.74 28. Fabricated Metals -6.25 4.83 8.37 -0.31 2.38 4.27 -5.94 2.45 4.10 29. Machinery and
Equipments 11.21 -10.67 12.31 6.69 -2.55 7.56 4.53 -8.12 4.75
31. Elec. Machinery - - 21.72 9.10 -6.30 18.63 3.09 32. Radio, TV 2.23 -0.44 10.76 9.25 -1.52 4.77 -7.02 1.08 5.99 34. Motor Vehicles -26.93 -1.84 16.54 8.38 3.00 9.40 -35.31 -4.84 7.14 Sub-Total 0.59 -0.68 9.30 -0.46 -0.36 3.01 1.05 -0.32 6.28 2 17. Textiles 3.50 -2.88 6.26 -5.63 -2.43 -0.16 9.13 -0.45 6.42 27. Basic Metals 2.10 -3.82 7.02 -1.58 1.84 1.16 3.69 -5.66 5.86 35. Other Transport -22.86 -3.10 3.43 5.25 -6.87 -0.45 -28.11 3.77 3.87 36. Other Manufacturing 10.66 5.38 4.99 5.80 1.35 -3.44 4.86 4.03 8.43 Sub-Total 4.07 0.19 5.70 -2.48 -2.12 -1.26 6.55 1.32 6.96
Category B 3 16. Tobacco Products 7.24 -4.30 5.03 12.89 -8.80 7.73 -5.65 4.49 -2.70 18. Wearing Apparel* -29.52 6.24 14.40 -41.34 1.52 14.44 11.82 4.72 -0.05 20. Wood Products 6.12 -7.31 1.20 7.53 -3.08 2.36 -1.40 -4.23 -1.17 23. Coke, Petroleum -4.33 -6.73 0.16 3.11 -10.76 0.45 -7.44 4.03 -0.29 Sub-Total -1.56 -4.93 5.01 0.57 -4.75 5.16 -2.14 -0.18 -0.15
Category C
6 1405.Cotton ginning 3.85 -20.83 -1.53 -16.08 -4.33 -11.93 19.93 -16.49 10.40 33. Medical, Precision 26.31 -7.01 -1.31 7.76 -0.39 -4.36 18.54 -6.62 3.06 Sub-Total -3.45 6.92 -1.33 -2.60 0.68 -6.96 -0.85 6.24 5.63 7 25. Rubber Products 15.69 4.79 0.83 12.18 4.77 1.45 3.52 0.03 -0.63 30. Office, Accounting -1.60 19.91 -
53.12-12.41 5.91 -30.76 10.82 14.00 -22.36
19. Leather Products -16.50 8.24 1.71 -6.94 -1.65 -2.65 -9.56 9.89 4.36 Sub-Total -3.45 6.92 0.12 -2.60 0.68 -1.02 -0.85 6.24 -2.02 All * 0.99 -0.99 6.92 -0.95 -1.73 2.16 1.94 0.75 4.76 Note: The classification of Industry groups is based on the last period (1994-01) growth
categories. * Wearing apparel excludes tailoring establishments.
Sources: CSO (1990), NSSO (1989), NSSO (1994a), NSSO (1994b), NSSO (1998a),
NSSO (1998b), NSSO (2002a), NSSO (2002b).
23
Table 2: Percentage of Home-based Workers Among All Workers in Each Industry Group
Percentage of Home-based Workers Growth Rate
Male Female Total 1994-05-2000-01
1994-95
2000-01
1994-95
2000- 01
1994-95
2000- 01
Male Female Total
Category A 1 15. Food Products 50.3 45.8 74.4 73.7 (27.3) 58.5 53.4 0.9 0.0 0.6
21. Paper & Paper Products
57.0 41.1 92.1 86.8 (38.8) 73.0 58.8 0.8 4.5 2.9
22. Publishing, Printing 22.9 23.1 39.4 36.0 (9.1) 25.8 24.2 4.4 -5.3 2.7 24. Chemical Products 33.8 20.2 70.5 83.4 (52.6) 57.3 53.5 1.7 7.9 6.6 26. Other Nonmetallic
Mineral Products 54.4 41.7 60.5 51.3 (34.2) 57.1 45.0 -1.6 0.0 -1.0
28. Fabricated Metal Products
37.6 33.8 72.4 69.5 (7.8) 40.4 36.6 2.3 -0.9 1.8
29. Machinery & Equip n e c
29.8 27.5 27.0 46.7 (4.8) 30.6 28.4 6.1 10.0 6.4
31. Electrical Machinery 21.3 19.0 26.8 23.4 (16.7) 22.6 19.7 14.2 14.0 14.2 32. Radio, TV,
Communications 34.4 36.4 41.8 11.9 (16.0) 35.8 32.5 3.7 -6.5 2.9
34. Motor Vehicles 25.8 8.2 16.0 17.0 (2.6) 25.7 8.5 -9.1 -14.0 -9.4 Sub Total 46.8 39.7 69.4 66.7 (26.0) 54.0 46.7 0.8 0.8 0.8 2 17. Textiles 72.1 70.1 87.4 89.5 (43.2) 80.6 78.5 0.1 1.5 0.8
27. Basic Metals 26.5 23.0 31.2 64.3 (3.7) 27.1 24.5 -0.6 -0.3 -0.6 35. Other Transport
equipments 39.9 23.2 73.5 35.1 (2.9) 43.5 23.6 -8.8 -30.1 -10.6
36. Furniture & Other Manufacturing
47.9 32.7 91.2 82.6 (19.5) 60.7 42.4 -8.1 -9.2 -8.6
Sub Total 60.5 54.0 88.2 88.2 (34.8) 72.4 65.9 -2.3 -0.8 -1.6 Category B
3 16. Tobacco Products 87.7 86.7 95.7 95.1 (69.3) 92.6 92.5 3.1 8.0 6.4 18. Wearing Apparels* 45.7 39.1 58.9 86.2 (31.0) 48.8 53.7 8.2 33.1 16.4 20.Wood Except Furniture 70.4 65.7 92.9 93.1 (34.0) 78.6 75.0 1.7 1.8 1.7 23.Coke refined
petroleum 27.5 8.9 34.1 35.1 (10.6) 30.7 11.7 -16.9 -11.3 -15.4
Sub Total 71.5 65.9 93.4 93.6 (46.0) 81.1 78.7 2.5 6.0 4.3
24
Table 2 (Contd…) Category C
6 1405. Cotton Gin, Cleaning & Bailing
60.3 36.3 86.1 18.8 (34.7) 72.3 30.3 -19.9 -39.4 -26.4
33. Medical precision, optical
43.6 14.1 15.6 19.8 (7.1) 41.3 14.5 -19.5 -22.0 -19.8
Sub Total 49.6 19.1 50.7 19.1 (15.2) 53.6 19.1 -19.7 -35.2 -23.2 7 25. Rubber Products 20.5 23.9 47.9 54.0 (21.3) 25.7 30.4 3.4 9.0 5.3
30. Office, Accounting & computing
3.6 0.4 0.0 0.8 (13.8) 3.1 0.4 -67.7 0.0 -62.9
19. Leather 58.4 48.9 80.9 66.5 (10.4) 61.1 50.7 -6.0 -8.2 -6.3 Sub Total 44.1 38.3 65.0 58.5 (15.4) 47.7 41.4 -4.0 -0.4 -3.3 TOTAL* 56.5 49.7 83.4 83.3 (34.0) 66.9 61.2 0.2 2.3 1.1 Note: Figures in parentheses indicate the percentage of all female to all production workers *Wearing apparel excludes tailoring establishments. Source: Estimates are computed from raw data.
Table 3: Percentage of Home-based Workers Among Production Workers
(Family and Hired) in Each Industry Group Percentage of Home-based Workers Growth Rate
Male Female Total 1994-95-2000-01 Industry
1994-95
2000-01
1994-95
2000-01
1994-95
2000-01
Male Female Total
Category A 1 15. Food Products 40.2 46.0 78.4 71.5
(19.2)56.1 50.9 14.0 -8.0 4.7
21. Paper & Paper Products
51.3 33.9 93.4 82.8 (32.4)
67.9 49.7 3.6 3.3 3.4
22. Publishing, Printing 17.3 21.0 42.1 32.1 (7.8)
20.4 21.8 12.3 -4.0 9.4
24. Chemical Products 28.1 18.6 64.3 80.5 (48.3)
46.9 48.5 8.2 16.5 14.5
26. Other Nonmetallic Mineral Products
46.1 38.3 61.5 33.5 (25.1)
53.8 37.1 8.3 -16.8 -1.5
28. Fabricated Metal Products
31.0 32.3 73.2 61.6 (4.4)
35.2 33.6 10.9 -7.5 8.4
29. Machinery & Equip n e c
21.4 24.4 44.5 12.6 (3.1)
22.5 24.0 15.3 -16.4 13.8
31. Electrical Machinery 20.0 17.4 14.2 10.9 (15.7)
19.1 16.4 17.9 15.4 17.6
32. Radio, TV, Communications
31.6 35.2 43.8 9.4 (15.6)
32.4 31.2 9.2 -1.2 8.5
34. Motor Vehicles 24.9 8.1 17.6 17.6 (2.7)
24.4 8.4 -5.2 -2.4 -5.0
Sub Total 37.3 38.1 71.3 59.1 (18.8)
50.1 42.1 11.9 -7.5 4.3

25
Table 3 (Contd…) 2 17. Textiles 64.7 66.3 85.9 86.0
(34.5) 75.2 73.1 6.9 -4.1 1.5
27. Basic Metals 24.6 20.4 40.0 36.4 (2.3)
25.8 20.7 3.7 -16.1 2.2
35. Other Transport equipments
32.8 23.0 95.1 69.9 (1.2)
37.2 23.6 -0.5 -30.3 -3.3
36. Furniture & Other Manufacturing
32.9 31.0 94.5 78.8 (15.1)
57.9 38.2 7.5 -17.0 -4.4
Sub Total 51.4 50.5 88.4 84.5 (26.9)
68.3 59.7 6.9 -7.3 0.0
Category B
3 16. Tobacco Products 79.3 85.3 93.4 94.4 (67.6)
90.1 91.4 20.2 11.5 13.7
18. Wearing Apparels* 41.9 39.6 59.1 88.4 (28.2)
44.8 53.4 12.9 31.5 19.2
20.Wood Except Furniture
57.7 62.1 93.1 91.4 (22.2)
77.5 68.6 19.1 -7.4 6.3
23. Coke refined petroleum
24.9 8.1 38.3 36.2 (2.7)
28.3 8.9 -10.4 -33.8 -15.3
Sub Total 58.3 55.1 92.2 91.9 (36.2)
78.2 68.4 18.6 4.5 10.2
Category C
6 1405. Cotton Gin, Cleaning & Bailing
38.6 33.7 90.3 9.2 (30.9)
63.7 26.1 5.4 -42.9 -12.1
33. Medical precision, optical
42.9 13.9 33.6 16.9 (7.6)
39.6 14.1 -12.8 -37.3 -17.3
Sub Total 42.0 18.5 51.6 12.1 (14.4)
45.8 17.6 -7.3 -40.2 -15.2
7 25. Rubber Products 16.2 22.1 42.5 48.7 (20.2)
19.6 27.4 9.9 16.2 11.9
30. Office, Accounting & computing
3.5 0.4 0.0 3.1 (3.9)
2.8 0.5 -61.0 0.0 -56.1
19. Leather 51.1 47.4 82.4 54.5 (6.8)
55.7 47.9 2.9 -17.2 0.1
Sub Total 35.8 36.2 66.1 50.2 (13.2)
40.0 38.1 4.5 -1.4 3.3
TOTAL* 45.5 46.4 83.4 81.1 (26.9)
62.3 55.7 11.7 -2.6 4.7
Note: Figures in parentheses indicate the percentage of all female to all production workers. * Wearing apparel excludes tailoring establishments.
Source: Estimates are computed from raw data.

26
Table 4: Percentage of Home-based Workers in the Manufacturing Sector by Rural Urban Location, 1999-00
Home-based Sector
Male Female Total Rural 34.78 72.03 48.18 Urban 16.29 62.89 26.02 Total 25.35 69.03 38.04
Source: Estimates for 1999-2000 are computed from raw data.
Table 5: Age Distribution of Total, Home-based and Sub-contract Workers in the Manufacturing Sector, 1999-00
Total Workers Home-based Sub-contract Age
Group Male Female Total Male Female Total Male Female Total 5-14 2.0 6.7 3.4 3.4 7.8 5.7 4.1 9.2 7.4 15-29 39.0 42.3 40.0 36.0 42.8 39.6 36.0 47.1 43.1 30-44 36.3 32.5 35.2 32.2 31.3 31.7 31.9 28.8 29.9 45-59 17.5 14.2 16.5 18.7 13.4 15.9 18.9 11.3 14.1 60+ 5.2 4.2 4.9 9.7 4.6 7.0 9.1 3.5 5.5 Total 100.0 100.0 100.0 100.0 100.0 100.0 100.0 100.0 100.0 Source: Same as Table 4.
Table 6: Distribution of Total, Home-based and Sub-contract Workers in the Manufacturing Sector by Education, 1999-00
Total Workers Home-based Sub-contract Education
Male Female Total Male Female Total Male Female Total Illiterate 21.0 53.8 30.6 33.5 56.2 45.5 33.2 53.7 46.2 Literate-Primary 29.3 27.4 28.7 33.6 28.3 30.8 34.3 32.0 32.8 Middle 19.8 11.7 17.5 16.8 10.9 13.7 18.3 10.6 13.4 Secondary 14.6 4.3 11.6 9.5 3.0 6.1 7.3 2.5 4.3 Higher Sec. 7.2 1.5 5.6 4.5 1.0 2.6 4.7 0.8 2.2 Graduation & Above
8.1 1.3 6.1 2.1 0.5 1.3 2.2 0.3 1.0
Total 100.0 100.0 100.0 100.0 100.0 100.0 100.0 100.0 100.0 Source: Same as Table 4.
27
Table 7: Distribution of Total, Home-based and Sub-contract Workers in the Manufacturing Sector by Social Groups, 1999-00
Total Workers Home based Sub-contract Social
Groups Male Female Total Male Female Total Male Female Total ST 4.0 7.3 5.0 5.5 8.3 6.9 4.1 5.4 4.1 SC 16.6 19.5 17.4 17.4 18.9 18.2 17.1 16.3 17.1 OBC 38.4 44.5 40.2 45.5 42.7 44.1 47.9 43.5 47.9 Others 40.9 28.6 37.5 31.6 30.1 30.8 30.8 34.8 30.8 Total 100.0 100.0 100.0 100.0 100.0 100.0 100.0 100.0 100.0 Note: ST: Scheduled Tribe; SC: Scheduled Caste; OBC: Other Backward Caste
Source: Same as Table 4.
Table 8: Distribution of Total, Home-based and Sub-contract Workers in the Manufacturing Sector by Religion, 1999-00
Total Workers Home-based Sub-contract Religion
Male Female Total Male Female Total Male Female Total Hindu 80.1 75.2 78.7 77.0 71.0 73.9 74.4 64.1 68.2
Muslim 15.7 20.8 17.1 20.0 25.6 22.9 22.7 33.2 29.1 Christian 1.8 2.7 2.1 1.4 2.2 1.8 1.0 1.4 1.3 Sikh 1.3 0.5 1.1 0.9 0.5 0.7 1.3 0.5 0.8 Jain 0.4 0.1 0.3 0.1 0.0 0.1 - - - Buddhist 0.3 0.4 0.3 0.2 0.2 0.2 0.2 0.2 0.2 Parsi 0.0 0.1 0.1 0.1 0.2 0.1 0.2 0.3 0.3 Other 0.4 0.3 0.3 0.3 0.3 0.3 0.2 0.3 0.2 Total 100.0 100.0 100.0 100.0 100.0 100.0 100.0 100.0 100.0 Source: Same as Table 4.

28
Table 9: Percentage of Workers by Status of Dependence in Home-based Manufacturing, 1999-00
Among Home-based Workers Percentage
Home-based to Total Workers
Self-Employed
Independent
Self-Employed
Dependent: Sub-
contracted
Horizontal Sub-
contracting
Vertical Sub-
contracting
Wage Employed
Total Workers Category A.1 23.03 67.5 23.1 10.9 12.2 9.5 Category A.2 40.05 36.9 50.8 8.2 42.6 12.4 Category B 61.86 39.5 51.8 8.0 43.8 8.7 Category C.6 11.52 88.2 2.0 2.0 0 9.8 Category C.7 15.59 46.3 38.8 25.0 13.8 14.9 Total Manufacturing
38.04 45.6 44.3 9.09 35.22 10.1
Male Workers Category A.1 17.4 69.9 17.3 13.1 4.2 12.8 Category A.2 28.7 33.9 47.5 10.0 37.5 18.7 Category B 41.5 55.0 37.0 11.6 25.4 8.0 Category C.6 7.1 79.2 3.6 3.6 0 17.2 Category C.7 14.2 48.7 35.5 26.5 9.1 15.8 Total Manufacturing
25.3 52.4 34.4 12.0 22.3 13.2
Female Workers Category A.1 44.8 63.8 31.8 7.5 24.3 4.4 Category A.2 70.8 40.2 54.3 6.1 48.2 5.5 Category B 84.7 31.0 59.9 6.1 53.8 9.1 Category C.6 67.9 100.0 - - - - Category C.7 29.1 35.8 53.6 18.4 35.2 10.7 Total Manufacturing
69.0 39.5 53.2 6.4 46.8 7.3
Source: Same as Table 4.
29
References Basant, R. and U. Rani (2004), ‘Labour Market Deepening in India’s IT: An
Exploratory Analysis’, Economic and Political Weekly, 39(50): 5317-26. Becker, G.S. and K.M. Murphy (1992), ‘The Division of Labor, Coordination
Costs and Knowledge’, The Quarterly Journal of Economics, CVII (4): 1137-60.
Chatterjee, Mirai, Marty Chen, Jeemol Unni (2002), ‘Autonomy, Security and
Voice in Ahmedabad City, India’, Paper presented at the Workshop on ‘Reconceptualizing Work and Decent Work Indexes’ organized by International Labour Organization, Geneva, December 12-13, 2002.
Craig, C., Rubery, J., Tarling, R. and Wilkinson, F. (1982), Labour Market
Structure, Industrial Organisation and Low Pay, Cambridge: Cambridge University Press.
CSO (1990), Directory Manufacturing Establishments Survey 1989-90, Summary
Results for Central Sample, Department of Statistics, Ministry of Planning, Government of India, New Delhi.
Doeringer,P. and M. Piore (1971), Internal Labour Markets and Manpower
Analysis, Heath Lexington Books, Lexington. Duranton, G. (2004), ‘The Economics of Production Systems: Segmentation and
Skill-based Change’, European Economic Review, 48: 307-36. Ethier, W. (1982),’National and International Returns to Scale in the Modern
Theory of International Trade’, American Economic Review, 72:389-405. Fine, Ben (1998), Labour Market Theory: A Constructive Reassessment, London:
Routledge. Kantor, Paula (2000), ‘Gender Differentials in Micro enterprise Success for Home
based Garment Makers in Ahmedabad, India’, A dissertation submitted for the degree of Doctor of Philosophy, Department of City and Regional Planning, University of North Carolina at Chapel Hill.
NSSO (1989), NSS 40th Round (July 1984-June 1985); No.363/1, Tables with
Notes on Survey of Unorganised Manufacture: Non-Directory Establishments and Own Account Enterprises, Part I, Part II (Volume 1 and 2), Department of Statistics, New Delhi: Government of India.
30
NSSO (1994a), NSS 45th Round (July 1989-June 1990); No.396/2, Tables with Notes on Survey of Unorganised Manufacture: Non-Directory Establishments and Own Account Enterprises, Part-I (All India), Department of Statistics, New Delhi: Government of India.
NSSO (1994b), NSS 45th Round (July 1989-June 1990); No.396/2, Tables with Notes on Survey of Unorganised Manufacture: Non-Directory Establishments and Own Account Enterprises, Part-II (States), Volume 1, Department of Statistics, New Delhi: Government of India.
NSSO (1998a), NSS 51st Round (July 1994-June 1995); No.433 (51/2.2/1) Unorganised Manufacturing Sector in India: Its Size, Employment and Some key Estimates, -Directory Establishments and Own Account Enterprises, Department of Statistics, New Delhi: Government of India.
NSSO (1998b), NSS 51st Round (July 1994-June 1995); No.434 (51/2.2/2) Unorganised Manufacturing Sector in India: Salient Features, Department of Statistics, New Delhi: Government of India.
NSSO (2002a), NSS 56th Round (July 2000-June 2001); No.479 (56/2.2/3) Unorganised Manufacturing Sector in India: Employment, Assets and Borrowings, Ministry of Statistics and Programme Implementation, New Delhi: Government of India.
NSSO (2002b), NSS 56th Round (July 2000-June 2001); No.480 (56/2.2/4) Unorganised Manufacturing Sector in India: Input, Output and Value Added, Ministry of Statistics and Programme Implementation, New Delhi: Government of India.
Prugl, E and Irene Tinker (1997), ‘Micro entrepreneurs and Homeworkers:
Convergent Categories’, World Development, 25(9), pp.1471-1482. Unni, Jeemol and Uma Rani (2003), ‘Changing Structure of Workforce in
Unorganised Manufacturing’, The Indian Journal of Labour Economics, 46(4): 983-97.
Unni, Jeemol and Uma Rani (2005), “Impact of Recent Policies on Home-based
Work in India”, Discussion Paper Series No. 10, Human Development Resource Centre, United Nations Development Programme, New Delhi.
Watanabe, S., edited (1983), Technology, Marketing and Industrialisation: Linkages
between Large and Small Enterprises, Macmillan India Limited, Delhi.
31
Appendix Table 1: Percentage of Home-based Workers in Each Industry Group to All Home-based Production Workers (Family and Hired)
Male Female Total Industry 1994-95 2000-01 1994-95 2000-01 1994-95 2000-01
Category A 1 15. Food Products 18.67 19.45 17.66 11.17 18.07 16.21
151. Meat, fish, fruit, vegetables 1.59 1.59 0.64 0.85 1.03 1.30 152. Dairy products 1.21 2.07 1.45 1.47 1.36 1.84 153. Grain mill products 7.54 10.04 5.93 5.06 6.59 8.09 154. Other food products 7.16 4.27 8.30 2.89 7.83 3.73 155. Beverages 1.17 1.48 1.34 0.90 1.27 1.25 21. Paper & Paper Products 0.81 0.45 0.66 0.82 0.72 0.60 22. Publishing, Printing 0.90 0.85 0.21 0.17 0.49 0.58 24. Chemical Products 0.65 0.48 1.09 3.01 0.91 1.47 241. Basic chemicals 0.03 0.01 0.00 0.00 0.01 0.01 242. Other chemical products 0.62 0.47 1.09 3.01 0.90 1.47 243. Man made fibres 0.00 0.00 0.00 0.00 0.00 0.00 26. Other Nonmetallic Mineral Products 9.28 6.87 8.38 3.14 8.75 5.41 261. Glass & Glass Products 0.72 0.29 0.08 0.17 0.34 0.24 269. Non Metallic mineral products n.e.c 8.56 6.58 8.30 2.97 8.40 5.17 28. Fabricated Metal Products 4.94 4.28 0.89 0.58 2.54 2.83 281. Structural Metal Products 0.35 0.71 0.00 0.23 0.14 0.52 289. Other Fabricated metal products n.e.c. 4.59 3.57 0.89 0.35 2.39 2.31 29. Machinery & Equip n e c 0.93 1.04 0.07 0.03 0.42 0.65 291. General purpose machinery 0.03 0.13 0.00 0.01 0.01 0.08 292. Special purpose machinery 0.81 0.88 0.06 0.02 0.36 0.54 293. Domestic appliances 0.09 0.04 0.01 0.00 0.04 0.02 31. Electrical Machinery 0.27 0.35 0.02 0.06 0.12 0.24 311. Elec motor, generators, transformers 0.05 0.12 0.01 0.00 0.03 0.07 312. Elec. Distribution & control apparatus 0.07 0.01 0.01 0.01 0.03 0.01 313. Insulated wire & cable 0.02 0.00 0.00 0.00 0.01 0.00 314. Accumulators, cells & batteries 0.06 0.05 0.00 0.01 0.02 0.03 315. Electric lamps 0.07 0.06 0.00 0.02 0.03 0.04 319. Other electric equipment n.e.c 0.00 0.12 0.00 0.02 0.00 0.08 32. Radio, TV, Communications 0.16 0.12 0.01 0.01 0.07 0.08 321. Electronic valves & tubes 0.03 0.01 0.00 0.00 0.01 0.01 322. TV, radio transmitters 0.01 0.06 0.00 0.00 0.01 0.04 323. TV, radio receivers 0.12 0.05 0.00 0.00 0.05 0.03 34. Motor Vehicles 0.25 0.08 0.01 0.01 0.11 0.05 341. Motor vehicles 0.01 0.00 0.00 0.00 0.00 0.00 342. Bodies, coach 0.16 0.02 0.00 0.00 0.07 0.01 343. Parts & accessories. 0.08 0.06 0.01 0.01 0.04 0.04 Sub Total 36.86 33.98 29.01 19.00 32.2 28.11

32
Appendix Table 1 (Contd…)
2 17. Textiles 28.79 19.57 25.91 20.82 27.08 20.06 171. Spinning, weaving & finishing 16.77 11.36 16.25 10.09 16.46 10.86 172. Other textiles 11.50 8.01 9.50 10.14 10.31 8.84
173. Knitted & crocheted 0.51 0.21 0.16 0.59 0.30 0.36 27. Basic Metals 0.44 0.25 0.04 0.02 0.20 0.16 271. Basic iron, steel 0.14 0.05 0.00 0.00 0.06 0.03 272. Non ferrous metal 0.26 0.18 0.02 0.01 0.12 0.11 273. Casting of metals 0.04 0.02 0.02 0.00 0.03 0.01 35. Other Transport equip 0.31 0.14 0.05 0.01 0.15 0.09 351. Ships & Boats 0.01 0.00 0.00 0.00 0.00 0.00 352. Railways & Tramway 0.00 0.00 0.00 0.00 0.00 0.00 353. Space craft & air craft 0.00 0.00 0.00 0.00 0.00 0.00 359. Transport equipment n.e.c 0.30 0.13 0.05 0.01 0.15 0.08 36. Furniture & Other Manufacturing 9.31 6.59 12.52 4.62 11.22 5.82 361. Furniture 3.92 1.79 1.22 0.18 2.32 1.16 362. Manu n.e.c (Jewellery, sports, music) 5.38 4.81 11.30 4.44 8.90 4.66 Sub Total 38.84 26.55 38.52 25.46 38.65 26.12
Category B 3 16. Tobacco Products 4.99 7.54 13.26 27.06 9.90 15.19
18. Wearing Apparels 2.83 11.79 0.55 16.06 1.48 13.46 181. Wearing apparel except fur 2.77 11.75 0.54 16.03 1.45 13.43 182. Fur products 0.05 0.04 0.01 0.03 0.03 0.04 20.Wood Except Furniture 12.75 18.02 17.80 11.73 15.75 15.56 201. Saw milling of wood 0.74 0.26 0.01 0.01 0.31 0.16 202. Products of wood, straw, cork 12.01 17.76 17.79 11.72 15.45 15.40 23. Coke refined petroleum 0.07 0.02 0.02 0.00 0.04 0.01 231. Coke oven products 0.03 0.01 0.01 0.00 0.02 0.01 232. Refined petroleum 0.03 0.01 0.02 0.00 0.02 0.00 233. Nuclear fuel Sub Total 20.63 37.37 31.64 54.85 27.17 44.22
Category C
6 1405. Cotton Gin, Cleaning & Bailing 0.04 0.03 0.07 0.01 0.06 0.02 33. Medical precision, optical 0.18 0.04 0.05 0.01 0.10 0.02 331. Medical instruments 0.02 0.02 0.00 0.00 0.01 0.01 332. Optical instruments 0.15 0.01 0.05 0.00 0.09 0.01 333. Watches & clocks 0.00 0.00 0.00 0.00 0.00 0.00 Sub Total 0.22 0.06 0.12 0.01 0.16 0.04
33
Appendix Table 1 (Contd…)
7 25. Rubber Products 0.67 0.55 0.18 0.47 0.38 0.52 251. Rubber products 0.18 0.12 0.04 0.05 0.10 0.09 252. Plastic products 0.49 0.43 0.14 0.43 0.28 0.43 30. Office, Accounting & computing 0.00 0.00 0.00 0.00 0.00 0.00 19. Leather 2.78 1.49 0.54 0.20 1.45 0.98 191. Tanning & dressing 0.56 0.38 0.22 0.04 0.36 0.25 192. Footwear 2.22 1.11 0.32 0.15 1.09 0.74 Sub Total 3.45 2.04 0.71 0.67 1.82 1.50 TOTAL 100 100 100 100 100 100 Source: Estimates are computed from raw data.


![M. Langan & J. Scott - The False Promise of AfT December 2011 [BWPI Working Paper 160]](https://img.pdfslide.net/doc/110x75/54440705b1af9f600a8b4752/m-langan-j-scott-the-false-promise-of-aft-december-2011-bwpi-working-paper-160.jpg)