Embed Size (px)
Citation preview

WORKING PAPER NO. 2014-09
Evaluation of Public R&D Policy: A Meta-Regression Analysis
By
Syoum Negassi and Jean-Francois Sattin
WORKING PAPER SERIES

The views expressed in the Working Paper Series are those of the author(s) and do not necessarily reflect those of the Department of Economics or of the University of Delaware. Working Papers have not undergone any formal review and approval and are circulated for discussion purposes only and should not be quoted without permission. Your comments and suggestions are welcome and should be directed to the corresponding author. Copyright belongs to the author(s).

1
Evaluation of Public R&D Policy: A Meta-Regression Analysis
Syoum NEGASSI1 University Paris 1 Pantheon Sorbonne and Visiting Professor, University of Delaware
Jean-François SATTIN
University Paris 1 Pantheon Sorbonne
April 2014 Abstract. Economic theory and empirical evidence indicate that technological innovation is an important determinant of long-term economic development. Various country policies have been launched in favour of private research and development (R&D) with economic development as the main objective. As often in economics, public intervention is grounded on the presumed existence of market failures. The purpose of this paper is two-fold. First, it provides an overview of the history of R&D-related tax policies in more than ten industrial countries. Second, after reviewing the existent empirical evidence on the effectiveness of R&D tax credits policies, it presents a meta-regression analysis based on an econometric model. Our results show that an R&D tax credit is strongly significant in the studies taken cumulatively. JEL Classification: C01, C12, H53, H54, O31, O32. Keywords: R&D, Meta-analysis Corresponding author: Syoum NEGASSI University of Paris 1 Pantheon Sorbonne Visiting Professor, University of Delaware [email protected]
1 I would like to thank the Department of Economics at the University of Delaware for giving me the opportunity to work on my research during my stay as a visiting professor and the University of Delaware Library for granting me access to all the online journals and other resources I required for this research. The financial support of MESR (Ministère de l'enseignement supérieur et de la recherche DGRI / SPFCO B1 - Département de la gestion et du pilotage budgétaire des programmes,1 rue Descartes 75231 PARIS Cedex 01) is gratefully acknowledged.

2
1. Introduction US, European and Asia policy makers have been concerned about the technological
performance of their countries for large parts of the Twentieth Century. These concerns were
sharpened by the post-war rise of the Japanese economy, which enjoyed very high growth
rates until the 1990s based on a strong technological base and high commitment to R&D. The
phenomenal growth of US, European and Asian economies (specially the Asian tiger
economies) over the 1980s and mid-1990s has also been based on a high-tech strategy. These
competitive threats have coincided with an intellectual movement in economic theory which
emphasizes the conscious accumulation of R&D and human capital in explaining economic
growth (e.g. Aghion and Howitt, 1992).
Public support for innovation-related activities has been justified in several ways. First,
governments are responsible for providing new or improved technology for public sector
functions (security, health, and communications) and R&D for these tasks may be performed
in public research laboratories or contracted out to private firms and funded by public
revenues. The second justification for public subsidies is to correct for market failures.
Market failures in real and financial markets offer scope and justification for public support,
as the return may be not sufficient to justify private investment. The broad consensus on the
use of public support is based on the inefficiencies of the market. The neoclassical theory
based on a positive externality argument suggests that, because of the ‘public good’
characteristics of R&D activities, the level of private R&D expenditure would be
systematically lower than the socially optimal level. These create a gap between private and
social return on R&D, and as a result less than optimal levels of research. Incomplete
appropriability of research output and externalities deriving from the public good nature of
R&D are at the base of this (Nelson, 1959; Arrow, 1962). The characteristics of imperfect
appropriability and imperfect excludability lead to the under-provision of innovation outputs
by private decision makers in a market environment. This occurs since the benefits associated
with R&D activities are easily and freely available to firms that are not engaged in R&D
efforts. Indeed, the lack of full appropriability of R&D outcomes reduces the incentive to do
R&D on the part of private firms so that, as in a classical Pigouvian context, government
intervention through subsidization can reduce the extent of this ‘market failure’.
This argument has been widely criticized by several scholars. From an evolutionary
perspective, Cohen and Levinthal (1989) argued that knowledge cannot be so easily absorbed
unless imitative firms, in turn, invest in a certain level of R&D effort: imitation is not costless

3
and needs some pre-existing ‘hard core’ R&D activity. This standpoint could lead to a
paradoxical consequence: in an environment characterized by significant spillover effects,
firms could have greater incentives to perform R&D since, in doing so, they might expand
their absorptive capacity, i.e. their ability to benefit from the R&D efforts of others. In this
way, they could more easily imitate and exploit market surpluses. As a consequence, the level
of R&D could be too high (rather than too low), since many firms could undertake more
R&D effort than that required to reach the optimal social results (e.g. by an increase of
duplications in R&D expenditure).
Some scholars have suggested that R&D should not be taken as a pure public good: a firm
has a great number of tools to protect its inventive capacity, such as patents and secrecy (see,
e.g. Nadiri, 1993). Therefore, the extent of positive externalities in production can be very
limited and ⁄or industry-specific, and the need for supporting R&D activities more
controversial than it might appear at first glance.
Additionally, knowledge is not subject to exhaustion or congestion because knowledge is a
non-rival and partially excludable good (Romer, 1990). The use of knowledge for one
purpose does not diminish its supply or availability for other purposes. This “public good”
feature demonstrates the social desirability of technological knowledge, but also presents a
major disincentive for private investment.
There is also asymmetric information about the expected outcome of R&D investments and
sunk costs in R&D investment. Moreover, investment in R&D is riskier than investment in
physical assets, and as a result there are likely to be more financial constrained (Hyytinen and
Tovainen, 2005; Czarnitzki, 2006). Public investment is designed to encourage firms to carry
out R&D by lowering marginal costs and decreasing the uncertainties that are typically
connected to this activity. In addition to these direct effects at the firm level, positive indirect
impacts are also expected to spill over to other firms in the system.
Economic theory and empirical evidence indicate that technological innovation is an
important determinant of long-term economic development. Various country policies have
been launched in favour of private research and development (R&D) with economic
development as the main objective. For example, some countries like the United States and
France, pioneered in R&D tax credit programs at the beginning of the 1980s. The popularity
of R&D tax credits continued into this millennium, when other countries established their
R&D tax credit programs in the end of 1990 and beginning of 2000, respectively. The
rationale backing such policies is that governments can pursue regional economic

4
development by correcting market failure in innovation, thus enhancing private incentive to
invest in research and development.
Given that the R&D tax credit has been in existence in many countries for a number of years,
one legitimate question is whether this R&D-preferential policy has induced additional
private R&D expenditure in these countries. There is no doubt that jobs and income are
ultimate goals in countries’ innovation-based economic development. However, increasing
private spending on R&D in the country is a necessary intermediate step toward these final
goals. Therefore, evaluating the effects of tax credits on private R&D spending is an
important first step toward a full evaluation of the economic effects of R&D tax incentives.
Since the R&D tax credit co-exists with other countries R&D policy efforts, we can also
include other relevant policy factors such as countries’ cooperative technology programs in
Europe, and input and output of the higher education sector. Although R&D tax credit is just
one of several policy instruments on R&D, it is a common strategy being employed by many
countries for many years.
There have been many policy analyses of R&D tax credit, which confirm the effectiveness of
R&D tax incentives on private spending in R&D. Studies of tax incentives aim mainly at
measuring the additional private R&D spending and the cost-effectiveness of the incentives.
Econometric estimation using two types of parametric methods developed first: impact
models (Berger, 1993) in which a binary variable shows the impact of the tax incentive, and
demand models (Hall, 1993) that directly obtain the price-elasticity of R&D investment.
More recently, parametric approaches have been combined with non-parametric ones in the
evaluation of public policies. The second set of approaches has been widely used to
determine whether R&D direct subsidies complement or crowd out private spending on
R&D. In these studies, the recent concern about endogeneity and selection problems has led
researchers to identify patterns in the distribution of public support and to estimate
counterfactual status (Herrera and Heijs 2006).
As more and more emphasis is being given to the role of government supporting innovation-
related activity, a clearer understanding of the historical intent of R&D related tax policies
and of the effectiveness of these policies appears to be necessary.
The purpose of this paper is two-fold. First, it provides an overview of the history of R&D-
related tax policies in more than ten industrial countries. Second, after reviewing the existent
empirical evidence on the effectiveness of R&D tax credits policies, it presents a meta-
regression analysis based on an econometric model.

5
Section 2 presents the aspects of the public scheme to be evaluated. Section 3 is devoted to
the R&D tax incentives schemes and theoretical framework of the effectiveness of public
policies with a brief introduction to models that are widely used in the evaluations of R&D
public policies. Section 4 outlines the empirical methodologies and section 5 presents results
and discussion.
2. R&D tax incentives schemes and Theoretical Framework of government policies for private R&D
a. Public policy scheme
R&D tax incentives also often seek to understand the channels underling a possible increase
in the amount of R&D caused by the policy. For example, many questions can be raised: by
how much do R&D tax incentives increase investment for firms that already investing in
R&D; how many firms that were not yet investing in R&D are induced to invest in R&D to
the tax incentives; and how does the presence of R&D tax incentives across countries affect
the decision of firms to locate their R&D investment in different tax jurisdictions.
The effectiveness of R&D tax incentives on increasing R&D investment can be evaluated by
estimating the private “R&D price elasticity”, which measures the percentage change in R&D
investment resulting from tax relief for every percentage change in its after-tax price (also
called the user cost of R&D), or by the “incrementality ratio,” which measures the change in
R&D investment per dollar of forgone tax revenue that is spent on R&D fiscal incentives.
The incremental credit is meant to target tax relief to R&D expenditure that would not have
occurred in absence of the credit. On the other hand, volume credits do not provide additional
incentives to increase R&D investment from previous years since conditional on current level
of R&D, firms will receive a tax credit regardless of their past investment.
An incremental scheme supports more firms with high R&D growth relative to a volume-
based scheme which supports equally all R&D performing firms. A combination of volume
and incremental tax incentives (hybrid schemes) maintains the level R&D investment and
simultaneously rewards high growth in R&D investment (Criscuolo and al., 2009).
R&D tax incentives may also affect the overall level of R&D investment in a country by
encouraging R&D by firms that have not previously invested in R&D. R&D tax incentives
schemes can provide special provisions for new claimants (e.g. France) or starts-up (e.g.
France, Netherland and Korea). At the same time, fiscal incentives might not be sufficient to

6
spur a firm’s decision to invest in R&D; there is scarce empirical evidence on this issue, (see
our results).
Insert Table 1
R&D tax incentives are now used in 26 out of 34 OECD member countries. Among non-
OECD member countries, Brazil, China, India, Russia, Singapore and South Africa provide
tax incentives for R&D.
The existing R&D tax incentives schemes differ significantly across countries in terms of
their generosity, their design, and how they explicitly target different firms or specific areas.
Tax incentives for R&D include expenditure-based tax incentives, tax credits, R&D tax
allowance, payroll withholding tax credit for R&D wages, and taxing royalty income and
other income from knowledge capital at a preferential rate. Tax incentives differences are
illustrated in table 1. Most OECD countries and emerging countries provide fiscal incentives
through tax credits or enhanced allowances. Tax credits allow a direct deduction from the tax
payable while enhanced allowances provide an additional tax deduction (above a normal
deduction rate of 100% for wages, and depreciation for capital cost) from corporate taxable
income. The main difference between the two mechanisms is that the former directly reduces
the tax liability while the latter approach the reduction in tax liability depends on corporate
income tax rate.
R&D tax incentives may apply to all qualified R&D expenditures (volume-based credits like
in Canada) or only to the additional amount of R&D expenditure above a certain base amount
(incremental credits like in USA).
Support for business R&D through the tax system is typically part of a broader set of policies
to support investment in R&D, which also includes direct support, such as grants, loans or
procurements contracts.
The overall costs associated with the R&D tax incentives schemes depend both on the uptake
of the scheme by firms and the design of tax incentives in a country. Significant differences
exist in the generosity of R&D tax incentives across countries and within countries between
small and large firms.
b. Theoretical background

7
The majority of research on the effects of public policies on firm R&D expenditure have
chosen to measure the presence ⁄absence of ‘additionality’ of public incentives by skipping, at
least implicitly, the essential step of providing an explicit theoretical framework to explain
this causal relation (and also without entering too much into the analysis of other types of
additionality, such as that based on output variables: productivity, profitability, innovation
performance, etc.). David et al. (2000) and David and Hall (2000) provide more sound
theoretical bases for the understanding of the effect of public policies on private R&D
investment. Their structural model identifies the optimal level of R&D investment as the
point at which marginal rate of returns (MRR) and marginal capital costs (MCC) associated
with R&D investments are equal. This is the classic profit maximization strategy of firms.
The MRR curve derives from sorting R&D projects according to their internal rate of return,
as in a usual investment plan. This curve is a decreasing function of R&D expenditure, since
firms will first implement projects with higher internal rates of return and then those
presenting lower rates. The MCC curve, instead, reflects opportunity costs of investment
funds, at any level of R&D. This curve has an upward slope due to the assumption that, as
soon as the number of projects to implement increases, firms have to shift from financing
them through retained earnings to equity and ⁄ or debt funding (i.e. from internal to external
and more costly sources).
Both curves depend on a number of variables (other than R&D expenditure) that can move
them either downward or upward. MRR depends of technological opportunities; state of
demand; appropriability conditions and MCC of technological policy tools; macroeconomic
conditions; external costs of funds; and venture capital availability. The equilibrium
condition, MRR = MCC, provides the optimal level of firm R&D investment. According to
this framework, we might wonder what kind of effect a subsidy would have on the
equilibrium level of the R&D expenditure: additionality; crowding-out, etc.
The difficulties that private parties are confronted with in reaping the benefits from their
R&D investments and the intrinsic risks associated with innovations leave significant room
for government intervention. According to microeconomic theory, governments can stimulate
private R&D investment and spur economic development by reducing the marginal cost of
capital (MCC) and/or raising the marginal rate of return (MRR) on private R&D investment.
Government policies that directly target R&D include intellectual property rights, R&D tax
credits, direct funding to industries and government R&D labs, and investing in public
services (higher education in science and engineering disciplines, programs for technology
development and application, and so on).
8
The offer of R&D tax incentives offsets the inappropriability inherent in innovation by
reducing the cost of private R&D activities. The tax incentives have involved allowing R&D
expenditures to be expensed rather than capitalized, offering depreciation allowance and tax
credits for eligible R&D expenditures, and other tax benefits such as exemption of sales and
use taxes for R&D properties.
Direct subsidies (either R&D contracts or R&D grants) are another major way governments
intervene in private R&D activities. While tax incentives reduce the cost of private R&D,
direct public subsidies induce additional private R&D investment by raising the private MRR
on R&D investment. Direct subsidies also relieve the firms of some joint costs of research
and development activities. On the other hand, public R&D subsidies may simply substitute
for some of the investment that the performing firms otherwise would have prepared to
undertake. Moreover, public R&D subsidies may negatively affect private investment in
R&D by introducing the upward pressure on the prices of R&D inputs, such as wages of
scientists and engineers.
In the public finance literature, the quality of public services is generally regarded as an
important factor in the decisions of business location and/or expansion. Public services
provide direct benefits to businesses and help to reduce business cost. For R&D investment,
two types of services are important: higher education (which is a major source of R&D
human resources and knowledge spillovers to business R&D) and cooperative technology
programs (which assist technology development and application to benefit companies and
industries in the states).
In the past two decades, many governments in Europe have been very active in stimulating
R&D investment within their borders by offering various incentives and services to
industries. If properly designed and implemented, the additional private R&D spending
induced by the tax incentives can bring about some desirable economic benefits to the
county. These benefits may include more highly paid jobs, higher per capita income, and an
appropriate share of other benefits from the R&D conducted in their territory.
A number of studies have been done to evaluate the effectiveness of tax incentives in making
firms spend more on R&D. The usual evaluation consists in checking whether there is R&D
additionality, in the sense that private firms increase their R&D expenditures by more than it
costs the government to support the tax incentives program. If per dollar of government
support less than one dollar of additional private R&D gets spent by business, then public
support partially crowds out private funding for R&D. The evaluation of the so-called ‘‘bang
for the buck’’ is a rough cost–benefit analysis that generally does not take into account

9
factors like spillovers, indirect tax returns, administration costs and the opportunity cost of
spending taxable income on R&D support.
Different models may be used in analyzing a wide range of issues relevant to an evaluation of
tax incentives, but their highest relevance and most widespread use is in the analysis of input
additionality and result additionality. The discussion is concentrated around these issues.
Hall and van Reenen (2000) focus their discussion on estimating the input additionality
effect, through econometric estimation of demand equations for R&D.
There are basically two approaches (see Hall and van Reenen, 2000 for more details):
(1)R&D demand equation with shift parameter for existence of a tax credit scheme. The
first approach is used in a large number of studies. In this approach, the demand equation
includes a variable that indicates whether the firm had access to the tax incentive, in addition
to other variables that affect R&D investments:
( ) ititXitCitDR εγβα +++=&ln (1)
This equation expresses the logarithm of the R&D investments of firm i in year t as a
function of the presence of a tax incentive, Cit, that is equal to one if firm i had access to the
scheme in year t and zero otherwise, and other variables, which are contained in the vector
Xit. Such variables may be previous R&D investments, previous output and sales, expected
future output, cash flow, product prices, etc. Whether the firms have been granted R&D
subsidies through other channels will also be an important factor.
The β -parameter measures the expected growth of R&D investment following a firm getting
access to the scheme. The basic framework assumes that this effect is identical across firms.
This assumption is hardly innocuous, but it is not discussed by Hall and van Reenen (2000).
Such models should be estimated on microdata to utilize cross-section variation in access to
the scheme across firms. Using macrodata only, it is impossible to distinguish the effects of
the scheme from unobserved macroeconomic shocks.
(2) Demand equation with user cost of R&D. The second “demand equation” approach has
very much in common with the one described above. The major difference is that instead of
just including a variable indicating existence of or access to a tax incentive for R&D, one
calculates the so-called “user cost” of R&D investments, i.e. a variable that reflects the price
of R&D investments for the firm, on the margin, taking into account R&D tax incentives,

10
other tax rules, interest rates and depreciation. The introduction of, for example, a tax
deduction scheme for R&D will reduce the user cost of R&D.
For R&D tax incentives, the “user cost of R&D” model is employed in most of the empirical
studies at levels ranging from individual firms to the whole economy. In a recent review, Hall
and Van Reenen (2000) conclude that a dollar in tax credit for R&D stimulates a dollar of
additional private R&D investment. They argue that the estimation based on the “user cost of
R&D” model is preferable because it is grounded in economic theory, and the price response
of R&D investment can be estimated directly. However, some weaknesses still exist in the
model. One important methodological issue is the simultaneity between the R&D investment
level of a firm and the tax price it faces. Additionally, since the user cost of R&D is a
composite measure of depreciation allowance, tax credit, corporate income tax rate, and
personal income tax rate, the visibility of policy effects is low.
( ) ititXititDR εγβρα +++=&ln (2)
In which 𝜌𝑖𝑡 is a variable measuring the user cost of R&D (i.e. its marginal costs), and the
parameter β (expected negative) is the elasticity of R&D with respect to its price, measuring
by how much R&D will increase when its marginal costs decrease.
The key advantage of the user cost approach compared to the shift parameter approach is that
one may utilize variations in the generosity of the scheme across firms, and also changes over
time. Such variation may be very useful in identifying the effect of the scheme. In addition,
variations in other components of the user cost (tax rules, interest rates, depreciation rates)
may in theory help in identifying the effects of the fiscal measure. Within this framework,
one may calculate the price elasticity of R&D, that is, how large the percentage change of
R&D investments that follows from a one percentage change in the user cost.
The user cost is calculated by calculating what it costs for a profit- maximizing firm to invest
“an additional dollar” in R&D at time t, and then “sell” this project in the next period. The tax
system affects this cost in two respects. First, the return to the investment is taxed at a rate τi.
Second, the investment cost is reduced by the tax subsidy and the allowed tax depreciation.
4. Econometric analysis Our meta-regression analysis builds upon a new database containing information on a large
number of recent firm, country and state level studies on the effects of R&D tax credits. We

11
then investigate the factors that may explain differences in the estimated effects that are
reported in the literature. In addition to several other control factors, the key explanatory
variable that we focus on refers precisely to the specific characteristics. Our meta-regressions
investigate whether those studies have controlled for these specific characteristics.
A clearer understanding of the historical intent of R&D-related tax policies and of the
effectiveness of these policies appears to be necessary. Analysis of the effects of public
financing on private investment in R&D has been the objective of numerous applied studies
without it having been possible to arrive at a definite conclusion. After the creation of a data-
base including all relevant studies and their results and characteristics, a meta-analysis was
carried out to examine whether the characteristic of the applied studies influence the results
and explain the differences in the empirical literature on this subject.
This is an interesting pattern that calls for further research (i.e., constructed a model which
takes into account some of the most important characteristics that explain variation in the
estimated effects of R&D tax credits among different micro-econometric studies available in
the literature). If corroborated by future investigations, this finding would cast some
important doubts on the effectiveness of R&D tax incentives. This would in fact imply that
fiscal resources intended to stimulate R&D and economic competitiveness have a relatively
stronger effect on those specific characteristics that are characterized by low technological
opportunities, sluggish demand conditions and weak spillover effects to the rest of the
economy. If so, R&D tax incentives mechanisms should be redesigned in order to take into
account the specific conditions that shape innovation propensity and dynamics in different
industries of the economy, and in particular allocate a greater amount of fiscal incentives to
R&D to high-opportunity and technologically dynamic sectors.
The specific novelty of our survey paper and its intended contribution to the literature are
twofold. First, we carry out a meta-analysis is to create a database that includes the relevant
studies on the effectiveness of R&D tax credit policies and on the relation between public
funding of R&D and private R&D expenditure. In the end, more than 60 empirical studies
were used in our meta-analysis (see Table 6 in Appendix). As is usual, most of them present
more than one result (more than 700 estimation points in our econometric analysis, 341 for
additivity ratio and 284 for user cost). The adoption of the meta-regression database and
methodology opens up for future updates and extensions of this type of analysis of the effects
of R&D policy. Second, in explicitly investigating the role of the specific characteristics, we
create a bridge between the R&D policy literature, on the one hand, and the important strand
of research on firms’ industrial patterns of innovation, on the other.

12
To compare the results of the existing studies it is necessary to have a summary statistic of
the main variable which is the dependent variable in the meta-regression. The empirical
studies used in the meta-analysis sometimes estimate elasticity and other marginal effects.The
objective of a meta-analysis is to examine whether the characteristics of studies influence the
results. These characteristics are the independent variables (also frequently called moderator
variable) in the meta-regression. The variables are presented in the next section.
4.1 Data and indicators
Following the standard meta-regression analysis methodology (see e.g. Stanley, 2001), the
search process for relevant papers to include in the meta-analysis database included many
reviews. Only papers that presented an econometric analysis of the effects of R&D tax credits
on firm-level innovation and that provided enough information regarding the effect estimates
(their standard errors or t-statistics) were further considered. Our literature search focused
more carefully on those more old and recent micro-econometric studies produced from 1983
onwards. Earlier studies had been identified and surveyed in previous overview papers, which
made some of our data collection tasks easier (David et al., 2000; Hall and Van Reenen,
2000; Parsons and Phillips, 2007; Mohnen and Lokshin, 200; Hall et al., 2009; and Yang,
2011).
Typically, meta-analysis is a quantitative technique to summarize and evaluate the available
empirical parameters (estimates) on a particular issue. That is, meta-analysis establishes
guidelines to review, integrate, and synthesis studies examining similar research questions.
Then, it can detect whether consensus conclusions are emerging in the studies and whether
differences in the results across literatures. Therefore, the goal of meta-analysis is to detect
the existence of an association among the variable of interest, the estimation of magnitude
and the statistical significance of such association. By making the process of research explicit
and systematic, meta-analysis clearly compares the different studies in a systematic way.
Meta-analysis is more objective than the traditional literature review. Meta-analysis can
include non-sampling characteristics as a moderator variable in a meta-regression model.
Typically, each study on the effects of R&D fiscal incentives present estimation results for
several regressions. But, there is no clear benchmark or rule in the meta-regression literature
for deciding how many and which of these reported regressions should be included in a meta-
regression analysis dataset. Another problem is concerned with the conclusions by comparing
and aggregating studies which are using different measuring techniques, definitions of
13
variables, and subjects among the studies. The heterogeneity exists among studies because
results from poorly-designed studies are included with results from good studies.
In order to have as many observations as possible and thus increase the variability of our
sample, the selection criterion we used was somewhat broad. We included all different
regressions produced by the same micro-econometric study as different observations in our
dataset, as long as these regressions differed between them in some substantial way, e.g. in
terms of their subsample, time period, model specification, tax-credit measure or dependent
variable. This procedure is in line with other recent meta-analysis exercises in other fields of
economic research (e.g. Doucouliagos and Stanley 2009; Efendic et al. 2012).
4.2 Econometric methods The empirical studies estimate the equations (1) and (2) presented in section 2 of this study.
According to those empirical studies, the main coefficient of interest is an estimate of the
impact of tax credits R&D investment (β). Different researchers might present specific
estimates of the effect of tax credit on R&D expenditure with and without a particular control
variable.
Because the empirical studies mostly use different data sets, sample sizes and independent
variables, variances of these estimated coefficients may not be equal and meta-regression
errors are likely to be heteroscedastic. In order to compare with the research results from the
empirical literature, it is necessary to transform the summary statistics to a common and
comparable metric which is based on the concept of standardization (Lipsey and Wilson,
2001).
Glass (1976, 1977) introduced the concept of effect size to integrate the findings of an
experimental literature, so that effect size allows diverse studies to be compared directly.
In addition, Meta-analysis has been suggested by Stanley and Jarrell (1989) as a means of
summarising more accurately regression results across studies, such as those investigating the
relationship between R&D tax credit and R&D activity, and making generalisations from
available empirical evidence. Stanley and Jarrell (1989) pay attention to the reported t-
statistic, which provide the critical tests in the empirical studies.
Several variables have been applied in the literature to test the relation between tax credit and
R&D investment; our study follows Stanley and Jarrell (1989) using t-values to compare a
number of studies. In our work, the t-statistic which will be considered as the dependent
variable, had to be an estimate of the impact of some measures of tax credit. Most of the
studies in our data sets provided more than one set of results for the estimation of initial

14
regression. Following Stanley and Jarrell (1989), multiple estimates from the same study
were used as separate observations if they referred to different years. Estimates from
dissimilar models using data from the same year were also included as separate observations.
On the other hand, an alternative modelling approach is to include only one estimate from
each study and that is the best estimate by the authors. Nonetheless, the best estimate is not
obvious in some cases, while the variation in the results is a key focus of most papers. Our
study applies the first approach to aggregate different multiple estimates.
An advantage of the t-statistic is this standardized variable is a unitless measure, allowing
easy comparability across studies. It is why, in our work, we can ignore issues regarding the
measurement scales of the R&D investment and tax credit variables. For this reason, we will
include in our models a range of measures of public policies (tax credits, etc.) and measures
of R&D investment. Our paper will try to explain differences in the size of the estimated tax
credit effects in the literature. Indeed, most econometric studies focus greater attention on
significance than size because t-statistics are function of size. In our case, observation is the
sample size for each study estimate; see the variable of number of observations in our data
sets, which gives sample size for each study.
To explain variation in the empirical results in the literature, we quantify the impact of data
and specification differences on the reported effect of tax credit on R&D activities. Our
dependent variable, which is the parameter of interest, contains a vector of estimates of the
effect being measured (the effect of tax credit on R&D investment). The t-statistics
(dependent variable in this study) are explained by the many economic variables (dummy or
continuous) and the usual error term. These moderator variables will be discussed below.
4.2.1 Publication selection bias “The simplest and most commonly used method to detect publication selection is an informal
examination of a funnel plot” (Sutton et al., 2000, pp.1574). A funnel graph of our dataset is
a scatter diagram of estimated effect (user-cost elasticity and additionality ratio in our case).
The expected shape is an inverted funnel (this means an absence of publication selection).
Graphs are very often vulnerable to subjective interpretation and it is better to model
publication selection which involves a meta-regression analysis between user-cost elasticity
and its standard error (see Ashenfelter et al., 1999; Card et al., 1995; Görg and Strobl, 2001;
Mookerjee, 1991):

15
𝑎𝑠𝑖 = 𝛽1 + 𝛽0𝑆𝑒𝑠𝑖 + 𝜀𝑠𝑖 (3)
where s=1,...n (n studies), i=1,...,k (k regression estimates), 𝑎𝑠𝑖 is the user-cost elasticity or
the additivity elasticity for study s and regression estimate i, 𝑆𝑒𝑠𝑖 is its standard error and 𝜀𝑠𝑖
is the error term. Equation (3) is the explicit representation of meta-regression analysis model
for publication selection. In the absence of publication selection, observed effects should vary
randomly around the true value, β1, independently of standard error. When all studies are
selected for statistical significance, publication selection bias will be proportional to the
standard error 𝑆𝑒𝑠𝑖.
Studies using larger samples can be expected to report smaller publication bias. In most
econometric models, 𝜀𝑠𝑖 is considerate to be heteroscedastic and to avoid it the classical
practice is to weight equation (1) by 𝑆𝑒𝑠𝑖. Dividing equation (3) by this term gives:
𝑎𝑠𝑖𝑆𝑒𝑠𝑖
= 𝛽1𝑆𝑒𝑠𝑖
𝛽1 + 𝛽0 + 𝜀𝑠𝑖𝑆𝑒𝑠𝑖
(4)
𝑎𝑠𝑖𝑆𝑒𝑠𝑖
is the t-value (t of Student) for the estimated user-cost elasticity.
𝑡𝑠𝑖 = 𝛽1𝑆𝑒𝑠𝑖
𝛽1 + 𝛽0 + 𝜀𝑠𝑖𝑆𝑒𝑠𝑖
(5)
Equation (3) is the Weight Least Squares (WLS) of equation (1). Egger et al. (1997) point out
that the t-test of the intercept in equation (3) is a test for publication bias, which indicates
whether some omitted variables in equation (3) (characteristics of the studies...etc.) may lead
to systemic selection effect and hence a bias in the estimated effect. Stanley (2008), argues
that the meta-regression model can be used to test not only for publication selection, but also
for the true empirical effect after having controlled for publication bias. The first test is
referred to the funnel asymmetry test (FAT) and the latter as the precise-effect test (PET).
FAT tests the hypothesis:
�
𝐻0 : 𝛽0 = 0 ≪=≫ implies lack of publication selectionAgain
𝐻1 : 𝛽0 ≠ 0 ≪=≫ implies either upward (positive sign) or downward publication (negative sign)
PET tests the hypothesis:
16
⎩⎪⎨
⎪⎧𝐻1 : 𝛽1 = 0 ≪=≫ implies no authentic empirical effect, this means also
no true effect corrected for any publication bias𝐴𝑔𝑎𝑖𝑛
𝐻1 : 𝛽1 ≠ 0 ≪=≫ implies the existence of authentic empirical effect and could be interpreted as the true effect corrected for any publication bias
4.2.2 Meta-regression analysis
In our study, in addition to these two tests, we will investigate the effectiveness of R&D tax
credits policies reported in the literature. We therefore extend the basic model in equation (5)
to include a set of additional explanatory variables (Xs,i). In the econometric specification,
those explanatory variables correspond to individual study characteristics that may have a
substantial impact on the results of studies examining the relationship between tax credits and
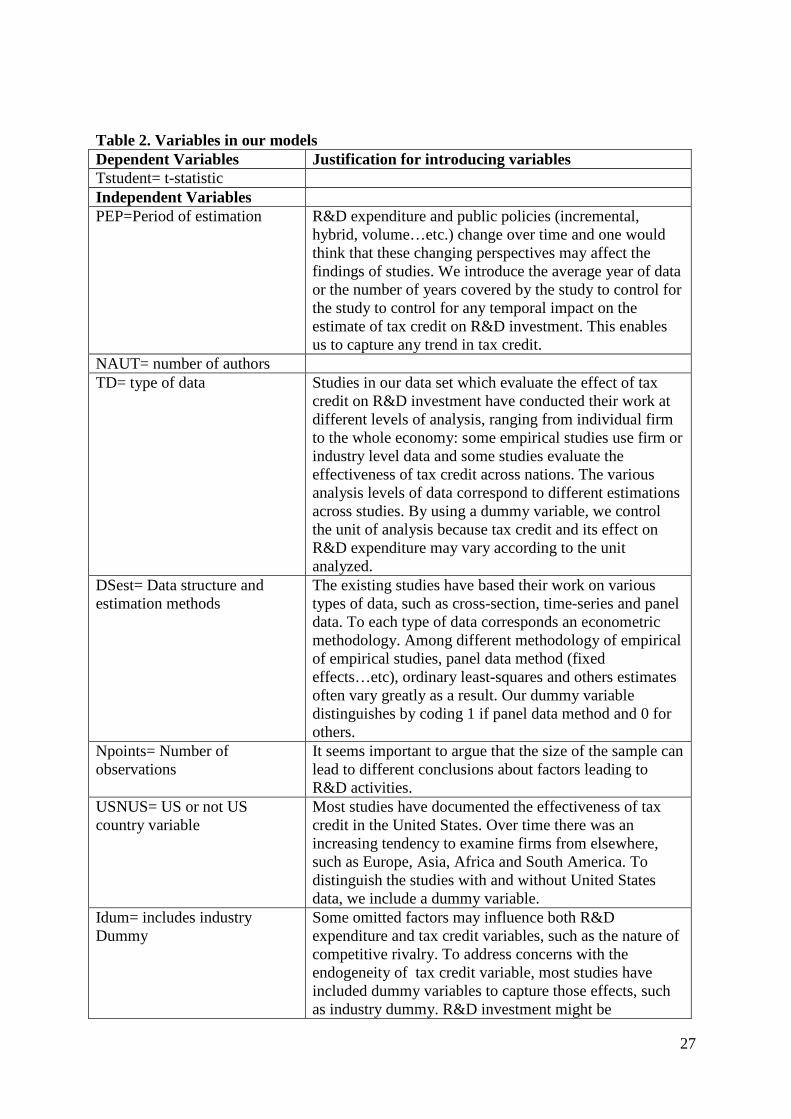
R&D activities. Table 2 outlines a list of moderator variables. Those moderator variables can
be continuous or binary variables. The binary variables used in this study reflect the presence
or absence of variables and generally take the form of dummy variables.
𝑡𝑠,𝑖 = � 𝛽1𝑆𝑒𝑠,𝑖
� + 𝛽0 + ∑ 𝛼𝑗𝑘𝑗=1 � 1
𝑆𝑒𝑠,𝑖� 𝑋𝑗,𝑠,𝑖 + 𝛾𝑠,𝑖 �
1𝑆𝑒𝑠,𝑖
� (6) 𝑡𝑠,𝑖 is the effect of tax credit on R&D investment.
Insert Table 2 By using Equation (6), we will test the following two hypotheses: Hypothesis 1: Tax credit reduces the cost of R&D activity
Hypothesis 2: Tax credit induces higher levels of R&D activity
A comparison of empirical studies is difficult due to the heterogeneity of empirical models
used. In our case, we split our data set in two due to the existence of two approaches in the
evaluation of tax incentives (see section 3 of this study). The sample across different
literature suggests a number of explanatory variables, so we outline a list of moderator
variables (see Table 2). We introduce four type of moderator variables:

17
- variables which represent the R&D investment measure: R&D expenditures by the
private enterprises, Direct Gov support on RD, High Edu, Funds from abroad foreign
enterprises;
- variables which represent R&D tax incentives: tax credit, labour tax, corporate tax,
machinery tax, building tax;
- variables which represent data characteristics and methodology;
- variables which represent the various explanatory variables reported in the original
studies.
5. Results and discussion
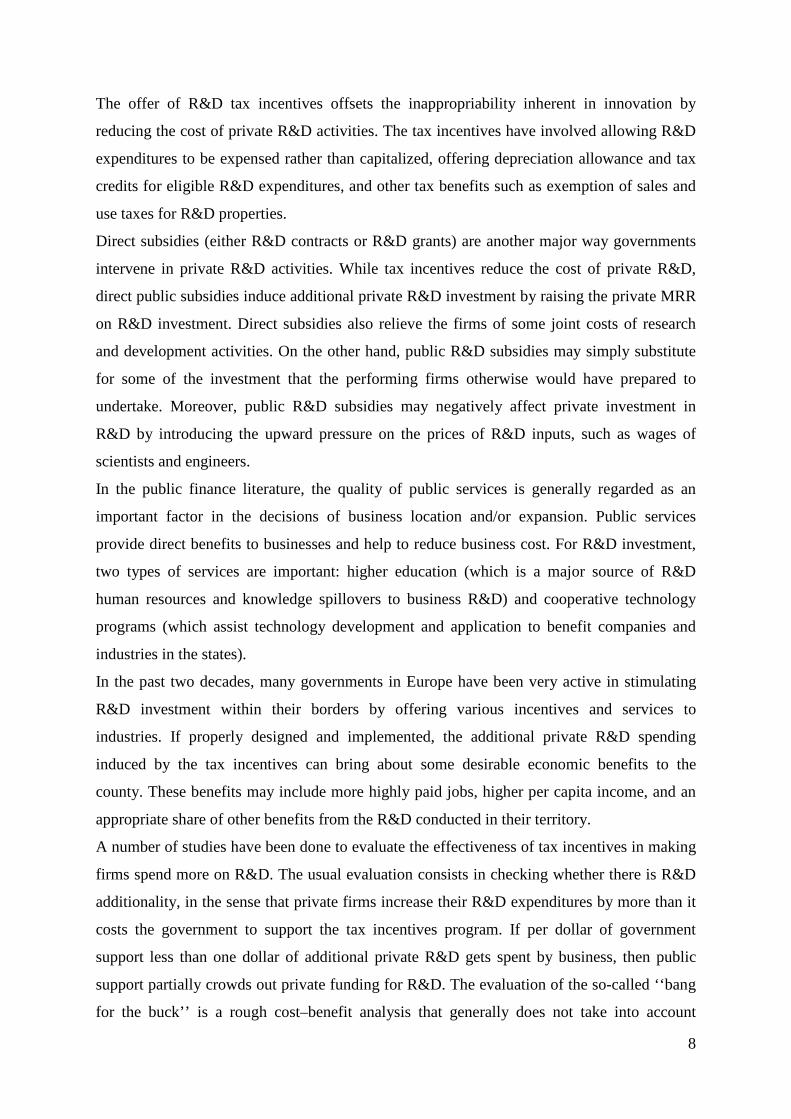
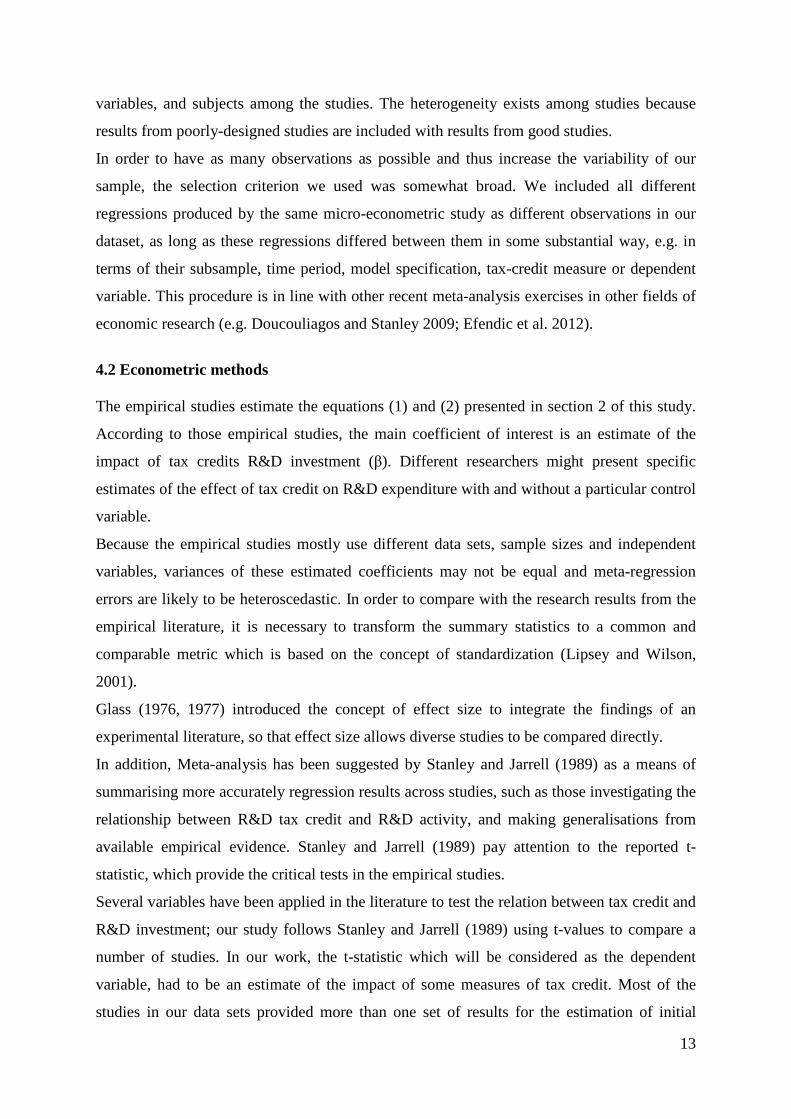
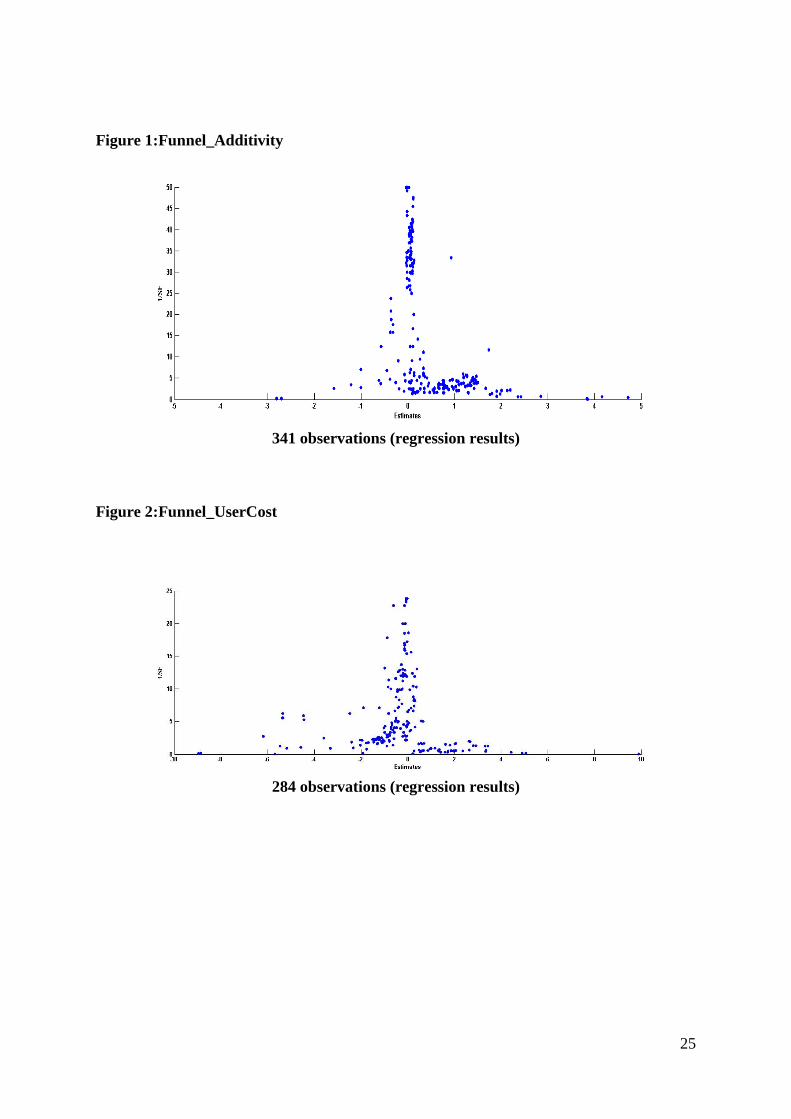
a. Funnel
Figure 1 and 2 plots the estimated user-cost elasticity and estimated additionality ratio with
their inverse of standard error (weight). These graphs are referred to as funnel graphs because
in the absence of publication selection it should look like an inverted funnel (Sutton, 2000).
The symmetric shape is a necessary condition to exclude publication bias. These two figures
have a funnel form and seem symmetric. We know that the visual interpretation of the funnel
graph may be ambiguous, for this reason the FAT is generally associated with the Meta-
regression analysis of equation (3).
Table 3 displays results of equation 1. This equation is a specification which only includes
the constant 𝛽0 (the publication bias effect) and 1𝑆𝑒
(measure of the true empirical effect of
R&D tax incentives).
Insert Figures 1 and 2
Insert Table 3
b. Meta-analysis
Many specifications designed to inform what study attributes affect the significance, the sign,
and the magnitude of the estimated R&D tax credit effects are estimated. The R&D tax credit
effects variable (represented by t-statistics) is then regressed on several study characteristics
that are presumed to influence the study outcome.

18
Table 4 and 5 present the results of meta-regression analysis. It reports the results of the
estimation of equation 3 and equation 4, referring to the empirical approach in which the
dependent variable used in previous studies is additionality ratio (Eq. 1) and referring to the
second model specification that is typically adopted in the literature, which has as dependent
variable the user-cost elasticity (Eq. 2).
Insert Tables 4 and 5
c. Commemts
In Table 3, the estimated parameter for the constant is significant for both specification
(User-cost or Additionality), providing evidence of publication (selection) bias effect. The
parameter is positive in the case of Additionality specification and negative in the User-cost
specification, indicating that previous studies overestimated the effect of R&D tax credits on
firm’s innovation activities (in additionality) and they failed to control for a set of factors that
may affect this relationship (in User-cost). In addition to the publication bias, note that the
estimated coefficient on the inverse of the standard error is negative and is not significant in
both specifications. This implies no authentic empirical effect (measured by the coefficient of
the inverse of the standard error), this means also no true effect corrected for any publication
bias. The slope of PET in these specifications serves as a test for empirical effect corrected of
publication bias. Our estimations of equation (6) will try to correct this publication bias. The
PET does not find a significant evidence of positive of R&D tax credit effects for both
sample of our analysis.
It is reasonable to expect that if tax credit is significant across studies, estimation of equation
(6) will generate a positive and statistically significant coefficient for the main variable R&D
tax credit (Tax in Table 4). In different models (Table 4), results show that R&D tax credit is
strongly significant in the studies taken cumulatively. A number of them have been done to
evaluate the effectiveness of tax incentives in making firms spend more on R&D. The usual
evaluation consists in checking whether there is R&D additionality, in the sense that private
firms increase their R&D expenditures by more than it costs the government to support the
tax incentives program. The evaluation of the so-called ‘‘bang for the buck’’ is a rough cost–
benefit analysis that generally does not take into account factors like spillovers, indirect tax
returns, administration costs and the opportunity cost of spending taxable income on R&D
support.

19
Different models may be used in analyzing a wide range of issues relevant to an evaluation of
tax incentives, but their highest relevance and most widespread use is in the analysis of input
additionality and result additionality. The discussion is concentrated around the input
additionality effect, through econometric estimation of demand equations for R&D.
The second “demand equation” approach has very much in common with the one described
above. The major difference is that instead of just including a variable indicating existence of
or access to a tax incentive for R&D, one calculates the so-called “user cost” of R&D
investments, i.e. a variable that reflects the price of R&D investments for the firm, on the
margin, taking into account R&D tax incentives, other tax rules, interest rates and
depreciation. The introduction of say a tax deduction scheme for R&D will reduce the user
cost of R&D.
For R&D tax incentives, the “user cost of R&D” model is employed in most of the empirical
studies at levels ranging from individual firms to the whole economy. Since the economic
theory indicates that user cost of capital is a contributor to R&D investment, the exclusion of
variables which are related to the user cost in a study may affect the estimated tax credit
effects leading to a mis-specified model. This is why we have include an indicator of size,
human capital, subsidy, etc. All our models (in Tables 4 and 5) present sensitivity results at
three levels of significance (1%, 5% and 10%) for the estimated tax credit effects.
The intercept in most of our models (example model 1 and model 6) is significant in both
specifications, implying that there is a statistically significant relationship between tax credit
and R&D activity.
Some data characteristics do affect positively the empirical analysis of the influence of tax
credit on R&D activities, such as number of observations, the number of years covered by the
study, and industry, firm, state or country level data. In contrast, a negative coefficient
implies that number observations and average years tends to provide a non-significant
relationship between tax credit and R&D. The variable of the number of years covered is
significantly positive in all our models, implying that early studies seem to give higher
support to the relationship between tax credit and R&D. For instance, the variable of time
dummy is significantly negative in some our models. This indicates that the inclusion of this
variable weaken the relationship between tax credit and R&D. In addition, the number of
observations is significantly positive in models 6 and 9, that is, larger number of observations
increase the probability of positive effect of tax credit on R&D activities.

20
Results indicate the inclusion of high-technology industry (variable HTD) as a variable
matter. Controlling for high-technology industry through a dummy variable contributes
Controlling for high-technology industry through a dummy variable contributes to an
important increase in the effect of R&D tax credit on R&D activities. This results suggests
that there is a positive program effect on R&D spending for the high-technology industry in
the different studies. In sum R&D tax credit ha have positive effects on growth of R&D
spending for all industry and the high-technology industry. This tell us that the R&D tax
credit ha have the effect of increasing RR&D spending not only for the high- technology
industry not only for the high- technology industry but also for the industry. This evidence
supports the appropriateness of this public policy on the grounds that the primary purpose of
this credit law has been fulfilled.
On the other hand, our results show that our expectation is not totally realized because in
most models the tax credit is not strongly significant. Among the variable capturing data
characteristic (variable TD), the coefficient of the observation (variables NB and PEP), the
country of data (Variable USNOUS), and the panel data (variable Desta) are also significant.
From the results, Private R&D expenditures, Government expenditure in high education, do
not significantly affect the tax credit significance (coefficients positive and no significant
except in model 10 Table 5). At all observation levels, Knowledge stocks (Variable HE)
reveal positive effect but this is not strongly supported (only model 10 shows highly positive
result).
The relationship between public funding and private funding is unclear from insignificant
estimates in all our models.
Conclusion
This study presents a quantitative review of the empirical literature on the R&D investment
from R&D tax credit policy. This study applies meta-regression analysis a sample of 625 t-
statistics (341 t-statistics for additivity ratio model and 284 t-statistics for the user cost
model) assembled for more than 60 studies to investigate the overall impact of tax credit on
firms’ R&D investment. The research has painted a broad picture of the sorts of applications,
methods, and findings, in the published literature. Our results show tax credit, other tax
policy, estimation methods, sectorial dummy and level of analysis increased the estimated
effect of tax credit on R&D expenditure. Lagged R&D, the inclusion of time, industry
21
dummy, level of education and corporate tax rate do not appear to impact the estimated effect
of R&D spending.
References Aerts K. and T. Schmidt (2008), Two for the price of one? Additionality effects of R&D
subsidies: A comparison between Flanders and Germany, Research Policy 37, 806-822. Aghion, P., and P. Howitt (2005), Growth with quality-improving innovations: An integrated
framework, in: Handbook of Economic Growth, P. Aghion and S. Durlauf (eds.), (Elsevier, 2005) Vol. 1A, 67-110.
Aghion, P., et al. (1997). "Competition and growth with step-by-step innovation: an example." European Economic Review, Papers and Proceedings: 771-782.
Aghion, P., et al. (2005). "Competition and innovation: an inverted U relationship." Quarterly Journal of Economics 120(2): 701-728. Almus, M. and D. Czarnitzki (2003), The effects of public R&D subsidies on firms'
innovation activities: the case of Eastern Germany, Journal of Business and Economic Statistics 21(2), 226-236.
Arrow, K.J. (1962), Economic welfare and the allocation of resources for invention, in R.R. Nelson (ed.), The rate and direction of inventive activity: economic and social factors, Princeton, N.J.: Princeton University Press, 609-625.
Aschhoff, B. (2010), Who Gets the Money? The Dynamics of R&D Project Subsidies in Germany, Jahrbücher für Nationalökonomie und Statistik 230(5), 522-546.
Ashenfelter, O., Harmon, C. and Oosterbeek, H. (1999). “A review of estimates of schooling/earnings relationship, with test for publication bias,” Labour Economics, 6:453-70.
Baghana, R. and P. Mohnen (2009). "Effectiveness of R&D tax incentives in small and large enterprises in Quèbec," Small Business Economics 33: 91-107.
Berger, P. G. (1993). "Explicit and Implicit Tax Effects of the R&D Tax Credit," Journal of Accounting Research 31(2): 131-171.
Bérubé, Charles and Pierre Mohnen (2009): Are firms that receive R&D subsidies more innovative? Canadian Journal of Economics, Vol. 42, Issue 1, pp. 206-225.
Billings, B. A. and Y. Fried (1999). "The effects of taxes and organizational variables on research and development intensity." R&D Management 29(3): 289-301.
Billings, B. A., et al. (2001). "The role of taxes in corporate research and development spending." R&D Management 31(4): 465-477.
Bloom, N., Griffith, R., Van Reenen, J. (2002). Do R&D tax credits work? Evidence from a panel of countries 1979-1997, Journal of Public Economics 85 (1), 1-31.
Busom, I. (2000), An empirical evaluation of the effects of R&D subsidies, Economics of Innovation and New Technology 9(2), 111-148.
Card, D. and Krueger, A. B. (1995). “Time-series minimum-wage studies: a meta-analysis”. American Economic Review, 85: 234-43.
Cerulli, G. (2010), Modelling and measuring the effect of public subsidies on business R&D: a critical review of the economic literature, Economic Record 86, 421-449.
Cerulli G. and Potì B. (2008), Evaluating the Effect of Public Subsidies on Firm R&D Activity: An Application to Italy Using the Community Innovation Survey, Ceris-CNR Working Paper, No 09/08.
Cerulli G. and Potì B. (2010), The differential impact of privately and publicly funded R&D on R&D investment and innovation: the Italian case, Working Papers 10, Doctoral School of Economics, Sapienza University of Rome.

22
Cincera, M., D. Czarnitzki, and S. Thorwarth (2009), Efficiency of public spending in support of R&D activities, European Economy. Economic Papers 376, Brussels.
Clausen, T.H. (2007), Do subsidies have positive impacts on R&D and innovation activities at the firm level? Working Paper 2007/0615, Centre for Technology, Innovation and Culture, University of Oslo, Oslo.
Criscuolo,C., D. Czarnitzki, C. Hambro and J. Warda (2009), “Design and Evaluation of Tax Incentives for Business Research and Development: Good Practice and Future Development”, final report submitted by the Expert Group on Impacts of R&D Tax Incentives to the European Commission, Directorate General
Czarnitzki, D. (2005), Extent and Evolution of the Productivity Deficiency in Eastern Germany, Journal of Productivity Analysis 24(2), 209-229.
Czarnitzki, D. and A. Fier (2002), Do innovation subsidies crowd out private investment? Evidence from the German Service Sector, Applied Economics Quarterly (Konjunkturpolitik) 48(1), 1-25.
Czarnitzki, D., B. Ebersberger and A. Fier (2007), The Relationship between R&D Collaboration, Subsidies and R&D Performance: Empirical Evidence from Finland and Germany, Journal of Applied Econometrics 22(7), 1347-1366.
Czarnitzki, D. and G. Licht (2006), Additionality of Public R&D Grants in a Transition Economy: The Case of Eastern Germany, Economics of Transition 14(1), 101–131.
David, P.A., B.H. Hall and A.A. Toole (2000), Is public R&D a complement or substitute for private R&D? A review of the econometric evidence, Research Policy 29(4-5), 497-529.
Duguet E. (2004), Are R&D subsidies a substitute or a complement to privately funded R&D? Evidence from France using propensity score methods for non-experimental data, Revue d’Economie Politique 114(2), 263-292.
Duguet, E. (2007), 'L'effet du crédit d'impôt recherche sur le financement privé de la recherche: une évaluation économétrique', Working paper, Université d'Evry.
Falk, Martin (2006): What drives business Research and Development (R&D) intensity across Organisation for Economic Co-operation and Development (OECD) countries?, Applied Economics, Vol. 38, Issue 5, pp. 533-547.
Garcia, A. and P. Mohnen (2010), Impact of government support on R&D and innovation, UNU_MERIT working paper, Maastricht.
Glass, G. (1976), Primary, secondary, and meta-analysis of research. Educational Researcher, 5(10), 3-8.
Glass, G. (1977), Integrating findings: the meta-Analysis of research. Review of Research in Education, 5, 351-379.
Gerfin M. and M. Lechner (2001), A Microeconometric Evaluation of Active Labour Market Policy in Switzerland, The Economic Journal 112, 845 -893.
González, X., Jaumandreu, J. and Pazó, C. (2005), Barriers to innovation and subsidy effectiveness, RAND Journal of Economics 36(4), 930-949.
González, X., and C. Pazó (2008), Do public subsidies stimulate private R&D spending? Research Policy 37(3), 371-389.
Görg, H. and Strobl, E. (2001). “Multinational companies and productivity spillovers: a meta-analysis”. Economic Journal, 111: F723-40.
Görg, H. and E. Strobl (2007), The effect of R&D subsidies on private R&D, Economica 74(294), 215-234.
Hall B.H., van Reenen J., 2000, How effective are fiscal incentives for R&D? A review of the evidence, Research Policy, 29, n. 4-5, 449-469.
Hall, Brownyn H., et al. (2009). “Measuring the returns to R&D.” NBER Working Paper Series 15622

23
Hægeland, T. and J. Møen (2007). "Input additionality in the Norwegian R&D tax credit scheme." Statistics Norway Reports.
Harris, R., et al. (2009). "Is a higher rate of R&D tax credit a panacea for low levels of R&D in disadvantaged regions?" Research Policy 38: 192-205.
Hines, J. R. (1991). "On the sensitivity of R&D to delicate tax changes: The behaviour of U.S. multinationals in the 1980s." NBER Working Paper Series 3930.
Ho, Y. (2006). Evaluating the effectiveness of state R&D tax credits. Graduate School of Public and International Affairs, University of Pittsburgh.
Huang, C.-H. (2009). Three Essays on the Innovation Behaviour of Taiwan`s Manufacturing Firms. Graduate Institute of Industrial Economics, Taiwan, National Central University.
Hussinger, K. (2008), R&D and Subsidies at the Firm Level: An Application of Parametric and Semi-Parametric Two-Step Selection Models, Journal of Applied Econometrics 23, 729-747.
Imbens, G.W. and J.M. Wooldridge (2009), Recent Developments in the Econometrics of Program Evaluation, Journal of Economic Literature 47, 5-86.
Kasahara, H., et al. (2012). "Does R&D Tax Credit Affect R&D Expenditure? The Japanese Tax Credit Reform in 2003." Journal of Economic Literature.
Klassen, K. J., et al. (2004). "A Cross-national Comparison of R&D Expenditure Decisions: Tax Incentives and Financial Constraints." Contemporary Accounting Research 21(3): 639-680.
Klette, T.J., Møen, J. and Z. Griliches (2000), Do Subsidies to Commercial R&D Reduce Market Failures? Microeconometric Evaluation Studies, Research Policy 29(4-5), 471-495.
Koga, T. (2003). "Firm size and R&D tax incentives." Technovation 23: 643-648. Lach, S. (2002), Do R&D subsidies stimulate or displace private R&D? Evidence from Israel,
Journal of Industrial Economics 50(4), 369-390 Lee, C.-Y. (2011). "The differential effects of public R&D support on firm R&D: Theory and
evidence from multi-country data." Technovation 31(256-269). Lichtenberg, F. R. (1984), The Relationship Between Federal Contract R&D and Company
R&D. "The American Economic Review, Vol. 74, pp. 73 - 78. Link, A.N. (1982), An analysis of the composition of R&D spending, Southern Economic
Journal 49(2), 342-349. Lipsey, M. W., and Wilson, D. B. (2001), Practical Meta-Analysis: SAGE. Lokshin, B. and P. Mohnen (2007). "Measuring the Effectiveness of R&D tax credits in the
Netherlands." UNU-MERIT Working Paper Series 025. Lokshin, B. and P. Mohnen (2012). "How effective are level-based R&D tax credits?
Evidence from the Netherlands." Applied Economics 44(12): 1527-1538. Lundvall, B. Å. and S. Borràs (2005). Science, technology and innovation policies. The
Oxford Mercer-Blackman, V. (2008). "The Impact of Research and Development Tax Incentives on
Colombia`s Manufacturing Sector: What Difference Do They Make?" IMF Working Paper 178.
Mohnen, P. and Lokshin, B. (2009). “What Does it Take for an R&D Tax Incentive Policy to be Effective?” CIRANO Scientific Series 2009s-11
Mookerjee, R. (1991), “A meta-analysis of the export growth hypothesis”. Economics letters, 91: 395-401.
Mulkay, B. and J. Mairesse (2003). "The Effect of the R&D Tax Credit in France." LEREPS and UNU-MERIT, Preliminary Draft.
Mulkay, B. and J. Mairesse (2008). "Financing R&D Through Tax Credit in France." LEREPS and UNU-MERIT Preliminary Draft.

24
Nicoletti, G. and S. Scarpetta (2004). "Regulation, Productivity and Growth: OECD Evidence." Economic Policy 18: 9-72.
OECD (2010). R&D tax incentives: rationale, design, evaluation. Paff, L. A. (2004). "Does the alternate incremental credit affect firm R&D?" Technovation
24: 41-52. Paff, L. A. (2005). "State-Level R&D Tax Credits: A Firm-Level Analysis." Topics in
Economic Analysis & Policy 5(1). Parisi, M. L. and A. Sembenelli (2003). "Is Private R&D Spending Sensitive to Its Price?
Empirical Evidence on Panel Data for Italy." Empirica 30: 357-377. Parsons, M. and Phillips, N. (2007), “An Evaluation of the Federal Tax Credit for Scientific
Research and Experimental Development.” Department of Finance Working Paper 2007-08
Pavitt, K. (1984). "Sectoral patterns of technical change: towards a taxonomy and a theory."Research Policy 13: 343-373.
Poot, T., et al. (2003). "Evaluation of a major Dutch Tax Credit Scheme (WBSO) aimed at promoting R&D." Working Paper.
Sutton, A. J., Duval, S. J., Tweedie, R. L., Abrams, K. R. And Jones, D. R. (2000). “Empirical assessment of effect of publication bias on meta-analyses”. British Medical Journal, 320: 1574-77.
Suetens, S. (2002), R&D subsidies and production effect s of R&D personnel: evidence from the Flemish region, CESIT Discussion Paper 2002/03, Antwerp.
Toivanen, O. and P. Niininen (2000), Investment, R&D, subsidies, and credit constraints, Helsinki School of Economics Working Paper 244, Helsinki.
Van Pottelsberghe, B., S. Nysten and E. Megally (2003), Evaluation of current fiscal incentives for business R&D in Belgium, Solvay Business School and Service Public Federal de Programmation Politique Scientifique , Brussels.
Wallsten S.J. (2000), The effects of government-industry R&D programs on private R&D: the case Small Business Innovation Research Program, RAND Journal of Economics 31(1), 82-100.
Wolff G.B. and V. Reinthaler (2008), The effectiveness of subsidies revisited: Accounting for wage and employment effects in business R&D, Research Policy 37, 1403–1412.
25
Figure 1:Funnel_Additivity
341 observations (regression results)
Figure 2:Funnel_UserCost
284 observations (regression results)

26
Table 1. R&D Tax Incentives Schemes in Selected Developed and Emerging Countries, 2013 R&D Tax incentive scheme Countries Incremental R&D tax credits United States, Ireland, Taiwan Hybrid system of volume and an incremental credit
Japan, Korea, Portugal, Spain
Volume-based R&D tax credit Australia, Canada, France, Norway, Brazil, China, India
R&D tax allowance Denmark, Czech Republic, Austria, Hungary, United Kingdom
Payroll withholding tax credit for R&D wage Belgium, Hungary, Netherland, Spain More generous R&D tax incentives for SME’s
Canada, Australia, Japan, united Kingdom, Hungary, Korea, Norway
Targeting Countries Special for energy United States Special for collaboration Italy, Hungary, Japan, Norway Special for new claimants France Special for young firms and star-ups France, Netherland, Korea Ceilings on amounts that can be claimed Italy, Japan, united states, Austria,
Netherland Income based R&D tax incentives Belgium, Netherland, Spain No R&D tax incentives Estonia, Finland, Germany, Luxembourg,
Mexico, New Zealand, Sweden, Switzerland
27
Table 2. Variables in our models Dependent Variables Justification for introducing variables Tstudent= t-statistic Independent Variables PEP=Period of estimation R&D expenditure and public policies (incremental,
hybrid, volume…etc.) change over time and one would think that these changing perspectives may affect the findings of studies. We introduce the average year of data or the number of years covered by the study to control for the study to control for any temporal impact on the estimate of tax credit on R&D investment. This enables us to capture any trend in tax credit.
NAUT= number of authors TD= type of data Studies in our data set which evaluate the effect of tax
credit on R&D investment have conducted their work at different levels of analysis, ranging from individual firm to the whole economy: some empirical studies use firm or industry level data and some studies evaluate the effectiveness of tax credit across nations. The various analysis levels of data correspond to different estimations across studies. By using a dummy variable, we control the unit of analysis because tax credit and its effect on R&D expenditure may vary according to the unit analyzed.
DSest= Data structure and estimation methods
The existing studies have based their work on various types of data, such as cross-section, time-series and panel data. To each type of data corresponds an econometric methodology. Among different methodology of empirical of empirical studies, panel data method (fixed effects…etc), ordinary least-squares and others estimates often vary greatly as a result. Our dummy variable distinguishes by coding 1 if panel data method and 0 for others.
Npoints= Number of observations
It seems important to argue that the size of the sample can lead to different conclusions about factors leading to R&D activities.
USNUS= US or not US country variable
Most studies have documented the effectiveness of tax credit in the United States. Over time there was an increasing tendency to examine firms from elsewhere, such as Europe, Asia, Africa and South America. To distinguish the studies with and without United States data, we include a dummy variable.
Idum= includes industry Dummy
Some omitted factors may influence both R&D expenditure and tax credit variables, such as the nature of competitive rivalry. To address concerns with the endogeneity of tax credit variable, most studies have included dummy variables to capture those effects, such as industry dummy. R&D investment might be

28
determined by a variety of firm or industry specific characteristic in the policy-making processes, such as the supply of researchers, the degree of concentration, technology opportunities, industrial pressure…etc. We try to capture these characteristics by this dummy variable.
TDY: includes time dummy Some studies include time variables to represent the effect of omitted variables and control the effect that is common across time. Since various common shocks, like business cycle or technology shocks, would affect the ability of firms to perform R&D, time dummy variable is included in the model to get rid of annual macroeconomic shocks. Time dummy capture the changes in public policy, technological progress or other time-specific effects which authors were not able to incorporate into the measure of tax credit.
BERD: Business enterprises expenditure in R&D
R&D personnel in the total workforce is one of the major determinants in R&D intensity. Scientists undertake R&D research and also expand absorptive capacity. This variable measures the R&D activity of the firm.
GDERD: Gross Domestic exp on RD total
The theory of industrial cluster argues that R&D investment depends on interactions between input supply and local demand conditions and the competition of industries, but those factors are complicated and immeasurable. To account for these omitted factors, the gross domestic expenses is included in the model to interpret fluctuations in economic health over the sample period. Its growth may be relevant to determine the market size for future inventions, which in turn is decisive to forecast the profitability of R&D project.
HE: High Edu expenditure by gov.
One of the key elements in the production of ideas is human capital which is dedicated to the production of R&D activity. The higher education influences the size of R&D employment and event stimulates R&D activity. The development of human capital generates a highly educated labour and increase the productivity of labour over time, so the efficient labour approaches the success in the innovation-based growth model. As a result, human capital consists of skills and knowledge which workers acquire through education and training.
GS: Direct Gov. support on R&D
Direct subsidies that are accompanied a government’s project are distributed through grants to firms for specific projects or research areas. Such funding could be concentrated in areas where there is a large gap between the social and the private rate of return. The R&D subsidy lowers the private cost of the project, so the subsidy may turn an unprofitable project into a profitable one by the firm. R&D subsidy can also reduce the fixed costs of research facilities and it can motivate the profitability of undertaking R&D activity. Hence, the R&D subsidy can stimulate current and future private R&D expenditures.

29
Compared with fiscal incentives for R&D activities, subsidies are likely to be captured by firms with low income taxes, so subsidies should not influence the tax coefficient.
Taux= rate of tax credit; CT =Corporate income tax rate; LT = Tax price of Labour related to R&D; MET = Tax price of machinery and equipment used for the purposes of R&D; BST= Tax price buildings and structures used for the purposes of R&D; FT= Tax price for RD expenditure that applicable to cross border RD
Our focus now shifts to different types of fiscal incentives. Fiscal incentives for R&D can take various forms (see Table 1). There are many reasons for the government to use these policy instruments: changes in tax structure often affect agents’ behavior. For example an increase in corporate tax rates distort the relative value of resources and lower the net rate of return to private R&D investment. Then, R&D activity of resources and lower the net rate of return to private R&D investment. Then, R&D activities are less attractive and the rate of growth declines. Therefore, taxes on investment and income have a detrimental impact on investment activities and economic growth in an economy. On the other hand, R&D tax credit can support firms to increase financial resources which are committed to technological innovation. That is tax credit are deducted from the corporate income tax, so an increase in R&D tax credit lowers the user cost of capital and R&D investment becomes more competitive. Then, tax credit will stimulate further research on R&D and contribute to economic growth and social welfare.
RDR: RDt-1 (inclusion of lagged R&D)
To control for the prior year’s R&D expenditure, most empirical studies introduce lagged R&D expenditures to distinguish short-run and long-run effects. The prior year’s R&D spending for each firm acts as an important determinant in conducting the new investment. And the positive coefficient on the lagged R&D stock variables indicates that firms performing R&D continue to do so.
HTECH: dummy: 1 if high-tech subsamples firms, 0 otherwise
SME: variable (dummy for SMEs subsamples)
INVERSE = Inverse of the standard error (SE) of the effect estimated
MANUF: dummy: 1 if manufacturing subsamples, 0 otherwise
FET: Funds from abroad foreign enterprises
NB : Some variables come from Russell Thomson who has given us his dataset constructed by him.

30
Table 3. Regression results of equation (3) for both cases (Additionality ratio and user-cost elasticity). Dependent Independents
t-statistic of the estimated User-cost elasticity
t-statistic of the estimated Additionality ratio
Intercept : the publication bias effect
-1.706684 (0.449262)
2.162046 (0.200625)
1𝑆𝑒
: inverse of standard error or measure of the true empirical effect of R&D tax incentives
-6.30E-05 (0.000366)
-1.23E-05 (2.44E-05)
R-squared and Adjusted-R squared
0.000121 -0.003960
0.000928 -0.002732
F-statistic 0.029690 0.253457 Number of observations 247 275

31
Table 4. Meta-Analysis of Additivity ratio of R&D tax credit effects (1) (2) (3) (4) (5)
Constant 3.2623*** (1.1744)
0.7175 (1.3236)
3.7662 (2.9066)
1.8937 (3.6035)
3.1045 (3.7466)
TD : Type of data 1.7307** (0.6943)
1.1660* (1.6682)
1.5690* (0.7677)
5.5154*** (1.7627)
5.9203*** (1.7925)
DSEST : Data structure and estimation methods
4.2464*** (0.8395)
5.3790*** (0.8761)
3.6090*** (1.0803)
3.0697*** (1.14263)
1.8953 (1.14330)
USNOUS : US or not US country
0.8169 (0.7306)
3.2760*** (0.9328)
1.8061* (0.9963)
6.1904** (2.911)
5.6568* (2.8915)
TAUX : Rate of tax credit 25.441***
(6.2685) 14.2701** (7.1469)
34.8228*** (10.7275)
43.2132*** (11.3344)
TDY : includes time dummy
-0.002506 (0.6732)
-1.5662** (0.7821)
-1.6259** (0.8209)
-1.7201* (0.8760)
-0.3354 (0.8632)
NAUT : Number of authors -0.5949
(0.6292) -3.2245*** (1.2400)
-7.4583*** (1.3125)
-5.8906*** (1.2000)
IDUM : Industry Dummy -0.4097 (0.5918)
0.1086 (0.5932)
1.0746 (0.7161)
2.7597*** (0.7465)
-1.3676* (0.6957)
HTD : High-tech subsamples firms
2.4148*** (0.5998)
2.2838*** (0.5889)
2.1143*** (0.6162)
0.4036 (0.7517)
0.7013 (0.7509)
SME:SME-Dummy 0.9682 (0.8768)
1.2652 (0.8865)
1.6455* (0.9411)
2.9233*** (0.9686)
2.1165* (1.0922)
LF:Large firms dummy 1.5988** (0.6807)
1.2772* (0.6743)
1.1856* (0.6678)
0.8868 (0.6429)
1.0762* (0.6534)
HM:High market comp.-Dummy
1.7559** (0.7711)
3.5379*** (0.8710)
-0.8866 (1.4318)
-4.7104** (1.9299)
-3.0440 (1.8837)
MS:Market Size Dummy
-2.0361*** (0.6214)
-2.9848*** (0.6960)
-1.6254* (0.8405)
-0.9566 (0.8547)
-1.0523 (0.8781)
LABOUR:Tax price of Labour related to RD
8.3306*** (2.4023)
20.2679*** (3.9147)
-15.6995*** (3.71983)
MET:Tax price of machinery and equipment used for the purposes of RD
6.1961*** (2.0452)
9.8405*** (2.5432)
10.6221*** (2.5601)
CTR : Corporate income tax rate
-10.1205 (6.5736)
1.2133 (6.6631)
6.4756 (6.7381)
BST : Tax price buildings and structures used for the purposes of RD
0.000957 (0.001232)
0.004329*** (0.001254)
0.005202*** (0.001320)
PEP : Average year of data or the number of years covert by the study
2.2887*** (0.5128)
1.8027*** (0.4966)
NB : Number of observations
0.7794*** (0.1914)
BRD : Lagged Business enterprises expenditure in R&D
0.2173 (0.91464)
0.4362 (0.9081)
GS : Direct Gov. support on RD and Europe Commission
2.0085* (1.1279)
1.0259 (1.1003)
HE : High Edu expenditure by gov (Human Capital indicator)
0.070305 (0.6444)
0.1194 (0.6473)
FET:Funds from abroad foreign enterprises
-0.8829* (0.4489)
-0.6685 (0.4404)
NOBS 341 341 341 341 341 R-Squared 0.1808 0.2208 0.2600 0.3619 0.3676 F-Statistics 7.2864 7.7482 7.1167 8.6182 8.4039
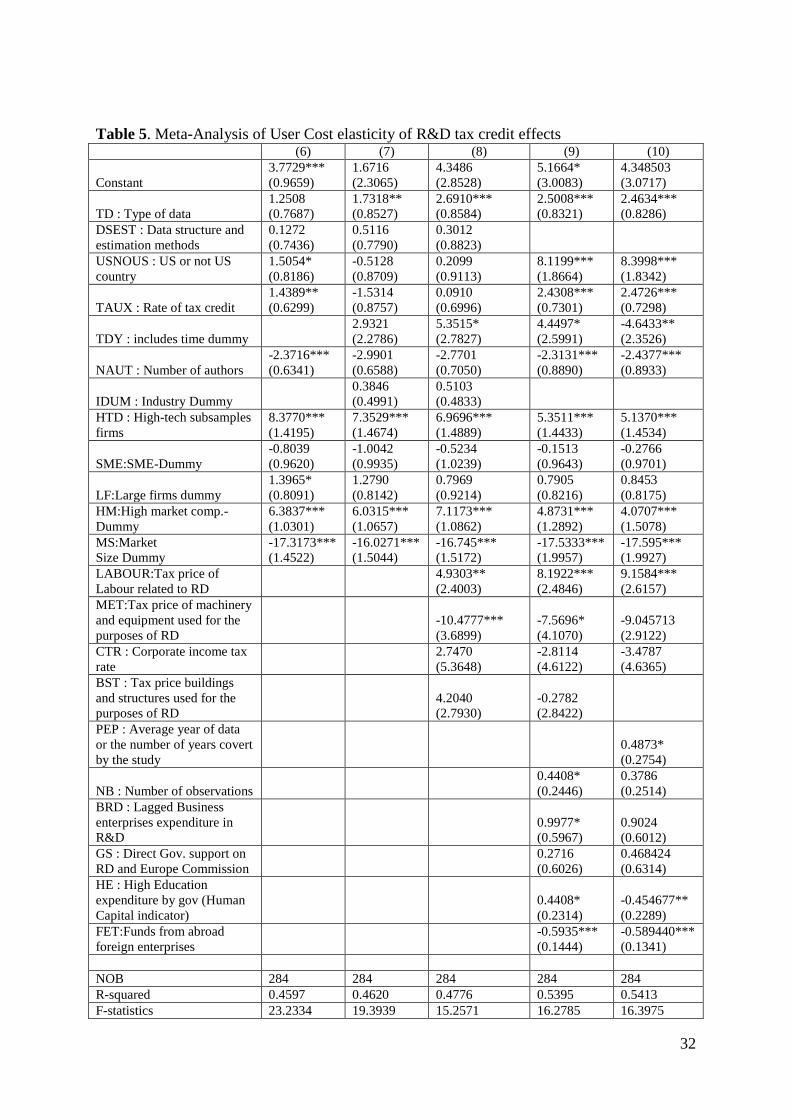
32
Table 5. Meta-Analysis of User Cost elasticity of R&D tax credit effects (6) (7) (8) (9) (10)
Constant 3.7729*** (0.9659)
1.6716 (2.3065)
4.3486 (2.8528)
5.1664* (3.0083)
4.348503 (3.0717)
TD : Type of data 1.2508 (0.7687)
1.7318** (0.8527)
2.6910*** (0.8584)
2.5008*** (0.8321)
2.4634*** (0.8286)
DSEST : Data structure and estimation methods
0.1272 (0.7436)
0.5116 (0.7790)
0.3012 (0.8823)
USNOUS : US or not US country
1.5054* (0.8186)
-0.5128 (0.8709)
0.2099 (0.9113)
8.1199*** (1.8664)
8.3998*** (1.8342)
TAUX : Rate of tax credit 1.4389** (0.6299)
-1.5314 (0.8757)
0.0910 (0.6996)
2.4308*** (0.7301)
2.4726*** (0.7298)
TDY : includes time dummy 2.9321
(2.2786) 5.3515* (2.7827)
4.4497* (2.5991)
-4.6433** (2.3526)
NAUT : Number of authors -2.3716*** (0.6341)
-2.9901 (0.6588)
-2.7701 (0.7050)
-2.3131*** (0.8890)
-2.4377*** (0.8933)
IDUM : Industry Dummy
0.3846 (0.4991)
0.5103 (0.4833)
HTD : High-tech subsamples firms
8.3770*** (1.4195)
7.3529*** (1.4674)
6.9696*** (1.4889)
5.3511*** (1.4433)
5.1370*** (1.4534)
SME:SME-Dummy -0.8039 (0.9620)
-1.0042 (0.9935)
-0.5234 (1.0239)
-0.1513 (0.9643)
-0.2766 (0.9701)
LF:Large firms dummy 1.3965* (0.8091)
1.2790 (0.8142)
0.7969 (0.9214)
0.7905 (0.8216)
0.8453 (0.8175)
HM:High market comp.-Dummy
6.3837*** (1.0301)
6.0315*** (1.0657)
7.1173*** (1.0862)
4.8731*** (1.2892)
4.0707*** (1.5078)
MS:Market Size Dummy
-17.3173*** (1.4522)
-16.0271*** (1.5044)
-16.745*** (1.5172)
-17.5333*** (1.9957)
-17.595*** (1.9927)
LABOUR:Tax price of Labour related to RD
4.9303** (2.4003)
8.1922*** (2.4846)
9.1584*** (2.6157)
MET:Tax price of machinery and equipment used for the purposes of RD
-10.4777*** (3.6899)
-7.5696* (4.1070)
-9.045713 (2.9122)
CTR : Corporate income tax rate
2.7470 (5.3648)
-2.8114 (4.6122)
-3.4787 (4.6365)
BST : Tax price buildings and structures used for the purposes of RD
4.2040 (2.7930)
-0.2782 (2.8422)
PEP : Average year of data or the number of years covert by the study
0.4873* (0.2754)
NB : Number of observations
0.4408* (0.2446)
0.3786 (0.2514)
BRD : Lagged Business enterprises expenditure in R&D
0.9977* (0.5967)
0.9024 (0.6012)
GS : Direct Gov. support on RD and Europe Commission
0.2716 (0.6026)
0.468424 (0.6314)
HE : High Education expenditure by gov (Human Capital indicator)
0.4408* (0.2314)
-0.454677** (0.2289)
FET:Funds from abroad foreign enterprises
-0.5935*** (0.1444)
-0.589440*** (0.1341)
NOB 284 284 284 284 284 R-squared 0.4597 0.4620 0.4776 0.5395 0.5413 F-statistics 23.2334 19.3939 15.2571 16.2785 16.3975

33
Table 6. List of papers working on the effect of tax credit on private R&D. Authors Date Country Period from Period to Asmussen et Berriot
1993 France 1985 1989
Australian bureau of Economics
1993 Australia 1984 1994
Banno 2009 Italy 1991 2007 Bloom, Griffith and Van Reenen
2007 9 OECD countries 1979 1997
Baghna et Mohnen 2009 Canada (Québec) 1997 2003 Baily et Lawrence 1992 USA 1981 1989 Berger 1993 USA 1982 1985 Bernstein 1986 Canada 1981 1986 Bernstein 1998 Canada 1964 1992 Bloom et al. 2002 G7+Australia+Spain 1979 1997 Collins 1983 USA 1981 1981 Lhullery et al. 2013 France 1993 2006 Dagenais et al. 1997 and 2004 Canada 1975 1992 Haegland et Moen (a)
2007 Norway 1993 2005
Hall 1993 USA 1981 1991 Cordes 1989 USA 1981 1985 Harris et al. 2009 Northern Ireland 1998 2003 Hines 1993 USA 1984 1989 Cozzarin 2008 Canada 2005 2006 HRMC 2010 United Kingdom 2003 2007 Cahu et al. 2010 France Prospectif horizon 2020
Klassen et al. 2004 Canada 1991 1997 Cappelen et al. 2010 Norway 2002 2009 Duguet 2008 France 1993 2003 Eisner et al. 1983 USA 1981 1982 Loskshin et Mohnen
2011 Pays-Bas 1996 2004
Loskshin et Mohnen
2007 Pays-Bas 1996 2004
Mairesse et Mulkay
2004 France 1983 1997
Mamuremas et Nadiri
1996 USA 1956 1988
Mansfield 1986 Sweden 1981 1988 Mansfield 1986 USA 1981 1983 Mansfield et Switzer
1985 Canada 1980 1983
Elschner and Ernst 2008 EU Member States 2006 2007 McCutchen 1993 USA 1982 1985 McFetridge et Warda
1983 Canada 1962 1982
McKenzie et Sershun
2005 G7+Australie+Espagne 1979 1997
Parisi et Sembellini 2001 Italy 1992 1997 Shah 1994 Canada 1963 1983 Swenson 1992 USA 1981 1987 Van der Hove et al. 1998 Netherlands 1994 1996 Wilson 2007 USA 1981 2004

34
Czarnitzki et al. 2011 Canada 1997 1999 Wu 2005 USA 1979 1985 Falk 2004 OECD 1970 2002 Marra 2004 Spain 1991 1999 Thomson 2010 Australia 1990 2005 Falk 2006 Guellec et van Pottelsberghe
2003
Parson et Phillips 2007 Watkins and Paff 2009 USA 1994 1999 Corchuelle et Martinez-Roz
2009 Spain 1990 2002
Koga 2003 Japan 1989 1998 Lebeau 1996 Corchuelle et Martinez-Roz
2011 Spain 1998 2002
Fedderke and Teubes
2011 USA, China, South Africa, Israel, Singapore and Malaysia
1990 1998
Haegland et Moen (b)
2007 Norway 2002 2005
Harris and al. 2009 Northern Ireland 1998 2003 Huang and Yang 2009 Taiwan 2001 2005 Ientile 2008 France 1986 2003 Kobayashi 2011 Japan 1999 2007 Klassen and al. 2004 USA and Canada 1992 1997 Onishi and Nagata 2009 Japan Paff 2005 USA 1994 1999 Russo 2004 Canada Lester 2011 Canada 2006 2008 Missaka 2008 USA 1987 2006 Caiumi 2011 Italy 2000 2005 Wang and Tsai 1998 Taiwan 1997 1997 Yohei 2011 Japan 2006 2006 Lhuillery et al. 2013 France 1998 2003 Ho 2006 USA 1975 1999 Huang 2009 Taiwan 2001 2005 Choi and Jeong 2013 USA 1980 2008 Corchuelo and Martinez-Ros 2009 Spain 2002 2002 Chang 2012 USA 1981 2006 Chiang, Lee and Anandarajan 2012 Taiwan 2002 2007 Wu 2005 USA 1979 1995 Yang et al 2012 Taiwan 2001 2005 Rao 2010 USA 1981 1991 Romero Jordan et Sanz Sanz 2007 Spain 1990 2001
Shah 1994 Canada 1963 1983 Thomson 2010 Australia 1990 2005
Lee 2011 2011 Japan, Canada, Korea, Taiwan, China, India 1997 1997