Embed Size (px)
Citation preview
Working Paper No. 7 (July 1998)
An Investigation of Aquaculture Potential in Small-Scale Farmer-Managed Irrigation Systems of Raichur District, Karnataka, India
Aquaculture in Small-Scale Farmer-Managed Irrigation Systems Funded by DFID Aquaculture Research Programme
Institute of Aquaculture, University of Stirling, Scotland, UK.
List of Working Papers
Project Summary Report
1. Raichur District: Site for a Study of Aquaculture Development in the Semi-arid Tropics
2. Methods for Participatory Information Gathering and Analysis
3. Socio-economic Analysis of Villages in Relation to Aquaculture Potential in Raichur District, Karnataka, India 4. Investigation of Gender Issues in Relation to Aquaculture Potential in Raichur District, Karnataka, India
5. On-farm Resources for Small-scale Farmer-managed Aquaculture in Raichur District, Karnataka, India
6. Inland Fisheries Resources and the Current Status of Aquaculture in Raichur District and Karnataka State, India
7. An Investigation of Aquaculture Potential in Small-scale Farmer-managed Irrigation Systems of Raichur District, Karnataka, India
8. Indigenous Freshwater Fish Resources of Karnataka State and their Potential for Aquaculture
9. Institutional Linkages of Relevance to Small-scale Aquaculture Development in Karnataka State, India 10. Fisheries Marketing, Demand and Credit in Raichur District, Karnataka, India
Project background
The arid and semi-arid tropics are areas in urgent need of development. As a home to a large proportion of the world's poor these regions face a future of scarcity of food and insufficient water for consumption and irrigation of crops. It has been predicted that India and Sri Lanka will face a fresh-water crisis in the near future, and as much water is currently wasted due to inadequate management and conservation practices there is a need for more integrated approaches to water management. The majority of India's surface water bodies are used primarily for irrigation. Although large-scale irrigation systems cover more surface area and supply a greater area of farmland, more farmers are dependent on small-scale systems for their daily livelihood. Irrigation systems are often very inefficient water distribution systems, and studies suggest that the efficiency of water use could be improved. The integration of aquaculture (which can be non-consumptive in terms of water use) has the potential to increase food production and improve the efficiency of the use of small-scale irrigation water resource.
These Working Papers are the first stage of the research project 'Small-scale farmer-managed aquaculture in engineered water systems' (DFID project R7064). The project aims to investigate the potential for integration of aquaculture into small-scale farmer-managed irrigation systems in arid and sem i-arid regions of India and Sri Lanka. Intended beneficiaries include the rural poor, which in India belong to the Scheduled Castes (SCs)1 and Scheduled Tribes (STs)2. This part of the project focuses on Karnataka State on the south west of the Indian peninsular.
During the research, the economic and technical feasibility and the social acceptability of the production of fish in such systems of arid and semi-arid regions of Karnataka were investigated. Field research took place from 6 April to 21 May 1998 and included a `Rapid Rural Appraisal' of four villages in. Raichur District, Karnataka, and semi-structured interviews with representatives from the Government Department of Fisheries, marketing organisations, academics and other relevant institutional sectors within the state.
All fieldwork was undertaken in collaboration with the NGO Samuha, an organisation undertaking wide-ranging activities in the arid and semi-arid areas of Karnataka State. Samuha has extensive experience within participatory development and its initiatives range across health, disabilities, women's development, HIV/AIDS, education, animal husbandry, drinking water and sanitation, irrigation and watershed development (Pradeep, 1994). The majority of the work of Samuha is carried out in the districts of Koppal and Raichur with a smaller project in Bangalore. The activities of Samuha are supported by a number of bodies: ActionAid; OXFAM; the Swiss Development Cooperation; the Government of Karnataka and the Government of India as well as individual donors.
The results and analysis are presented in the ten Working Papers listed above. For an overview of the content of each of the Working Papers, see the Summary Report. This series of working papers have been produced principally as a resource for a stakeholder workshop to be held in Coimbatore, 19th - 20'1' November 1998. Conclusions and the research agenda are therefore preliminary.

1 SCs: lower castes identified by the Indian government as a means of classifying castes for the allocation of benefits.2 STs: all tribals. SCs and STs together constitute the `socially and educationally backward classes of citizens'. The terms form the basis for policies of protection and positive discrimination.
Glossary
CIFA Central Institute for Freshwater Aquaculture
DFID Department for International Development (formerly ODA)
DoF Department of Fisheries
Kharif The first growing season (June-October)
NGO Non-governmental Organisation
ODA Overseas Development Agency (now DFID)
PRA Participatory Rural Appraisal
Rabi The second growing season (November-March)
RRA Rapid Rural AppraisalRs Indian unit of currency
SC Scheduled Caste
ST Scheduled Tribe
1 ha 2.4 acres
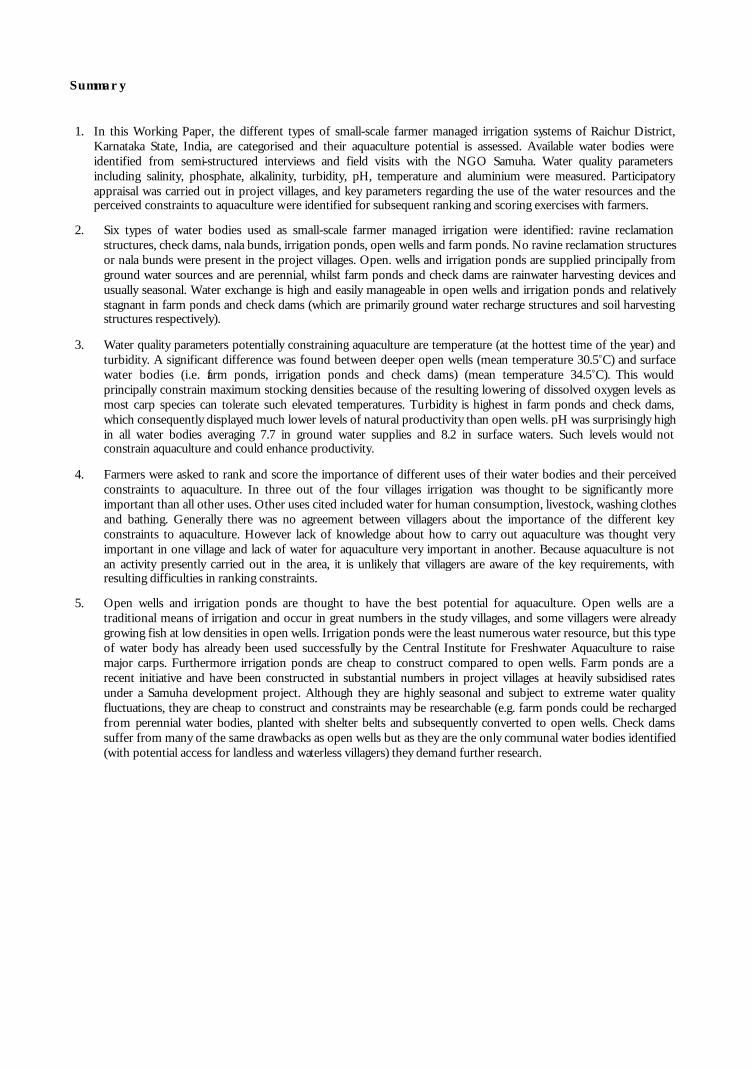
1. In this Working Paper, the different types of small-scale farmer managed irrigation systems of Raichur District, Karnataka State, India, are categorised and their aquaculture potential is assessed. Available water bodies were identified from semi-structured interviews and field visits with the NGO Samuha. Water quality parameters including salinity, phosphate, alkalinity, turbidity, pH, temperature and aluminium were measured. Participatory appraisal was carried out in project villages, and key parameters regarding the use of the water resources and the perceived constraints to aquaculture were identified for subsequent ranking and scoring exercises with farmers.
2. Six types of water bodies used as small-scale farmer managed irrigation were identified: ravine reclamation structures, check dams, nala bunds, irrigation ponds, open wells and farm ponds. No ravine reclamation structures or nala bunds were present in the project villages. Open. wells and irrigation ponds are supplied principally from ground water sources and are perennial, whilst farm ponds and check dams are rainwater harvesting devices and usually seasonal. Water exchange is high and easily manageable in open wells and irrigation ponds and relatively stagnant in farm ponds and check dams (which are primarily ground water recharge structures and soil harvesting structures respectively).
3. Water quality parameters potentially constraining aquaculture are temperature (at the hottest time of the year) and turbidity. A significant difference was found between deeper open wells (mean temperature 30.5°C) and surface water bodies (i.e. farm ponds, irrigation ponds and check dams) (mean temperature 34.5°C). This would principally constrain maximum stocking densities because of the resulting lowering of dissolved oxygen levels as most carp species can tolerate such elevated temperatures. Turbidity is highest in farm ponds and check dams, which consequently displayed much lower levels of natural productivity than open wells. pH was surprisingly high in all water bodies averaging 7.7 in ground water supplies and 8.2 in surface waters. Such levels would not constrain aquaculture and could enhance productivity.
4. Farmers were asked to rank and score the importance of different uses of their water bodies and their perceived constraints to aquaculture. In three out of the four villages irrigation was thought to be significantly more important than all other uses. Other uses cited included water for human consumption, livestock, washing clothes and bathing. Generally there was no agreement between villagers about the importance of the different key constraints to aquaculture. However lack of knowledge about how to carry out aquaculture was thought very important in one village and lack of water for aquaculture very important in another. Because aquaculture is not an activity presently carried out in the area, it is unlikely that villagers are aware of the key requirements, with resulting difficulties in ranking constraints.
5. Open wells and irrigation ponds are thought to have the best potential for aquaculture. Open wells are a traditional means of irrigation and occur in great numbers in the study villages, and some villagers were already growing fish at low densities in open wells. Irrigation ponds were the least numerous water resource, but this type of water body has already been used successfully by the Central Institute for Freshwater Aquaculture to raise major carps. Furthermore irrigation ponds are cheap to construct compared to open wells. Farm ponds are a recent initiative and have been constructed in substantial numbers in project villages at heavily subsidised rates under a Samuha development project. Although they are highly seasonal and subject to extreme water quality fluctuations, they are cheap to construct and constraints may be researchable (e.g. farm ponds could be recharged from perennial water bodies, planted with shelter belts and subsequently converted to open wells. Check dams suffer from many of the same drawbacks as open wells but as they are the only communal water bodies identified (with potential access for landless and waterless villagers) they demand further research.
Summary
An Investigation of Aquaculture Potential in Small-scale Farmer managed Irrigation Systems of Raichur District, Karnataka, India
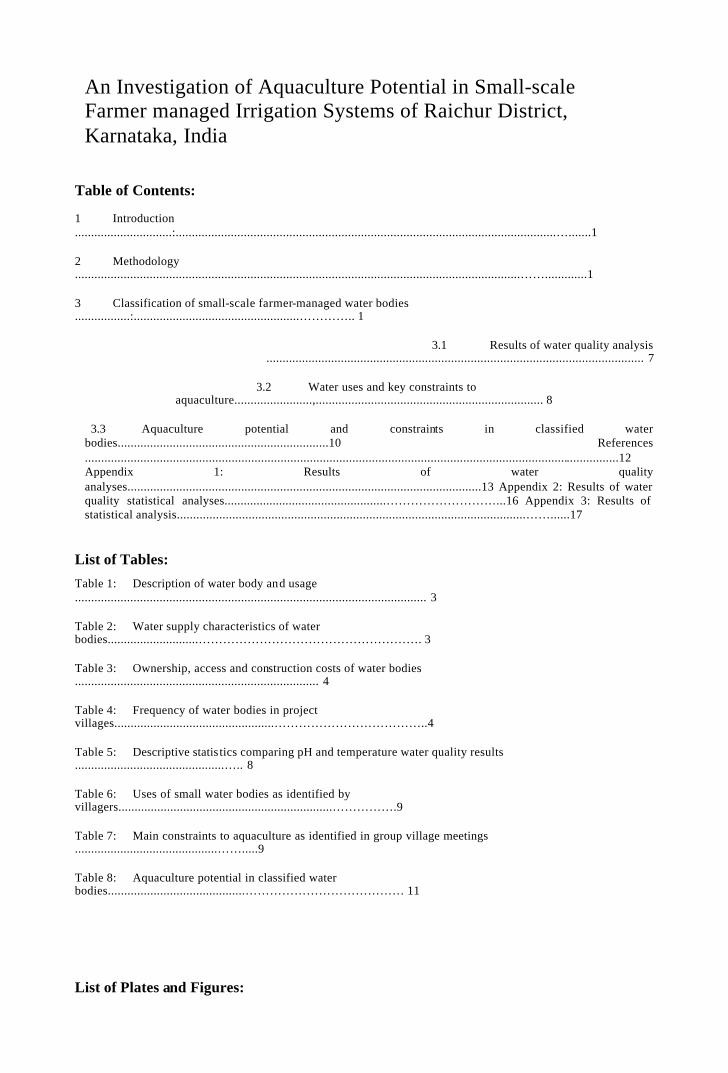
Table of Contents:
1 Introduction ..............................:.....................................................................................................................….......1
2 Methodology .........................................................................................................................................…….............1
3 Classification of small-scale farmer-managed water bodies .................:...................................................………….. 1
3.1 Results of water quality analysis .................................................................................................................... 7
3.2 Water uses and key constraints to aquaculture........................,...................................................................... 8
3.3 Aquaculture potential and constraints in classified water bodies.................................................................10 References ....................................................................................................................................................................12 Appendix 1: Results of water quality analyses.............................................................................................................13 Appendix 2: Results of water quality statistical analyses..................................................………………………...16 Appendix 3: Results of statistical analysis...........................................................................................................……......17
List of Tables:
Table 1: Description of water body and usage ............................................................................................................ 3
Table 2: Water supply characteristics of water bodies............................………………………………………………. 3
Table 3: Ownership, access and construction costs of water bodies ........................................................................... 4
Table 4: Frequency of water bodies in project villages.................................................………………………………..4
Table 5: Descriptive statis tics comparing pH and temperature water quality results ..............................................….. 8
Table 6: Uses of small water bodies as identified by villagers..................................................................…………….9
Table 7: Main constraints to aquaculture as identified in group village meetings ............................................…….....9
Table 8: Aquaculture potential in classified water bodies..........................................………………………………… 11
List of Plates and Figures:

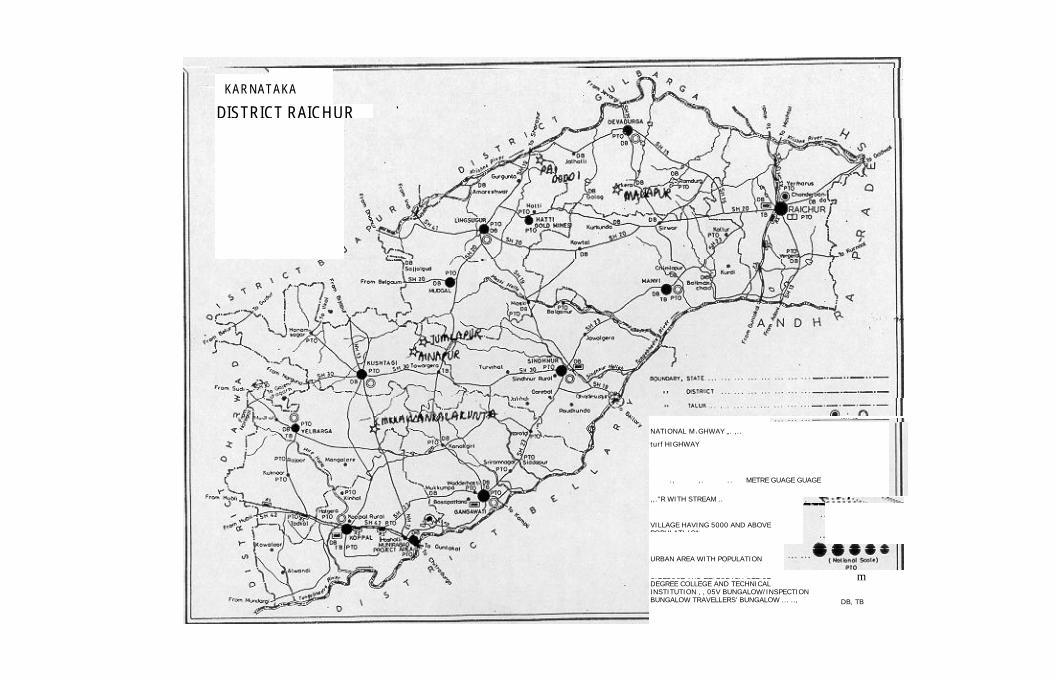
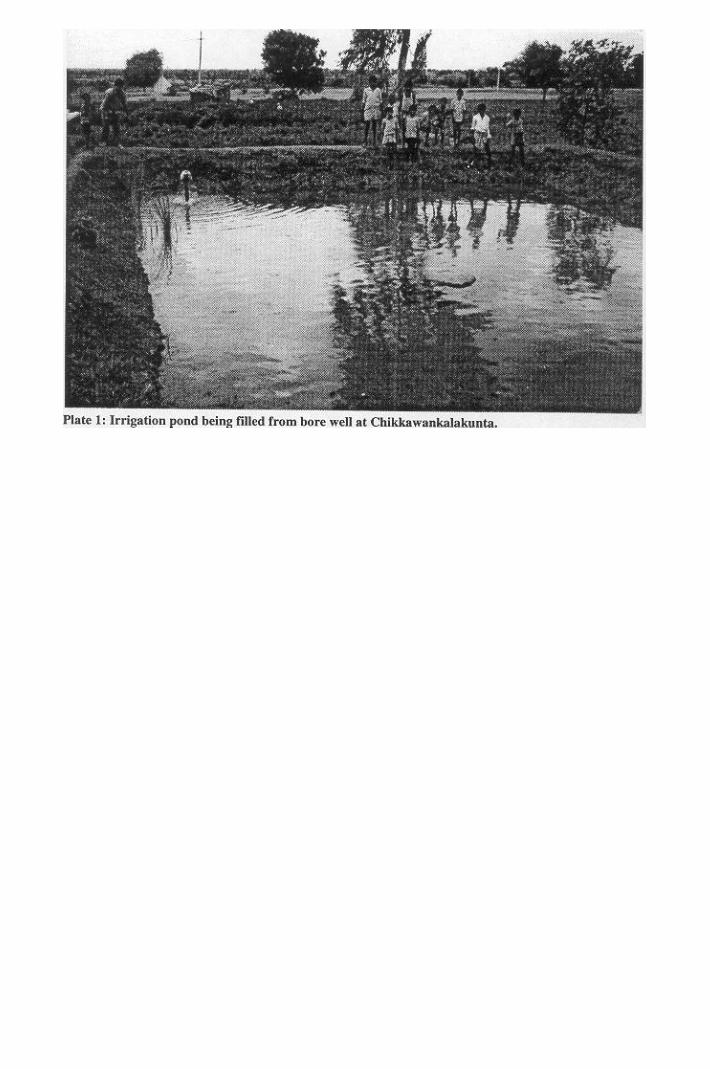
Figure 1: Map of Raichur........................................................................................................................................5 Plate 1: Irrigation pond being filled from bore well at Chikkawankalakunta........ ..............................................5
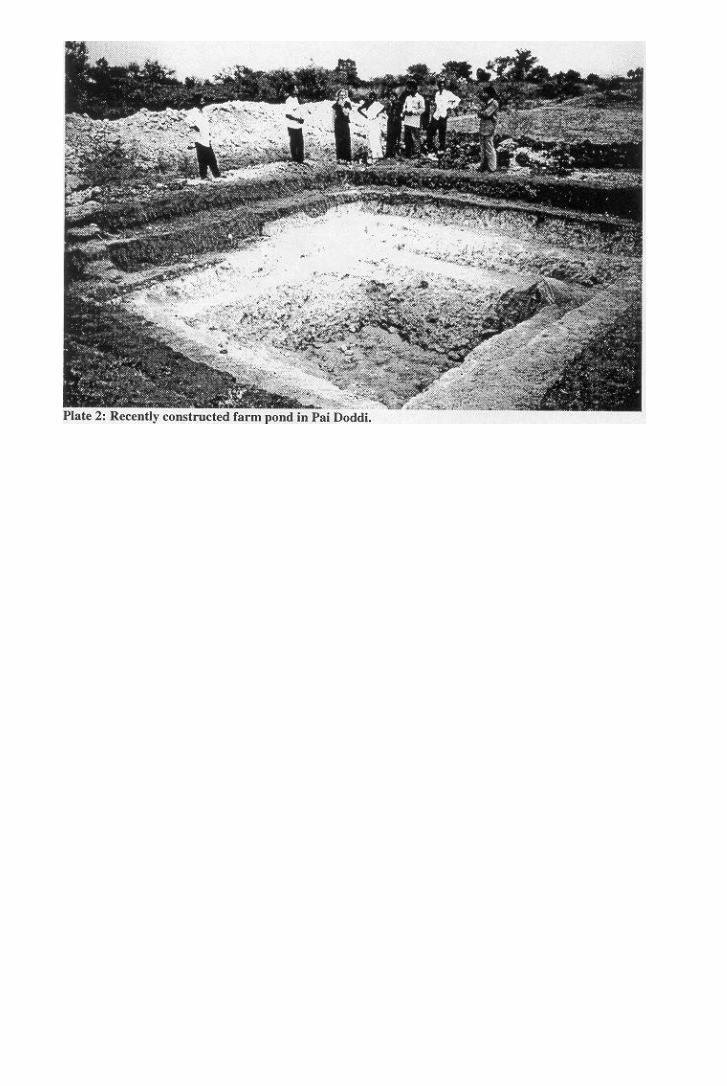
Plate 2: Recently constructed farm pond in Pai Doddi.................................................…………………………...…..5
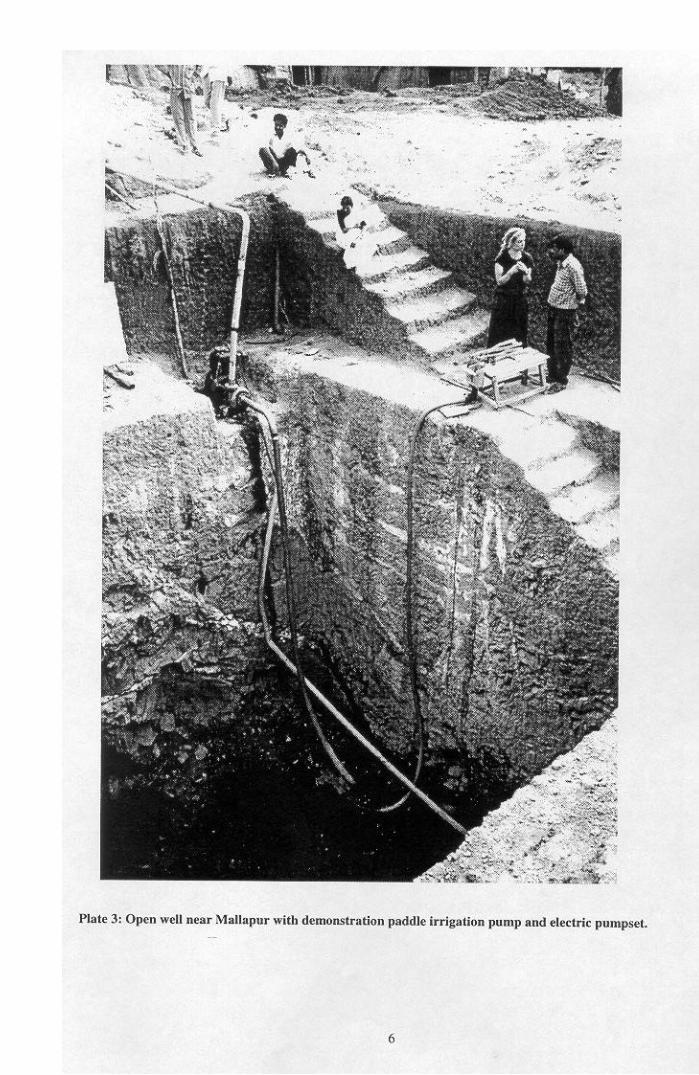
Plate 3: Open well near Mallapur with demonstration paddle irrigation pump and electrical pumpset..................... 6
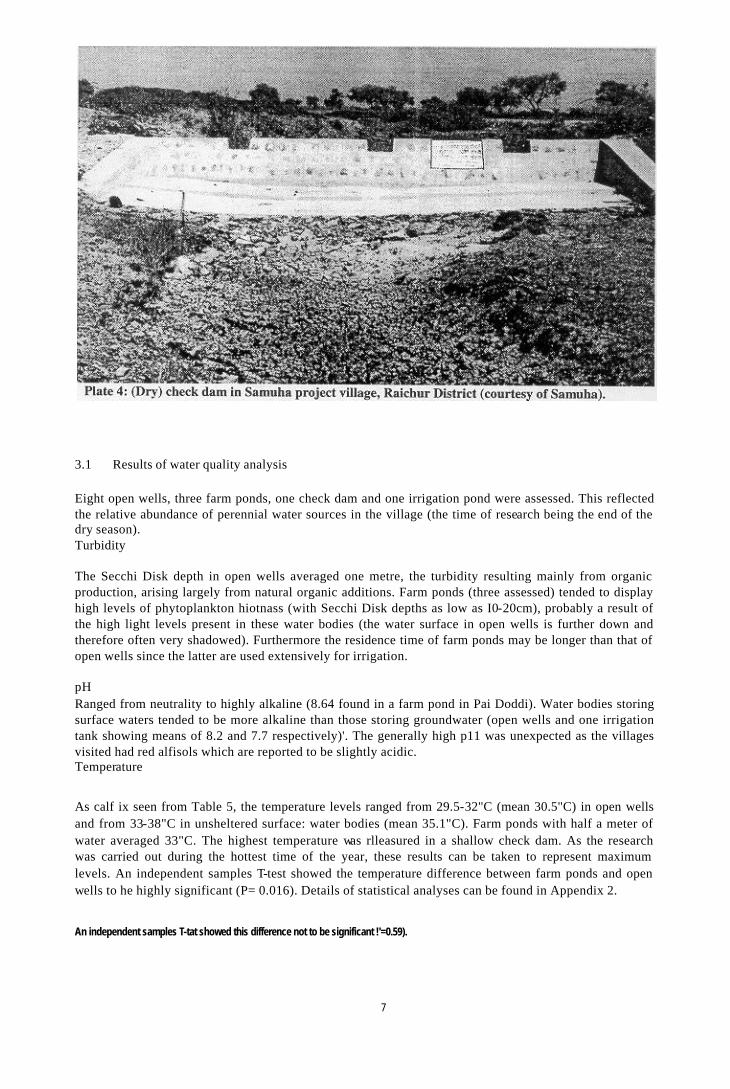
Plate 4: (Dry) check dam in Samuha project village, Raichur District...............................................……………… 7
1 Introduction In this paper the different types of small-scale, farmer-managed water bodies of Raichur District, Karnataka, India, are identified and their potential for the integration of aquaculture assessed. 2 Methodology
The different types of water body present in the study area were identified from interviews with staff from Samuha (see project background). Visits were made to all different types, and a classification (see Tables 1, 2 and 3) constructed on the basis of physical characteristics, seasonality, water uses, and access and ownership patterns. Four research villages were selected partly on the basis of the number and types of water bodies present, and partly on the basis of socio-economic characteristics. These can be seen in Box 1 and Figure 1. For an outline of the selection of villages, see Working Paper 1.
In individual villages maps were constructed with villagers identifying the position and ownership of all water bodies. Participatory research was carried out, using individual farm walks and key informant interviews with villagers. The major uses of the water bodies as well as the key constraints to the introduction of aquaculture into small-scale farmer managed irrigation systems were identified in village group meetings, and ranked and scored in order of their importance to individual farmers. Water quality parameters of individual water bodies were measured, including: salinity, phosphate, alkalinity, turbidity, pH, temperature and aluminium. Measurement of temporal variation in water quality parameters was not possible in the project time frame. The research took place during the end of the summer, at a time where temperatures were at their highest, although the characteristics measured may not be indicative of the worst case situation. Samples were collected in glass bottles and analysed the same day..
3 Classification of small-scale farmer-managed water bodies From key informant interviews with staff from Samuha staff, six types of small-scale water body were identified in the Samuha project villages. These can be seen in Table 1. Tables 2 and 3 show the results of the classification. Images of these structures are shown in plates 1 to 2.
Box 1: Research villages in Raichur District. Village name Taluk Jumlapur & Ainapur Kushtagi Chikkawankalakunta Yelbarga Pai Doddi Lingsugur Mallapur Deodurg
KARNATAKA
DISTRICT RAICHUR
HEADQUATERS DISTRICT TALUK NATIONAL M IGHWAY „. ,..
turf HIGHWAY
., ,. .. METRE GUAGE GUAGE
,,."R WITH STREAM ..
VILLAGE HAVING 5000 AND ABOVE POPULATI ION
URBAN AREA WITH POPULATION
SIZEPOST AND TELEGRAPH OFFICE . DEGREE COLLEGE AND TECHNICAL INSTITUTION , , 05V BUNGALOW/INSPECTION BUNGALOW TRAVELLERS' BUNGALOW ... .., . ... ...
Gorebat
m
DB, TB
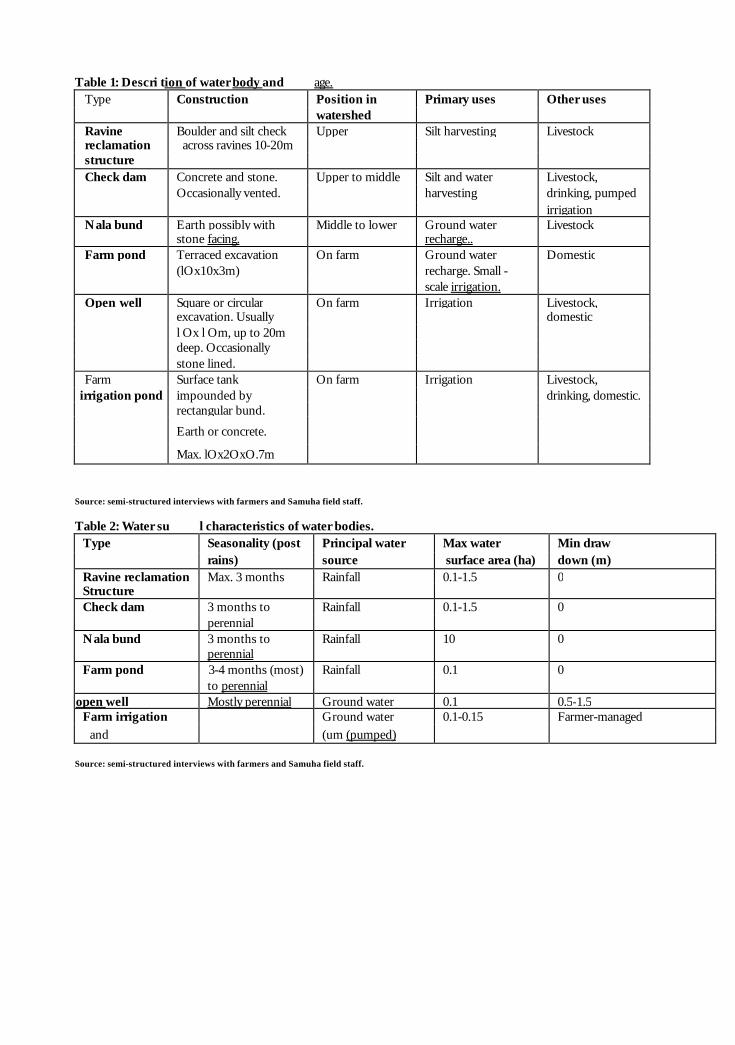
Table 1: Descri tion of water body and age. Type Construction Position in Primary uses Other uses
watershed Ravine Boulder and silt check Upper Silt harvesting Livestock reclamation across ravines 10-20m structure Check dam Concrete and stone. Upper to middle Silt and water Livestock,
Occasionally vented. harvesting drinking, pumped irrigation
Nala bund Earth possibly with Middle to lower Ground water Livestock stone facing. recharge..
Farm pond Terraced excavation On farm Ground water Domestic (lOx10x3m) recharge. Small - scale irrigation.
Open well Square or circular On farm Irrigation Livestock, excavation. Usually domestic l Ox l Om, up to 20m deep. Occasionally stone lined.
Farm Surface tank On farm Irrigation Livestock, irrigation pond impounded by drinking, domestic.
rectangular bund.
Earth or concrete.
Max. lOx2OxO.7m
Source: semi-structured interviews with farmers and Samuha field staff.
Table 2: Water su l characteristics of water bodies. Type Seasonality (post Principal water Max water Min draw
rains) source surface area (ha) down (m) Ravine reclamation Max. 3 months Rainfall 0.1-1.5 0 Structure Check dam 3 months to Rainfall 0.1-1.5 0
perennial Nala bund 3 months to Rainfall 10 0
perennial Farm pond 3-4 months (most) Rainfall 0.1 0
to perennial open well Mostly perennial Ground water 0.1 0.5-1.5
Farm irrigation
t Ground water 0.1-0.15 Farmer-managed
and (um (pumped) Source: semi-structured interviews with farmers and Samuha field staff.
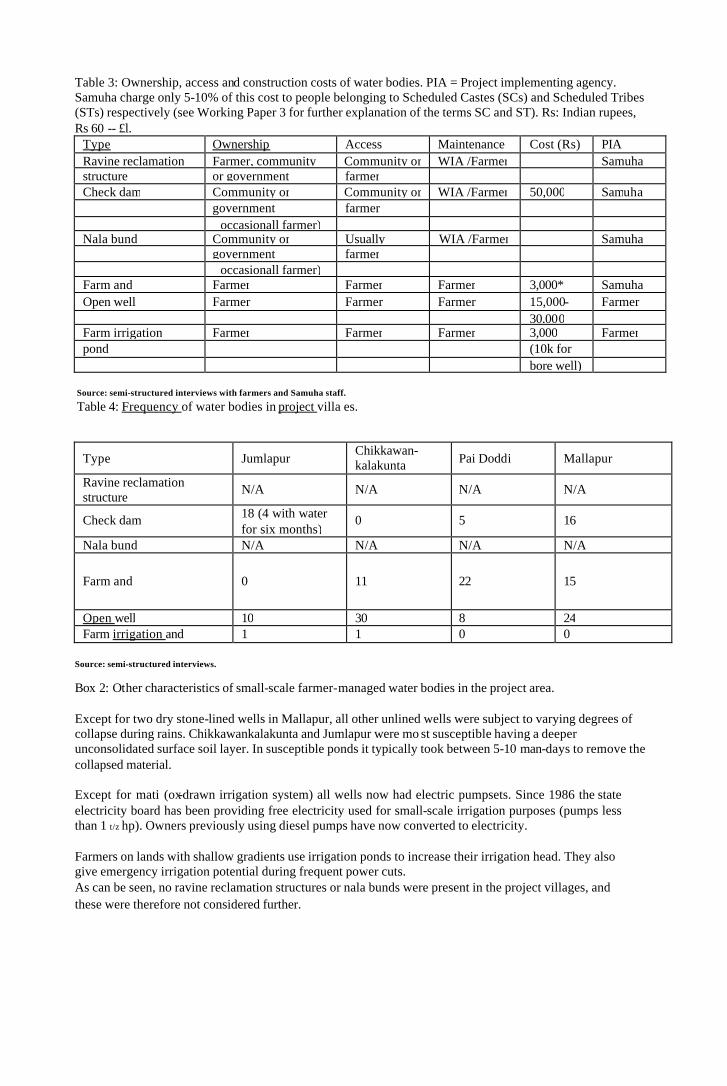
Table 3: Ownership, access and construction costs of water bodies. PIA = Project implementing agency. Samuha charge only 5-10% of this cost to people belonging to Scheduled Castes (SCs) and Scheduled Tribes (STs) respectively (see Working Paper 3 for further explanation of the terms SC and ST). Rs: Indian rupees, Rs 60 -- £l.
Type Ownership Access Maintenance Cost (Rs) PIA Ravine reclamation Farmer, community Community or WIA /Farmer Samuha structure or government farmer Check dam Community or Community or WIA /Farmer 50,000 Samuha
government farmer occasionall farmer)
Nala bund Community or Usually WIA /Farmer Samuha government farmer occasionall farmer)
Farm and Farmer Farmer Farmer 3,000* Samuha Open well Farmer Farmer Farmer 15,000- Farmer
30,000 Farm irrigation Farmer Farmer Farmer 3,000 Farmer pond (10k for
bore well) Source: semi-structured interviews with farmers and Samuha staff.
Table 4: Frequency of water bodies in project villa es.
Type Jumlapur Chikkawan- kalakunta Pai Doddi Mallapur
Ravine reclamation structure
N/A N/A N/A N/A
Check dam 18 (4 with water for six months)
0 5 16
Nala bund N/A N/A N/A N/A
Farm and 0 11 22 15
Open well 10 30 8 24 Farm irrigation and 1 1 0 0
Source: semi-structured interviews.
Box 2: Other characteristics of small-scale farmer-managed water bodies in the project area. Except for two dry stone-lined wells in Mallapur, all other unlined wells were subject to varying degrees of collapse during rains. Chikkawankalakunta and Jumlapur were mo st susceptible having a deeper unconsolidated surface soil layer. In susceptible ponds it typically took between 5-10 man-days to remove the collapsed material. Except for mati (ox-drawn irrigation system) all wells now had electric pumpsets. Since 1986 the state electricity board has been providing free electricity used for small-scale irrigation purposes (pumps less than 1 t/z hp). Owners previously using diesel pumps have now converted to electricity. Farmers on lands with shallow gradients use irrigation ponds to increase their irrigation head. They also give emergency irrigation potential during frequent power cuts. As can be seen, no ravine reclamation structures or nala bunds were present in the project villages, and these were therefore not considered further.
3.1 Results of water quality analysis
Eight open wells, three farm ponds, one check dam and one irrigation pond were assessed. This reflected the relative abundance of perennial water sources in the village (the time of research being the end of the dry season). Turbidity The Secchi Disk depth in open wells averaged one metre, the turbidity resulting mainly from organic production, arising largely from natural organic additions. Farm ponds (three assessed) tended to display high levels of phytoplankton hiotnass (with Secchi Disk depths as low as I0-20cm), probably a result of the high light levels present in these water bodies (the water surface in open wells is further down and therefore often very shadowed). Furthermore the residence time of farm ponds may be longer than that of open wells since the latter are used extensively for irrigation. pH Ranged from neutrality to highly alkaline (8.64 found in a farm pond in Pai Doddi). Water bodies storing surface waters tended to be more alkaline than those storing groundwater (open wells and one irrigation tank showing means of 8.2 and 7.7 respectively)'. The generally high p11 was unexpected as the villages visited had red alfisols which are reported to be slightly acidic. Temperature
As calf ix seen from Table 5, the temperature levels ranged from 29.5-32"C (mean 30.5"C) in open wells and from 33-38"C in unsheltered surface: water bodies (mean 35.1"C). Farm ponds with half a meter of water averaged 33"C. The highest temperature was rlleasured in a shallow check dam. As the research was carried out during the hottest time of the year, these results can be taken to represent maximum levels. An independent samples T-test showed the temperature difference between farm ponds and open wells to he highly significant (P= 0.016). Details of statistical analyses can be found in Appendix 2.
An independent samples T-tat showed this difference not to be significant !'=0.59).
7
Chloride, aluminium and phospate Chloride levels ranged from 50 - 175mg 1- ', following the same trend as pH with lowest levels observed in the open wells. Alfisols have reported high levels of aluminium and iron (Haylor, 1997), but despite this the present study found, aluminium levels to be negligible. Phosphate (1.5-2.8mg h', mean 2.2mg 1-
') and alkalinity (234-485mg 1-', mean 385mg 1"') levels were relatively high, consistent with the high productivity mentioned above
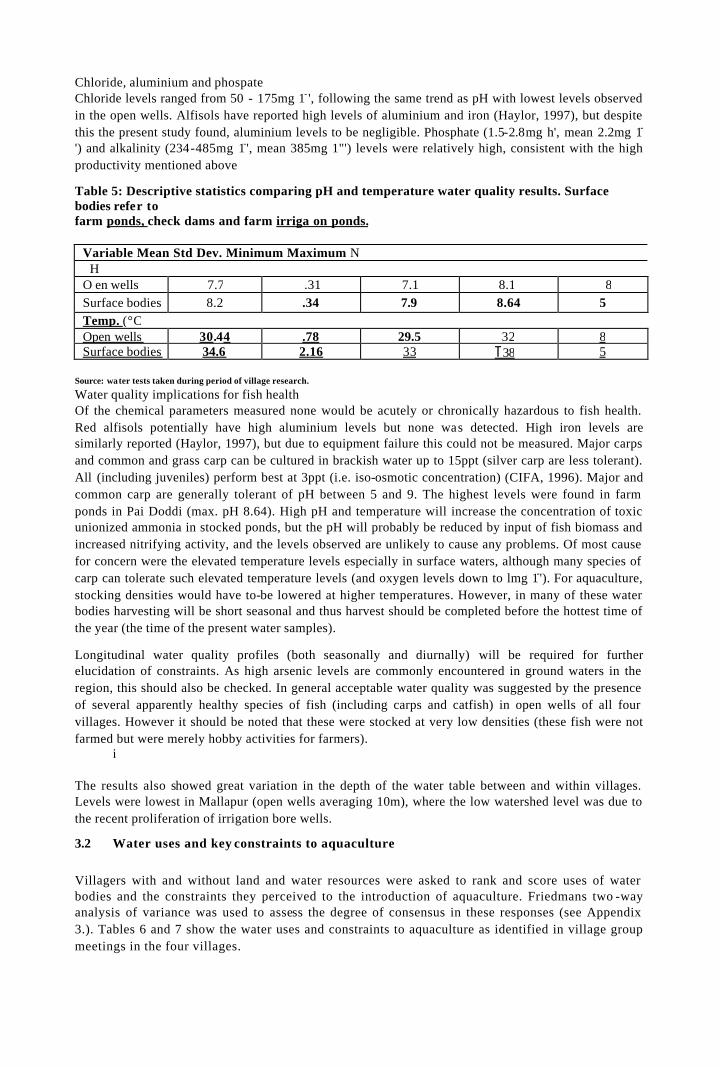
Table 5: Descriptive statistics comparing pH and temperature water quality results. Surface bodies refer to farm ponds, check dams and farm irriga on ponds.
Variable Mean Std Dev. Minimum Maximum N H
O en wells 7.7 .31 7.1 8.1 8 Surface bodies 8.2 .34 7.9 8.64 5 Temp. (°C Open wells 30.44 .78 29.5 32 8 Surface bodies 34.6 2.16 33 T 38 5
Source: water tests taken during period of village research.
Water quality implications for fish health Of the chemical parameters measured none would be acutely or chronically hazardous to fish health. Red alfisols potentially have high aluminium levels but none was detected. High iron levels are similarly reported (Haylor, 1997), but due to equipment failure this could not be measured. Major carps and common and grass carp can be cultured in brackish water up to 15ppt (silver carp are less tolerant). All (including juveniles) perform best at 3ppt (i.e. iso-osmotic concentration) (CIFA, 1996). Major and common carp are generally tolerant of pH between 5 and 9. The highest levels were found in farm ponds in Pai Doddi (max. pH 8.64). High pH and temperature will increase the concentration of toxic unionized ammonia in stocked ponds, but the pH will probably be reduced by input of fish biomass and increased nitrifying activity, and the levels observed are unlikely to cause any problems. Of most cause for concern were the elevated temperature levels especially in surface waters, although many species of carp can tolerate such elevated temperature levels (and oxygen levels down to lmg 1-'). For aquaculture, stocking densities would have to-be lowered at higher temperatures. However, in many of these water bodies harvesting will be short seasonal and thus harvest should be completed before the hottest time of the year (the time of the present water samples).
Longitudinal water quality profiles (both seasonally and diurnally) will be required for further elucidation of constraints. As high arsenic levels are commonly encountered in ground waters in the region, this should also be checked. In general acceptable water quality was suggested by the presence of several apparently healthy species of fish (including carps and catfish) in open wells of all four villages. However it should be noted that these were stocked at very low densities (these fish were not farmed but were merely hobby activities for farmers).
i
The results also showed great variation in the depth of the water table between and within villages. Levels were lowest in Mallapur (open wells averaging 10m), where the low watershed level was due to the recent proliferation of irrigation bore wells.
3.2 Water uses and key constraints to aquaculture
Villagers with and without land and water resources were asked to rank and score uses of water bodies and the constraints they perceived to the introduction of aquaculture. Friedmans two -way analysis of variance was used to assess the degree of consensus in these responses (see Appendix 3.). Tables 6 and 7 show the water uses and constraints to aquaculture as identified in village group meetings in the four villages.
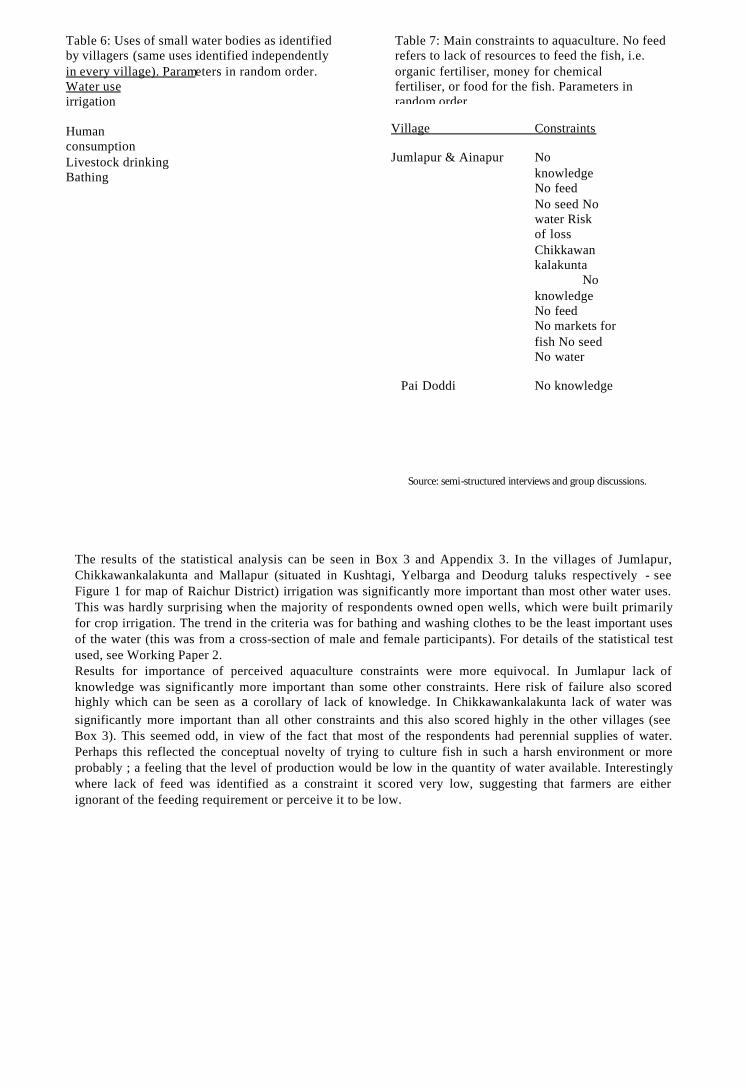
The results of the statistical analysis can be seen in Box 3 and Appendix 3. In the villages of Jumlapur, Chikkawankalakunta and Mallapur (situated in Kushtagi, Yelbarga and Deodurg taluks respectively - see Figure 1 for map of Raichur District) irrigation was significantly more important than most other water uses. This was hardly surprising when the majority of respondents owned open wells, which were built primarily for crop irrigation. The trend in the criteria was for bathing and washing clothes to be the least important uses of the water (this was from a cross-section of male and female participants). For details of the statistical test used, see Working Paper 2. Results for importance of perceived aquaculture constraints were more equivocal. In Jumlapur lack of knowledge was significantly more important than some other constraints. Here risk of failure also scored highly which can be seen as a corollary of lack of knowledge. In Chikkawankalakunta lack of water was significantly more important than all other constraints and this also scored highly in the other villages (see Box 3). This seemed odd, in view of the fact that most of the respondents had perennial supplies of water. Perhaps this reflected the conceptual novelty of trying to culture fish in such a harsh environment or more probably ; a feeling that the level of production would be low in the quantity of water available. Interestingly where lack of feed was identified as a constraint it scored very low, suggesting that farmers are either ignorant of the feeding requirement or perceive it to be low.
Table 6: Uses of small water bodies as identified by villagers (same uses identified independently in every village). Parameters in random order. Water use irrigation
Human consumption Livestock drinking Bathing Washing clothes
Source: semi-structured interviews and group discussions.
Village Constraints
Jumlapur & Ainapur No knowledge No feed No seed No water Risk of loss Chikkawankalakunta No knowledge No feed No markets for fish No seed No water
Pai Doddi No knowledge
Table 7: Main constraints to aquaculture. No feed refers to lack of resources to feed the fish, i.e. organic fertiliser, money for chemical fertiliser, or food for the fish. Parameters in random order.
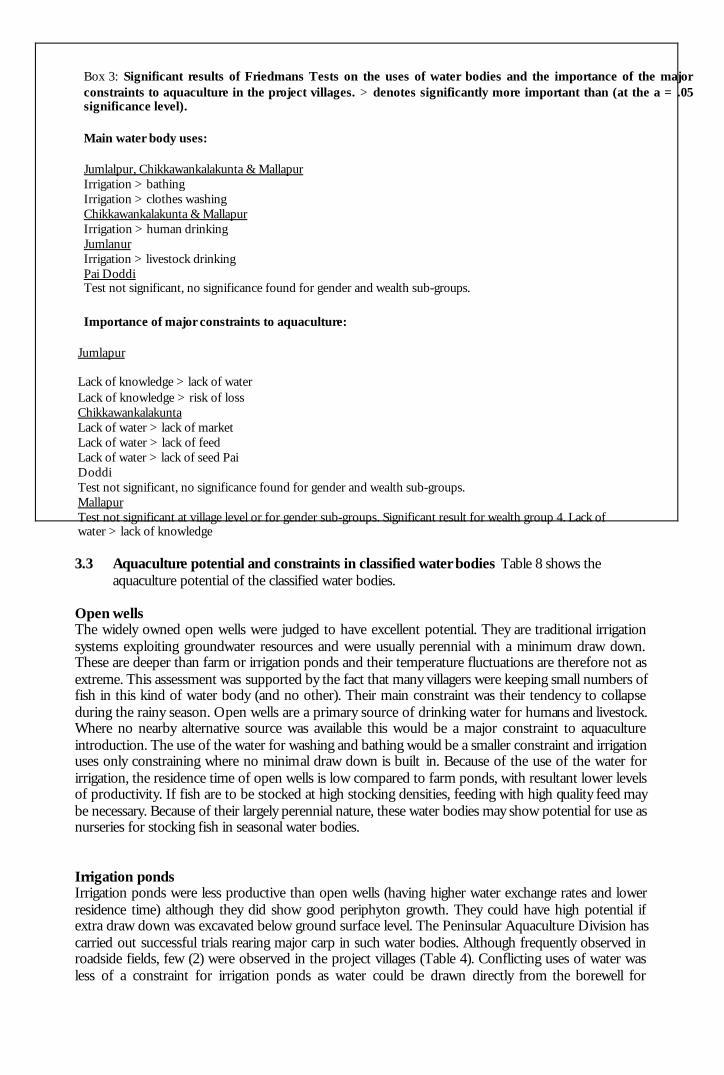
3.3 Aquaculture potential and constraints in classified water bodies Table 8 shows the aquaculture potential of the classified water bodies.
Open wells The widely owned open wells were judged to have excellent potential. They are traditional irrigation systems exploiting groundwater resources and were usually perennial with a minimum draw down. These are deeper than farm or irrigation ponds and their temperature fluctuations are therefore not as extreme. This assessment was supported by the fact that many villagers were keeping small numbers of fish in this kind of water body (and no other). Their main constraint was their tendency to collapse during the rainy season. Open wells are a primary source of drinking water for humans and livestock. Where no nearby alternative source was available this would be a major constraint to aquaculture introduction. The use of the water for washing and bathing would be a smaller constraint and irrigation uses only constraining where no minimal draw down is built in. Because of the use of the water for irrigation, the residence time of open wells is low compared to farm ponds, with resultant lower levels of productivity. If fish are to be stocked at high stocking densities, feeding with high quality feed may be necessary. Because of their largely perennial nature, these water bodies may show potential for use as nurseries for stocking fish in seasonal water bodies. Irrigation ponds Irrigation ponds were less productive than open wells (having higher water exchange rates and lower residence time) although they did show good periphyton growth. They could have high potential if extra draw down was excavated below ground surface level. The Peninsular Aquaculture Division has carried out successful trials rearing major carp in such water bodies. Although frequently observed in roadside fields, few (2) were observed in the project villages (Table 4). Conflicting uses of water was less of a constraint for irrigation ponds as water could be drawn directly from the borewell for
Box 3: Significant results of Friedmans Tests on the uses of water bodies and the importance of the major constraints to aquaculture in the project villages. > denotes significantly more important than (at the a = .05 significance level).
Main water body uses:
Jumlalpur, Chikkawankalakunta & Mallapur Irrigation > bathing Irrigation > clothes washing Chikkawankalakunta & Mallapur Irrigation > human drinking Jumlanur Irrigation > livestock drinking Pai Doddi Test not significant, no significance found for gender and wealth sub-groups.
Importance of major constraints to aquaculture:
Jumlapur
Lack of knowledge > lack of water Lack of knowledge > risk of loss Chikkawankalakunta Lack of water > lack of market Lack of water > lack of feed Lack of water > lack of seed Pai Doddi Test not significant, no significance found for gender and wealth sub-groups. Mallapur Test not significant at village level or for gender sub-groups. Significant result for wealth group 4. Lack of water > lack of knowledge

alternative uses. The potential to manage water exchange is a key strength of both open wells and irrigation ponds.
10
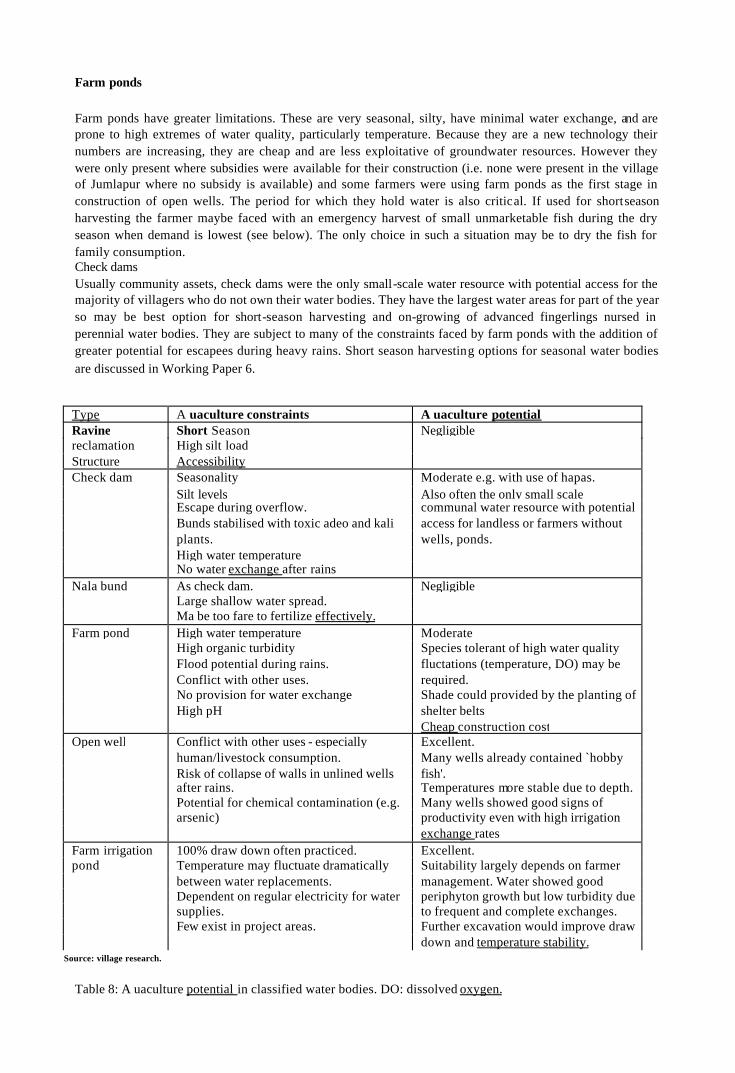
Farm ponds
Farm ponds have greater limitations. These are very seasonal, silty, have minimal water exchange, and are prone to high extremes of water quality, particularly temperature. Because they are a new technology their numbers are increasing, they are cheap and are less exploitative of groundwater resources. However they were only present where subsidies were available for their construction (i.e. none were present in the village of Jumlapur where no subsidy is available) and some farmers were using farm ponds as the first stage in construction of open wells. The period for which they hold water is also critical. If used for shortseason harvesting the farmer maybe faced with an emergency harvest of small unmarketable fish during the dry season when demand is lowest (see below). The only choice in such a situation may be to dry the fish for family consumption. Check dams Usually community assets, check dams were the only small-scale water resource with potential access for the majority of villagers who do not own their water bodies. They have the largest water areas for part of the year so may be best option for short-season harvesting and on-growing of advanced fingerlings nursed in perennial water bodies. They are subject to many of the constraints faced by farm ponds with the addition of greater potential for escapees during heavy rains. Short season harvesting options for seasonal water bodies are discussed in Working Paper 6.
Table 8: A uaculture potential in classified water bodies. DO: dissolved oxygen.
Type A uaculture constraints A uaculture potential Ravine Short Season Negligible reclamation High silt load Structure Accessibility Check dam Seasonality Moderate e.g. with use of hapas.
Silt levels Also often the only small scale Escape during overflow. communal water resource with potential Bunds stabilised with toxic adeo and kali access for landless or farmers without plants. wells, ponds. High water temperature No water exchange after rains
Nala bund As check dam. Negligible Large shallow water spread. Ma be too fare to fertilize effectively.
Farm pond High water temperature Moderate High organic turbidity Species tolerant of high water quality Flood potential during rains. fluctations (temperature, DO) may be Conflict with other uses. required. No provision for water exchange Shade could provided by the planting of High pH shelter belts Cheap construction cost
Open well Conflict with other uses - especially Excellent. human/livestock consumption. Many wells already contained `hobby Risk of collapse of walls in unlined wells fish'. after rains. Temperatures more stable due to depth. Potential for chemical contamination (e.g. Many wells showed good signs of arsenic) productivity even with high irrigation exchange rates
Farm irrigation 100% draw down often practiced. Excellent. pond Temperature may fluctuate dramatically Suitability largely depends on farmer
between water replacements. management. Water showed good Dependent on regular electricity for water periphyton growth but low turbidity due supplies. to frequent and complete exchanges. Few exist in project areas. Further excavation would improve draw down and temperature stability. Source: village research.

References
Cresswell, R. (1993) Aquaculture desk reference. Van Nostrand Rheinhold N.Y., USA. 205 pp.
Haylor, G. (1997) Karnataka Watershed Development Project: Aquaculture Specialist's Report, September 1997. Institute of Aquaculture, University of Stirling, Stirling, Scotland..48pp.
Anderson R. & Tave D. (Eds) (1991). Management of fertilised hatchery ponds. Food Products press London.
CIFA (1996) Workshop on Peninsular aquaculture 21/5/96 Bangalore. Abstracts. Bangalore, India. 35 pp.
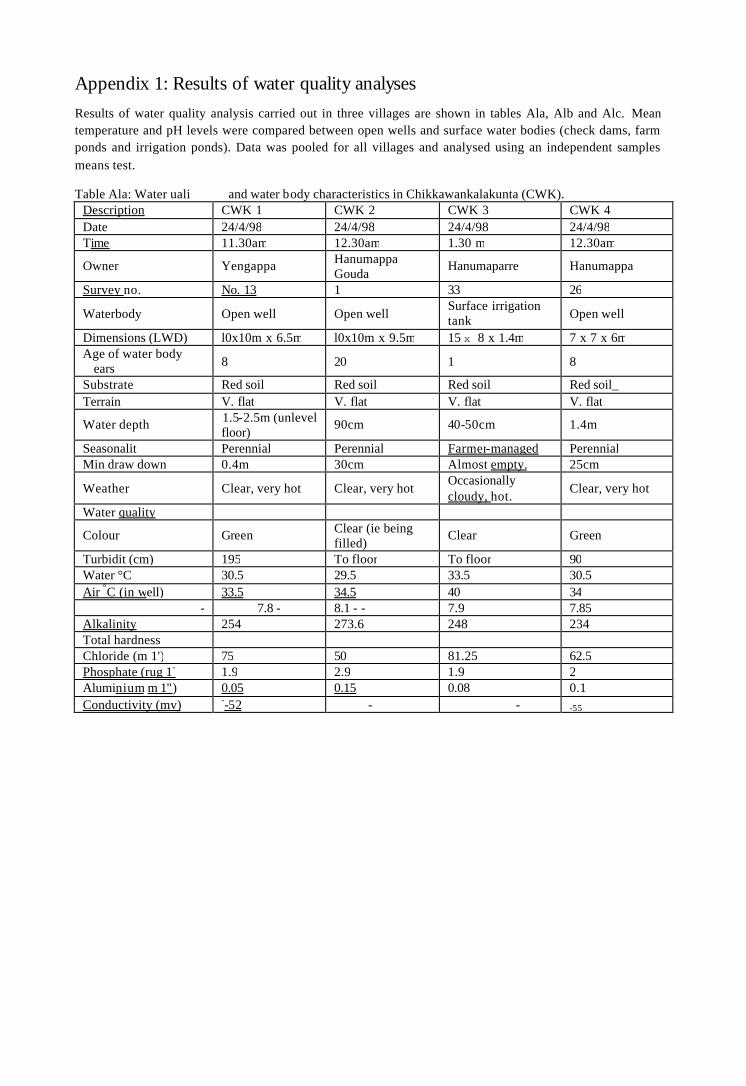
Appendix 1: Results of water quality analyses Results of water quality analysis carried out in three villages are shown in tables Ala, Alb and Alc. Mean temperature and pH levels were compared between open wells and surface water bodies (check dams, farm ponds and irrigation ponds). Data was pooled for all villages and analysed using an independent samples means test.
Table Ala: Water uali and water body characteristics in Chikkawankalakunta (CWK). Description CWK 1 CWK 2 CWK 3 CWK 4 Date 24/4/98 24/4/98 24/4/98 24/4/98 Time 11.30am 12.30am 1.30 m 12.30am
Owner Yengappa Hanumappa Gouda
Hanumaparre Hanumappa
Survey no. No. 13 1 33 26
Waterbody Open well Open well Surface irrigation tank Open well
Dimensions (LWD) l0x10m x 6.5m l0x10m x 9.5m 15 x 8 x 1.4m 7 x 7 x 6m Age of water body
ears 8 20 1 8
Substrate Red soil Red soil Red soil Red soil_ Terrain V. flat V. flat V. flat V. flat
Water depth 1.5-2.5m (unlevel floor)
90cm 40-50cm 1.4m
Seasonalit Perennial Perennial Farmer-managed Perennial Min draw down 0.4m 30cm Almost empty. 25cm
Weather Clear, very hot Clear, very hot Occasionally cloudy, hot.
Clear, very hot
Water quality
Colour Green Clear (ie being filled)
Clear Green
Turbidit (cm) 195 To floor To floor 90 Water °C 30.5 29.5 33.5 30.5 Air °C (in well) 33.5 34.5 40 34
- 7.8 - 8.1 - - 7.9 7.85 Alkalinity 254 273.6 248 234 Total hardness Chloride (m 1') 75 50 81.25 62.5 Phosphate (rug 1- 1.9 2.9 1.9 2 Aluminium m 1") 0.05 0.15 0.08 0.1 Conductivity (mv) --52 - - -55
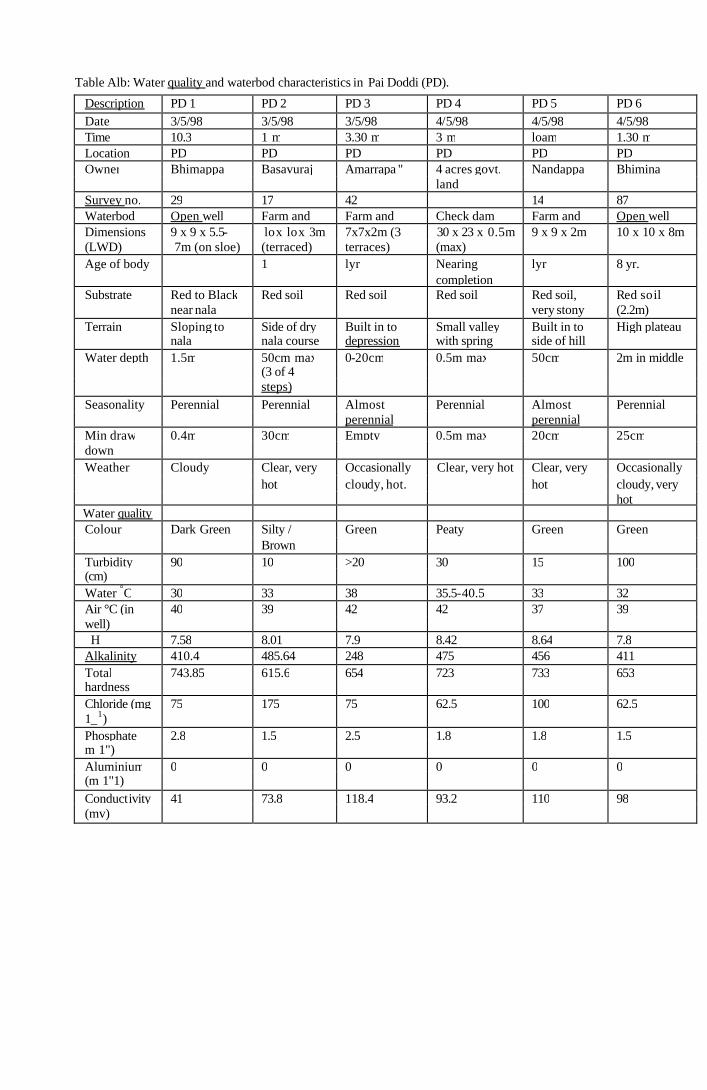
Table Alb: Water quality and waterbod characteristics in Pai Doddi (PD).
Description PD 1 PD 2 PD 3 PD 4 PD 5 PD 6 Date 3/5/98 3/5/98 3/5/98 4/5/98 4/5/98 4/5/98 Time 10.3 1 m 3.30 m 3 m loam 1.30 m Location PD PD PD PD PD PD Owner Bhimappa Basavuraj Amarrapa " 4 acres govt. Nandappa Bhimina
land Survey no. 29 17 42 14 87 Waterbod Open well Farm and Farm and Check dam Farm and Open well Dimensions 9 x 9 x 5.5- lox lox 3m 7x7x2m (3 30 x 23 x 0.5m 9 x 9 x 2m 10 x 10 x 8m (LWD) 7m (on sloe) (terraced) terraces) (max) Age of body 1 lyr Nearing lyr 8 yr.
completion Substrate Red to Black Red soil Red soil Red soil Red soil, Red soil
near nala very stony (2.2m) Terrain Sloping to Side of dry Built in to Small valley Built in to High plateau
nala nala course depression with spring side of hill Water depth 1.5m 50cm max 0-20cm 0.5m max 50cm 2m in middle
(3 of 4 steps)
Seasonality Perennial Perennial Almost Perennial Almost Perennial perennial perennial
Min draw 0.4m 30cm Empty 0.5m max 20cm 25cm down Weather Cloudy Clear, very Occasionally Clear, very hot Clear, very Occasionally
hot cloudy, hot. hot cloudy, very hot
Water quality Colour Dark Green Silty / Green Peaty Green Green
Brown Turbidity 90 10 >20 30 15 100 (cm) Water °C 30 33 38 35.5-40.5 33 32 Air °C (in 40 39 42 42 37 39 well) H 7.58 8.01 7.9 8.42 8.64 7.8
Alkalinity 410.4 485.64 248 475 456 411 Total 743.85 615.6 654 723 733 653 hardness Chloride (mg 75 175 75 62.5 100 62.5 1_1) Phosphate 2.8 1.5 2.5 1.8 1.8 1.5 m 1") Aluminium 0 0 0 0 0 0 (m 1"1) Conductivity 41 73.8 118.4 93.2 110 98 (mv)
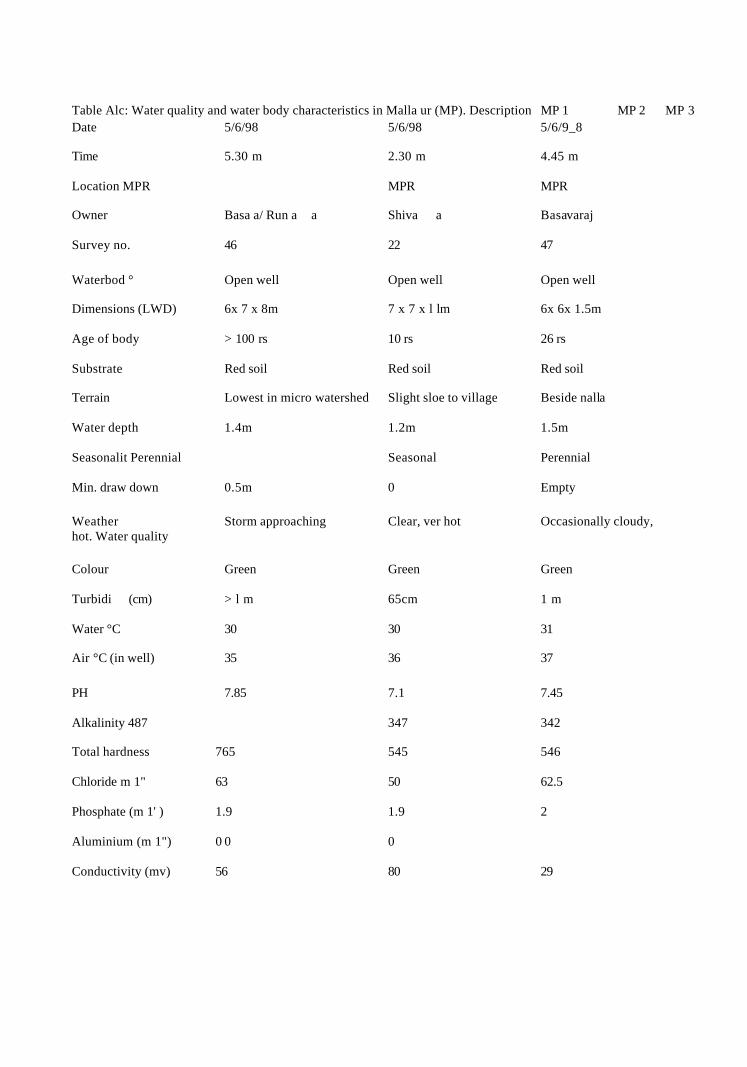
Table Alc: Water quality and water body characteristics in Malla ur (MP). Description MP 1 MP 2 MP 3 Date 5/6/98 5/6/98 5/6/9_8
Time 5.30 m 2.30 m 4.45 m
Location MPR MPR MPR
Owner Basa a/ Run a a Shiva a Basavaraj
Survey no. 46 22 47
Waterbod ° Open well Open well Open well
Dimensions (LWD) 6x 7 x 8m 7 x 7 x l lm 6x 6x 1.5m
Age of body > 100 rs 10 rs 26 rs
Substrate Red soil Red soil Red soil
Terrain Lowest in micro watershed Slight sloe to village Beside nalla
Water depth 1.4m 1.2m 1.5m
Seasonalit Perennial Seasonal Perennial
Min. draw down 0.5m 0 Empty
Weather Storm approaching Clear, ver hot Occasionally cloudy, hot. Water quality
Colour Green Green Green
Turbidi (cm) > l m 65cm 1 m
Water °C 30 30 31
Air °C (in well) 35 36 37
PH 7.85 7.1 7.45
Alkalinity 487 347 342
Total hardness 765 545 546
Chloride m 1" 63 50 62.5
Phosphate (m 1' ) 1.9 1.9 2
Aluminium (m 1") 0 0 0
Conductivity (mv) 56 80 29

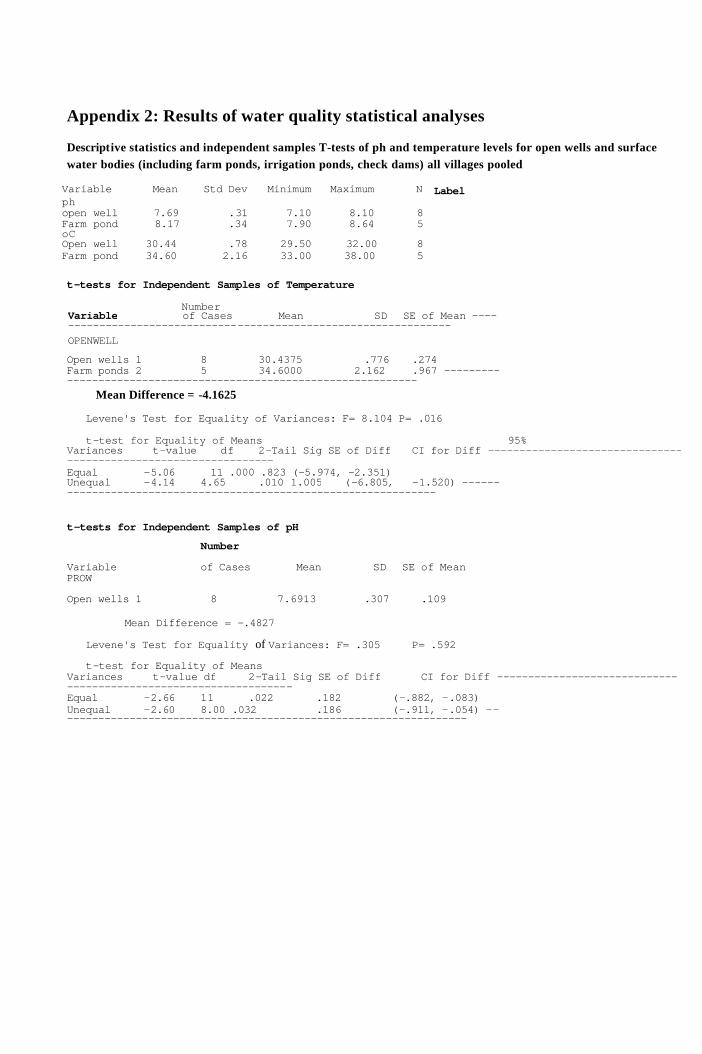
Appendix 2: Results of water quality statistical analyses
Descriptive statistics and independent samples T-tests of ph and temperature levels for open wells and surface water bodies (including farm ponds, irrigation ponds, check dams) all villages pooled
Variable Mean Std Dev Minimum Maximum Nph open well 7.69 .31 7.10 8.10 8Farm pond 8.17 .34 7.90 8.64 5oC Open well 30.44 .78 29.50 32.00 8Farm pond 34.60 2.16 33.00 38.00 5
Label
t-tests for Independent Samples of Temperature
Number Variable of Cases Mean SD SE of Mean ----------------------------------------------------------------- OPENWELL
Open wells 1 8 30.4375 .776 .274 Farm ponds 2 5 34.6000 2.162 .967 -----------------------------------------------------------------
Mean Difference = -4.1625
Levene's Test for Equality of Variances: F= 8.104 P= .016
t-test for Equality of Means 95% Variances t-value df 2-Tail Sig SE of Diff CI for Diff ---------------------------------------------------------------- Equal -5.06 11 .000 .823 (-5.974, -2.351) Unequal -4.14 4.65 .010 1.005 (-6.805, -1.520) -----------------------------------------------------------------
t-tests for Independent Samples of pH
Number
Variable of Cases Mean SD SE of Mean PROW
Open wells 1 8 7.6913 .307 .109
Farm Ponds 2 5 8.1740 .337 .151 -------Mean Difference = -.4827
Levene's Test for Equality of Variances: F= .305 P= .592
t-test for Equality of Means 95% Variances t-value df 2-Tail Sig SE of Diff CI for Diff -----------------------------
------------------------------------ Equal -2.66 11 .022 .182 (-.882, -.083) Unequal -2.60 8.00 .032 .186 (-.911, -.054) ------------------------------------------------------------------
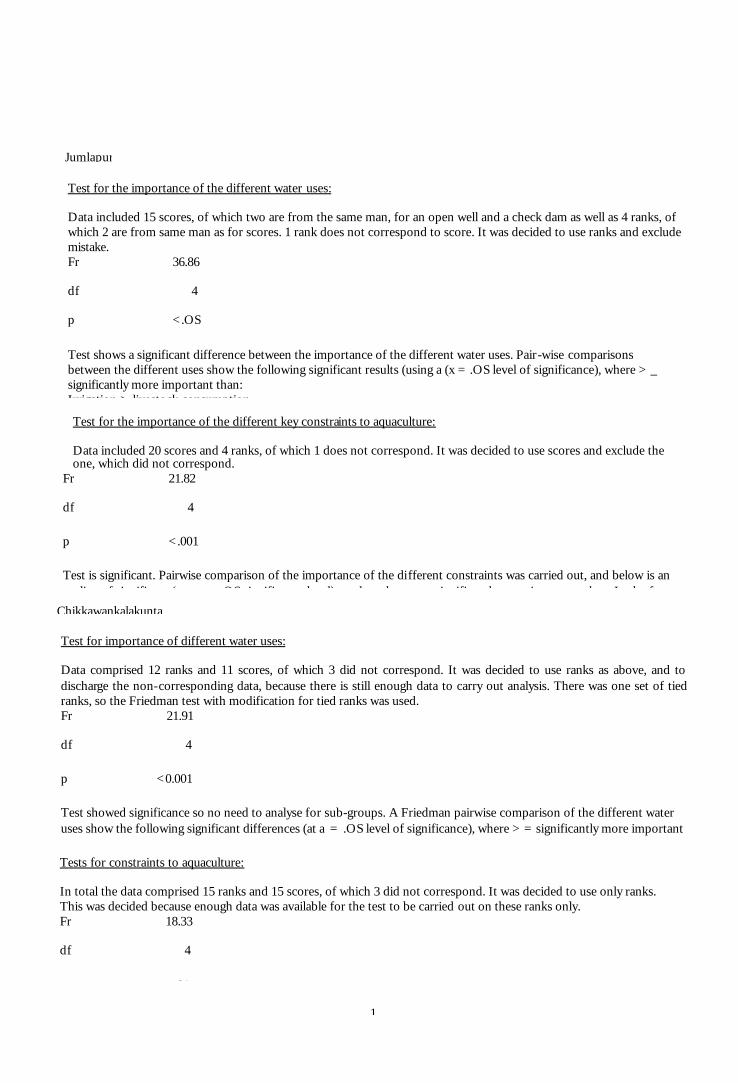
Jumlapur
Test for the importance of the different water uses:
Data included 15 scores, of which two are from the same man, for an open well and a check dam as well as 4 ranks, of which 2 are from same man as for scores. 1 rank does not correspond to score. It was decided to use ranks and exclude mistake. Fr 36.86
df 4
p <.OS
Test shows a significant difference between the importance of the different water uses. Pair-wise comparisons between the different uses show the following significant results (using a (x = .OS level of significance), where > _ significantly more important than: Irrigation > livestock consumption
Test for the importance of the different key constraints to aquaculture:
Data included 20 scores and 4 ranks, of which 1 does not correspond. It was decided to use scores and exclude the one, which did not correspond.
Fr 21.82
df 4
p <.001
Test is significant. Pairwise comparison of the importance of the different constraints was carried out, and below is an outline of significant (at a a = .OS significance level) results, where > = significantly more important than: Lack of
Chikkawankalakunta
Test for importance of different water uses:
Data comprised 12 ranks and 11 scores, of which 3 did not correspond. It was decided to use ranks as above, and to discharge the non-corresponding data, because there is still enough data to carry out analysis. There was one set of tied ranks, so the Friedman test with modification for tied ranks was used. Fr 21.91
df 4
p <0.001
Test showed significance so no need to analyse for sub-groups. A Friedman pairwise comparison of the different water uses show the following significant differences (at a = .OS level of significance), where > = significantly more important than: Tests for constraints to aquaculture:
In total the data comprised 15 ranks and 15 scores, of which 3 did not correspond. It was decided to use only ranks. This was decided because enough data was available for the test to be carried out on these ranks only. Fr 18.33
df 4
p <.01
1

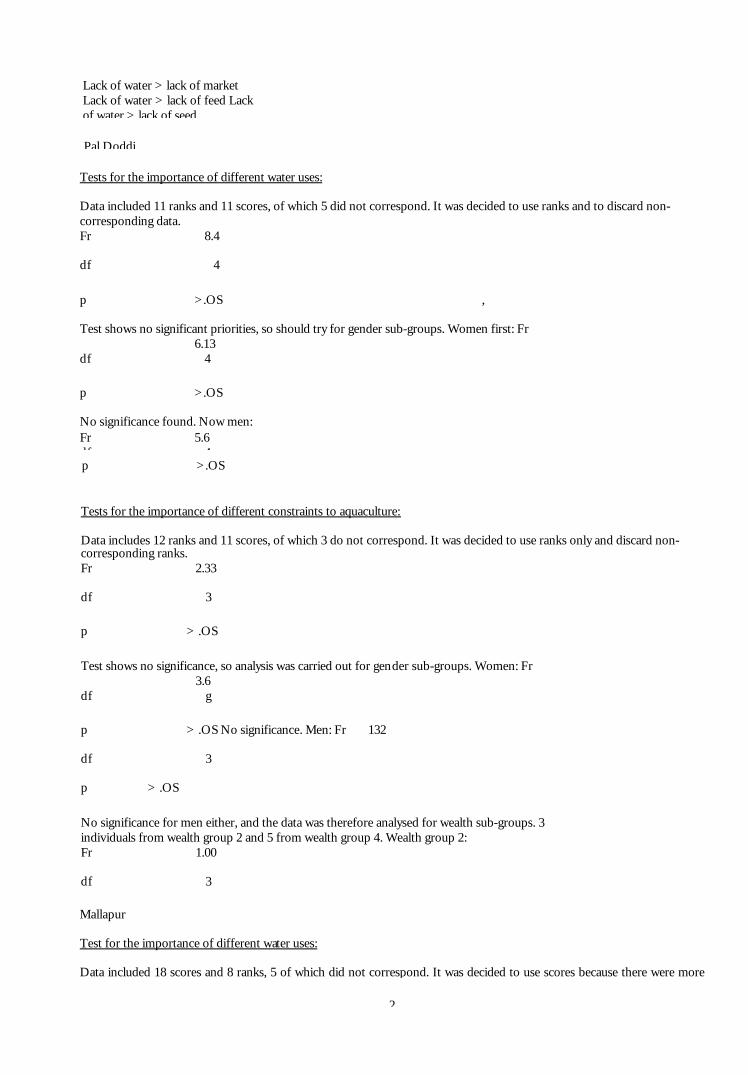
Lack of water > lack of market Lack of water > lack of feed Lack of water > lack of seed
Pal Doddi
Tests for the importance of different water uses:
Data included 11 ranks and 11 scores, of which 5 did not correspond. It was decided to use ranks and to discard non-corresponding data. Fr 8.4
df 4
p >.OS ,
Test shows no significant priorities, so should try for gender sub-groups. Women first: Fr 6.13 df 4
p >.OS
No significance found. Now men: Fr 5.6 df 4 p >.OS
Tests for the importance of different constraints to aquaculture:
Data includes 12 ranks and 11 scores, of which 3 do not correspond. It was decided to use ranks only and discard non-corresponding ranks. Fr 2.33
df 3
p > .OS
Test shows no significance, so analysis was carried out for gender sub-groups. Women: Fr 3.6 df g
p > .OS No significance. Men: Fr 132
df 3
p > .OS
No significance for men either, and the data was therefore analysed for wealth sub-groups. 3 individuals from wealth group 2 and 5 from wealth group 4. Wealth group 2: Fr 1.00
df 3
Mallapur
Test for the importance of different water uses:
Data included 18 scores and 8 ranks, 5 of which did not correspond. It was decided to use scores because there were more
2
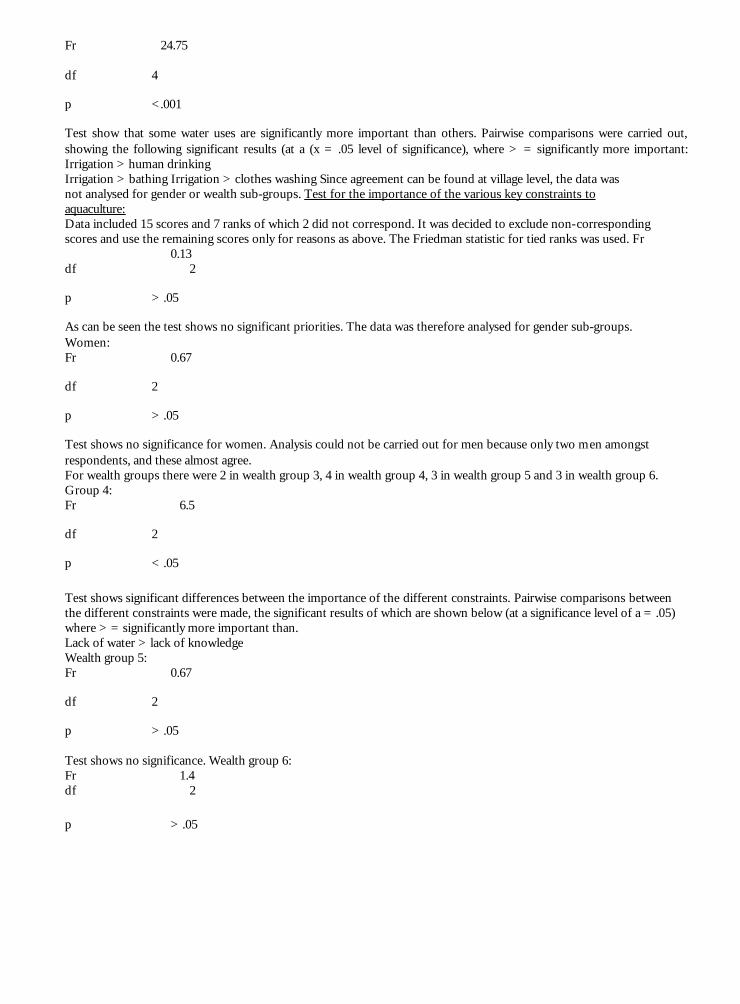
Fr 24.75
df 4
p <.001
Test show that some water uses are significantly more important than others. Pairwise comparisons were carried out, showing the following significant results (at a (x = .05 level of significance), where > = significantly more important: Irrigation > human drinking Irrigation > bathing Irrigation > clothes washing Since agreement can be found at village level, the data was not analysed for gender or wealth sub-groups. Test for the importance of the various key constraints to aquaculture: Data included 15 scores and 7 ranks of which 2 did not correspond. It was decided to exclude non-corresponding scores and use the remaining scores only for reasons as above. The Friedman statistic for tied ranks was used. Fr 0.13 df 2
p > .05
As can be seen the test shows no significant priorities. The data was therefore analysed for gender sub-groups. Women: Fr 0.67
df 2
p > .05
Test shows no significance for women. Analysis could not be carried out for men because only two men amongst respondents, and these almost agree. For wealth groups there were 2 in wealth group 3, 4 in wealth group 4, 3 in wealth group 5 and 3 in wealth group 6. Group 4: Fr 6.5
df 2
p < .05
Test shows significant differences between the importance of the different constraints. Pairwise comparisons between the different constraints were made, the significant results of which are shown below (at a significance level of a = .05) where > = significantly more important than. Lack of water > lack of knowledge Wealth group 5: Fr 0.67
df 2
p > .05
Test shows no significance. Wealth group 6: Fr 1.4 df 2
p > .05