Embed Size (px)
Citation preview
24
Working Paper no. 74 - Development as State-making -
POVERTY IS NOT BEING REDUCED IN MOZAMBIQUE
Benedito Cunguara
Universität für Bodenkultur, Vienna Joseph Hanlon
Crisis States Research Centre
June 2010
Crisis States Working Papers Series No.2 ISSN 1749-1797 (print) ISSN 1749-1800 (online) Copyright © B. Cunguara and J. Hanlon, 2010
1
Crisis States Research Centre
Poverty is not being reduced in Mozambique
Benedito Cunguara (Universität für Bodenkultur, Vienna) Joseph Hanlon (Crisis States Research Centre)
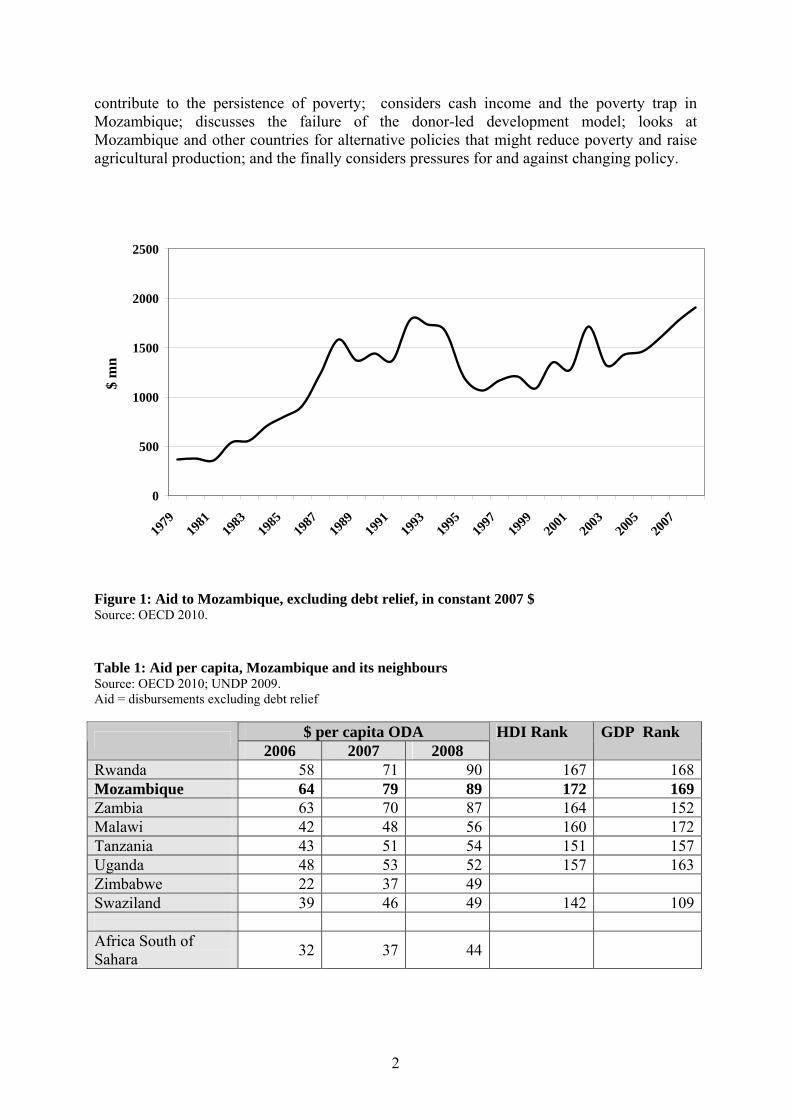
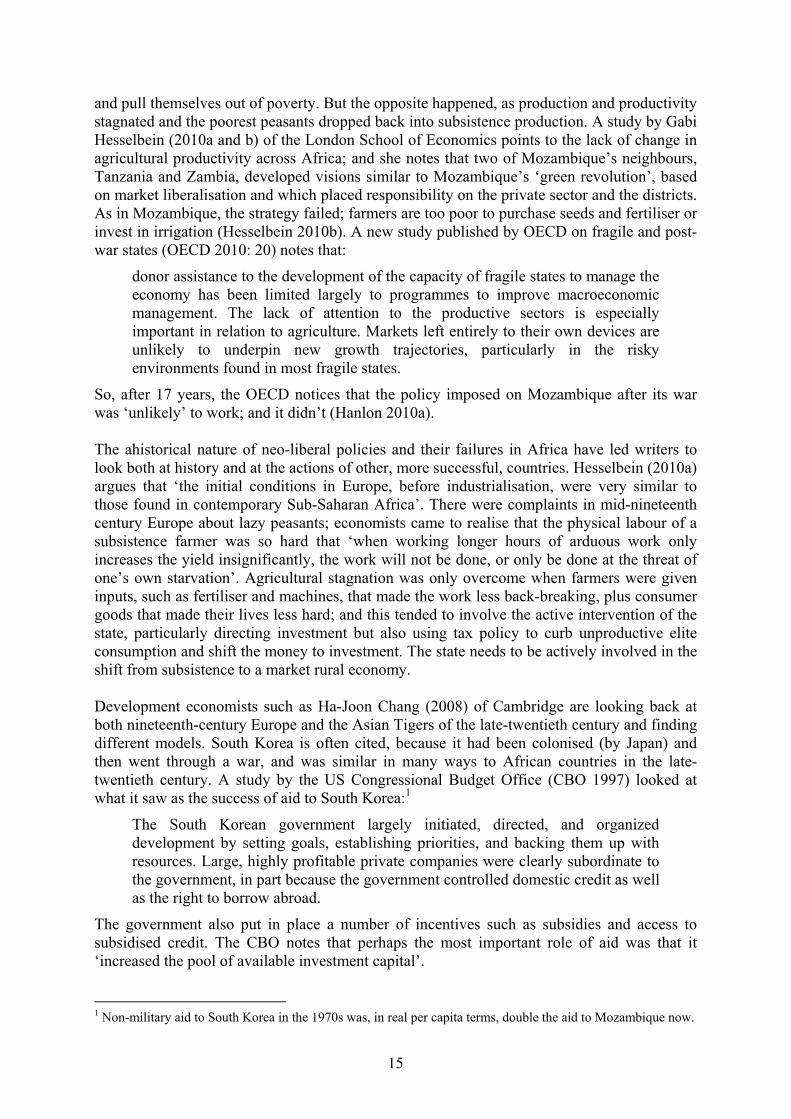
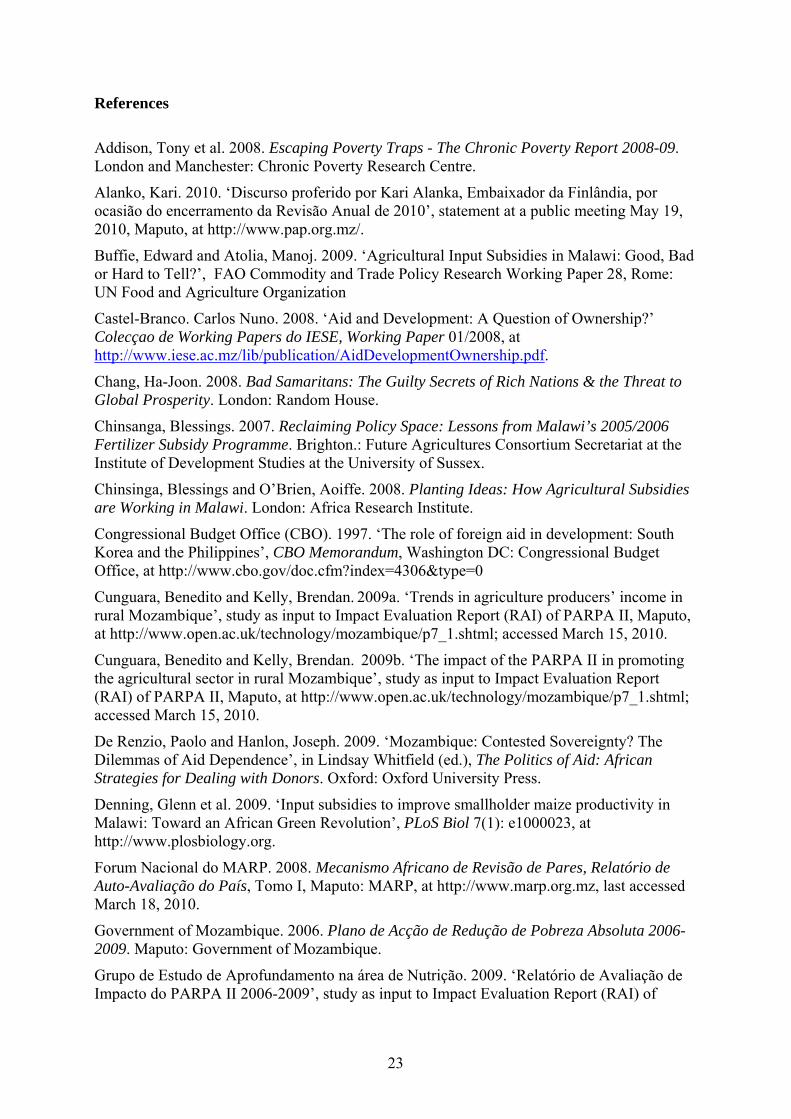
Mozambique remains one of the poorest countries in the world, with a GDP rank of 169 and a Human Development Index of 172 (UNDP 2009). Trying to recover after nearly three decades of war, it became a donor darling, and aid has been rising steadily for the past decade (see Figure 1). Mozambique receives significantly more aid than neighbours at a similar level (see Table 1) – Malawi (GDP rank 172, HDI 160) and Tanzania (GDP 157, HDI 151) receive only 60 percent per capita of the aid of Mozambique. This may be because Mozambique is one of the few countries to be loyally following a neo-liberal, free market development policy and is apparently also reducing poverty (Hanlon and Smart 2008; De Renzio and Hanlon 2009). Both Malawi and Tanzania have publicly opposed donor economic policies. A national family-consumption survey (IAF, Inquérito aos Agregados Familiares) in 1996-97 showed that 69 percent of the population lived below the poverty line. A similar study six years later offered two alternative figures: 63 percent based on the same poverty line; or 54 percent based on changed consumption patterns which effectively lowered the poverty line (MPF/IFPRI/PU, 2004). Poverty lines were based on food baskets; between the two surveys, poor people switched to cheaper, lower quality food, which, it was claimed, allowed the poverty line to be lowered. Perhaps not surprisingly, government and donors accepted the lower percentage, which appeared to show a dramatic fall in poverty in only six years. In keeping with this, Mozambique’s Poverty Reduction Strategy Paper, the Action Plan to Reduce Absolute Poverty 2006-2009 (Plano de Acção para a Redução da Pobreza Absoluta, PARPA II), called for a further cut to 45 percent by 2009. Some of us argued that the higher poverty figure was more realistic, because the reduction in the number of people below the poverty line came about mainly by lowering the line, and because no other survey showed such a dramatic fall in poverty (Hanlon and Smart 2008: 61). This provoked a fierce debate with the authors of the IAF report (Savana, January 25, 2008). The 45 percent target has proved a hostage to fortune. Both donors and government staked their prestige on a continuing huge fall in poverty, but the National Agricultural Survey (Trabalho de Inquérito Agrícola, TIA), a nationally representative household-income survey, indicates that far from declining, poverty is actually increasing, as is the gap between rich and poor. Officially, 70 percent of the Mozambican population is rural and agriculture is the predominant economic activity in Mozambique. The smallholder sector accounts for 99 percent of all farms, which means that the further reduction in poverty called for in PARPA II is dependent on enhancing farmers’ incomes. PARPA II recognises this and prioritises agricultural development to increase rural incomes and reduce absolute poverty. PARPA II calls for a transformation of agriculture through the promotion of agrarian services, and increased productivity and production. We argue here that this has not happened. In this paper, we first look at data sources, then consider what they show about changes in poverty and income. The paper continues by pointing to the lack of changes in farming, which
2
contribute to the persistence of poverty; considers cash income and the poverty trap in Mozambique; discusses the failure of the donor-led development model; looks at Mozambique and other countries for alternative policies that might reduce poverty and raise agricultural production; and the finally considers pressures for and against changing policy.
0
500
1000
1500
2000
2500
1979
1981
1983
1985
1987
1989
1991
1993
1995
1997
1999
2001
2003
2005
2007
$ m
n
Figure 1: Aid to Mozambique, excluding debt relief, in constant 2007 $ Source: OECD 2010. Table 1: Aid per capita, Mozambique and its neighbours Source: OECD 2010; UNDP 2009. Aid = disbursements excluding debt relief
$ per capita ODA 2006 2007 2008 HDI Rank GDP Rank
Rwanda 58 71 90 167 168Mozambique 64 79 89 172 169Zambia 63 70 87 164 152Malawi 42 48 56 160 172Tanzania 43 51 54 151 157Uganda 48 53 52 157 163Zimbabwe 22 37 49 Swaziland 39 46 49 142 109 Africa South of Sahara 32 37 44
3
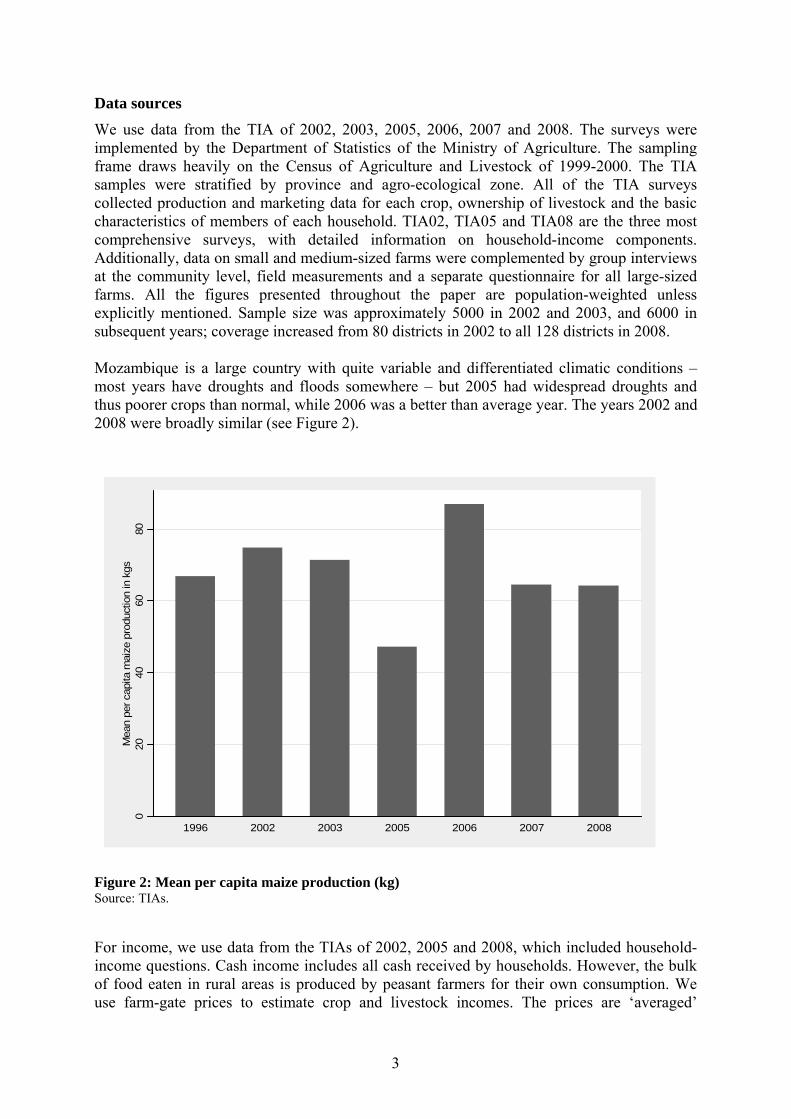
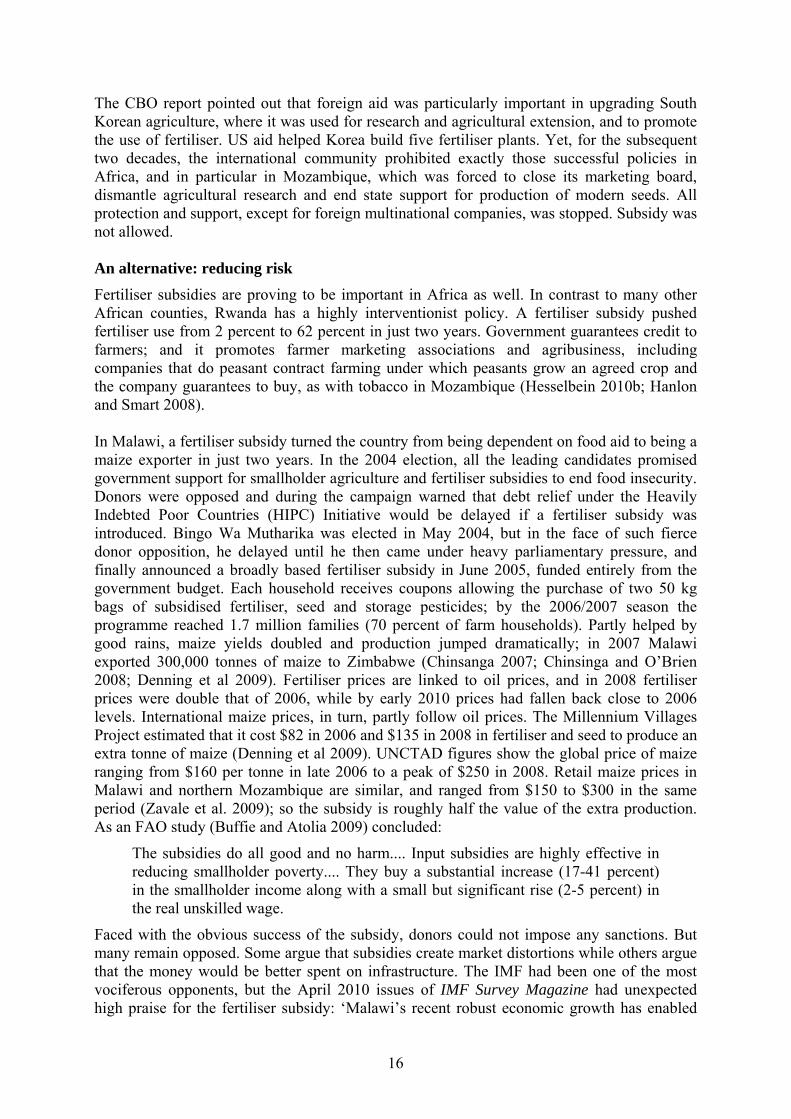
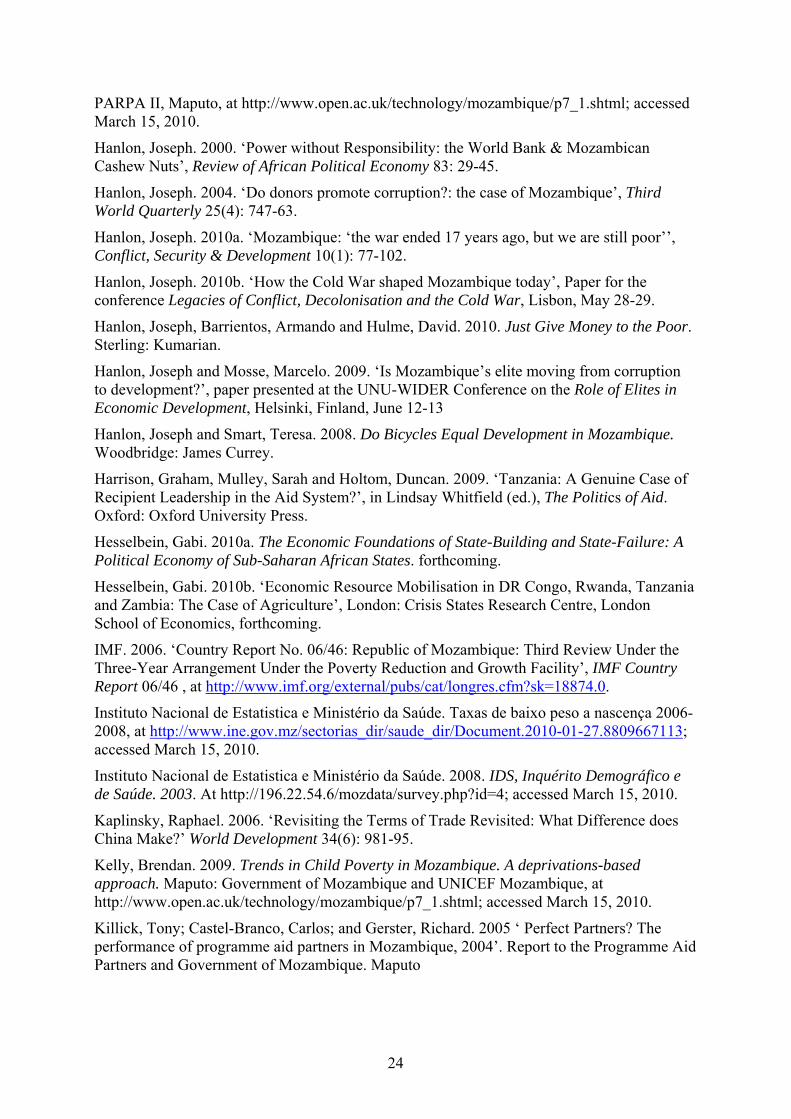
Data sources We use data from the TIA of 2002, 2003, 2005, 2006, 2007 and 2008. The surveys were implemented by the Department of Statistics of the Ministry of Agriculture. The sampling frame draws heavily on the Census of Agriculture and Livestock of 1999-2000. The TIA samples were stratified by province and agro-ecological zone. All of the TIA surveys collected production and marketing data for each crop, ownership of livestock and the basic characteristics of members of each household. TIA02, TIA05 and TIA08 are the three most comprehensive surveys, with detailed information on household-income components. Additionally, data on small and medium-sized farms were complemented by group interviews at the community level, field measurements and a separate questionnaire for all large-sized farms. All the figures presented throughout the paper are population-weighted unless explicitly mentioned. Sample size was approximately 5000 in 2002 and 2003, and 6000 in subsequent years; coverage increased from 80 districts in 2002 to all 128 districts in 2008. Mozambique is a large country with quite variable and differentiated climatic conditions – most years have droughts and floods somewhere – but 2005 had widespread droughts and thus poorer crops than normal, while 2006 was a better than average year. The years 2002 and 2008 were broadly similar (see Figure 2).
Figure 2: Mean per capita maize production (kg) Source: TIAs. For income, we use data from the TIAs of 2002, 2005 and 2008, which included household-income questions. Cash income includes all cash received by households. However, the bulk of food eaten in rural areas is produced by peasant farmers for their own consumption. We use farm-gate prices to estimate crop and livestock incomes. The prices are ‘averaged’
020
4060
80M
ean
per c
apita
mai
ze p
rodu
ctio
n in
kgs
1996 2002 2003 2005 2006 2007 2008
4
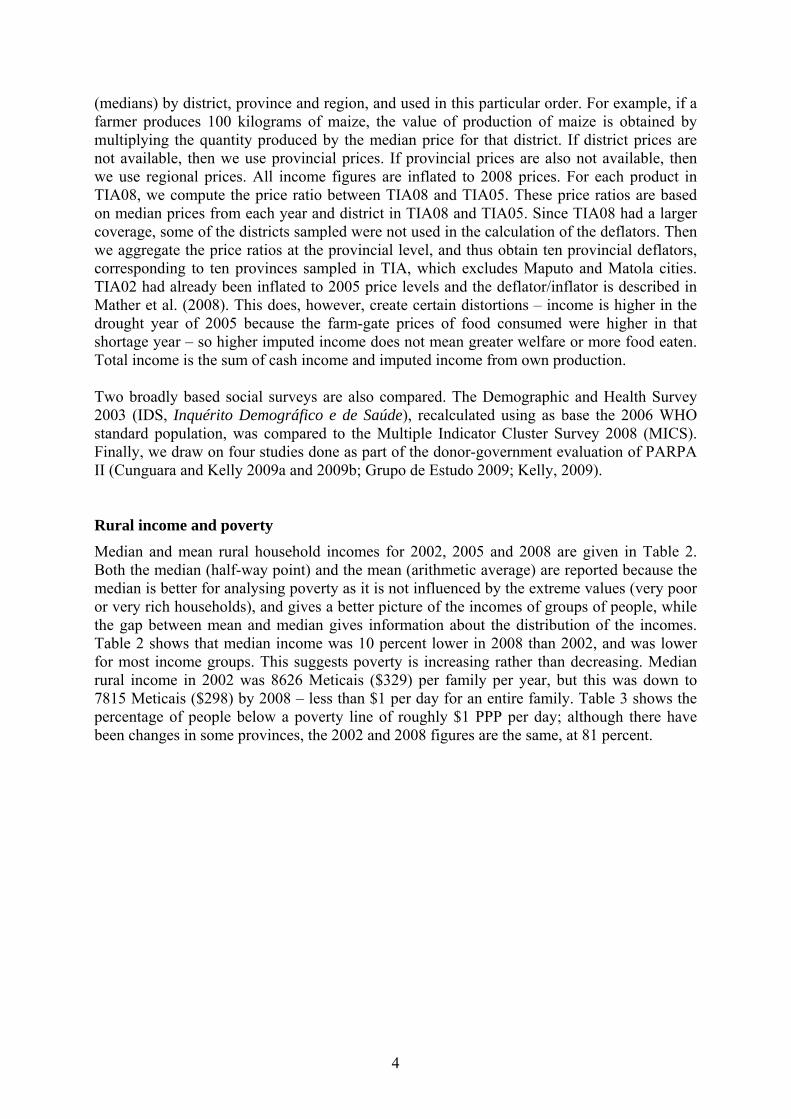
(medians) by district, province and region, and used in this particular order. For example, if a farmer produces 100 kilograms of maize, the value of production of maize is obtained by multiplying the quantity produced by the median price for that district. If district prices are not available, then we use provincial prices. If provincial prices are also not available, then we use regional prices. All income figures are inflated to 2008 prices. For each product in TIA08, we compute the price ratio between TIA08 and TIA05. These price ratios are based on median prices from each year and district in TIA08 and TIA05. Since TIA08 had a larger coverage, some of the districts sampled were not used in the calculation of the deflators. Then we aggregate the price ratios at the provincial level, and thus obtain ten provincial deflators, corresponding to ten provinces sampled in TIA, which excludes Maputo and Matola cities. TIA02 had already been inflated to 2005 price levels and the deflator/inflator is described in Mather et al. (2008). This does, however, create certain distortions – income is higher in the drought year of 2005 because the farm-gate prices of food consumed were higher in that shortage year – so higher imputed income does not mean greater welfare or more food eaten. Total income is the sum of cash income and imputed income from own production. Two broadly based social surveys are also compared. The Demographic and Health Survey 2003 (IDS, Inquérito Demográfico e de Saúde), recalculated using as base the 2006 WHO standard population, was compared to the Multiple Indicator Cluster Survey 2008 (MICS). Finally, we draw on four studies done as part of the donor-government evaluation of PARPA II (Cunguara and Kelly 2009a and 2009b; Grupo de Estudo 2009; Kelly, 2009). Rural income and poverty Median and mean rural household incomes for 2002, 2005 and 2008 are given in Table 2. Both the median (half-way point) and the mean (arithmetic average) are reported because the median is better for analysing poverty as it is not influenced by the extreme values (very poor or very rich households), and gives a better picture of the incomes of groups of people, while the gap between mean and median gives information about the distribution of the incomes. Table 2 shows that median income was 10 percent lower in 2008 than 2002, and was lower for most income groups. This suggests poverty is increasing rather than decreasing. Median rural income in 2002 was 8626 Meticais ($329) per family per year, but this was down to 7815 Meticais ($298) by 2008 – less than $1 per day for an entire family. Table 3 shows the percentage of people below a poverty line of roughly $1 PPP per day; although there have been changes in some provinces, the 2002 and 2008 figures are the same, at 81 percent.
5
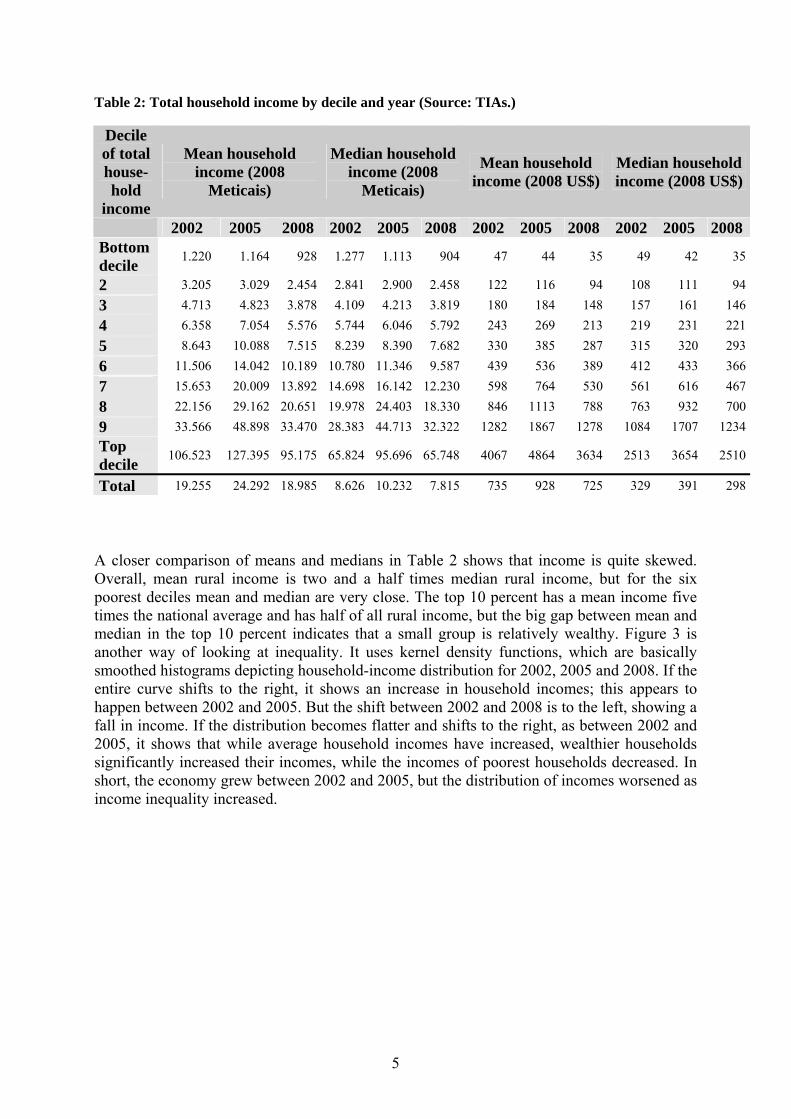
Table 2: Total household income by decile and year (Source: TIAs.)
Decile of total house-hold
income
Mean household income (2008
Meticais)
Median household income (2008
Meticais)
Mean household income (2008 US$)
Median household income (2008 US$)
2002 2005 2008 2002 2005 2008 2002 2005 2008 2002 2005 2008Bottom decile 1.220 1.164 928 1.277 1.113 904 47 44 35 49 42 35
2 3.205 3.029 2.454 2.841 2.900 2.458 122 116 94 108 111 943 4.713 4.823 3.878 4.109 4.213 3.819 180 184 148 157 161 1464 6.358 7.054 5.576 5.744 6.046 5.792 243 269 213 219 231 2215 8.643 10.088 7.515 8.239 8.390 7.682 330 385 287 315 320 2936 11.506 14.042 10.189 10.780 11.346 9.587 439 536 389 412 433 3667 15.653 20.009 13.892 14.698 16.142 12.230 598 764 530 561 616 4678 22.156 29.162 20.651 19.978 24.403 18.330 846 1113 788 763 932 7009 33.566 48.898 33.470 28.383 44.713 32.322 1282 1867 1278 1084 1707 1234Top decile 106.523 127.395 95.175 65.824 95.696 65.748 4067 4864 3634 2513 3654 2510
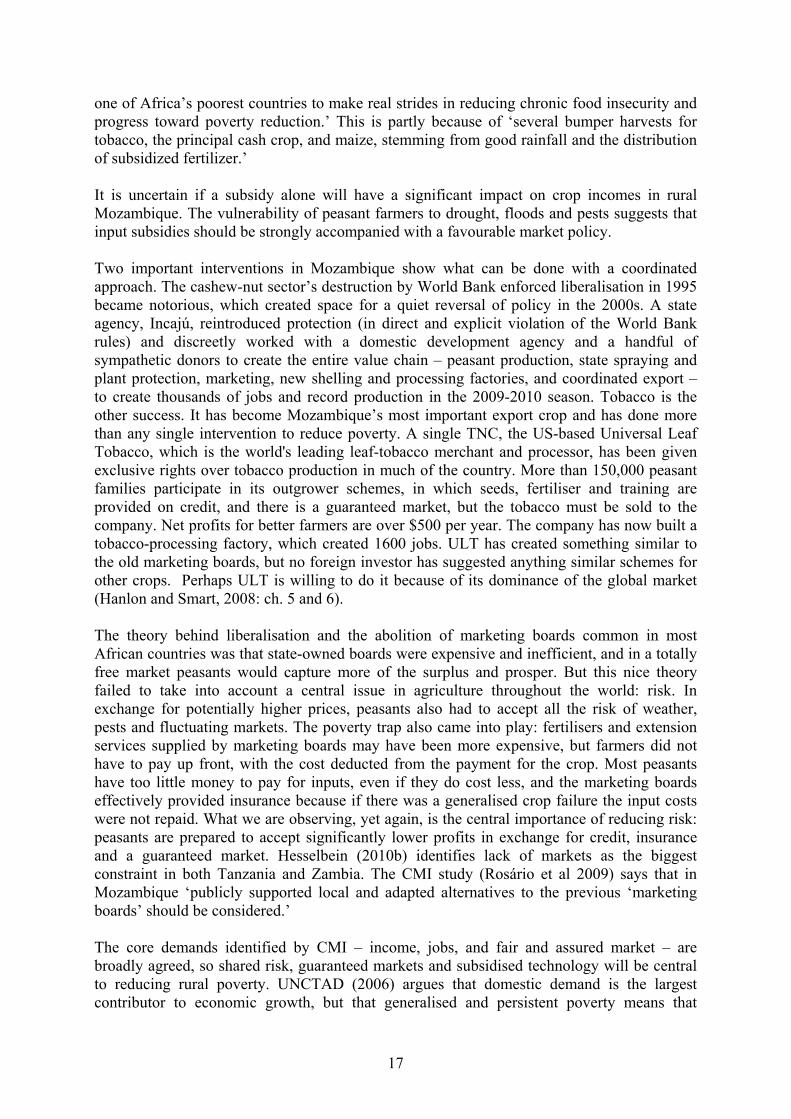
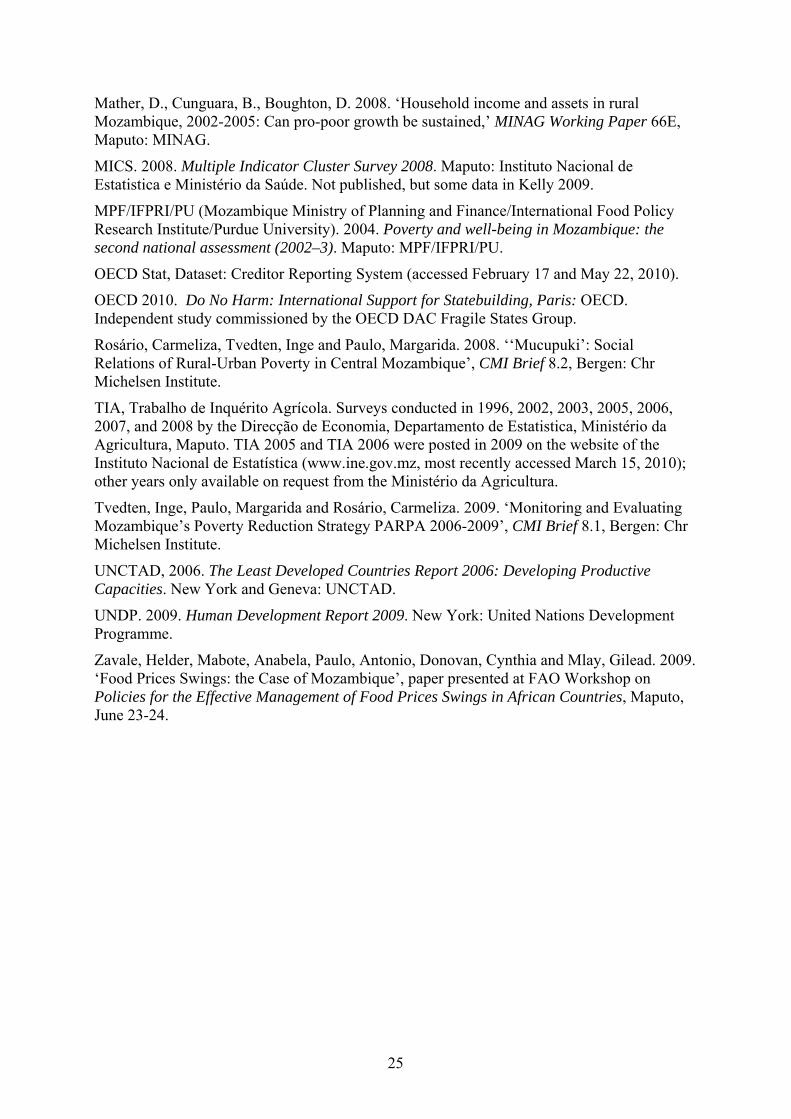
Total 19.255 24.292 18.985 8.626 10.232 7.815 735 928 725 329 391 298 A closer comparison of means and medians in Table 2 shows that income is quite skewed. Overall, mean rural income is two and a half times median rural income, but for the six poorest deciles mean and median are very close. The top 10 percent has a mean income five times the national average and has half of all rural income, but the big gap between mean and median in the top 10 percent indicates that a small group is relatively wealthy. Figure 3 is another way of looking at inequality. It uses kernel density functions, which are basically smoothed histograms depicting household-income distribution for 2002, 2005 and 2008. If the entire curve shifts to the right, it shows an increase in household incomes; this appears to happen between 2002 and 2005. But the shift between 2002 and 2008 is to the left, showing a fall in income. If the distribution becomes flatter and shifts to the right, as between 2002 and 2005, it shows that while average household incomes have increased, wealthier households significantly increased their incomes, while the incomes of poorest households decreased. In short, the economy grew between 2002 and 2005, but the distribution of incomes worsened as income inequality increased.
6
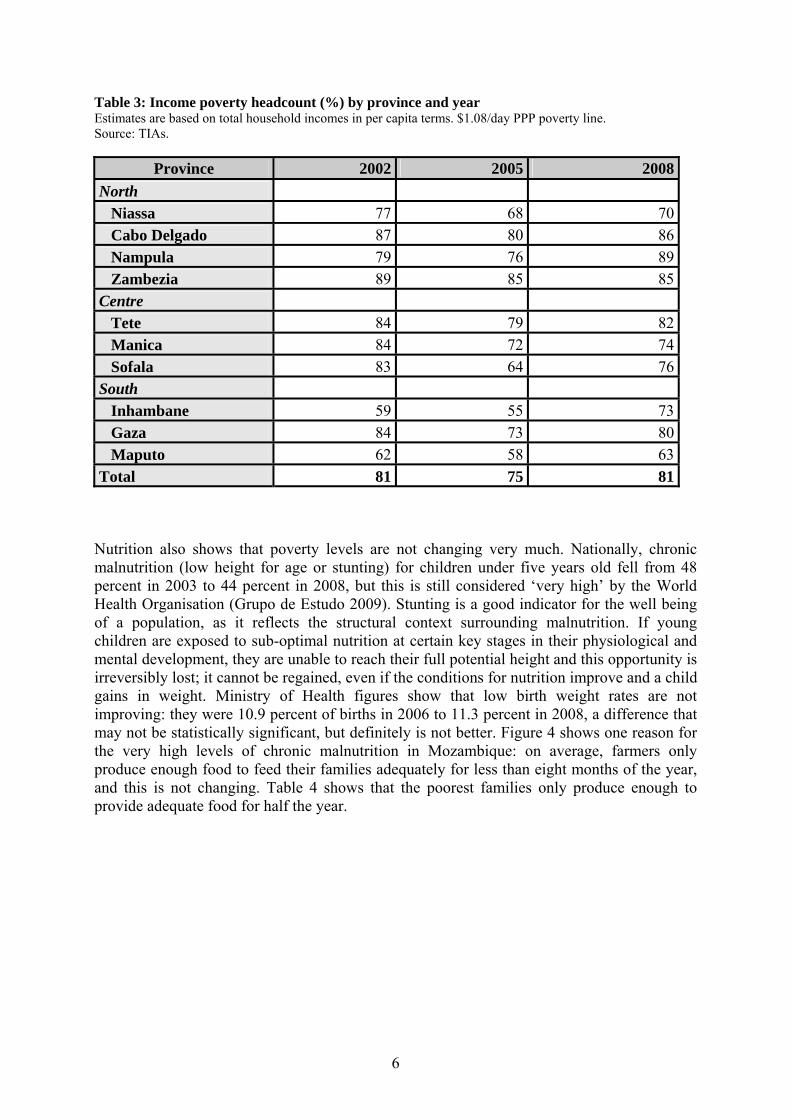
Table 3: Income poverty headcount (%) by province and year Estimates are based on total household incomes in per capita terms. $1.08/day PPP poverty line. Source: TIAs.
Province 2002 2005 2008North Niassa 77 68 70 Cabo Delgado 87 80 86 Nampula 79 76 89 Zambezia 89 85 85Centre Tete 84 79 82 Manica 84 72 74 Sofala 83 64 76South Inhambane 59 55 73 Gaza 84 73 80 Maputo 62 58 63Total 81 75 81
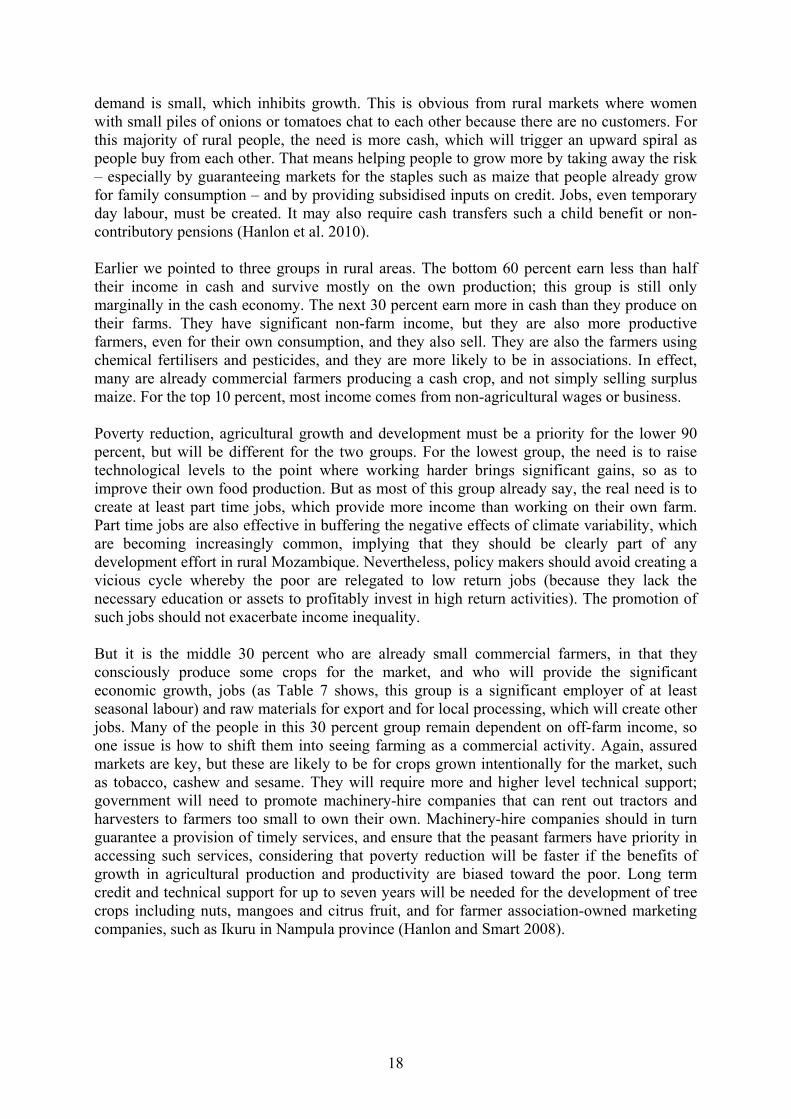
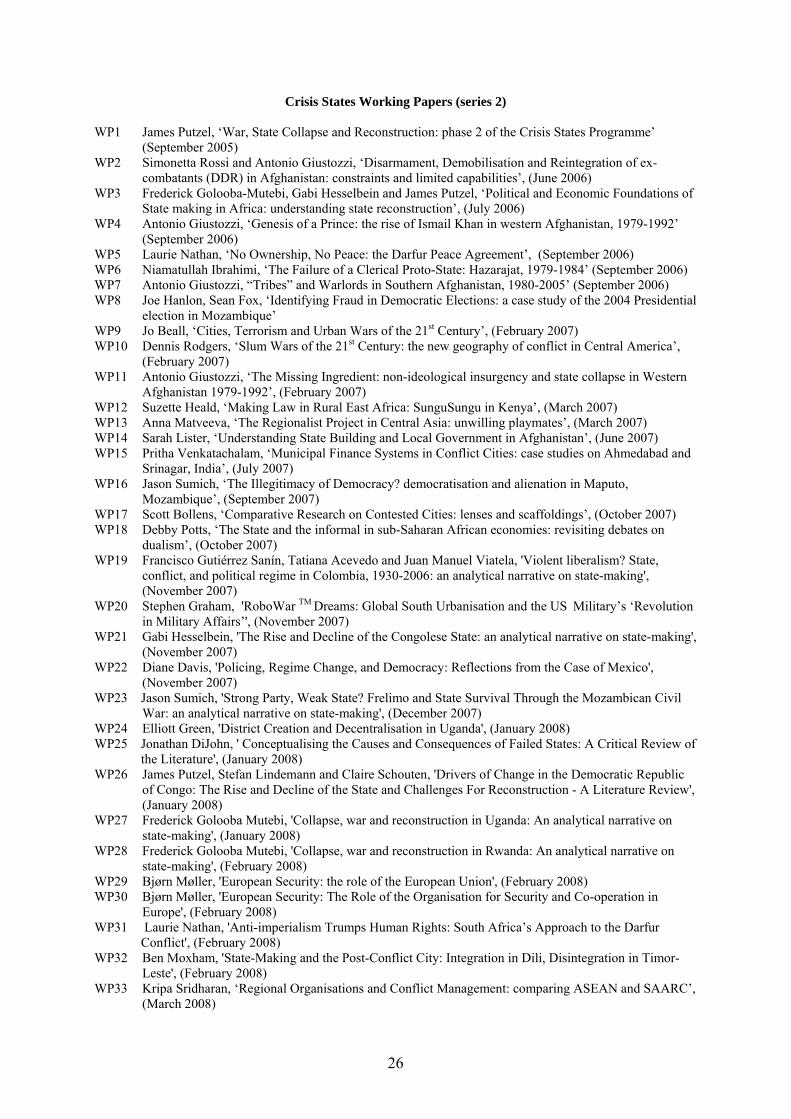
Nutrition also shows that poverty levels are not changing very much. Nationally, chronic malnutrition (low height for age or stunting) for children under five years old fell from 48 percent in 2003 to 44 percent in 2008, but this is still considered ‘very high’ by the World Health Organisation (Grupo de Estudo 2009). Stunting is a good indicator for the well being of a population, as it reflects the structural context surrounding malnutrition. If young children are exposed to sub-optimal nutrition at certain key stages in their physiological and mental development, they are unable to reach their full potential height and this opportunity is irreversibly lost; it cannot be regained, even if the conditions for nutrition improve and a child gains in weight. Ministry of Health figures show that low birth weight rates are not improving: they were 10.9 percent of births in 2006 to 11.3 percent in 2008, a difference that may not be statistically significant, but definitely is not better. Figure 4 shows one reason for the very high levels of chronic malnutrition in Mozambique: on average, farmers only produce enough food to feed their families adequately for less than eight months of the year, and this is not changing. Table 4 shows that the poorest families only produce enough to provide adequate food for half the year.

7
0.1
.2.3
.4K
erne
l den
sity
0 5 10 15Log of household income
2002 20052008
Figure 3: Kernel density function for household income Source: TIAs.
Figure 4: Months with an adequate food supply from farmers’ own production Source: TIAs. Although income and nutrition are not improving, there are improvements in human-capital and deprivations-based measures of poverty. The 2008 Multiple Indicator Cluster Survey indicates considerable improvements in human capital, notably education and health. Although it remains extremely high, the under-five mortality rate was reduced from 153 deaths per 1,000 live births in 2003 to 138 in 2008. Positive trends were also observed with respect to literacy rates and primary school enrolment and attendance rates, although the
7.62 7.49
8.34
7.13
02
46
8#
of m
onth
s w
ith a
dequ
ate
food
sup
ply
2005 2006 2007 2008
8
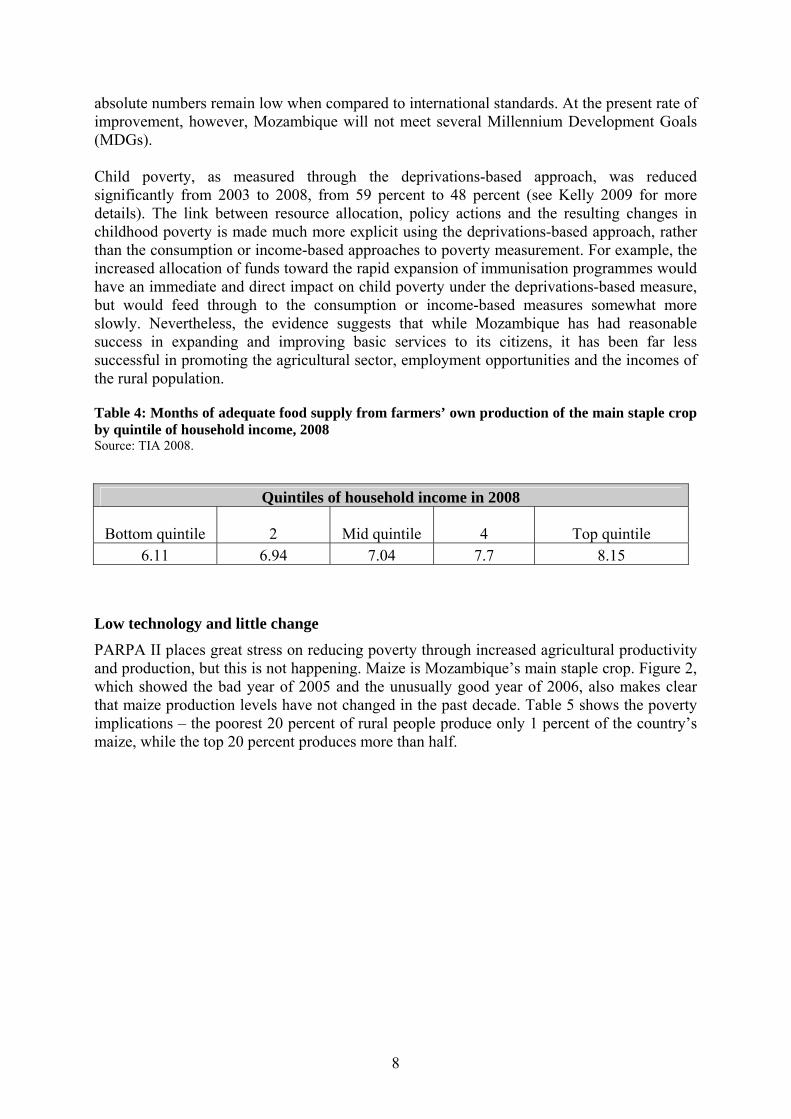
absolute numbers remain low when compared to international standards. At the present rate of improvement, however, Mozambique will not meet several Millennium Development Goals (MDGs). Child poverty, as measured through the deprivations-based approach, was reduced significantly from 2003 to 2008, from 59 percent to 48 percent (see Kelly 2009 for more details). The link between resource allocation, policy actions and the resulting changes in childhood poverty is made much more explicit using the deprivations-based approach, rather than the consumption or income-based approaches to poverty measurement. For example, the increased allocation of funds toward the rapid expansion of immunisation programmes would have an immediate and direct impact on child poverty under the deprivations-based measure, but would feed through to the consumption or income-based measures somewhat more slowly. Nevertheless, the evidence suggests that while Mozambique has had reasonable success in expanding and improving basic services to its citizens, it has been far less successful in promoting the agricultural sector, employment opportunities and the incomes of the rural population. Table 4: Months of adequate food supply from farmers’ own production of the main staple crop by quintile of household income, 2008 Source: TIA 2008.
Quintiles of household income in 2008
Bottom quintile 2 Mid quintile 4 Top quintile 6.11 6.94 7.04 7.7 8.15
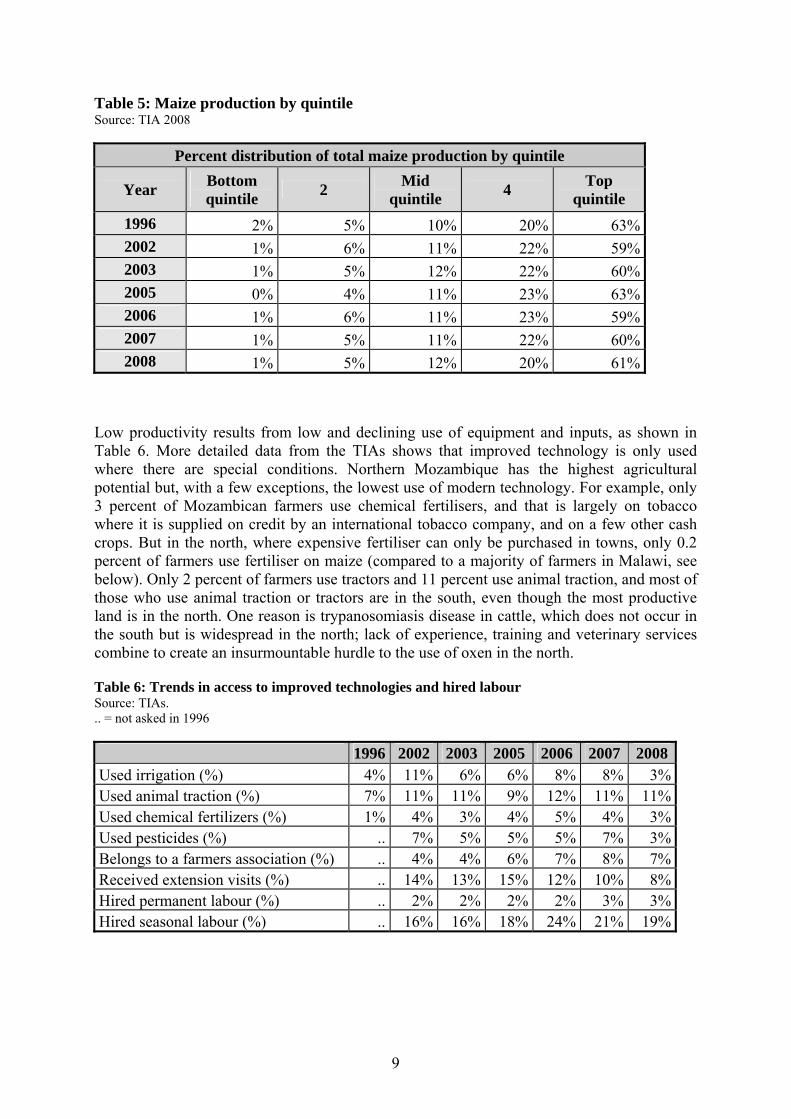
Low technology and little change PARPA II places great stress on reducing poverty through increased agricultural productivity and production, but this is not happening. Maize is Mozambique’s main staple crop. Figure 2, which showed the bad year of 2005 and the unusually good year of 2006, also makes clear that maize production levels have not changed in the past decade. Table 5 shows the poverty implications – the poorest 20 percent of rural people produce only 1 percent of the country’s maize, while the top 20 percent produces more than half.
9
Table 5: Maize production by quintile Source: TIA 2008
Percent distribution of total maize production by quintile
Year Bottom quintile 2 Mid
quintile 4 Top quintile
1996 2% 5% 10% 20% 63% 2002 1% 6% 11% 22% 59% 2003 1% 5% 12% 22% 60% 2005 0% 4% 11% 23% 63% 2006 1% 6% 11% 23% 59% 2007 1% 5% 11% 22% 60% 2008 1% 5% 12% 20% 61%
Low productivity results from low and declining use of equipment and inputs, as shown in Table 6. More detailed data from the TIAs shows that improved technology is only used where there are special conditions. Northern Mozambique has the highest agricultural potential but, with a few exceptions, the lowest use of modern technology. For example, only 3 percent of Mozambican farmers use chemical fertilisers, and that is largely on tobacco where it is supplied on credit by an international tobacco company, and on a few other cash crops. But in the north, where expensive fertiliser can only be purchased in towns, only 0.2 percent of farmers use fertiliser on maize (compared to a majority of farmers in Malawi, see below). Only 2 percent of farmers use tractors and 11 percent use animal traction, and most of those who use animal traction or tractors are in the south, even though the most productive land is in the north. One reason is trypanosomiasis disease in cattle, which does not occur in the south but is widespread in the north; lack of experience, training and veterinary services combine to create an insurmountable hurdle to the use of oxen in the north. Table 6: Trends in access to improved technologies and hired labour Source: TIAs. .. = not asked in 1996
1996 2002 2003 2005 2006 2007 2008Used irrigation (%) 4% 11% 6% 6% 8% 8% 3%Used animal traction (%) 7% 11% 11% 9% 12% 11% 11%Used chemical fertilizers (%) 1% 4% 3% 4% 5% 4% 3%Used pesticides (%) .. 7% 5% 5% 5% 7% 3%Belongs to a farmers association (%) .. 4% 4% 6% 7% 8% 7%Received extension visits (%) .. 14% 13% 15% 12% 10% 8%Hired permanent labour (%) .. 2% 2% 2% 2% 3% 3%Hired seasonal labour (%) .. 16% 16% 18% 24% 21% 19%
10
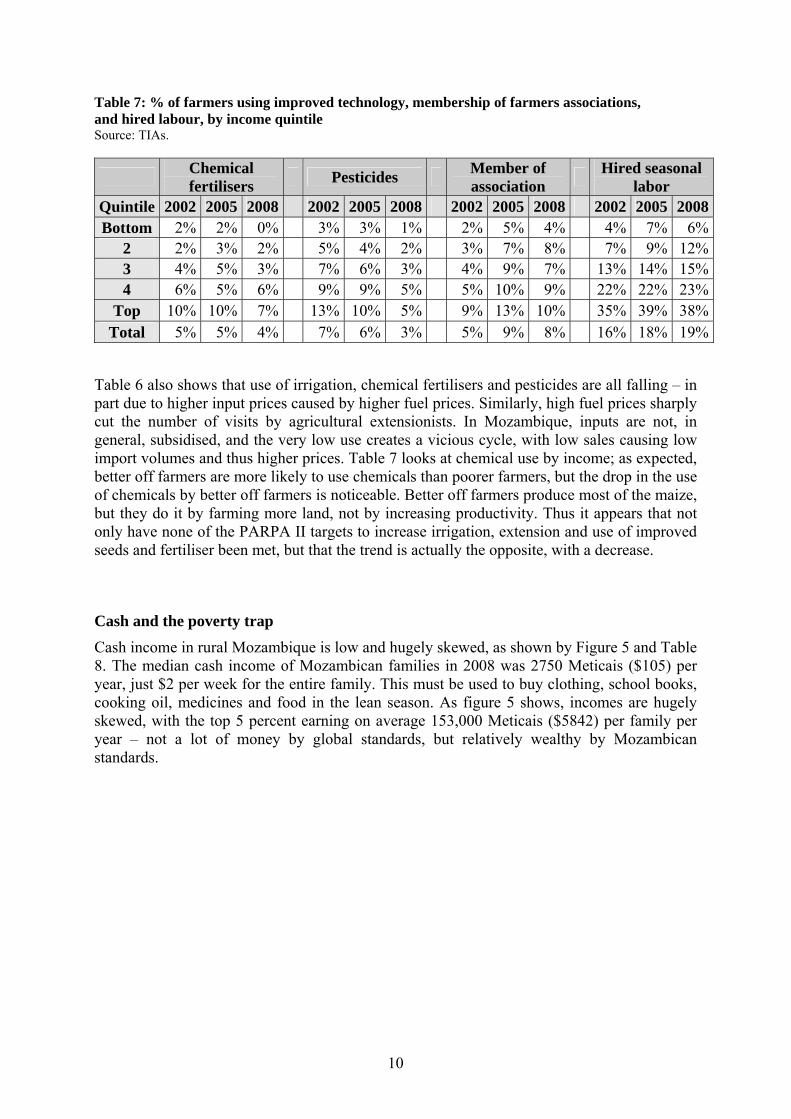
Table 7: % of farmers using improved technology, membership of farmers associations, and hired labour, by income quintile Source: TIAs.
Chemical fertilisers Pesticides Member of
association Hired seasonal labor
Quintile 2002 2005 2008 2002 2005 2008 2002 2005 2008 2002 2005 2008Bottom 2% 2% 0% 3% 3% 1% 2% 5% 4% 4% 7% 6%
2 2% 3% 2% 5% 4% 2% 3% 7% 8% 7% 9% 12%3 4% 5% 3% 7% 6% 3% 4% 9% 7% 13% 14% 15%4 6% 5% 6% 9% 9% 5% 5% 10% 9% 22% 22% 23%
Top 10% 10% 7% 13% 10% 5% 9% 13% 10% 35% 39% 38%Total 5% 5% 4% 7% 6% 3% 5% 9% 8% 16% 18% 19%
Table 6 also shows that use of irrigation, chemical fertilisers and pesticides are all falling – in part due to higher input prices caused by higher fuel prices. Similarly, high fuel prices sharply cut the number of visits by agricultural extensionists. In Mozambique, inputs are not, in general, subsidised, and the very low use creates a vicious cycle, with low sales causing low import volumes and thus higher prices. Table 7 looks at chemical use by income; as expected, better off farmers are more likely to use chemicals than poorer farmers, but the drop in the use of chemicals by better off farmers is noticeable. Better off farmers produce most of the maize, but they do it by farming more land, not by increasing productivity. Thus it appears that not only have none of the PARPA II targets to increase irrigation, extension and use of improved seeds and fertiliser been met, but that the trend is actually the opposite, with a decrease.
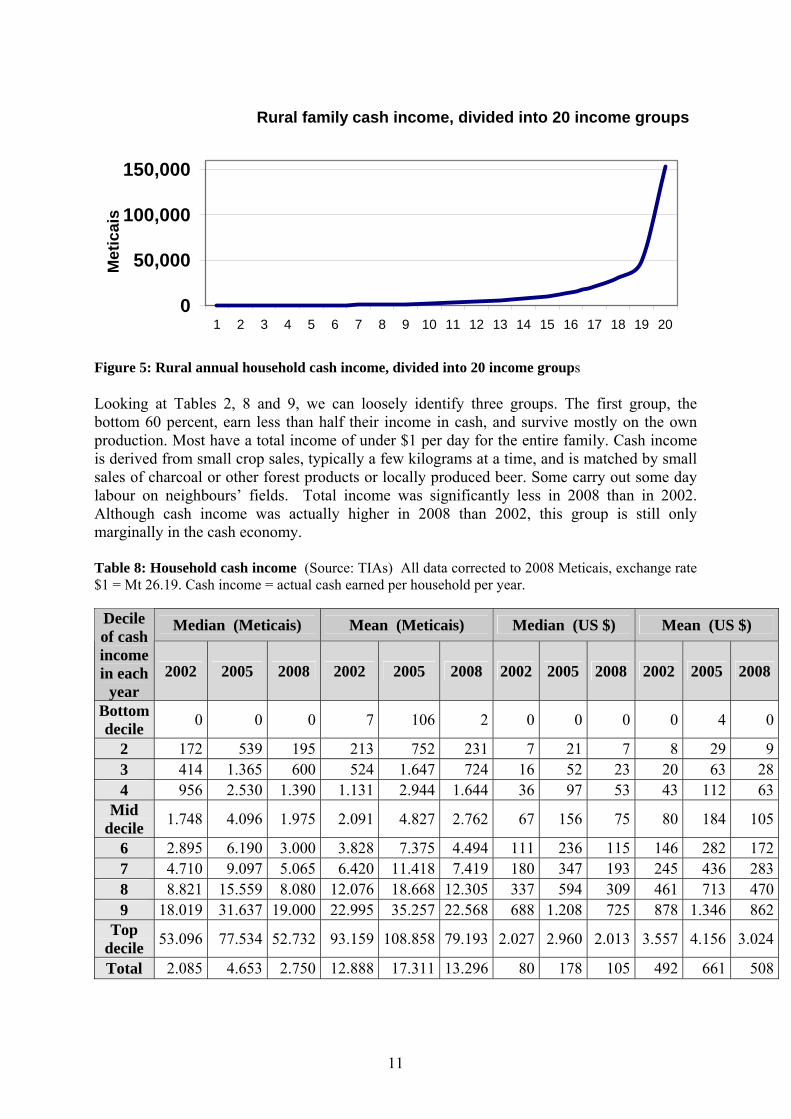
Cash and the poverty trap Cash income in rural Mozambique is low and hugely skewed, as shown by Figure 5 and Table 8. The median cash income of Mozambican families in 2008 was 2750 Meticais ($105) per year, just $2 per week for the entire family. This must be used to buy clothing, school books, cooking oil, medicines and food in the lean season. As figure 5 shows, incomes are hugely skewed, with the top 5 percent earning on average 153,000 Meticais ($5842) per family per year – not a lot of money by global standards, but relatively wealthy by Mozambican standards.
11
Rural family cash income, divided into 20 income groups
0
50,000
100,000
150,000
1 2 3 4 5 6 7 8 9 10 11 12 13 14 15 16 17 18 19 20
Met
icai
s
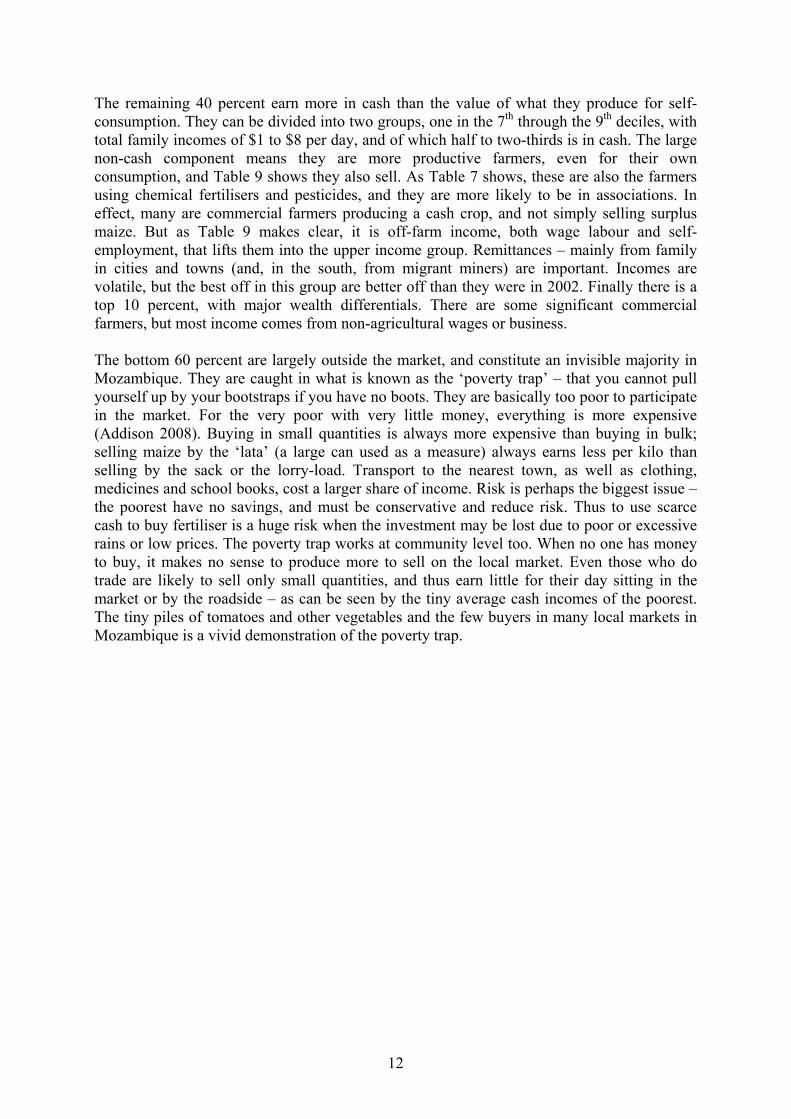
Figure 5: Rural annual household cash income, divided into 20 income groups Looking at Tables 2, 8 and 9, we can loosely identify three groups. The first group, the bottom 60 percent, earn less than half their income in cash, and survive mostly on the own production. Most have a total income of under $1 per day for the entire family. Cash income is derived from small crop sales, typically a few kilograms at a time, and is matched by small sales of charcoal or other forest products or locally produced beer. Some carry out some day labour on neighbours’ fields. Total income was significantly less in 2008 than in 2002. Although cash income was actually higher in 2008 than 2002, this group is still only marginally in the cash economy. Table 8: Household cash income (Source: TIAs) All data corrected to 2008 Meticais, exchange rate $1 = Mt 26.19. Cash income = actual cash earned per household per year.
Median (Meticais) Mean (Meticais) Median (US $) Mean (US $) Decile of cash income in each
year 2002 2005 2008 2002 2005 2008 2002 2005 2008 2002 2005 2008
Bottom decile 0 0 0 7 106 2 0 0 0 0 4 0
2 172 539 195 213 752 231 7 21 7 8 29 93 414 1.365 600 524 1.647 724 16 52 23 20 63 284 956 2.530 1.390 1.131 2.944 1.644 36 97 53 43 112 63
Mid decile 1.748 4.096 1.975 2.091 4.827 2.762 67 156 75 80 184 105
6 2.895 6.190 3.000 3.828 7.375 4.494 111 236 115 146 282 1727 4.710 9.097 5.065 6.420 11.418 7.419 180 347 193 245 436 2838 8.821 15.559 8.080 12.076 18.668 12.305 337 594 309 461 713 4709 18.019 31.637 19.000 22.995 35.257 22.568 688 1.208 725 878 1.346 862
Top decile 53.096 77.534 52.732 93.159 108.858 79.193 2.027 2.960 2.013 3.557 4.156 3.024
Total 2.085 4.653 2.750 12.888 17.311 13.296 80 178 105 492 661 508
12
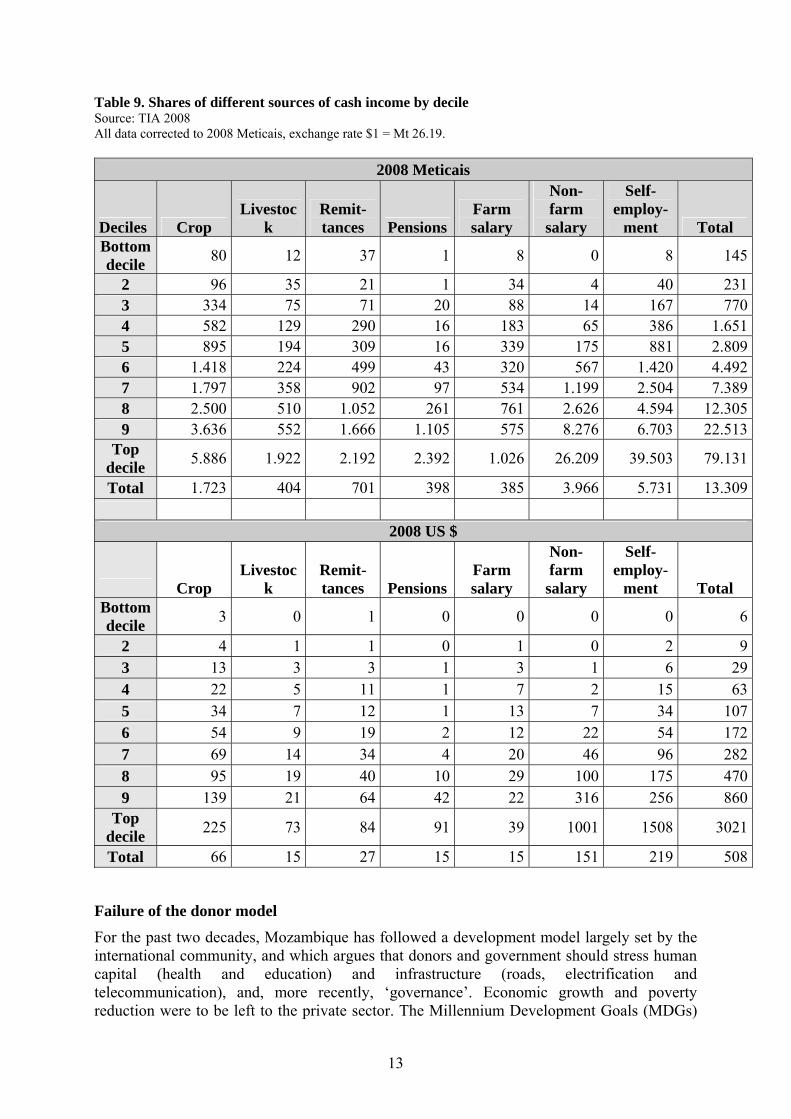
The remaining 40 percent earn more in cash than the value of what they produce for self-consumption. They can be divided into two groups, one in the 7th through the 9th deciles, with total family incomes of $1 to $8 per day, and of which half to two-thirds is in cash. The large non-cash component means they are more productive farmers, even for their own consumption, and Table 9 shows they also sell. As Table 7 shows, these are also the farmers using chemical fertilisers and pesticides, and they are more likely to be in associations. In effect, many are commercial farmers producing a cash crop, and not simply selling surplus maize. But as Table 9 makes clear, it is off-farm income, both wage labour and self-employment, that lifts them into the upper income group. Remittances – mainly from family in cities and towns (and, in the south, from migrant miners) are important. Incomes are volatile, but the best off in this group are better off than they were in 2002. Finally there is a top 10 percent, with major wealth differentials. There are some significant commercial farmers, but most income comes from non-agricultural wages or business. The bottom 60 percent are largely outside the market, and constitute an invisible majority in Mozambique. They are caught in what is known as the ‘poverty trap’ – that you cannot pull yourself up by your bootstraps if you have no boots. They are basically too poor to participate in the market. For the very poor with very little money, everything is more expensive (Addison 2008). Buying in small quantities is always more expensive than buying in bulk; selling maize by the ‘lata’ (a large can used as a measure) always earns less per kilo than selling by the sack or the lorry-load. Transport to the nearest town, as well as clothing, medicines and school books, cost a larger share of income. Risk is perhaps the biggest issue – the poorest have no savings, and must be conservative and reduce risk. Thus to use scarce cash to buy fertiliser is a huge risk when the investment may be lost due to poor or excessive rains or low prices. The poverty trap works at community level too. When no one has money to buy, it makes no sense to produce more to sell on the local market. Even those who do trade are likely to sell only small quantities, and thus earn little for their day sitting in the market or by the roadside – as can be seen by the tiny average cash incomes of the poorest. The tiny piles of tomatoes and other vegetables and the few buyers in many local markets in Mozambique is a vivid demonstration of the poverty trap.
13
Table 9. Shares of different sources of cash income by decile Source: TIA 2008 All data corrected to 2008 Meticais, exchange rate $1 = Mt 26.19.
2008 Meticais
Deciles Crop Livestoc
k Remit-tances Pensions
Farm salary
Non-farm salary
Self-employ-
ment Total Bottom decile 80 12 37 1 8 0 8 145
2 96 35 21 1 34 4 40 2313 334 75 71 20 88 14 167 7704 582 129 290 16 183 65 386 1.6515 895 194 309 16 339 175 881 2.8096 1.418 224 499 43 320 567 1.420 4.4927 1.797 358 902 97 534 1.199 2.504 7.3898 2.500 510 1.052 261 761 2.626 4.594 12.3059 3.636 552 1.666 1.105 575 8.276 6.703 22.513
Top decile 5.886 1.922 2.192 2.392 1.026 26.209 39.503 79.131
Total 1.723 404 701 398 385 3.966 5.731 13.309
2008 US $
Crop Livestoc
k Remit-tances Pensions
Farm salary
Non-farm salary
Self-employ-
ment Total Bottom decile 3 0 1 0 0 0 0 6
2 4 1 1 0 1 0 2 93 13 3 3 1 3 1 6 294 22 5 11 1 7 2 15 635 34 7 12 1 13 7 34 1076 54 9 19 2 12 22 54 1727 69 14 34 4 20 46 96 2828 95 19 40 10 29 100 175 4709 139 21 64 42 22 316 256 860
Top decile 225 73 84 91 39 1001 1508 3021
Total 66 15 27 15 15 151 219 508 Failure of the donor model For the past two decades, Mozambique has followed a development model largely set by the international community, and which argues that donors and government should stress human capital (health and education) and infrastructure (roads, electrification and telecommunication), and, more recently, ‘governance’. Economic growth and poverty reduction were to be left to the private sector. The Millennium Development Goals (MDGs)
14
have become an integral part of this policy, with emphasis put on MDG Goals 2 to 6 – education, gender and health. The bias toward human capital has been pushed by the donors – aid to the social and governance sectors in Mozambique doubled in just six years, from $477 million in 2003 to $990 million in 2008. Budget support jumped from $172 million to $452 million between 2003 and 2008, and that also largely goes to social sectors (OECD Stat). A mark of the unquestioning promotion of this model was the 2005 statement by a visiting Norwegian aid official that ‘everyone knows’ that poverty is fought through investment in health, education, water and roads (Castel-Branco 2007). MDG Goal 1, to ‘end poverty and hunger’, has largely been ignored, and left to the private sector and foreign investment. Goal 1 has three targets: halve the proportion of people whose income is less than $1 a day, achieve full and productive employment and decent work for all, and halve the proportion of people who suffer from hunger. Mozambique seems not to be moving toward the Goal 1 targets, yet both the government and donors leave the economic sectors as areas outside their concern. There has been substantial foreign investment in Mozambique, but it has been primarily in mineral and energy ‘mega-projects’. Rapid economic growth with GDP rising by more than 6 percent a year for the past decade wins high praise from the international community, and has been driven by these ‘mega-projects’, but they create few jobs and have few local linkages. Over the next decade, mineral and energy exports will provide an increasing share of government revenue, but this is not a development strategy. Mozambique remains predominantly rural, and in the short and medium term, agriculture must remain a central component of development and poverty reduction. Import-substitution industrialisation will never compete with China, but specialised agriculture and agro-industry can sell to the Asian market, creating jobs and raising incomes, and can grow in parallel with increased food production (see, for example, Kaplinsky 2006). This is already happening in a small way, notably in Nampula, where some smallholders have increased the production of sesame, which is exported to Asian and European markets. The government talks much about the ‘green revolution’, which is supposed to end rural poverty. But it is not happening. Half of Mozambicans are peasant farmers using only a hoe and no modern inputs, farming as their great grandparents did. Improvements in health and education are not, so far, having an impact on the countryside. Indeed, poverty appears to be increasing. Data from the most recent National Agricultural Survey (TIA 2008) confirms that poverty is growing and use of modern technology is falling. The Chr Michelsen Institute (CMI) of Norway is doing a long term study of poverty funded by the UK Department for International Development, which should shake up the donor community (Tvedten et al. 2009):
Our surveys confirm national data on improvements in education and health. However, we also show that people are in the process of losing faith in education as a vehicle for upward social mobility... Above all, the surveys have confirmed the importance attached to employment, income and fair prices for agricultural products for alleviating poverty.
Two decades of a donor-led, liberal, free-market rural development strategy have failed not just in Mozambique, but across Africa. Countries were pushed to privatise what were previously state services and close marketing boards in the belief that if a truly free market was established, farmers would respond to price signals to produce the most profitable crops
15
and pull themselves out of poverty. But the opposite happened, as production and productivity stagnated and the poorest peasants dropped back into subsistence production. A study by Gabi Hesselbein (2010a and b) of the London School of Economics points to the lack of change in agricultural productivity across Africa; and she notes that two of Mozambique’s neighbours, Tanzania and Zambia, developed visions similar to Mozambique’s ‘green revolution’, based on market liberalisation and which placed responsibility on the private sector and the districts. As in Mozambique, the strategy failed; farmers are too poor to purchase seeds and fertiliser or invest in irrigation (Hesselbein 2010b). A new study published by OECD on fragile and post-war states (OECD 2010: 20) notes that:
donor assistance to the development of the capacity of fragile states to manage the economy has been limited largely to programmes to improve macroeconomic management. The lack of attention to the productive sectors is especially important in relation to agriculture. Markets left entirely to their own devices are unlikely to underpin new growth trajectories, particularly in the risky environments found in most fragile states.
So, after 17 years, the OECD notices that the policy imposed on Mozambique after its war was ‘unlikely’ to work; and it didn’t (Hanlon 2010a). The ahistorical nature of neo-liberal policies and their failures in Africa have led writers to look both at history and at the actions of other, more successful, countries. Hesselbein (2010a) argues that ‘the initial conditions in Europe, before industrialisation, were very similar to those found in contemporary Sub-Saharan Africa’. There were complaints in mid-nineteenth century Europe about lazy peasants; economists came to realise that the physical labour of a subsistence farmer was so hard that ‘when working longer hours of arduous work only increases the yield insignificantly, the work will not be done, or only be done at the threat of one’s own starvation’. Agricultural stagnation was only overcome when farmers were given inputs, such as fertiliser and machines, that made the work less back-breaking, plus consumer goods that made their lives less hard; and this tended to involve the active intervention of the state, particularly directing investment but also using tax policy to curb unproductive elite consumption and shift the money to investment. The state needs to be actively involved in the shift from subsistence to a market rural economy. Development economists such as Ha-Joon Chang (2008) of Cambridge are looking back at both nineteenth-century Europe and the Asian Tigers of the late-twentieth century and finding different models. South Korea is often cited, because it had been colonised (by Japan) and then went through a war, and was similar in many ways to African countries in the late-twentieth century. A study by the US Congressional Budget Office (CBO 1997) looked at what it saw as the success of aid to South Korea:1
The South Korean government largely initiated, directed, and organized development by setting goals, establishing priorities, and backing them up with resources. Large, highly profitable private companies were clearly subordinate to the government, in part because the government controlled domestic credit as well as the right to borrow abroad.
The government also put in place a number of incentives such as subsidies and access to subsidised credit. The CBO notes that perhaps the most important role of aid was that it ‘increased the pool of available investment capital’.
1 Non-military aid to South Korea in the 1970s was, in real per capita terms, double the aid to Mozambique now.
16
The CBO report pointed out that foreign aid was particularly important in upgrading South Korean agriculture, where it was used for research and agricultural extension, and to promote the use of fertiliser. US aid helped Korea build five fertiliser plants. Yet, for the subsequent two decades, the international community prohibited exactly those successful policies in Africa, and in particular in Mozambique, which was forced to close its marketing board, dismantle agricultural research and end state support for production of modern seeds. All protection and support, except for foreign multinational companies, was stopped. Subsidy was not allowed. An alternative: reducing risk Fertiliser subsidies are proving to be important in Africa as well. In contrast to many other African counties, Rwanda has a highly interventionist policy. A fertiliser subsidy pushed fertiliser use from 2 percent to 62 percent in just two years. Government guarantees credit to farmers; and it promotes farmer marketing associations and agribusiness, including companies that do peasant contract farming under which peasants grow an agreed crop and the company guarantees to buy, as with tobacco in Mozambique (Hesselbein 2010b; Hanlon and Smart 2008). In Malawi, a fertiliser subsidy turned the country from being dependent on food aid to being a maize exporter in just two years. In the 2004 election, all the leading candidates promised government support for smallholder agriculture and fertiliser subsidies to end food insecurity. Donors were opposed and during the campaign warned that debt relief under the Heavily Indebted Poor Countries (HIPC) Initiative would be delayed if a fertiliser subsidy was introduced. Bingo Wa Mutharika was elected in May 2004, but in the face of such fierce donor opposition, he delayed until he then came under heavy parliamentary pressure, and finally announced a broadly based fertiliser subsidy in June 2005, funded entirely from the government budget. Each household receives coupons allowing the purchase of two 50 kg bags of subsidised fertiliser, seed and storage pesticides; by the 2006/2007 season the programme reached 1.7 million families (70 percent of farm households). Partly helped by good rains, maize yields doubled and production jumped dramatically; in 2007 Malawi exported 300,000 tonnes of maize to Zimbabwe (Chinsanga 2007; Chinsinga and O’Brien 2008; Denning et al 2009). Fertiliser prices are linked to oil prices, and in 2008 fertiliser prices were double that of 2006, while by early 2010 prices had fallen back close to 2006 levels. International maize prices, in turn, partly follow oil prices. The Millennium Villages Project estimated that it cost $82 in 2006 and $135 in 2008 in fertiliser and seed to produce an extra tonne of maize (Denning et al 2009). UNCTAD figures show the global price of maize ranging from $160 per tonne in late 2006 to a peak of $250 in 2008. Retail maize prices in Malawi and northern Mozambique are similar, and ranged from $150 to $300 in the same period (Zavale et al. 2009); so the subsidy is roughly half the value of the extra production. As an FAO study (Buffie and Atolia 2009) concluded:
The subsidies do all good and no harm.... Input subsidies are highly effective in reducing smallholder poverty.... They buy a substantial increase (17-41 percent) in the smallholder income along with a small but significant rise (2-5 percent) in the real unskilled wage.
Faced with the obvious success of the subsidy, donors could not impose any sanctions. But many remain opposed. Some argue that subsidies create market distortions while others argue that the money would be better spent on infrastructure. The IMF had been one of the most vociferous opponents, but the April 2010 issues of IMF Survey Magazine had unexpected high praise for the fertiliser subsidy: ‘Malawi’s recent robust economic growth has enabled
17
one of Africa’s poorest countries to make real strides in reducing chronic food insecurity and progress toward poverty reduction.’ This is partly because of ‘several bumper harvests for tobacco, the principal cash crop, and maize, stemming from good rainfall and the distribution of subsidized fertilizer.’ It is uncertain if a subsidy alone will have a significant impact on crop incomes in rural Mozambique. The vulnerability of peasant farmers to drought, floods and pests suggests that input subsidies should be strongly accompanied with a favourable market policy. Two important interventions in Mozambique show what can be done with a coordinated approach. The cashew-nut sector’s destruction by World Bank enforced liberalisation in 1995 became notorious, which created space for a quiet reversal of policy in the 2000s. A state agency, Incajú, reintroduced protection (in direct and explicit violation of the World Bank rules) and discreetly worked with a domestic development agency and a handful of sympathetic donors to create the entire value chain – peasant production, state spraying and plant protection, marketing, new shelling and processing factories, and coordinated export – to create thousands of jobs and record production in the 2009-2010 season. Tobacco is the other success. It has become Mozambique’s most important export crop and has done more than any single intervention to reduce poverty. A single TNC, the US-based Universal Leaf Tobacco, which is the world's leading leaf-tobacco merchant and processor, has been given exclusive rights over tobacco production in much of the country. More than 150,000 peasant families participate in its outgrower schemes, in which seeds, fertiliser and training are provided on credit, and there is a guaranteed market, but the tobacco must be sold to the company. Net profits for better farmers are over $500 per year. The company has now built a tobacco-processing factory, which created 1600 jobs. ULT has created something similar to the old marketing boards, but no foreign investor has suggested anything similar schemes for other crops. Perhaps ULT is willing to do it because of its dominance of the global market (Hanlon and Smart, 2008: ch. 5 and 6). The theory behind liberalisation and the abolition of marketing boards common in most African countries was that state-owned boards were expensive and inefficient, and in a totally free market peasants would capture more of the surplus and prosper. But this nice theory failed to take into account a central issue in agriculture throughout the world: risk. In exchange for potentially higher prices, peasants also had to accept all the risk of weather, pests and fluctuating markets. The poverty trap also came into play: fertilisers and extension services supplied by marketing boards may have been more expensive, but farmers did not have to pay up front, with the cost deducted from the payment for the crop. Most peasants have too little money to pay for inputs, even if they do cost less, and the marketing boards effectively provided insurance because if there was a generalised crop failure the input costs were not repaid. What we are observing, yet again, is the central importance of reducing risk: peasants are prepared to accept significantly lower profits in exchange for credit, insurance and a guaranteed market. Hesselbein (2010b) identifies lack of markets as the biggest constraint in both Tanzania and Zambia. The CMI study (Rosário et al 2009) says that in Mozambique ‘publicly supported local and adapted alternatives to the previous ‘marketing boards’ should be considered.’ The core demands identified by CMI – income, jobs, and fair and assured market – are broadly agreed, so shared risk, guaranteed markets and subsidised technology will be central to reducing rural poverty. UNCTAD (2006) argues that domestic demand is the largest contributor to economic growth, but that generalised and persistent poverty means that
18
demand is small, which inhibits growth. This is obvious from rural markets where women with small piles of onions or tomatoes chat to each other because there are no customers. For this majority of rural people, the need is more cash, which will trigger an upward spiral as people buy from each other. That means helping people to grow more by taking away the risk – especially by guaranteeing markets for the staples such as maize that people already grow for family consumption – and by providing subsidised inputs on credit. Jobs, even temporary day labour, must be created. It may also require cash transfers such a child benefit or non-contributory pensions (Hanlon et al. 2010). Earlier we pointed to three groups in rural areas. The bottom 60 percent earn less than half their income in cash and survive mostly on the own production; this group is still only marginally in the cash economy. The next 30 percent earn more in cash than they produce on their farms. They have significant non-farm income, but they are also more productive farmers, even for their own consumption, and they also sell. They are also the farmers using chemical fertilisers and pesticides, and they are more likely to be in associations. In effect, many are already commercial farmers producing a cash crop, and not simply selling surplus maize. For the top 10 percent, most income comes from non-agricultural wages or business. Poverty reduction, agricultural growth and development must be a priority for the lower 90 percent, but will be different for the two groups. For the lowest group, the need is to raise technological levels to the point where working harder brings significant gains, so as to improve their own food production. But as most of this group already say, the real need is to create at least part time jobs, which provide more income than working on their own farm. Part time jobs are also effective in buffering the negative effects of climate variability, which are becoming increasingly common, implying that they should be clearly part of any development effort in rural Mozambique. Nevertheless, policy makers should avoid creating a vicious cycle whereby the poor are relegated to low return jobs (because they lack the necessary education or assets to profitably invest in high return activities). The promotion of such jobs should not exacerbate income inequality. But it is the middle 30 percent who are already small commercial farmers, in that they consciously produce some crops for the market, and who will provide the significant economic growth, jobs (as Table 7 shows, this group is a significant employer of at least seasonal labour) and raw materials for export and for local processing, which will create other jobs. Many of the people in this 30 percent group remain dependent on off-farm income, so one issue is how to shift them into seeing farming as a commercial activity. Again, assured markets are key, but these are likely to be for crops grown intentionally for the market, such as tobacco, cashew and sesame. They will require more and higher level technical support; government will need to promote machinery-hire companies that can rent out tractors and harvesters to farmers too small to own their own. Machinery-hire companies should in turn guarantee a provision of timely services, and ensure that the peasant farmers have priority in accessing such services, considering that poverty reduction will be faster if the benefits of growth in agricultural production and productivity are biased toward the poor. Long term credit and technical support for up to seven years will be needed for the development of tree crops including nuts, mangoes and citrus fruit, and for farmer association-owned marketing companies, such as Ikuru in Nampula province (Hanlon and Smart 2008).
19
Is such a policy change possible? The dawning recognition that poverty is not being reduced, at least not as quickly as previously thought, is forcing some rethinking, but it is proving very slow. Prominent establishment Mozambicans are speaking out. Young people rioted in the capital Maputo on February 5, 2008 against the rising cost of living; five people were killed and more than a hundred injured, many shot by police. Rogério Sitoe, editor-in-chief of the government owned daily, Noticias, wrote a remarkable column arguing that the root cause is ‘the religious way we applaud and accept the prescriptions of the World Bank and International Monetary Fund’, when these are really ‘poison prescriptions’. They have destroyed jobs and failed to promote agricultural development, which has ‘contributed greatly to the impoverishment of the countryside and forced a migration to the cities, particularly of the youth.’ The government needs its own development policy and needs to stop treating World Bank and IMF statements as if they were ‘bible verses’ (Notícias, February 15, 2008). Later that year, Professor Firmino G. Mucavele, formerly Chief Executive of NEPAD and now head of the Agronomy Faculty of Universidade Eduardo Mondlane, argued that Mozambique’s much talked-about ‘green revolution’ cannot be simply providing a few inputs. Instead, it requires radical changes to the entire agricultural value chain, new ways of thinking about rural development, a hugely increased role for the state and large amounts of money. He stressed that in previous green revolutions, the entire food-production chain – choice of crops, inputs, extension, production systems and marketing – went through a revolution that was totally externally financed. The state would need to provide vastly expanded extension services, step up research particularly on pests and diseases, and would have to be buyer of last resort to guarantee a market (Noticias, September 15, 2008). Then in early 2009, open criticism of the development model was voiced by the Mozambican Forum of the Peer Review Mechanism of the African Union. In a self-evaluation report for the peer review, the Forum said that ‘the most credible indicators point to an increase in absolute terms in the number of people below the minimum subsistence level.’ The report (Forum Nacional do MARP 2009: 50 and 82) is caustic about economic policy, pointing to the ‘notorious way the economic programme ignored the question of income distribution, which means that the principle beneficiaries of growth are concentrated in tiny groups and a restricted social strata.’ It goes on to cite ‘the failure to prioritise job creation in economic programmes’ and says that the high levels of ‘unemployment result from the application of neo-liberal economic programmes, which has a constraining effect leaving many families without the minimum level of subsistence.’ The Forum consists of the Mozambican establishment; it has 58 members from civil society and the private sector, with three provincial governors, the governor of the central bank and representatives of eight parliamentary commissions. The review was chaired by Lourenço do Rosário, rector of the largest private university, Universidade Politécnica. Then on 17 May 2010, in a speech in Maputo, the Executive Secretary of the Southern African Development Community (SADC) and former Mozambican Finance Minister, Tomás Salomão, said western institutions have been telling African governments ‘do what I say and not what I do’. Developing countries had thus been obliged ‘to comply with the recipes from structural adjustment programmes, often with heavy social costs and little impact on our socio-economic development’. The risk now was that attempts would be made ‘to patch up the model of ‘structural adjustment’ which has proven to be obsolete and outdated, and does
20
not respond to the challenges that developing countries must overcome’. Salomão (AIM News, May 18, 2010) feared that Africa would be faced:
..with the question: do you want aid? Then do what it says on this menu. Take it or leave it. A menu which often has nothing to do with us, or is produced by intellectuals who have recently come out of banks and universities, and don’t know that Africa is a continent with more than 50 countries of differing socio-cultural realities.
The obvious question is why, with the establishment behind it, the Mozambican government does not simply stand up to the donors, as the government in Malawi did. Both donors and government have invested huge political capital in the current failed model and change will be hard. The glib answer is provided by Table 1. Malawi stood up to the donors over fertiliser and still has a marketing board; Tanzania stood up to the donors in the early 1990s, and it now has an Independent Monitoring Group for aid (Harrison et al. 2009). Malawi and Tanzania received only 60 percent as much aid as Mozambique, per capita, which in 2008 was worth nearly $800 million to Mozambique. A 2005 evaluation of aid to Mozambique by the respected British economist Tony Killick and others (Killick et al. 2005: 50), ironically titled ‘Perfect Partners’, said boldly: ‘aid dependency does not have to entail subservience’. But most Mozambican leaders disagree, and think Salomão rather than Killick is right; looking over the border at Malawi and Tanzania, they conclude the subservience pays extremely well. Frelimo’s dealings with the international community reflect a long history in which the ‘West’ was not sympathetic to it. This was shaped by the Cold War. First NATO backed Portugal’s attempt to prevent independence and decolonisation. Then Mozambique became a Cold War battlefield, and in the 1982-92 proxy war, more than one million Mozambicans died; inevitably, many in the leadership see this as an extraordinarily high price that was paid for having an independent development policy. Then at the end of the Cold War, the victors in Washington used the Bretton Woods Institutions to impose harsh neo-liberal policies on post-socialist governments that were still not trusted (Hanlon 2010a and b). Aid was used to impose these policies. During the 1980s there were two donor strikes, in which food aid was withheld first to force Mozambique to sign an agreement with the IMF and World Bank, and then to force it to agree a structural adjustment programme (Hanlon and Smart 2008: 10). The next confrontation came in 1995, when the World Bank imposed an unprecedented set of ‘necessary conditions’ on its programme to Mozambique. If the ‘necessary conditions’ were not satisfied, the programme would stop, and since all aid at that time was conditional on having a World Bank programme, violation of those conditions would end all aid. Two of those conditions were particularly controversial: privatisation of state banks to consortia known to be corrupt (which bankrupted the banks and created the high level corruption that still plagues Mozambique); and a liberalisation of the cashew sector (which totally destroyed the sector). In a debate on cashew on November 24, 1997, Prime Minister Pascoal Mocumbi told parliament that when Mozambique asked for money ‘from the World Bank, the Bank imposes its conditions. Sometimes we have to accept things which are not in our interest, because there is no other way out’ (Hanlon 2000). Faced with an international community that is seen to demand an inordinate level of obsequiousness while often not acting in Mozambique’s interest, the government is careful to avoid frontal confrontations with the donors. It chooses its battles carefully, and then acts as discreetly and invisibly as possible. There have been three confrontations. The first, described above, was over cashew, where over a decade government intervention in direct violation of World Bank policy rebuilt the sector, creating thousands of industrial jobs and an important peasant cash crop (Hanlon and Smart 2008: ch 5). It appears to be a model agricultural
21
development, but cannot be widely applied because it was carried out without publicity and tolerated by some donors because of the embarrassment caused by the international scandal created by the World Bank destruction of the sector. The second confrontation was over a campaign pledge by Armando Guebuza in 2004 to create a Mozambican development bank. In a response similar to that in Malawi in the same year, donors said they would not allow government to create such a bank -- even though Mozambique was one of few countries without a development bank, and many donors have their own development bank. The newly elected government decided not to confront the donors, and instead quietly inserted a budget line to give about $250,000 to each district per year as a development fund. Donors were angry, at least partly because they simply did not notice until the budget was passed by parliament. Their response was to insist on a change in the agreement between the budget-support donors and government, in which the donors would see not only the final budget, but all preliminary drafts – to insure that nothing they did not agree with was ever again snuck into the budget. The third and most complex confrontation is the on-going struggle over ‘governance’. Here Frelimo’s interests are complex. At one level, some in the Frelimo elite stole large amounts of money from the privatised banks, and part of this money was used to fund the party; prosecuting such people in response to donor demands would destabilise the Frelimo party. But at another level, ‘good governance’ is now seen as opening Mozambique to transnational corporations and to prevent the support of domestic capital, which has been important in all successful national developments, such as the Asian Tigers, and which Mozambique is now doing (Hanlon and Mosse 2009). Again Frelimo is trying to avoid a frontal confrontation. Instead, each year it promises actions that are never actually carried out. In 2004, one of us wrote an article entitled ‘Do donors promote corruption?: the case of Mozambique’, in which we argued that there was an implicit compromise to maintain the myth of the Mozambican success story, in which both sides claim poverty reduction, Mozambique accepts imposed neo-liberal policy prescriptions and the stress on social services, and the donors turn a blind eye to corruption and state capture (Hanlon 2004). That deal seems to still be in place, because at the May 19, 2010 annual review of budget support, Kari Alanko, Finnish ambassador and head of the budget-support group, said that although government performance on governance was ‘unsatisfactory’, that its overall performance was ‘satisfactory’ because of expansion of services, economic growth and inflation control (Alanko 2010). For two decades, donors have been deeply divided on agriculture and rural development policy; their attitudes have changed rapidly and there have been divisions within agencies. But the one constant has been to keep government out of the economy and agriculture. Thus they forced the closure of the marketing board and seed production and curbed agricultural research. In 1999, the World Bank actually blocked the government from hiring more agricultural extension workers, even though the total number was only one-tenth that recommended by the FAO (Hanlon and Smart 2008: 168). The issue is not the policies, but the government role. Thus the IMF and other donors allow protection for the sugar sector, in which the plantations are owned by trans-national corporations who said their investment was dependent on protection, but not for the cashew sector owned by local business. Huge tax breaks and other de facto subsidies are permitted for foreign investors, particularly in the mineral-energy sector. One of the world’s largest tobacco companies can be given exclusive rights to control tobacco production in much of the country and set up what is, in effect, a marketing board, but the state is not allowed to create a similar system for other crops. The desire to avoid public confrontations with the donors combined with the emphasis that the
22
donors have put on keeping the state out of agriculture makes it impossible for Mozambique to introduce a programme like the Malawi fertiliser subsidy. Another key to the puzzle is that Frelimo lacks a coherent agriculture and rural development strategy, and has not been able to have a broad public debate. There are two reasons why Frelimo cannot think outside the box and openly debate alternatives. First, the tradition is that policy issues should be debated first inside the party and in secret, but Frelimo has been unable to build that kind of internal debate. The second is that the budget-support process means that donors are deeply embedded inside all the key ministries, and thus intervene actively in all policy discussions, which makes it impossible to even consider options that donors would oppose (De Renzio and Hanlon 2009). But the final key rests inside the Frelimo leadership. Frelimo has always stressed big farms: state farms in the socialist era, and now trying to encourage foreign companies to invest in big farms (often the old state farms). There has always been a distrust of the 30 percent of better-off peasants who could be commercial farmers – dismissed as ‘kulaks’ in the socialist era, their role is still not accepted. In this, there is a curious alignment of interest between Frelimo and the donors – both want big foreign-owned plantations as a development strategy and to help ‘subsistence’ peasant farmers (the poorest of the poor) almost as a form of social welfare. The final piece of the jigsaw is that throughout the ‘greed is good’ 1990s, donors promoted the idea that by getting rich, the elite was promoting development. Indeed, as recently as 2006 the IMF called for ‘an agricultural and rural strategy to enhance the trickling down of growth to the poorest segments of the population’ (IMF 2006). Some of the Mozambican elite still believe in ‘trickle down’; for others it is a convenient myth to justify the widening gaps between rich and poor − and who in the elite will argue for a different policy to help the poor when the elite gain so much from the present policy? Donors have pushed this development model very hard, and even used the budget-support process to ensure that their officials are part of drafting key Mozambican documents such as the PARPA. But the Mozambican leadership has also accepted the donor line; thus there seems no enthusiasm on either side for a change in policy. Mozambique has been a donor darling because of a combination of two factors – subservience to donor policy combined with apparently dramatic falls in poverty. If poverty is not falling, will that force a rethink on both sides? Can Mozambique and its donors pay less attention to Millennium Development Goals 2-6, and more time to MGD 1 – food, income and jobs? This is related to agricultural growth and the ‘green revolution’, which in turn requires a recognition that markets do not spring up by magic, but instead are created by the state. Will the government try to promote markets and the introduction of subsidised new technology, which will allow peasants to reduce their back-breaking work while producing more and raising their living standards?
23
References Addison, Tony et al. 2008. Escaping Poverty Traps - The Chronic Poverty Report 2008-09. London and Manchester: Chronic Poverty Research Centre.
Alanko, Kari. 2010. ‘Discurso proferido por Kari Alanka, Embaixador da Finlândia, por ocasião do encerramento da Revisão Anual de 2010’, statement at a public meeting May 19, 2010, Maputo, at http://www.pap.org.mz/.
Buffie, Edward and Atolia, Manoj. 2009. ‘Agricultural Input Subsidies in Malawi: Good, Bad or Hard to Tell?’, FAO Commodity and Trade Policy Research Working Paper 28, Rome: UN Food and Agriculture Organization
Castel-Branco. Carlos Nuno. 2008. ‘Aid and Development: A Question of Ownership?’ Colecçao de Working Papers do IESE, Working Paper 01/2008, at http://www.iese.ac.mz/lib/publication/AidDevelopmentOwnership.pdf.
Chang, Ha-Joon. 2008. Bad Samaritans: The Guilty Secrets of Rich Nations & the Threat to Global Prosperity. London: Random House.
Chinsanga, Blessings. 2007. Reclaiming Policy Space: Lessons from Malawi’s 2005/2006 Fertilizer Subsidy Programme. Brighton.: Future Agricultures Consortium Secretariat at the Institute of Development Studies at the University of Sussex.
Chinsinga, Blessings and O’Brien, Aoiffe. 2008. Planting Ideas: How Agricultural Subsidies are Working in Malawi. London: Africa Research Institute.
Congressional Budget Office (CBO). 1997. ‘The role of foreign aid in development: South Korea and the Philippines’, CBO Memorandum, Washington DC: Congressional Budget Office, at http://www.cbo.gov/doc.cfm?index=4306&type=0
Cunguara, Benedito and Kelly, Brendan. 2009a. ‘Trends in agriculture producers’ income in rural Mozambique’, study as input to Impact Evaluation Report (RAI) of PARPA II, Maputo, at http://www.open.ac.uk/technology/mozambique/p7_1.shtml; accessed March 15, 2010.
Cunguara, Benedito and Kelly, Brendan. 2009b. ‘The impact of the PARPA II in promoting the agricultural sector in rural Mozambique’, study as input to Impact Evaluation Report (RAI) of PARPA II, Maputo, at http://www.open.ac.uk/technology/mozambique/p7_1.shtml; accessed March 15, 2010.
De Renzio, Paolo and Hanlon, Joseph. 2009. ‘Mozambique: Contested Sovereignty? The Dilemmas of Aid Dependence’, in Lindsay Whitfield (ed.), The Politics of Aid: African Strategies for Dealing with Donors. Oxford: Oxford University Press.
Denning, Glenn et al. 2009. ‘Input subsidies to improve smallholder maize productivity in Malawi: Toward an African Green Revolution’, PLoS Biol 7(1): e1000023, at http://www.plosbiology.org.
Forum Nacional do MARP. 2008. Mecanismo Africano de Revisão de Pares, Relatório de Auto-Avaliação do País, Tomo I, Maputo: MARP, at http://www.marp.org.mz, last accessed March 18, 2010.
Government of Mozambique. 2006. Plano de Acção de Redução de Pobreza Absoluta 2006-2009. Maputo: Government of Mozambique.
Grupo de Estudo de Aprofundamento na área de Nutrição. 2009. ‘Relatório de Avaliação de Impacto do PARPA II 2006-2009’, study as input to Impact Evaluation Report (RAI) of
24
PARPA II, Maputo, at http://www.open.ac.uk/technology/mozambique/p7_1.shtml; accessed March 15, 2010.
Hanlon, Joseph. 2000. ‘Power without Responsibility: the World Bank & Mozambican Cashew Nuts’, Review of African Political Economy 83: 29-45.
Hanlon, Joseph. 2004. ‘Do donors promote corruption?: the case of Mozambique’, Third World Quarterly 25(4): 747-63.
Hanlon, Joseph. 2010a. ‘Mozambique: ‘the war ended 17 years ago, but we are still poor’’, Conflict, Security & Development 10(1): 77-102.
Hanlon, Joseph. 2010b. ‘How the Cold War shaped Mozambique today’, Paper for the conference Legacies of Conflict, Decolonisation and the Cold War, Lisbon, May 28-29.
Hanlon, Joseph, Barrientos, Armando and Hulme, David. 2010. Just Give Money to the Poor. Sterling: Kumarian.
Hanlon, Joseph and Mosse, Marcelo. 2009. ‘Is Mozambique’s elite moving from corruption to development?’, paper presented at the UNU-WIDER Conference on the Role of Elites in Economic Development, Helsinki, Finland, June 12-13
Hanlon, Joseph and Smart, Teresa. 2008. Do Bicycles Equal Development in Mozambique. Woodbridge: James Currey.
Harrison, Graham, Mulley, Sarah and Holtom, Duncan. 2009. ‘Tanzania: A Genuine Case of Recipient Leadership in the Aid System?’, in Lindsay Whitfield (ed.), The Politics of Aid. Oxford: Oxford University Press.
Hesselbein, Gabi. 2010a. The Economic Foundations of State-Building and State-Failure: A Political Economy of Sub-Saharan African States. forthcoming.
Hesselbein, Gabi. 2010b. ‘Economic Resource Mobilisation in DR Congo, Rwanda, Tanzania and Zambia: The Case of Agriculture’, London: Crisis States Research Centre, London School of Economics, forthcoming.
IMF. 2006. ‘Country Report No. 06/46: Republic of Mozambique: Third Review Under the Three-Year Arrangement Under the Poverty Reduction and Growth Facility’, IMF Country Report 06/46 , at http://www.imf.org/external/pubs/cat/longres.cfm?sk=18874.0.
Instituto Nacional de Estatistica e Ministério da Saúde. Taxas de baixo peso a nascença 2006-2008, at http://www.ine.gov.mz/sectorias_dir/saude_dir/Document.2010-01-27.8809667113; accessed March 15, 2010.
Instituto Nacional de Estatistica e Ministério da Saúde. 2008. IDS, Inquérito Demográfico e de Saúde. 2003. At http://196.22.54.6/mozdata/survey.php?id=4; accessed March 15, 2010.
Kaplinsky, Raphael. 2006. ‘Revisiting the Terms of Trade Revisited: What Difference does China Make?’ World Development 34(6): 981-95.
Kelly, Brendan. 2009. Trends in Child Poverty in Mozambique. A deprivations-based approach. Maputo: Government of Mozambique and UNICEF Mozambique, at http://www.open.ac.uk/technology/mozambique/p7_1.shtml; accessed March 15, 2010.
Killick, Tony; Castel-Branco, Carlos; and Gerster, Richard. 2005 ‘ Perfect Partners? The performance of programme aid partners in Mozambique, 2004’. Report to the Programme Aid Partners and Government of Mozambique. Maputo
25
Mather, D., Cunguara, B., Boughton, D. 2008. ‘Household income and assets in rural Mozambique, 2002-2005: Can pro-poor growth be sustained,’ MINAG Working Paper 66E, Maputo: MINAG.
MICS. 2008. Multiple Indicator Cluster Survey 2008. Maputo: Instituto Nacional de Estatistica e Ministério da Saúde. Not published, but some data in Kelly 2009.
MPF/IFPRI/PU (Mozambique Ministry of Planning and Finance/International Food Policy Research Institute/Purdue University). 2004. Poverty and well-being in Mozambique: the second national assessment (2002–3). Maputo: MPF/IFPRI/PU.
OECD Stat, Dataset: Creditor Reporting System (accessed February 17 and May 22, 2010).
OECD 2010. Do No Harm: International Support for Statebuilding, Paris: OECD. Independent study commissioned by the OECD DAC Fragile States Group.
Rosário, Carmeliza, Tvedten, Inge and Paulo, Margarida. 2008. ‘‘Mucupuki’: Social Relations of Rural-Urban Poverty in Central Mozambique’, CMI Brief 8.2, Bergen: Chr Michelsen Institute.
TIA, Trabalho de Inquérito Agrícola. Surveys conducted in 1996, 2002, 2003, 2005, 2006, 2007, and 2008 by the Direcção de Economia, Departamento de Estatistica, Ministério da Agricultura, Maputo. TIA 2005 and TIA 2006 were posted in 2009 on the website of the Instituto Nacional de Estatística (www.ine.gov.mz, most recently accessed March 15, 2010); other years only available on request from the Ministério da Agricultura.
Tvedten, Inge, Paulo, Margarida and Rosário, Carmeliza. 2009. ‘Monitoring and Evaluating Mozambique’s Poverty Reduction Strategy PARPA 2006-2009’, CMI Brief 8.1, Bergen: Chr Michelsen Institute.
UNCTAD, 2006. The Least Developed Countries Report 2006: Developing Productive Capacities. New York and Geneva: UNCTAD.
UNDP. 2009. Human Development Report 2009. New York: United Nations Development Programme.
Zavale, Helder, Mabote, Anabela, Paulo, Antonio, Donovan, Cynthia and Mlay, Gilead. 2009. ‘Food Prices Swings: the Case of Mozambique’, paper presented at FAO Workshop on Policies for the Effective Management of Food Prices Swings in African Countries, Maputo, June 23-24.
26
Crisis States Working Papers (series 2)
WP1 James Putzel, ‘War, State Collapse and Reconstruction: phase 2 of the Crisis States Programme’ (September 2005)
WP2 Simonetta Rossi and Antonio Giustozzi, ‘Disarmament, Demobilisation and Reintegration of ex-combatants (DDR) in Afghanistan: constraints and limited capabilities’, (June 2006)
WP3 Frederick Golooba-Mutebi, Gabi Hesselbein and James Putzel, ‘Political and Economic Foundations of State making in Africa: understanding state reconstruction’, (July 2006)
WP4 Antonio Giustozzi, ‘Genesis of a Prince: the rise of Ismail Khan in western Afghanistan, 1979-1992’ (September 2006)
WP5 Laurie Nathan, ‘No Ownership, No Peace: the Darfur Peace Agreement’, (September 2006) WP6 Niamatullah Ibrahimi, ‘The Failure of a Clerical Proto-State: Hazarajat, 1979-1984’ (September 2006) WP7 Antonio Giustozzi, “Tribes” and Warlords in Southern Afghanistan, 1980-2005’ (September 2006) WP8 Joe Hanlon, Sean Fox, ‘Identifying Fraud in Democratic Elections: a case study of the 2004 Presidential
election in Mozambique’ WP9 Jo Beall, ‘Cities, Terrorism and Urban Wars of the 21st Century’, (February 2007) WP10 Dennis Rodgers, ‘Slum Wars of the 21st Century: the new geography of conflict in Central America’,
(February 2007) WP11 Antonio Giustozzi, ‘The Missing Ingredient: non-ideological insurgency and state collapse in Western
Afghanistan 1979-1992’, (February 2007) WP12 Suzette Heald, ‘Making Law in Rural East Africa: SunguSungu in Kenya’, (March 2007) WP13 Anna Matveeva, ‘The Regionalist Project in Central Asia: unwilling playmates’, (March 2007) WP14 Sarah Lister, ‘Understanding State Building and Local Government in Afghanistan’, (June 2007) WP15 Pritha Venkatachalam, ‘Municipal Finance Systems in Conflict Cities: case studies on Ahmedabad and
Srinagar, India’, (July 2007) WP16 Jason Sumich, ‘The Illegitimacy of Democracy? democratisation and alienation in Maputo,
Mozambique’, (September 2007) WP17 Scott Bollens, ‘Comparative Research on Contested Cities: lenses and scaffoldings’, (October 2007) WP18 Debby Potts, ‘The State and the informal in sub-Saharan African economies: revisiting debates on
dualism’, (October 2007) WP19 Francisco Gutiérrez Sanín, Tatiana Acevedo and Juan Manuel Viatela, 'Violent liberalism? State,
conflict, and political regime in Colombia, 1930-2006: an analytical narrative on state-making', (November 2007)
WP20 Stephen Graham, 'RoboWar TM Dreams: Global South Urbanisation and the US Military’s ‘Revolution in Military Affairs’', (November 2007)
WP21 Gabi Hesselbein, 'The Rise and Decline of the Congolese State: an analytical narrative on state-making', (November 2007)
WP22 Diane Davis, 'Policing, Regime Change, and Democracy: Reflections from the Case of Mexico', (November 2007)
WP23 Jason Sumich, 'Strong Party, Weak State? Frelimo and State Survival Through the Mozambican Civil War: an analytical narrative on state-making', (December 2007)
WP24 Elliott Green, 'District Creation and Decentralisation in Uganda', (January 2008) WP25 Jonathan DiJohn, ' Conceptualising the Causes and Consequences of Failed States: A Critical Review of the Literature', (January 2008) WP26 James Putzel, Stefan Lindemann and Claire Schouten, 'Drivers of Change in the Democratic Republic
of Congo: The Rise and Decline of the State and Challenges For Reconstruction - A Literature Review', (January 2008)
WP27 Frederick Golooba Mutebi, 'Collapse, war and reconstruction in Uganda: An analytical narrative on state-making', (January 2008)
WP28 Frederick Golooba Mutebi, 'Collapse, war and reconstruction in Rwanda: An analytical narrative on state-making', (February 2008)
WP29 Bjørn Møller, 'European Security: the role of the European Union', (February 2008) WP30 Bjørn Møller, 'European Security: The Role of the Organisation for Security and Co-operation in
Europe', (February 2008) WP31 Laurie Nathan, 'Anti-imperialism Trumps Human Rights: South Africa’s Approach to the Darfur Conflict', (February 2008) WP32 Ben Moxham, 'State-Making and the Post-Conflict City: Integration in Dili, Disintegration in Timor-
Leste', (February 2008) WP33 Kripa Sridharan, ‘Regional Organisations and Conflict Management: comparing ASEAN and SAARC’,
(March 2008)
27
WP34 Monica Herz, ‘Does the Organisation of American States Matter?’ (April 2008) WP35 Deborah Fahy Bryceson, ‘Creole and Tribal Designs: Dar es Salaam and Kampala as Ethnic Cities in
Coalescing Nation States WP36 Adam Branch, ‘Gulu Town in War and Peace: displacement, humanitarianism and post-war crisis’
(April 2008) WP37 Dennis Rodgers, ‘An Illness called Managua’ (May 2008) WP38 Rob Jenkins, ‘The UN peacebuilding commission and the dissemination of international norms’ (June
2008) WP39 Antonio Giustozzi and Anna Matveeva, ‘The SCO: a regional organisation in the making’ (September
2008) WP40 Antonio Giustozzi, ‘Afghanistan: transition without end’ (November 2008) WP41 Niamatullah Ibrahimi, ‘At the Sources of Factionalism and Civil War in Hazarajat’ (January 2009) WP42 Niamatullah Ibrahimi, ‘Divide and Rule: state penetration in Hazarajat, from monarchy to the Taliban’
(January 2009) WP43 Daniel Esser, ‘Who Governs Kabul? Explaining urban politics in a post-war capital city’ (February
2009) WP44 Francisco Gutierrez et al, ‘Politics and Security in Three Colombian Cities’ (March 2009) WP45 Marco Pinfari, ‘Nothing but Failure? The Arab League and the Gulf Cooperation Council as Mediators
in Middle Eastern Conflicts’ (March 2009) WP46 Anna Matveeva, ‘The Perils of Emerging Statehood: civil war and state reconstruction in Tajikistan’ (March 2009) WP47 Jennifer Giroux, David Lanz and Damiano Sguaitamatti, ‘The Tormented Triangle: the regionalisation
of conflict in Sudan, Chad and the Central African Republic’ (April 2009) WP48 Francisco Gutierrez-Sanin, ‘Stupid and Expensive? A critique of the costs-of-violence literature’ (May
2009) WP49 Herbert Wulf and Tobias Debiel, ‘Conflict Early Warming and Response Mechanisms: tools for
enhancing the effectiveness of regional organsations? A comparative study of the AU, ECOWAS, IGAD, ASEAN/ARG and PIF’ (May 2009)
WP50 Francisco Gutierrez Sanin and Andrea Gonzalez Pena, ‘Force and Ambiguity: evaluating sources for cross-national research- the case of military interventions’ (June 2009)
WP51 Niamatullah Ibrahimi, ‘The Dissipation of Political Capital amongst Afghanistan’s Hazaras: 2001-2009’ (June 2009)
WP52 Juergen Haacke and Paul D. Williams, ‘Regional Arrangements and Security Challenges: a comparative analysis’ (July 2009)
WP53 Pascal Kapagama and Rachel Waterhouse, ‘Portrait of Kinshasa: a city on (the) edge’, (July 2009) WP54 William Freund, ‘The Congolese Elite and the Fragmented City’, (July 2009) WP55 Jo Beall and Mduduzi Ngonyama, ‘Indigenous Institutions, Traditional Leaders and Elite Coalitions for
Development: the case of Greater Durban, South Africa’ (July 2009) WP56 Bjorn Moller, ‘Africa’s Sub-Regional Organisations: seamless web or patchwork?’ (August 2009) WP57 Bjorn Moller, ‘The African Union as Security Actor: African solutions to African problems?’ (August
2009) WP58 Francisco Gutierrez Sanin, ‘The Quandaries of Coding & Ranking: evaluating poor state performance
indexes’ (November 2009) WP59 Sally Healy, ‘Peacemaking in the Midst of War: an assessment of IGAD’s contribution to regional
security’ (November 2009) WP60 Jason Sumich, ‘Urban Politics, Conspiracy and Reform in Nampula, Mozambique’, (November 2009) WP61 Koen Vlassenroot and Karen Büscher, ‘The City as Frontier: urban development and identiy processes
in Goma’, (November 2009) WP62 Antonio Giustozzi, ‘The Eye of the Storm: cities in the vortex of Afghanistan’s civil wars’, (November
2009) WP63 Kristof Titeca, ‘The Changing cross-border Trade Dynamics of north-western Uganda, north-eastern
Congo and southern Sudan’, (November 2009) WP64 Neera Chandhoke, ‘Civil Society in Conflict Cities: the case of Ahmedabad’, (November 2009) WP65 Gonzalo Vargas, ‘Armed Conflict, Crime and Social Protest in South Bolivar, Colombia (1996-2004),
(December 2009) WP66 Talatbek Masadykov, Antonio Giustozzi, James Michael Page, ‘Negotiating with the Taliban: toward a
solution for the Afghan conflict’ (January 2010) WP67 Tom Goodfellow, ‘Bastard Child of Nobody?’: anti-planning and the institutional crisis in
contemporary Kampala’ (February 2010) WP68 Jason Sumich, ‘Nationalism, ,Urban Poverty and Identity in Maputo, Mozambique’, (February 2010)
28
WP69 Haris Gazdar, Sobia Ahmad Kaker, Irfan Khan, ‘Buffer Zone, Colonial Enclave or Urban Hub? Quetta: between four regions and two wars’ (February 2010)
WP70 Azmat Ali Budhani, Haris Gazdar, Sobia Ahmad Kaker, Hussain Bux Mallah, ‘The Open City: social networks and violence in Karachi’ (March 2010)
WP71 Neera Chandhoke, ‘Some Reflections on the Notion of an ‘Inclusive Political Pact’: a perspective from Ahmedabad’ (March 2010) WP72 Sean Fox and Kristian Hoelscher, ‘The Political Economy of Social Violence: theory and evidence from a cross-country study’ (April 2010) WP73 Chris Alden, ‘A Pariah in our Midst: regional organisations and the problematic of Western-designated pariah regimes – the cases of SADC/Zimbabwe and ASEAN/Myanmar’ (May 2010) These can be downloaded from the Crisis States website (www.crisisstates.com), where an up-to-date list of all our publications including Discussion Papers, Occasional Papers and Series 1 Working Papers can be found.
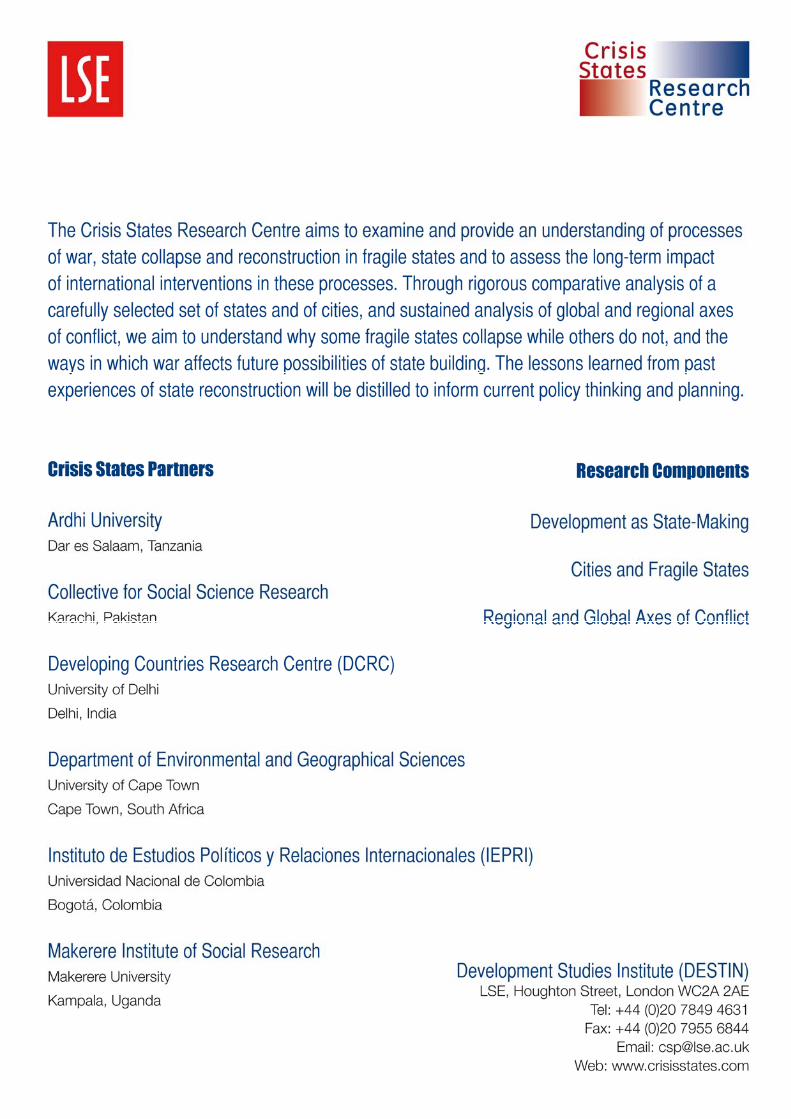
29


![Latornell hanlon 2013_11_22_ksw [read-only] (1)](https://img.pdfslide.net/doc/110x75/55c47010bb61eb4c288b4657/latornell-hanlon-20131122ksw-read-only-1.jpg)