Embed Size (px)
Citation preview
5757 S University Ave
Chicago IL 60637 Main 7737025599
bfiuchicagoedu
An Aliated Center of
WORKING PAPER middot NO 2019-52
Relinquishing Riches Auctions vs Informal Negotiations in Texas Oil and Gas LeasingThomas R Covert and Richard L SweeneyMARCH 2019
Relinquishing RichesAuctions vs Informal Negotiationsin Texas Oil and Gas Leasing lowast
Thomas R Covert dagger
Richard L Sweeney Dagger
March 2019
Abstract
This paper compares outcomes from informally negotiated oil and gas leases tothose awarded via centralized auction We use data on all contractual characteristicsand production outcomes for a class of state-owned mineral rights overlying newly dis-covered shale formations in Texas between 2005 and 2016 On roughly three quartersof this land the Texas Relinquishment Act of 1919 authorizes private individuals whoown surface-only rights to negotiate mineral leases on behalf of the public in exchangefor half of the proceeds The remainder are allocated via centralized auctions Usingvariation from this natural experiment we find that almost a century after leasingmechanisms were assigned auctioned leases generate 67 larger up-front paymentsthan negotiated leases do The two mechanisms also allocate mineral rights to differ-ent oil and gas companies and leases allocated by auction are 44 more productiveThese results are consistent with theoretical intuitions that centralized formal mecha-nisms like auctions outperform decentralized and informal mechanisms in both sellerrevenues and allocative efficiency Our findings have important implications for themore than $3 trillion of minerals owned by private individuals in the US the vastmajority of which transact in informal and decentralized settings
JEL Codes D44 L13 Q35
Keywords Auctions Decentralized Markets Oil and Gas Exploration and Production
lowastBoth authors declare they have no interests financial or otherwise that relate to the research describedin this paper nor do they have any current ties directly or indirectly to the energy industry We thankparticipants at numerous seminars as well as Peter Maniloff Aaron Flaaen Timothy Fitzgerald and PiotrDworczak for helpful comments Yixin Sun Eric Karsten Devin McNulty and Grace Park provided excellentresearch assistance Code for replication available at httpsgithubcomrlsweeneypublic cs texas
daggerUniversity of Chicago Booth School of Business and NBER ThomasCovertchicagobootheduDaggerBoston College sweeneribcedu
1
1 Introduction
Asset owners often need to identify and choose between potential contracting partners to
monetize their assetrsquos value For example companies that are the target of acquisition
may have multiple potential acquirers and research institutions looking to commercialize
intellectual property often decide among several possible partners Many land transactions
also look like this How should an owner go about this process The fact that buyer
valuations and even the identities of interested buyers may not be known to sellers provides
the starting point for rich literatures investigating theoretically optimal mechanisms or search
processes However there is little evidence on the consequences of less structured and likely
suboptimal allocation mechanisms used in the real world
In this paper we directly measure the gains from using a centralized theoretically high-
performing mechanism relative to using an informal decentralized mechanism in the market
for mineral leases in Texas We focus on a large class of lands set aside for public use under
the Texas Constitution on which legislative decisions made nearly one hundred years ago
determined whether leases signed during the recent shale boom transacted using an auction
or an informal ldquonegotiationrdquo1 Although the minerals within these lands belong to the State
on some parcels the Texas Relinquishment Act of 1919 grants the private individuals who
separately own the surface the right to negotiate terms with oil and gas companies on behalf
of the State in exchange for half of the revenues they generate Conversations with many
parties involved in Texas leasing confirm that these negotiated leases for public minerals
represent a useful analogue to the broader universe of negotiated leases for private minerals
in the United States
Our empirical strategy compares auctioned and negotiated leases that lie in narrowly
defined geographic areas which transact at approximately the same time Within these
location and time bins the resource quality is similar the information about its production
potential is constant and as we argue in section 4 the allocation mechanism is as good
as randomly assigned Using detailed data from more than thirteen hundred auctioned and
negotiated leases for publicly owned minerals in Texas between 2005 and 2016 we find
that auctioned leases sell for $709 per acre more than negotiated leases do This precisely
estimated difference is 67 of the average price of a negotiated lease so the causal effect of
auctions on seller revenues is economically important Furthermore this result is robust to a
wide range of controls and sample restrictions is not caused by differences in the likelihood
that auctioned and negotiated parcels have a successful transaction and even persists after
1Throughout the paper we use the term negotiation to refer to the informal search bargaining andsolicitation process that lessors use to award drilling rights on private land We describe what is knownabout this process in Section 2
2
conditioning on the resulting ex post investment and output For the average negotiated
lease in our data the difference in seller revenues is worth about $202000
In addition to this improvement in seller revenues which in principle could simply reflect
a transfer from buyers to sellers we also look for evidence of efficiency gains One theoret-
ically appealing feature of a well designed auction is that it should allocate an asset to its
highest value user Using the same empirical strategy we look for evidence of such allocative
efficiency gains by comparing measures of investment and output across auctioned and ne-
gotiated leases In our data auctioned leases are 22 more likely to be drilled and produce
44 more output than negotiated leases Combined with the fact that they also have slightly
higher royalty rates we estimate that on average auctions increase total seller revenue by
about $249000 per lease Moreover we show that while auctions allocate minerals to dif-
ferent firms the payment investment and output results all hold within firm suggesting
an important role for firm-lease ldquomatchrdquo in determining output As we discuss in section 7
the importance of match-based differences in productivity across potential lessees suggests
limited scope for ldquonudgerdquo style policy interventions which do not alter the mechanism used
to improve outcomes in decentralized markets
Our comparison of auctions to the unobserved distribution of informal mechanisms pro-
vides an empirical analogue to a rich theory literature comparing one formal mechanism to
another (Milgrom 2004 Klemperer 2004) Much of this work compares an auction to some
multi-stage mechanism either designed to highlight a feature or flaw of auctions or inspired
by the norms of a particular marketplace Bulow and Klemperer (1996) shows that sellers
gain more by adding an additional bidder to an otherwise unoptimized auction than they do
by having all the bargaining power perfect information and an optimally designed two-stage
mechanism One interpretation of this result consistent with our empirical findings is even
if the unobserved mechanisms embedded in our ldquonegotiationsrdquo are as seller-optimal as they
can possibly be centralized auctions will still perform better if they are able to attract more
competition
Subsequent work sought to incorporate entry costs into this comparison and considered
a sequential mechanism inspired by real-world corporate takeover battles Bulow and Klem-
perer (2009) show that while sequential transaction mechanisms can generate total welfare
gains relative to auctions by avoiding the excessive entry in auctions these gains mainly
accrue to buyers to the point that sellers should still prefer auctions Roberts and Sweet-
ing (2013) show that when entry is selective so that high value bidders are more likely to
participate sequential mechanisms can outperform auctions even those with optimally set
reserve prices They empirically verify these results using a structural model of auctions
with endogenous entry in the market for timber Wang (2018) arrives at a similar result in
3
a model of seller-optimal mechanisms for corporate takeovers Inspired by the recent growth
of ldquogo-shoprdquo sequential mechanisms in these markets she shows that depending on parame-
ter values the seller-optimal mechanism may involve sequential negotiations a simultaneous
auction or a take-it-or-leave-it offer to a specific potential buyer
As we discuss in section 7 the fact that we do not observe the details of the ldquomechanismsrdquo
employed in negotiations means that our results cannot empirically resolve any (surely con-
text specific) theoretical ambiguity on the ldquooptimalrdquo way to sell something Conversations
with industry participants suggest that features of the proposed sequential mechanisms from
the theory literature coexist with costly landowner search effort (Hortacsu and Syverson
2004 Allen et al Forthcoming Cuesta and Sepulveda 2018) bilateral bargaining (Backus
et al 2015 2018 Larsen 2014) and even some take-it-or-leave-it behavior on the part of
some buyers Rather the contribution of this paper is to demonstrate the magnitude of the
gains from using a fairly standard nearly optimal mechanism in a real world setting
As such this paper joins a small but growing empirical literature that compares the
performance of real-world non-auction mechanisms to auctions2 Larsen (2014) shows that
bilaterally negotiated used car transactions that follow failed auctions generate a large frac-
tion of the theoretical maximum available ex ante surplus suggesting that some commonly
used real-world mechanisms have performance comparable to optimal auctions Salz (2017)
documents large inefficiencies in the highly decentralized market for waste collection in New
York City and finds that intermediaries who perform procurement auctions on behalf of
their clients have spillover effects which reduce the costs of all buyers including those who
do not use intermediaries Finally Gentry and Stroup (2018) estimates a model of corporate
takeover auctions In each of these papers only one mechanism is observed in the data To
predict what would happen in a different mechanism the authors estimate the distribution
of preferences and costs using a structural model and then compute counterfactual market
outcomes under alternative mechanisms (in Larsen (2014) its the optimal mechanism in
Myerson (1981) in Salz (2017) its a pure search market in Gentry and Stroup (2018) its a
sequential mechanism with possibly selective entry) In contrast we observe the results of
auction and non-auction mechanisms simultaneously on otherwise identical objects As a
result we can directly compare welfare relevant outcomes across mechanisms
We also contribute to the large literature on the economics of oil and gas leasing in the
United States Early work by Ken Hendricks and Rob Porter on the performance of auctions
2There is also a corporate finance literature on mergers and acquisitions comparing auctioned and nego-tiated outcomes Subramanian (2007) finds that ldquoGo-shoprdquo deals in which private equity target firms areexplicitly allowed to solicit outside bids following an acquisition offer sell at higher prices than ldquoNo-shoprdquodeals do In contrast Boone and Mulherin (2007) find that auctioned takeover deals transact at roughly thesame prices as negotiated deals do
4
for mineral leases in the US Gulf of Mexico focused on the empirical relevance of common
values and information asymmetries (Hendricks and Porter 1996 1988) In symmetric in-
formation environments (auctions for ldquowildcatrdquo tracts) they showed that US government
auctions captured approximately 100 of the ex ante surplus while it captured considerably
less in asymmetric information environments (auctions for ldquodrainagerdquo tracts) In contrast
to this literature on the performance of sellers in the presence of informed vs uninformed
bidders in this paper we analyze seller performance under formal vs informal mechanisms
Recent work on mineral lease auctions has sought to separately identify affiliation from
synergies between neighboring parcels and to measure the extent to which bidders have
uncertainty about how many competitors they will face (Kong 2017 2016) Bhattacharya
et al (2018) examine the economic structure of the ldquosecurityrdquo sold by the winning bidder
to the auctioneer and find that the New Mexico State Land Officersquos choice of this security
is close to optimal relative to their estimates of the structural demand and cost primitives
To our knowledge our paper is the first to document the revenue and allocative efficiency
properties of non-auction mechanisms in mineral leasing
In addition to quantifying differences in investment and output between negotiated and
auctioned leases we also document for the first time the exact level of revenues that private
landowners earn from oil and gas development Approximately three quarters of all mineral
rights in the United States are held by private individuals However the vast majority
of leases on these lands are incompletely recorded in county registries In particular it
is common for EampP companies to record a placeholder value for bonus payments in their
public lease filings often ldquo$10 plus other consideration paidrdquo Moreover most mineral leases
are developed as a part of larger ldquounitsrdquo in which several leases are combined into a single
project This ldquounitizationrdquo creates a challenge for matching publicly documented drilling
and production data to individual mineral owners As a result little is know about total
landowner revenues in mineral rights contracts In our setting we observe the full set of
payments received by the State and private surface owners including bonus payments and
royalty revenue even on unitized leases Previous literature on the landowner benefits of the
fracking boom was not able to directly measure revenues in this way (Brown et al 2016
Feyrer et al 2017 Bartik et al 2017) We find that bonus payments represent 80 of total
landowner revenue earned to-date for the average lease and by construction they are the
entirety of landowner revenues for the two thirds of leases that are never drilled Precisely
quantifying these landowner benefits provides important context to the growing number of
papers documenting large local negative externalities from fracking (Muehlenbachs et al
2015 Currie et al 2017)
The rest of the paper proceeds as follows In Section 2 we describe the mineral leasing
5
process and provide background information on our natural experiment in Texas Section 3
discusses the data we use and the filtering criteria we apply to it Section 4 describes our
empirical strategy and identification argument and Sections 5 and 6 present the results In
Section 7 we discuss possible mechanisms for our results before concluding in Section 8
2 Background
21 Mineral Exploration and Production in the United States
The US Energy Information Administration estimates that at the end of 2017 oil and gas
companies in the United States had proved reserves of 42 billion barrels of oil and 464 trillion
cubic feet of natural gas As of December 31 2017 these reserves were worth more than
$45 trillion3 Although more than three quarters of these deposits lie in land owned by
private individuals (Fitzgerald and Rucker 2016) landowners must partner with oil and gas
exploration and production companies (EampP) to transform their reserves into revenue
Partnerships between land owners and EampP companies are formalized through mineral
lease agreements which are contracts with three key elements a primary term before which
the lessee (the EampP company) must begin drilling a royalty rate providing the lessor (the
landowner) with a share of any realized drilling revenues and an upfront bonus payment to
secure the right to explore4 Lessees frequently elect not to drill any wells before the con-
clusion of the primary term and even when they do realized drilling does not always result
in economically viable quantities of production As a result most leases never receive any
royalty revenues so bonus payments are a particularly important aspect of landowner wel-
fare However despite their conceptual importance in this market little is known about the
distribution of bonus payments because they are usually not recorded in the mineral leases
filed in county registries Many leases also include clauses regarding operations cleanup and
other landowner protections (Vissing 2017)5
Mineral leases are typically initiated by EampP companies rather than by landowners An
EampP company will conduct background research and decide to acquire drilling rights in a
particular geographic location During this acquisition phase EampPrsquos often work through
intermediaries known as ldquolandmenrdquo6 One reason that EampP companies use landmen is that
3According to EIA data oil prices were $6673 per barrel (Brent) and natural gas prices were $369 permillion BTU (Henry Hub)
4This contract structure has important incentive implications as positive royalty rates provide incentivesfor lessees to drill later in the contract and finite primary terms provide incentives for lessees to drill earlierin the contract See Herrnstadt et al (2018)
5We study these ldquolease addendardquo formally in Appendix C6Landmen are also used in surface rights transactions such as siting pipelines or wind farms
6
a given firmrsquos need for new mineral leases may vary over time and the skills necessary to
find landowners verify their claim to mineral interests and convince them to lease can be
too expensive for an EampP company to consistently maintain in-house EampP companies can
also use landmen to sign leases on their behalf keeping the EampP companyrsquos identity secret
from potential lessors and from competing firms
22 Texas Relinquishment Act
Private mineral rights are a uniquely American phenomenon When individuals outside
of the US purchase surface rights to a piece of land local or central governments retain
ownership and authority over the minerals underground Because Texas was originally a
Spanish colony early land transactions in Texas followed a similar pattern when a private
individual bought land the King of Spain retained the mineral rights
After declaring independence in the mid 19th century the Republic of Texas appropriated
millions of acres of unsettled land for public use Eventually the Texas Constitution of 1876
allocated half of this land to benefit public schools The rules for transactions on the 8
million acres of land largely in West Texas contained in this ldquoPermanent School Fundrdquo
(PSF) were formalized in 1895 When PSF land was subsequently sold to private citizens
Texas following in Spanish tradition retained the rights to exploit minerals beneath the
surface The surface ownerrsquos remedy for damages resulting from any mineral exploration
and development was a mere $010 per acre annual fee7
When oil was discovered in Texas at the turn of the 20th century many surface owners
of PSF land argued that this compensation was inadequate8 To stave off ldquoarmed rebellionrdquo
by the surface owners against state lessees the Texas legislature passed the Relinquishment
Act of 1919 (Shields 1981) This law amended and reinterpreted through a decade and a
half of subsequent litigation appointed the surface owner as the minerals leasing agent of the
state provided that the surface ownerrsquos parcel had been acquired from the PSF by 19319
In exchange for negotiating a lease on the statersquos behalf surface owners were awarded half
of bonus and royalty payments generated from their land
Following the passage and eventual legal settlement of the Relinquishment Act in 1931
the mineral status of land sold from the PSF took on two forms Transactions between
1931 and 1973 explicitly awarded the majority of minerals to new surface owners On
7Interestingly when Texas declared independence it released full ownership of minerals on parcels priva-tized during colonial control to surface owners
8Although small quantities of oil were observed in Texas prior to that point recovery in large quantitieshad proved elusive prior to the massive gusher well at Spindletop in 1901 This well is largely cited as theadvent of the oil age in the United States (Yergin 2008)
9The Texas Supreme court finalized their interpretation of the Relinquishment Act in mid 1931
7
these ldquoFree Royaltyrdquo lands the state retained just a 116th royalty interest and no bonus
interest Starting in 1973 the state explicitly retained all mineral interests in subsequent
land transactions As a result land in the initial PSF belongs in one of four categories land
governed by the Relinquishment Act (which we refer to as ldquoRALrdquo parcels) with a 5050
split of the mineral interest between the surface owner and the State land sold between
1931 and 1973 in which the State retains a minority royalty interest land sold after 1973
in which the state owns the entirety of the mineral interest and land not yet sold in which
the state owns the entirety of the surface and minerals Our primary interest in this paper is
a comparison of leasing activity on Relinquishment Act lands with leasing activity on other
PSF land not sold as of 1973 Leases on these types of land are managed by the Texas
General Land Office with rigorous and publicly observable record keeping of all contractual
terms Since leases on Free Royalty Land are not managed by the GLO bonus payments on
theses leases are not publicly recorded
When a surface owner of an RAL parcel is approached by an EampP company she initially
negotiates a lease in the same fashion as she would if she owned a parcel with private mineral
rights However once the surface owner and the EampP company reach an agreement they
must submit their lease to the GLO for final approval If approved the lessee remits half
of the bonus and royalty payments to the state For PSF land sold after 1973 or not yet
sold the state directly leases mineral rights to EampP companies However unlike leases on
RAL parcels or the broader population of private leases the state awards leases on these
non-RAL parcels using an auction In these auctions bidders compete for leases with a fixed
primary term and royalty rate so the cash bids are analogous to the bonus payment on a
negotiated lease The state awards the lease to the highest bidder at the bonus payment
that bidder submitted10 In the event that an EampP company wishes to sign a lease in an
RAL parcel and the surface owner cannot be found the GLO will conduct an auction for
the lease using its standard process and the surface ownerrsquos share of the proceeds either go
into escrow or are forfeited to the State of Texas As a result there are a small number of
auctioned leases on RAL parcels which we include in our sample of auctioned leases below
10Similar processes are used in state land offices outside of Texas and at the Federal level
8
3 Data
Our primary dataset consists of the universe of oil and gas leases signed on PSF land in Texas
between 2005 and 20161112 Our initial dataset includes the shape location size effective
date bonus payment primary term and royalty rate for 4076 RAL leases 111 of which are
allocated by auction and 851 State leases For all leases that eventually result in drilling we
observe monthly payments for gas and oil royalties remitted to the state up through June
2018 We combine this with royalty rate and output price13 information to infer which leases
were drilled and monthly oil and gas production for drilled leases
We spatially intersect this lease-level dataset with a parcel map of all lands in the PSF
We acquired this map from P2Energy Solutions a private contractor which performed the
title research on Relinquishment Act lands for the State of Texas P2Energy Solutions
determined the time at which each parcel in this map was initially privatized or if it has not
yet been privatized We use this map of parcels to characterize differences in the likelihood
of a successful lease across negotiation (RAL) and auction (non-RAL) parcels
GLO uses first price sealed bid auctions to allocate its non-RAL leases14 For every
parcel that is nominated by an EampP company for inclusion in the next GLO auction we
observe a ldquobid noticerdquo describing the parcel itself the date that the auction will be held15
and the reserve price Following the auction we observe the name of each bidder who bid
above the reserve as well as their bid We infer that a parcel received no bids above the
reserve price if it exists in a bid notice but does not subsequently show up in the post-auction
bid data
11In addition to the PSF the GLO also manages mineral leasing for land owned by several ldquoLand Boardsrdquoincluding those for Veterans Parks amp Wildlife the Department of Criminal Justice as well as land under-neath state roads waterways and water bodies Leases for this land are also allocated by auction and areincluded in the GLOrsquos public lease data However we do not use it in this project as the ldquoassignmentrdquo tothe auction treatment is not quasi-random as in the PSF
12We also collected data from the universe of parcels from another public entity in the Texas the TexasBoard for Lease of University Lands However while leases on University Lands are allocated in centralizedauctions they are not directly comparable leases on RAL parcels because the parcels are much larger andmore contiguous University Lands parcels are also infrequently situated near RAL parcels Finally Uni-versity Lands parcels have been acquired over time and do not fit the clean quasi-experimental comparisonwith leases on RAL parcels discussed in Section 4
13We use the Henry Hub price for natural gas royalties and the WTI price for oil royalties14Note that in Texas these procedures are formally called ldquosealed bid salesrdquo and are never referred to as
auctions in an effort to distinguish them from a prior era of open outcry English auctions15GLO conducts two to four centralized auctions per year each of which includes hundreds of parcels from
the PSF and other publicly owned land funds in Texas
9
31 Data cleaning and sample selection
We impose a number of restrictions on these data to obtain our final sample16 First we
restrict the sample to leases lying on top of a shale formation as our empirical strategy
leverages the unexpected shock to the value of land from the fracking boom which occurred
decades after the Relinquishment Act17 Additionally we exclude leases that have missing
values for one or more contractual characteristics (bonus royalty primary term size or
location) leases with undivided18 ownership issues leases whose GIS shapes are inconsistent
with their stated size leases smaller than 10 acres or bigger than 1000 acres19 leases with
primary terms shorter than 12 months a small number of non-RAL leases that were actually
allocated by negotiation20 and a smaller number of leases acquired by the PSF after its
initial allocation The resulting dataset of 860 negotiated leases and 460 auctioned leases is
summarized in Table 1 Figure 1 demonstrates the distribution of lease types over time
Figure 1 Sample Leases by Year and Type
In the cross section after imposing these sample restrictions auctioned leases are larger
have slightly ldquomore convexrdquo shapes and are less likely to cover more than one legally defined
16Table A6 shows how many of the initial observations survive each of these cuts17We use the EIArsquos definition of shale formations in Texas shown shaded in yellow in Figure A118ldquoUndividedrdquo ownership refers to shared ownership of real property by two or more parties For example
if parents John and Mary bequeath their 640 acre parcel to their two children Bob and Jane then Bob andJane each have an undivided interest in the parcel In principal it is possible for Bob and Jane to separatelylease their respective undivided interests to different oil and gas companies
19Individual parcels we observe in the Texas Permanent School Fund are never more than 1000 acres andGLO rarely auctions leases that cover more than one parcel
20Some non-RAL land is allocated via bilateral negotiation when it is situated in a position where onlyone party can economically use it
10
Table 1 Lease Summary Statistics by Type
Negotiation (N = 860) Auction (N = 460)
Variable mean sd min max mean sd min max Difference p-value
Land CharacteristicsAcres 029 026 001 100 035 025 001 077 -007 000ShapeQuality 094 014 010 100 096 010 028 100 -001 006MultiPolygon 005 022 000 100 003 016 000 100 002 002
Lease CharacteristicsBonus 106 144 003 2684 204 247 002 1512 -098 000Term 4624 1388 1200 6000 5718 773 3600 6000 -1094 000RoyaltyRate 024 002 019 025 025 001 020 025 -001 000
Lease OutcomesDrilled 037 048 000 100 032 047 000 100 005 007Output 018 044 000 401 018 039 000 237 000 100Revenue 261 437 003 4217 365 454 002 3359 -104 000
Units acres are reported in thousands bonus and revenue are all reported in thousands of nominal dollars peracre output is reported in thousands of barrels of oil equivalent per acre term is reported in months Definitionsshape quality is the ratio of the leasersquos size to the size of the convex hull containing it ldquoMultiPolygonrdquo leaseshave claims to minerals in multiple adjacent or disjoint parcels we define a lease as ldquodrilledrdquo if it ever reportsa royalty payment
11
piece of land although the differences in these measures are small They also generate
substantially higher bonus payments (per acre) and pay slightly higher royalty rates while
auctioned leases have longer primary terms Auctions are slightly less likely to be drilled
produce equivalent amounts of output and the difference in total revenues (bonus payments
plus royalty income) is similar to the difference in bonus payments Figure 1 shows that
auctions are not consistently prevalent over time In particular there are relatively few
auctions in 2009 (when oil prices temporarily crashed during the financial crisis) and in
2012 (when gas prices reached lows not seen in a decade) Appendix Figure A1 shows
that auctioned and negotiated leases are also not evenly distributed across space except
possibly in West Texas where the Permian Basin shale play has recently experienced a
surge in leasing activity These differences in timing and location underscore the importance
of flexibly controlling for these factors in our empirical specifications below
4 Empirical Strategy
We use these data to measure how formal auctions effect lease outcomes including seller
revenues investment and production relative to outcomes on negotiations In the ideal
experiment we would have randomized mechanism type formal auction or informal negoti-
ation among a population of private mineral owners on top of shale formations on the eve
of the fracking boom In practice our sample consists of leases on the parcels that were
placed in the PSF by the Texas Constitution of 1876 and subsequently revealed to overlie
shale formations in the early 2000s21 Within this sample mechanism assignment is deter-
mined not by randomization but by the date on which a parcel was subsequently privatized
Our auction ldquotreatmentrdquo group contains leases on parcels that were not privatized before
1973 and as such are allocated using a formal auction Our ldquocontrolrdquo group of informally
negotiated leases lie in parcels that were privatized before 1931 when the Relinquishment
Act was finalized22 Thus to interpret differences in outcomes between these two groups as
representing the causal effects of auctions relative to informal negotiations we must assume
that classification into these two groups is uncorrelated with unmeasured determinants of
lease outcomes during the recent shale boom
To assess this assumption note that we are able to directly control for the two primary
21As described in Section 31 we exclude areas of the PSF allocation which were not affected by the recentshale boom However in this section we refer this subsample loosely as the ldquoPSFrdquo
22As discussed in Section 2 parcels in the missing group from this target population so-called Free Royaltyparcels sold between 1931 and 1973 are also informally negotiated However because the State of Texasonly retained a 116th royalty interest in these parcels the entire bonus accrues to surface owners whichthe GLO does not observe As a result although leases on these parcels are negotiated we canrsquot comparetheir bonus payments with the auction sample
12
determinants of lease outcomes where leases are and when they transact Leases on parcels
with better mineral resources may transact at higher prices attract more investment and
produce more output Similarly leases that occur during periods of high output prices or
increased technological progress may earn higher prices or generate better outcomes To
ensure that differences in location andor time do not confound our comparisons between
the two lease types we directly control for space and time using a set of location and time
fixed effects or by estimating a non-parametric control function for location and time Both
of these strategies ensure we are making comparisons between leases with similar mineral
quality which transact at similar times We also condition on detailed information about
how the surface is used and how far the parcel is from other potentially valuable features like
water and roads Thus our identification assumption is that whether a parcel was sold prior
to 1931 or later than 1973 is independent of any residual determinants of lease outcomes
during the shale boom after controlling for time space and other surface qualities
The main threat to the validity of this assumption is the possibility that the forces which
determine when a PSF parcel was privatized (if at all) are correlated with these residual
unobserved determinants of lease quality in the current shale environment For example if
land buyers in the pre-1931 era had knowledge about which parcels in narrowly defined areas
would be better or worse producers in the modern shale environment they might rationally
have acquired the ldquogoodrdquo parcels leaving only ldquobadrdquo parcels for future auctions Similarly
if the State of Texas had equivalent knowledge and wished to retain ldquogoodrdquo parcels for their
eventual participation in mineral lease auctions during the shale era RAL parcels would be
worse on average Both of these scenarios require widespread knowledge about the precise
location of the best mineral resources several decades before shale formations were discovered
or the technology to access them was invented We view this as unlikely Moreover its worth
noting that that when many of these RAL parcels were initially privatized the State of Texas
explicitly intended to retain full rights on any subsequent mineral revenues The 5050 split
that exists in RAL leases today was only a consequence of mineral discoveries that occurred
in other parts of the state after the PSF rules were established
Though we canrsquot directly test whether our assumption that controls for location time
and surface characteristics leave only ldquorandomrdquo variation in outcomes we can check whether
parcels governed by the Relinquishment Act appear similar on observable dimensions to
parcels subject to auctions Table 2 presents a series of balance tests where we regress
potentially confounding observable characteristics onto Auctioni and location fixed effects
Auction and negotiation parcels appear very similar with no measurable differences in shape
quality land cover or distance to infrastructure The one exception is parcel size auction
parcels are smaller and the difference is precisely estimated even after conditioning on
13
geographic location Because of this we control for lease size using a cubic spline in the
leasersquos acreage with five knots in all of our regression specifications23
Table 2 Parcel comparison
Acres Shape Road Dist Dev High Dev Low Cultivated Forest
-69342 -0007 -37646 0002 0010 0002 0002Auction
(19180) (0006) (154534) (0002) (0006) (0006) (0007)
N 1747 1747 1747 1747 1747 1747 1747R2 0451 0467 0422 0304 0415 0633 0793
Definitions acres in thousands shape quality is the ratio of parcel size to the size of the convex hullcontaining the parcel road distance is the distance in meters from the parcelrsquos centroid to the nearestroad developed high and low cultivated and forests are land cover measures listed in percentagepoints All models include fixed effects for the 10 mile grid containing the centroid of the parcel andstandard errors are clustered at the grid level
With these assumptions in mind we estimate several versions of the following regression
Yi = τAuctioni +Xiβ + δL(i)T (i) + 983171i (1)
where Yi is a lease outcome of interest and Auctioni is an indicator that is equal to one
if the lease was allocated by auction Xi is the a spline in the leasersquos size in acres its
primary term in months its royalty rate and in some specifications the ldquoqualityrdquo of the
leasersquos shape24 a dummy variable indicating whether the lease covers more than one parcel
its distance to infrastructure and satellite measures of its landcover characteristics δ is
a set of location and time fixed effects location-by-time fixed effects or a non-parametric
function of location and time Since there is no a priori sense in which a given fixed effect
specification ldquocorrectlyrdquo controls for the effects of location and time on lease outcomes
we estimate these models using several fixed effect specifications as well as specifications
that non-parametrically control for location and time by combining the Robinson (1988)
transformation with modern random forest techniques (Athey et al 2019)25 τ thus reflects
the difference in outcomes for auctioned leases relative to negotiated leases within leases
that have similar size are located nearby transact at similar times and have comparable
23Note that while negotiation parcels are larger than auction parcels the reverse is true of sample leases24We define Shape Quality as the ratio of the leasersquos area to the area of the convex hull containing the
lease25Specifically we estimate these models by separately projecting Y Auction and X onto the leasersquos
GPS coordinates L(i) and effective date T (i) using random forests and then regress the residuals Yi minusE [Y | L(i) T (i)] onto the residuals Auctioni minusE [Auction | L(i) T (i)] and Xi minusE [X | L(i) T (i)] We reportheteroskedasticity robust standard errors for the Auction coefficient in these specifications consistent withthe results in Robinson (1988)
14
characteristics
5 Seller Revenue Results
We begin by investigating the impact of auctions on seller revenues estimating several ver-
sions of Equation 1 with bonus per acre as the dependent variable
Table 3 presents the results In column 1 we include fixed effects for the year-quarter
of the leasersquos effective date and for the 10 square mile grid containing the leasersquos centroid
The interpretation of this estimate is that auctioned leases receive $584 more per acre in
bonus payments than similar negotiated leases a difference which is precisely estimated
This difference is 55 of the average per-acre bonus payment for RAL leases in Table 1
In column 2 we interact the grid indicators with year of sample indicators to account for
the fact that different locations in Texas were developed at different times in our sample
With these interactive fixed effects the estimated auction coefficient is larger still precisely
estimated and is 67 of the average negotiated bonus payment This model which compares
leases for minerals that are located at roughly the same space and which transact at roughly
the same point in time is our main specification
Table 3 Bonus Payments and Mechanism Type
( 1 ) ( 2 ) ( 3 ) ( 4 ) ( 5 ) ( 6 )
58452 70885 100870 65810 71721 71815Auction
(24802) (34220) (49063) (25645) (16032) (34091)
Grid 10 10 10 20 RF 10Time Q GYQ GYQ GYQ RF GYQExtra No No No No No YesN 1320 1320 1320 1320 1320 1320R2 0584 0760 0895 0677 0046 0763
The dependent variable in each regression is the bonus payment ($) per acre In columns1-4 and 6 the size of the location bins in miles are indicated in the ldquoGridrdquo row whilethe structure of the time controls (ldquoQrdquo for quarter of sample ldquoGYQrdquo for grid-by-yearplus quarter of sample and ldquoGYQrdquo for grid-by-quarter of sample) are indicated in theldquoTimerdquo row Standard errors are clustered by grid in columns 1-4 and 6 Column 5 usesa Robinson (1988) transformation using random forests with heteroskedasticity-consistentstandard errors All models include a spline in acres and linear terms for term length androyalty rate ldquoExtrardquo controls include shape regularity a dummy variable for whether thelease spans multiple parcels surface cover measures and distance to roads and water sourcesThe average negotiated bonus payment is $1060 per acre
In the remaining columns we investigate the sensitivity of these results to the inclusion
15
of additional controls26 In column 3 we include location-quarter-of-sample fixed effects to
impose more stringent limits on which leases can be compared over time This results in an
even larger and still-precise estimate at $1009 per acre the difference is on par with the
average negotiated bonus payment To ensure that our results are robust to different choices
of spatial controls in column 4 we use 20 square mile grids instead of 10 square mile In
column 5 we replace the grid and time fixed effects with a non-parametric control for the
leasersquos location and time using random forests Finally in column 6 we include controls for
other measures of surface quality like the quality of the leasersquos shape an indicator for whether
the lease spans multiple parcels the distance from the lease to roads and water infrastructure
and satellite measures of the leasersquos landcover Across all of these specifications we find
consistent evidence that bonus payments are substantially larger in auctions than they are
in negotiations27
Even at the lower end of these estimates the implications for seller revenue are large
For an RAL lease of average size the causal effect of auctions on seller revenues is worth
about $167000 In aggregate this increase in RAL bonus payments would be worth about
$143 million in our sample
51 Extensive Margin Considerations
The results in Table 3 show that auctioned transactions occur at substantially higher prices
than negotiated transactions However this is a comparison between successful transactions
and not all attempted transactions are successful auctions fail if they attract no bids at or
above the posted reserve price and negotiations analogously fail when surface owners demand
bonus payments royalties primary terms or additional protective clauses in leases that
exceed the ldquowillingness-to-payrdquo of their contracting partners When attempted transactions
fail the short-run welfare of landowners and their potential contracting partners is effectively
zero Thus if failures are common and differentially likely across the two mechanisms the
true welfare differences between them could be quite different from the observable revenue
differences To interpret our revenue differences in welfare terms we must check for the
presence of differences in the mechanism-specific probability of a successful transaction
For auctioned leases we can directly compute the probability of a successful transaction
because we observe the list of parcels that go up for auction as well as the subsequent
bids Among GLO auctions on PSF land 45 of nominated parcels failed to receive a
26In appendix A2 we report estimates of the models in Table 3 with the natural logarithm of bonuspayments as the left-hand side variable
27Table 1 shows imperfect balance between auction and negotiated leases across many of our conditioningvariables even after making the aforementioned sample restrictions To verify that our results are still robustto any latent bias due to this imbalance we estimate overlap-weighted treatment effects in Appendix A4
16
qualifying bid so on a per-transaction basis failure is quite common The GLO often offers
to sell these failed parcels again in future auctions to the point that 72 of all observed
nominated parcels transact at some point in our sample Given that auctions donrsquot always
clear even after repeated attempts at transaction it could be the case that the difference in
seller revenues we observe on successful transactions could be offset by a higher likelihood
of transaction among RAL negotiations
Unlike auctions we donrsquot observe attempted RAL negotiations that fail so we observe
neither the likelihood of ldquonominationrdquo nor the probability of successful transaction condi-
tional on being nominated However we can still characterize the total extensive margin
differences between auctions and negotiations inclusive of both differences in nomination
and transaction success by comparing the number of parcels that could ever have a trans-
action under a given mechanism with the number of those parcels on which we actually
observe a lease
We first visualize the rate at which auction and negotiation parcels are leased over time
in Figure 2 For each 10-mile by 10-mile grid we compute the fraction of auction and
negotiation parcels that have been leased at least once by the start of a given month and
plot the average across grids for each month between January 2005 and December 2016
Visually the arrival rate of a parcelrsquos first successful transaction is comparable across the
two mechanisms providing initial evidence that differences in the nomination process or
probability of a successful transaction are unlikely to be important To ensure that differences
across parcels in size shape quality land cover characteristics or distance to infrastructure
donrsquot mask differences in the likelihood of a successful lease we also report estimates of
parcel-level regressions in Table 4 The left-hand-side variable is a dummy indicating that
at least one lease occurs during our sample period (2005-2016) Across different spatial
controls and accounting for differences in observables on the surface these models reveal no
statistically or economically significant differences in the probability of a parcel being leased
in our sample Given these results it does not appear that any extensive margin corrections
are necessary to interpret the bonus results reported above
52 Robustness Checks
As we discussed in section 4 our key identifying assumption is that land that was initially
owned by the state but sold between 1895 and 1931 is similarly valuable for todayrsquos hydro-
carbon exploration as land from the same allocation that was sold after 1973 or is not yet
sold While we believe it is unlikely that the timing of early land transactions would be cor-
related with the productivity of shale formations that were unknown until the early 2000rsquos
17
Figure 2 Time to First Lease for Auction and RAL Parcels
Average across 10 square mile grids of the fraction of parcels that have leased at least once since January
2005 by parcel type
Table 4 Likelihood of Leasing and Mechanism Type
( 1 ) ( 2 ) ( 3 ) ( 4 ) ( 5 ) ( 6 )
0003 0008 0013 0004 0009 0014Auction
(0020) (0019) (0016) (0019) (0018) (0016)
Grid 20 10 RF 20 10 RFExtra No No No Yes Yes YesN 1747 1747 1747 1747 1747 1747R2 0748 0805 0017 0750 0808 0029
The dependent variable equals 1 if a parcel was ever leased and 0 otherwise Incolumns 1-2 and 4-5 the size of the location bins in miles are indicated in the ldquoGridrdquorow Standard errors are clustered by grid in columns 1-2 and 4-5 Columns 3 and 6use a Robinson (1988) transformation using random forests with heteroskedasticity-consistent standard errors All models include a spline in the size of the parcel inacres and models with ldquoextrardquo controls include shape regularity surface cover anddistance to roads and water sources
18
our empirical specifications include flexible spatial controls to account for any differences in
geology across leases governed by the two mechanisms Moreover within narrowly defined
locations Table 2 shows that the land for auctioned and negotiated leases are similar on
a host of observable characteristics Finally although Figure 2 shows leases on unleased
parcels occur at similar times within these narrowly defined grids our main specifications
include additional space-by-time controls This ensures that we are making comparisons
between leases that transact in both similar places and similar times
Nevertheless if our identification assumptions were wrong and auctioned leases were
somehow easier to develop then EampPrsquos would rightly pay more for these parcels but our
conclusion that auctions have a causal effect on seller revenues would be incorrect As an
extreme test of this sort of reverse causality we look for differences in bonus payments
conditional on ex-post measures of lease value We observe investment (in the form of
drilling) and production (in the form of product-specific royalty revenues) for each lease
and can thus directly measure the extent to which accurately anticipated differences in these
outcomes explain ex ante bonus payment differences To do this we add investment and
production as covariates to our standard bonus payment regressions as shown in Table 5
Columns 1 and 2 of this table show that while EampP companies are willing to pay more
for parcels that are eventually drilled they continue to pay more in auctions even after
conditioning on drilling decisions The estimated coefficient on the Auction variable is still
large precisely estimated and in the same ballpark as our main specification in Table 3
Columns 3 and 4 show that this remains true even if we condition on realized production
As in the first two columns we do see evidence that leases which ultimate produce more
output do earn higher bonus payments but this does not diminish the difference in up front
payments between auctioned and negotiated leases
Another identification concern relates to a form of exclusion restriction implied by our
empirical strategy To conclude that the difference in bonus payments between auctioned
and negotiated leases is caused by the mechanism itself we must assume that there are no
other channels through which the Relinquishment Act affects lease outcomes One potential
confounder is the difference in surface ownership between auctioned and negotiated leases
The Relinquishment Act specifically allows a subset of private surface owners to perform
negotiations so all of our negotiated leases have private surface ownership In contrast
some auctions occur on PSF parcels that were never sold and as a result have state surface
ownership Private surface ownership itself could reduce the value of a negotiated lease if
for example private surface owners have houses or livestock on their property or if EampP
companies simply face additional constraints on drilling relative to leases where the state
controls the surface If these constraints made negotiated leases more difficult to develop
19
Table 5 Bonus Payments and Mechanism Type Robustness
( 1 ) ( 2 ) ( 3 ) ( 4 ) ( 5 ) ( 6 )
70039 70457 68151 68195 63053 85858Auction
(35312) (16413) (36098) (16734) (65126) (24085)16149 23751
Drilled(20709) (11796)
034 041Output
(034) (015)
Estimate G10Y RF G10Y RF G10Y RFSample All All All All Private PrivateN 1320 1320 1320 1320 1103 1103R2 0760 0051 0761 0060 0755 0053
The dependent variable in each regression is bonus ($) per acre In columns 5 and6 the same is restricted to leases with strictly private surface ownership Columns1 3 and 5 use fixed effects for year-by-10-mile grid as well as quarter of sampleColumns 2 4 and 6 use a random forest to semi-parametrically control for locationand time Standard errors clustered by location in columns 1 3 and 5 and areheteroskedasticity-consistent in columns 2 4 and 6 All models include a spline inacres and linear terms in term length and royalty rate
EampP companies would rationally pay less to lease them but this difference in payment would
not be caused by the difference in mechanisms
To ensure that our results are not driven by differences in private surface rights we
restrict our analysis to parcels where the state does not own surface rights Among this
subsample there are two types of auctioned leases First as previously discussed a small
number of leases on RAL parcels are auctioned when the state cannot locate the surface
owner Second land sold from the PSF after 1973 has private surface ownership just like
leases on RAL parcels If there are additional costs to developing leases with private surface
ownership we would expect the difference in bonus payments between these leases and
leases on RAL parcels to be smaller than the overall difference we observe when including
the full set of auction leases Columns 5 and 6 of Table 5 present our main bonus regressions
specifications re-run on this restricted sample Although the results in column 5 are less
precise due to the fact that it excludes nearly half of the auctioned leases these estimates
are remarkably consistent with the results in Table 328 We therefore reject the concern
that negotiated leases earn lower bonus payments because they are associated with private
surface ownership
Finally surface owners of RAL parcels sometimes negotiate additional contractual pro-
28In Table A3 we estimate all of the specifications in Table 3 using this restricted subsample The pointestimates in this table are generally higher than those in 3 and many are precisely estimated
20
visions which deviate from the standard RAL lease and it could be the case that these
additional contractual demands compensate RAL lessors for the lower bonus payments they
receive To test this hypothesis we collected and digitized data on the auxiliary clauses
embedded in each RAL lease As we document in Appendix C we find no evidence that
variation in the number of additional contractual demands or the relative landowner vs EampP
company ldquofriendlinessrdquo of those contractual demands can explain the differences in bonus
payments that we observe Even after conditioning on these additional contractual char-
acteristics auctioned leases still pay considerably higher bonus payments than negotiated
leases do
6 Allocative Efficiency Results
Our results on the causal effect of auctions on bonus payments are consistent with predictions
from a strand of the theory literature that the ldquocompetitive effectsrdquo of auctions generate
tangible benefits for sellers (Bulow and Klemperer 1996 2009) This literature also suggests
that auctions should generate higher total welfare than other less formal mechanisms by
reliably awarding goods to the buyers who values them the most For example Klemperer
(2004) argues that ldquoa well-designed auction is the method most likely to allocate resources
to those who can use them most valuablyrdquo Motivated by these additional predictions from
the theory literature we use our drilling and production data to measure the causal effect
of auctions on allocative efficiency
In order for auctions to produce better allocative outcomes than negotiations two condi-
tions must be true First it must be the case that potential lessees are heterogenous in their
cost of investment or ability to produce output Many sources of heterogeneity among EampP
companies are ldquoverticalrdquo in nature in that some firms have either consistently lower costs
or higher productivity than others We know these differences in costs or productivity must
exist because there are wide differences in firm size and observable measures of firm sophis-
tication among the set of active firms in the US onshore EampP business Indeed some of the
largest companies in the world like Exxon and Chevron compete for leases against thou-
sands of privately held EampP companies with fewer than 500 employees Beyond observable
differences in firm size and sophistication there is heterogeneity across EampP companies in
their decisions to hire external service contractors to perform drilling and completion services
or to maintain these capabilities in house There is also evidence for heterogeneity across
firms in their engineering designs of hydraulic fracturing treatments which are necessary for
all leases in this setting (Covert 2015) Finally it is possible that some firms may simply
be able to process post-acquisition lease information more effectively and in doing so more
21
efficiently select which of their leases to drill
In addition to these vertical differences in EampP company quality there are also many
potential sources of horizontal heterogeneity across firms which may make some better at
developing a particular piece of land than others For example firms who already control
acreage in one area may be able to develop drilling plans that minimize the number of wells
necessary to extract minerals relative to firms who have less existing nearby acreage hold-
ings Firms who own hydrocarbon transportation infrastructure close to a given parcel may
experience cost advantages in developing that specific parcel but not other parcels further
away from this infrastructure And similarly firms with formation-specific knowledge about
geology or efficient engineering choices will be able to produce more (or less expensively)
than firms with less context-specific knowledge
Heterogeneity across potential lessees wonrsquot necessarily generate allocative differences
across the two mechanisms if negotiations somehow select the same winning firms as auctions
do In addition to characterizing potential sources of heterogeneity among firms we can also
show that auctions and negotiations generate noticeably different allocations of firms to
leases We do this by tabulating auction and negotiation ldquomarket sharesrdquo for each of the ten
most active lessees as shown in Table 629 For these especially active lessees a firmrsquos share
of leases in the auction market is quite different than its share in the negotiation market
The data soundly reject a Chi-squared test of the hypothesis that a firmrsquos auction market
share is the same as its negotiation market share (p lt 2times 10minus16)30
Because EampP companies often focus their leasing activities in a specific area and because
different areas have different shares of auctioned and negotiated leases these differences in
market shares across the mechanism types may simply reflect differences in the distribution
of a firmrsquos ldquointerestrdquo across basins To verify that this kind of heterogeneity is not driving
these differences in market shares across mechanism types we also replicate this exercise
within leases overlying the two largest shale basins in Texas the Permian and the Eagle
Ford We can similarly reject a null hypothesis of equal proportions for the top 10 most
active lessees in each basin Thus the data on firm assignment is consistent with the idea
that the two mechanism types generate different allocations One major consequence of this
difference is differential concentration across mechanisms Table 6 suggests that the auction
market is more concentrated than the negotiation market the top 10 auction winners won
56 of all auctions while the top 10 negotiators won just 45 of all negotiations31
29It is important to emphasize that firm identities are observed with error in our data Additional infor-mation on our process for cleaning names is provided in Appendix B
30Chi-squared tests of equal proportions for the top 20 and 40 most active lesses are similarly rejected31The gap between the total share of top 20 auction winners and negotiation winners is about 11 and
the gap for the top 40 is about 8
22
Table 6 Top 10 Auction Winners and Negotiators
Firm Leases Auction Share Negotiation Share
CHESAPEAKE 114 0183 0035LEWIS OPERATING 83 0022 0085ENERGEN 80 0061 0060PETROHAWK 72 0085 0038PETRO HUNT 69 0007 0077CIMAREX 59 0039 0048ANADARKO 56 0048 0040DEVON 33 0059 0007BP PRODUCTIONS 31 0000 0036RANGE PRODUCTION 31 0043 0013
ALL OTHERS 692 0454 0562
While it is not hard to imagine that firms will differ in their use value for any given parcel
and the data is supportive of the idea that auctions allocate differently than negotiations
actually testing whether auctions select better lessees is complicated by the fact that we
donrsquot directly observe the latent productivity for any lease-lessee pair (and we donrsquot even
observe who the set of potential lessees are for the negotiated leases) However under any
source of heterogeneity between firms vertical or horizontal if auctions have higher allocative
efficiency we should expect to see that auctioned leases are put to more productive use than
negotiated leases This is something that we can directly measure using our royalty payment
data
Output from the oil and gas industry is administratively recorded and reported at high
frequency This output is undifferentiated (aside from oil vs gas) and the market for it
is competitive so direct output comparisons have a clear normative interpretation The
primary challenge in using production data implied by product-specific royalty payments
is that leases generate output over many years and all producing leases in our sample are
right censored To deal with this we begin by estimating the impact of auctions on the
probability that a lease is ever drilled We restrict the sample to leases whose primary term
has concluded by the end of June 2018 Within this group drilling is an important indicator
of the eventual value of a lease yet the outcome is unaffected by right censoring
The top panel of Table 7 presents the results The model specifications in each column
are identical to those in Table 3 showing the effects of mechanism type on lease outcomes
under various spatial and temporal controls as well as the inclusion of ldquoextrardquo covariates
Across specifications auctioned leases are 8 to 18 percentage points more likely to be drilled
and in half of these specifications the estimates are statistically different from zero As just
23
38 of negotiated leases are ever drilled this increase in the probability of drilling is large
in relative terms Although the models in columns 2 4 and 6 are imprecisely estimated
the general picture across the specifications suggests large differences in the probability of
investment providing our first set of evidence linking a transactionrsquos mechanism type to its
real outcomes
Table 7 Likelihood of Drilling Lease Output Lease Revenue and Mechanism Type
( 1 ) ( 2 ) ( 3 ) ( 4 ) ( 5 ) ( 6 )
0116 0082 0179 0096 0132 0080Auction - Drilling
(0044) (0050) (0078) (0061) (0042) (0051)R2 0397 0657 0747 0500 0038 0666
11748 8505 11418 11644 14128 9619Auction - Output
(3797) (4030) (6677) (3853) (4153) (4246)R2 0557 0783 0859 0630 0021 0789
135810 88008 121034 128482 192748 92279Auction - Revenue
(45411) (57828) (83874) (54047) (45534) (58690)R2 0592 0791 0890 0645 0027 0796
Grid 10 10 10 20 RF 10Time Q GYQ GYQ GYQ RF GYQExtra No No No No No YesN 1109 1109 1109 1109 1109 1109
The dependent variables are an indicator for whether the lease is associated with royalty revenue in sample(Drilling) discounted barrels of oil equivalent per acre (Output) and total revenue per acre which is thesum of the bonus and discounted royalty payments (Revenue) In columns 1-4 and 6 the size of the locationbins in miles are indicated in the ldquoGridrdquo row while the structure of the time controls (ldquoQrdquo for quarterof sample ldquoGYQrdquo for grid-by-year plus quarter of sample and ldquoGYQrdquo for grid-by-quarter of sample) areindicated in the ldquoTimerdquo row Standard errors are clustered by grid in columns 1-4 and 6 Column 5 uses aRobinson (1988) transformation using random forests with heteroskedasticity-consistent standard errorsAll models include a spline in acres and linear terms in term and royalty rate ldquoExtrardquo controls includeshape regularity a dummy variable for whether the lease spans multiple parcels surface cover measuresand distance to roads and water sources The sample includes all leases whose primary term ends beforeJune 2018 Negotiated leases are drilled 38 of the time The average negotiated lease generates 192 bblof discounted BOE per acre and $2575 of total seller revenues per acre
Next we estimate the impact of mechanism type on lease output measured in discounted
barrels of oil equivalent per acre which is the actual object of import for the allocative
efficiency question Before discussing the results it is worth noting that this variable is
incredibly skewed for leases that are drilled in our sample the difference between the 10th
and 90th percentiles of output spans more than three orders of magnitude A natural solution
to this right skewness would be to examine differences in output across leases in relative
terms by using the natural logarithm of output as the dependent variable However as
24
described above fewer than half of leases are ever drilled and as such generate zero output
in the real sense (ie this is not just a selection problem) In this situation adding a
small constant to these zeros to facilitate the logarithmic transformation is unlikely to be
innocuous We thus proceed in levels acknowledging that the skewness of the data will make
these measurements inherently imprecise
The middle panel of Table 7 presents the results In all specifications auctioned leases
produce substantially more than negotiated leases and all estimates are statistically different
from zero Even at the low end of these estimates (column 2) the difference of roughly 85
barrels of oil equivalent per acre is 44 of the average output on negotiated leases Using
alternative spatial and temporal controls the differences between auctioned and negotiated
leases are even larger For example the point estimate in column 5 is 74 of the average
output of negotiated leases
This increased output implies that not only are auctions more efficient they likely have
an even larger impact on seller revenues than the bonus regressions imply The bottom panel
of Table 7 measures this formally using the sum of bonus payments and discounted royalty
revenues as the dependent variable Across all six specifications we find large differences in
total revenue though the differences for specifications with finer spatial controls are imprecise
due to the small sample and skewness of royalty payments
61 Unpacking the source of heterogeneity
Table 7 provides evidence that auctions allocate leases to firms who are more likely to drill
them and who produce more output with them a result that is consistent with some of the
theory literaturersquos predictions of allocative efficiency gains from auctions In this section
we provide statistical evidence regarding the relative contribution of vertical or horizontal
productivity differences between firms in generating these results A key motivation for this
decomposition is to understand whether or not auctions are necessary to deliver the gains
we estimate above If the gains from auctions come primarily from identifying persistently
productive firms (in the vertical sense) one can imagine relatively light-handed policy in-
terventions which would simply make landowners aware of who productive lessors are and
nudge lessors to select them Conversely if the latent firm productivity ordering varies from
parcel to parcel it is difficult to imagine a way to achieve higher allocative efficiency without
widespread adoption of some auction-like mechanism
As discussed above vertical productivity factors generate persistent differences across
firms By definition these factors are constant across leases within a firm Thus if pro-
ductivity differences between auctions and negotiations are driven primarily by vertical dif-
25
ferences in the firms these mechanism allocate to then comparisons of drilling and output
within a firm should reveal no auction treatment effect We test this hypothesis in Table
8 which reports estimates of our main drilling and output regressions with and without
fixed effects for the identity of the lease winner Even after conditioning on firm identity
bonus payments the likelihood of drilling and lease output are all still larger by a similar
magnitude in auction leases relative to negotiated leases If variation in allocation across
vertically differentiated firms was an important driver of the difference in lease outcomes
across the two mechanisms we would expect to see that the differences in outcomes condi-
tional on firm identity would be closer to 0 than the unconditional differences If anything
the opposite seems to be true although confidence intervals overlap considerably We also
perform this exercise with bonus as the dependent variable finding similar results auctions
pay more even within firm
Table 8 Effects of Firm Composition and Mechanism Type onLease Outcomes
Bonus Bonus Drilled Drilled Output Output
70885 71936 0082 0177 8505 17500Auction
(34220) (43769) (0050) (0090) (4030) (8429)
Firm FE No Yes No Yes No YesN 1320 1320 1109 1109 1109 1109R2 0760 0825 0657 0748 0783 0859
The dependent variable is bonus per acre (columns 1 and 2) a dummy variablefor whether the lease is drilled (columns 3 and 4) or discounted output in BOEterms per acre (columns 5 and 6) All specifications include fixed effects for10-mile grids-by-year and quarter-of-sample as well as controls for royalty rateterm and a spline in acres
Given that the differences between auctions and negotiations exist in comparisons within
the same firm we conclude that the source of the output effect must be due to horizontal
differences or ldquomatchrdquo How plausible are lessee-lease shocks as a determinant of differences
between auctioned and negotiated leases Unfortunately we are not aware of a direct test
for this hypothesis However we can use the auction bid data to verify that the magnitude of
firm-lease shocks must be large relative to vertical differences among firms If a firmrsquos value
for a parcel was mostly vertical in the sense that some firms were inherently more productive
or more likely to drill than others wersquod expect to see a consistent ranking of auction bids
between firms across auctions In particular when two firms bid in the same set of auctions
wersquod expect the higher productivity firm to bid more than the lower productivity firm in
every auction We check this in the bid data by looking at all ldquopairsrdquo of firms who bid in
26
the same auction more than ten times Table 9 lists these pairs and tabulates the probability
that the alphabetically earlier firm (Firm A) bids higher than the later firm (Firm B) If
firm-lease match was less important than vertical differences between firms wersquod expect to
see that one firm consistently bids higher than the other What we observe is the exact
opposite for 8 of the 9 pairs the fraction of the time that one firm wins more than the other
is statistically identical to a coin toss
Table 9 Bid ranking for top auction pairs
Firm A Firm B Auctions Share A gt B
CIMAREX ENERGEN 31 052CIMAREX CONOCO PHILLIPS 19 079CONOCO PHILLIPS ENERGEN 19 037CIMAREX RESOLUTE 19 053ENERGEN RESOLUTE 19 042COG RANGE PRODUCTION 17 041CONOCO PHILLIPS RESOLUTE 17 053CIMAREX MARSHFIELD OIL AND GAS 12 067ENERGEN MARSHFIELD OIL AND GAS 12 067
7 Discussion
Texas mineral leases allocated by auctions generate more revenue for mineral rights owners
and are better matched to firms who can use these minerals productively relative to leases
allocated by informal decentralized negotiations What features of the unobserved ldquoRAL
mechanismrdquo underlying these negotiated transactions are responsible for these differences A
significant limitation in answering this question is that while the auction process is compre-
hensively documented by an administrative body with public records of all submitted bids
on all potential transactions there are no records of the circumstances that lead up to a suc-
cessful negotiated transaction nor are there any records of initiated but failed negotiations
In lieu of sufficient transaction level detail to quantitatively evaluate the negotiation pro-
cess we instead discuss how institutional features of this market and the resulting outcome
differences fit within existing mechanism comparisons considered by the literature
Section 6 shows that negotiations do not always allocate leases to the highest value
user One possible explanation for this phenomena is that the set of potential lessees for
negotiations and auctions are the same but negotiations choose among these lessees in
a sequential fashion while the auctioneer selects among all participants simultaneously
27
The theory literature offers conflicting opinions about the efficiency costs and benefits of a
sequential process relative to a simultaneous process Bulow and Klemperer (2009) show
that sequential mechanisms can perform worse than an auction both in terms of generating
seller revenues and allocative efficiency if a ldquogood enoughrdquo bidder randomly arrives early
enough in the sequential process However this possibility is predicated on their assumption
that a bidderrsquos entry choice is independent of its value for the lease Roberts and Sweeting
(2013) demonstrate that a similar sequential mechanism can outperform auctions if this
entry choice is instead selective in the sense that better users of a lease are more likely to
participate than worse users Thus if the only difference between the informal process for
RAL negotiations and the GLOrsquos auctions was that auctions considered bids simultaneously
while negotiations reviewed offers from the same set of bidders sequentially (up to the point
when a transaction occurs) the improved performance of auctions in our setting suggests
that entry choices by EampP companies are not especially ldquoselectedrdquo as in the Roberts and
Sweeting (2013) mechanism
An alternative explanation consistent with the decline in allocative efficiency is that RAL
leases actually transact using an auction but ldquoRAL auctionsrdquo simply attract fewer bidders
than GLO auctions do This is roughly the ldquonon-sequentialrdquo search mechanism considered
by Salz (2017) In our setting the possibility that RAL surface owners are unable (or
unwilling) to acquire offers from all potential lessees seems more than plausible State
auctions are widely publicized and routinely held whereas a central challenge for firms in
acquiring negotiated acreage (both in RAL and private land writ large) is identifying which
land is leasable and performing title search to determine who actually owns it It is thus
likely that informal mechanisms for the latter would result in fewer participants Note that
while reduced competition in a hypothetical ldquoRAL auctionrdquo would generate a reduction in
seller revenues by itself the fact that ldquomatch qualityrdquo as defined in Section 6 also declines
suggests that the subset of bidders that participate in negotiations must exclude the highest
value buyer with positive probability
While these two mechanisms could rationalize our empirical results it is important to note
that neither perfectly fits this setting In the primary market for oil and gas leases offers to
mineral owners are initiated by the buyer and anecdotally we know that many transactions
conclude before any other parties even have the opportunity to participate Savvy leasing
agents cognizant of the relative unsophistication of their counterparts likely use a variety
of persuasive techniques which do not fit well within a formal mechanism design framework
Relatedly it seems intuitive that landowners would have a difficult time committing to (and
executing) a more formal process In the most extensive survey of private mineral rights
owners to date only 21 of lessors in Pennsylvania reported ever consulting with a lawyer
28
before transacting32 Conversely GLO rules require that all parcels to be auctioned be
announced via public notice with clearly posted reserve prices The requirement that the
lease go to the high bidder is codified in state law and easily enforceable and observable
How feasible would it be for landowners to hold an auction While it is possible that the
costs associated with organizing an auction may have been large prior to the Internet era
nowadays there are electronic mineral auction platforms whose fees are 10 or less of the final
transaction price Indeed the Texas GLO now uses one such platform EnergyNetcom that
explicitly advertises its availability to private landowners Given our main treatment effect
estimate in Table 3 is a 67 increase in bonus price this gain from using an auction appears
to far exceed the cost33 In this specific context itrsquos also possible to imagine the Texas GLO
performing these auctions on the surface ownerrsquos behalf and presumably internalizing some
scale economies while doing so34
71 External Validity
How generalizable are these results to the broader population of mineral leases on private
land in the United States which are also allocated in an informal decentralized fashion
One possible concern about predicting that the returns to auctions would be similar in other
locations is that the negotiations in our sample are particularly inefficient or uncompetitive
If that were the case the true causal effects of auctions relative to negotiations in other
mineral leasing settings would be smaller than the effects we estimate here
We begin by noting that the auctions against which these negotiated leases are compared
are not particularly competitive In Appendix Table 9 we tabulate the number of auctions
with 1 2 3 4 or 5+ bidders and within those groups compute the average bonus payment
per acre and the median reserve margin More than two-thirds of all GLO auctions receive
only 1 successful bidder and this fact seems to be known to potential bidders as auctions that
do receive more bids have substantially higher winning bids The fact that reserve margins
are much lower for the vast majority of auctions with 1 or 2 realized bidders relative to
auctions with more suggests that either GLO has set reserve prices relatively low or that
bidders expect a low but positive probability of competition a phenomenon studied in Kong
(2017)
32Survey conducted by the Penn State Extension Marcellus Education Team and summarized in ldquoNaturalGas Lessorsrsquo Experiences in Bradford and Tioga Counties 2010rdquo [Online version available here accessed3152018]
33Note that RAL landowners only have a 50 claim to the gain from auctions So unless the state borehalf the costs the effective fee from the RAL landowners perspective would be 20 which is still far belowthe estimated auction gain
34Indeed GLO already does this when EampP firms wish to lease minerals in RAL parcels in which ownershipcannot be established due to inheritance or property title issues
29
Similarly it is unlikely that RAL negotiations are especially ldquobadrdquo Although data on
the ldquoqualityrdquo of negotiations in other settings is hard to come by what little information is
available suggests that private landowners are not particularly savvy For example the afore-
mentioned Pennsylvania survey found that 79 of lessors only spoke to one EampP company
before signing a lease They also appear relatively uninformed with only 32 reporting to
have consulted any educational materials prior to signing
In contrast Relinquishment Act lessors are likely better informed than the general private
mineral rights owner population Although the process for RAL leasing mirrors that of
private leasing with a landman approaching the surface owner with an offer and the two
parties coming to a private agreement these agreements must be approved by the GLO
before they are finalized During this approval process the terms of the agreement may be
improved with the GLO requesting for example a higher bonus payment or shorter primary
term In our sample 19 of RAL leases show some type of improvement during this approval
period the median improvements for bonuses and royalties are 50 and 17 respectively
Throughout this paper we compare realized lease terms from RAL negotiations rather
than what the landowners would have negotiated absent state intervention so the treatment
effects we estimate are likely to be lower bounds on the difference in revenues and allocative
efficiency we would expect from replacing informal negotiations with centralized auctions in
the broader private leasing population
8 Conclusion
At current prices proved US oil and gas reserves are worth approximately $45 trillion and
the vast majority of these resources are owned and managed by private individuals While
this arrangement has delivered substantial wealth to countless landowners the informal
mechanisms they use to find and bargain with their contracting partners may generate
less revenue and less efficient matches to EampP companies than would be possible under
a more formal mechanism In this paper we directly quantify this loss Using rich data
on a large number of leases affected by a natural experiment we compare outcomes under
unstructured ldquonegotiationsrdquo to formal auctions Our results show that auctions generate
67 larger up front payments and that auctions produce 44 more output suggesting
that auctions facilitate better matches between land and the firms that can use it most
productively Given that landowners in this setting often have assistance from an informed
third party (the Texas GLO) these results likely provide a lower bound on the prospective
gains from using auctions in the private mineral leasing population writ large
A natural direction for future work would be to investigate why informal mechanisms
30
perform so poorly In this paper we lack sufficient information on the process leading up to
informal transactions and instead rely on credible identification of the net effect of formal
vs informal mechanisms in the ldquoreduced formrdquo One approach to gaining insight about
the causes of this difference would be to perform surveys of informal mechanism users or to
conduct experimental information interventions in mineral leasing or other settings An-
other would be to measure similar reduced form differences in other economically important
markets where formal and informal mechanisms coexist such as real estate construction
procurement and used automobile sales In these other settings sellers may be more or less
informed or have different abilities to attract potential buyers Given the sheer size of these
other markets if even a fraction of the estimated gains in this paper translate the gains
from policy that encourages the use of formal mechanisms would be enormous
References
Allen Jason Robert Clark and Jean-Francois Houde ldquoSearch Frictions and MarketPower in Negotiated Price Marketsrdquo Journal of Political Economy Forthcoming
Athey Susan Julie Tibshirani Stefan Wager et al ldquoGeneralized random forestsrdquoThe Annals of Statistics 2019 47 (2) 1148ndash1178
Backus Matthew Thomas Blake Bradley Larsen and Steven Tadelis ldquoSequen-tial Bargaining in the Field Evidence from Millions of Online Bargaining InteractionsrdquoWorking Paper 24306 National Bureau of Economic Research February 2018
Tom Blake and Steven Tadelis ldquoCheap Talk Round Numbers and the Economicsof Negotiationrdquo June 2015 (21285)
Bartik Alexander W Janet Currie Michael Greenstone and Christopher RKnittel ldquoThe Local Economic and Welfare Consequences of Hydraulic FracturingrdquoWorking Paper 23060 National Bureau of Economic Research January 2017
Bhattacharya Vivek Andrew Ordin and James W Roberts ldquoBidding and DrillingUnder Uncertainty An Empirical Analysis of Contingent Payment Auctionsrdquo 2018 work-ing paper
Boone Audra L and J Harold Mulherin ldquoHow Are Firms Soldrdquo The Journal ofFinance March 2007 62 (2) 847ndash875
Brown Jason P Timothy Fitzgerald and Jeremy G Weber ldquoCapturing rents fromnatural resource abundance Private royalties from US onshore oil amp gas productionrdquoResource and Energy Economics November 2016 46 23ndash38
Bulow Jeremy and Paul Klemperer ldquoAuctions Versus Negotiationsrdquo The AmericanEconomic Review 1996 86 (1) 180ndash194
31
and ldquoWhy Do Sellers (Usually) Prefer Auctionsrdquo The American Economic Review2009 99 (4) 1544ndash1575
Covert Thomas ldquoExperiential and Social Learning in Firms the Case of Hydraulic Frac-turing in the Bakken Shalerdquo 2015 working paper
Cuesta Jose Ignacio and Alberto Sepulveda ldquoPrice Regulation in Credit Markets ATrade-off between Consumer Protection and Credit Accessrdquo Available at SSRN 32829102018
Currie Janet Michael Greenstone and Katherine Meckel ldquoHydraulic fracturingand infant health New evidence from Pennsylvaniardquo Science Advances December 20173 (12) e1603021
Feyrer James Erin T Mansur and Bruce Sacerdote ldquoGeographic Dispersion ofEconomic Shocks Evidence from the Fracking Revolutionrdquo American Economic ReviewApril 2017 107 (4) 1313ndash1334
Fitzgerald Timothy and Randal Rucker ldquoUS private oil and natural gas royaltiesestimates and policy relevancerdquo OPEC Energy Review March 2016 40 (1) 3ndash25
Gentry Matthew and Caleb Stroup ldquoEntry and competition in takeover auctionsrdquoJournal of Financial Economics 2018
Hendricks Kenneth and Robert H Porter ldquoAn Empirical Study of an Auction withAsymmetric Informationrdquo The American Economic Review 1988 78 (5) 865ndash883
and ldquoThe Timing and Incidence of Exploratory Drilling on Offshore Wildcat TractsrdquoThe American Economic Review June 1996 86 (3) 388ndash407
Herrnstadt Evan Ryan Kellogg and Eric Lewis ldquoRoyalties and Deadlines in Oiland Gas Leasing Theory and Evidencerdquo 2018 working paper
Hortacsu Ali and Chad Syverson ldquoProduct Differentiation Search Costs and Com-petition in the Mutual Fund Industry A Case Study of SampP 500 Index Fundsrdquo TheQuarterly Journal of Economics 05 2004 119 (2) 403ndash456
Klemperer P Auctions Theory and Practice Auctions Theory and Practice PrincetonUniversity Press 2004
Kong Yunmi ldquoSequential Auctions with Synergy and Affiliation Across Auctionsrdquo 2016working paper
ldquoSelective Entry in Auctions Estimation and Evidencerdquo Working Paper 2017
Larsen Bradley ldquoThe Efficiency of Real-World Bargaining Evidence from WholesaleUsed-Auto Auctionsrdquo Working Paper 20431 National Bureau of Economic Research Au-gust 2014
32
Li Fan Kari Lock Morgan and Alan M Zaslavsky ldquoBalancing covariates via propen-sity score weightingrdquo Journal of the American Statistical Association 2018 113 (521)390ndash400
Milgrom Paul Putting Auction Theory to Work Cambridge University Press January2004
Muehlenbachs Lucija Elisheba Spiller and Christopher Timmins ldquoThe HousingMarket Impacts of Shale Gas Developmentrdquo American Economic Review December 2015105 (12) 3633ndash3659
Myerson Roger B ldquoOptimal auction designrdquo Mathematics of operations research 19816 (1) 58ndash73
Roberts James W and Andrew Sweeting ldquoWhen Should Sellers Use AuctionsrdquoAmerican Economic Review August 2013 103 (5) 1830ndash1861
Robinson Peter M ldquoRoot-N-consistent semiparametric regressionrdquo Econometrica Jour-nal of the Econometric Society 1988 pp 931ndash954
Salz Tobias ldquoIntermediation and Competition in Search Markets An Empirical CaseStudyrdquo SSRN Scholarly Paper ID 2961795 Social Science Research Network RochesterNY May 2017
Shields James D ldquoLeasing Lands Subject to the Texas Relinquishment Act CommentrdquoSt Maryrsquos Law Journal 1981 13 868ndash886
Subramanian Guhan ldquoGo-Shops vs No-Shops in Private Equity Deals Evidence andImplicationsrdquo Business Lawyer (ABA) 2007 63 729
Vissing Ashley ldquoOne-to-Many Matching with Complementary Preferences An EmpiricalStudy of Market Power in Natural Gas Leasingrdquo August 2017
Wang Zhe ldquoDesigning MampA Selling Mechanisms Go-Shop Negotiationsrdquo Available atSSRN 3287321 2018
Yergin Daniel The Prize December 2008
33
Appendix A Additional Tables and Figures
A1 RAL vs State Lease Locations
Figure A1 Map of Sample Leases by Type
34
Figure A2 Example of Sample Lease Type Overlap
35
A2 Log Bonus Results
Table A1 log(Bonus) Payments and Mechanism Type
( 1 ) ( 2 ) ( 3 ) ( 4 ) ( 5 ) ( 6 )
035 040 040 041 043 039Auction
(008) (010) (013) (010) (006) (010)
Grid 10 10 10 20 RF 10Time Q GYQ GYQ GYQ RF GYQExtra No No No No No YesN 1320 1320 1320 1320 1320 1320R2 0919 0970 0983 0954 0730 0970
The dependent variable in each regression is the natural logarithm of theleasersquos bonus payment In columns 1-4 and 6 the size of the location binsin miles are indicated in the ldquoGridrdquo row while the structure of the timecontrols (ldquoQrdquo for quarter of sample ldquoGY Qrdquo for grid-by-year plus quarterof sample and ldquoGYQrdquo for grid-by-quarter of sample) are indicated in theldquoTimerdquo row Standard errors are clustered by grid in columns 1-4 and 6Column 5 uses a Robinson (1988) transformation using random forests withheteroskedasticity-consistent standard errors All models include a spline inacres and linear terms for term length and royalty rate ldquoExtrardquo controls in-clude shape regularity a dummy variable for whether the lease spans multipleparcels surface cover measures and distance to roads and water sources
Table A2 log(Bonus) Payments and Mechanism Type Robustness
( 1 ) ( 2 ) ( 3 ) ( 4 ) ( 5 ) ( 6 )
039 042 039 041 040 048Auction
(010) (005) (010) (006) (013) (008)012 027
Drilled(006) (005)
000 000Output
(000) (000)
Estimate G10Y RF G10Y RF G10Y RFSample All All All All Private PrivateN 1320 1320 1320 1320 1103 1103R2 0970 0738 0970 0741 0972 0713
The dependent variable in each regression is the natural logarithm of the leasersquosbonus payment Columns 1 3 and 5 use fixed effects for year by 10-mile gridas well as quarter of sample Columns 2 4 and 6 use a random forest to semi-parametrically control for location and time Standard errors clustered by loca-tion in columns 1 3 and 5 and are heteroskedasticity-consistent in columns 2 4and 6 All models include a spline in acres and linear terms in term length androyalty rate
36
A3 Private Surface Owner Models
Table A3 Bonus Payments and Mechanism Type Private Surface OwnersOnly
( 1 ) ( 2 ) ( 3 ) ( 4 ) ( 5 ) ( 6 )
63309 63053 139995 78322 85858 65324Auction
(34246) (65126) (103094) (33646) (24085) (62626)
Grid 10 10 10 20 RF 10Time Q GYQ GYQ GYQ RF GYQExtra No No No No No YesN 1103 1103 1103 1103 1103 1103R2 0566 0755 0907 0665 0053 0759
The dependent variable in each regression is the leasersquos bonus payment In columns 1-4 and6 the size of the location bins in miles are indicated in the ldquoGridrdquo row while the structure ofthe time controls (ldquoQrdquo for quarter of sample ldquoGY Qrdquo for grid-by-year plus quarter of sampleand ldquoGYQrdquo for grid-by-quarter of sample) are indicated in the ldquoTimerdquo row Standard errorsare clustered by grid in columns 1-4 and 6 Column 5 uses a Robinson (1988) transformationusing random forests with heteroskedasticity-consistent standard errors All models includea spline in acres and linear terms for term length and royalty rate ldquoExtrardquo controls includeshape regularity a dummy variable for whether the lease spans multiple parcels surface covermeasures and distance to roads and water sources
A4 Overlap-weighted ATEs
In section 3 we describe our rationale for dropping (primarily) negotiated leases with es-pecially large sizes or terms that are shorter than 1 year Our goal in dropping these ob-servations is to achieve ldquobalancerdquo between the observable characteristics of auctioned andnegotiated leases Here we report the results that we obtain from measuring the causal effectsof mechanism type on lease outcomes using overlap-weighted treatment effect techniques de-scribed in Li et al (2018) These estimates do not require a priori choices about whichcomparisons are sufficiently balanced so the data for these calculations include leases wepreviously dropped because they were too large or their terms were too short We computethe estimates in Table A4 using the ldquocausal forestrdquo estimator from the grf R package asdescribed in Athey et al (2019) Our results are close to those presented in Tables 3 and 7
37
Table A4 Overlap-weighted ATE Estimates
Bonus Bonus Drilled Drilled Output Output
84127 82148 0100 0096 17037 18382Auction
(14109) (13778) (0041) (0039) (4458) (4368)
Extra No Yes No Yes No Yes
N 1595 1595 1328 1328 1328 1328
Overlap weighted average treatment effect estimates for Bonus per acre (columns 1and 2) Drilled (columns 3 and 4) and Output per acre (columns 5 and 6) Columns4 through 6 are estimated using the subsample of leases whose primary terms are notcensored The covariates used in determining the conditional expectation and propensityfunctions include location effective date acres term royalty rate as well as shaperegularity surface cover an indicator for leases spanning multiple parcels and distanceto roads and water sources for the ldquoextrardquo columns 2 4 and 6
A5 Auction Statistics
Table A5 Auction Results by Number of Bidders
Bids Auctions Fraction Bonus ($Acre) BidReserve (med)
1 263 057 1418 1662 88 019 1877 2083 35 008 3014 3614 32 007 2795 3265 22 005 6225 3615 + 19 004 6027 471
This table summarizes the winning bids from GLO auctions The last col-umn contains the median ratio of winning bid to the reserve price for eachgroup
38
Appendix B Data Cleaning
B1 Sample construction
Table A6 Sample Construction
Drop Reason Negotiation Auction
All Leases 4012 915Not on Shale 2359 550Missing Value 2314 550Less Than 10 or Greater Than 1000 Acres 1869 506Gross and Net Acreage Differ 1406 504Undivided Interest 893 477Term Less Than 1 Year 883 477Cancelled or Withdrawn 874 474Negotiated State Lease 861 474Lessee Owns RAL Surface 860 474PSF Acquired Land 860 460
Final Sample 860 460
Additional discussion provided in section 31
B2 Firm Names
Though we observe the name of the firm on the lease EampP companies sometimes use in-termediaries to acquire land and in these cases we might not observe the relevant firmOne reason why a firm would do this would be to prevent its competitors from discoveringits interest in a particular play before it had had acquired enough land to develop it Thisldquosecrecyrdquo motivation is probably relevant because the presence of non-EampP company lesseesis much more common in the auction data than in the negotiated data This is perhaps notsurprising since the auction records are publicly released shortly after the auction and eas-ily observable To partially overcome this challenge we use data on lease assignments legaltransactions which formally change ownership of a lease from one firm to another to betterinfer who the ultimate EampP company is on leases initially awarded to non-EampP companylessees We observe assignments on 18 of RAL leases and 33 of auction leases For eachnon-EampP company in our data who ever assigns a lease to an EampP company we identify avariety of ldquomost commonrdquo assignees using auction status location and time For non-EampPcompany leases in which we do not observe an assignment we characterize the ldquorealrdquo lesseeas this (conditional) most common assignee Though this process is not perfect it doesgreatly reduce the number of leases that we believe are allocated to lessees that are not EampPcompanies
39
Appendix C RAL Lease Addenda
In addition to specifying a bonus payments royalty rate and primary terms mineral leasesalso specify how the contracting parties will resolve disagreements about issues related toenvironmental impact on-site water usage and surface property disruptions among otherthings These protective clauses are standardized in the GLO auction lease agreement andthere are ldquodefaultrdquo values for them in the GLOrsquos required RAL lease agreement HoweverRAL surface owners and their contracting partners can optionally negotiate some deviationsfrom the standard lease To the extent that RAL surface owners are willing to forego up-front bonus payments for stricter surface protections during subsequent exploration andproduction we might be worried that the differences in bonus payments that we observe arenot caused by the mechanism itself but rather by a compensating differentials story
To determine the validity of this concern we had a team of research assistants do adual-entry review of the text of these lease addenda for all RAL leases signed between 2005and 2016 They characterized the extent to which each one improved or deteriorated thesurface ownerrsquos rights along dimensions such as environmental impact water usage andsurface property disruptions About 73 of RAL leases have one or more additional clausesin their lease addenda In Table A7 we include measures of these protective clauses in bonusregressions like those shown in Table 3 The first two columns mirror the result shown inthe main text auctioned pleases pay about $700 more per acre in up-front bonus paymentsthan negotiated leases do In the next two columns we include covariates which measurethe number of pages in an RAL leasersquos addendum as well as the number of specific legalclauses documented Finally in the last two columns we include covariates for each specifickind of clause that occur in these addenda coded as minus1 if a leasersquos addenda deteriorates thesurface ownerrsquos rights relative to the standard RAL lease 0 if it is absent or does not affectthe surface ownerrsquos rights and +1 if it improves upon the surface ownerrsquos rights Across allspecifications we find no evidence that variation between auctioned and negotiated leasesin protective clauses can ldquoexplain awayrdquo the observed differences in bonus payments
40
Table A7 Bonus Payments and Mechanism Type Robustness to RAL Lease Ad-denda
( 1 ) ( 2 ) ( 3 ) ( 4 ) ( 5 ) ( 6 )
70885 71721 82294 84530 66789 73465Auction
(34220) (16032) (28462) (13466) (32738) (19286)-1680 -1419
Pages(4591) (1303)2969 3755
Clauses(2417) (1320)
-293 -12236Surface Protection
(8263) (8866)-11763 -1860
Payment Terms(9863) (7346)-11773 -1860
Location Requirements(15567) (11306)-13540 6313
Pugh Clause(22921) (10504)-17346 -1197
Cleanup Terms(17119) (14773)-7694 -13592
Livestock Protection(28715) (16670)34262 35157
On-site Water Use(39632) (26300)3645 -32605
Waste Management(16381) (20503)4303 6454
Definitional Changes(7045) (7150)-11619 26417
Pollution Protection(17974) (18480)-2044 -17442
Infrastructure Constraints(19791) (16297)-69872 19184
Caliche Use(75715) (35997)1407 477
Additional Fees(14735) (13693)29693 12046
Time Constraints(26056) (27624)12321 8114
Miscellaneous(19189) (16251)
Grid 10 RF 10 RF 10 RFTime GYQ RF GYQ RF GYQ RFN 1320 1320 1320 1320 1320 1320R2 0760 0046 0762 0063 0763 0059
Columns 1 3 and 5 control for space and time using 10-mile grid by year of sample fixed effects aswell as fixed effects for quarter of sample Columns 2 4 and 6 use a random forest in lease latitudelongitude and effective date
41
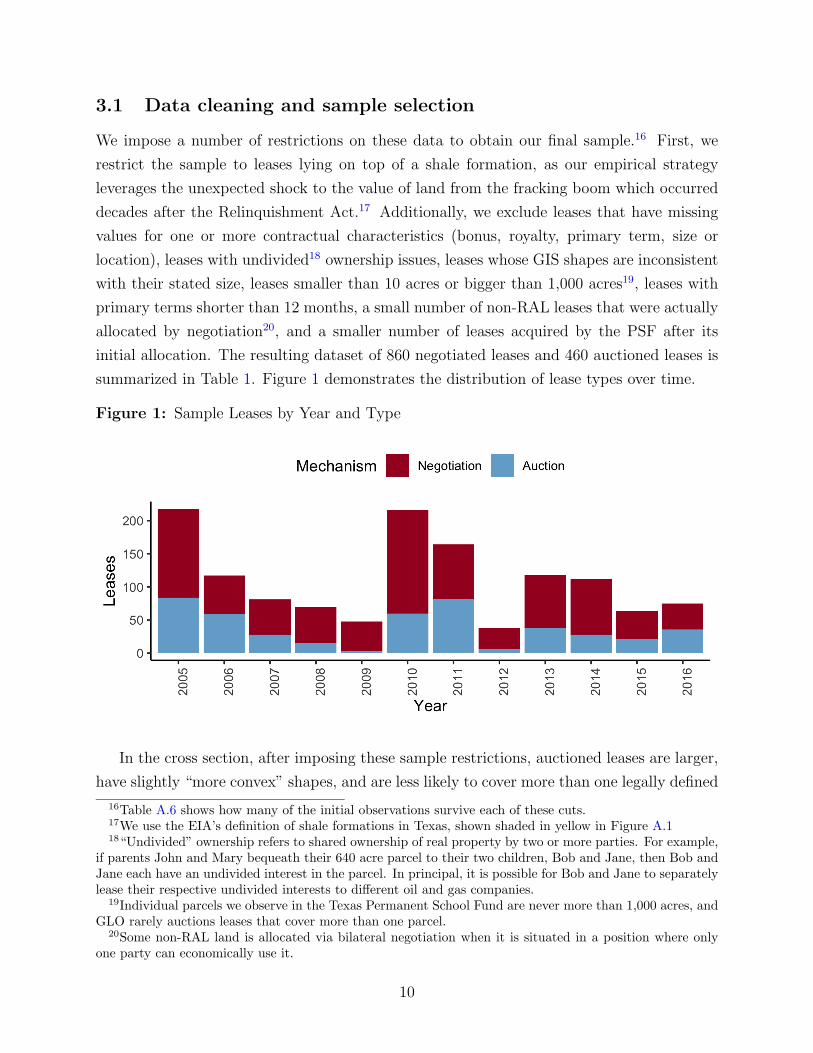
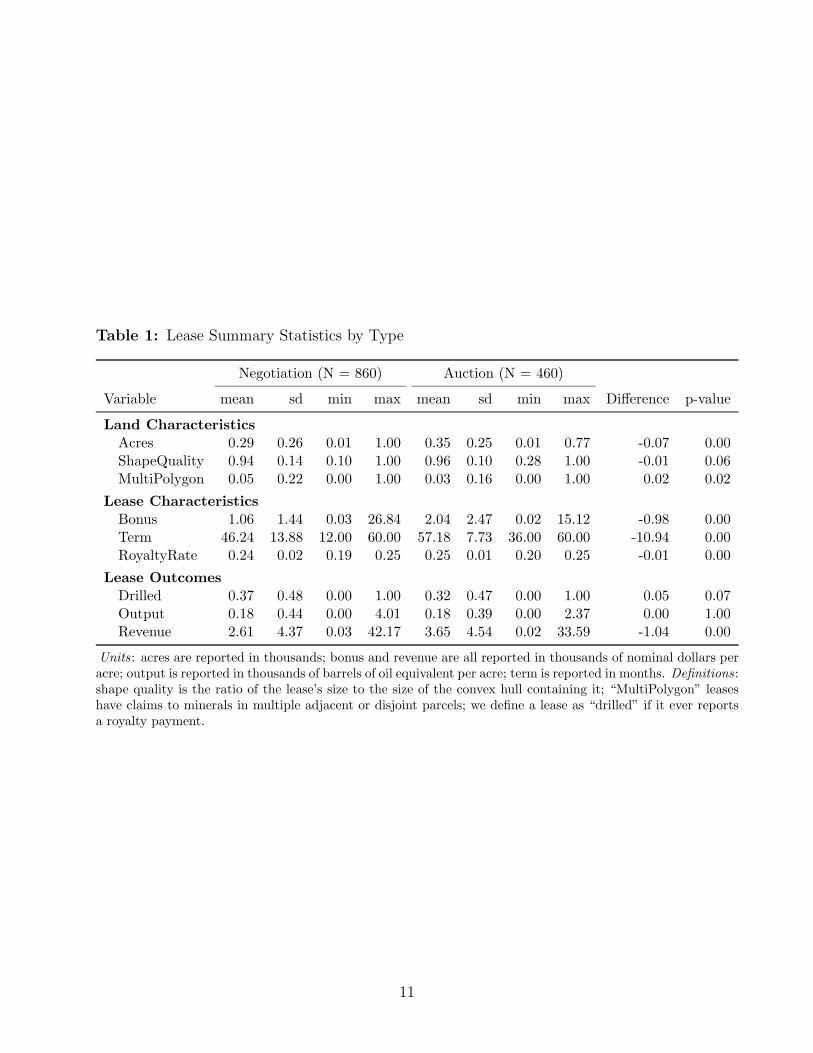
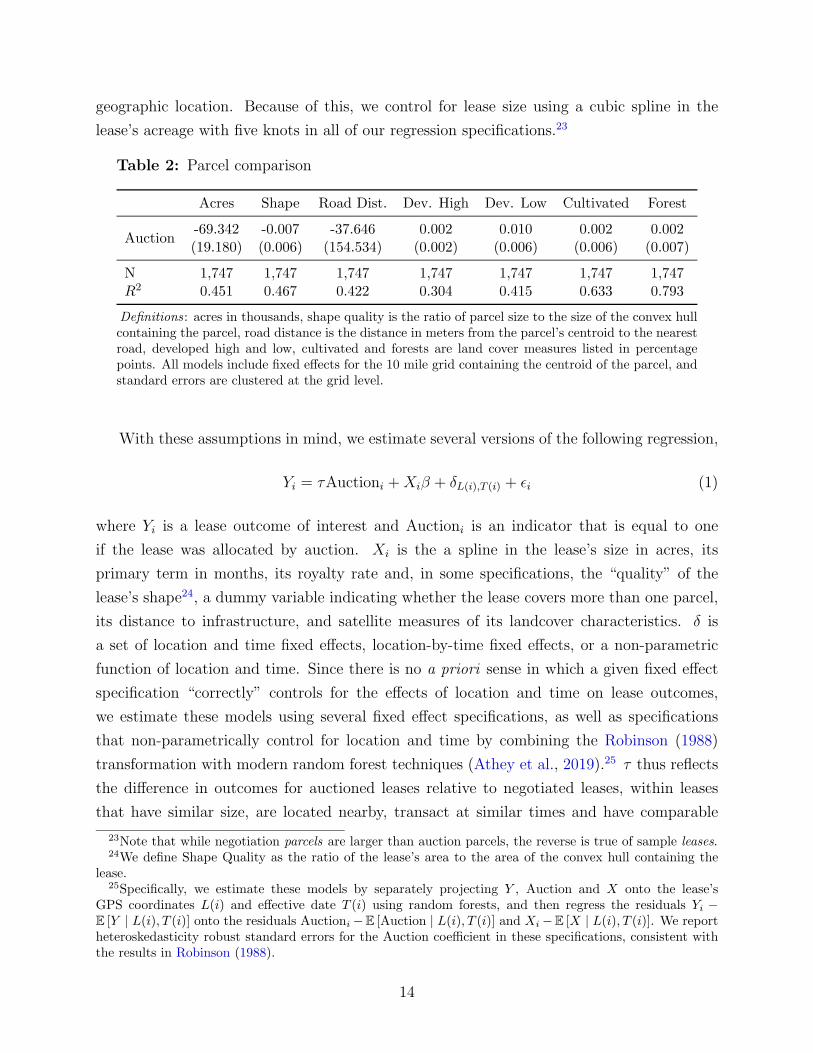
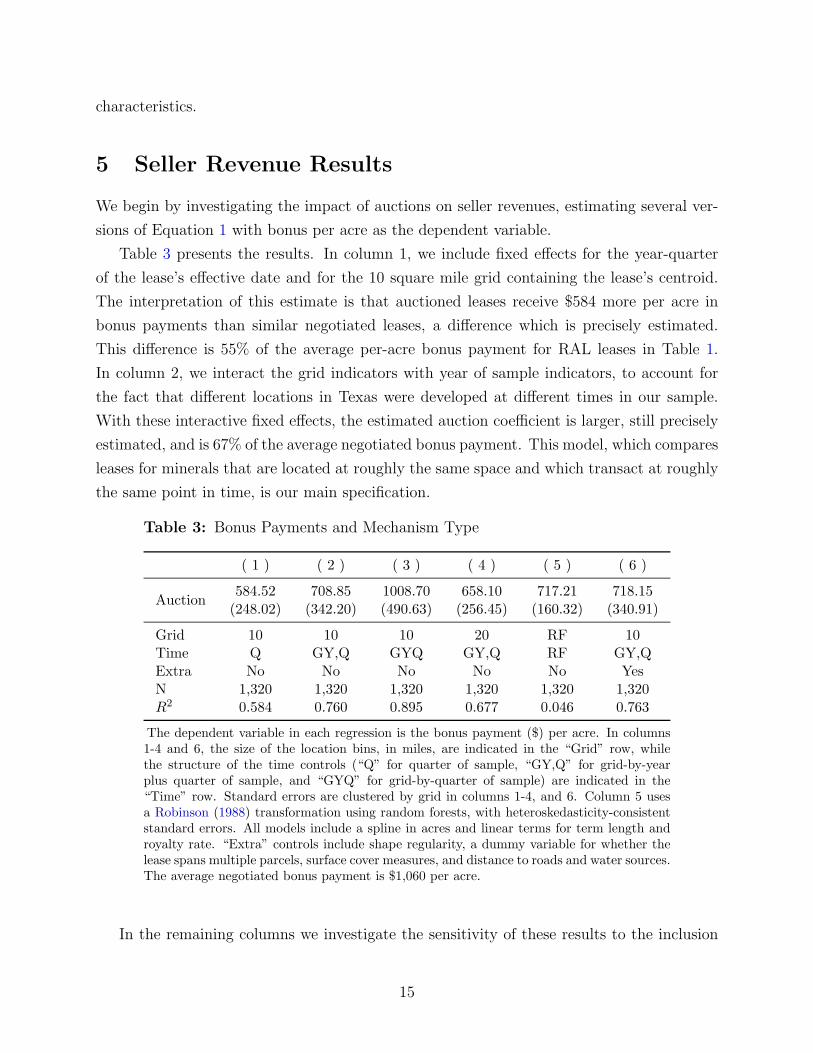
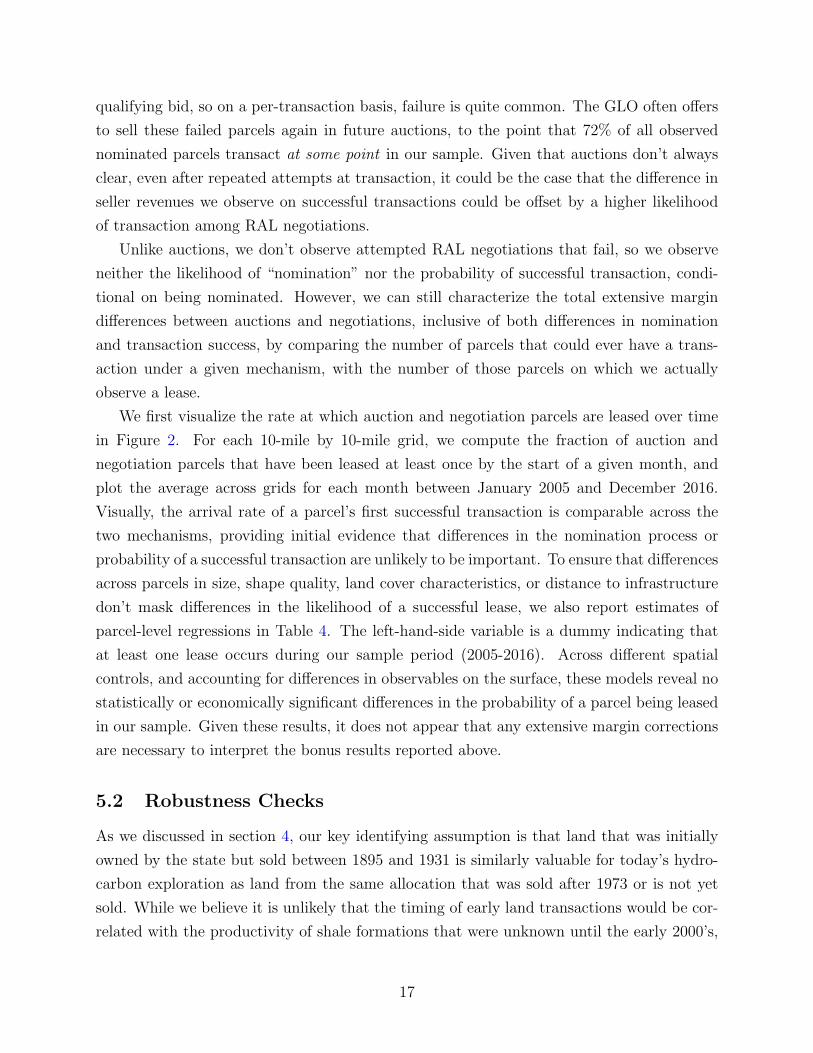
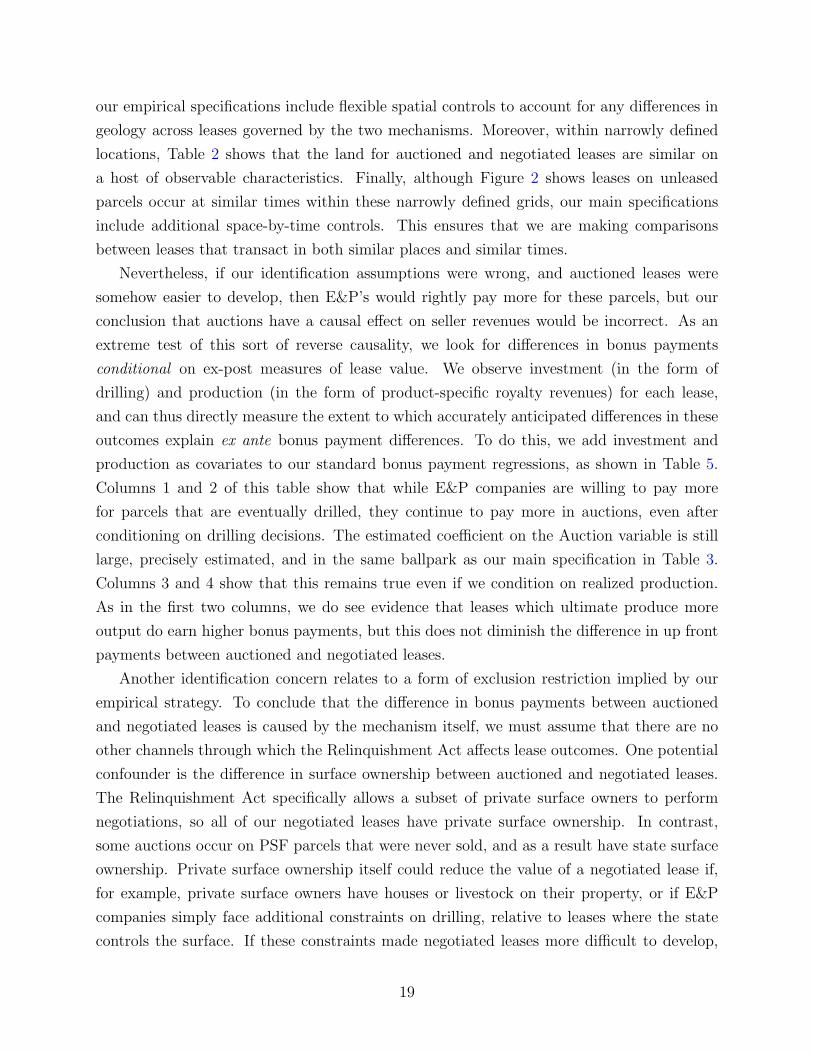
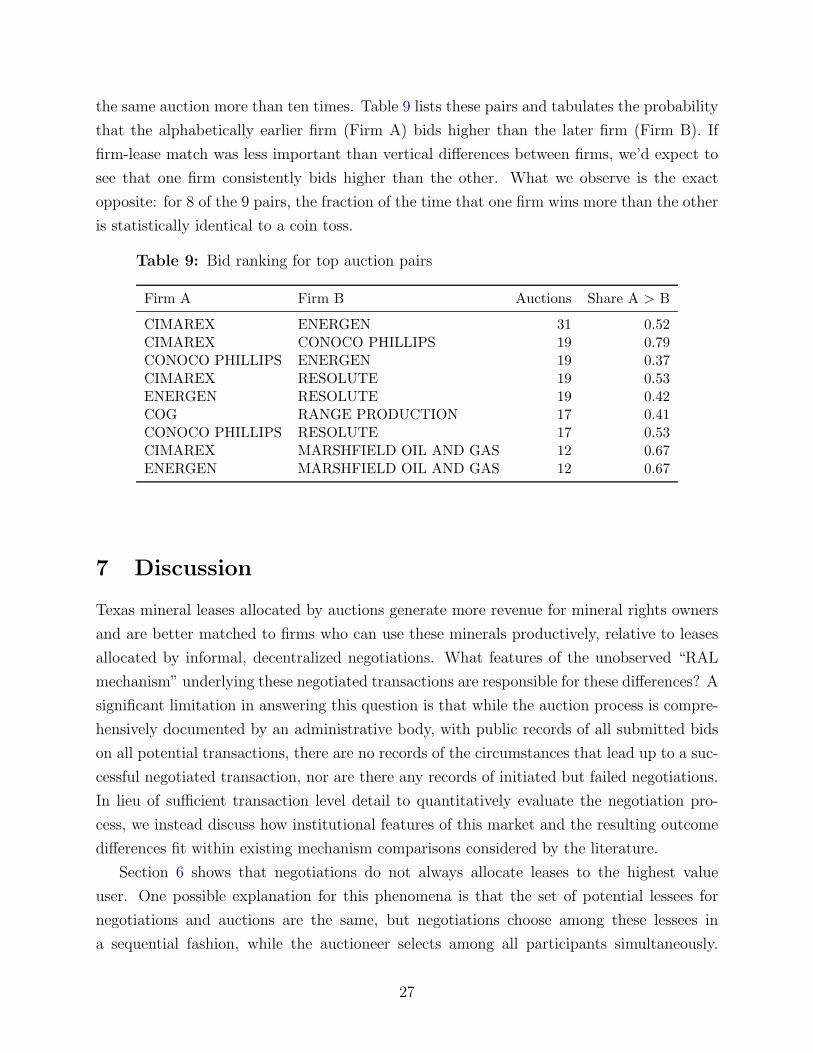
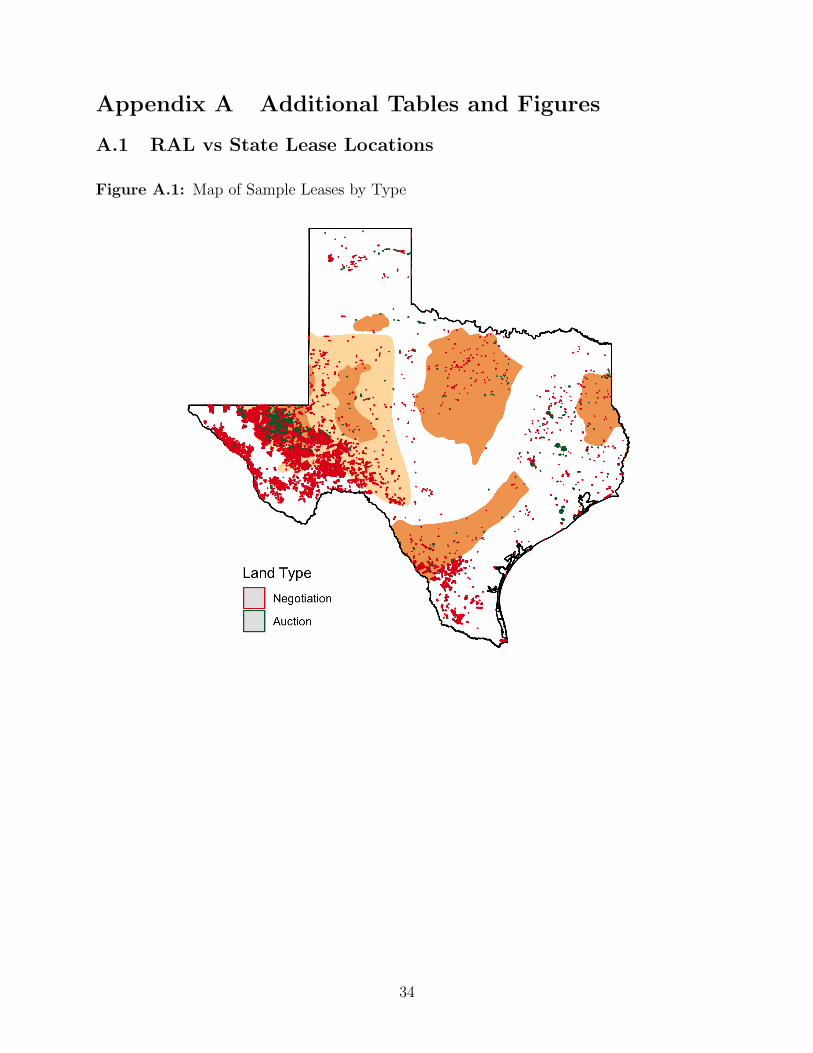
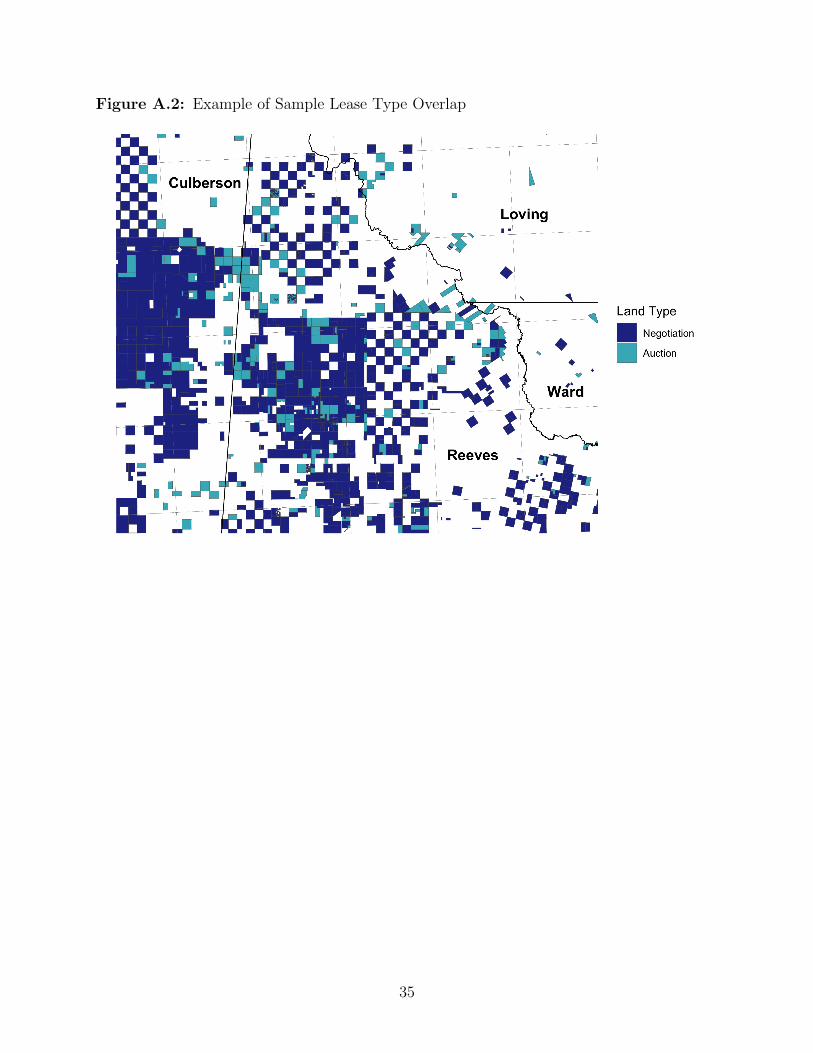
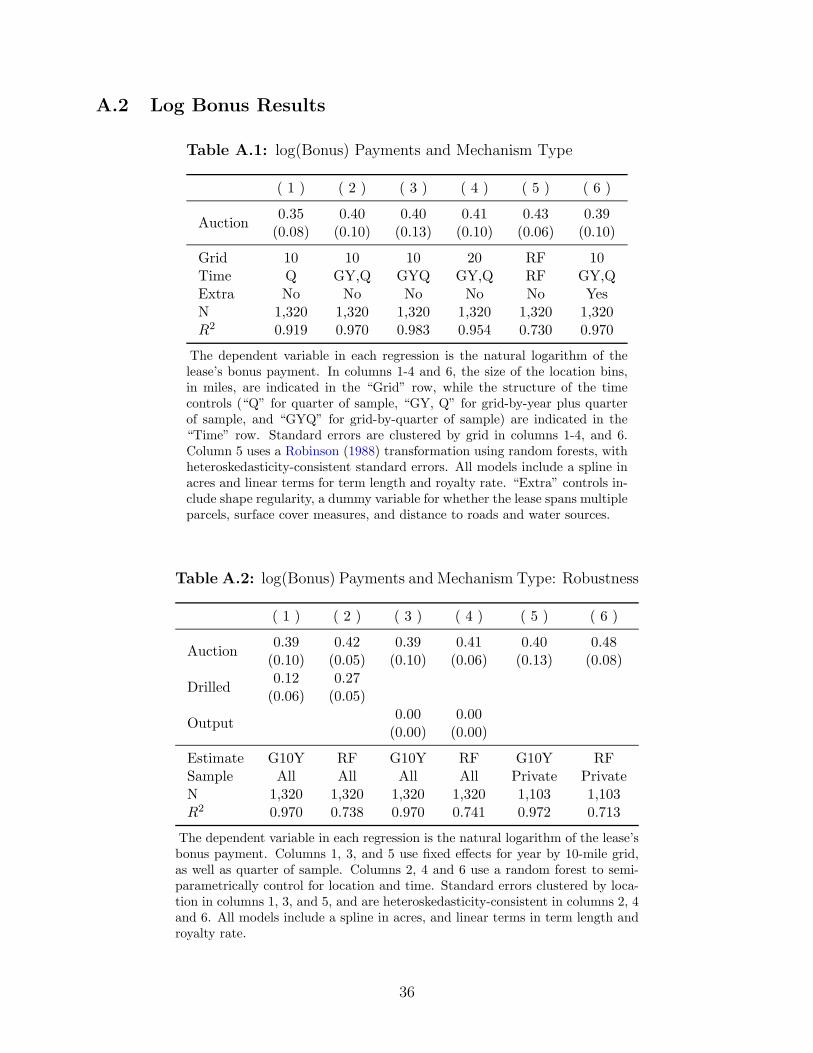
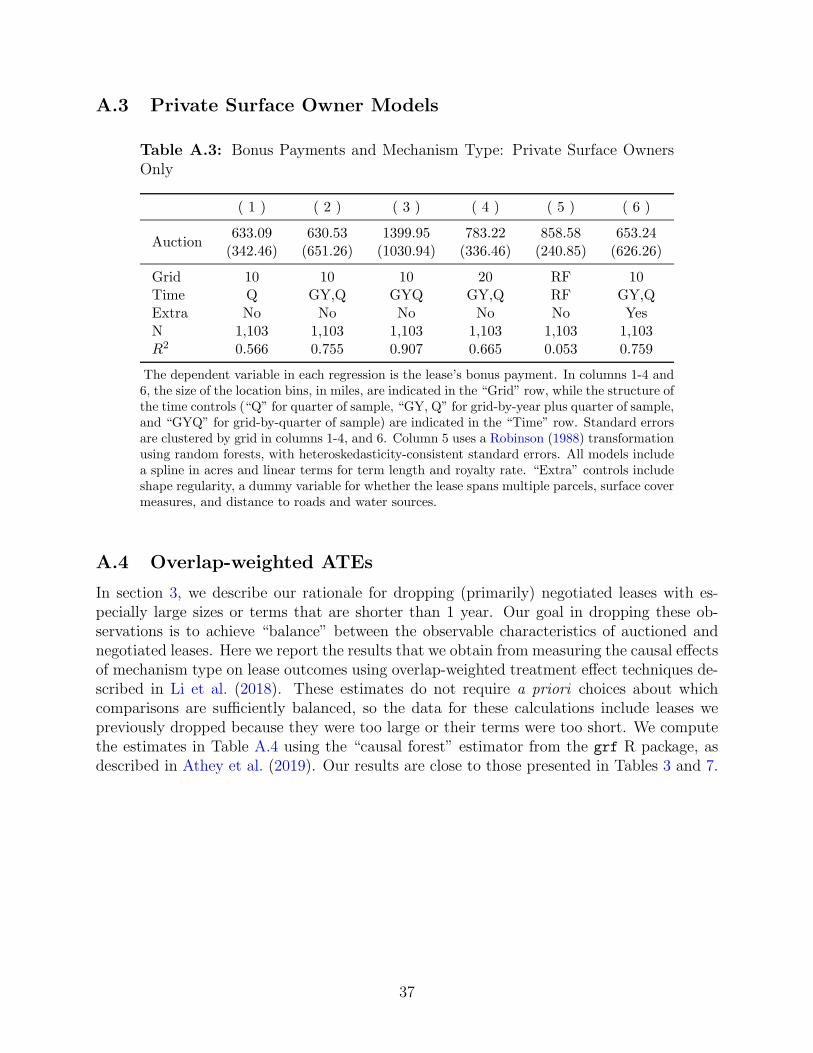
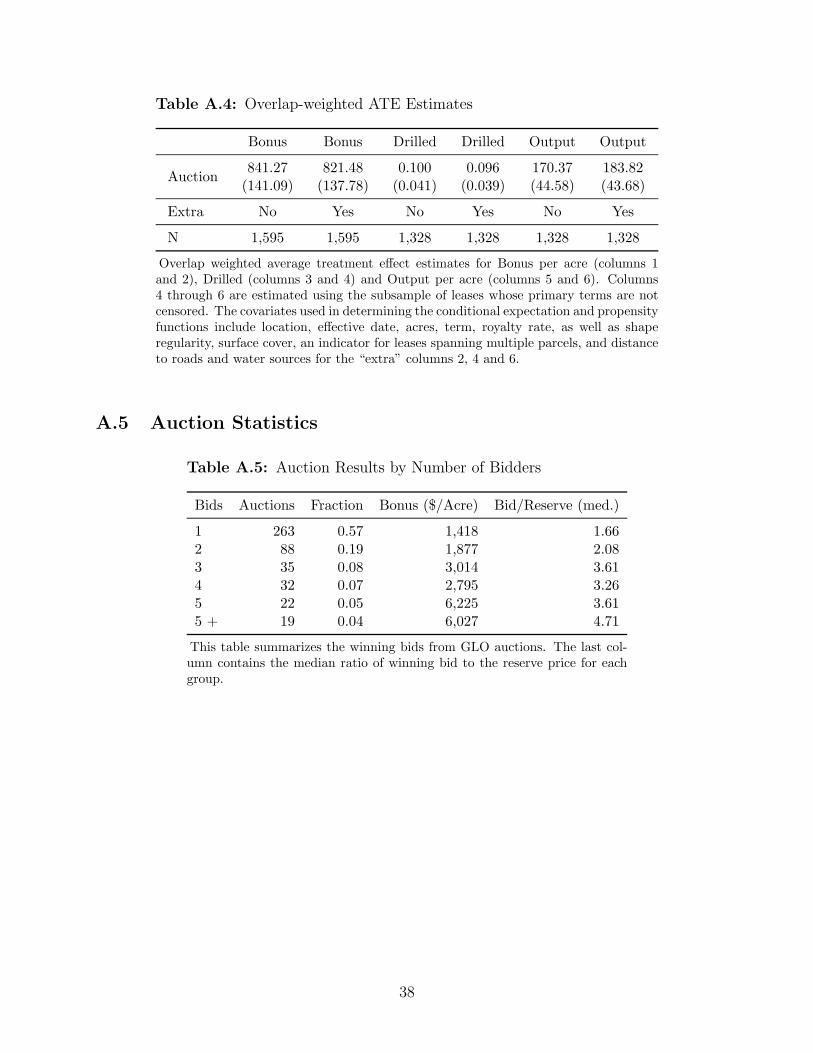
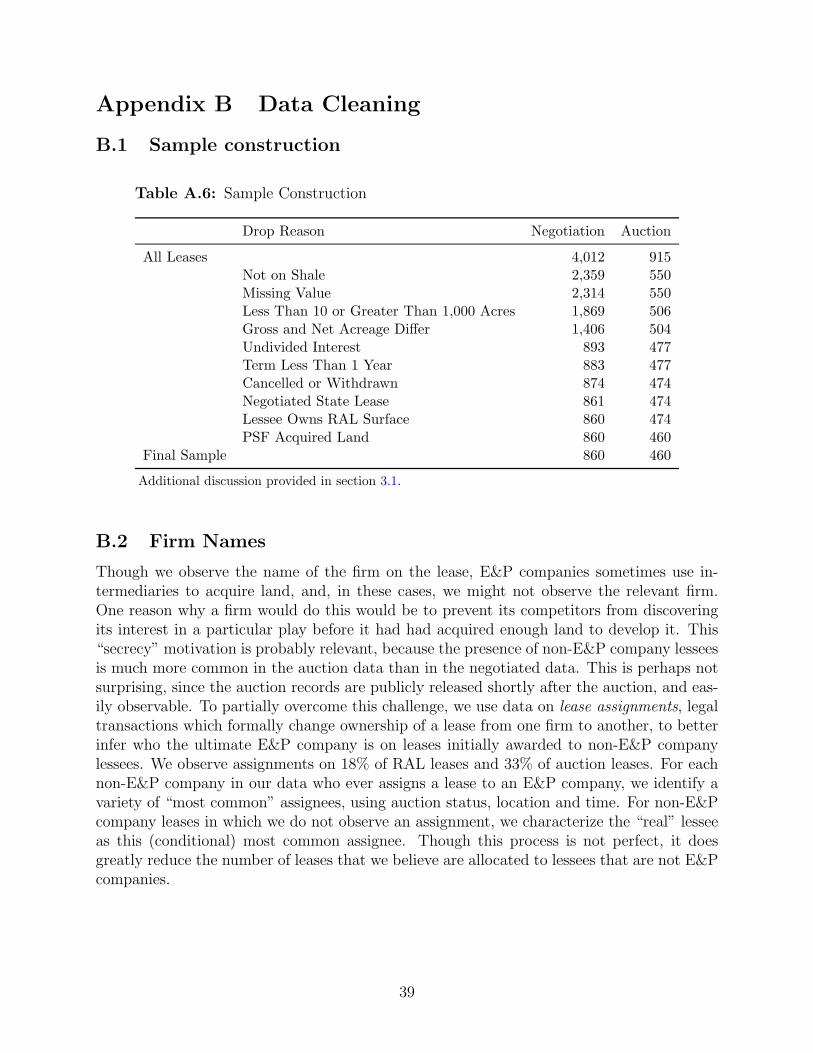
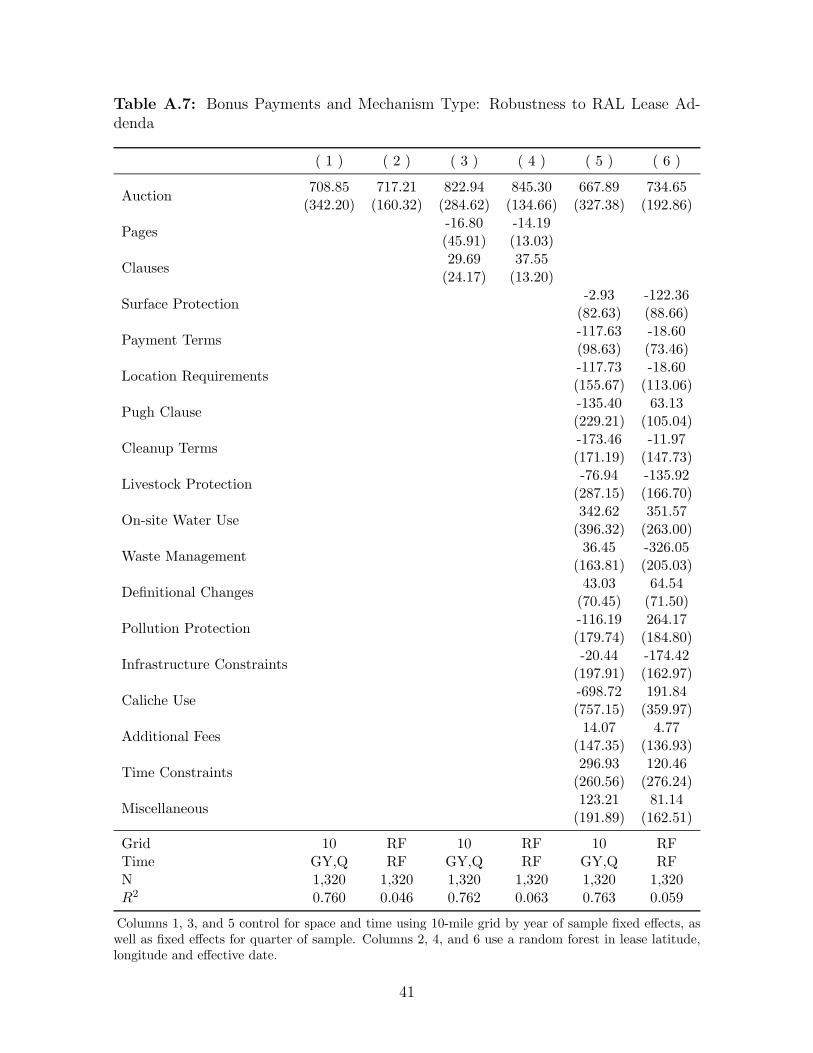