Embed Size (px)
Citation preview

Working Paper Series Breaking the shackles: Zombie firms, weak banks and depressed restructuring in Europe
Dan Andrews, Filippos Petroulakis
Disclaimer: This paper should not be reported as representing the views of the European Central Bank (ECB). The views expressed are those of the authors and do not necessarily reflect those of the ECB.
No 2240 / February 2019
Abstract
This paper explores the connection between ”zombie” firms (firms that would typically exitin a competitive market) and bank health and the consequences for aggregate productivityin 11 European countries. Controlling for cyclical effects, the results show that zombie firmsare more likely to be connected to weak banks, suggesting that the zombie firm problem inEurope may at least partly stem from bank forbearance. The increasing survival of zombiefirms congests markets and constrains the growth of more productive firms, to the detrimentof aggregate productivity growth. Our results suggest that around one-third of the impact ofzombie congestion on capital misallocation can be directly attributed to bank health and addi-tional analysis suggests that this may partly be due to reduced availability of credit to healthyfirms. Finally, improvements in bank health are more likely to be associated with a reduc-tion in the prevalence of zombie firms in countries where insolvency regimes do not undulyinhibit corporate restructuring. Thus, leveraging the important complementarities betweenbank strengthening efforts and insolvency regime reform would contribute to breaking theshackles on potential growth in Europe.
Keywords: Zombie Firms; Factor Reallocation; Productivity; Credit ConstraintsJEL codes: D24, G21, L25, O47.
ECB Working Paper Series No 2240 / February 2019 1

Non-Technical Summary
The collapse in potential output growth over the past two decades brings into focus the struc-tural barriers to productivity growth in Europe and the scope for policy to break these shackles.Firm-level research has linked the productivity slowdown to widening productivity dispersionacross firms (Andrews et al. 2016), rising capital misallocation (Gopinath et al. 2017) and declin-ing business dynamism (Decker et al. 2016). A related source of concern is that firms that wouldtypically exit or be forced to restructure in a competitive market – ”zombie firms” – seem to in-creasingly survive during the crisis, which may weigh on average productivity and crowd-outgrowth opportunities for more productive firms (Adalet McGowan et al. 2018). It has been ar-gued (Caballero et al. 2008) that the presence of zombies imposes a tax on healthy firms, whosuffer a loss in profitability and hence growth prospects, impacting aggregate growth. Theseproblems may be symptomatic of impaired banks, which may be reluctant to recognize non-performing loans (NPLs) and realize losses on their balance sheets, and may rather “evergreen”loans to zombie firms (i.e. bank forbearance). Outside of the Japanese experience of the 1990s weknow little about why zombies exist, and to what extent the zombie problem is a manifestationof banking sector weakness. We also know very little about the role of insolvency frameworks:lengthy procedures and barriers to restructuring may result in low enough recovery rates thateven healthy banks have little incentive to force a default and may instead forbear on zombies.
Accordingly, this paper studies the connection between zombie firms, bank health and insolvencyframeworks and the consequences for productivity growth. Using a large cross-country firm-level database, information on bank balance sheets, credit availability perception indicators byfirms, and a new indicator on insolvency regimes, our paper produces four concrete results.
First, our estimates show that zombie firms have a higher likelihood of being connected to aweak bank. After controlling for cyclical influences at the industry-country level, our estimatesimply that weak banks are between 1.2 and 1.8 percentage points more likely of being connectedwith a zombie firm compared to healthy banks. This translates into a 13% to 19% difference inzombie incidence between healthy and weak banks. These results are consistent with the ideathat the zombie firm problem in Europe may at least partly stem from bank forbearance.
Second, we find an important role for the insolvency framework in shaping the link betweenzombie firms and bank health. Even when banks are healthy, an insolvency framework whichimpedes corporate restructuring and reduces recovery rates for creditors may reduce incentivesfor banks to commence the process of recovery, liquidation, or restructuring. We show that im-provements in bank health are more likely to be associated with a reduction in the prevalenceof zombie firms in countries where insolvency regimes do not unduly inhibit corporate restruc-
ECB Working Paper Series No 2240 / February 2019 2

turing. Put differently, the effectiveness of efforts to reduce NPLs will be limited if insolvencyregimes remain hostile to efficient restructuring. These findings carry strong policy implicationsand imply that leveraging the important complementarities between efforts to restore bank healthand insolvency regime reform will be important for breaking the shackles on potential growth.
Third, we explore the aggregate consequences of the zombie firm-bank connection throughthe channel of capital reallocation. In a well-functioning economy, capital should flow towardsmore productive firms at the expense of less productive firms (productivity-enhancing capitalreallocation). We show that, on average, capital reallocation is productivity-enhancing, but theextent to which this is true diminishes as zombie congestion (i.e. the share of the industry capitalstock sunk in zombie firms) rises. Consistent with the zombie firm- weak bank link uncoveredabove, we then show that the capital reallocation process is less (more) productivity-enhancingin industries exposed to weaker (healthier) banks. Our results suggest that around one-thirdof the impact of zombie congestion on capital misallocation can be directly attributed to bankhealth. These findings are significant given that rising capital misallocation is emerging as a keyexplanation of the productivity slowdown in some countries (Gopinath et al. 2017).
Finally, we provide new evidence on an understudied channel: the potential for zombie firmsto crowd-out credit to healthier and more productive firms. If zombie congestion crowds-outinvestment opportunities for healthier and more productive firms, one would expect that this re-lationship is also reflected in access to credit. We find a statistically significant negative relation-ship at the sectoral level between the share of capital sunk in zombie firms and credit availabilityfor healthy firms. This could reflect direct crowd-out – banks cannot lend to healthy firms be-cause their balance sheets are weakened due to zombie exposure – or reduced borrowing capacitybecause zombie congestion has reduced industry profitability and thus the returns on potentialprojects of healthy firms. Assuming banks engage in sectoral diversification, we hypothesize thatthe latter is more likely. These results should be interpreted with caution, given that the samplesize is very small and the economic magnitude of the estimated coefficient is modest.
The results of this paper imply that in order to facilitate the unwinding of the zombie problem itis essential that bank balance sheets are strong, underlining the need for fast recapitalizations af-ter crises and measures to reduce NPLs. But strengthening banks is insufficient while insolvencyregimes remain hostile to the orderly restructuring and resolution of weak firms. Thus, in coun-tries with weak banks and weak insolvency regimes, efforts to improve banks’ health should beaccompanied by appropriate insolvency reforms to reduce impediments to corporate restructur-ing. At the same time, countries with strong firms and banks should view the establishment ofan efficient insolvency framework as equivalent to a financial stability-enhancing measure.
ECB Working Paper Series No 2240 / February 2019 3

1 Introduction
The collapse in potential output growth over the past two decades brings into closer focus thestructural barriers to productivity growth in Europe and the scope for policy to break theseshackles. Firm-level research is increasingly linking the aggregate productivity slowdown to thewidening productivity dispersion across firms (Andrews et al. 2016), rising capital misallocation(Gopinath et al. 2017) and declining business dynamism (Decker et al. 2016). A related source ofconcern is that firms that would typically exit or be forced to restructure in a competitive market– i.e. ”zombie firms” – are increasingly surviving, which may weigh on average productivity andcrowd-out growth opportunities for more productive firms (Adalet McGowan et al. 2018). Thezombie problem is a particular manifestation of inefficiencies on the (firm) exit margin. Whenzombie firms remain in the market, they trap scarce resources, which imposes an implicit tax onhealthy firms, reducing their profit and hence their investment and growth opportunities (zom-bie congestion). A rich literature dating back to Hopenhayn (1992) has posited that the exit of lowproductivity firms and the reallocation of their resources to more productive firms are key for ag-gregate MFP (multi-factor productivity) growth, and ultimately, economic growth. Inefficienciesin the exit margin can thus have severe aggregate consequences.
In some countries, these problems may be symptomatic of impaired banking sectors. In thisview, banks’ reluctance or lack of incentives to deal with non-performing loans (NPLs) and re-alize losses on their balance sheets that may arise from corporate insolvencies, may lead to ”ev-ergreening” of loans to zombie firms (i.e. bank forbearance). But almost everything we knowabout this issue is based on the Japanese experience of the 1990s (Caballero et al. 2008; Peek &Rosengren 2005) and cross-country research on the connection between zombie firms and weakbanks is scarce.
Accordingly, this paper explores the connection between zombie firms and bank health and theresulting consequences for aggregate productivity growth. To this end, we assemble a cross-country micro dataset by linking ORBIS, the largest commercially available firm-level source ofcross-country data, with bank-level information from Bankscope and microdata on firms’ accessto finance from the Survey on the Access to Finance for Enterprises (SAFE), run by the EuropeanCentral Bank (ECB). We use principal components analysis to construct a multi-dimensional in-dicator of bank health, which takes into account tangible equity, net income, NPLs, return onassets, and measures of maturity mismatch and asset riskiness. Our final dataset covers 11 Eu-ropean countries, from 2001 to 2014. In turn, cross-country empirical analysis delivers four mainpolicy findings.
ECB Working Paper Series No 2240 / February 2019 4

First, after controlling for cyclical influences at the industry-country level, our baseline (within-industry) estimates show that zombie firms have a higher likelihood of being connected to aweak bank. These results survive a battery of robustness tests. Assuming a causal relationship,our baseline estimates imply that weak banks (i.e. those one standard deviation below the meanof the bank health distribution) are between 1.2 and1.8 percentage points more likely of beingconnected with a zombie firm compared to healthy banks (i.e. those one standard deviationabove the mean of the bank health distribution), using the definition of Adalet McGowan et al.(2018). This translates into a 13% to 19% difference in zombie incidence between healthy andweak banks relative to the mean. These results are consistent with the idea that the zombie firmproblem in Europe may at least partly stem from bank forbearance.
We then explore the potential for the design of insolvency regimes to condition the link betweenzombie firms and bank health. Even when banks are healthy, an insolvency framework whichcreates impediments to corporate restructuring and reduces recovery rates for creditors may re-duce the economic incentives for banks to commence the process of recovery, liquidation, orrestructuring. Consistent with this idea, we exploit new OECD insolvency regime indicators (seeAdalet McGowan & Andrews 2018) to show that improvements in bank health are more likely tobe associated with a reduction in the prevalence of zombie firms in countries where insolvencyregimes do not unduly inhibit corporate restructuring. Put differently, the effectiveness of effortsto reduce NPLs will be limited if insolvency frameworks remain hostile to efficient restructuring.Taken together, these findings carry strong policy implications and imply that leveraging the im-portant complementarities between efforts to restore bank health and insolvency regime reformwill be crucial for breaking the shackles on potential growth in Europe.
Third, we explore the aggregate consequences of the zombie firm-weak bank connection throughthe channel of capital reallocation. We first replicate the key findings of Adalet McGowan et al.(2018), and show that on average, more productive firms attract more capital (i.e. capital realloca-tion is productivity-enhancing) but the extent to which this is true diminishes as zombie conges-tion (i.e. the share of the industry capital stock sunk in zombie firms) rises. Consistent with theempirical link between zombie firms and bank health uncovered above, we then show that thecapital reallocation process is less (more) productivity-enhancing in industries exposed to weaker(healthier) banks. For example, a one standard deviation increase in bank health would raise ourpreferred measure of the efficiency of capital reallocation (the difference in capital growth be-tween firms one standard deviation above and below the sectoral mean of productivity) by 23%.Moreover, our results suggest that around one-third of the impact of zombie congestion on cap-ital misallocation can be directly attributed to bank health. These findings are significant giventhat rising capital misallocation is emerging as a key explanation of the productivity slowdown
ECB Working Paper Series No 2240 / February 2019 5

in some countries (Gopinath et al. 2017).
Finally, we study the channels through which zombie congestion may adversely affect the growthopportunities of healthier and more productive firms. If zombie congestion crowds-out invest-ment opportunities for healthier and more productive firms, then one would expect that thisrelationship is also reflected in access to credit. Using data from the Survey on the Access toFinance of Enterprises (SAFE) from the European Central Bank (ECB), we find a statistically sig-nificant negative relationship at the sectoral level between the share of capital sunk in zombiefirms and credit availability for healthy firms. Intuitively, this could reflect direct crowd-out ef-fects – i.e. banks cannot lend to healthy firms because their balance sheets are weakened due totheir zombie exposure – or reduced borrowing capacity because zombie congestion has reducedindustry profitability and thus the returns on potential projects of healthy firms. Assuming banksengage in sectoral diversification, we hypothesize that this is more likely to reflect the latter andless so direct crowd-out. These results should be interpreted with caution, however, given thatthe sample size is very small and the economic magnitude of the estimated coefficient is modest.
The paper is structured as follows. The following section illustrates the link between zombies andproductivity weakness and then reviews existing literature between zombie firms, weak banks,and insolvency regimes. Section 3 outlines the empirical strategy while Section 4 explains thedata sources. Section 5 then provides new empirical evidence on four issues: i) the connection be-tween zombie firms and weak banks; ii) how this link is conditioned by the design of insolvencyregimes; iii) the aggregate consequences of the zombie firm-weak bank connection through thechannel of capital reallocation; and iv) channels through which zombie congestion adversely af-fects growth, with a particular focus on healthy firms access to finance. Section 6 provides someconcluding remarks.
2 Productivity, Zombie firms, and Public Policy
2.1 The exit margin as a source of productivity weakness
Potential output growth has slowed by about one percentage point per annum across the EU sincethe late 1990s, which is entirely accounted for by a collapse in labor productivity growth. Diggingdeeper, this reflects a pre-crisis slowing in multi-factor productivity (MFP)1 growth (figure 1), andmore recently a weakness in capital deepening (Ollivaud et al. 2016). This has raised questions
1MFP is equivalent to TFP, Total Factor Productivity, but we use the MFP term throughout the text.
ECB Working Paper Series No 2240 / February 2019 6

about our societies’ ability to make good on promises to current and future generations.
A key lesson from recent research is that using aggregate data to understand the proximatedrivers of productivity weakness only gets one so far. In fact, cross-country differences in aggre-gate productivity are increasingly being linked to the widespread asymmetry and heterogeneityin firm performance within sectors (Bartelsman et al. 2013, Hsieh & Klenow 2009). The distribu-tion of firm productivity is typically not clustered around the mean but is instead characterizedby many below-average performers and a smaller number of star performers. Moreover, the de-gree of heterogeneity is striking: even within narrowly defined industries in the United States,firms at the 90th percentile of the MFP distribution are twice as productive as firms at the 10thpercentile (Syverson 2011).
This heterogeneity in firm performance is important as it creates scope for growth-enhancingresource reallocation. A theoretical literature dating back to Hopenhayn (1992) has posited thatthe exit of low productivity firms and the reallocation of their resources to more productive firmsare key for aggregate MFP growth. Indeed, firm exit creates space for new varieties to emergeand new entrants productively recycle the assets of defunct firms across a range of activities.2
While this typically reflects the reallocation of tangible inputs, there is also scope for the post-exitdiffusion of codified knowledge to new entrants via employee mobility and the sales of patents(Hoetker & Agarwal 2007). More generally, these predictions have been borne out in a host ofempirical studies3, which document that within-industry resource reallocation is a significantcontributor to – if not the predominant driver of – aggregate productivity growth. While thecreative-destruction process in a well-functioning market economy compels poorly performingfirms to improve their efficiency or exit the market, there are signs from recent firm-level studiesthat this process may be slowing down.
First, the level of productivity dispersion within industries has risen over time, implying a widen-ing gap between more productive and less productive firms (Andrews et al. 2016). This findingof rising productivity dispersion is confirmed by a range of studies using alternate data sources(Decker et al. 2016, Berlingieri et al. 2017, Gamberoni et al. 2016) and it appears that it is notjust driven by frontier firms pushing the boundary outward. Instead, it has been attributed tostagnating laggard firm productivity related to the declining ability or incentives of such firms toadopt best practices from the frontier (Andrews et al. 2016). This raises serious questions aboutwhat allows weak firms that do not adopt the latest technologies to remain in the market.
2For the productive recycling of assets of exiting firms, see Australian Productivity Commission (2015) for theairline industry, Hiatt et al. (2009) for beverages, and Hoetker & Agarwal (2007) for the disk drive industry.
3See Baily et al. 1992, Foster et al. 2006, Baldwin & Gu 2006, Disney et al. 2003.
ECB Working Paper Series No 2240 / February 2019 7
Second, the contribution of resource reallocation to aggregate productivity growth has declinedover time. This is reflected in a decline in the responsiveness of firm growth (investment) toproductivity over recent decades in Europe (Adalet McGowan et al. 2018) and the United States(Decker et al. 2017), which implies that the propensity of high productivity firms to expand andlow productivity firms to downsize (or exit) has fallen (Decker et al. 2017). Similarly, Gopinathet al. (2017) document a rising dispersion of return to capital in the manufacturing sector in Spain,Italy, and Portugal in the run-up to the crisis, which they attribute to the misallocation of credit-driven capital inflows towards high net worth, but not necessarily productive, firms. Evidenceof a decline in productivity-enhancing reallocation is particularly significant in light of risingproductivity dispersion, which would ordinarily imply stronger incentives for productive firmsto aggressively expand and drive out less productive firms.
Finally, rising productivity dispersion and declining productivity-enhancing reallocation havecoincided with a decline in a variety of measures of business dynamism. A well-documentedaspect of this development is that firm entry has declined in many countries (Criscuolo et al.2014). Clearly, this does not augur well for productivity growth given that young firms possess acomparative advantage in commercializing radical innovations (Acemoglu et al. 2013) and placeindirect pressure on incumbent firms to improve their productivity via technology adoption. Buta less widely understood fact is that declining firm entry has also been accompanied by a risingsurvival probability of marginal firms that would typically exit in a competitive market (Andrewset al. 2016).
The prolonged survival of such firms not only weighs on average productivity but potentiallycrowds-out growth opportunities for more productive firms. Until recently, almost everythingwe knew about this issue was confined to Japan in the 1990s. In this regard, Caballero et al.(2008) argue that the survival of zombie firms congests markets and lowers industry profitability– by inflating wages relative to productivity and depressing market prices – which deters theexpansion of healthier firms. Using firm-level data for the Japanese episode, Caballero et al.(2008) infer whether a firm is a zombie by comparing its interest payments to prime lendingrates. They confirm that in industries where a higher share of capital is sunk in zombie firms,healthy firms experience lower investment and employment growth, and that the productivitygap between non-zombie and zombie firms is higher, implying that new firms need to clear awide productivity threshold in order to enter the market.
Outside of the Japanese episode, Adalet McGowan et al. (2018) apply the same framework to abroad sample of OECD countries. After controlling for cyclical influences at the industry-countrylevel, a higher share of industry capital sunk in zombie firms is found to crowd-out the growth –
ECB Working Paper Series No 2240 / February 2019 8

in terms of investment and employment – of healthy firms within an industry. Moreover, youngfirms are particularly affected. They find that up to one-quarter of the actual decline in aggregatebusiness investment in Italy between 2008 and 2013 can be linked to the rise in zombie conges-tion. But the story does not end there since zombie congestion disproportionately crowds-out thegrowth of more productive firms, thus slowing aggregate MFP growth via less efficient capitalreallocation. In Spain, for example, perhaps one-half of the decline in the efficiency of capitalreallocation can be accounted for by the rise in zombie congestion.
2.2 Zombie firms and weak banks
Despite the renewed research interest in zombie firms and their aggregate consequences, the liter-ature on the causes of the problem is slimmer. The seminal paper on the emergence of zombies inJapan is Peek & Rosengren (2005), who confirm the widely suspected phenomenon of ”evergreen-ing”, whereby banks engage in zombie lending by continuing to finance weak or even insolventfirms (”unnatural selection”). This was attributed to perverse institutional incentives, such asthe reluctance of banks to write-off loans, which increased the closer was the reported capital toregulatory requirements (”balance sheet cosmetics”). Cultural incentives also mattered: bankshad an implicit duty to support troubled firms, and relationship-lending forces were particularlyimportant. Overall, 14 to 36% of all firms were zombies at some point, according to Kwon et al.(2015).4
These studies from Japan provide insights into the proximate causes of zombie congestion inEurope. The most obvious account would emphasize the damage to the banking sector incurredfrom the financial crisis, which undermined its ability to channel scarce credit to the most efficientuses. In this regard, Acharya et al. (2017) provide some evidence that undercapitalized banksin Europe have directed loans to zombie firms in order to avoid incurring losses on their loanportfolios, which – instead of raising real activity – crowded-out the growth of non-zombie firmsvia zombie congestion. At the same time, recent evidence shows that bank stress hinders thedeleveraging process of zombie firms in the euro periphery (Storz et al. 2017).
4Subsequent work has shed light on the nuances of the Japanese episode. Sakai et al. (2010)found that smallfirms that eventually defaulted performed worse and paid higher interest rates than surviving firms. This finding– which contradicts Peek and Rosengren – may reflect differences in sample composition, particularly the focus onlisted firms only in the seminal study. Against this, Akiyoshi & Kobayashi (2010)directly test for the effect of bankdistress on firm productivity and confirm the negative link. Nishimura et al. (2005) find that firms with relativelyhigh MFP exited, while firms with relatively low MFP stayed in the market, an indication of unnatural selection.Okada & Horioka (2008) argued that the selection mechanism was disruptive, with banks giving preference to highand low MFP firms, at the expense of medium MFP firms, who presumably could survive even with rationed credit.
ECB Working Paper Series No 2240 / February 2019 9

Against this, Schivardi et al. (2018) study the universe of loans in Italy in 2003-2014, matchedwith the universe of firms. While their results confirm both zombie lending and negative ef-fects on healthy firms, they claim that the aggregate effects on MFP and the growth of healthyfirms are minimal. 5 They also find no evidence that bank capitalization affects credit supply tonon-zombies. While this paper is closely related to our own, it differs in two key respects. First,Schivardi et al. (2018) focus on new lending. Under the stricter supervision landscape in Europe,however, new lending to zombies may only constitute a small part of the forbearance strategy ofbanks. Instead, indirect means of forbearance – i.e. beneficial restructuring, maturity extensionor conversion of the payment structure (i.e. from regular installments to a lump-sum payment atmaturity) – may be more prevalent. For this reason, we implicitly focus on forbearance strategiesby considering indebtedness when constructing zombie firm indicators, and not only new lend-ing. Second, Schivardi et al. (2018) consider the bank-firm relationship, and therefore abstractfrom the possibility that lending is restricted because healthy firms lack the profitability requiredto get good credit, due to zombie congestion. By contrast, we employ a catch-all approach andthus consider all types of zombie-friendly behavior.
2.3 Zombie firms, weak banks, and insolvency regimes
The fact that zombies appear after large shocks in some countries but not others suggests thatthere is a potentially important role for structural policies, particularly the extent to which in-solvency regimes foster the timely initiation and resolution of insolvency proceedings.6 In thisregard, new evidence assembled in Adalet McGowan & Andrews (2018) reveal significant dif-ferences across European countries in barriers to corporate restructuring and the personal costsassociated with entrepreneurial failure implied by national insolvency regimes. Moreover, theydemonstrate the potential for reforms to insolvency regimes to reduce the share of capital sunk inzombie firms. For example, reducing barriers to restructuring to best practices could reduce thezombie capital share by one-half and one-third in Italy and Greece, respectively. These gains arepartly realized via the restructuring of weak firms, which in turn spurs the reallocation of capitalto more productive firms (Adalet McGowan et al. 2018) and generates MFP gains within laggardfirms via more efficient technological adoption (Adalet McGowan et al. 2017).
5Note, however, that Schivardi et al. (2018) find that a bank recapitalization of 4 billion euros in 2012 (0.25% ofGDP), would lead to additional GDP growth of 0.2-0.35% annually for five years, which is arguably sizable.
6For instance, we know little about why zombie firms emerged as a widespread phenomenon in 1990s Japan incontrast to other episodes. As Peek and Rosengren point out, this stands in contrast to the S&L crisis, where banksquickly shrank their loan portfolios after the shock. Indeed, that was the case even though loose lending standardsfrom the previous decade were also a large part of the problem, and also in contrast to the last crisis, where debtoverhang was a major concern several years after the shock.
ECB Working Paper Series No 2240 / February 2019 10

In a frictionless model, when a firm has trouble meeting its obligations to its debtor it will re-linquish ownership of its collateral. If this is not sufficient to repay the value of the debt, it willenter into bankruptcy proceedings to determine the value of its assets, which are then sold-offto pay the remainder of the debt. The faster this process is completed, the sooner will the re-sources tied to the failing firm be able to be reallocated to more productive uses. In practice,there can be a number of frictions that emanate from the inability of the insolvency frameworkto address the existence of incomplete contracts, which can severely delay the orderly realloca-tion process. Smith & Stromberg (2005) argue that the principal role of an orderly bankruptcyprocess is to mitigate bargaining frictions between the debtor and its creditor(s). By preventinga ”rush to the exit” motive, a well-designed insolvency regime verifies the value of assets andliabilities, it maintains the value of assets during bargaining, and improves coordination amongcreditors, among others.7 Consolo et al. (forthcoming) consider how the insolvency frameworkaffects deleveraging and NPLs in OECD countries, and find that a more efficient framework is astrong predictor of both the level of NPLs, but also the speed of NPL reduction.
In the context of zombie lending, poorly designed insolvency frameworks are likely to interactwith evergreening motives. Recall that a bank will be willing to evergreen loans to a troubledfirm (either by extending new loans or allowing non-payment of existing loans via restructuringof debt) because it does not want to write-off losses on its balance sheet and increase provisions. Itwill do so to the extent to which the amount recovered is not high enough to cover the increase inprovisions or, even if expected recovery is complete, it is expected to be delayed to such an extentthat the bank prefers to evergreen. Thus, a poorly-designed insolvency framework ultimatelyimplies a lower expected recovery value for the amounts owed to the bank and it follows thatevergreening motives should be higher than under a more appropriate regime. This leads usto suspect that improvements in bank health are more likely to be associated with a reductionin the prevalence of zombie firms in countries where insolvency regimes do not unduly inhibitcorporate restructuring.
2.4 Four key issues for investigation
Against this background, this paper addresses four key issues. First, it explores whether zombiefirms are more likely to be connected to weak banks, in order to gauge the extent to which bankforbearance is a relevant policy concern. Second, it examines whether the aforementioned linkbetween zombie firms and weak banks is conditioned by the design of insolvency regimes, with a
7Similar arguments are made by Marinc & Vlahu (2012), who also underline the role of the bankruptcy regimein preventing hold-out problems.
ECB Working Paper Series No 2240 / February 2019 11

view to highlighting potential policy complementarities between financial sector and insolvencyregime reform. Third, the paper explores consequences of the zombie firm-weak bank connectionfor aggregate productivity via the channel of capital reallocation. Finally, it contributes to the rel-atively scarce literature on the channels through which zombie firms affect growth, by examiningwhether zombie congestion crowds-out healthy firms’ access to credit.
3 Empirical framework
3.1 Zombie firms and weak banks
Our first aim is to establish a robust connection between zombie firms and weak banks. To thisend, we estimate the following baseline model for 11 countries8, over the period 2003-2014:
zombieisc,t = α0 + α1BankHealthisc,t−2 +Xisc,t−2Θ + γsc,t + εisc,t. (1)
The dependent variable takes the value of 1 if the firm is classified as a zombie in a given yearand 0 otherwise. BankHealthisc,t denotes the health of the bank associated with firm i in sector sin country c at time t), and is increasing in bank health.9 We enter bank health in the model witha two-year lag (t-2) in order to observe it at beginning of the time window used to define zombiefirms (recall that firms are classified as zombies if they demonstrate persistent financial weaknessfor three consecutive years) but the results are also highly robust to using a three-year lag.10 Thematrix Xisc,t is composed of relevant firm-level controls, such as firm size, firm age, and laborproductivity.11 We use a rich fixed effect structure, denoted by γsc,t. In our baseline specification,we use a triple-interacted country-sector-year fixed effect, meaning that we control for the effectsof time-varying shocks at the country-industry level, and we thus exploit firm-level variation
8These are Austria, Denmark, Estonia, France, Germany, Greece, Latvia, Slovenia, Spain, Portugal, United King-dom
9Although we mainly rely on the holistic bank health measure, we also briefly explore the role of different bankbalance sheet variables.
10We do this as we cannot know whether a troubled firm at time t is allowed to survive by its bank because thebank judges it to have growth potential, or because the bank engages in zombie forbearance (for balance sheet orother reasons). As such, we need to observe the firm as being troubled for some time in order to be more confidentclassifying it as a zombie. At the same time, the timing relationship between bank health and the incentive to allowzombie firms to survive (”bad” forbearance), or simply engage in temporary forbearance for struggling firms withgood growth prospects (”good” forbearance), is unclear.
11We do this as we want to control for possible selection on size or age (which have been shown to be important)or for cases where productive firms are struggling and their banks forbear as they expect to see profits in the future(in which case forbearance is efficient), and isolate the effect of bank health.
ECB Working Paper Series No 2240 / February 2019 12

within country-sector-year cells. Given our fixed effects structure, we are unable to use logit orprobit models, and so we estimate all our models with OLS (via linear probability models). Sinceour working hypothesis is that healthier banks have less of an incentive to allow zombie firms tostay alive (or remain zombies, without restructuring their debt), we expect α1 < 0.
One implication of our high-dimensional fixed effects structure is that since we identify off de-viations from within-group (i.e. country-industry-year) means, we potentially underestimateaggregate effects (which is indeed the case as we show in section 5). Intuitively, over the periodwe study, there was a worsening of bank health as a result of the financial crisis initially, and thesovereign debt crisis subsequently, for each country and sector. By imposing a triple-interactedfixed effect framework, we are effectively purging a lot of this variation. Thus, after establishingthe robustness of our results to controlling for country-sector-year fixed effects, we also applya less burdensome fixed effects structure, in order to produce a less conservative bound for themagnitude of our results. The latter involves controlling for time fixed effects (to absorb globalshocks) and country-industry fixed effects to control for time-invariant country-specific industrycharacteristics. We also report an upper bound effect that includes country-sector fixed effectsbut omits time effects.
3.2 Zombie firms, bank health, and insolvency regimes
Next, we incorporate the insolvency framework indicators. We focus on four indicators, denotedby INSOLc, as they vary only at the country level and pertain to a single point in time.12 Due tothe lack of temporal variation, the level effect of the indicator variable is absorbed by the countryfixed effect, and so we identify its effect from the interaction with bank health.
We augment (1) as follows:
zombieisc,t = α0 + α1BankHealthisc,t−2 + α2BankHealthisc,t−2 × INSOLc
+Xisc,t−2Θ + γsc,t + εisc,t. (2)
The insolvency variables are defined as deviations from best practices, so a rising value of theindicator denotes a framework that is more likely to delay the initiation and resolution of insol-vency proceedings. More specifically, our working assumption is that higher barriers to corporate
12The indicators pertain to two separate years - 2010 and 2016 - and were collected in a single wave, in 2016 and2017. As our sample covers the period 2003-2014, we consider regressions with both years separately. Unfortunately,it is not possible to exploit time series variation in the indicator (see Adalet McGowan & Andrews 2018.
ECB Working Paper Series No 2240 / February 2019 13
restructuring, for example, will reduce the extent to which improvements in bank health translateinto a reduction in zombie firm prevalence. Thus, our prediction is that α1 < 0, as before, andα2 > 0.
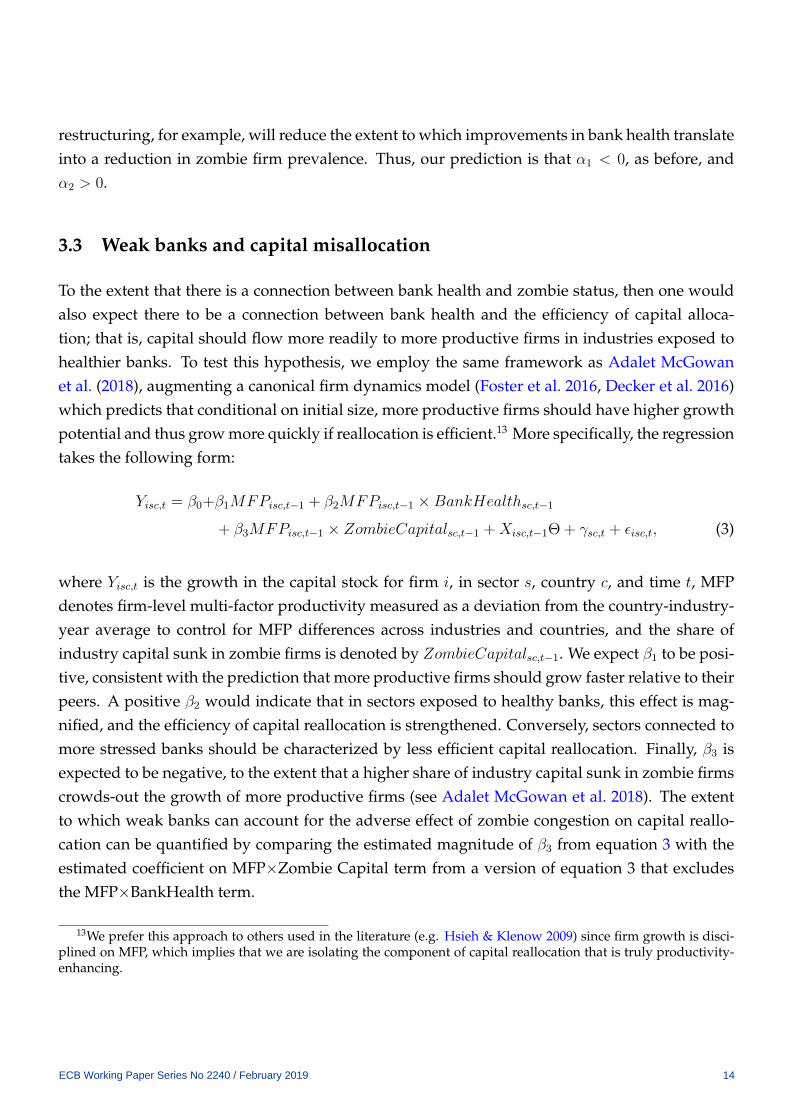
3.3 Weak banks and capital misallocation
To the extent that there is a connection between bank health and zombie status, then one wouldalso expect there to be a connection between bank health and the efficiency of capital alloca-tion; that is, capital should flow more readily to more productive firms in industries exposed tohealthier banks. To test this hypothesis, we employ the same framework as Adalet McGowanet al. (2018), augmenting a canonical firm dynamics model (Foster et al. 2016, Decker et al. 2016)which predicts that conditional on initial size, more productive firms should have higher growthpotential and thus grow more quickly if reallocation is efficient.13 More specifically, the regressiontakes the following form:
Yisc,t = β0+β1MFPisc,t−1 + β2MFPisc,t−1 ×BankHealthsc,t−1
+ β3MFPisc,t−1 × ZombieCapitalsc,t−1 +Xisc,t−1Θ + γsc,t + εisc,t, (3)
where Yisc,t is the growth in the capital stock for firm i, in sector s, country c, and time t, MFPdenotes firm-level multi-factor productivity measured as a deviation from the country-industry-year average to control for MFP differences across industries and countries, and the share ofindustry capital sunk in zombie firms is denoted by ZombieCapitalsc,t−1. We expect β1 to be posi-tive, consistent with the prediction that more productive firms should grow faster relative to theirpeers. A positive β2 would indicate that in sectors exposed to healthy banks, this effect is mag-nified, and the efficiency of capital reallocation is strengthened. Conversely, sectors connected tomore stressed banks should be characterized by less efficient capital reallocation. Finally, β3 isexpected to be negative, to the extent that a higher share of industry capital sunk in zombie firmscrowds-out the growth of more productive firms (see Adalet McGowan et al. 2018). The extentto which weak banks can account for the adverse effect of zombie congestion on capital reallo-cation can be quantified by comparing the estimated magnitude of β3 from equation 3 with theestimated coefficient on MFP×Zombie Capital term from a version of equation 3 that excludesthe MFP×BankHealth term.
13We prefer this approach to others used in the literature (e.g. Hsieh & Klenow 2009) since firm growth is disci-plined on MFP, which implies that we are isolating the component of capital reallocation that is truly productivity-enhancing.
ECB Working Paper Series No 2240 / February 2019 14

We use bank health at the sector level, not at the firm-level, for two reasons. First, because itis sectoral bank health that matters for zombie congestion. According to our hypothesis, weakbanks may prop up zombie firms, which in turn crowds out growth opportunities even for pro-ductive firms that are connected to healthy banks.14 Second, by adding sectoral bank health weaddress one criticism for the reallocation regression by Schivardi et al. (2018). They argue thatan aggregate shock - which increases the zombie share in a sector - may also affect the relativeperformance of firms, even in the absence of zombie congestion effects. They instead examine theeffect of sectoral bank health on the relative performance of firms, claiming that it does not sufferfrom the same issues, and implicitly treating negative reallocation through zombie congestion orbank health as equivalent. The identifying assumption necessary in this case is that bank healthis exogenous to sectoral business cycle conditions (a test we directly carry out); if this is satisfied,then our model gives a direct estimate of the reallocation effects of bank health.
For the reallocation models, we focus on 7 countries from our sample which give us the broadestestimates of MFP at the firm level. These are Austria, France, Germany, Slovenia, Spain, Portugal,and the United Kingdom. See Adalet McGowan et al. (2018) for more details.
3.4 Zombie firms and credit crowd-out
Finally, we explore the question of whether the survival of zombie firms crowds-out credit accessto healthier firms, by combining data from ORBIS with SAFE, in a sample of 4 euro area coun-tries (France, Germany, Italy and Spain). More specifically, we examine whether healthy firmsoperating in industries where a higher share of industry capital is sunk in zombie firms havemore difficulty obtaining bank credit than firms in sectors where zombie congestion is lower.The sample chosen is representative and we utilize the rolling panel component of the survey,which contains firm-level balance sheet information. The period covered is from 2009 to 2013.
The model is as follows:
CreditAvailabilityisc,t = δ0 + δ1ZombieCapitalsc,t−1 +Xisc,t−1Θ + γc,t + εisc,t, (4)
where: CreditAvailability is increasing in the extent to which bank loan (or credit line) availabilityfor firms has improved over time (see section 4.2). The remaining variables are defined above.Contrary to the other models, the bulk of the variation in the zombie capital share is at the sectoral
14In addition, this strategy allows us to increase the sample size, allowing our sample to capture the underlyingdistribution of firms, which is crucial for the validity of the exercises.
ECB Working Paper Series No 2240 / February 2019 15
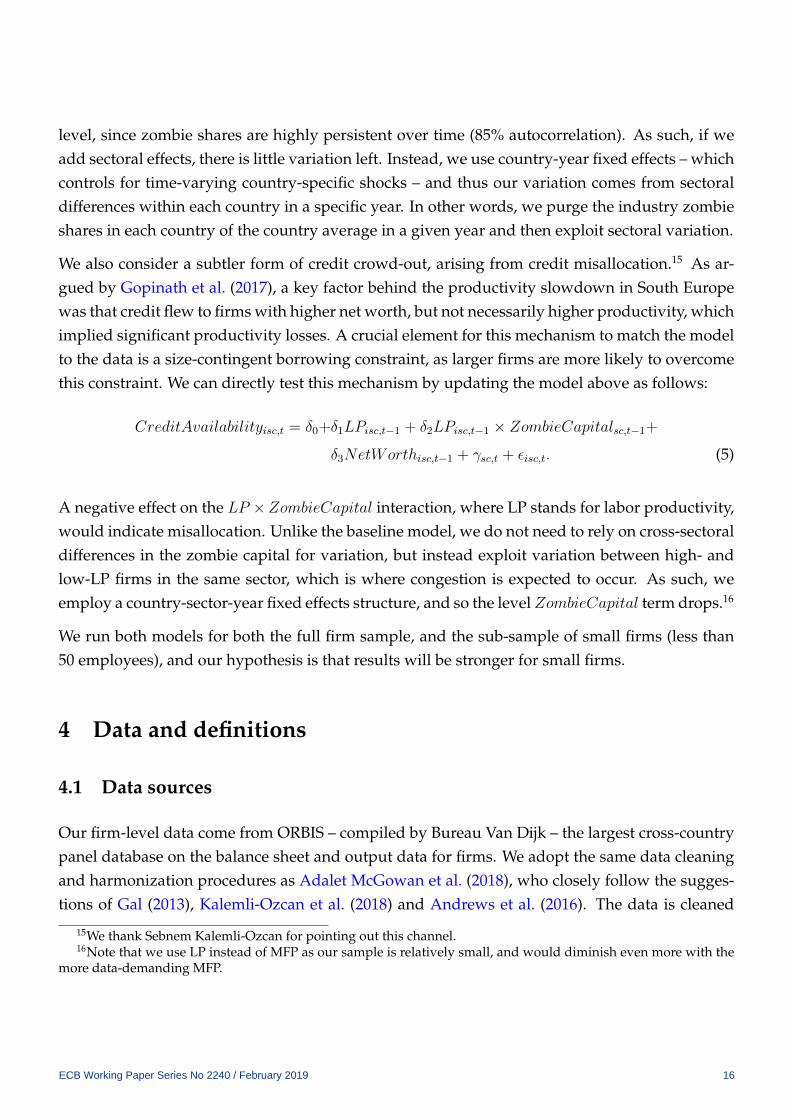
level, since zombie shares are highly persistent over time (85% autocorrelation). As such, if weadd sectoral effects, there is little variation left. Instead, we use country-year fixed effects – whichcontrols for time-varying country-specific shocks – and thus our variation comes from sectoraldifferences within each country in a specific year. In other words, we purge the industry zombieshares in each country of the country average in a given year and then exploit sectoral variation.
We also consider a subtler form of credit crowd-out, arising from credit misallocation.15 As ar-gued by Gopinath et al. (2017), a key factor behind the productivity slowdown in South Europewas that credit flew to firms with higher net worth, but not necessarily higher productivity, whichimplied significant productivity losses. A crucial element for this mechanism to match the modelto the data is a size-contingent borrowing constraint, as larger firms are more likely to overcomethis constraint. We can directly test this mechanism by updating the model above as follows:
CreditAvailabilityisc,t = δ0+δ1LPisc,t−1 + δ2LPisc,t−1 × ZombieCapitalsc,t−1+
δ3NetWorthisc,t−1 + γsc,t + εisc,t. (5)
A negative effect on the LP ×ZombieCapital interaction, where LP stands for labor productivity,would indicate misallocation. Unlike the baseline model, we do not need to rely on cross-sectoraldifferences in the zombie capital for variation, but instead exploit variation between high- andlow-LP firms in the same sector, which is where congestion is expected to occur. As such, weemploy a country-sector-year fixed effects structure, and so the level ZombieCapital term drops.16
We run both models for both the full firm sample, and the sub-sample of small firms (less than50 employees), and our hypothesis is that results will be stronger for small firms.
4 Data and definitions
4.1 Data sources
Our firm-level data come from ORBIS – compiled by Bureau Van Dijk – the largest cross-countrypanel database on the balance sheet and output data for firms. We adopt the same data cleaningand harmonization procedures as Adalet McGowan et al. (2018), who closely follow the sugges-tions of Gal (2013), Kalemli-Ozcan et al. (2018) and Andrews et al. (2016). The data is cleaned
15We thank Sebnem Kalemli-Ozcan for pointing out this channel.16Note that we use LP instead of MFP as our sample is relatively small, and would diminish even more with the
more data-demanding MFP.
ECB Working Paper Series No 2240 / February 2019 16

in a common manner across all countries, harmonizing balance sheets in terms of consolidationlevel and time horizon (calendar year). Firm-level nominal variables are deflated using 2-digitindustry deflators from the OECD STAN database (as firm-level prices are not available, all pro-ductivity measures are revenue-based) and prices are expressed in industry purchasing powerparities. We use the methods identified in Gal (2013) to construct capital stock and productivityvariables (see below).17 Finally, as is standard practice, we consider only non-farm, non-financialfirms, and end up with a sample based on 61 sectors (between NACE Rev 2. 10-82, excluding64-66 – i.e. financials).
Bank balance sheet data is sourced from Bankscope, which contains data for over 30,000 banksas far back as 2001. We match ORBIS and Bankscope based on the banker variable in ORBIS,and we follow the literature and assume that the stated banker relationship also implies a bor-rowing relationship. There is ample evidence in the recent literature (Kalemli-Ozcan et al. 2018,Chodorow-Reich 2014) that lending relationships are highly sticky. Consistent with other papers,we are able to match a very large fraction of our firms to their main bank (Kalemli-Ozcan et al.2018, Storz et al. 2017), with match rates exceeding 90% in most countries. For cases where thefirm mentions more than one bank, we assume that the first bank mentioned is the main one.Summary statistics are given in Table I. Finally, we exploit restricted microdata on firms’ accessto finance from the Survey on the Access to Finance for Enterprises (SAFE), run by the EuropeanCentral Bank (ECB).
4.2 Key variable definitions
Productivity For productivity, we use two different methods, depending on the application,with a goal of striking a balance between maximizing our sample and using a robust estimate.As a control variable in the zombie firm regression analysis, we simply use gross output peremployee, deflated using the 2-digit OECD STAN industry deflators mentioned above, whichwe denote as labor productivity (LP). While this allows us to maximize data coverage, it shouldbe noted that Bartelsman et al. (2013) find that LP captures systematic variations in value-addedbased labor productivity. For the reallocation regressions, we follow Adalet McGowan et al.(2017b) and use a productivity measure based on a Solow residual (MFPR).
Zombie firms We employ two different definitions of zombie firms, each with the view ofmaximizing our sample, but our regression estimates are insensitive to the choice of measure. In
17See Gal (2013) and Andrews et al. (2016) for more details.
ECB Working Paper Series No 2240 / February 2019 17

each case, we only consider firms aged ten years or more, as start-ups are in general not expectedto be profitable. First, we define as zombies - following Adalet McGowan et al. (2018) - firmsthat register an interest coverage ratio (the ratio of profit to interest payments) below 1 for threeyears in a row. This measure intends to capture firms that are not profitable enough to cover debtpayments – and thus on the margin of exit in a competitive market. We presume that these firmsare potentially benefiting from creditor forbearance.
One drawback of the interest coverage (IC) measure is that it requires data on interest payments,which are often sparsely reported in the countries for which we can successfully match firms tobanks. As a complementary measure, we thus follow Storz et al. (2017) and classify the firm as azombie if it has: i) low debt service capacity for three years in a row; and ii) either negative returnon assets or negative investment for three years in a row.18 Again, the logic is that firms that havechronically low debt service capacity and have negative returns on assets or negative investmentare likely to be on the brink of exit unless their creditors allow them to remain operational. Thismeasure, which we call NRI, is highly correlated with the IC measure (correlation around 0.7) andallows for a larger sample of firms from all countries, plus the addition of Denmark and Estonia(where interest rate data are scarcely reported). Accordingly, we adopt this NRI definition whenour dependent variable is a binary indicator of zombie firm status in order to maximize samplecoverage, but are careful to show that our results are also robust to using the IC measure. Insections 5.3 and 5.4, however, where we focus on the zombie capital share and country coveragein more restricted, we employ the IC measure in order to ensure consistency and comparabilitywith Adalet McGowan et al. (2018), whose baseline model we adopt.
Bank Health Since the aim is to link bank health as a whole to zombie firms and capital real-location, and not to characterize the relevant drivers of a bank balance sheet in detail, we relyon a holistic measure of bank health. Accordingly, we construct a bank health index by PrincipalComponents Analysis of the following seven measures: capital (TCE), NPLs, return on averageassets (ROAA), Retail Funding, Z-Score, Net Income, and Net Interest Income. Retail Fundingis given by the ratio of retail deposits and total assets and is intended to measure the extent towhich the bank relies on sticky retail deposits, as opposed to more volatile wholesale funding(such as money market funds, whose dry-up was a key driver of bank stress in the euro crisis).The Z-Score is given by the sum of ROAA and TCE, divided by the standard deviation of ROAA,and captures the riskiness of bank assets. 19 Ideally, we would also want to include sovereign
18Here, we set the limit for low debt service capacity as a ratio of EBIT to financial debt (sum of loans and long-term debt) lower than 20%.
19Principal Components Analysis has become fairly standard in economics, for applications where the precisenature and number of the relevant variables are unknown and the precise magnitude of each component variable
ECB Working Paper Series No 2240 / February 2019 18

bond holding, as sovereign exposure has been shown to be particularly important during theEuropean crisis. Adding sovereign bond holdings to our indicator reduces the size of our sampleby over 30% and provides almost no new information, as the correlation of the indicators withand without sovereign bond holdings is over 99%. We confirm in the empirical part that ourresults are unchanged by using the broader indicator and maintain the indicator based on theseven measures (without sovereign bond holdings) throughout our analysis.
Figures 3 and 4 show the evolution of the average value of the bank health indicator for the wholesample and for each country in our sample separately. Overall the indicator for each countryaligns well with the evolution of the crisis. The earlier parts of the crisis saw sharp declines inthe health of Baltic banks followed by a relatively swift recovery, whereas the hit came later forGreece (the sharpest as expected), as well as Portugal, Spain, and Slovenia. Austria, Denmark,France, Germany, and the United Kingdom exhibit much smaller declines in bank health, buttypically do not recover to reach pre-crisis levels of health (partly due to low profitability).
Before proceeding, it is important to note that the ex-ante relationship between bank balancesheet variables and bank health, and by extension lending, is unclear.20 All things equal, a higherlevel of regulatory capital is considered a sign of a healthy balance sheet, but it could also bethe result of low risk-taking, and little lending activity. At the same time, banks possessing highquality, high return assets, which generate a steady flow of income with limited risk, may affordto have relatively lower levels of capital adequacy. As such, capital may be a misleading metricof bank health. Risk-weighted (or regulatory) capital could be a potentially better measure butdata availability issues force us to use Tangible Common Equity (TCE) as our measure of bankcapital, which is typically the most stringent of all regulatory definitions and is not adjusted forrisk.21 The same concerns hold for alternative indicators of bank health, over and above capital, asthey are likely to measure different vulnerabilities. For instance, a high return on average assets(ROAA) and Net Interest Income indicate that a bank can withstand shocks by drawing downcash buffers, while a low level of maturity mismatch implies that a bank may be less vulnerableto funding shock. Finally, we cannot observe exactly what determines bank health from theperspective of internal bank management.22
not important (see Bernanke et al. 2005). Storz et al. (2017) take a similar approach.20Strictly speaking, bank balance sheets refer to asset, liabilities, and equity capital. Here, we use the term to refer
also to variables typically belonging to the bank’s profit and loss (P&L) statement, such as net income or return onassets.
21TCE is the owner equity after removing preferred stock, goodwill, and intangible assets (the latter two generallyrefer to difficult to value and highly illiquid assets, such as trademarks). As such, it is typically thought of as theloss-absorbing capacity of the owners of the bank.
22The health of the bank as judged by its internal risk management framework will determine whether the man-agers deem the bank to be sound, and hence influence the forbearance strategy.
ECB Working Paper Series No 2240 / February 2019 19

Access to finance for healthy firms To measure healthy firms’ access to finance, we use a re-stricted microdata version of the Survey on the Access to Finance for Enterprises (SAFE), designedand run by the ECB to provide insight into the firms’ perception of credit availability. The rele-vant question the survey asks firms is whether, compared to the previous six months, it is moredifficult to obtain different types of bank credit; we focus on loans or credit lines. In each wave,we rescale the response variable as follows: -1 indicates that access to bank loan availability hasworsened over the last six months; 0 indicates no change; and 1 indicates an improvement. Wecumulate the access to bank credit variable across time for the duration of the presence of thefirm in the sample, to implicitly create an index of credit availability across time. For instance, ifaccess improves for both semesters of 2012 and 2013, then the value for 2013 will be 4.23
We also use a composite financing gap indicator (see Ferrando et al. 2013) to take into accountcredit demand (and not just supply), which makes use of the self-reported change in financingneeds for the firm (increased, decreased, or unchanged). The (rescaled) composite indicator takesa value of -1 for increased needs and deteriorating availability, -0.5 for either increased needsor deteriorating availability (but not both), and so forth. Again, responses are cumulated acrosstime.24
Insolvency Framework To test the effect of the insolvency framework on the relationship be-tween bank health and zombie firms, we make use of a novel set of indicators developed by theOECD (see Adalet McGowan & Andrews 2018). The set covers 13 different distinct features of theinsolvency framework which – based on international best practice and existing research – maycarry adverse consequences for productivity growth by delaying the initiation of and increasingthe length of insolvency proceedings. We focus our attention on three composite indices – theaggregate index (insol13 – an unweighted average of the 13 components) plus two sub-indices:barriers to corporate restructuring and the lack of preventative and streamlining measures.
According to these metrics, cross-country differences in the design of insolvency regimes aresignificant. For example, the United Kingdom’s low value on the aggregate composite indicatorsin Figure 5 reflects the fact that the personal costs associated with entrepreneurial failure andbarriers to restructuring are low, while there is also a number of provisions to aid prevention andstreamlining. In Estonia, however, the reverse is true and our working hypothesis is that this is
23When we cumulate the semester-level data, we truncate the value to ±3, as less than 1% of observations areoutside this set. Results are very similar if instead we use the semester-level variables.
24In detail for the other values: 0 for unchanged situation (increased need and improved availability, decreasedneed and deteriorated availability, or both unchanged); 0.5 for one-sided decreasing financing gap (decreased needsor improved availability, but not both); and 1 for two-sided decrease in financing gap (decreased needs and improvedavailability).
ECB Working Paper Series No 2240 / February 2019 20

likely to result in an insolvency regime which delays the timely restructuring of weak firms andthus slow down the reallocation of scarce resources to their most productive use.25
5 Results
5.1 Are zombie firms connected to weak banks?
Figure 6 presents graphical evidence of the relationship between bank health and zombie firms.In each graph, we show the share of firms at the country-industry-year level associated witheach bank that are defined as zombies (y variable), plotted against the two-year lags of the bankhealth composite index and its seven constituent components (x variable). The red line is a linearregression fit of y on x, purged of country-industry-year fixed effects to control for cyclical shocksat the country-industry level. For ease of observation, we split the sample of the x variable into50 bins of equal size, and each point in the scatter plot gives the sample mean of y for each bin(after controlling for country-industry-year fixed effects). A strong negative relationship emergesbetween bank health and the zombie firm share, which we interpret as evidence that zombie firmsare more likely to be connected to weak banks.
Table II shows the results from our baseline model for zombies and banks (equation 1). Panel Ashows the results from regressions with country-industry and year fixed effects, which removetime-invariant country-industry effects, and also time-varying global shocks. The model in col-umn 1 includes only bank capital and NPLs, to focus on the asset side. Both are highly significantand have the expected signs. Columns 2 and 3 progressively include more balance sheet vari-ables, to account for the role of income, asset riskiness, and the risk coming from the liability sidein the form of maturity mismatch. While the coefficients always have the expected signs, they arenot always significant, illustrating the multicollinearity problem mentioned previously. As such,column 4 shows results from a model containing only the composite index, which is an increas-ing function of bank health. The estimated coefficient is negative, as expected, and statisticallysignificant at the 1% level.
Panel B shows results from the more restrictive model that contains country-industry-year fixedeffects, so variation comes from differences across firms operating in the same country-industry-
25As discussed in Adalet McGowan & Andrews (2018), an inability of creditors to initiate restructuring, a lackof priority given to new financing over unsecured creditors and an indefinite stay on assets translate into signifi-cant barriers to corporate restructuring in Estonia. Similarly, a lack of early warning mechanisms, pre-insolvencyregimes and special insolvency procedures for Small and Medium-Sized Enterprises (SMEs) imply that preventionand streamlining is weak in Estonia.
ECB Working Paper Series No 2240 / February 2019 21

year cell. Results are similar for most variables. Although coefficients are for the most partsmaller in absolute value, as we now control for a substantially larger part of the variation, theirsigns remain unchanged.26 Crucially, the composite index of bank health remains highly signif-icant. The last column of Table II shows results from using a bank health indicator which alsoincludes sovereign bond holdings. The estimates are virtually indistinguishable, at the cost of abig reduction in our sample; as such we will rely on the main indicator throughout the paper.
Table III explores the relationship further. Column 1 shows the full results of the baseline regres-sion, with the previously omitted firm-level controls shown for exposition purposes. 27 In turn,columns 2-4 demonstrate that the relationship between zombie status and bank health is virtuallyunchanged before and after the crisis. This indicates that the forbearance incentives of banks arenot simply a cyclical phenomenon. Of course, the aggregate size of the zombie population andthe incentives of banks to forbear are cyclical, but the marginal incentive does not seem to vary.
We can gauge the economic magnitude of the effect by comparing the banks at high and lowlevels of health. With the NRI definition (Table III, column 1) of zombies, healthy banks (definedas those one standard deviation above the bank health variable mean) have a 1 percentage pointlower probability of being associated with zombies compared to weak banks (defined as thoseone standard deviation below the bank health variable mean). At a mean zombie rate of 13%in the sample, this translates to roughly 8% difference in zombie incidence between healthy andweak banks relative to the mean. The magnitude of the effect is slightly larger using the ICdefinition (Table IV, column 4), where the difference in probability is 1.2 percentage points, whichgiven a mean zombie rate of 9.4%, implies a difference of 13% in zombie incidence betweenhealthy and weak banks. It should be noted that this is most likely a conservative estimate, as itremoves country-industry-year fixed effects. If, for instance, we include country-sector and yearfixed effects (i.e. column 4 of Table II, Panel A), then healthy banks are 2.5 percentage points lesslikely to be associated with zombies with the NRI definition and 1.8 percentage points with theIC definition, a difference in relative incidence of around 19% in both cases.
Table IV explores the robustness of our baseline estimates. Columns 1-3 show that the relation-ship between zombie firms and bank health is evident in manufacturing, services, and construc-tion. Column 4 shows that the coefficient of bank health is still negative and highly significant,when we apply the interest coverage definition of a zombie firm, instead of NRI (Section 4). Col-
26The coefficients on NPLs are now much smaller in magnitude and insignificant, and the opposite holds for netinterest income.
27Older firms are more likely to be zombies while firms with high (lagged) productivity are less likely to bezombies. Micro firms (less than ten employees) appear to be the most likely to be zombies, as expected, as firms thatdo not grow are expected to be more problematic.
ECB Working Paper Series No 2240 / February 2019 22

umn 5 then shows that the results are robust to excluding firms with less than 20 employees,which tend to be under-represented in ORBIS (see Gal 2013, Kalemli-Ozcan et al. 2018).
The final columns of Table IV provide further evidence that our estimated relationship betweenzombie firms and weak banks is not simply a product of reverse causality, whereby troubled firmswould adversely affect the balance sheets of their banks. While we partly mitigate these concernsabove by entering bank health with a two-year lag, controlling for cyclical shocks and runningseparate pre and post-crisis regressions, an alternate approach is to directly remove potentialsources of such reverse causality. Accordingly, Column 6 shows that the estimated relationshipis robust to excluding larger firms (i.e. firms with 50 or more employees). This is significant sincebank balance sheets are likely to be more sensitive to large firms in distress than smaller firms.
Removing large firms, however, may not adequately address endogeneity concerns if a givenbank has high indirect exposure, via its connections with a cluster of small firms which togetheraccount for a significant share of sectoral activity. Accordingly, column 7 shows that the resultsare robust to removing firm-year observations for cases with high (above median) bank exposureto specific sectors, defined as the sum of tangible fixed assets of all the firms in a country-sector-year cell with which a bank is linked, as a fraction of bank assets. This is important in the face ofa new literature on the role of collateral in amplifying sectoral shocks, either through collateralfiresales (real estate or equipment) or through agglomeration effects (Benmelech & Bergman 2011,Benmelech et al. 2014), and particularly housing in the case of small firms (Banerjee & Blicke2016). Jaskowski (2015) makes the theoretical argument that zombie lending may in fact, be arational strategy on the part of banks, who engage in zombie lending as a way of preventinga string of bankruptcies and forced fire sales. With our approach, we can thus control for aspecific form of this externality (operating specifically through sectoral effects), and we confirmthe robustness of our results.
Finally, if a bank was particularly exposed to a sector badly hit by the crisis, then it is possible thatthe country-industry-year fixed effect will not fully remove any correlation between bank healthand the error term, thus inducing reverse causality. As a robustness check, we also run an IVregression for both the NRI and IC definitions (see the final two columns of Table IV), using thepre-crisis lag of bank health as an instrument. Specifically, we instrument for the second lag ofbank health using its fifth lag (and so the seventh lag of bank health). As we also control for banksize, we have to instrument for it as well (also using its fifth lag), since bank size is correlatedwith health, and so failing to instrument for it would violate the exclusion restriction.28 The IVcoefficient is actually more negative than OLS, suggesting that, if anything, the OLS estimate may
28See Acemoglu & Angrist (2000) for a similar argument.
ECB Working Paper Series No 2240 / February 2019 23

be biased downwards.
5.2 Insolvency Frameworks
Table V shows the estimates of equation (2), where we use insolvency regime indicators for twoseparate years: 2016 (Panel A) and 2010 (Panel B). As predicted, the BankHealth× INSOL inter-action is positive and highly significant (column 1 of Panel A). Column 2 shows that this resultis mainly driven by the Barriers to Restructuring (BTR) sub-component and this result is robustto an alternative definition of zombie firms based on the interest coverage ratio. This suggeststhat in countries with high barriers to restructuring weak firms, improvements in bank health areless likely to translate into fewer zombie firms. This is a central result of the paper: policy initia-tives to improve bank health following a financial crisis are more likely to be associated with adecline in zombie congestion in countries where insolvency regimes do not unduly inhibit corpo-rate restructuring since such regimes increase the economic incentives for banks to recognize theloans to zombie firms as non-performing and commence restructuring or foreclosure proceed-ings. Thus, there are important complementarities between policy initiatives to improve bankhealth and insolvency reform.
Column 3 shows that the interaction term is not statistically significant for the indicator relatingto prevention and streamlining (LPS), which broadly refer to mechanisms that allow firms undertemporary distress to avoid entering into insolvency. This should not be surprising: zombiefirm problems mostly manifest themselves during slow recoveries after deep recessions broughtabout by financial crises when temporary distress is not expected to be of first-order importance.Finally, column 4 repeats the exercise with barriers to restructuring, except now augmenting themodel to include two additional interaction terms with GDP growth (lagged by two years, as withall other controls). The concern is that, although we include country-sector-year fixed effects, ourmodel could be capturing (accidental) correlation between the insolvency framework and thesize of the downturn.29 The main result is robust to this test. In Panel B, we repeat the sameexercise for 2010 values of the insolvency framework. The results for barriers to restructuringremain highly statistically significant, although the coefficients for the aggregate measures nowbecome statistically insignificant (though they do maintain the correct sign).30 We repeat the
29If, for instance, Denmark, which was one of the countries least affected by the crisis, had an insolvency frame-work that entailed low barriers to restructuring, it is possible that the effect we capture is purely driven by suchnoise.
30It is unclear why this is the case, but regardless, our focus and intuitive framework relates to barriers to re-structuring mostly, and less so to other features of the framework. The changes in the sample occur because of dataavailability issues for Denmark. In the 2016 wave, there are no data for insol13, and for the 2010 wave we only have
ECB Working Paper Series No 2240 / February 2019 24

exercise using the IC definition of status, instead of the baseline NRI definition, and the results,shown in Table VI, are very similar. 31
One way to illustrate the importance of the insolvency regime is to estimate how much morepotent the role of a healthy bank would be if the regime were at the level of best practices. Infigure 9, we plot, for each country in our sample, how the percentage point difference between thezombie-reducing effect of a healthy bank (one standard deviation above the mean) versus a weakbank (one standard deviation below the mean) varies according to the design of the insolvencyregime, as measured by the barriers to restructuring indicator (BTR) in 2010. The results in PanelA pertain to the baseline NRI definition of zombie firms which allows us to include Denmarkin the exercise, while Panel B shows the corresponding exercise based on the interest coveragedefinition of zombie firms. As the framework performance is measured in terms of distance frombest practice, the blue bars can be interpreted as ”room for improvement” in terms of reducingzombie prevalence through reforming BTR. By definition, the best performer in the sample, theUnited Kingdom, has no room for improvement. For example, Panel B shows that if Estonia –where barriers to corporate restructuring are high – reformed its insolvency regime to the sampleminimum (i.e. the United Kingdom), then the reduction in the zombie firm share associated witha two standard deviation improvement in bank health could be around 2.6 percentage pointshigher than otherwise.
We also show, with red diamonds, the position of the country using the value of BTR in 2016,to capture the effect of reforms. Several countries, particularly in the euro periphery, have im-plemented important reforms, and have gone some way into reducing the incentives of banks toallow zombies to operate. Reforms to insolvency regimes since 2010 in Greece, Slovenia, and Por-tugal have managed to exploit roughly half of the possibilities offered by improving their BTR,with smaller improvements in Spain and Latvia. Germany has been the most successful in thatregard, fully capturing reform opportunities.
data for LPS.31We check the robustness of the estimates by repeating the analysis for the IC zombie definition (table VI). More-
over, table VII shows results from estimating the zombie and insolvency regressions for both the IC and NRI indica-tors with the triple fixed effects specification now at the 3-digit NACE sector. This further enhances the robustnessof our estimates by controlling for time-varying shocks at a more granular level.
ECB Working Paper Series No 2240 / February 2019 25

5.3 Weak banks and capital misallocation
Table VIII shows results from the baseline reallocation regression.32 Row 1 shows that moreproductive firms grow at a statistically significantly higher pace, suggesting that the process ofcapital reallocation enhances aggregate productivity. Moreover, row 2 shows that bank healthacts as an amplifier to the reallocation process: that is, productive firms in industries exposed tohealthy banks grow faster than those in industries exposed to weak banks. The other columns ofPanel A show that the relationship between bank health and capital reallocation is robust acrosssectors, and was not materially affected by the crisis (Panel C).33 The economic magnitude ofthis effect is significant: an increase in bank health by one standard deviation above its meanwould raise the difference in the capital growth between high and low productivity firms (i.e.those one standard deviation above and below the sectoral mean) by 23%. As such, the healthof the banking system is important in channeling scarce capital to productive firms and thusunderpinning their growth.
Next, we jointly examine bank health and zombie congestion (table IX). We do this in steps. First,we estimate a capital reallocation model that separately includes a zombie capital×MFP inter-action (which is expected to have a negative coefficient; see Adalet McGowan et al. 2018); thenwe include also a bank health×MFP interaction (which is expected to have a positive coefficient).Column 3 reports the estimates of the model that includes both interaction terms. Regardingthe latter, our expectation is that the inclusion of the bank health×MFP interaction will reducethe estimated absolute magnitude of the coefficient on the zombie capital×MFP interaction, asbank health is relevant to both zombie congestion and capital reallocation. Finally, Column 4 re-peats the baseline exercise with the MFP×Bank Health interaction, but we now add a firm fixedeffect, and qualitatively the results are very similar. Removing time-invariant firm-level hetero-geneity helps to shore-up the robustness of our estimates, ensuring that they are not driven byunobserved firm characteristics.
As expected from the results of Adalet McGowan et al. (2018), a higher zombie capital sharedampens the efficiency of capital reallocation, by moderating the responsiveness of firm capitalgrowth to (lagged) MFP; moreover, when both interactions are included, they remain highly sig-nificant but their absolute magnitude falls, indicating that they are correlated. The coefficient on
32The regressions in this section use a definition of capital using only tangible fixed assets, but if we use total fixedassets instead (including intangibles), the results are broadly similar.
33There is evidence that reallocation intensity fell during the crisis – which is consistent with the findings of Fosteret al. (2016) for the United States - although this result is driven by the construction sector (Table VIII, Panel B). Ifwe broaden the definition of capital to include intangible assets, however, the estimated effects are larger, and theMFP×Crisis interaction becomes significant for services as well.
ECB Working Paper Series No 2240 / February 2019 26

the zombie capital×MFP interaction changes from -0.1340 to -0.0894, a fall in absolute magnitudeof around 33%. To the extent that causation runs from bank health to zombie firms, this suggeststhat around one-third of the distortionary effects of zombie congestion on capital reallocation canbe directly attributed to weak banks which allow zombie firms to fester.
The estimated coefficients in column 2 (Table IX) imply that if Spain were able to reduce its zom-bie capital share to the sample minimum (Slovenia), then the difference in the capital growthbetween high and low productivity firms (those one standard deviation above and one stan-dard deviation below sectoral mean) would be 2.2 percentage points higher. Similarly, if bankhealth in Spain were at the level of France in 2012, the gap in capital growth between high andlow productivity firms in 2013 would have been roughly 1.2 percentage points higher (based onthe estimated coefficient in column 1, Table VIII). These estimated effects are economically sig-nificant, since the difference in capital growth between high and low productivity firms fell by2.4 percentage points in Spain from 2004 to 2013 (Adalet McGowan et al. 2018), consistent withthe idea that rising capital misallocation is a key driver of the productivity slowdown in Spain(Gopinath et al. 2017), and more generally (see Section 2).
5.4 Zombie firms and Credit Crowd-Out
Figure 8 shows the binned scatter plot of the sectoral average of the cumulated credit availabilityvariable for healthy firms against the (lagged) share of zombie capital in the same sector, control-ling for country-year fixed effects. The left panel shows the plot for bank loans and the right panelfor bank credit lines. We see a clear negative effect of zombie capital on bank credit availabilityfor healthy firms: sectors with a high share of capital tied to zombie firms, within country-yearclusters, are associated with more restricted access to bank loans.
Regression results in Table X confirm the graphical evidence, for both the simple and the com-posite indicator (which accounts for credit demand).34 Columns 1-2 give the results of runningdifferent versions of (4). Looking at Panel A, which shows results for loan availability for all firms,we see that controlling for lagged firm productivity, lagged firm net worth (given as sharehold-ers’ funds as a fraction of total assets, as in Gopinath et al. (2017)) and country-year fixed effects,the coefficient for lagged zombie capital share is negative and significant for either the simpleor the composite indicator. This confirms the hypothesis that in sectors with a higher share of
34An alternative way is to directly control for credit demand, using the self-reported indicator of changing creditneeds. Doing so is similar in spirit to the Khwaja & Mian (2008) approach of using firm fixed-effects in lendingregressions. Running the basic model with the credit availability indicator with dummies for financing needs givesvery similar results.
ECB Working Paper Series No 2240 / February 2019 27

zombie capital, healthy firms have a harder time obtaining credit. The coefficient on net worth ispositive and highly significant, indicating that firms with high net worth (an indicator of creditconstraints) have easier access to credit, even controlling for productivity. Panel B then restrictsthe analysis to small firms only (those with less than 50 employees), and the zombie capital coeffi-cient is more negative, implying that smaller firms are disproportionately affected by crowd-out.Both of these confirm the results of Gopinath et al. (2017). Finally, Columns 5-6 present results ofmodel (4) for an ordered logit model. Results are very similar but less significant for credit lines.
Columns 3-4 present results from regressions of model (5). Recall that, in this case, we directlytest for misallocation, namely whether more productive firms suffered more from crowd-out insectors with high levels of capital tied to zombie firms, controlling for net worth. As variationhere comes from differences in productivity within-sector, we employ country-sector-year fixedeffects. The hypothesis is not borne for the sample including all firms (Panel A), but it is con-firmed for the small firm subsample in Panel B. The coefficient of the zombie share - productivityinteraction is negative and significant for the simple indicator. It also has the correct sign forthe composite indicator, but the errors are higher in this case, giving a p-value of 22%. Again,these results confirm those of Gopinath et al. (2017), who posit the existence of a size-contingentborrowing constraint to rationalize misallocation.
Panels C and D repeat the analysis for availability of credit lines. Results are by and large similar,albeit at lower significance levels. We confirm the existence of a crowd-out for both the simpleand the composite indicator, and, for the simple indicator, we obtain a statistically significantestimate of misallocation.
It should be noted that, given that our sample size is relatively small (up to 7,613 observationsfor loans, 6,944 for credit lines) and the panel short, the results in this section should be viewedas indicative.
To gauge the magnitude of the effect, it is useful to restrict attention to values at 0 or 1 of thecredit availability indicators, since the sample period is one of gradually improving financingconditions.35 A logistic regression of this transformed variable on the zombie capital share andvarious control variables indicates that a one standard deviation increase in the zombie capitalshare is associated with a reduction in the probability of improved loan availability by 1.9 per-centage points (with a similar magnitude for credit lines). Compared to an average probabilityof improvement in loan availability of 25% at the mean of the distribution, the overall effect ismodest, but not trivial.
35Over the sample period (i.e. 2009 to 2013), we observe a general improvement in lending conditions – save for2011H2-2012H1 – which are likely tied to the cycle and accommodative monetary policy.
ECB Working Paper Series No 2240 / February 2019 28

The negative relationship between credit availability to healthy firms and zombie capital in asector could either be the result of lower profitability of potential investments due to zombiecongestion, or limited lending capacity of banks exposed to this particular sector due to zombieforbearance. However, our sense is that it is more likely to reflect the former. Banks are unlikely,on average, to be overly exposed to a specific sector so much so that exposure to zombie firms inthat sector substantially hurts their balance sheet. For instance, the median bank exposure to aspecific country-sector-year cell, given by the total tangible capital of the firms in that particularsector associated with any given bank, is approximately 0.12% of total bank assets. This makesit unlikely that losses from loans to zombies in a given sector would affect lending capacity toa healthy firm in the same sector. Of course, this is not to imply that crowd-out cannot occurthrough the bank balance sheet. In fact, contrary to the zombie congestion case, credit crowd-outmay spillover to other sectors, but this hypothesis is difficult to address with the data at hand.
Finally, it is useful to discuss how our results relate to those of Schivardi et al. (2018). Althoughthey do not find evidence of crowd-out, we believe that their research strategy examines differ-ent dimensions to ours, and so our papers are rather complementary in that regard. First, weshow that in sectors with a high zombie share, healthy firms find it more difficult to borrow. Bycontrast, Schivardi et al. consider the bank-firm relationship only, and do not study the mar-gin where lending is restricted because healthy firms lack the profitability required to get goodcredit, due to zombie congestion. Second, Schivardi et al. focus on new credit, and do not con-sider restructuring/forbearance. As already argued, while new lending to zombie was clearly aconcern in Japan, in the European supervisory context such behavior would be rare, and indirectforbearance methods more likely. While they do examine the classification of NPLs, they do notcheck to see whether weak banks have different strategies in how they treat problematic loans,which would be indicative evidence of forbearance. We have a catchall approach so we considerall types of zombie-friendly behavior.
In addition, crowd-out occurs when lending to the zombie reduces credit to the healthy firm.Schivardi et al. show that the likelihood of lending to healthy firms during the crisis for weakbanks is not lower than for zombies. However, the crucial question is whether they would havereceived more credit had it not been for zombie lending or forbearance, a counterfactual thatthese authors cannot capture with their setup. Our approach cannot capture it either, but we canmore concretely capture a different dimension: namely, that healthy firms in industries with alarge number of zombies are disadvantaged.
ECB Working Paper Series No 2240 / February 2019 29

6 Conclusion
This paper presents robust evidence that zombie firms are more likely to be connected to weakbanks. We then show that the effect of bank health on zombie status is amplified under insolvencyregimes that do not unduly inhibit corporate restructuring. Thus efficient insolvency policies,together with healthier banks, would appear to be important in resolving the zombie problem,thereby raising aggregate productivity growth.
Next, we show that healthy banks foster productivity-enhancing capital reallocation, the processby which productive firms grow relatively more. We also show that about one-third of the nega-tive effects of zombie congestion on the efficiency of reallocation, identified in earlier work, couldbe attributed to weak banks.
Furthermore, we offer some evidence on the mechanism behind zombie congestion. The neg-ative zombie effects on reallocation and productivity have been attributed to congestion effects(competition) or the credit crowd-out. However, little is known about the crowd-out channel. Weprovide some evidence of the existence of credit crowd-out, using SAFE. Results are indicativedue to the small sample, but we document a modest but statistically significant effect: healthyfirms report smaller improvements in access to finance in sectors with a high share of capitaltied to zombie firms. This would suggest that zombie congestion works mostly through reducedprofits for healthy firms, which reduce expected return on projects, and as a result lead to worseborrowing opportunities.
Set in the broader context of the productivity slowdown and the aftermath of the global financialcrisis, which has hurt bank and firm balance sheets, our results can carry important implications.As rising capital misallocation has been shown to be a key driver of the aggregate productivityslowdown (Gopinath et al. 2017), while zombie congestion is intimately linked to the other keymicro dimensions to the slowdown, such as rising productivity dispersion (Andrews et al. 2016)and declining business dynamism (Decker et al. 2016), identifying and correcting the distortionswhich disrupt the natural market selection mechanism is vital to reviving productivity growth.
Future research could look to dig deeper into the recent debate about the link between zombiecongestion and monetary policy. It has been argued that accommodative policy increases theincentives of banks to bet on the resurrection of zombie firms (White 2012) and that ”too lowfor too long” policies make funding cheap and fuel the survival of weak firms, increasing mis-allocation and harming productivity growth (Borio 2018). Conversely, others have argued thatmisallocation did not increase during the crisis and is a country-specific than a global problem.At the same time, monetary accommodation facilitated access to credit for viable but vulnerable
ECB Working Paper Series No 2240 / February 2019 30

firms and allowed them to finance working capital/invest, hence alleviating an even larger dropin aggregate demand, investment, and productivity (Obstfeld & Duval 2018).
While this question remains unresolved, it is important that future research takes into accounttwo ideas. First, it is necessary to distinguish between stocks and flows of credit to zombie firmsand the impact of monetary policy on these two margins. Unlike in earlier zombie episodes, it isimprobable that weak and indebted firms receive new lending to roll over existing debt, as mod-ern supervisory practices would capture and prohibit it. Instead, banks could allow forbearanceon the stock of existing debt, and help firms to alleviate payment problems. However, monetarypolicy intends to influence the flow of credit and is hence unlikely to be a direct factor in thedecision to forbear.
One implication that future research should reflect on is how monetary policy affects the oppor-tunity cost of holding bad loans on bank balance sheets. In principle, banks will recognize badloans if the net return to recognition (profits from outside projects net of the cost of provisions) ishigher than the return to forbearance (assumed zero). If this net return is an increasing functionof interest rates, then low rates may imply a negative net return to recognition, and hence aninaction region where the return to forbearance dominates. If the low policy rate is a responseto a lack of profitable investment opportunities, then a substantial interest rate increase may beneeded to materially alter the incentives of banks. This fundamental trade-off is at the heart ofthis debate. At the same time, this discussion highlights the key role of an efficient insolvencyframework, which would reduce the cost of recognition and hence narrow the inaction region, atany policy rate.
Second, our research suggests that it is important to take into account the behavior of banks,which have an incentive to forbear when their balance sheets are weak and their profitability islow. Accordingly, monetary policy may affect forbearance decisions through its balance sheeteffects. To the extent that expansionary policies also have positive effects on bank balance sheets,indirect effects may work in the same direction. At the same time, forbearing on a bad loanimplies an increase in the expected riskiness of the bank’s balance sheet; Dell’Ariccia et al. (2017)show that, in line with theoretical predictions by Dell’Ariccia et al. (2014), while indeed risk-taking in new loans is higher when real policy interest rates are low, this effect is lower for weaklycapitalized banks.
Nevertheless, the connection between monetary policy and zombies should not distract from thecontribution of bank recapitalization and insolvency regimes. The results of this paper implythat in order to facilitate the unwinding of the zombie problem it is essential that bank balancesheets are strong, underlining the need for fast recapitalizations after crises and measures to re-
ECB Working Paper Series No 2240 / February 2019 31
duce NPLs. But strengthening banks is an insufficient policy response while insolvency regimesremain hostile to the orderly restructuring and resolution of weak firms. Thus, in countries withweak banks and weak insolvency regimes, efforts to improve banks’ health should be accompa-nied by appropriate insolvency reforms to reduce impediments to corporate restructuring. At thesame time, countries with strong firms and banks should view the establishment of an efficientinsolvency framework as equivalent to a financial stability-enhancing measure.
References
Acemoglu, D., Akcigit, U., Bloom, N. & Kerr, W. R. (2013), ‘Innovation, Reallocation and Growth’,NBER Working Paper.
Acemoglu, D. & Angrist, J. (2000), ‘How Large Are Human-Capital Externalities? Evidence fromCompulsory Schooling Lawsy’, NBER Macroeconomics Annua 15), 9–59.
Acharya, V., Eisert, T., Eufinger, C. & Hirsch, C. (2017), ‘Whatever it takes: The Real Effects ofUnconventional Monetary Policy’, NBER Working Paper.
Adalet McGowan, M. & Andrews, D. (2018), ‘Design of Insolvency Regimes across Countries’,OECD Economics Department Working Paper.
Adalet McGowan, M., Andrews, D. & Millot, V. (2017), ‘Insolvency Regimes, Technology Diffu-sion and Productivity Growth: Evidence from Firms in OECD Countries’, OECD EconomicsDepartment Working Paper.
Adalet McGowan, M., Andrews, D. & Millot, V. (2018), ‘The Walking Dead? Zombie Firms andProductivity Performance in OECD Countries’, Economic Policy .
Akiyoshi, F. & Kobayashi, K. (2010), ‘Banking Crisis and Productivity of Borrowing Firms: Evi-dence from Japan’, Japan and the World Economy 22(3), 141–150.
Andrews, D., Criscuolo, C. & Gal, P. (2016), ‘The Best versus the Rest: The Global ProductivitySlowdown, Divergence across Firms and the Role of Public Policy’, OECD Working Paper.
Australian Productivity Commission (2015), ‘Business Set-up, Transfer and Closure’, Draft Re-port, Canberra.
Baily, M. N., Hulten, C. & Campbell, D. (1992), ‘Productivity dynamics in manufacturing plants’,Brookings Papers on Economic Activity: Microeconomics , 187–249.
ECB Working Paper Series No 2240 / February 2019 32

Baldwin, J. & Gu, W. (2006), ‘Competition, firm turnover and productivity growth’, ResearchPaper Series, Statistics Canada.
Banerjee, R. & Blicke, K. (2016), ‘Housing Collateral and Small Firm Activity in Europe’, BISWorking Paper No. 575.
Bartelsman, E., Haltiwanger, J. & Scarpetta, S. (2013), ‘Cross-Country Differences in Productivity:The Role of Allocation and Selection’, American Economic Review 103(1), 305–334.
Benmelech, E. & Bergman, N. (2011), ‘Bankruptcy and the Collateral Channel’, The Journal ofFinance 66(2), 337–378.
Benmelech, E., Bergman, N., Milanez, A. & Mukharlyamov, V. (2014), ‘The Agglomeration ofBankruptcy’, Working Paper.
Berlingieri, G., Blanchenay, P. & Criscuolo, C. (2017), ‘The Great Divergence(s)’, OECD Science,Technology and Industry Policy Papers.
Bernanke, B., Boivin, J. & Eliasz, P. (2005), ‘Measuring the Effects of Monetary Policy: AFactor-Augmented Vector Autoregressive (FAVAR) Approach’, Quarterly Journal of Economics120, 387–422.
Borio, C. (2018), ‘A blind spot in today’s macroeconomics?’, Panel remarks in BIS-IMF-OECDJoint Conference on ’Weak productivity: the role of financial factors and policies’.
Caballero, R., Hoshi, T. & Kashyap, A. (2008), ‘Zombie Lending and Depressed Restructuring inJapan’, American Economic Review 98(5), 1943–1977.
Chodorow-Reich, G. (2014), ‘The Employment Effects of Credit Market Disruptions: Firm-LevelEvidence from the 2008-09 Financial Crisis’, Quarterly Journal of Economics 129(1), 1–59.
Consolo, A., Pierluigi, B. & Malfa, F. (forthcoming), ‘The Importance of Insolvency Frameworksfor Deleveraging and NPL Resolution’, ECB Working Paper.
Criscuolo, C., Gal, P. & Menon, C. (2014), ‘The Dynamics of Employment Growth: New Evidencefrom 18 Countries’, OECD Science, Technology and Industry Policy Papers.
Decker, R., Haltiwanger, J., Jarmin, R. S. & Miranda, J. (2016), ‘Changing Business Dynamism andProductivity: Shocks vs. Responsiveness’, Working Paper.
ECB Working Paper Series No 2240 / February 2019 33

Decker, R., Haltiwanger, J., Jarmin, R. S. & Miranda, J. (2017), ‘Declining Dynamism, AllocativeEfficiency, and the Productivity Slowdown’, American Economic Review: Papers and Proceedings107(5), 322–326.
Dell’Ariccia, G., Laeven, L. & Marquez, R. (2014), ‘Monetary Policy, Leverage, and Bank Risk-Taking’, Journal of Economic Theory 149(C), 65–99.
Dell’Ariccia, G., Laeven, L. & Suarez, G. (2017), ‘Bank Leverage and Monetary Policy’s Risk-Taking Channel: Evidence from the United States’, Journal of Finance 72(2), 613–654.
Disney, R., Haskel, J. & Heden, Y. (2003), ‘Restructuring and Productivity Growth in UK Manu-facturing’, Economic Journal 113, 666–694.
Ferrando, A., Griesshaber, N., Kohler-Ulbrich, P., Perez-Duarte, S. & Schmitt, N. (2013), ‘Measur-ing the opinion of firms on the supply and demand of external financing in the euro area’, IFCBulletin, Bank for International Settlements 36, 283–303.
Foster, L., Grim, C. & Haltiwanger, J. (2016), ‘Reallocation in the Great Recession: Cleansing orNot?’, Journal of Labor Economics 34(1), S293–S331.
Foster, L., Haltiwanger, J. & Krizan, C. J. (2006), ‘Market Selection, Reallocation, and Restructur-ing in the U. S Retail Trade Sector in the 1990s’, Review of Economics and Statistics 88(4), 748–758.
Gal, P. (2013), ‘Measuring Productivity at the Firm Level Using ORBIS’, OECD Working Paper.
Gamberoni, E., Giordano, C. & Lopez-Garcia, P. (2016), ‘Capital and Labour (mis)allocation in theEuro Area: Some Stylized Facts and Determinants’, ECB Working Paper.
Gopinath, G., Kalemli-Ozcan, S., Karabarbounis, L. & Villegas-Sanchez, C. (2017), ‘Capital Allo-cation and Productivity in South Europe’, Quarterly Journal of Economics 132(4), 1915–1967.
Hiatt, S., Sine, W. & Tolbert, P. (2009), ‘From Pabst to Pepsi: The Deinstitutionalization of SocialPractices and the Creation of Entrepreneurial Opportunities’, Administrative Science Quarterly54(4), 635–667.
Hoetker, G. & Agarwal, R. (2007), ‘Death Hurts, But It Isn’t Fatal: The Postexit Diffusion ofKnowledge Created by Innovative Companies’, Academy of Management Journal 50(2), 446–467.
Hopenhayn, H. (1992), ‘Entry, Exit, and Firm Dynamics in Long Run Equilibrium’, Econometrica60(5), 1127–1150.
ECB Working Paper Series No 2240 / February 2019 34

Hsieh, C.-T. & Klenow, P. J. (2009), ‘Misallocation and Manufacturing TFP in China and India’,The Quarterly Journal of Economics 124(4), 1403–1448.
Jaskowski, M. (2015), ‘Should zombie lending always be prevented?’, International Review of Eco-nomics & Finance 40C, 191–203.
Kalemli-Ozcan, S., Laeven, L. & Moreno, D. (2018), ‘Debt Overhang, Rollover Risk, and CorporateInvestment: Evidence from the European Crisis’, NBER Working Paper.
Khwaja, A. I. & Mian, A. (2008), ‘Tracing the impact of bank liquidity shocks: Evidence from anemerging market’, American Economic Review 98(4), 1413–42.
Kwon, H., Narita, F. & Narita, M. (2015), ‘Resource reallocation and zombie lending in Japan inthe 1990s’, Review of Economic Dynamics 18, 709–732.
Marinc, M. & Vlahu, R. (2012), The Economics of Bank Bankruptcy Law, Springer-Verlag, BerlinHeidelberg.
Nishimura, K., Nakajima, T. & Kiyota, K. (2005), ‘Does the Natural Selection Mechanism StillWork in Severe Recessions? Examination of the Japanese Economy in the 1990s’, Journal ofEconomic Behavior and Organization 58, 53–78.
Obstfeld, M. & Duval, R. (2018), ‘Tight monetary policy is not the answer to weak productivitygrowth’, VoxEU.
Okada, T. & Horioka, C. (2008), ‘A Comment on Nishimura, Nakajima, and Kiyota’s “Does theNatural Selection Mechanism Still Work in Severe Recessions? Examination of the JapaneseEconomy in the 1990s”’, Journal of Economic Behavior & Organization 67, 517–520.
Ollivaud, P., Guillemette, Y. & Turner, D. (2016), ‘Links between weak investment and the slow-down in productivity and potential output growth across the OECD’, OECD Economics De-partment Working Papers.
Peek, J. & Rosengren, E. (2005), ‘Unnatural Selection: Perverse Incentives and the Misallocationof Credit in Japan’, American Economic Review 95(4), 1144–1166.
Sakai, K., Uesugi, I. & Watanabe, T. (2010), ‘Firm Age and the Evolution of Borrowing Costs:Evidence from Japanese Small Firms’, Journal of Banking & Finance 34(8), 1970–1981.
Schivardi, F., Sette, E. & Tabellini, G. (2018), ‘Credit Misallocation During the European FinancialCrisis’, Working Paper.
ECB Working Paper Series No 2240 / February 2019 35

Smith, D. & Stromberg, P. (2005), Maximizing the Value of Distressed Assets: Bankruptcy Law and theEfficient Reorganization of Firms, Cambridge University Press.
Storz, M., Koetter, M., Setzer, R. & Westphal, A. (2017), ‘Do We Want these two to Tango? OnZombie Firms and Stressed Banks in Europe’, ECB Working Paper.
Syverson, C. (2011), ‘What Determines Productivity?’, Journal of Economic Literature 49(2), 326–365.
White, W. (2012), ‘Ultra-Easy Monetary Policy and the Law of Unintended Consequences’, DallasFed Working Papers.
ECB Working Paper Series No 2240 / February 2019 36

Figure 1: Potential Output Growth in OECD countries
The graph shows the evolution of potential output growth in OECD countries, and the break-down to the contributions. Data for 2016 and 2017 are based on projections. Data come fromthe OECD Economic Outlook Database, and the chart from the OECD June 2016 EconomicOutlook.
ECB Working Paper Series No 2240 / February 2019 37

Figure 2: Insolvency Regimes in OECD countries, 2016
The stacked bars correspond to three subcomponents of the insolvency indicator in 2016. The diamond correspondsto the value of the aggregate insolvency indicator based on these three subcomponents in 2010. Only countries forwhich data are available for the three sub-components in 2016 are included. Source: Adalet McGowan et al. (2017).
ECB Working Paper Series No 2240 / February 2019 38
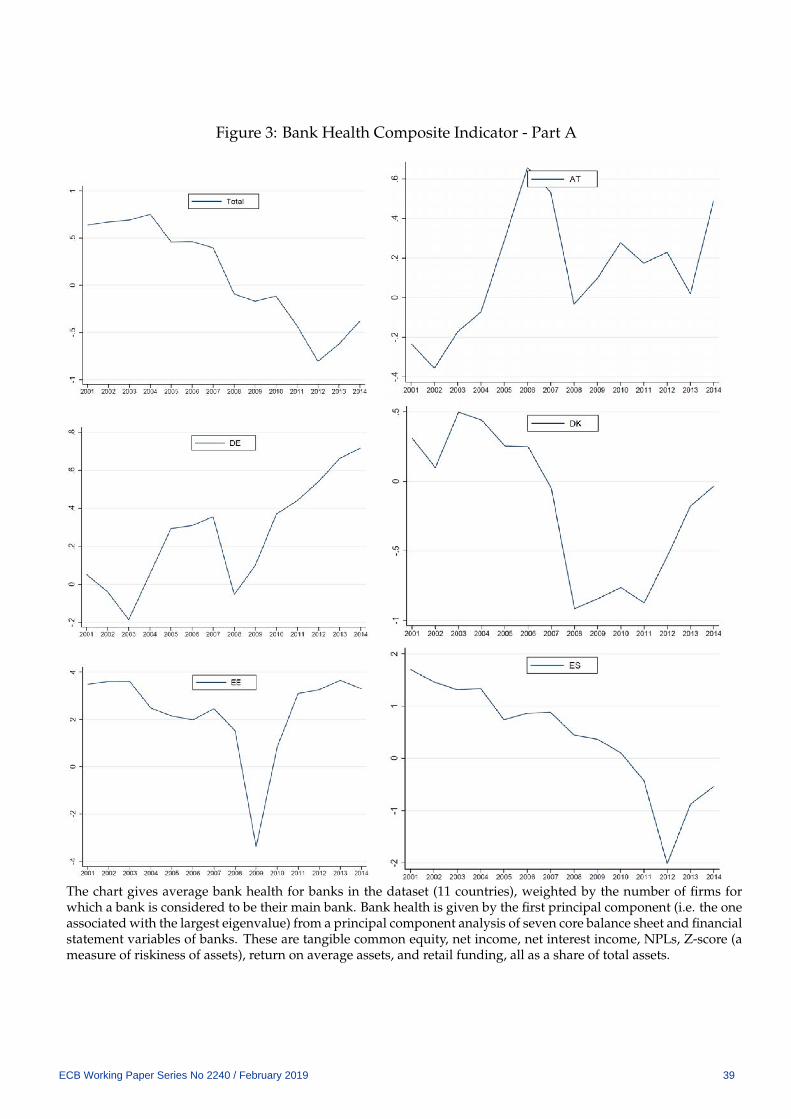
Figure 3: Bank Health Composite Indicator - Part A
The chart gives average bank health for banks in the dataset (11 countries), weighted by the number of firms forwhich a bank is considered to be their main bank. Bank health is given by the first principal component (i.e. the oneassociated with the largest eigenvalue) from a principal component analysis of seven core balance sheet and financialstatement variables of banks. These are tangible common equity, net income, net interest income, NPLs, Z-score (ameasure of riskiness of assets), return on average assets, and retail funding, all as a share of total assets.
ECB Working Paper Series No 2240 / February 2019 39

Figure 4: Bank Health Composite Indicator - Part B
The chart gives average bank health for banks in the dataset (11 countries), weighted by the number of firms forwhich a bank is considered to be their main bank. Bank health is given by the first principal component (i.e. the oneassociated with the largest eigenvalue) from a principal component analysis of seven core balance sheet and financialstatement variables of banks. These are tangible common equity, net income, net interest income, NPLs, Z-score (ameasure of riskiness of assets), return on average assets, and retail funding, all as a share of total assets.
ECB Working Paper Series No 2240 / February 2019 40

Figure 5: Insolvency Framework Sub-Indicators in OECD countries
Panel A - Personal Costs for Failed Entrepreneurs0
.2.4
.6.8
1
TR CA US RU AU UK JP CH NZ CR LV NO FI IE AT FR IT SK SI DK PL CL GR ES NL BE IL KR DE PT HU SE EE CZ LT MX
2010 2016
Panel B - Barriers to Restructuring
0.2
.4.6
.81
CR CZ UKRUUS SK DE JP PT FI CH IL MX IE FR PL NZ ES SE KR AT BE CN SI AUGR CL NO LT HU IT LV NL EE CA TR DK
2010 2016
Panel C - Lack of prevention and streamlining
0.2
.4.6
.81
FR UKCN AT ES DKRU NZ IL KR FI CH IT DE IE US TR AUCR PL BENOSE LV SK NL SI PT JP CL GRMXHU EE CZ LT CA
2010 2016
ECB Working Paper Series No 2240 / February 2019 41

Figure 6: Bank Zombie Shares
5.5
66.
57
7.5
8Zo
mbi
e S
hare
by
Ban
k (%
)
-4 -2 0 2 4Bank Health Index (t-2)
The plot is a fitted line from regressing the share of firms by bank that are zombies on bank health, withcountry-industry-year fixed effects. The scatters show the mean of y for each bin of x.
ECB Working Paper Series No 2240 / February 2019 42

Figure 7: Bank Zombie Shares - Components5.
56
6.5
77.
58
Zom
bie
Sha
re b
y B
ank
(%)
-4 -2 0 2 4Bank Health Index (t-2)
The plot is a fitted line from regressing the share of firms by bank that are zombies on bankhealth, with country-industry-year fixed effects. The scatters show the mean of y for each binof x.
ECB Working Paper Series No 2240 / February 2019 43

Figure 8: Credit Availability
The plot is a fitted line from regressing the cumulated credit availability variable (sectoralmean) on lagged zombie capital share in the sector, with country-year fixed effects. Thescatters show the mean of y for each bin of x.
ECB Working Paper Series No 2240 / February 2019 44

Figure 9: Zombie firm share reduction associated with an improvement in bank healthaccording to the insolvency regimes
Panel A - NRI definition
Panel B - IC definition
The graph shows the percentage point difference between the zombie-reducing effect of a healthy bank (one standarddeviation above the mean) versus a weak bank (one standard deviation below the mean) under the barriers torestructuring performance (BTR) in 2010. As the BTR indicator is defined as distance from the frontier, the barsindicate the gains from reducing BTR to sample minimum. The red diamonds show the difference in 2016. Giventhat Denmark lacks insolvency regime indicators for 2010, we assume that the 2010 value is equivalent to the 2016value and as such do not simulate potential gains from reform. The estimates are based on the coefficients in TableV.
ECB Working Paper Series No 2240 / February 2019 45
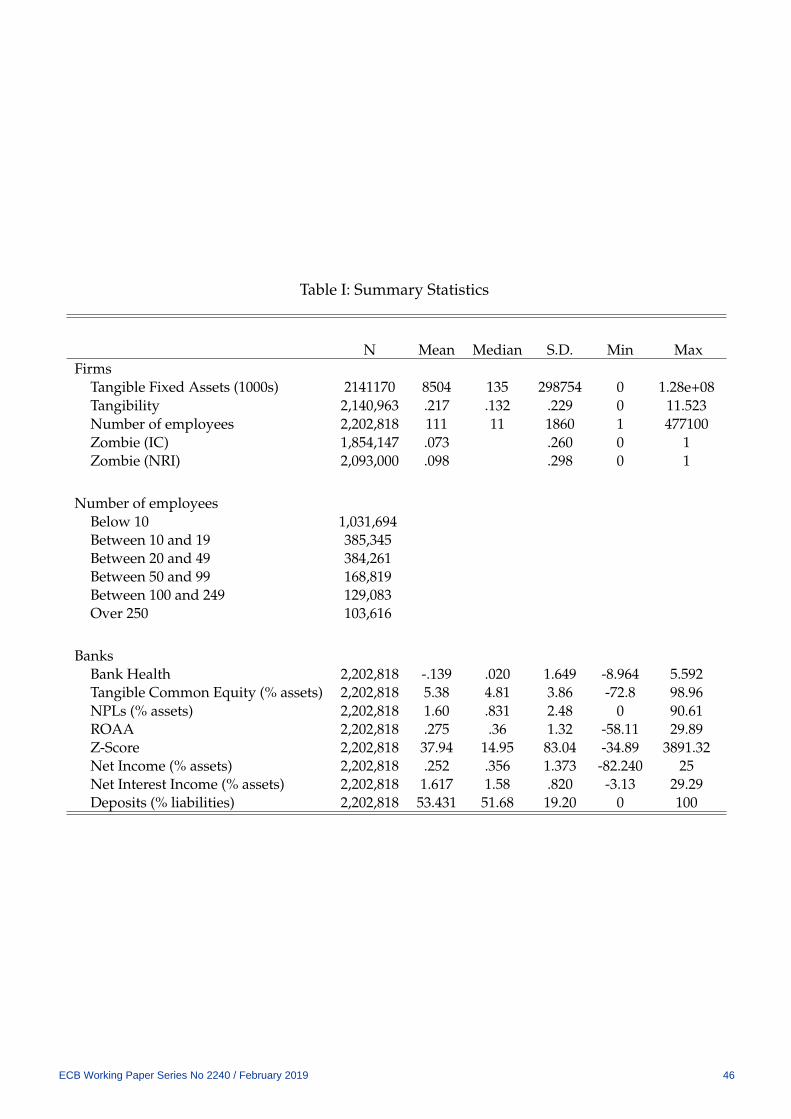
Table I: Summary Statistics
N Mean Median S.D. Min MaxFirms
Tangible Fixed Assets (1000s) 2141170 8504 135 298754 0 1.28e+08Tangibility 2,140,963 .217 .132 .229 0 11.523Number of employees 2,202,818 111 11 1860 1 477100Zombie (IC) 1,854,147 .073 .260 0 1Zombie (NRI) 2,093,000 .098 .298 0 1
Number of employeesBelow 10 1,031,694Between 10 and 19 385,345Between 20 and 49 384,261Between 50 and 99 168,819Between 100 and 249 129,083Over 250 103,616
BanksBank Health 2,202,818 -.139 .020 1.649 -8.964 5.592Tangible Common Equity (% assets) 2,202,818 5.38 4.81 3.86 -72.8 98.96NPLs (% assets) 2,202,818 1.60 .831 2.48 0 90.61ROAA 2,202,818 .275 .36 1.32 -58.11 29.89Z-Score 2,202,818 37.94 14.95 83.04 -34.89 3891.32Net Income (% assets) 2,202,818 .252 .356 1.373 -82.240 25Net Interest Income (% assets) 2,202,818 1.617 1.58 .820 -3.13 29.29Deposits (% liabilities) 2,202,818 53.431 51.68 19.20 0 100
ECB Working Paper Series No 2240 / February 2019 46

Table II: Zombie regression
(1) (2) (3) (4) (5)
Panel A - Country-Industry and Year Fixed Effects
Capital -0.0022∗∗∗ -0.0020∗∗ -0.0020∗(-2.71) (-2.27) (-1.94)
NPLs 0.0055∗∗∗ 0.0056∗∗∗ 0.0049∗∗∗(4.11) (3.59) (3.40)
Net Income -0.0008 -0.0022(-0.27) (-0.75)
Net Interest Income -0.0042 -0.0021(-1.30) (-0.58)
Maturity Mismatch -0.0017(x10) (-1.20)Z-Score -0.0004∗(x10) (-1.61)Bank Health -0.0073∗∗∗
(-4.95)Bank Health -0.0075∗∗∗inc Gov. Bonds (-3.48)Firm Controls Yes Yes Yes Yes YesN 1534841 1534011 1508501 1508501 1,61284R2 0.0784 0.0784 0.0789 0.0786 0.0784
Panel B - Country-Industry-Year Fixed Effects
Capital -0.0008∗∗∗ -0.0006∗∗∗ -0.0004∗∗∗(-3.30) (-2.49) (-1.87)
NPLs -0.0003 -0.0000 -0.0002(-0.52) (-0.05) (-0.42)
Net Income -0.0006 -0.0011(-0.66) (-1.07)
Net Interest Income -0.0046∗∗∗ -0.0037∗∗∗(-4.38) (-3.58)
Maturity Mismatch -0.0003(x10) (-0.69)Z-Score -0.0004∗∗∗(x10) (-3.52)Bank Health -0.0026∗∗∗
(-5.31)Bank Health -0.0027∗∗∗inc Gov. Bonds (-4.59)Firm Controls Yes Yes Yes Yes YesN 1534412 1533582 1508076 1508076 1160665R2 0.1014 0.1014 0.1015 0.1014 0.1005
The dependent variable is a binary indicator of zombie status, using the NRI definition. Allbank balance sheet variables are expressed in two years lags. All regressions include a controlfor bank size. Firm controls include firm age, lagged productivity, and a set of dummies forfirm employment.Standard Errors clustered at the bank level. t statistics in parentheses.∗ p < 0.10, ∗∗ p < 0.05, ∗∗∗ p < 0.01
ECB Working Paper Series No 2240 / February 2019 47

Table III: Zombie regression - Crisis
(1) (2) (3) (4)Full Sample Pre-Crisis Crisis Full Sample
Bank Health -0.0026∗∗∗ -0.0022∗∗ -0.0028∗∗∗ -0.0028∗∗∗(-5.31) (-2.43) (-4.75) (-3.52)
Crisis × Bank Health 0.0002(0.29)
Age 0.0005∗∗∗ 0.0004∗∗∗ 0.0005∗∗∗ 0.0005∗∗∗(5.60) (4.72) (5.69) (5.60)
Labor Productivity -0.0377∗∗∗ -0.0282∗∗∗ -0.0432∗∗∗ -0.0377∗∗∗(-10.41) (-15.52) (-9.24) (-10.41)
10<Employment<24 -0.0095∗∗∗ -0.0074∗∗ -0.0104∗∗∗ -0.0095∗∗∗(-3.73) (-2.15) (-4.37) (-3.73)
25<Employment<49 -0.0048∗ -0.0015 -0.0067∗ -0.0048∗(-1.65) (-0.58) (-1.83) (-1.65)
49<Employment<99 0.0104∗∗ 0.0149∗∗∗ 0.0074 0.0104∗∗(2.42) (5.23) (1.20) (2.42)
99<Employment<249 0.0166∗∗∗ 0.0210∗∗∗ 0.0139∗ 0.0166∗∗∗(3.01) (4.09) (1.86) (3.01)
Employment≥250 0.0138∗∗ 0.0183∗∗∗ 0.0111 0.0138∗∗(2.45) (4.41) (1.45) (2.45)
Country-Industry-Year FE Yes Yes Yes Yes
N 1508076 578756 929320 1508076R2 0.1014 0.0442 0.1043 0.1014
The dependent variable is a binary indicator of zombie status, using the NRI definition.All bank balance sheet variables are expressed in two years lags. All regressions includea control for bank size. Firm controls include firm age, lagged productivity, and a set ofdummies for firm employment.Standard Errors clustered at the bank level. t statistics in parentheses.∗ p < 0.10, ∗∗ p < 0.05, ∗∗∗ p < 0.01
ECB Working Paper Series No 2240 / February 2019 48

Tabl
eIV
:Zom
bie
regr
essi
on-R
obus
tnes
sC
heck
s
(1)
(2)
(3)
(4)
(5)
(6)
(7)
(8)
(9)
Man
ufac
turi
ngSe
rvic
esC
onst
ruct
ion
ICO
ver
20Be
low
50Lo
wEx
posu
reIV
-NR
IIV
-IC
Bank
Hea
lth
-0.0
026∗∗∗
-0.0
023∗∗∗
-0.0
040∗∗∗
-0.0
025∗∗∗
-0.0
033∗∗∗
-0.0
025∗∗∗
-0.0
029∗∗∗
-0.0
054∗∗
-0.0
051∗∗
(-3.
19)
(-3.
59)
(-4.
75)
(-4.
32)
(-3.
94)
(-5.
18)
(-4.
75)
(-2.
45)
(-2.
12)
Age
0.00
03∗∗
0.00
06∗∗∗
0.00
03∗∗∗
0.00
06∗∗∗
0.00
03∗∗∗
0.00
07∗∗∗
0.00
05∗∗∗
0.00
06∗∗∗
0.00
08∗∗∗
(2.4
0)(7
.22)
(3.5
0)(8
.81)
(4.4
3)(6
.97)
(5.3
9)(5
.10)
(7.1
1)
Labo
rPr
oduc
tivi
ty-0
.050
3∗∗∗
-0.0
399∗∗∗
-0.0
218∗∗∗
-0.0
262∗∗∗
-0.0
229∗∗∗
-0.0
414∗∗∗
-0.0
371∗∗∗
-0.0
487∗∗∗
-0.0
336∗∗∗
(-11
.55)
(-8.
98)
(-7.
87)
(-9.
78)
(-9.
78)
(-11
.20)
(-12
.04)
(-12
.94)
(-9.
71)
10<
Empl
oym
ent<
24-0
.007
2∗∗
-0.0
075∗∗∗
-0.0
151∗∗∗
0.00
02-0
.012
2∗∗∗
-0.0
114∗∗∗
-0.0
003
(-2.
45)
(-2.
88)
(-3.
44)
(0.0
8)(-
5.05
)(-
3.49
)(-
0.10
)
25<
Empl
oym
ent<
49-0
.001
0-0
.000
8-0
.015
5∗∗∗
0.00
67∗∗
-0.0
116∗∗∗
-0.0
073
0.00
49(-
0.30
)(-
0.26
)(-
3.57
)(2
.31)
(-3.
61)
(-1.
44)
(-1.
13)
49<
Empl
oym
ent<
990.
0277∗∗∗
0.01
01∗∗
-0.0
119∗∗
0.02
57∗∗∗
0.04
280.
0041
0.02
21∗∗∗
(5.8
4)(1
.99)
(-2.
39)
(6.3
6)(1
.14)
(-0.
62)
(-4.
24)
99<
Empl
oym
ent<
249
0.04
11∗∗∗
0.01
22∗
-0.0
098
0.03
57∗∗∗
0.07
09-0
.001
20.
0276∗∗∗
(7.0
6)(1
.95)
(-1.
59)
(7.6
3)(1
.46)
(-0.
16)
(-4.
85)
Empl
oym
ent≥
250
0.04
89∗∗∗
0.00
58-0
.021
4∗∗∗
0.03
76∗∗
0.00
82-0
.013
4∗0.
0215∗∗∗
(9.3
5)(0
.91)
(-3.
13)
(6.9
0)(1
.29)
(-1.
66)
-2.7
1
Empl
oym
ent
-0.0
000
0.00
00∗∗∗
(-0.
96)
(3.5
4)
Empl
oym
ent2
0.00
00-0
.000
0∗∗∗
(0.1
9)(-
2.71
)
Cou
ntry
-Ind
ustr
y-Ye
arFE
Yes
Yes
Yes
Yes
Yes
Yes
Yes
Yes
Yes
N35
7421
8899
2426
0731
1389
844
5563
7512
1462
767
9161
5108
5946
6875
R2
0.10
700.
0920
0.13
310.
0584
0.07
980.
1132
0.11
32K
leib
erge
n-Pa
apF-
stat
isti
c13
.322
14.6
61
The
depe
nden
tva
riab
leis
abi
nary
indi
cato
rof
zom
bie
stat
us,u
sing
the
NR
Ide
finit
ion
unle
sssp
ecifi
ed.
All
regr
esso
rsar
eex
pres
sed
intw
oye
ars
lags
.A
llre
gres
sion
sin
clud
ea
cont
rolf
orba
nksi
ze.
Firm
cont
rols
incl
ude
firm
age,
lagg
edpr
oduc
tivi
ty,a
nda
set
ofdu
mm
ies
for
firm
empl
oym
ent.
Stan
dard
Erro
rscl
uste
red
atth
eba
nkle
vel.
tsta
tist
ics
inpa
rent
hese
s.Th
eSt
ock-
Yogo
crit
ical
valu
esfo
r10
%m
axim
alIV
size
are
7.03
-hi
gher
valu
esof
the
Kle
iber
gen-
Papp
F-st
atis
tic
indi
cate
reje
ctio
nof
wea
k-in
stru
men
tnul
l.∗p<
0.10
,∗∗p<
0.05
,∗∗∗
p<
0.01
ECB Working Paper Series No 2240 / February 2019 49

Table V: Insolvency Framework - NRI definition
(1) (2) (3) (4)insol13 Barriers Lack of Barriers
to restructuring prevention to restructuring
Panel A - 2016 indicators
Bank Health -0.0069∗∗∗ -0.0049∗∗∗ -0.0035∗∗∗ -0.0049∗∗∗(-3.52) (-6.46) (-4.40) (-6.29)
Bank Health × INSOL 0.0141∗∗ 0.0116∗∗∗ 0.0028 0.0113∗∗∗(2.39) (4.56) (1.46) (4.35)
Bank Health × GDP growth -0.0003∗∗(-2.53)
Bank Health × INSOL ×GDP growth 0.0005∗(1.91)
R2 0.1011 0.1014 0.1014 0.1015N 1487846 1508076 1508076 1508076
Panel B - 2010 indicators
Bank Health -0.0052∗∗ -0.0053∗∗∗ -0.0028∗∗∗ -0.0051∗∗∗(-2.54) (-4.17) (-3.57) (-4.11)
Bank Health ×INSOL 0.0061 0.0082∗∗ 0.0004 0.0075∗∗(1.31) (2.41) (0.30) (2.29)
Bank Health × GDP growth -0.0004∗(-1.86)
Bank Health × INSOL × GDP growth 0.0006(1.44)
R2 0.1011 0.1011 0.1014 0.1011N 1487846 1487846 1508076 1487846
Country-Industry-Year FE Yes Yes Yes Yes
The dependent variable is a binary indicator of zombie status, using the NRI definition. All regressorsare expressed in two years lags. All regressions include a control for bank size. Firm controls includefirm age, lagged productivity, and a set of dummies for firm employment. INSOL12 is the aggregatemeasure without rights of employees, and INSOL13 includes rights of employees.Standard Errors clustered at the bank level. t statistics in parentheses.∗ p < 0.10, ∗∗ p < 0.05, ∗∗∗ p < 0.01
ECB Working Paper Series No 2240 / February 2019 50
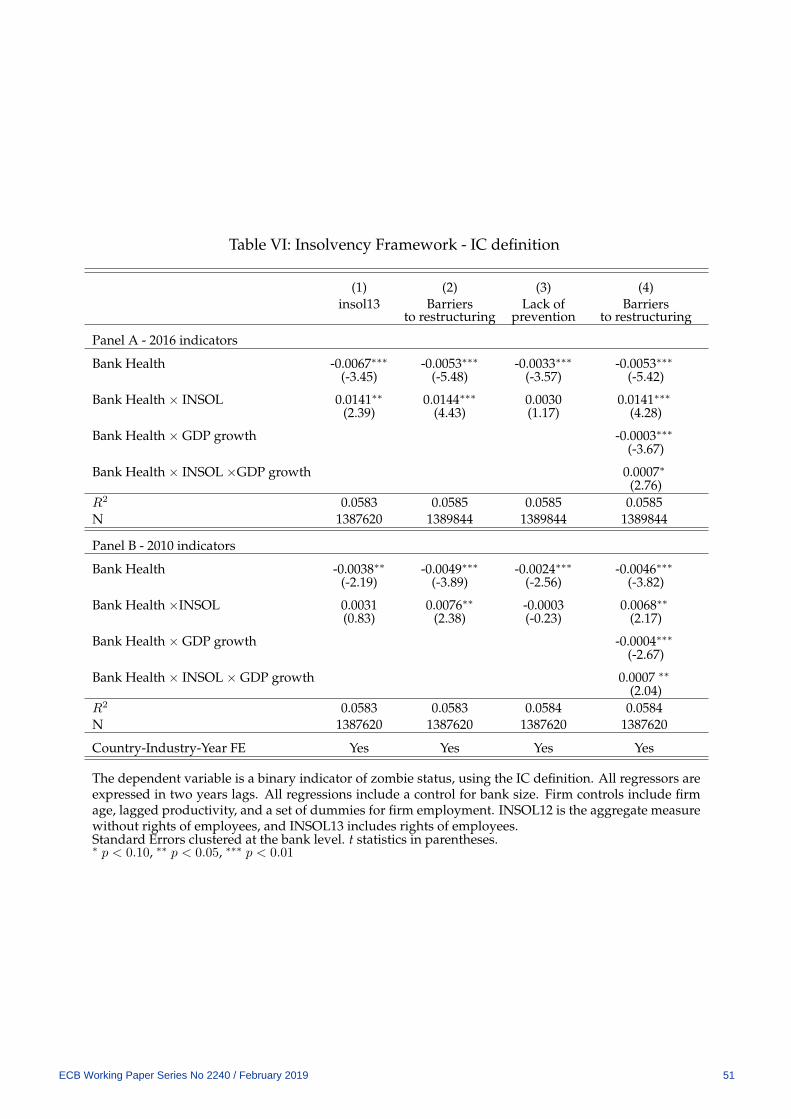
Table VI: Insolvency Framework - IC definition
(1) (2) (3) (4)insol13 Barriers Lack of Barriers
to restructuring prevention to restructuring
Panel A - 2016 indicators
Bank Health -0.0067∗∗∗ -0.0053∗∗∗ -0.0033∗∗∗ -0.0053∗∗∗(-3.45) (-5.48) (-3.57) (-5.42)
Bank Health × INSOL 0.0141∗∗ 0.0144∗∗∗ 0.0030 0.0141∗∗∗(2.39) (4.43) (1.17) (4.28)
Bank Health × GDP growth -0.0003∗∗∗(-3.67)
Bank Health × INSOL ×GDP growth 0.0007∗(2.76)
R2 0.0583 0.0585 0.0585 0.0585N 1387620 1389844 1389844 1389844
Panel B - 2010 indicators
Bank Health -0.0038∗∗ -0.0049∗∗∗ -0.0024∗∗∗ -0.0046∗∗∗(-2.19) (-3.89) (-2.56) (-3.82)
Bank Health ×INSOL 0.0031 0.0076∗∗ -0.0003 0.0068∗∗(0.83) (2.38) (-0.23) (2.17)
Bank Health × GDP growth -0.0004∗∗∗(-2.67)
Bank Health × INSOL × GDP growth 0.0007 ∗∗(2.04)
R2 0.0583 0.0583 0.0584 0.0584N 1387620 1387620 1387620 1387620
Country-Industry-Year FE Yes Yes Yes Yes
The dependent variable is a binary indicator of zombie status, using the IC definition. All regressors areexpressed in two years lags. All regressions include a control for bank size. Firm controls include firmage, lagged productivity, and a set of dummies for firm employment. INSOL12 is the aggregate measurewithout rights of employees, and INSOL13 includes rights of employees.Standard Errors clustered at the bank level. t statistics in parentheses.∗ p < 0.10, ∗∗ p < 0.05, ∗∗∗ p < 0.01
ECB Working Paper Series No 2240 / February 2019 51

Table VII: Zombie regressions - 3 digit sectors
(1) (2) (3) (4) (5) (6)NRI NRI NRI IC IC IC
Bank Health -0.0025∗∗∗ -0.0048∗∗∗ -0.0051∗∗∗ -0.0024∗∗∗ -0.0051∗∗∗ -0.0045∗∗∗(-5.04) (-6.23) (-3.93) (-4.16) (-5.28) (-3.60)
Bank Health ×Barriers 0.0118∗∗∗ 0.0141∗∗∗(4.48) (4.29)
Bank Health ×Barriers 2010 0.0080∗∗ 0.0069∗∗(2.27) (2.13)
Age 0.0004∗∗∗ 0.0004∗∗∗ 0.0004∗∗∗ 0.0006∗∗∗ 0.0006∗∗∗ 0.0006∗∗∗(5.19) (5.22) (5.16) (8.11) (8.16) (8.11)
Labor Productivity -0.0403∗∗∗ -0.0404∗∗∗ -0.0405∗∗∗ -0.0291∗∗∗ -0.0292∗∗∗ -0.0292∗∗∗(-10.10) (-10.13) (-10.04) (-10.25) (-10.29) (-10.26)
10<Employment<24 -0.0088∗∗∗ -0.0088∗∗∗ -0.0089∗∗∗ 0.0006 0.0006 0.0006(-3.57) (-3.57) (-3.60) (0.27) (0.26) (0.25)
25<Employment<49 -0.0048∗ -0.0049∗ -0.0051∗ 0.0058∗∗ 0.0058∗∗ 0.0058∗∗(-1.75) (-1.75) (-1.82) (2.14) (2.14) (2.12)
49<Employment<99 0.0103∗∗ 0.0103∗∗ 0.0104∗∗ 0.0247∗∗∗ 0.0246∗∗∗ 0.0246∗∗∗(2.47) (2.46) (2.44) (6.69) (6.67) (6.67)
99<Employment<249 0.0159∗∗∗ 0.0157∗∗∗ 0.0159∗∗∗ 0.0332∗∗∗ 0.0330∗∗∗ 0.0332∗∗∗(2.92) (2.91) (2.87) (7.65) (7.64) (7.64)
Employment>250 0.0134∗∗ 0.0131∗∗ 0.0138∗∗ 0.0336∗∗∗ 0.0333∗∗∗ 0.0336∗∗∗(2.35) (2.32) (2.35) (6.26) (6.21) (6.25)
R2 0.1154 0.1155 0.1149 0.0746 0.0747 0.0745Observations 1505815 1505815 1486032 1387779 1387779 1385652
Country-Industry-Year FE Yes Yes Yes Yes Yes Yes
The dependent variable is a binary indicator of zombie status, according to the definition indicated in eachcolumns. All regressors are expressed in two years lags. All regressions include a control for bank size. ”Bar-riers” indicates the value of the insolvency subindicator for barriers to restructuring for the 2016 wave, and”Barriers 2010” the respective value for the 2010 wave. The country-industry-year fixed effects are at the 3-digit NACE classification.Standard Errors clustered at the bank level. t statistics in parentheses.∗ p < 0.10, ∗∗ p < 0.05, ∗∗∗ p < 0.01
ECB Working Paper Series No 2240 / February 2019 52
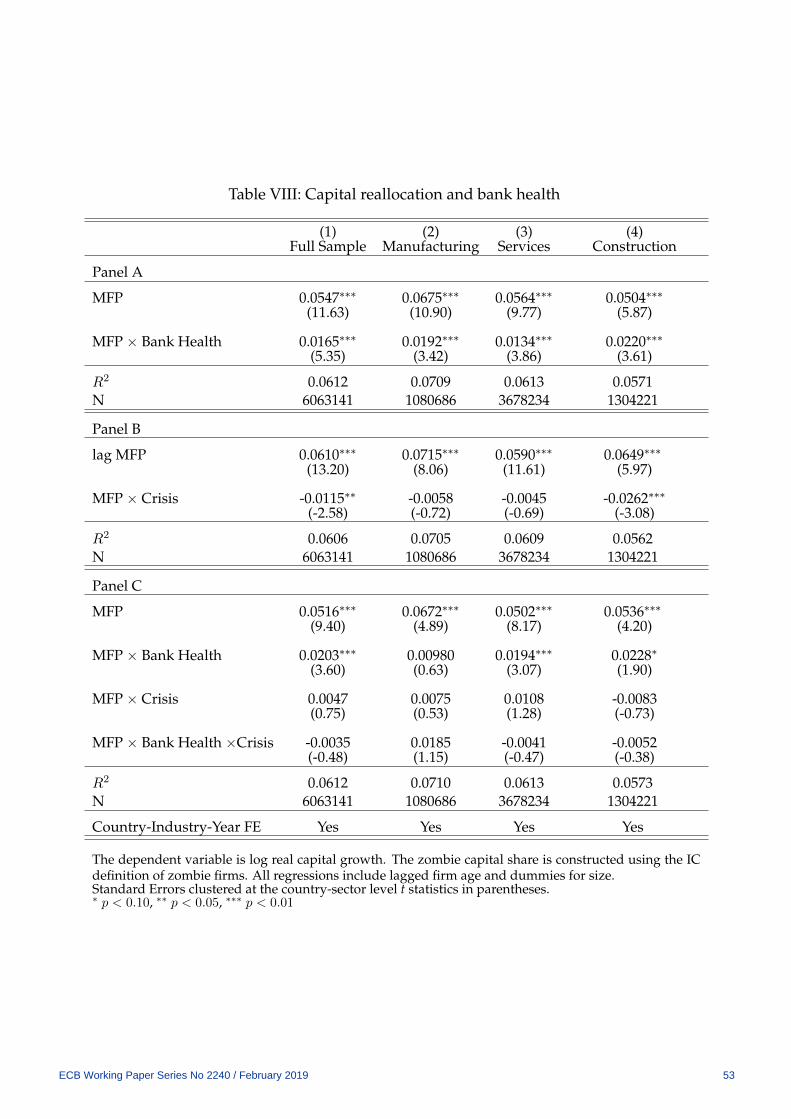
Table VIII: Capital reallocation and bank health
(1) (2) (3) (4)Full Sample Manufacturing Services Construction
Panel A
MFP 0.0547∗∗∗ 0.0675∗∗∗ 0.0564∗∗∗ 0.0504∗∗∗(11.63) (10.90) (9.77) (5.87)
MFP × Bank Health 0.0165∗∗∗ 0.0192∗∗∗ 0.0134∗∗∗ 0.0220∗∗∗(5.35) (3.42) (3.86) (3.61)
R2 0.0612 0.0709 0.0613 0.0571N 6063141 1080686 3678234 1304221
Panel B
lag MFP 0.0610∗∗∗ 0.0715∗∗∗ 0.0590∗∗∗ 0.0649∗∗∗(13.20) (8.06) (11.61) (5.97)
MFP × Crisis -0.0115∗∗ -0.0058 -0.0045 -0.0262∗∗∗(-2.58) (-0.72) (-0.69) (-3.08)
R2 0.0606 0.0705 0.0609 0.0562N 6063141 1080686 3678234 1304221
Panel C
MFP 0.0516∗∗∗ 0.0672∗∗∗ 0.0502∗∗∗ 0.0536∗∗∗(9.40) (4.89) (8.17) (4.20)
MFP × Bank Health 0.0203∗∗∗ 0.00980 0.0194∗∗∗ 0.0228∗(3.60) (0.63) (3.07) (1.90)
MFP × Crisis 0.0047 0.0075 0.0108 -0.0083(0.75) (0.53) (1.28) (-0.73)
MFP × Bank Health ×Crisis -0.0035 0.0185 -0.0041 -0.0052(-0.48) (1.15) (-0.47) (-0.38)
R2 0.0612 0.0710 0.0613 0.0573N 6063141 1080686 3678234 1304221
Country-Industry-Year FE Yes Yes Yes Yes
The dependent variable is log real capital growth. The zombie capital share is constructed using the ICdefinition of zombie firms. All regressions include lagged firm age and dummies for size.Standard Errors clustered at the country-sector level t statistics in parentheses.∗ p < 0.10, ∗∗ p < 0.05, ∗∗∗ p < 0.01
ECB Working Paper Series No 2240 / February 2019 53

Table IX: Capital reallocation, bank health and zombie congestion
(1) (2) (3) (4)Full Sample Full Sample Full Sample Full Sample
MFP 0.0547∗∗∗ 0.0655∗∗∗ 0.0616∗∗∗ 0.1826∗∗∗(11.63) (9.97) (9.88) (17.06)
MFP× Bank Health 0.0165∗∗∗ 0.0147∗∗∗ 0.0171∗∗∗(5.35) (4.76) (5.85)
MFP × Industry Zombie Share -0.1340∗∗∗ -0.0894∗∗(-3.16) (-2.29)
Age -0.0019 ∗∗∗ -0.0018∗∗∗ -0.0018 ∗∗∗ -0.0237(-6.53) (-6.42) (-6.43) (-0.01)
10<Employment<24 -0.0212∗∗∗ -0.0213∗∗∗ -0.0213∗∗∗ -0.0484∗∗∗(-4.25) (-4.27) (-4.29) (-8.83)
25<Employment<49 -0.0154∗∗ -0.0154∗∗ -0.0155∗∗∗ -0.0887∗∗∗(-2.57) (-2.55) (-2.59) (-13.38)
49<Employment<99 -0.0204∗ -0.0201∗ -0.0205∗ -0.1223∗∗∗(-1.81) (-1.74) (-1.81) (-13.88)
99<Employment<249 -0.0339∗∗∗ -0.0344∗∗∗ -0.0344∗∗∗ -0.1723∗∗∗(-2.91) (-2.93) (-2.95) (-16.64)
Employment>=250 -0.0306∗∗ -0.0312∗∗ -0.0310∗∗ -0.1967∗∗∗(-2.31) (-2.33) (-2.32) (-10.98)
Country-Industry-Year FE Yes Yes Yes YesFirm FE No No No Yes
R2 0.0612 0.0608 0.0613 0.3998N 6063141 6063141 6063141 5774378
The dependent variable is log real capital growth. The zombie capital share is constructedusing the IC definition of zombie firms. All regressors are lagged.Standard Errors clustered at the country-sector level. t statistics in parentheses∗ p < 0.10, ∗∗ p < 0.05, ∗∗∗ p < 0.01
ECB Working Paper Series No 2240 / February 2019 54
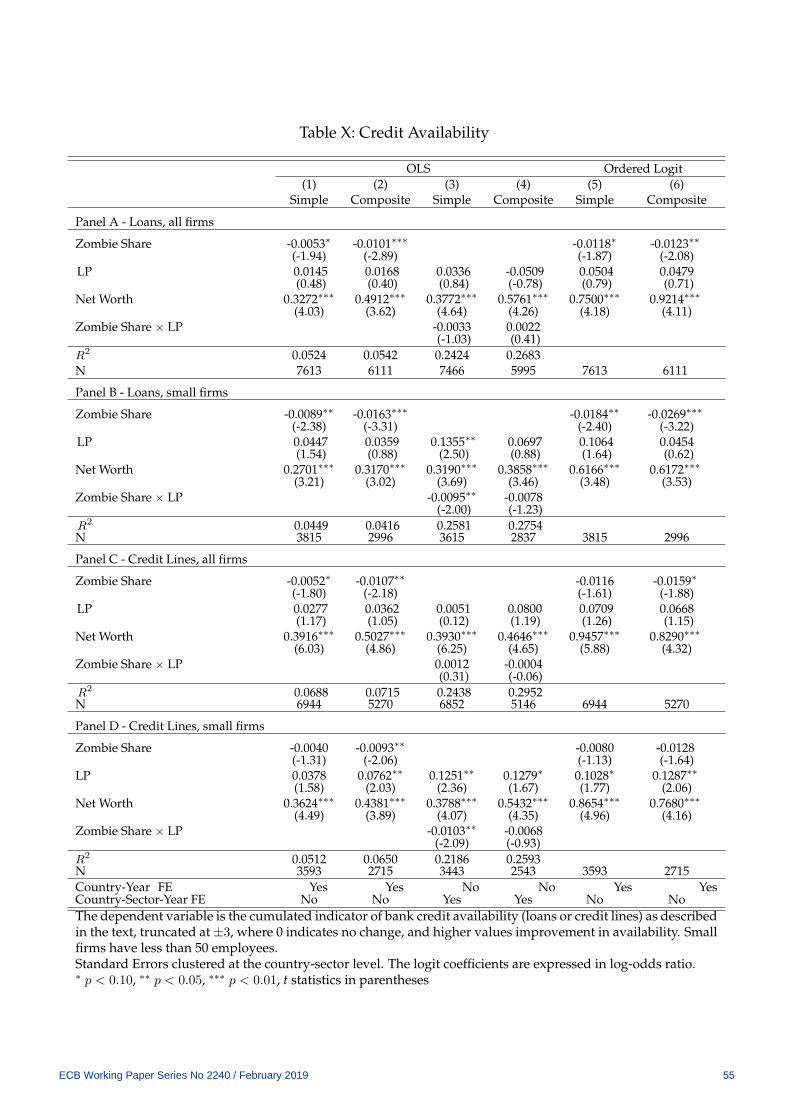
Table X: Credit Availability
OLS Ordered Logit(1) (2) (3) (4) (5) (6)
Simple Composite Simple Composite Simple Composite
Panel A - Loans, all firms
Zombie Share -0.0053∗ -0.0101∗∗∗ -0.0118∗ -0.0123∗∗(-1.94) (-2.89) (-1.87) (-2.08)
LP 0.0145 0.0168 0.0336 -0.0509 0.0504 0.0479(0.48) (0.40) (0.84) (-0.78) (0.79) (0.71)
Net Worth 0.3272∗∗∗ 0.4912∗∗∗ 0.3772∗∗∗ 0.5761∗∗∗ 0.7500∗∗∗ 0.9214∗∗∗(4.03) (3.62) (4.64) (4.26) (4.18) (4.11)
Zombie Share × LP -0.0033 0.0022(-1.03) (0.41)
R2 0.0524 0.0542 0.2424 0.2683N 7613 6111 7466 5995 7613 6111
Panel B - Loans, small firms
Zombie Share -0.0089∗∗ -0.0163∗∗∗ -0.0184∗∗ -0.0269∗∗∗(-2.38) (-3.31) (-2.40) (-3.22)
LP 0.0447 0.0359 0.1355∗∗ 0.0697 0.1064 0.0454(1.54) (0.88) (2.50) (0.88) (1.64) (0.62)
Net Worth 0.2701∗∗∗ 0.3170∗∗∗ 0.3190∗∗∗ 0.3858∗∗∗ 0.6166∗∗∗ 0.6172∗∗∗(3.21) (3.02) (3.69) (3.46) (3.48) (3.53)
Zombie Share × LP -0.0095∗∗ -0.0078(-2.00) (-1.23)
R2 0.0449 0.0416 0.2581 0.2754N 3815 2996 3615 2837 3815 2996
Panel C - Credit Lines, all firms
Zombie Share -0.0052∗ -0.0107∗∗ -0.0116 -0.0159∗(-1.80) (-2.18) (-1.61) (-1.88)
LP 0.0277 0.0362 0.0051 0.0800 0.0709 0.0668(1.17) (1.05) (0.12) (1.19) (1.26) (1.15)
Net Worth 0.3916∗∗∗ 0.5027∗∗∗ 0.3930∗∗∗ 0.4646∗∗∗ 0.9457∗∗∗ 0.8290∗∗∗(6.03) (4.86) (6.25) (4.65) (5.88) (4.32)
Zombie Share × LP 0.0012 -0.0004(0.31) (-0.06)
R2 0.0688 0.0715 0.2438 0.2952N 6944 5270 6852 5146 6944 5270
Panel D - Credit Lines, small firms
Zombie Share -0.0040 -0.0093∗∗ -0.0080 -0.0128(-1.31) (-2.06) (-1.13) (-1.64)
LP 0.0378 0.0762∗∗ 0.1251∗∗ 0.1279∗ 0.1028∗ 0.1287∗∗(1.58) (2.03) (2.36) (1.67) (1.77) (2.06)
Net Worth 0.3624∗∗∗ 0.4381∗∗∗ 0.3788∗∗∗ 0.5432∗∗∗ 0.8654∗∗∗ 0.7680∗∗∗(4.49) (3.89) (4.07) (4.35) (4.96) (4.16)
Zombie Share × LP -0.0103∗∗ -0.0068(-2.09) (-0.93)
R2 0.0512 0.0650 0.2186 0.2593N 3593 2715 3443 2543 3593 2715Country-Year FE Yes Yes No No Yes YesCountry-Sector-Year FE No No Yes Yes No NoThe dependent variable is the cumulated indicator of bank credit availability (loans or credit lines) as describedin the text, truncated at±3, where 0 indicates no change, and higher values improvement in availability. Smallfirms have less than 50 employees.Standard Errors clustered at the country-sector level. The logit coefficients are expressed in log-odds ratio.∗ p < 0.10, ∗∗ p < 0.05, ∗∗∗ p < 0.01, t statistics in parentheses
ECB Working Paper Series No 2240 / February 2019 55

Acknowledgements The views expressed in this paper are those of the authors alone, and may not necessarily reflect those of the European Central Bank (ECB), the Organization for Economic Co-operation and Development (OECD), or the Australian Treasury. This work was undertaken while Andrews was at the OECD. We would like to thank Sebnem-Kalemli Ozcan, Romain Duval, Garry Young, Enrique Moral-Benito, Bob Anderton, Giuseppe Nicoletti, Isabel Vanksteenkiste, Beatrice Pierluigi, Muge Adalet McGowan, Agostino Consolo, Bjorn Fischer, Peter Gal, Valentine Millot, Ralph Setzer, Manuela Storz, Livio Stracca, seminar participants at the ECB, the OECD, the Joint OECD-IMF-BIS conference on weak productivity, Bruegel, Peterson Institute, Bank of Spain, and EARIE 2018. All errors are our own. Dan Andrews Australian Treasury, Canberra, Australia; OECD; email: [email protected] Filippos Petroulakis European Central Bank, Frankfurt am Main, Germany; email: [email protected]
© European Central Bank, 2019
Postal address 60640 Frankfurt am Main, Germany Telephone +49 69 1344 0 Website www.ecb.europa.eu
All rights reserved. Any reproduction, publication and reprint in the form of a different publication, whether printed or produced electronically, in whole or in part, is permitted only with the explicit written authorisation of the ECB or the authors.
This paper can be downloaded without charge from www.ecb.europa.eu, from the Social Science Research Network electronic library or from RePEc: Research Papers in Economics. Information on all of the papers published in the ECB Working Paper Series can be found on the ECB’s website.
PDF ISBN 978-92-899-3502-9 ISSN 1725-2806 doi:10.2866/192858 QB-AR-19-021-EN-N