Embed Size (px)
Citation preview
Working Paper Series Do stress tests matter? Evidence from the 2014 and 2016 stress tests
Oana-Maria Georgescu, Marco Gross, Daniel Kapp, Christoffer Kok
Disclaimer: This paper should not be reported as representing the views of the European Central Bank (ECB). The views expressed are those of the authors and do not necessarily reflect those of the ECB.
No 2054 / May 2017

Abstract
Stress tests have been increasingly used in recent years by regulators to foster con-
fidence in the banking sector by not only increasing its resilience via mandatory capital
increases but also by enhancing transparency to allow investors to better discriminate
between banks. In this study, using an event study approach, we explore how market
participants reacted to the 2014 Comprehensive Assessment and the 2016 EBA EU-
wide stress test. The results show that stress test disclosures revealed new information
that was priced by the markets. We also provide evidence that the publication of
stress test results enhanced price discrimination as the impact on bank CDS spreads
and equity prices tended to be stronger for the weaker performing banks in the stress
test. Finally, we provide some evidence that also sovereign funding costs were affected
in the aftermath of the stress test publications. The results provide insights into the
effects and usefulness of stress test-related disclosures.
JEL classification: G14, G18, G21.
Keywords: event study, bank stress tests, disclosure.
ECB Working Paper 2054, May 2017 1

Non-technical summary
The purpose of this paper is to assess whether the 2014 and 2016 EU-wide stress tests
achieved one of their main objectives, namely to provide new information to the market via
detailed disclosures of point-in-time bank balance sheet characteristics and of the outcome
of the forward-looking solvency assessment (the stress test). The assessment is centred on
whether banks’ cost of funding and equity prices were visibly affected by the announcement
of the stress test and by the publication of the results.
Against this background, we test three hypotheses. We first conjecture that stress tests may
reveal new information about the banks being stress tested and therefore could impact their
market-based funding costs and stock prices. The second hypothesis is that the publication
of stress test results improved price discrimination in terms of allowing markets to better
discriminate between ’good’ and ’bad’ banks. Finally, the third hypothesis is that the stress
test, in particular the 2014 Comprehensive Assessment (CA), may have affected the CDS
prices of the sovereigns of banks being stress tested due to the potential fiscal implications
of filling identified bank capital shortfalls.
To test these hypotheses we employ an event study approach estimating cumulative ”abnor-
mal” returns of banks’ CDS spreads and stock prices and sovereign CDS spreads around the
stress test events (e.g. announcements, results publication, etc.). To test the second hypoth-
esis, we furthermore distinguish between banks according to what the stress test revealed
about their relative strengths and weaknesses.
The main findings are the following:
For what concerns Hypothesis 1 the results show that both the announcement of the key
features of the stress test and the publication of results revealed new information that was
priced by markets, as reflected in statistically significant abnormal returns.
With respect to whether markets became better at discriminating ’strong’ and ’weak’ banks
(Hypothesis 2) we also find that the market price impact differs across the banks when we
measure banks according to how well they performed in the stress tests. In the 2014 CA,
after the publication of the results we observe negative abnormal CDS returns for banks
with a large CET1 impact resulting from the Asset Quality Review (AQR) and the stress
test adverse scenario. This may suggest that given the ’pass-fail’ nature of the exercise,
creditors of the weakest performing banks may benefit from the remedial actions required
as a follow up to the CA (e.g. capital raising). At the same time, stock prices of the weaker
banks performed significantly worse than those of the stronger banks upon publication of
ECB Working Paper 2054, May 2017 2

the 2014 CA results, which could reflect the likely dilution of equity holders for those weaker
banks needing to raise capital as a follow-up to the CA. In the 2016 stress test, banks
experiencing a large CET1 ratio decline under the adverse scenario reported significantly
higher positive abnormal CDS returns (and negative abnormal stock price returns) after
the publication of the stress test results compared to better performing banks. While the
sign of the expectations may have been different in the two stress tests, the revision of
expectations conditional on the credit quality of tested banks provide consistent evidence
for the hypothesis that the two stress tests improved the ability of markets to discriminate
between ’good’ banks and ’bad’ banks.
We also provide evidence that sovereign funding costs were somewhat affected by the pub-
lication of stress test results. In the 2014 CA, this was especially the case for sovereigns
where stress tested banks had relatively large exposures to their own sovereign, which could
indicate a strong bank-sovereign link. In the 2016 stress test, that feature did not seem to
affect sovereign CDS spreads (potentially due to the fact that there was no new information
compared to previously disclosed data on sovereign exposures) but instead sovereign fund-
ing costs displayed abnormal increases in those countries where banks’ CET1 buffers were
relatively low under the adverse scenario.
Overall, our study provides insights into the effects and usefulness of stress test-related
disclosures. It is shown that the most recent EU-wide stress tests provided value added in
terms of providing new information to the market, which by enhancing market efficiency
provided support to the broader micro- and macroprudential uses of the stress tests aiming
at safeguarding financial stability.
ECB Working Paper 2054, May 2017 3

1 Introduction
Stress tests have been increasingly used in recent years by regulators to foster confidence in
the banking sector by not only increasing its resilience via mandatory capital increases but
also by enhancing transparency to allow investors to better discriminate between banks and
thereby contributing to a more efficient market pricing of bank funding costs. Financial crises
are typically characterised by heightened uncertainty about the quality and hence valuation
of assets held by banks. This can have negative implications for even sound banks’ access
to and cost of funding, as markets may not be able to properly discriminate between ’good’
and ’bad’ banks.1
The Comprehensive Assessment (CA) conducted by the ECB in 2014 as well as the 2016 EBA
EU-wide stress test should also be viewed in this tradition. The stated objectives of the CA
were to: (i) strengthen banks’ balance sheets by repairing the problems identified through the
necessary remedial actions; (ii) enhance transparency by improving the quality of information
available on the condition of the banks; and (iii) build confidence by assuring all stakeholders
that, on completion of the identified remedial actions, banks will be soundly capitalised.2 In
addition, the publication of the results of the 2014 Comprehensive Assessment marked the
beginning of the SSM, a core element of the Banking Union, that was expected to severe
the vicious link between banks and their respective sovereign. Similarly, the 2016 stress test
aimed at improving market discipline by enhancing transparency.3
In this paper, we focus on whether the second stated objective was met: To what extent did
information about the underlying quality of banks’ assets, their exposures and their resilience
to an assumed adverse scenario imply new information to the market and thereby affected
the pricing of banks’ cost of funding and stock prices? We attempt to answer three main
questions in an event study setting on bank (and sovereign) CDS returns and stock price
returns around key events during the 2014 and 2016 stress tests. With respect to the 2014
CA we focus on the announcement of the stress test, the clarification of the methodology, the
1As asymmetric information between banks and outside investors may become particularly pronouncedduring a crisis, this is likely to amplify the adverse selection bias where the ’good’ banks will be priced out ofthe market because it cannot distinguish between them and the ’lemons’ (the unhealthy banks); see Akerlof(1970)
2See ECB (2014) ”Aggregate Report on the Comprehensive Assessment”, October.3Thus, according to the EBA press release when publishing the 2016 stress test results, ”the objective
of the stress test is to provide supervisors, banks and other market participants with a common analyticalframework to consistently compare and assess the resilience of large EU banks to adverse economic develop-ments. Along with the results, the EBA is providing again substantial transparency of EU banks’ balancesheets, with over 16,000 data points per bank, an essential step towards enhancing market discipline in theEU.” (see EBA, ”EBA publishes 2016 EU-wide stress test results”, 29 July 2016)
ECB Working Paper 2054, May 2017 4

publication of the Comprehensive Assessment Stress Test (CAST) Manual for the 2014 stress
test that laid out the stress test quality assurance methodology and finally the publication
of the stress test results. Similarly, for the 2016 stress test we examine the impact on
market prices around the announcement of the exercise, the publication of key features and
the publication of the results. In light of the significant differences in the design of the
2014 and the 2016 stress tests, the comparison of the market reaction to the two disclosure
events can be of interest for regulators wishing to achieve an efficient stress test setup. A
further element that we explore is the extent to which stress test related disclosures, incl.
potential recapitalisation needs, had any impact on the pricing of CDS spreads on the banks’
sovereigns. Stress test disclosures could have an impact on sovereign funding costs both by
providing new information about banks’ exposures to their sovereign and due to potential
fiscal implications if the sovereign has to provide support to banks failing the stress test.4
Against this background, we test three hypotheses. We first conjecture that stress tests
may reveal new information about the banks being stress tested and therefore impact their
market-based funding costs and stock prices. The second hypothesis is that the publication
of stress test results improved price discrimination in terms of allowing markets to better
discriminate between ’good’ banks and ’bad’ banks. Finally, the third hypothesis is that the
stress test, in particular the 2014 CA, may have affected the CDS prices of the sovereigns of
banks being stress tested.
To test these hypotheses we employ an event study approach estimating cumulative ”abnor-
mal” returns of banks’ CDS spreads and stock prices and sovereign CDS spreads around the
stress test events (e.g. announcements, results publication, etc.). To test the second hypoth-
esis, we furthermore distinguish between banks according to what the stress test revealed
about their relative strengths and weaknesses.
The main findings are the following:
For what concerns Hypothesis 1 the results show that both the announcement of the key
features of the stress test and the publication of results revealed new information that was
priced by markets, as reflected in statistically significant abnormal returns.
With respect to whether markets became better at discriminating ’strong’ and ’weak’ banks
(Hypothesis 2) we also find that the market price impact differs across the banks when we
measure banks according to how well they perform in the stress tests. The direction of
the market price impact between weak and strong banks is however different in the 2014
exercise compared to the 2016 stress test. In the 2014 CA, after the publication of the
4The latter feature was mainly an issue for the 2014 CA due to its ”pass-fail” nature.
ECB Working Paper 2054, May 2017 5

CA results, we observe large, negative abnormal CDS returns for banks with a large CET1
impact resulting from the AQR and the stress test adverse scenario. This may suggest that
results for the weaker banks were less bad than expected for bank creditors and given the
’pass-fail’ nature of the exercise that creditors of the weaker banks would benefit from the
remedial actions required by the weakest performing banks. At the same time, stock prices
of the weaker banks performed significantly worse than those of the stronger banks upon
publication of the 2014 CA results, which could reflect the likely dilution of equity holders
for those weaker banks needing to raise capital as a follow-up to the CA. The opposite
pattern can be observed for the 2016 stress test. Banks with large adverse-baseline CET1
ratio gaps reported significantly higher positive abnormal CDS returns after the publication
of the stress test results compared to banks with a small adverse baseline gap.5 While the
sign of the expectations may have been different in the two stress tests, the revision of
expectations conditional on the credit quality of tested banks provide consistent evidence
for the hypothesis that the two stress tests improved the ability of markets to discriminate
between ’good’ banks and ’bad’ banks. We interpret these findings as a confirmation of the
fact that the stress test results publication fosters transparency by confirming or adjusting
prevailing bank risk perceptions, irrespective of whether the disclosed results triggered a
mandatory capital issuance or not.
The comparison of the results of the CDS and stock market event study is of interest because
creditors and stock holders may have different incentives with respect to the disclosure of
stress test information. The negative abnormal stock returns in conjunction with the negative
abnormal CDS returns observed after the publication of the 2014 stress test results point to a
disconnect between the stock market and the CDS market. In addition, it seems that stock
markets discriminate between ’good’ and ’bad banks’: Banks with a large CET1 impact
resulting from the stress test adverse scenario and the AQR experienced negative abnormal
returns, while banks that are well capitalised conditional on the hypothetical adverse scenario
and the AQR correction report positive abnormal returns. These results provide support
for the hypothesis that regulatory or voluntary capital raising needs uncovered by the stress
test may be detrimental to shareholders. In contrast, creditors seem to be more focused on
the solvency of the banks and may have been relieved to learn that losses incurred in the
adverse scenario were lower than expected. The disconnect between CDS and stock markets
cannot be observed for the 2016 stress test. The reason may be the different setup of the
2016 stress test, with creditors benefitting from remedial capital actions in the 2014 but not
5The capital impact of the 2014 stress test is computed relative to the end 2013 starting point, in order toaccount for the effect of the AQR. The capital impact of the 2016 stress test refers to the difference betweenthe CET1 ratio in the adverse and baseline scenario.
ECB Working Paper 2054, May 2017 6
in the 2016 stress test. Another explanation could be the different ex-ante expectations of
creditors with respect to banks’ performance in the stress test.
We also provide evidence that sovereign funding costs were somewhat affected by the pub-
lication of stress test results. In the 2014 CA, this was especially the case for sovereigns
where stress tested banks had relatively large exposures to their own sovereign, which could
indicate a strong bank-sovereign link. In the 2016 stress test, that feature did not seem to
affect sovereign CDS spreads (potentially due to the fact that there was no new information
compared to previously disclosed data on sovereign exposures) but instead sovereign fund-
ing costs displayed abnormal increases in those countries where banks’ CET1 buffers were
relatively low under the adverse scenario.
This paper is organized as follows: Section 2 and 3 give an overview of the existing literature
as well as the main features of the two stress tests, Section 4 describes the data and the
empirical methodology. Section 5 discusses the results. Section 6 concludes.
2 Related literature
There is a small but emerging literature on stress test disclosures and their implications.
Some theoretical papers discuss the trade-off implied by the publication of stress test results.
Goldstein and Sapra (2012) show that disclosure of supervisory information and stress test
results can have a detrimental effect on the ex-ante incentives of banks. In the absence
of informational frictions, more information always improves market discipline. In reality,
banks are opaque institutions whose reactions are endogenous to the regulatory environment.
Banks maximizing equity returns will have incentives to engage in short-term risky projects in
order to pass the stress tests. Moreover, as shown by Morris and Shin (2002), if the precision
of the disclosed information is not sufficiently high, market participants may place too much
weight on the public signal leading to market overreaction and coordination failures.
Similarly, Gick and Pausch (2012) show in a game-theoretical framework that macro stress
tests can be welfare improving if the methodology as well as the results of the stress test
are communicated effectively. Spargoli (2012) shows that in the case that the regulator is
able to recapitalize banks, it is in the interest of the regulator to reveal a bank’s capital
shortfall. The difference in recapitalization capability is found to partly explain why the
market’s reaction to stress tests was favorable for the US SCAP and largely negligible in
Europe for the 2010 and 2011 stress tests.
ECB Working Paper 2054, May 2017 7

Hirtle (2007) shows that enhanced disclosure of bank holding companies is associated with
higher risk-adjusted returns. Horvath and Vasco (2012) document various countries’ degrees
of transparency since the year 2000 and find that in good times increased transparency is
beneficial for financial stability. A telling example for the potentially adverse consequences
of low disclosure requirements is the 1982 saving and loans crisis in the US. The combination
of a pronounced maturity mismatch coupled with rising interest rates led to the insolvency of
many US saving banks. The build-up of risks was not apparent from the financial statements
of these banks as they reported their financial statements under amortized cost, delaying the
recognition of their funding vulnerability (see Elliott et al. (2013)). There is a wide literature
documenting the tendency of banks to use reporting discretion in order to manage earnings
(see for example Huizinga and Laeven (2012), Laux and Leuz (2009), Kolev (2009) and Song
(2010)). This also applies to stress test disclosure, as banks have considerable discretion in
mapping their risk parameters to the adverse scenario. As shown by Gao and Jiang (2014),
the incentives for misreporting are not linear in the bank’s fundamentals. Very ’good’ and
very ’bad’ banks have less incentive for misreporting, while banks in between wish to avoid
panic-based runs. This gives rise to pooling equilibria in which ’good’ banks avoid panic
based runs while ’bad’ banks avoid fundamental based runs.
Comparing US and EU stress tests, Schuerman (2013) and Candelon and Amadou (2015)
discuss governance aspects that are essential for the effectiveness of stress tests, such as the
institutional framework, the scope, the methodology and scenario design, the granularity of
disclosed information as well as the planned follow-up actions by the relevant authorities.
Their analysis suggests that a strong institutional framework, a credible backstop and effi-
cient communication to market participants are key elements for an effective stress test that
may be more important than the technical specifications of the stress test. Frame et al.
(2015) review the key features of the supervisory stress tests performed on Fannie Mae and
Freddie Mac and identify two major flaws in the setup of the stress test that that rendered
these stress tests uninformative. First, the supervisor failed to update the model with data
on mortgages originated after 1997 or to extend the model with other relevant variables. Sec-
ond, the house price adverse scenario was much too mild compared to the actual house price
development in the bust. Acharya and Steffen (2014b) criticise the ECB’s Comprehensive
Assessment for not being stringent enough pointing out a striking divergence between their
own market-based stress test estimates and the ECB’s stress test results, which in their view
can be explained by the reliance on static risk-weights in the regulatory assessment.6 Homar
et al. (2016) however argue that the SRISK approach of Acharya and Steffen by focusing
6See also Acharya and Steffen (2014a) and Acharya, Pierret and Steffen (2016).
ECB Working Paper 2054, May 2017 8

purely on bank equity losses (and not losses on total assets) is not a well-suited benchmark
for supervisory and macroprudential stress tests.
The existing empirical evidence on stress tests suggests that the mandatory disclosure of
stress test results generally revealed new information to the market. Breckenfelder and
Schwaab (2015) use the reaction of equity and CDS markets to the publication of 2014
stress test results to quantify the cross-border spillovers from changes in banks CDS and
equity prices in stressed countries to the sovereign CDS in non-stressed countries. The
paper shows that after the publication of stress test results, the debt-weighted sovereign
CDS of non-stressed countries (Austria, Belgium, France, Germany and the Netherlands)
increased more than the sovereign CDS of stressed countries (Greece, Ireland, Portugal,
Italy and Spain), while the corresponding debt-weighted bank CDS remain relatively flat.
Moreover, the paper finds that after the results publication, the average response of bank
CDS to a change in stock prices is less strong for bank equity located in stressed countries
compared to bank equity located in a non-stressed country. Last, sovereign CDS spreads of
non-stressed countries seem to be more sensitive to changes in CDS spreads and equity prices
of banks located in stressed countries compared to banks from non-stressed countries. The
authors interpret these results as evidence for the fact that non-stressed countries provide a
priced second line of defense to banks in stressed countries. Barucci et al (2014) analyze
cross-sectional drivers of the AQR and stress test shortfall and find a negative correlation
with the initial CET1 ratio, bank size, the ratio of non-performing loans and the use of the
internal rating based approach (IRB) for the determination of risk-weighted assets. Steffen
(2014) discusses the trade-off faced by the ECB between maintaining its reputation as an
independent regulator and disclosing bank shortfalls in the absence of credible backstops.
In order to emphasize the uncertainty around the results of the Comprehensive Assessment,
Steffen (2014) compares several alternative capital shortfall measures that could be used
as benchmarks in future exercises, such as a 7% leverage ratio, a market capital shortfall, a
capital shortfall in a systemic crisis as well as a capital shortfall after write-down.
Petrella and Resti (2013) finds a significant reaction of stock markets to the publication
of the 2011 EU stress test results. Peristian et al. (2010) find that stock markets reacted
to the disclosure of policy-related information during the SCAP and to the announcement
of the methodology publication. Along the same lines, Neretina et al. (2014) investigate
the effects of the announcement, clarication, methodology and outcomes of US bank stress
tests on banks’ equity prices, credit risk and on systemic risk. While only weak effects
on large US banks’ equity returns are found, for some exercises, CDS spreads and bank
systemic risk declined after the results publication. Ellahie (2012) employs a difference-in-
ECB Working Paper 2054, May 2017 9
difference methodology in order to compare tested EU banks with propensity score matched
control firms in an event study around stress test announcement and disclosure events of
the 2010 CEBS and the 2011 EBA stress tests. The study finds that unlike the publication
of the results, the 2010 and the 2011 stress test announcements did not have identifiable
effects on information asymmetry.7 Bischof and Daske (2013) analyze bank behavior after
the publication of the 2011 stress test results and show that tested banks increased their
subsequent voluntary disclosures on their sovereign exposures. Jordan et al. (2000) analyze
the market reaction to the announcement of formal supervisory enforcement actions on US
banks. Their results show that the supervisory actions revealed new information and that
the cross-sectional variation in the disclosure policy prior to the announcement explains the
magnitude of the market reaction. Finally, in a study closely related to ours (albeit for the
US), Flannery et al. (2016) present evidence that the Federal Reserve stress tests produce
information about both the stress-tested bank holding companies and the overall state of
the banking industry. They find that stress test disclosures are associated with significantly
higher absolute abnormal returns, as well as higher abnormal trading volume. In addition,
they document that more levered and riskier holding companies seem to be more affected
by the stress test information.
We add to these studies by comparing the market reactions to the 2014 Comprehensive
Assessment with the 2016 EBA stress test. As we will discuss below, the two exercises had
slightly different purposes (the first being a ’pass-fail’ exercise and the other a supervisory
exercise) and how markets react to their publication and disclosures may therefore offer useful
insights into the importance and implications of stress test methodologies and disclosure
requirements. We also examine the market pricing impact for both bank shareholders and
creditors, which could be different due to the implications that stress test outcomes may
entail for the two types of investors.
3 The 2014 and 2016 Stress Tests
The ECB 2014 Comprehensive Assessment included an Asset Quality Review (AQR) and
a stress test. The scope of the 2014 CA was significantly larger than that of previous
EBA stress tests, with more granular information disclosed and extensive quality assurance.
The AQR involved the analysis of 119,000 debtors and 170,000 collateral items, while the
stress test implied granular analysis of 40 million data points (around 300,000 per bank).
7The information asymmetry was proxied by equity and credit bid-ask spreads.
ECB Working Paper 2054, May 2017 10

The quality assurance process involved a significant number of ECB top-down models, was
automated and data driven, targeting the material deviations that were identified between
the banks’ own (bottom-up) estimates and those of the ECB (top-down).8 In addition, the
2014 adverse scenario was widely considered to be more severe - and more credible - than
those of past EU-wide stress test exercises. By linking the disclosed capital shortfalls with
mandatory equity issuance, the CA was meant to improve the resilience of banks and increase
confidence across the European banking sector. The capital plans of banks identified with a
shortfall were assessed by the ECB Supervisory Board and challenged by the joint supervisory
teams of the newly founded Single Supervisory Mechanism (SSM). Finally, the starting point
figures used for the projections were revised figures resulting from the AQR. This feature of
the 2014 stress test is essential as the magnitude of this correction in conjunction with the
stress test results enables an interpretation of the market reaction to the stress tests results
conditional on the bank-specific disclosure quality.
The AQR was intended to be point-in-time assessment of the accuracy of the carrying value
of banks’ assets as of December 2013. For the banks to be included in the Single Supervisory
Mechanism (SSM), the results of the AQR were used as a starting point for the stress test.
The stress test was a forward looking examination of the resilience of banks’ solvency to two
hypothetical scenarios. The minimum required capital under the baseline scenario was set
to 8%. The minimum required capital under the adverse scenario was 5.5%.
The 2014 stress test was jointly undertaken by the 130 participating banks, National Compe-
tent Authorities, the ECB and the European Systemic Risk Board (ESRB). We also include
in our sample the 10 non-euro area banks that were part of the EBA stress test but will not
be part of the SSM.
The AQR revealed that bank asset values need to be adjusted by e 48 billions. The pub-
lication of stress test results showed that the adverse scenario would deplete banks’ capital
by e 263 billion, reducing the median CET1 ratio by 4 percentage points from 12.4% to
8.3%. A combined capital shortfall of e 25 billion was detected for 25 participating banks.
Considering the capital-rasing actions in 2014, 8 banks would have fallen below the capital
threshold of 5%.
Unlike the 2014 stress test, the 2016 stress test did not stipulate a ’pass-fail’ CET1 ratio
threshold implying that the stress test results would not automatically result in a manda-
tory capital issuance. This is an important difference to the 2014 stress test. However, the
results of the stress test are an important input into the supervisory review process. The
8See ECB (2014), ”Asset Quality Review - Phase 2 Manual”, March; and ECB (2014), ”ComprehensiveAssessment Stress Test Manual, August.
ECB Working Paper 2054, May 2017 11

EBA clarified during the execution phase of the stress test that the results will be part of
the supervisory guidance. This guidance does not constitute a legal minimum and does not
impact the maximum distributable amount. ECB also clarified that for what concerns SSM
significant institutions taking part in the exercise, the stress test results ”...contribute in a
non-mechanistic way as one of several input factors to determine Pillar 2 capital in the ECBs
overall Supervisory Review and Evaluation Process (SREP)”. It also clarified that the stress
test results ”are used by the ECB in Pillar 2 guidance, taking additionally into account
consequences of the static balance sheet assumption and banks mitigating management ac-
tions among other factors.”9 The ECB did however clarify in separate communication that a
benchmark for how stress test results are treated in the SREP would be the banks’ adverse
scenario results in relation to a CET1 ratio of 5.5% or, in the case of global systemically
important banks (G-SIBs), 5.5% plus the G-SIB buffer. Markets could therefore interpret
banks falling below this threshold as banks failing the stress test and thus require some form
of recapitalisation (even if filling the shortfall would occur in a less mechanistic manner and
subject to more supervisory discretion, compared to the 2014 exercise). Overall, the adverse
scenario led to a 380 bps drop in the starting point CET1 ratio of 13.2% by the end of the
three-year scenario horizon. The fully-loaded CET1 ratio fell from 12.6 to 9.2% while the
aggregate leverage ratio dropped from 5.2 to 4.2% in the adverse scenario.
4 Methodology
Empirical Method
In order to gauge the impact of the stress test-related events we employ an ’event study’
approach. For this purpose, we estimate cumulative returns and cumulative excess returns
around the stress test events (i.e. announcements of the exercises, publication of key features
such as methodologies and scenarios, publication of results). Table 7 provides an overview
of the key events during the 2014 CA and the 2016 stress test exercises that we analyse.
A number of strategies for the estimation of excess returns exist.10 Excess returns of a
security are traditionally defined as the actual ex-post return over the event window minus a
normal return of the same security of the event window. The normal return is the expected
return without conditioning on the event taking place or taking into account external factors.
Other event studies on related topics use one or two factor models to control for external
9See ECB Banking Supervision press release 29 July 2016.10For a review of methodologies, see Brown and Warner (1985) and MacKinlay (1997).
ECB Working Paper 2054, May 2017 12

factors. Peristian et al. (2010) regress the daily stock return on the market return only,
proxied by the S&P financial index, Cardinali and Nordmark (2011) employ a univariate
model and use the MSCI World Index, while Jordan et al. (2000) use two versions of a
two-factor model.
For the purpose of our assessment, we also employ a standard method whereby for all banks
and sovereigns we compute excess returns relative to the market; that is, we employ a ”market
model” approach (MacKinlay (1997)). These are computed as the residuals from a set of
regression equations (one equation for each sovereign and bank) that relate the individual
bank and sovereign market prices to market dynamics. Each bank (sovereign) i is regressed
on the set of two common regressors: the day-on-day returns of the financial and sovereign
indices.
Rt,i=α0 + α1Rfint + α2R
sovt + εt,i . (4.1)
where Rt,i is the return on bank i (or sovereign i) in period t, Rfint is the return on the market
index for banks, and Rsovt is the return of the sovereign CDS index.11 12 Abnormal returns,
i.e. the equations’ residuals, are estimated using a 30 business days rolling window and a
robust Iteratively Reweighted Least Squares (IRLS) method.13 Rolling sets of residuals are
computed for each window. The excess returns implied by the model are given by εt,i. In
the second stage, excess returns over the relevant window around the event date are used to
compute excess/abnormal returns (CARs). The event window considered was 2 days. The
results were robust to alternative window lengths, while the 2-day window turned out to be
more informative (and thus the one reported below in the results section). For the purpose
of assessing the significance of the excess returns, we employ a standard t-test methodology.
11The sovereign CDS index return at a given point in time t is defined as the simple average of theindividual sovereign CDS returns at that time t.
12Our method is not entirely standard with regard to the fact that we include some sovereign returnmeasure on the right hand-side of the equations for the banks, and mirror-wise the bank market returns inthe equations for the individual sovereigns. This feature owes to our presumption that non-negligible linksexist between banks (in particular sizable, systemically relevant ones) and sovereigns, due to various formsof implicit and explicit guarantees that effectively tie the risk pertaining to banks and sovereigns together.Controlling for such known links is therefore warranted.
13IRLS finds the maximum likelihood estimates of a generalized linear model, and in the framework ofrobust regressions finds the M-estimator, as a way to deal with outliers and non-normally distributed databy minimizing the least absolute error rather than the least squared error.
ECB Working Paper 2054, May 2017 13

Data
CDS and stock price data are not available for all banks stress tested in the 2014 and 2016
European exercises.
For what concerns the data on CDS spreads a sample of 62 European stress tested banks
was selected on the basis of availability of CDS spread data. 62 of these banks participated
in the 2014 CA and 36 banks participated in the EBA 2016 stress test.14 In addition, for
the event study on the 2016 stress test exercise we also include in one specification 26 and
14 European banks that were not tested for the CDS and stock event study, respectively,
in order to gauge differences in the market impact around the stress test result publication
between banks included in the exercise and those not being tested (see Table 3 below). For
the 2014 CA, the number of non-stress tested banks for which CDS spreads were available
was not big enough to constitute a reliable ’control’ group. Table 6 provides an overview of
the banks included in our sample.
For each bank and the corresponding sovereign daily 5-year maturity senior CDS, prices were
collected from Datastream, and Bloomberg in those cases where the respective bank CDS
prices were not available on Datastream. Even if the CDS spreads used in the estimations
were observed spreads, they could be highly illiquid, as can be seen in the stale prices for
some banks. The log transformation of CDS spreads in returns leads to zero returns for
these observations. As an example, 5 of the 62 tested banks reported zero returns around
the publication of the 2014 results. These banks were kept in the sample as it was considered
that an abnormal return of zero is also informative.15 Indices for bank CDS and sovereign
CDS spreads are the ITRX Financial and the ITRX Sovx, respectively. Realized volatilities
of these indices are calculated using 5-day rolling windows.
For what concerns equity prices daily stock price data for 45 European banks was obtained
from Bloomberg. 31 one of those banks were stress tested in the 2014 and 2016 exercises,
while 14 banks were not participating in the stress tests but were included as a non-tested
14Only for 62 of the 140 banks participating in the 2014 EBA stress test CDS data was available. 10non-euro area EU banks were included in the 2014 EBA stress test but not in the CA. The 2016 stress testsample included 51 banks covering around 70% of total assets in each country in the EU. 37 out of these 51bank are supervised by the ECB. CDS data was available for 36 banks included in the EBA sample.
15For 51 of the 59 banks for which CDS data was available on Datastream the veracity score was available.The veracity score indicates the type of price used in calculating the CDS spread. A score value of 1 indicatesan observed market spread while a score value of 2 indicates a derived spread. For at least 70% of the 51banks, the veracity score is lower than 1.5 on average during the estimation and event period for both the2014 and the 2016 stress test. The average veracity score ranges from 70% for the abnormal returns estimatedaround the results publication for the 2014 stress test and 76% for the abnormal returns estimated aroundthe announcement of the 2014 stress test.
ECB Working Paper 2054, May 2017 14

’control’ group (see Table 3 below).
The impact on sovereign CDS spreads following stress test publications could be particularly
pronounced for countries where banks hold large sovereign exposures. The absolute exposure
of each bank to all regions is weighted by the CDS spreads of the respective sovereigns and
expressed relative to the total assets of each bank.
Sov. exp. banki=30∑j=1
{Net direct position bank i to country jTAi
x CDSSj × 100}30∑j=1
CDSSj
where CDSS and TA refer to the CDS spread of sovereign j and bank i’s total assets, re-
spectively. For each bank, the sovereign exposures per country was obtained from the 2014
and 2016 stress test databases available on the EBA website. Accounting values gross of
provisions were used.16
5 Results
Hypothesis 1: Did the 2014 and 2016 stress tests reveal new infor-
mation?
The disclosure of stress test information involves a trade-off between fostering transparency
and possibly adversely affecting financial stability. On the one hand, more transparency
improves market investors’ ability to discriminate between banks and may enhance incentives
for prompt corrective action by identifying banks with capital shortfalls. On the other hand,
disclosure of bad news about banks that are already under financial strain can lead to market
overreaction and hurt financial stability. This is particularly harmful when the precision of
the disclosed information is low, as market participants will place too much weight on the
public signal (see Morris and Shin (2002)). Moreover, more disclosure improves transparency
only if it is effective in reaching market participants. Information that is not considered to
be sufficiently precise, for example due to an ill-designed disclosure template or due to
market perception that the quality assurance process cannot prevent banks from engaging
in ’beauty contests’, will not achieve this objective. It could also be that the information
disclosed in the stress test was anticipated. Even though in theory supervisors have an
informational advantage over market participants, it cannot be ruled out that in some cases
16In the EBA statistical dictionary this corresponds to gross direct exposures, item number 993301.
ECB Working Paper 2054, May 2017 15

private information is more timely than the information disclosed by the supervisor (see
Berger et al. (2000)).
If market participants had doubts about the reliability of the disclosed information or if
they could anticipate the stress test results, we should observe abnormal returns that are
not statistically different from zero around the stress test-related events (announcement,
clarification of key features and results publication). In contrast, significant abnormal excess
returns suggest that the stress test-related events revealed new information (our Hypothesis
1).
Figure 1. Bank CDS and Equity Abnormal Returns - Stress Test 2014
(a) CDS abnormal returns (b) Stock abnormal returns
Figure 1 shows the cross-sectional distribution of abnormal bank CDS and equity returns
of tested banks around the publication of the 2014 stress test results. Positive abnormal
bank CDS returns were reported in the days before the results publication, presumably in
response to the speculation in the media regarding the magnitude of the downward revisions
(left-hand panel). The negative abnormal returns around the publication date could be
interpreted as a relief following these conservative expectations. Looking at abnormal stock
returns (right-hand panel), there seems to be significant cross-sectional heterogeneity in the
days before the publication. After the publication of results, abnormal stock returns became
negative for most banks and recovered in the following days. It is also noticeable that
while mean abnormal returns were overall mostly hovering around zero there were tails of
the distribution where the market impact around the stress test event differed substantially
from zero. The cross-distributional effects will be explored further below (Hypothesis 2).
Similarly, Figure 2 shows the cross-sectional distribution of abnormal bank CDS and equity
returns around the publication of the 2016 stress test results. Negative abnormal returns
ECB Working Paper 2054, May 2017 16

can be observed in the days before the publication of the results, with CDS returns changing
sign after the publication date. The comparison of the two figures suggests that in the case
of CDS markets, the different sign of the CDS abnormal returns in the 2016 exercise may be
due to different ex-ante expectations compared to the 2014 stress test.
Figure 2. Bank CDS and Equity Abnormal Returns - Stress Test 2016
(a) CDS abnormal returns (b) Stock abnormal returns
In order to test Hypothesis 1, Tables 1 and 2 report the abnormal returns obtained from the
CDS and stock event study in the 2014 and 2016 stress tests, respectively. Throughout this
paper, the sign of the abnormal returns is interpreted as a revision of previous expectations
conditional on the new information revealed by the various stress test events.
Table 1 (upper panel) shows that the announcement of the 2014 stress test in late January
2014 as well as the announcement of the key features (incl. methodology and scenarios)
in April 2014 resulted in positive abnormal CDS returns for tested banks (and significant
negative abnormal stock returns following the announcement of key features, as can be seen
in the lower panel in table 1). This could be due to uncertainty on the financial position
and resilience of tested banks and their ability to raise the amount of capital revealed by the
stress test.17 At the time of the publication of the results in October 2014, however, markets
seemed to have largely priced in the results as reflected in the non-significant abnormal
(negative) CDS and stock returns.
The comparison of the results of the CDS and stock market event study is of interest because
17Banks with shortfalls had to submit capital plans by the 10th of November 2014. These plans were to beevaluated by the Supervisory Board by December 2014, while the joint supervisory teams would be in chargeof assessing the adequacy and credibility of capital plans. Banks would then have to cover the shortfallswithin 6 months for shortfalls identified in the AQR or stress test baseline scenario and within 9 months forshortfalls identified in the stress test adverse scenario.
ECB Working Paper 2054, May 2017 17

creditors and stock holders may have different incentives with respect to the disclosure
of stress test information. More information can be beneficial for creditors due to lower
monitoring costs, while mandatory capital actions as a result of the stress test decreases
the default probability and hence the funding cost. In contrast, mandatory equity issuance
can be detrimental for equity holders due to its a diluting effect on share values. From this
perspective, although the results did not trigger large abnormal returns, it is nevertheless
interesting to observe that the direction of returns pointed to a (slight) improvement in
banks’ default probability as reflected in negative CDS spreads while the value of bank
stocks declined on average.
Turning to the 2016 stress test Table 2 (upper panel) shows that for the 2016 exercise CDS
abnormal returns the opposite pattern can be observed. While the announcement of the
key features of the scenario and stress test methodology in February 2016 led to negative
abnormal CDS returns, these positive expectations were reverted upon results publication
following which significantly positive abnormal CDS returns were observed. This finding is
corroborated by the comparison of CDS abnormal returns between stress tested and non-
stress tested banks, as illustrated in the upper panel of Table 3, which shows that tested banks
experienced significantly higher CDS abnormal returns than non-tested banks. Likewise,
when looking at the stock price reactions (lower panel of Table 2), excess stock returns are
found to be significant and negative both in relation to the announcement of key features and
following the publication of results. One reason could be that 2016 stress test results were
assessed by market participants to have been worse than anticipated.18 Another reason could
be that the 2016 exercise did not foresee any fail and pass threshold or mandatory capital
issuance. As a result, creditors of problematic banks would not benefit from the improved
solvency following mandatory regulatory capital issuance.19 Another potential explanation
may be that the results for tested banks are driven by the banks with a poor performance
in the stress test, and for which the publication of the stress test results led to a downward
revision of market expectations (to be explored more in detail below). Additional generalised
uncertainty may have been created by the impact of the Brexit - which was clearly not part
of the macro scenario - on UK and possibly other European banks.20
The next section sheds more light on the drivers of this result by analyzing cross-sectional
differences across the various sub-samples.
18The decrease in CET1 ratio is of similar magnitude in the 2014 versus 2016 stress test, with a 380 bpsdecline in the starting point CET1 ratio in 2016 versus 300 bps in 2014 (including the AQR correction).
19This notwithstanding, mainly due to substantial capital raising efforts between 2014 and 2016, only oneof the 51 banks fell below the 5.5% that was relevant in the 2014 stress test.
20The UK referendum on EU membership took place on 23 June 2016, approximately one month prior tothe release of the stress test results.
ECB Working Paper 2054, May 2017 18
Hypothesis 2: Did the stress test improve price discrimination?
Banks are relatively opaque institutions whose assets are difficult to evaluate by external
parties, for example creditors, regulators and market participants. This information asym-
metry (possibly combined with the implicit government guarantee for banks) can result in a
disconnect between banks funding costs and their risk profile. As a consequence, the ability
of creditors to distinguish between ’good banks’ and ’bad banks’ can be impaired, especially
during periods of heightened uncertainty. This may result in inefficient resource allocations
at the expense of depositors and taxpayers. In this context, mandatory disclosure via stress
tests can overcome the above mentioned inefficiency and improve price discrimination as
stipulated by Hypothesis 2.
The upper panel in Table 4 shows that after the publication of the 2014 stress test results,
banks with a large CET1 impact resulting from the AQR report significantly higher negative
CDS abnormal returns than banks with a low impact. We interpret the negative abnormal
returns as evidence for the revision of previous conservative estimates on the magnitude of
the capital shortfall and/or the AQR corrections. This result suggests that the disclosure
of the CA results enhanced price discrimination. This finding is confirmed when looking
at the excess stock returns in the lower panel in Table 4 which displays significant, more
negative abnormal returns for banks performing worse in the stress test (in terms of CET1
ratio impact). Thus, looking at the different sub-samples in the lower panel in Table 4,
it seems that stock markets do discriminate between ’good’ and ’bad banks’: Banks with
a large CET1 impact resulting from the AQR and the stress test adverse scenario report
negative abnormal returns, while banks that are well capitalised after the adverse scenario
and the AQR correction report positive abnormal returns. The difference between the two
groups is statistically significant. This could reflect that regulatory actions implied by the
stress test are seen as detrimental to shareholders.
In contrast, for the 2016 stress test, Table 5 shows that capital-constrained banks - as
measured by the adverse baseline gap - reported significantly higher positive excess returns
after the publication of stress test results compared to better capitalized banks. A similar
reaction can be observed for stock markets in the lower panel in Table 5. Poorly capitalized
banks under the adverse scenario reported higher negative returns compared to banks with
a high capital buffer. Thus, it seems that the publication of the stress test results improved
the price discrimination between ’good’ and ’bad’ banks.
The above disconnect between CDS and stock markets cannot be observed for the 2016
stress test. The reason may be the different setup of the 2016 stress test, with the creditors
ECB Working Paper 2054, May 2017 19

benefitting from compulsory remedial capital actions in the 2014 but not in the 2016 stress
test. Another explanation could be the different ex-ante expectations of creditors with
respect to bank performance.
Taken together, the results of both the 2014 and 2016 stress test suggest that that price
discrimination was enhanced to the extent that previous expectations on well versus poorly
capitalized banks were revised. Even if the pricing before the stress test results publication
was already reflecting these risk characteristics of tested banks, the new information revealed
by the stress test is reflected in the lower/higher than expected downward correction.
Hypothesis 3: Bank-sovereign risk spillover
The size of banks’ sovereign exposure can be seen as a measure of the strength of the link
between the bank and the sovereign. Sovereign distress can directly affect banks through
their holdings of sovereign bonds, while a fragile banking sector increases the contingent
liabilities of the sovereign, further deteriorating the financial position of banks with a large
sovereign exposure.21
Looking at the 2014 stress test, Table 1 (mid panel) shows that sovereign CDS spreads reacted
in similar ways as those of the tested banks. For example, at the time of the clarification
of the methodology sovereign CDS excess returns were significantly positive while they were
followed by significantly negative abnormal returns upon the publication of the stress test
results. The latter result could reflect that capital shortfalls identified in the 2014 CA were
deemed small enough (and perhaps smaller than a priori expected) for banks to be able to
address them via private solutions without having to rely on the sovereign.
At the same time, the middle panel in Table 4 provides evidence for the risk transfer from
the bank to the sovereign after the publication of the CA results in October 2014, with the
sovereign CDS spreads of banks with a large CET1 impact resulting from the Comprehensive
Assessment reporting significantly larger negative abnormal returns than the sovereign of
banks with a low CA CET1 impact. The same pattern can be observed for the reaction of
the sovereign of banks with large (small) sovereign exposure; that is, for sovereigns which
exhibit a stronger link to domestic banks.22
21See e.g. Acharya, Drechsler and Schnabl (2014), Gennaioli et al. (2014) and Faia (2016).22This is not in line with Breckenfelder and Schwaab (2015) who find no significant relation between the
reaction of bank CDS spreads and their respective sovereign. The authors interpret the stronger reaction ofsovereign CDS in non-stressed countries to changes in bank CDS spreads and equity in stressed countriescompared to non-stressed countries as evidence of a risk transfer from the last to the former group ofcountries. Differences in results could be attributed to differences in the econometric setting, as Breckenfelder
ECB Working Paper 2054, May 2017 20

In contrast, for the 2016 stress test the link between the bank and the respective sovereign is
less pronounced. The middle panel in Table 3 shows that the sovereign of stress tested banks
reported significantly higher negative abnormal CDS returns compared to non-tested banks
after the publication of key features of the stress test. These expectations were reverted
upon results publication. The middle panel in Table 5 suggest that the results are driven
mostly by the sovereign of banks experiencing a low CET1 buffer under the adverse scenario.
Overall, the results of the 2014 stress test provide evidence that the bank-sovereign link is
priced by the markets, thus confirming Hypothesis 3. The large negative sovereign abnormal
CDS returns observed after the publication of the 2014 results suggest that creditors were
relieved to learn the lower than expected capitalization needs weighing on the fiscal position
of the sovereign. The comparison with the 2016 results suggests that in the context of the
stress test, this relation depends on particular features of the exercise. In particular, it
seems intuitive that this relation is stronger when the stress test features a ’fail and pass’
threshold, followed by mandatory capital issuance, implying a potential need for the sovereign
to recapitalize ’bad banks’ after the stress test. A further explanation could be that at the
time of the 2016 stress test markets were already well informed about the extent of banks’
sovereign exposures following the EBA’s ’transparency exercises’ of previous years as well
as the ECB’s Comprehensive Assessment in 2014. The news content of the 2016 stress test
disclosures related to sovereign exposures may therefore have been limited.
6 Conclusions
The aim of the analysis presented in this paper was to gauge whether the 2014 and 2016 Eu-
ropean stress tests, and their related individual bank disclosures, provided new information
to the market, affecting the pricing of banks’ cost of funding and stock prices as well as the
funding costs of their sovereigns.
For this purpose, we tested three hypotheses. We first conjectured that stress tests may reveal
new information about the banks being stress tested and therefore impact their market-based
funding costs and stock prices. The second hypothesis is that the publication of stress test
results improved price discrimination in terms of allowing markets to better discriminate
and Schwaab (2015) are using a difference-in-difference estimator compared to an event study setting inthis paper, while the time horizon is considerably longer, 14 days versus 2-5 days for the event window inthis paper. More importantly, the authors seem to interpret a negative correlation between the change inbanks and sovereign CDS spreads as evidence of a weak bank-sovereign link. However, a strong negativecorrelation can also be interpreted as evidence of a risk transfer from the bank to the respective sovereign.
ECB Working Paper 2054, May 2017 21

between ’good’ banks and ’bad’ banks. The third hypothesis is that the stress test, in par-
ticular the 2014 CA, may have affected the CDS prices of the sovereigns of banks being stress
tested. For what concerns Hypothesis 1, the results show that both the announcement of the
key features of the stress test and the publication of results revealed new information that
was priced by markets, as reflected in statistically significant abnormal returns. With respect
to whether markets became better at discriminating ’strong’ and ’weak’ banks (Hypothesis
2) we also find that the market price impact differs across the banks when we measure banks
according to how well they perform in the stress tests. As regards the third hypothesis we
provide evidence that sovereign funding costs were somewhat affected by the publication of
stress test results.
Moreover, especially in the context of the 2014 Comprehensive Assessment we find that stock
market and debt market price reactions went in opposite directions. This may reflect that
creditors and stock holders have different incentives with respect to the disclosure of stress
test information. For instance, regulatory or voluntary capital raising needs uncovered by the
stress test may be detrimental to shareholders as their shares would be diluted. In contrast,
creditors seem to be more focused on the solvency of the banks which should be improved
by capital raising following the stress test. The disconnect between CDS and stock prices
cannot be observed for the 2016 stress test. The reason may be the different setup of the
2016 stress test, with the creditor benefitting form remedial capital actions in the 2014 but
not in the 2016 stress test. Another explanation could be the different ex-ante expectation
of creditors with respect to bank performance.
Overall, our study provides insights into the effects and usefulness of stress test-related
disclosures. It is shown that the most recent EU-wide stress tests provided value added in
terms of providing new information to the market, which by enhancing market efficiency
provided support to the broader micro- and macroprudential uses of the stress tests aiming
at safeguarding financial stability.
ECB Working Paper 2054, May 2017 22

7 Appendix
Table 1: Cumulative Excess CDS and Stock Returns (2014 Stress Test)
Event\Sample N Obs Mean Std Dev Min Max
Bank CDS CARAnnouncement 61 0.07* 0.03 -0.15 0.09Key Features 61 0.029*** 0.04 -0.03 0.19CAST Manual 61 -0.009 0.05 -0.12 0.27Results 61 -0.001 0.03 -0.13 0.08Sovereign CDS CARAnnouncement 61 -0.001 0.01 -0.02 0.03Key Features 61 0.011*** 0.02 -0.03 0.03CAST Manual 61 0.010*** 0.03 -0.06 0.08Results 61 -0.026*** 0.04 -0.12 0.03Stock CARAnnouncement 33 0.008 0.04 -0.07 0.12Key Features 33 -0.018*** 0.02 -0.08 0.02CAST Manual 33 -0.001 0.08 -0.11 0.37Results 33 -0.014 0.07 -0.11 0.28
The table reports the summary statistics of the cumulative abnormal CDS and stock returns oftested banks and the corresponding sovereigns around the 2014 stress test related events. The an-nouncement event refers to 31/01/2014, the date when the 2016 stress test was announced. Thekey features of the stress test were clarified on the 29/04/2014. The Comprehensive Assessmentand Stress Test (CAST) was published on the 08/08/2016. The stress test results were publishedon the 26/10/2014. ***, **, * indicate p-values below 0.01, 0.05 and 0.1 respectively.
ECB Working Paper 2054, May 2017 23

Table 2: Cumulative Excess CDS and Stock Returns (2016 Stress Test)
Event\Sample N Obs Mean Std Dev Min Max
Bank CDS CARAnnouncement 36 0.005 0.023 -0.028 0.108Key Features 36 -0.016** 0.044 -0.120 0.096Results 36 0.028*** 0.042 -0.021 0.227Sovereign CDS CARAnnouncement 36 0.022** 0.06 -0.04 0.19Key Features 36 -0.037*** 0.02 -0.08 0.00Results 36 0.006*** 0.01 -0.01 0.02Stock CARAnnouncement 31 -0.002 0.012 -0.039 0.029Key Features 31 -0.062*** 0.024 -0.123 -0.022Results 31 -0.008** 0.017 -0.064 0.034
The table reports the summary statistics of the cumulative abnormal CDS and stock returns oftested banks and the corresponding sovereigns around the 2016 stress test related events. The an-nouncement event refers to 5/11/2016, the date when the 2016 stress test was announced. The keyfeatures of the stress test were clarified on the 24/02/2016. The stress test results were publishedon the 29/07/2016. ***, **, * indicate p-values below 0.01, 0.05 and 0.1 respectively.
Table 3: Cumulative Excess CDS and Stock Returns (2016 Stress Test)
Event/Sample Tested Not Tested t test
Banks CDS CARAnnouncement 0.005 0.008 0.69Key Features -0.016 -0.012 -0.27Results 0.028 0.005 2.61**Sovereign CDS CARAnnouncement 0.022 0.000 1.65*Key Features -0.036 -0.045 1.61*Results 0.006 0.003 0.98Stock CARAnnouncement -0.002 0.027 -2.12**Key Features -0.062 -0.063 0.11Results -0.008 -0.001 -1.09
The table reports the average excess CDS and stock returns of banks and the correspondingsovereigns CDS abnormal returns around the 2016 stress test events. The CDS event study in-cludes 36 tested banks and 26 non-tested banks. The stock return event study includes 31 testedand 14 non-tested banks. The announcement event refers to 5/11/2016, the date when the 2016stress test was announced. The key features of the stress test were clarified on the 24/02/2016.The stress test results were announced on the 29/07/2016. ***, **, * indicate p-values below 0.01,0.05 and 0.1 respectively.
ECB Working Paper 2054, May 2017 24

Table 4: Cumulative Excess Returns (2014 Stress Test)
Sample Sub-sample 1 Sub-sample 2 t test
Bank CDS CARLarge vs small CA CET1 impact -0.006 0.006 -1.16Large vs small sovereign exposure 0.001 -0.005 0.67Large vs small AQR CET1 buffer -0.008 0.009 -1.99**Small vs large CET1 buffer 0.001 -0.001 0.35Sovereign CDS CARLarge vs small CA CET1 impact -0.033 -0.031 -1.41*Large vs small sovereign exposure -0.051 -0.003 -5.1***Large vs small AQR CET1 buffer -0.034 -0.029 -0.4Small vs large CET1 buffer -0.037 -0.03 -1.1Stocks CARLarge vs small CA CET1 impact -0.038 0.008 -2.1**Large vs small sovereign exposure -0.047 0.017 -3.1***Large vs small AQR CET1 buffer -0.043 0.016 -2.77***Small vs large CET1 buffer -0.024 -0.005 -0.77
The first two columns report the average excess returns after the publication of the stress testresults on the 26/10/2014. The last column reports the values of the t statistic comparing the re-spective sub-samples. The large/small sub-samples refer to average returns of banks for which theCET1 impact after the Comprehensive Assessment (CA) or alternatively capital buffers/sovereignexposures are above (below) the median. The first two panels report the excess CDS returns of the62 tested banks and the respective sovereign. The lower panel reports the stock excess returns of33 tested banks. The CET1 impact after the CA refers to the decrease in CET1 capital ratio dueto the stress test adverse scenario and the AQR. The CET1 impact resulting from the AQR refersto credit exposure corrections before any offsetting effects. The capital buffer refers to the CET1capital ratio above 7% in the adverse scenario. For each bank, the sovereign exposures per countrywas obtained from the 2014 stress test database available on the EBA website. ***, **, * indicate(one-sided) p-values below 0.01, 0.05 and 0.1 respectively.
ECB Working Paper 2054, May 2017 25

Table 5: Cumulative Excess Returns (2016 Stress Test)
Sample Sub-sample 1 Sub-sample 2 t test
Bank CDS CARLarge vs small adverse baseline gap 0.043 0.013 2.26**Large vs small sovereign exposure 0.036 0.021 1.07Small vs large CET1 buffer 0.023 0.034 -0.82Sovereign CDS CARLarge vs small adverse baseline gap 0.004 0.007 -0.86Large vs small sovereign exposure 0.005 0.006 -0.53Small vs large CET1 buffer 0.009 0.003 1.79*Stocks CARLarge vs small adverse baseline gap -0.008 -0.008 -0.05Large vs small sovereign exposure -0.006 -0.010 0.7Small vs large CET1 buffer -0.012 -0.004 -1.51*
The first two columns report the average excess returns after the publication of the stress testresults on the 29/07/2016. The last column reports the values of the t statistic comparing therespective sub-samples. The large/small sub-samples refer to average returns of banks for whichthe gap between the baseline and adverse CET1 ratios in the stress test or alternatively capitalbuffers/sovereign exposures are above (below) the median. The first two panels report the excessCDS returns of the 36 tested banks and the respective sovereign. The lower panel reports the stockexcess returns of 31 tested banks. The capital buffer refers to the CET1 capital ratio above 7% inthe adverse scenario. For each bank, the sovereign exposures per country was obtained from the2016 stress test database available on the EBA website. ***, **, * indicate (one-sided) p-valuesbelow 0.01, 0.05 and 0.1 respectively.
ECB Working Paper 2054, May 2017 26

Table 6: Sample of Banks (2014 and 2016 Stress Test)
EBA Identifier Bankname Tested 2016 Tested 2014
AT001 Erste Group Bank AG Yes YesAT002 Raiffeisen Zentralbank sterreich AG Yes YesBE005 KBC Group NV Yes YesDE017 Deutsche Bank AG Yes YesDE018 Commerzbank AG Yes YesDE019 LB.Baden-Wuertemberg Yes YesDE021 Bayerische Landesbank. Yes YesDE026 LB.Hessen-Thuringen Yes YesDK008 Dankse bank Yes YesES059 Banco Santander, S.A. Yes YesES060 Banco Bilbao Vizcaya Argentaria, S.A. Yes YesES064 BANCO POPOLAR ESPN. SA Yes YesES065 BANCO SABADELL SA Yes YesFR013 BNP Paribas Yes YesFR014 Groupe Crdit Agricole Yes YesFR016 Socit Gnrale Yes YesFR117 Banque Fedv Yes YesGB088 Royal Bank of Scotland Group Yes YesGB089 HSBC Holdings Plc Yes YesGB090 Barclays Bank Plc Yes YesGB091 Lloyds Bank Plc Yes YesIE037 Allied Irish Banks plc Yes YesIE038 Bank of Ireland Yes YesIT040 Intesa Sanpaolo S.p.A. Yes YesIT041 UniCredit S.p.A. Yes YesIT042 Banca Monte dei Paschi di Siena S.p.A. Yes YesIT043 Banco Popolare - Societ Cooperativa Yes YesIT044 UBI Banca Yes YesNL047 ING Bank NV Yes YesNL048 Rabobank Yes YesNL049 ABN Amro Bank N.V. Yes YesNO051 DnB NOR Bank ASA Yes YesSE084 Nordea Bank AB (publ) Yes YesSE085 Skand Enskilda Banken AB Yes YesSE086 Svenska Handelsbanken AB (publ) Yes YesSE087 Swedbank AB (publ) Yes YesAT104 BAWAG P.S.K No YesBE004 Dexia NV No YesDE020 DZ BANK AG No YesDE025 HSH Nordbank AG No YesDE130 IKB Deutsche Industriebank AG No YesES061 Bankia SA No YesES062 La Caja des Ahorros y Pensiones No YesES069 Bankinter, S.A. No YesGR030 Eurobank Ergasias, S.A. No YesGR031 National Bank of Greece, S.A. No YesGR032 Alpha Bank, S.A. No YesGR033 Piraeus Bank, S.A. No YesIE039 Permanent LTD No YesIT145 Mediobanca - Banca di Credito Finanziario S.p.A. No YesIT147 Banca Popolare Di Milano No YesPT053 Caixa Geral des Deposits No YesPT054 Banco Comercial Portugues, SA No YesPT056 Banco BPI, SA No YesCH001 Credit Suisse No NoCH002 UBS AG No NoDE024 WESTLB AG No NoES083 Caja del Ahorros del Med No NoFR113 Natixis No NoGB192 Nationwide Building Society. No NoGB193 Standard Chartered No NoPT055 Banco Espirito Santo No No
ECB Working Paper 2054, May 2017 27

Table 7: Stress Test Events
2014 Stress Test
Announcement 31/01/2014Key Features 29/04/2014CAST Manual 08/08/2018Publication 26/10/2014
2016 Stress TestAnnouncement 05/11/2015Key Features 24/02/2016Publication 29/07/2016
The table reports the dates of each of the events considered in the 2014 and 2016 event study. The’Announcement’ event refers to the date when the EBA announced a new stress test. ’Key Fea-tures’ refers to the date when clarifications on the stress test methodology and the scenario werepublished. ’CAST Manual’ refers to the publication of the Comprehensive Assessment manual bythe ECB, containing further details on the quality assurance process. The ’Results’ event refer tothe date when the stress test results were published.
ECB Working Paper 2054, May 2017 28

Fig
ure
3.
2014
EB
AStr
ess
Tes
tC
um
ula
tive
2-day
(pos
tev
ent)
exce
ssre
turn
s-
AQ
RC
ET
1Im
pac
t(b
ps)
Not
e:T
he
left
axis
show
sth
ecu
mu
lati
ve2-
day
pos
tev
ent
exce
ssC
DS
retu
rns
afte
rth
est
ress
test
resu
lts
pu
bli
cati
onon
the
26/1
0/20
14.
Th
eri
ght
axis
show
sth
eC
ET
1im
pac
tre
sult
ing
from
AQ
Rcr
edit
exp
osu
reco
rrec
tion
sb
efor
ean
yoff
sett
ing
effec
tsex
pre
ssed
inp
erce
nt.
Aver
age
larg
e(s
mal
l)C
ET
1im
pact
refe
rsto
the
aver
age
cum
ula
tive
exce
ssre
turn
sfo
rth
eb
anks
wit
hth
eC
ET
1im
pac
th
igh
er(l
ower
)th
anth
em
edia
n.
ECB Working Paper 2054, May 2017 29
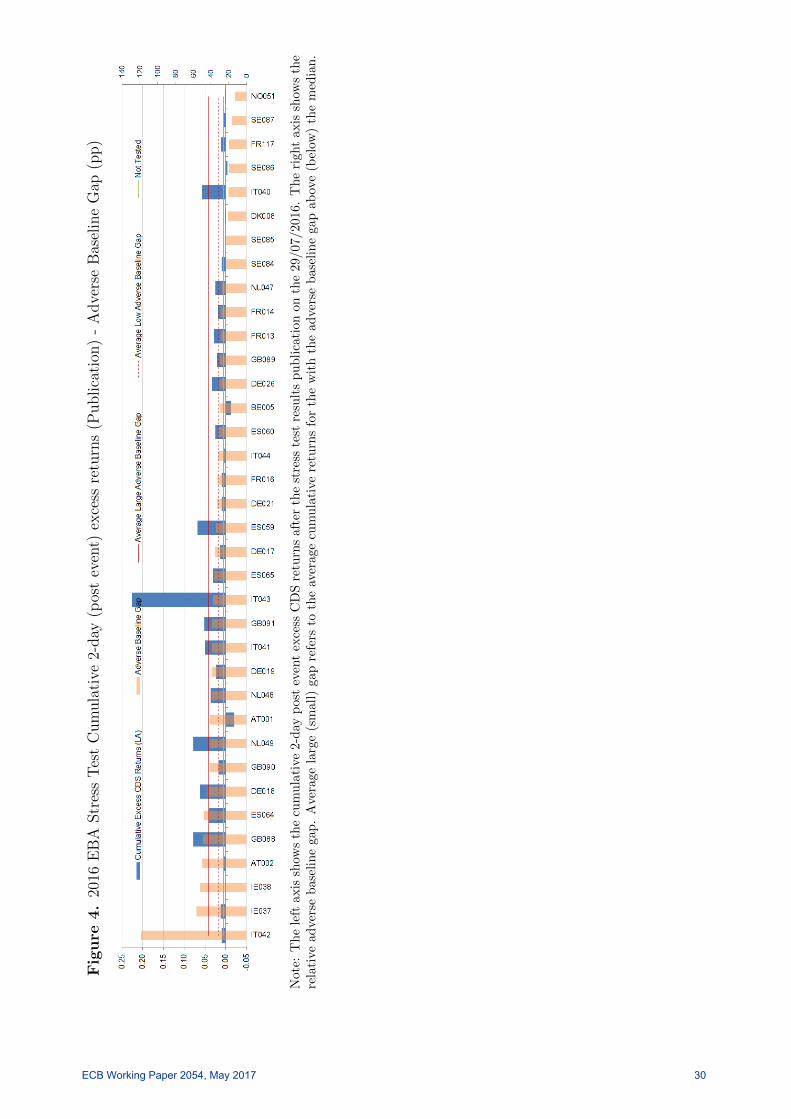
Fig
ure
4.
2016
EB
AStr
ess
Tes
tC
um
ula
tive
2-day
(pos
tev
ent)
exce
ssre
turn
s(P
ublica
tion
)-
Adve
rse
Bas
elin
eG
ap(p
p)
Not
e:T
he
left
axis
show
sth
ecu
mu
lati
ve
2-d
ayp
ost
even
tex
cess
CD
Sre
turn
saf
ter
the
stre
sste
stre
sult
sp
ub
lica
tion
onth
e29
/07/
2016
.T
he
right
axis
show
sth
ere
lati
vead
ver
seb
asel
ine
gap
.A
vera
gela
rge
(sm
all)
gap
refe
rsto
the
aver
age
cum
ula
tive
retu
rns
for
the
wit
hth
ead
vers
eb
asel
ine
gap
abov
e(b
elow
)th
em
edia
n.
ECB Working Paper 2054, May 2017 30

References
Andersen, T., Bollerslev, T., Diebold, F. and Vega, C. (2003), “Micro effects of macro announce-
ments: real-time price discovery in Foreign Exchange”, American Economic Review, Vol. 93,
38-62.
Abramowitz, M. and Stegun, I.A. (1960), “Handbook of mathematical functions”, volume 9, Dover
Publications, New York.
Acharya, V. and Steffen, S. (2014a), “Falling Short of Expectations Stress Testing the Euro-
zone Banking System”, Working Paper, NYU Stern School of Business; available at SSRN:
https://ssrn.com/abstract=2370484 or http://dx.doi.org/10.2139/ssrn.2370484.
Acharya, V. and Steffen, S. (2014b), “Benchmarking the European Central Bank’s Asset Quality
Review and Stress Test: A Tale of two Leverage Ratios”, VOX CEPRs Policy Portal.
Acharya, V., Drechsler, I. and Schnabl, P. (2014), “A Pyrrhic victory? bank bailouts and sovereign
credit risk”, Journal of Finance, 69(6), 2689-2739.
Acharya, V., Pierret, D. and Steffen, S. (2016), “Capital shortfalls of European banks since the
start of the Banking Union”, mimeo, 28 July 2016.
Akerlof, G.A. (1970), “The market for ”lemons”: Quality uncertainty and the market mechanism”,
The Quarterly Journal of Economics, Vol. 84, No. 3, 488-500.
Alter, A. and Beyer, A. (2012), “The dynamics of spillover effects during the European sovereign
debt turmoil”, CFS Working Paper 2012/13, Center for Financial Studies, Goethe University
Frankfurt.
Baillie, R., Booth, G., Tse, Y., and Zabotina T. (2002), “Price discovery and common factor
models”, Journal of Financial Markets, Vol. 5, 309-321.
Barrucci, E., Baviera, R., Milani, C.(2014), “Is the comprehensive assessment really comprehen-
sive?”, SSRN Working Paper.
Beltratti, A. (2011), “Do stress tests carry useful information? Evidence from Europe”, Working
Paper, University of Mannheim.
Berger, A., Sally, D., Flannery, M. (2000), “Comparing market and supervisory assessments of bank
performance: who knows what when?”, Journal of Money, Credit and Banking, 32(3), 641-667.
Bischof, J, and Daske, H. (2012), “Can supervisory disclosure mitigate bank opaqueness and re-
duce uncertainties during a financial crisis? Evidence from the EU-wide stress-testing exercise”,
Bocconi University, Journal of accounting research, 51(5) 997-1029.
ECB Working Paper 2054, May 2017 31

Bosma, J., Koetter, M. and Wedow, M. (2012), “Credit risk connectivity in the financial industry
and stabilization effects of government bailouts”, Discussion Paper 16/2012, Deutsche Bundes-
bank.
Brown, S. and Warner, J. (1985), “Using daily stock returns - The case of event studies”, Journal
of Financial Economics, 14 (3-31).
Breckenfelder H., and Schwaab, B. (2015), “The bank-sovereign nexus across borders”, SSRN
working paper.
Candelon, B. and Amadou, N. (2015), “How do markets react to stress tests”, IMF Working Paper
15/75.
Cardinali, A. and Nordmark, J. (2011), “How informative are bank stress tests? Bank opacity in
the European Union”, Working Paper, Lund University.
CEBS (2010), “Aggregate outcome of the 2010 EU wide stress test exercise coordinated by CEBS
in cooperation with the ECB”, Official Report from the 23.07.2010, Committee of European
Banking Supervisors.
Dungey, M., Fry, R.,Gonzales-Hermosillo, B. and Martin, V. (2004), “Empirical modeling of con-
tagion: a review of methodologies”, IMF Working Paper 04/78, International Monetary Fund.
EBA (2011), “European Banking Authority 2011 EU-wide Stress Test - Aggregate Report”, Official
Report from the 15.07.2011, European Banking Authority.
EBA (2012), “Press Release - EBA publishes final report on the recapitalization of European banks
and paves the way for the transition to the CRDIV framework”, Official Press Release from the
03.10.2012, European Banking Authority.
Ellahie, Atif (2012), “Capital Market Consequences of EU Bank Stress Tests”, Conference Discus-
sion Paper, New York Federal Reserve Bank.
Elliott, D., Feldberg, G. and Lehnert, A. (2013), “The history of cyclical macroprudential policy
in the United States”, FEDS Working Paper.
Faia, E. (2016), “Sovereign risk, bank’s funding and investors’ pessimism”, CEPR Discussion Paper
11340.
Flannery, M., Hirtle, B. and Kovner, A. (2016), “Evaluating the information in the Federal Reserve
Stress Tests”, FRB New York Staff Reports, No. 744.
Frame, W., Gerardi, K. and Willen, P. (2015), “The Failure of Supervisory Stress Testing: Fannie
Mae, Freddie Mac and OFHEO”, FRB Atlanta Working Paper.
ECB Working Paper 2054, May 2017 32

Fraser, D. (1957), “Nonparametric methods in statistics”, John Wiley and Sons, New York.
Gennaioli, N., Martin, A. and Rossi, S. (2014), “Sovereign default, domestic banks and financial
institutions”, Journal of Finance, 69(2), 819-866.
Gao, P. and Jiang, X. (2014), “Reporting discretion, market discipline and panic runs”, Working
Paper, Chicago University.
Gick, W. and Pausch, T. (2012), “Persuasion by stress testing : optimal disclosure of supervisory
information in the banking sector”, Discussion Paper, Deutsche Bundesbank, DP 32/2012.
Goldstein, I. and Sapra, H. (2012), “Should banks stress rest results be disclosed? An analysis
of the costs and benefits”, Working Paper, Prepared for the Committee on Capital Markets
Regulation.
Hale, G. and Krainer, J. and McCarthy, E. (2015), “Aggregation Level in Stress Testing Models”,
Working Paper, FRB San Fransisco.
Hirtle, B. (2007), “Public disclosure, risk, and performance at bank holding companies”, Staff
Report 293, Federal Reserve Bank of New York.
Homar, T., Kick, H. and Salleo, C. (2016), “Making sense of the EU wide stress test: a comparison
with the SRISK approach”, ECB Working Paper No. 1920.
Horvath, R. and Vasco, D. (2012), “Central bank transparency and financial stability: measure-
ments, determinants, and effects”, mimeo, Institute of Economic Studies, Charles University,
Prague, September 2012.
Huizinga, Harry and Laeven, Luc (2012), “Bank valuation and accounting discretion during a
financial crisis”, Journal of Financial Economics, 106(3) 614-634.
Iannotta, Giuliano (2006), “Testing for opaqueness in the European banking industry: evidence
from bond credit ratings”, Journal of Financial Services Research, 30(3) 287-309.
IMF (2012), “2012 Spillover Report - Background Papers”, Policy Report No. 070912, International
Monetary Fund.
Jordan, John S. and Peek, Joe and Rosengren, Eric S. (2000), “The market reaction to the disclosure
of supervisory actions: implications for bank transparency ”, Journal of Financial Intermedia-
tion, 9 (1), 298-319.
JPMorgan (2011), “EBA stress tests: Our view on today’s disclosure. The stress test converted
into JPM acid test”, JP Morgan Europe Equity Research, 2011.
Kanji, G. (1993), “100 statistical tests”, John Wiley and Sons, New York.
ECB Working Paper 2054, May 2017 33

Kolev, K. (2009), “Do investors perceive marking-to-model as marking-to-myth? Early evidence
from FAS 157 Disclosure.”, NYU Stern School of Business.
Laux, C. and Leuz, C. (2009), “The crisis of fair-value accounting: Making sense of the recent
debate”, Accounting, organizations and society, 34 (6), 826-834.
Lehman, B. (2002), “Some desiderata for the measurement of price discovery across markets”,
Journal of Financial Markets,(5), 259-276.
MacKinlay, A. Craig (1997), “Event studies in economics and finance”, Journal of Economic Lit-
erature, 35 (1), 13-39.
Morris, S. and Shin, H. (2002), “Social value of public information”, The American Economic
Review, 92 (5).
Neretina, E., Sahin, C. and De Haan, J. (2014), “Banking stress test eEffects on returns and risks”,
DNB Working Paper No. 419, De Nederlandsche Bank.
Petrella, G. and Resti, A. (2013), “Supervisors as information producers: Do stress tests reduce
bank opaqueness?”, Journal of Banking and Finance, 37(12), 5406-5420.
Peristian, S., Donald P. and Savino, V. (2010), “The information value of the stress test and bank
opacity”, Staff Report, New York Federal Reserve Bank, number 460.
Schuerman, T. (2013), “Stress Testing Banks”, Working Paper prepared for the Comittee on Capital
Markets Regulation.
Sgherri, S. and Zoli, E. (2009), “Empirical modeling of contagion: a review of methodologies”, IMF
Working Paper 09/222, International Monetary Fund.
Song, C., Wayne B., and Han Y. (2010), “Value relevance of FAS No. 157 Fair Value hierarchy
information and the impact of corporate governance mechanisms”, The Accounting Review, 85(4),
1375-1410.
Spargoli, F. (2012), “Bank recapitalization and the information value of a stress test in a crisis”,
Working Paper, Universitat Pompeu Fabra.
Steffen S. (2014), “Robustness, validity and significance of the ECB’s Asset Quality Review and
STress Test Exercise”, Study provided at the request of the Economic and Monteray Affairs
Committee of the European Parliament.
Thompson, R. (1995), “Handbooks in operations research and management science, Chapter 29:
Empirical methods of event studies in corporate finance”, Elsevier, 9 (1).
ECB Working Paper 2054, May 2017 34

Acknowledgements We would like to thank MFL internal seminar participants as well to the anonymous referee for useful comments. The views expressed are those of the authors and should not be reported as representing the views of the European Central Bank (ECB) or the Eurosystem. Oana-Maria Georgescu European Central Bank, Frankfurt am Main, Germany; email: [email protected] Marco Gross European Central Bank, Frankfurt am Main, Germany; email: [email protected] Daniel Kapp European Central Bank, Frankfurt am Main, Germany; email: [email protected] Christoffer Kok European Central Bank, Frankfurt am Main, Germany; email: [email protected]
© European Central Bank, 2017
Postal address 60640 Frankfurt am Main, Germany Telephone +49 69 1344 0 Website www.ecb.europa.eu
All rights reserved. Any reproduction, publication and reprint in the form of a different publication, whether printed or produced electronically, in whole or in part, is permitted only with the explicit written authorisation of the ECB or the authors.
This paper can be downloaded without charge from www.ecb.europa.eu, from the Social Science Research Network electronic library or from RePEc: Research Papers in Economics. Information on all of the papers published in the ECB Working Paper Series can be found on the ECB’s website.
ISSN 1725-2806 (pdf) DOI 10.2866/622534 (pdf) ISBN 978-92-899-2776-5 (pdf) EU catalogue No QB-AR-17-066-EN-N (pdf)