Embed Size (px)
Citation preview

International Institute for Applied Systems Analysis Schlossplatz 1 A-2361 Laxenburg, Austria
Tel: +43 2236 807 342 Fax: +43 2236 71313
E-mail: [email protected] Web: www.iiasa.ac.at
Working Papers on work of the International Institute for Applied Systems Analysis receive only limited
review. Views or opinions expressed herein do not necessarily represent those of the Institute, its National
Member Organizations, or other organizations supporting the work.
Working Paper
A collaborative expert system for group decision making in public policy
Matthias Wildemeersch ([email protected]) Elena Rovenskaya ([email protected]) Leena Ilmola ([email protected])
Approved by Pavel Kabat Director General and Chief Executive Officer, IIASA June, 2017
ZVR 524808900
WP-17-011

2

3
1 BACKGROUND...............................................................................................................5
2 TAXONOMYOFEXPERT-BASEDDECISIONSYSTEMS.......................................8
3 CONSTRUCTIONOFASYSTEMMAP...................................................................10
3.1 Selectingthegroupofexperts..............................................................................................12
3.2 Systemcomponentsandsystemboundaries........................................................................14
3.3 Graphstructureestimation...................................................................................................15
3.4 Parameterestimationwithknowngraphstructure..............................................................16
3.5 Testcasesoneducationandrefugeecrisis............................................................................17
4 INFERENCEENGINEFORANALYSISANDPOLICYDESIGN...........................18
4.1 Analysisofasystemmapthroughsystemdynamics.............................................................18
4.2 Validationofthesystemmap...............................................................................................21
4.3 Preferenceelicitationandproblemformalization.................................................................22
4.4 Designofrealisticpolicies.....................................................................................................22
4.5 Usecaseandbenchmarkexercise.........................................................................................23
5 CLOSINGCOMMENTS...............................................................................................23
6 LEXICONOFSYSTEMMAPS...................................................................................25
7 REFERENCES..............................................................................................................26

4
5
Matthias Wildemeersch, Elena Rovenskaya, Leena Ilmola
Abstract
In the policy arena, there is high pressure to provide right and quick decisions for problems that
are often poorly defined. There is thus an urgent need to support stakeholders in establishing a
shared understanding of policy problems and to assist them in the design of potential solutions.
Here we propose a methodology based on the construction and analysis of system maps, i.e.,
graphical representations of the complex interdependencies of all relevant factors that affect the
problem under study. Owing to their collaborative design, system maps provide a transparent
tool with broad stakeholder acceptance for analysis of ill-defined problems in a formal way. The
construction of system maps involves expert elicitation to define system components, system
boundaries, and interactions between system components, after which the dynamical system
behavior can be approximated by means of system dynamics. Although there is great value in the
construction of the system map to enhance the understanding of the problem scenario, we
consider this to be an intermediate step. The final target is to assist decision-makers by
constructing and analyzing system maps at each step of the decision-making process: i.e., from
the understanding of the system behavior, through the definition of objectives and constraints, to
the presentation of feasible solutions that are satisfactory over a range of different plausible
scenarios. System maps provides us with an effective framework to collect information dispersed
over experts, facilitate mediation, and analyze formally potential pathway solutions, meeting
different criteria of optimality and robustness.
1 Background
Groups rather than individuals typically deal with important issues (DeSanctis and Gallupe,
1987, Conradt and List, 2009). In the context of public policy, it is frequently unlikely that
any individual will have all necessary information at his or her disposal to formulate a
problem. We propose in this work a group decision support system for collective decision-
making that facilitates sharing of dispersed information and reconciliation of conflicting
views. By pooling the biased and incomplete information of the group members, a group can
create a more complete picture of the problem, which in turn can lead to better-informed
A Collaborative Expert System for
Group Decision Making in Public Policy
6
decision-making. The decision support tool brings about communication within the group,
and this can have a powerful effect on the decision process and the quality of the outcome.
Public policy problems often cannot be solved by traditional tools from operations research
(OR). The reasons for this failure are threefold: the stringent requirements for available
information and clarity of the goals (Head, 2008), the impossibility of capturing the multitude
of views or value systems that prevail in social problems, and the ill-defined nature of the
issues in the sense that they resist consistent problem formulation and clearly agreed solutions
(Rittel and Webber, 1973). These so-called wicked problems have several recurrent
characteristics, such as complex interdependencies, disagreement on the nature and the extent
of the problem, high levels of uncertainty, and mathematical difficulties in describing
concepts or verifying solutions. High levels of uncertainty and differing value frames
contribute to opposing opinions and incompatible solution pathways. Owing to their cross-
cutting nature, ill-defined problems are inevitably connected to other problems, for instance in
the case of environmental preservation and economic growth, and this interconnectedness
encourages the study of tradeoffs and synergies. There are many examples of ill-defined
problems in international policy, in problems of global change, and in socio-economic issues
in healthcare or social welfare. Since the complexity of these issues goes beyond the capacity
of a single person, a collaborative approach is required for the formulation of problem
solutions through the consultation of policy-makers, experts, stakeholders, and citizens. The
ill-defined issues that arise in public policy do not allow for trial-and-error approaches, since
there is no public tolerance for the failure of a policy. Taking into account time constraints
typically encountered in policy issues, this encourages the use of simple yet formal models
that allow stakeholders and policy-makers to increase their understanding of the problem
scenario and the consequences of policy solutions.
Human decisions are typically based on a representation of reality consisting of the elements
and relationships of the problem that seem to the decision-maker most relevant. These mental
models differ substantially from person to person. The objective of the decision support tool
that we consider here is to provide a methodology that translates the mental models of a group
of experts into a single consensus model. Consensus in this context does not mean that all
experts agree with the model, but that the produced framework is the best possible result that
merges conflicting views. The resulting model is different from statistical models and
mechanistic process-based models owing to the presence of intangible variables. The expert-
based decision models considered here are not meant to represent a reality, but intend to
represent the mental models of a group of experts.
All models are wrong. As Thomas Kuhn argued, the truth of a scientific model does not only
depend on objective criteria, but also on the consensus within a scientific community.
7
Therefore, in the context of expert-based decision models, the focus is not on the veracity of
the model, but rather on the usefulness of a model. The objective of models based on expert
judgment is to produce results that are convincing, useful, and that inspire confidence. An
expert-based model is convincing when it can reproduce simple intuitions of experts and
historical facts. The model is useful if it can be applied beyond known scenarios and if it can
be used to evaluate and propose new policies. Finally, it is key that expert-based models
inspire confidence. Expert-based decision models have mainly been applied in the field of
soft operations research (OR). Soft OR methods are participatory methods where a facilitator
assists in the formulation and exploration of a problem as part of a decision-making process.
The soft methods involve a group of decision-makers with conflicting views on the problem
and different objectives and interests. In these ill-formulated problem scenarios, a part of the
system will be difficult to quantify, for instance when social notions and subjective judgment
form a critical part of the model (Munro et al., 2002). Soft OR methods have been developed
more than thirty years ago, and to a certain extent these methods are able to address ill-
defined problems. Despite that, soft OR methods have never been recognized in the OR
literature and suffer from the connotation of being imprecise and non-rigorous (Mingers,
2011). As a consequence, soft OR methods do not inspire confidence, which reveals the need
to develop new methods that can address the shortcomings of the prevalent soft OR methods.
Many relevant problems feature characteristics that are not amenable for traditional OR
techniques. Specifically, the application of known methods is problematic when groups of
stakeholders are involved with different interests and values, when there is disagreement over
the nature of the problem, reliable data is missing, or critical factors are intangible. Moreover,
the problem definition may be changing continuously, the scientific knowledge to address
them insufficient, and the proposed solutions might address symptoms rather than causes.
These conditions are encountered in global problems related to climate change, population,
and geopolitics, but also on a smaller scale in a business environment. Traditional OR usually
works with a consensual group of decision makers with clear objectives that agrees on the
nature of the problem. Moreover, variables can be quantified, and uncertainty about variables
can be addressed with probabilistic methods. In reality, these criteria are often not met and
soft methods are a vital part of the formulation and solution of ill-defined problems. First, by
bringing experts together, soft OR helps to find agreement on the nature of the problem.
Stakeholders increase their understanding about the scenario by doing simulations, and this
incremental process leads to enhanced insight into the model, unanticipated consequences,
formulation of objectives and constraints. While this can be a final goal on itself, the output of
the soft OR phase can also be integrated into a traditional OR problem setting, for which the
methods are widely recognized and that inspire confidence. The participatory process of co-
8
design strengthens the transparency of traditional OR models, which is necessary in the
presence of multiple stakeholders. In conclusion, we claim that in the considered problem
scenarios soft OR and traditional OR are complementary and with this paper, we aim to
bridge the expert-based models in soft OR to quantifiable problems in traditional OR.
We advocate that system maps are the appropriate tool for the analysis of ill-defined
problems. System maps provide a graphical representation of all factors that constitute an ill-
defined problem together with their interdependencies. System maps are typically applied to
get a qualitative understanding of the indirect relationships and feedback loops between the
problem factors. Here, we propose a new perspective on system maps that integrates all
crucial steps of the decision-making process. We do not center on issues with a perceived lack
of scientific knowledge, but rather on poorly scoped problems with diverging value
frameworks. When time is unavailable to develop a well-grounded model, system maps are
an excellent tool to work towards a common understanding of the problem and define
solutions that are collectively supported. In fact, we propose to use system maps as the main
machinery for (i) cooperation, dialogue, and mediation during the construction of the map, (ii)
improvement of the understanding of the system behavior through numerical simulations, (iii)
inclusion of pluralistic values for the definition of objectives, and (iv) suggestion of solutions
that are broadly supported.
2 Taxonomy of expert-based decision systems
The terminology to describe soft OR methods and the corresponding graphical tools applied
in literature is ambiguous. Hence, we list here the main soft OR methodologies, which are
also collectively called problem structuring methods (PSM), together with several graphical
methods. In literature, different terminology can be found, usually with subtle differences
between the different terms. We distinguish here between broad conceptual frameworks and
narrowly defined methodologies.
The main conceptual frameworks that facilitate collaboration and negotiation are listed below.
A recurrent feature is that these frameworks do not go beyond a qualitative analysis of the
problem scenario.
• Soft systems methodology (SSM) is a sense-making framework that attempts to
incorporate irrationality of agents as well as different value frames (Checkland and
Holwell, 1997). Starting from a preliminary study of the problem scenario, a
conceptual activity model is built that is later on used to guide a dialogue on desirable
system outcomes between the involved stakeholders.
9
• Building on cognitive mapping, strategic options development and analysis (SODA)
first tries to unite the perceptions of different people related to a particular problem
scenario into a consensus group map, which is a subjective and abstract construct.
This map is consequently used within the broader context of strategy design through
group discussions.
• Strategic choice analysis (SCA) is a participative methodology that offers a
qualitative procedure for decision analysis (Friend and Hickling, 2005). By means of
discussions between participants holding different views, a feasible set of solutions is
created, individual decisions are compared, and finally a solution is selected out the
solution set taking into account the identified uncertainties.
There is a plethora of quantitative methods that can be classified according to different
dimensions, for instance probabilistic versus deterministic models and dynamical versus static
models. The most relevant methods used in literature are succinctly described below:
• Bayesian networks (BNs) provide a graphical representation of probabilistic
relationships between random variables by means of a directed acyclic graph. In case
of discrete random variables, for instance hypotheses, the probability of a child node
as a function of each possible combination of the parent nodes is typically listed in a
table. The power of Bayesian networks lies in the potential for predictive as well as
diagnostic inference. The required elicitation effort for BNs increases quickly with
the network size. In order to capture dynamics, dynamic BNs are used that relate the
network nodes over adjacent time steps.
• Influence diagrams or decision networks are a generalization of BNs that are applied
for decision-making problems under uncertainty.
• Discrete event simulation (DES) is an event-based dynamical system model that has
many industrial applications, for instance in supply chain management. The
usefulness of the model extends also to decision-making, and DES allows us to make
statistical estimates of queue lengths and waiting times under a set of alternative
policy decisions.
• System maps or causal loop diagrams are graphical models that visualize the causal
relationships between different factors within a system. We prefer the term system
maps, since they focus on the visual representation of a system rather than on the
feedback loops that exist within the system, which can be very hard to disentangle in
highly connected directed graphs. System maps provide a description of a system, its
boundaries, the constituent system components, and the interactions that exist
between these components. They typically consists both of hard (quantifiable) and
soft (non quantifiable) variables. The soft variables or intangibles are often critical in
10
the system behavior. Numerical data is usually unavailable for the intangibles, but
since they can significantly influence the system behavior, it is essential to include
the soft variables in the system dynamics. System maps are built to enhance the
understanding of the system behavior, in order to avoid unanticipated consequences
and the policy resistance that can result from that. System dynamics (SD) is typically
used to assist decision-makers in the design and analysis of policy options for the
system described in the system map. SD is very useful for the study of complex
systems, and allows the decision-maker to assess the system behavior under different
conditions and strategic policies.
As this work aims to connect conceptual frameworks with traditional OR techniques in the
realm of public policy, we are mainly concerned about complex issues that deal with multiple
views and intangible variables, while maintaining a formal approach that combines network
dynamics with probabilistic methods. BNs mainly evolve around static inference problems
and the elicitation requirements are infeasible for network sizes that usually appear in
problem scenarios of public policy. DES handles in practice well-defined processes with a
fairly narrow scope and has mainly been applied for industrial and production processes
building on strong empirical basis. In view of the peculiarities of ill-defined problems, system
dynamics over system maps is the appropriate tool that lends itself well for modeling
continuous processes catered to strategic policy design. System maps allow for the integration
of expert judgment and the blending of discrete and continuous processes, while
incorporating the statistical details of multiple experts. Ultimately, system maps open new
avenues to merge the mental models of experts and reach group consensus on the problem
structure.
3 Construction of a system map
Expressing the problem scenario in a rigorous and manageable model is a challenging
exercise. In view of the features of ill-defined policy problems, system maps can represent the
problem formally and with some caution do not involve excessive elicitation efforts. The
construction of a system map is a creative process of translating the ill-defined problem into a
set of well-defined system components and interconnections (von Winterfeldt, 1980).
Through this process, both objective (affected variables) and subjective (values and
perspectives) factors are combined, and the resulting system map will subsequently facilitate
the modeling and numerical analysis in the inference engine.
System maps were originally designed as a qualitative model, and the description of the
model itself was deemed to be useful to gain insight into the system behavior (Coyle, 2000).
11
Considering the quantification of qualitative models, it was argued that quantification could
introduce so many uncertainties that the policy conclusions drawn from quantified models
were potentially illusory. At the same time, there are many supporting arguments for a
quantified analysis of system maps that claim that simulation or quantification nearly always
adds value, even in face of possible uncertainties and the difficulties related to the
quantification of soft variables (Homer et al., 2001). Interestingly, experimental studies have
shown repeatedly that people perform poor mental simulations, even when they have
complete knowledge of the system structure and when the structure is relatively simple. As a
consequence, one cannot draw reliable conclusions from causal maps without simulation.
System maps contain variables of different nature, soft variables and hard variables, and the
meaningfulness of operations between these variables is often not obvious. Nonetheless, the
quantification of the system behavior discloses trends and indirect effects that are not obvious
by mere visual analysis of the system map.
System maps are a suitable tool able to handle soft variables, uncertainties, and missing data.
Current methods for the analysis of system maps are subject to different sources of
uncertainty, which can be classified as parametric, structural, and experimental uncertainty.
The dynamics that take place over the system map can be described and quantified by means
of dynamical systems theory. Several key references in the field of system dynamics and soft
systems methods are (Sterman, 2000, 2002, Jackson, 2006, Checkland, 1985, 2000).
Although decisions in organizations or in the policy domain are predominantly made
collectively, most decision support tools are still aimed at individuals. The proposed expert
system based on system maps combines individual opinions, aggregates partial information,
and gathers different perspectives, objectives, and preferences to reach a decision supported
by the group. The resulting framework is co-owned and co-designed by the users, and the
influence of a facilitator is minimized throughout the process. The proposed methodology
allows users to be both co-located or at different locations.
The objective of this section is to present a step-by-step procedure for the construction of a
system map and to reduce the uncertainty from which the current methods suffer. The main
challenges to establish a system map can be listed as follows:
• Expert selection: The problems we are focusing on are too large in scope to be
addressed by a single person. The aggregation of expert judgment is mandatory for
informed analysis of the problem setting and the system behavior. A first important
problem relates to the selection of the group of experts that will define the problem,
in light of the risk of groupthink and confirmation bias.
12
• Elicitation of relevant system components and system boundaries: There are different
strategies to distinguish between system and environment and define the system
boundaries. In this respect, the definition of the system needs to balance the
competitive requirements of complexity and tractability. The system needs to have a
sufficient level of complexity to allow non-obvious insights, while the complexity in
terms of number of state variables needs to be limited for reasons of feasibility
(Ferrara et al., 2010). Although the construction of the system map may seem
problem-specific, we present a method that addresses the following questions. How
can data and expert elicitation best be exploited to define the system map? How
should the expert surveys be designed to get optimal results, while minimizing the
influence of the workshop facilitator on the definition of the system map? What is the
approach to complement expert opinions with available data?
• Estimation of the graph structure: The correlation between the system components
translates the individual system components into a directed graph. A crucial aspect of
the network construction is that only direct interactions between system components
should be included.
• Estimation of parameters with known graph structure: The weights of the links in the
graph are estimated by a group of experts. Should expert opinions by aggregated or is
it advisable to keep the full range of uncertainty? With respect to aggregation
methods, it is important to note that different aggregation schemes lead to
qualitatively different results.
• Complexity reduction: The reasons to reduce the system map complexity are mainly
related to the expert elicitation effort and the human cognitive limitations to work
with large networks. A first aspect of complexity relates to network size and
structure. Are there methods to reduce the number of system components and links?
A second aspect of complexity relates to node interactions. The relationships between
the system components can be of different nature, and the question is if a single class
of relations can be defined for all links between the system components. Are linear
relations sufficient to define all links, or is there a need to define several classes of
interactions?
In the following sections, we will address step by step the main challenges listed above.
3.1 Selecting the group of experts
Expert elicitation is instrumental in the construction of a system map. Group decision-making
has clearly a higher cost than individual decision-making, but as relevant knowledge in public
policy scenarios is typically spread over a group of experts, the complexity of these problems
13
demands for higher levels of participation. In contrast with individual decision-making, the
challenge of group negotiation is to provide a framework that facilitates the aggregation of
unshared information and the reconciliation of conflicting interests. Although groups with
distributed knowledge are expected to provide higher quality decisions, this is not always
empirically justified. Groups can however outperform individuals when the distribution of
knowledge is asymmetric, but the processing of the information is symmetric (Brodbeck et
al., 2007). The group of experts needs to be selected based on the knowledge requirements of
the problem scenario. During the expert selection stage, it is difficult to avoid the involvement
of facilitator, and awareness is required that group selection can affect policy outcomes.
The first fundamental question that arises in the group selection deals with the necessary
number of experts in order to guarantee some pre-defined quality requirements. The wisdom
of crowds is often used to elicit system components, interactions, and weights of the system
map. With this technique, information is aggregated over experts, which yields good
estimates when the assessment of the experts is unbiased and independent. These conditions
are often not fulfilled in reality and require caution. It is not straightforward if more accurate
estimates can be obtained if the number of experts is maximized. On the contrary, it is often
possible to find a smaller and better-informed group that yields improved aggregated
judgment. It can be shown that under certain technical conditions an optimal size of the crowd
exists (Goldstein et al., 2014).
For policy problems, the group of experts needs to cover all crucial areas that are related to
the problem scenario, and often there is little overlap between the areas of expertise of the
group members. This group composition requires combining unshared information so as to
improve the quality of the group decision. Often unshared information is more significant
than the commonly held information in achieving a collective decision (Stasser and Titus,
1985). The effectiveness of the group builds on the transfer and integration of knowledge
across experts. Through discussion, the partial and biased believes of the group members can
be corrected to form a collective, unbiased representation of the system. In reality however,
due to group cohesiveness individuals avoid to raising controversial issues. This desire to
harmony is often referred to as groupthink and can lead to impaired decision-making.
Confirmation bias is a cognitive bias that can explain the standing and lasting different
opinions between groups (Tversky and Kahneman, 1973). The effects of groupthink and
confirmation bias require a systematic reworking of the system map, by a systems analyst or
workshop facilitator.

14
3.2 System components and system boundaries
Once experts are selected, the constituent elements of the problem scenario can be identified.
These system components can be variables that describe the state of the system, processes,
decision alternatives, or discrete events. The procedure to identify system components can be
divided in the following steps:
i. The group experts collect the system components during a participative workshop.
The co-location of experts is preferential during this phase of problem structuring, but
experts can define the system components also individually. The scope of this
exercise is primarily to find agreement on the extent of the problem scenario.
ii. The workshop facilitator or linguist pre-processes the list of system components
based on linguistic vicinity to avoid duplication of factors.
iii. The experts perform a logical clustering of the pre-processed data based on semantic
correlation. Specifically, system components are clustered visually based on their
significance, and logical clusters are replaced by a single system component. This
round of system dimension reduction needs to limit the dimension of the state space
to 50 - 100 system components. This effort is necessary to ensure that the elicitation
effort of the subsequent phases is manageable.
iv. The experts scale the relevance of system components visually on a diagram. This
scaling is done by placing the most important components in the center and placing
less important components in the periphery of the diagram. This round of system
dimension reduction prunes the least relevant system components and reduces the
dimension of the state space preferentially to 30 - 50 elements.
v. The experts define objectives and preferences for the problem scenario. This phase is
essential to verify the extent of the problem scenario and delineate the system
boundaries. Determining system boundaries is an iterative process that requires
balancing the complexity-feasibility tradeoff. In essence, the group of experts verifies
if the description of the system is appropriate for the purpose.
Both system components and system boundaries are now defined, but in order to allow for a
quantitative analysis, a scale of measure still needs to be determined. Several approaches can
be used to give meaningful values to the system components, which is particularly important
for the intangible variables. The systems analyst can decide to establish specific measurement
scales for all system components. The disadvantage of this approach is that operations, such
as summations and products, are performed on variables with very different units, and the
meaningfulness of these operations needs to be analyzed. Conversely, a common relative
scale can be used with unitless variables, which solves the problem of operations with
variables with different units. In this case, system components take values for instance over

15
the range [0, 100]. This approach enables an intuitive interpretation of the variation between
different system components and lends itself better to accommodate intangible variables.
3.3 Graph structure estimation
The next step is to identify relationships between system components during individual
sessions. In case data is available for all system components, the graph structure can be
estimated based on the conditional independence between the system components through
partial covariances (Hastie et al., 2009). A prudent approach is required in designing a
procedure to construct a directed graph, because the number of connections is directly related
to the elicitation effort for parameter estimation. The maximum number of connections
increases with the square of the number of system components. Often it is difficult to
distinguish between direct and indirect relationships between system components, and
therefore it is sensible to impose a limit on the number of connections to a given budget,
typically 10 percent of the maximum number of interconnections. To produce the
interconnections map, the following procedure can be followed:
i. A list of definitions of system components is provided, together with the budget of
interconnections.
ii. Select the most strongly connected pairs of system components, up to the limit of the
interconnections budget.
iii. A tally is made for all pairs and numbers are normalized by the maximum cited pair.
The most selected interconnections are kept up the maximum available budget.
iv. The system map can now be finalized by depicting system components together with
the links.
A similar approach has been followed in a recent report of the World Economic Forum
(WEF), where an interconnections map of risks is provided, as well as a risk-trend
interconnections map (WEF, 2016). The main shortcoming of their approach is that the
respondents were provided with a list of system components and could not decide which risks
were taken into consideration. We argue that the group of experts should determine both
system components and graph structure.
The resulting graph structure can be used to re-evaluate the system boundaries. In view of the
verification, it is useful to classify the system components into endogenous, exogenous, and
external state variables. The exogenous state variables represent constants and policy
decisions, while endogenous variables are those system components that represent the system
state. Endogenous variables change over time by interacting with each other and by the
influence of exogenous variables. External variables are uncoupled from the connected part of
the system map. These factors are considered insignificant for the purpose of the system and

16
can therefore be cancelled from the system map. Inspecting the link defined by the experts, it
is necessary to reflect on the feedback loops and verify if some of the exogenous variables
should be endogenous. A system component that is treated as exogenous is not subjective to
any feedback from the system. It is important to stress that this is often the case for policy
decisions. Although the policy decisions are influenced by the state of the system, they are
taken at a certain point in time and remain constant afterwards. If extra system components
and links are identified with potential policy implications, key participants of the workshop
need to be consulted to judge the validity of the assumptions.
The complexity resulting from the number of connections is the main hurdle to keep the
expert elicitation manageable. The system map, consisting of system components,
connections, and the results from the tally, can be represented by a weighted adjacency
matrix, which allows to exploit techniques from network science to understand which nodes
behave in a very similar way, which nodes are important, and sequentially, which nodes can
be excluded from the analysis. The methods that can be used are principal component
analysis, feature selection, community detection, and the relevance estimation of nodes by
different centrality metrics.
3.4 Parameter estimation with known graph structure
The system map is now defined by its components and the relationships that exist between
them, and expert opinion is now required to turn the graph into a weighted graph. This
quantification step allows us to use the system map for dynamical analysis of the system
behavior (cfr. Section 4). However, the cost-accuracy tradeoff is increasingly important with
network size, and therefore some assumptions need to be adopted to ensure that the elicitation
efforts remain achievable. Although relationships between system components can be highly
non-linear, all graph links can be approximated by linear relationships in case we aim to
capture local system behavior. Since the uncertainty in the description of the system behavior
is vast, this approximation reaffirms that the system model should only be used over a
relatively small time-horizon. In Section 4, it will be explained in greater detail that for each
link a single weight needs to be estimated that expresses the strength of the correlation
between the considered system components.
Depending on the size of the network and the total number of connections, there are different
strategies to estimate the link weights. In case the number of network links is reasonably
small, experts can be requested to estimate all link weights individually, or all links for which
they are able to make an informed guess. In this case, experts do not need to be co-located,
and the elicitation can be performed by means of a survey, customized software tool, etc. This
approach provides the best results and allows us to include the opinion distribution in the
17
analysis of the system behavior. Instead of using the consensus value that follows from social
choice theory, largely varying parameter values that correspond to opposing opinions can
disclose potentially very different behavior. However, if the complexity reduction efforts in
the former steps of the system map construction were not sufficient, it can be impractical to
request the experts to estimate all link weights. In this case, the group can be subdivided
according to thematic area, and link weights can be estimated in group by means of different
well-known aggregation methods. In this case, sub-groups need to be co-located or a group
needs to be formed in a distributed way making use of technologies commonly used today.
When the link weight assessment is performed in group, the elicitation process requires also
the presence of a moderator. Depending on the areas of expertise of the group members,
different social decision scheme can be used, such as delegation, unanimity, majority, or
plurality. There is a large body of literature on voting-based methods, and it has been shown
that range voting, which selects the vote with the highest average, results in the smallest
Bayesian regret.
Ill-defined problems have to cope with so-called deep uncertainty, which refers to uncertainty
that follows from disagreement between experts on the model structure, the type and weight
of interactions, and the extent of the problem scenario. It is essential that any opportunity to
reduce the inherent uncertainty of ill-defined problems be harnessed. It is therefore highly
recommended to capitalize on available data to estimate the link strength for those
interactions that can be quantified.
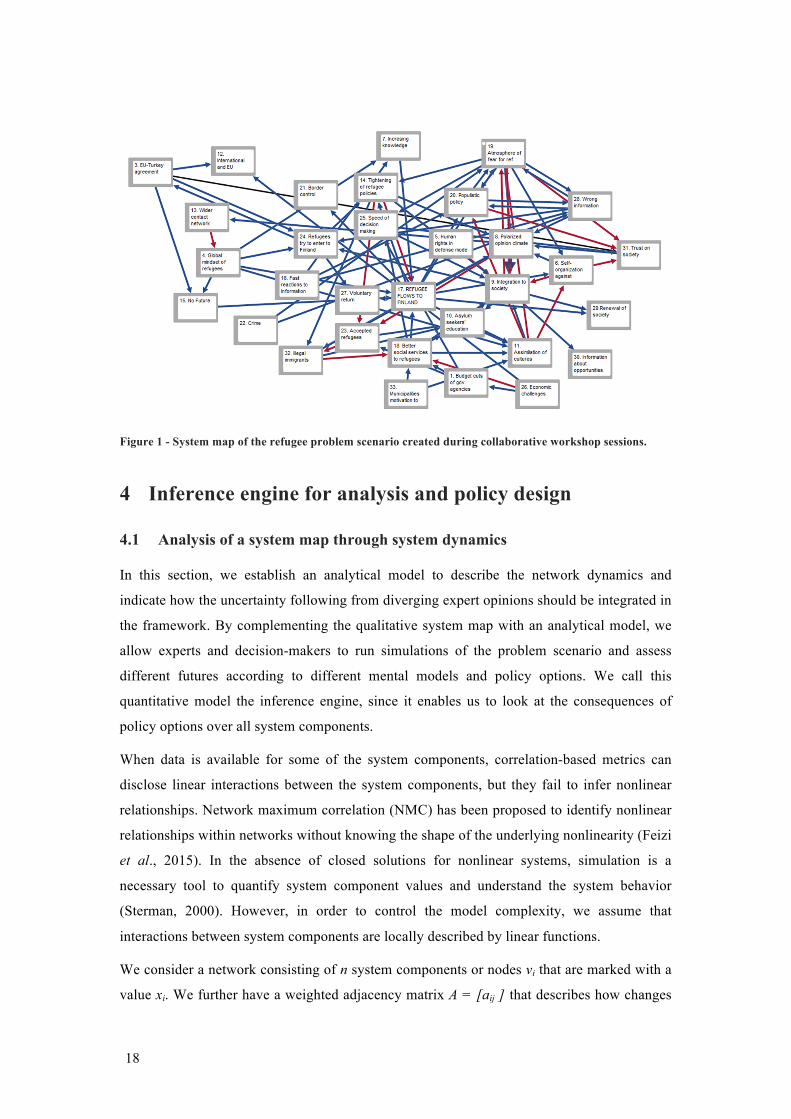
3.5 Test cases on education and refugee crisis
To illustrate the procedure, we show the system maps of two test cases that were developed in
collaboration with the Finnish Prime Minister’s Office (PMO). The first policy problem on
education was motivated by the deterioration of the PISA (programme for international
student assessment) results in Finland. The second policy problem concerns the recent
refugee crisis in Finland and the potential repercussions on employment, safety, education
level, etc. The system map that has been produced during different workshop sessions is
shown in Fig. 1.
18
Figure 1 - System map of the refugee problem scenario created during collaborative workshop sessions.
4 Inference engine for analysis and policy design
4.1 Analysis of a system map through system dynamics
In this section, we establish an analytical model to describe the network dynamics and
indicate how the uncertainty following from diverging expert opinions should be integrated in
the framework. By complementing the qualitative system map with an analytical model, we
allow experts and decision-makers to run simulations of the problem scenario and assess
different futures according to different mental models and policy options. We call this
quantitative model the inference engine, since it enables us to look at the consequences of
policy options over all system components.
When data is available for some of the system components, correlation-based metrics can
disclose linear interactions between the system components, but they fail to infer nonlinear
relationships. Network maximum correlation (NMC) has been proposed to identify nonlinear
relationships within networks without knowing the shape of the underlying nonlinearity (Feizi
et al., 2015). In the absence of closed solutions for nonlinear systems, simulation is a
necessary tool to quantify system component values and understand the system behavior
(Sterman, 2000). However, in order to control the model complexity, we assume that
interactions between system components are locally described by linear functions.
We consider a network consisting of n system components or nodes vi that are marked with a
value xi. We further have a weighted adjacency matrix A = [aij ] that describes how changes
19
of system component values are driven by changes of the neighboring system components.
We consider here the scenario where changes Δx(k) at time step k result in changes of the
system component values at time step k + 1, but where Δx(k) does not have a persistent effect
further in the future. Let uj(k) denote an identified policy option that directly affects node j at
time k, and let us assume that the relation between changes in node i and the changes of its
neighborhood happen in a linear fashion; then we can write
Δ𝑥!(𝑘 + 1) =!
𝑎!"Δ𝑥!(𝑘) + 𝑢!(𝑘),
which can be formulated in matrix form as
Δ𝐱(𝑘 + 1) = 𝐴Δ𝐱(𝑘) + 𝐮(𝑘).
By iterating the recurrence relation, we get
Δ𝐱(𝑛) = 𝐴!Δ𝐱(0) +!!!
!!!
𝐴!!!!!𝐮(𝜏).
Considering that Δ𝐱(0) = 0 and for constant input, we get
Δ𝐱(𝑛) =!!!
!!!
𝐴!!!!!𝐮
which can be reformulated differently in case |𝜆!(𝐴)| < 1 (such that 𝐴! converges and
(𝐼 − 𝐴) is invertible) as
Δ𝐱(𝑛) = (𝐼 − 𝐴)!!(𝐼 − 𝐴!!!)𝐮,
and the long-term effects can be written as
Δ𝐱(∞) = (𝐼 − 𝐴)!!𝐮.
In order to satisfy the condition that |𝜆!| < 1, we scale the weights of the matrix A with
𝜌(𝐴) + 1, where 𝜌(𝐴) = 𝑚𝑎𝑥!{|𝜆!|}. By rescaling the system matrix such that all
eigenvalues fall within the unit circle, we make sure that the system is stable. The stability
assumption is restrictive, but valid for many realistic systems. For the aggregate differences
of the feature values, we normalize with respect to the total aggregated input into the system
Δ𝐱!"" =!!!! Δ𝐱(𝑘)𝑁×𝑢!
.
It is relevant to note that the relation with time is weakly defined, mainly due to the scaling
imposed by the stability requirement. During the workshops, the facilitator needs to clarify
20
that a link weight with value 10 does not relate to a 10-fold increase of the destination node in
a single time step.
The uncertainty that originates from differing views on the model is typically called deep
uncertainty. Under conditions of deep uncertainty, we can get a better view on the range of
plausible futures through individual expert opinions. Instead, when aggregated metrics,
expected values, of consensus values are used for the link weights, the resulting model does
not allow exploring different potential pathways according to the mental models of the
experts. A model based on aggregate metrics can yield good results when the problem
scenario is not contentious, or in case accurate estimates exist of the model parameters.
However, in the context of ill-defined problems it is highly recommended to account for deep
uncertainty and use the diverging opinions in a robust decision-making framework. The
analysis of multiple pathways facilitates dialogue between experts and decision-makers and
can result in the selection of a consensual policy option. The final goal of the inference engine
is to support decision-making while accounting for the multiplicity of plausible futures. By
incorporating explicitly multiple views on the problem scenario, system maps can be very
helpful to find a consensus on the action to be taken. In this context, notice that the analytical
model is not a representation of reality, but a useful aid to link policy decisions to
consequences under diverging expert opinions.
In general, the expected value of the system dynamics is different from the dynamics of the
expected system, which can be expressed as
E[ fi(x(k),u(k),A)]≠ fi(x(k),u(k),E[A]) ,
where fi(.) represents the function representing the system dynamics. For the system described
here, fi(.) is a linear function such that we get an equality
E[ fi(x(k),u(k),A)]= fi(x(k),u(k),E[A]) .
It is however not clear if the dynamics of the expected system provide any meaningful
insight. Through all methods of aggregation, the expected system provides results that
exclude extreme expert judgments, even though very thoughtful. By running simulations over
system models corresponding to contrasting expert views, different pathways can be
distinguished and studied. Instead of focusing on optimality, ill-defined problems
predominantly focus on robustness of the proposed solutions by assessing how many of the
plausible pathways yield desirable outcomes under a given policy option. The policy option
should be chosen that provides desirable outcomes over the largest possible subset of expert
opinions. The reliability of the chosen policy can be expressed in terms of the ratio of the
21
subspace cardinality of the parameters that yields desirable outcomes over the entire
parameter-subspace cardinality.
4.2 Validation of the system map
A model is always wrong and cannot be verified nor validated (Sterman, 2000). Still, it is
essential to perform a set of tests that improve the quality of the model and can make it
convincing and useful. Validation in the strict sense of proving the validity and accuracy of
the inference engine is not applicable in this context. The system map is built on expert
knowledge, and is not verifiably wrong, meaning that there is no formal way to validate
expert judgment. Instead of a proper validation process, a sensitivity analysis can be
performed with respect to the system boundaries, system links, and if aggregation is
performed, with respect to the aggregation rule. The validation process as defined here is a
sanity test for the overall system behavior, and the system analyst can adjust the system map
in order to rule out obvious errors that went unnoticed. During validation, it is advisable to
compare the system behavior with historical data where possible. For problem scenarios in
public policy, data can be typically be found for certain subsets of the system map and the
meaningfulness of the inference engine should be verified for these subsets. The following
steps can be followed for system map validation:
i. Boundary adequacy can be tested both by including and excluding system
components and analyzing the sensitivity of the crucial state variables of the problem
scenario. In case additional system components have significant effects on the system
behavior, the system boundaries need to be re-evaluated.
ii. The structural adequacy relies heavily on the foreseen link budget. The sensitivity
with respect to the number of node interactions can disclose if the increase or
reduction of the link budget results in qualitatively different results. Quantitative
differences and varying speed of the system response are less relevant in this context.
In addition, the structural assessment requires also to verify if the system behavior is
conform physical laws, such as conservation laws.
iii. The parametric adequacy of the model makes use of historical data for subsets of the
system map to verify contentious opinions and outliers.
iv. The susceptibility of the model response with respect to model assumptions needs to
be analyzed. Model assumptions can relate to the functional relationships between the
system components, the imposed stability of the system, etc.
v. The focus of the sensitivity analysis is on tests that reveal the limitations of the
model. Model limitations can apply to the time horizon over which the model can be
used, the awareness of outliers in expert opinions, etc.
22
4.3 Preference elicitation and problem formalization
In public policy, it is essential to have a good understanding of the public value framework.
The elicitation of public values can be performed in expert groups, but also by means of
public involvement in focus groups of layman (Keeney et al., 1990). The elicitation process
consists of two sequential phases: (i) identification of the objectives and criteria to be met,
and (ii) collection of the weights corresponding to all criteria. The first phase is performed in
expert workshops during the construction of the system map, since the objectives help to
elucidate the system boundaries. Usually, competitive system objectives are defined taking
into account multiple perspectives within society. For the weighting of preferences, several
methods are commonly used such as cardinal ranking, nominal ranking, and interval selection
(Wang et al., 2009, Triantaphyllou, 2013), but the entire weight space can also be explored
(Lahdelma and Salminen, 2001). The robustness of these weighting methods needs to be
carefully assessed (Danielson and Ekenberg, 2016). Building on techniques from multi-
objective decision analysis, the criteria and preferences are merged in an objective function.
The inference engine can generate and visualize both the aggregated utility and the individual
objectives, which is very helpful for decision-makers to understand the tradeoffs and
synergies that result from chosen policy options.
4.4 Design of realistic policies
Some solutions that result from the optimization exercise can be unworkable. As an example,
there are cases where optimal control solutions suggest bang-bang control policies, i.e.,
policies where the control only takes the extreme values within the set of admissible controls.
Although there are methods to circumvent this particular control structure, in general we need
to evaluate if the obtained adaptive control policy is practically useful and meaningful to
implement.
If reliable probabilistic information is available about the different potential models, the
policy option should be selected that maximizes expected utility. However, under conditions
of deep uncertainty, a strategy is required that performs reasonably well across the range of
plausible futures defined by experts (Lempert, 2002, Lempert et al., 2006). Stated differently,
a robustness criterion is needed that allows us to make a comparative analysis of the available
policy options. Robust decision-making can help decision-makers to formulate solutions in
the absence of information about the likelihood of the model parameters, which is standard
for system maps and the corresponding ill-defined problems. By evaluating the range of
pathways, sub-optimal solutions can be identified that satisfy a minimum performance in the
largest possible subset of expert opinions. This approach allows us to discover the policy
options that yield acceptable performance over most of the future pathways. What
23
distinguishes system maps described in this work from traditional robust decision-making, is
that the uncertainty is not defined by a set of possible probability distributions of the system
parameters, but instead by diverging expert opinions for which no likelihood information is
available.
4.5 Use case and benchmark exercise
In the refugee problem scenario, we study now the preferential areas of policy action. Policy
actions need to address the following objectives that have been identified by the group of
experts: (i) reduce fear amongst Finnish population, (ii) control the refugee flow, (iii) manage
expectations of asylum seekers, (iv) preserve Finnish economy under migration pressure, and
(v) avoid collapse of Finnish society.
As a benchmark exercise, we aim to make a comparative study of the expected system
dynamics versus the dynamics of different plausible systems. The sensitivity of the system
outcomes as a function of the adopted aggregation rule can provide insight into the most
informative aggregation methods. By taking values from the empirical distribution of link
weights, plausible models are constructed and different pathways can be explored under
different realistic policy options. In view of the large uncertainties present in the system
maps, the emphasis is not on optimization, but rather on the selection of robust policy
solutions.
5 Closing comments
We proposed a methodology to develop an expert system addressing public policy issues
within a group setting. The expert system builds on a system map in combination with an
inference engine. The system map is defined during participative workshops and consists of
all essential factors and the interconnections between these factors that affect the problem
scenario. The inference engine can simulate future pathways and allows us to select solutions
that are robust over the largest possible set of expert opinions. The robust solution includes
and weighs multiple priorities of the decision-makers, according to their conflicting value
frameworks .
When aggregation rules are used for link weights, system maps represents the average
perception of the problem scenario and its meaningfulness can be questioned in view of
conflicting opinions. Other issues with aggregation rules relate to group bias and groupthink.
We therefore recommend using the full set of expert opinions and include in the analysis the
notion of robustness by providing policy options that yield acceptable performance over the
uncertainty domain.

24
Although we use a quantitative model to describe the system dynamics, we need to recognize
that the system map and its dynamics are fully based on expert judgment and on a set of
restrictive assumptions (e.g., linearity). The trajectories of the system components very often
do not have a direct physical interpretation, and therefore the quantitative model still leads
only to qualitative results. This means that the interpretation of numerical values is usually
done in a comparative way. Ultimately, we account for uncertainty by gathering expert
opinions in a robust decision-making context, but also here a prudent approach is necessary.
Group selection has a crucial impact on the quality and range of collected opinions, and there
are no formal ways to determine the completeness of the collected uncertainty set. The
proposed policy options are therefore only robust with respect to the set of opinions
developed in the considered group of experts.
25
6 Lexicon of system maps
System: A system is a closed set of state variables that all together represent the behavior of a
system. We call the state variables here the system components, and these system components
are augmented with interrelationships between them. The system components, system links,
and the interaction rules between connected system components determine the behavior of the
system under study.
System component: System components are the features, factors, or state variables that
determine the evolution of the system over time. System components can be classified
according to endogenous and exogenous variables, where the exogenous system components
can in some cases be used as policies or control variables. System components can also be
classified along another dimension, more specifically we can distinguish between measurable
and intangible state variables. Intangible system components frequently appear in ill-defined
problems and typically can be expressed by means of a common relative measurement scale.
System links: System links represent a relationship between system components and are
represented by edges in the graph structure. The system links in system maps as described in
this paper are marked with a weight, where the of the link strength is informed by data or
expert judgment.
System boundaries: The system boundaries separate the system from the environment,
which can affect the overall system behavior by means of exogenous effects or inputs.
26
7 References
1. Brodbeck, F.C., Kerschreiter, R., Mojzisch, A., and Schulz-Hardt, S., 2007. Group
decision making under conditions of distributed knowledge: The information
asymmetries model. Academy of Management Review, 32(2), pp.459-479.
2. Checkland P., 1985. From optimizing to learning: A development of systems thinking for
the 1990s, Journal of the Operational Research Society, pp.757-767.
3. ——, 2000. Soft systems methodology: a thirty year retrospective, Systems Research and
Behavioral Science, vol. 17, no. S1, pp.S11-S58.
4. Checkland, P., and Holwell, S., 1997. Information, systems and information systems:
making sense of the field. Wiley.
5. Conradt, L., and List, C., 2009. Group decisions in humans and animals: a
survey. Philosophical Transactions of the Royal Society B: Biological
Sciences, 364(1518), pp.719-742.
6. Danielson, M. and Ekenberg, L., 2016. A robustness study of state-of-the-art surrogate
weights for MCDM. Group Decision and Negotiation, pp.1-15.
7. Desanctis, G., and Gallupe, R.B., 1987. A foundation for the study of group decision
support systems. Management science, 33(5), pp.589-609.
8. Coyle, G., 2000. Qualitative and quantitative modelling in system dynamics: some
research questions, System Dynamics Review, vol. 16, no. 3, p. 225.
9. Feizi, S., Makhdoumi, A., Duffy, K., Kellis, M., and Medard, M., 2015. Network
maximal correlation, MIT Computer Science and Artificial Intelligence Laboratory,
Technical Report.
10. Ferrara, A., Ivanova, O., and Kancs, d’Artis., 2010. Modelling the policy instruments of
the EU cohesion policy.
11. Friend, J.K., and Hickling, A., 2005. Planning under pressure: the strategic choice
approach. Routledge.
12. Goldstein, D.G., McAfee, R.P., and Suri, S., 2014. The wisdom of smaller, smarter
crowds, in Proceedings of the fifteenth ACM conference on Economics and computation.
ACM, pp.471-488.
13. Hastie, T., Tibshirani, R. and Friedman, J., 2009. The elements of statistical learning.
Springer, New York.
14. Head, B.W., 2008. Wicked problems in public policy. Public Policy, 3(2), p.101-118.
15. Homer J., and Oliva, R., 2001. Maps and models in system dynamics: a response to
Coyle, System Dynamics Review, vol. 17, no. 4, pp.347-355.
16. Jackson, M.C., 2006. Creative holism: A critical systems approach to complex problem
situations, Systems Research and Behavioral Science, vol. 23, no. 5, pp. 647-657.
27
17. Keeney, R.L., Von Winterfeldt, D. and Eppel, T., 1990. Eliciting public values for
complex policy decisions. Management Science, 36(9), pp.1011-1030.
18. Lahdelma, R. and Salminen, P., 2001. SMAA-2: Stochastic multicriteria acceptability
analysis for group decision making. Operations Research, 49(3), pp.444-454.
19. Lempert, R.J., 2002. A new decision sciences for complex systems. Proceedings of the
National Academy of Sciences, 99(suppl 3), pp.7309-7313.
20. Lempert, R.J., Groves, D.G., Popper, S.W. and Bankes, S.C., 2006. A general, analytic
method for generating robust strategies and narrative scenarios. Management
science, 52(4), pp.514-528.
21. Munro, I., and Mingers, J., 2002. The use of multimethodology in practice - results of a
survey of practitioners, Journal of the Operational Research Society, vol. 53, no. 4,
pp.369–378.
22. Mingers, J., 2011. Soft OR comes of age - but not everywhere! Omega, vol. 39, no. 6, pp.
729-741.
23. Rittel, H.W., and Webber, M.M., 1973. Dilemmas in a general theory of planning. Policy
sciences, 4(2), pp.155-169.
24. Stasser, G., and Titus, W., 1985. Pooling of unshared information in group decision
making: Biased information sampling during discussion. Journal of personality and
social psychology, 48(6), p.1467.
25. Sterman, J.D., 2000. Business dynamics: systems thinking and modeling for a complex
world. Irwin/McGraw-Hill Boston, vol. 19.
26. ——, 2002. All models are wrong: Reflections on becoming a systems scientist, System
Dynamics Review, vol. 18, no. 4, pp.501-531.
27. Triantaphyllou, E., 2013. Multi-criteria decision making methods: a comparative
study (Vol. 44). Springer Science & Business Media.
28. Tversky, A., and Kahneman, D., 1973. Availability: A heuristic for judging frequency
and probability. Cognitive psychology, 5(2), pp.207-232.
29. von Winterfeldt, D., 1980. Structuring decision problems for decision analysis. Acta
Psychologica, 45(1), pp.71-93.
30. Wang, J.J., Jing, Y.Y., Zhang, C.F. and Zhao, J.H., 2009. Review on multi-criteria
decision analysis aid in sustainable energy decision-making. Renewable and Sustainable
Energy Reviews, 13(9), pp.2263-2278.
31. The global risks report 2016, 11th edition. World Economic Forum, 2016.

![Reliability of Packet Transmissions in Vehicular Networks ... · [A]E. Steinmetz, M. Wildemeersch, and H. Wymeersch, \WiP Abstract: Reception Probability Model for Vehicular Ad-Hoc](https://img.pdfslide.net/doc/110x75/5fd668b94302832dbe6684d1/reliability-of-packet-transmissions-in-vehicular-networks-ae-steinmetz-m.jpg)