Embed Size (px)
Citation preview
Working Paper February 2021WP 48
THE POLITICAL ECONOMY OF LAND USE AND LAND COVER CHANGE IN MVURWI AREA ZIMBABWE, 1984–2018Caleb Maguranyanga, Keen Marozva, Ian Scoones and Toendepi Shonhe
2 Working Paper 048 | February 2021
CONTENTSAcronyms ........................................................................................................................................... 4
Executive summary ........................................................................................................................... 5
1. Introduction .................................................................................................................................... 6
2. Study area ...................................................................................................................................... 8
3. Methods ......................................................................................................................................... 9
4. Study results: Changing land cover in Mvurwi ....................................................................... 12
4.1. Paired sample t-test results ........................................................................................... 14
4.2. Spearman’s Rho correlation test results ........................................................................ 14
4.3 Classification results ....................................................................................................... 14
5. Explaining land cover changes, 1984–2018 .............................................................................. 16
5.1. Land cover and land use classification in Ward 26 ........................................................ 20
6. Conclusions and policy recommendations ............................................................................... 21
References ....................................................................................................................................... 22
Tables
Table 3.1: Landsat sensors and bands used for calculating NDVI (1984-2018) ....................... 9
Table 3.2: Land cover classes ............................................................................................... 10
Table 4.1: Paired sample t-test results showing significant differences in NDVI ...................... 14
Table 4.2: Spearman’s Rho correlation test results of the four phases ................................... 14
Table 4.3: Accuracy results for the classification methods. .................................................... 14
Figures
Figure 2.1: Location of study area and sample points. ............................................................ 8
Figure 3.1: Methodological approach for the satellite imagery element of the study. .............. 11
Figure 4.1: Comparison of NDVI between the study years .................................................... 12
Figure 4.2: Average NDVI values for each Ward and mean rainfall from 1984 to 2018.. ......... 13
Figure 4.3: Q-Q Plots for normality test. ................................................................................ 13
Figure 4.4: Smoothed graph showing land classes in hectares over the study years.. ........... 15
Figure 4.5: Percentages of area occupied by each land class in Ward 26.. ........................... 15
3Working Paper 048 | February 2021
We would like to acknowledge the support of the APRA programme, funded by the UK Foreign Commonwealth and Development Office (FCDO), as well as the help of Mr Chimombe (AGRITEX Officer), Mr Sarayi (AGRITEX Officer) and the farmers who attended focus group discussions (FGDs) and contributed to key informant interviews (KIIs) in Mvurwi. Caleb Maguranyanga initially drafted the paper with Keen Marozva and then undertook the satellite imagery analysis for the paper, while all authors helped analyse and interpret it. Toendepi Shonhe undertook KIIs and FGDs in Mvurwi. Ian Scoones and Toendepi Shonhe also contributed to the analysis and writing, focusing on political economy interpretation, and they led the complementary agricultural history longitudinal analysis of Mvurwi.
Ian Scoones is a Professor of Development Studies at Sussex University, United Kingdom. Toendepi Shonhe is a researcher at the Thabo Mbeki African School of Public and International Relations, University of South Africa. Caleb Maguranyanga is a GIS and Remote Sensing Scientist, Department of Geography and Environmental Science, University of Zimbabwe. Keen Marozva is a researcher in GIS and remote Sensing, University of Zimbabwe.
This working paper is funded with UK aid from the UK government (Foreign, Commonwealth & Development Office – FCDO, formerly DFID). The opinions are the authors and do not necessarily reflect the views or policies of IDS or the UK government.
ACKNOWLEDGEMENTS
4 Working Paper 048 | February 2021
AGRITEX Agricultural Technical and Extension Services
APRA Agriculture Policy Research in Africa ESAP Economic Structural Adjustment Programme
FGD focus group discussion
FTLRP Fast Track Land Reform Programme
GIS Geographic Information System
GNU Government of National Unity
GPA Global Political Agreement
GPS Global Positioning System
KII key informant interview
LULCC land use and land cover change
LSCF large-scale commercial farm
MDC Movement for Democratic Change
NDVI Normalised Difference Vegetation Index
ODK Open Data Kit
STERP Short Term Emergency Recovery Programme
ZANU-PF Zimbabwe African National Union-Patriotic Front
ACRONYMS
5Working Paper 048 | February 2021
EXECUTIVE SUMMARY
An analysis of the variations in land use and land cover over the past four decades in the Mvurwi area, Mazowe district, Zimbabwe illustrates how socio-economic dynamics and natural factors combine to shape environmental change. Land use and cover changes (LULCC) were assessed using a combination of quantitative analysis (satellite imagery) of land cover and a grounded analysis of the social, economic and political factors. Normalised Difference Vegetation Index (NDVI) was calculated on Landsat data to test for significant changes in the vegetation cover at five-year intervals from 1984 to 2018 in the study area. NDVI was used because its simplicity and applicability to vegetation-base studies has been tested extensively and successfully in different categories of remote sensing techniques used to monitor agriculture and plant growth. In addition, Landsat was selected since it is the only satellite mission that covered the whole spectrum of the study period. Statistical analysis of land cover changes was complemented with field-based ground-truthing and interviews with land users. The study revealed four phases of vegetation cover change. The first phase, 1984–1999, showed an increase in vegetation cover, while the second phase, 1999–2004, showed a decrease in vegetation cover. The third phase, 2004–09, showed an increase in the vegetation cover and then the fourth phase, 2009–18, showed a decrease in vegetation cover. To gain a more granular view, a focused study was carried out on one Ward. The study revealed that changes were varied across the area, which included communal areas (small-scale farming), large-scale commercial farms/estates and, after the land reform in 2000, resettlement areas with different farm sizes. Explanations for these changes highlight social, economic and political drivers that have changed over time. A simple, linear explanation of LULCC is inappropriate as multiple drivers intersect, and environmental change must always be understood as co-constituted with social dynamics and political economy.
Keywords:GIS, image classification, land reform, NDVI, Remote sensing
6 Working Paper 048 | February 2021
This study examines LULCC over four decades in Mvurwi area of northern Zimbabwe. The aim was both to examine the extent of change and explore the underlying drivers. The study area allowed for an exploration of land cover changes in former large-scale commercial farms (up to the year 2000), new resettlements areas (after 2000) and a smallholder farming communal area. Taking a multi-decade time-frame, this study explores how land cover varies through different phases, with periods of vegetation expansion and contraction linked to a range of factors. A simplistic, linear explanation of environmental change is thus avoided, and a more nuanced picture emerges, which situates land use change in longer term socio-ecological and political economy dynamics.
Past studies have offered important qualitative insights into LULCC in Zimbabwe, particularly around the post-2000 land reform programme (Murisa 2016; Cliffe et al. 2011; Chigumira 2010), as well as more quantitative assessments of particular areas (Solomon et al. 2018; Matavire, Sibanda and Dube 2015; Mutanga, Ramoelo and Gonah 2013; Matsa and Muringaniza 2011). Few studies have combined a quantitative analysis of land cover, using satellite imagery, with a grounded analysis of the social, economic and political factors that influence change. Too often the result is a simplistic interpretation of satellite image analysis – the ‘gaze from space’ – making assumptions about environmental changes informed by dominant narratives, and without a detailed analysis of what happened in particular places informed by local accounts (Scoones 2018; Jombo et al. 2017). The application of remote sensing techniques using satellite imagery has become an important tool for the management, mapping and monitoring of landscape changes over time and at various scales (Attri, Chaudhry and Sharma 2015). At global scale, Myneni et al. (1997) calculated the increase in plant growth over the northern latitudes. Sibanda and Murwira (2012) distinguished cotton from maize and sorghum fields in smallholder agricultural landscapes of Southern Africa. Other studies (e.g. Sun et al. 2019; Levin 2015; Rawat and Kumar 2015) have been conducted at national and district levels.
Remote sensing provides an effective and economic means to collect data to monitor changes occurring in land use categories (Sharma et al. 2019). Satellite remote sensing is an ideal source for mapping LULCC, given its ability to provide consistent and repeatable measurements at a spatial scale appropriate for capturing both natural and human-induced phenomena (e.g. fires, disease, agriculture, urbanisation, deforestation) (Gómez, White and Wulder 2016). Land cover refers to the surface cover on the ground, whether vegetation, urban infrastructure, water, bare soil or other; while land use describes the use to which the land is put, and there may be different uses for lands with the same cover type (Coffey 2013).
There has been rapid development of remote sensing data of several multi-spectral, multi-temporal and multi-spatial ranges.i In this study we use imagery from the Landsat satellites because of their uniqueness in the application of land cover classification through continuous observation history since its launch in 1972 (Wulder et al. 2016). Landsat is the longest running uninterrupted Earth observation programme and its archives are the first to offer global images free of charge and provide insights into past trends that are important when monitoring land cover changes (Turner et al. 2015). In addition, Landsat satellites’ resolution characteristics (temporal, spatial and spectral) and other technical specifications make them suitable for LULCC detection for larger areas (Mensah, Wapaburda and Hammond 2017).
Timely and accurate change detection of the earth’s surface features provides the basis for evaluating the relationships and interactions between human and natural phenomena (Asokan and Anitha 2019). Digital image processing of satellite data provides tools for analysing the image through different algorithms and mathematical indices. Features are based on reflectance characteristics, and indices have been devised to highlight the features of interest on the image (Gao 1996). There are several indices for highlighting vegetation-bearing areas on a remote sensing scene. Vegetation indices, among other methods, have been reliable in monitoring vegetation change (Nageswara et al. 2005).
1 INTRODUCTION
7Working Paper 048 | February 2021
One of the most widely used indices for vegetation monitoring is the NDVI (Tucker 1979), which is widely applied in research on global environmental and climatic change (Gao 1996). According to Rouse et al. (1974) NDVI is calculated as follows: NDVI= (NIR+R)/(NIR−R) whereby NIR and R is the surface reflectance in the near−infrared and red bands respectively. NDVI values range from -1 to +1. Dense vegetation is represented by high NDVI values, between 0.1 and 1. Conversely, non-vegetated surfaces such as water bodies yield negative values of NDVI because of the electromagnetic absorption quality of water. Bare soil areas represent NDVI values that are closest to 0 due to high reflectance in both the visible and NIR portions of the electromagnetic spectrum (Lillesand and Keifer 1994).
8 Working Paper 048 | February 2021
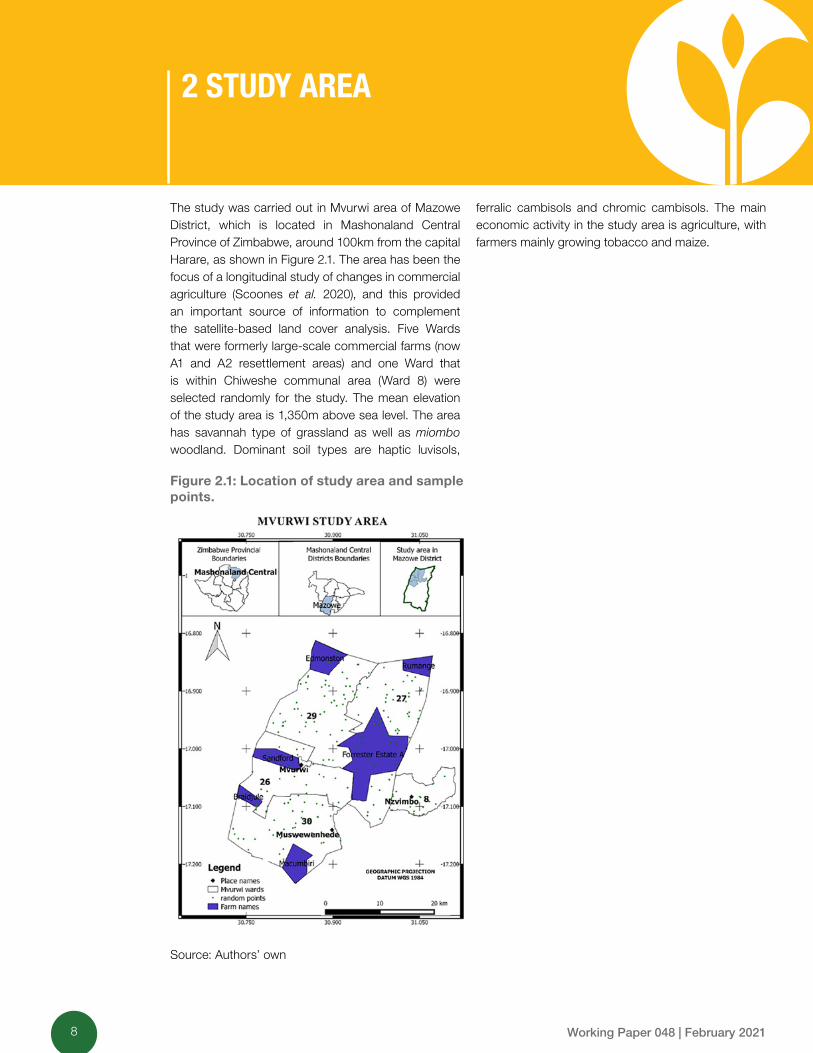
The study was carried out in Mvurwi area of Mazowe District, which is located in Mashonaland Central Province of Zimbabwe, around 100km from the capital Harare, as shown in Figure 2.1. The area has been the focus of a longitudinal study of changes in commercial agriculture (Scoones et al. 2020), and this provided an important source of information to complement the satellite-based land cover analysis. Five Wards that were formerly large-scale commercial farms (now A1 and A2 resettlement areas) and one Ward that is within Chiweshe communal area (Ward 8) were selected randomly for the study. The mean elevation of the study area is 1,350m above sea level. The area has savannah type of grassland as well as miombo woodland. Dominant soil types are haptic luvisols,
ferralic cambisols and chromic cambisols. The main economic activity in the study area is agriculture, with farmers mainly growing tobacco and maize.
2 STUDY AREA
Figure 2.1: Location of study area and sample points.
Source: Authors’ own
9Working Paper 048 | February 2021
3 METHODS
Our focused study was conducted in Ward 26, which was formerly a large-scale commercial farm area, and since 2000 has been converted to a mix of smallholder and medium-scale farm resettlements with 68 per cent model A1 farms (small-scale) and 32 per cent model A2 farms (medium-scale). Ward 26 was chosen for the granular study because of its proximity to Mvurwi town and its strong interaction between farming and urban areas economically, socially and environmentally through the interlinked spaces. The study quantified LULCC using a combination of NDVI analysis and a supervised classification method for the four phases under study, during the period 1984–2018.
In addition to the NDVI analysis and image classification in Ward 26, four FGDs and eight KIIs were held in Wards 8 and 26, as a means to help explain the NDVI analysis from a local perspective. Questions were asked on the economic activities of the area prior to resettlement, and how these have changed over time covering the study period (1984–2018). The influence of politics on the pace and intensity of development on land during the study period was also analysed. Selection of FGD and KII participants was based on position in government departments, age and length of stay on the farms. Field data were collected using Open Data Kit (ODK) suite, a Computer Aided Personalised Interviewer (Brunette et al. 2013). The questionnaire was digital and administered using android phones.
The questionnaire collected information such as GPS location, current LULCC, the previous LULCC, year when LULCC changed from the current, image of the area, other changes in LULCC and years and reason for each LULCC.ii
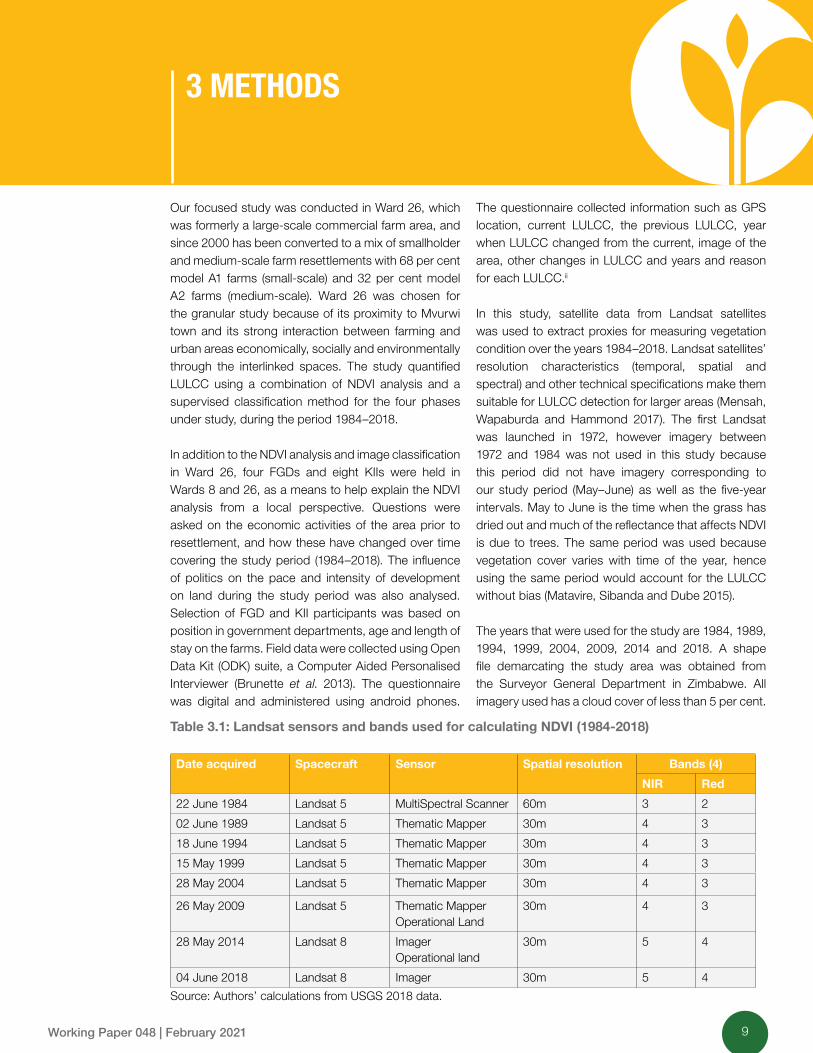
In this study, satellite data from Landsat satellites was used to extract proxies for measuring vegetation condition over the years 1984–2018. Landsat satellites’ resolution characteristics (temporal, spatial and spectral) and other technical specifications make them suitable for LULCC detection for larger areas (Mensah, Wapaburda and Hammond 2017). The first Landsat was launched in 1972, however imagery between 1972 and 1984 was not used in this study because this period did not have imagery corresponding to our study period (May–June) as well as the five-year intervals. May to June is the time when the grass has dried out and much of the reflectance that affects NDVI is due to trees. The same period was used because vegetation cover varies with time of the year, hence using the same period would account for the LULCC without bias (Matavire, Sibanda and Dube 2015).
The years that were used for the study are 1984, 1989, 1994, 1999, 2004, 2009, 2014 and 2018. A shape file demarcating the study area was obtained from the Surveyor General Department in Zimbabwe. All imagery used has a cloud cover of less than 5 per cent.
Table 3.1: Landsat sensors and bands used for calculating NDVI (1984-2018)
Date acquired Spacecraft Sensor Spatial resolution Bands (4)
NIR Red
22 June 1984 Landsat 5 MultiSpectral Scanner 60m 3 2
02 June 1989 Landsat 5 Thematic Mapper 30m 4 3
18 June 1994 Landsat 5 Thematic Mapper 30m 4 3
15 May 1999 Landsat 5 Thematic Mapper 30m 4 3
28 May 2004 Landsat 5 Thematic Mapper 30m 4 3
26 May 2009 Landsat 5 Thematic MapperOperational Land
30m 4 3
28 May 2014 Landsat 8 ImagerOperational land
30m 5 4
04 June 2018 Landsat 8 Imager 30m 5 4
Source: Authors’ calculations from USGS 2018 data.
10 Working Paper 048 | February 2021
Landsat 5 (Thematic Mapper), Landsat 8 (Operational Land Imager), both with a spatial resolution of 30m, and Landsat 5 (Multi Spectral Scanner) with a spatial resolution of 60m were used in this study, as shown in Table 3.1. Table 3.1 also shows the bands used to calculate NDVI. The satellite image tiles that were downloaded from earth explorer website (https://earthexplorer.usgs.gov/) are of World Reference System path 170 and row 72.
In this study, 200 random sample points were generated from the study area. These points were used for NDVI and rainfall data extraction. Random sampling was used, as the study area belongs to one agro-ecological region. Rainfall data was extracted at the same sampled points used for NDVI for each study year. Mean rainfall values were compared with those of NDVI to test if there was a relationship. The satellite imagery was corrected for radiometric, geometric and atmospheric errors before being used. It then went through the process of spectral and spatial subsetting (Mensah, Wapaburda and Hammond 2017). Satellite imagery comes with a lot of spectral bands. Therefore, spectral subsetting was performed so that few spectral bands to be used are selected. Spatial subsetting was also performed and unwanted geographical areas were removed to remain within the study area.
NDVI and land cover maps were produced to visualise the trend in vegetation cover between 1984 and 2018. The maps were used for exploratory data analysis prior to statistical tests. NDVI values were extracted at the 200 randomly sampled points in a Geographic Information System (GIS) environment. Cumulative rainfall data was downloaded from CHIRPS website (CHIRPS 2019) and extracted at sampled points for each study year (1984–2018).
Normality tests for the NDVI values at sampled points were conducted using the quantile-quantile (Q-Q) plots, a statistical test which tests whether the data is normally distributed or not (Atsalakis, Bouri and Pasiouras 2020; Zubir et al. 2018). If the data follow a normal distribution, the points in the Q-Q normal plot lie on a straight diagonal line. Following the normal
distribution of the data (p>0.05), the paired sample t-test was used to test whether there were any significant differences between vegetation NDVI signals amongst different years. The test was conducted at a 95 per cent confidence interval. According to Jennings, Zumbo and Joula (2002), it is still possible to use the paired samples t-test, provided that the sample size is at least 30; in this study, 200 samples were used. Furthermore, Spearman’s Rho, a non-parametric correlation test, was calculated to measure the strength of the relationship between rainfall and NDVI over the four phases (1984–99, 1999–2004, 2004–09 and 2009–18). Image classification was performed in Ward 26 where the study was more detailed. The data for the process was collected in the field using ODK and uploaded to the server. It was then downloaded from the server and divided into training (70 per cent) and testing (30 per cent). Training data was used on the processed imagery during the classification process. Testing data was used as ground-truth data in the accuracy assessment process. The major land classes observed in the field were bare ground, fields, forests, water bodies and grasslands, as shown in Table 3.2. Each pixel was classified according to the land class that covers more than half of the area (Islam et al. 2018).
Since there is no single classification method that works best on all remote sensing images, because images have varying spectral, temporal and spatial characteristics, several hard classification methods (Kamavisdar, Saluja and Agrawal 2013) were performed. This enabled the selection of the best method in terms of the overall accuracy and robustness for the final classification (King et al. 2001; as cited by Johnson et al. 2013). June 2018 imagery was used for the classification, so as to select the best algorithm, and then used to classify imagery for the remaining years in Ward 26.
Methods used were: (1) Maximum likelihood, based on the Bayes Theorem (Maselli and Conese 1994); (2) Minimum distance to mean approach, which calculates mean spectra of each predefined class and assigns the pixel to a group that has the least distance to the mean (Abburu and Suresh 2015); (3)
Table 3.2: Land cover classes
Class Description
Bare ground Includes areas with no or sparse vegetation. Roads are included.
Fields Includes harvested or not harvested fields.
Forests Includes areas with forest vegetation cover.
Water bodies Includes all water bodies such as dams, lakes and rivers.
Grassland Includes areas where grass is the dominant vegetation type.
Source: Authors’ own
11Working Paper 048 | February 2021
Spectral angle mapper, which is a physically-based spectral classification that uses an n-dimensional angle to match pixels to reference spectra (Zulhaidi, Suhaili and Mansor 2007) and (4) Mahalanobis distance classifier, which is based on a correlation between variables by which different patterns can be identified and analysed (Marghany and Hashim 2011).
Post-classification processing was conducted on each classification method. This was done in order to assess if there are classes that are nearly the same and whether there is need to combine them. Field and bare classes were merged to the fields class due to their reflectance characteristics. This is justified, as at the time of image acquisition (4 June 2018; see Table 3.1), some fields were already harvested, and therefore were classified as bare (Matavire, Sibanda and Dube 2015). Accuracy assessment was done for each classification method using Kappa statistics index (Haque and Basak 2017; Mensah, Wapaburda and Hammond 2017) which indicates the extent of agreement between the observed and expected results. Accuracy assessment is a validation process that is conducted by comparing the classification results with ground-truthed referenced data (Brabyn et al. 2013). Overall
accuracy quantifies how well a classification was done by the classifier (Mensah, Wapaburda and Hammond 2017) by showing the proportion that was correctly mapped out in the given reference sites. The higher the value, the better the classification method. Following these assessments, the maximum likelihood method produced the best classification results and was therefore used for classifying the imagery in Ward 26.
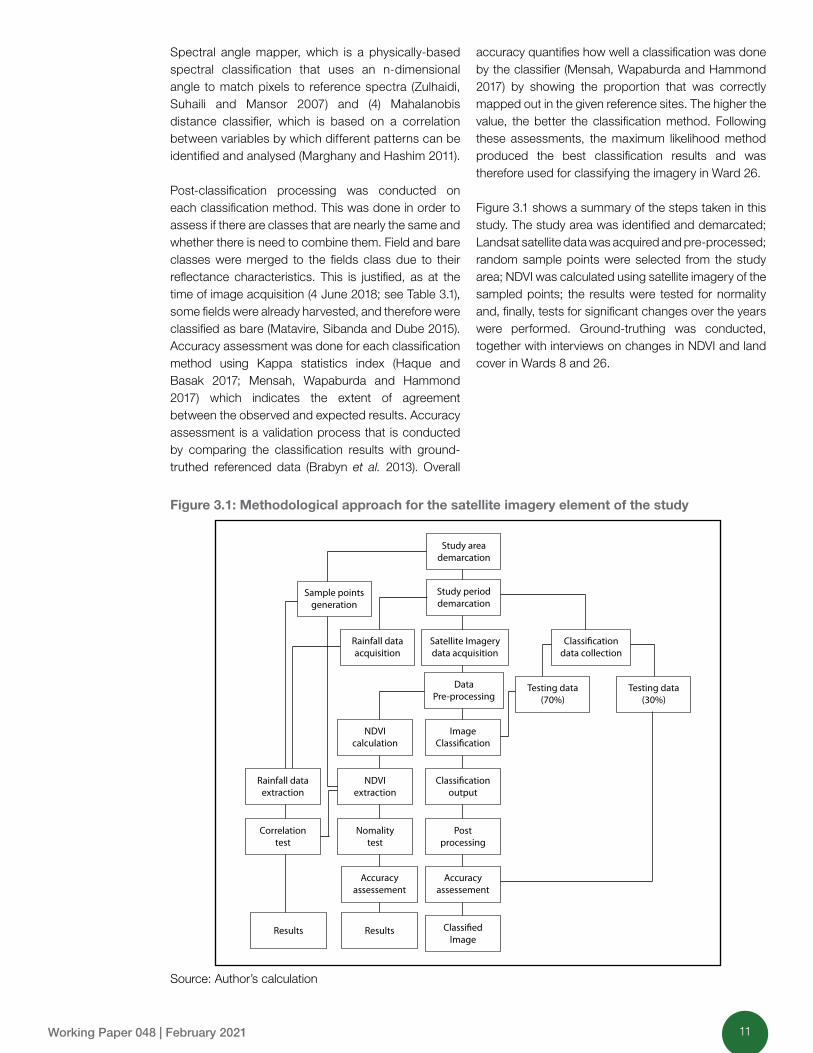
Figure 3.1 shows a summary of the steps taken in this study. The study area was identified and demarcated; Landsat satellite data was acquired and pre-processed; random sample points were selected from the study area; NDVI was calculated using satellite imagery of the sampled points; the results were tested for normality and, finally, tests for significant changes over the years were performed. Ground-truthing was conducted, together with interviews on changes in NDVI and land cover in Wards 8 and 26.
Figure 3.1: Methodological approach for the satellite imagery element of the study
Study areademarcation
Study perioddemarcation
Sample pointsgeneration
Rainfall dataacquisition
Satellite Imagerydata acquisition
DataPre-processing
ImageClassification
NDVIcalculation
NDVIextraction
Nomalitytest
Postprocessing
Accuracyassessement
ClassifiedImage
Accuracyassessement
Rainfall dataextraction
Correlationtest
Results Results
Classificationoutput
Classificationdata collection
Testing data(30%)
Testing data(70%)
Source: Author’s calculation
12 Working Paper 048 | February 2021
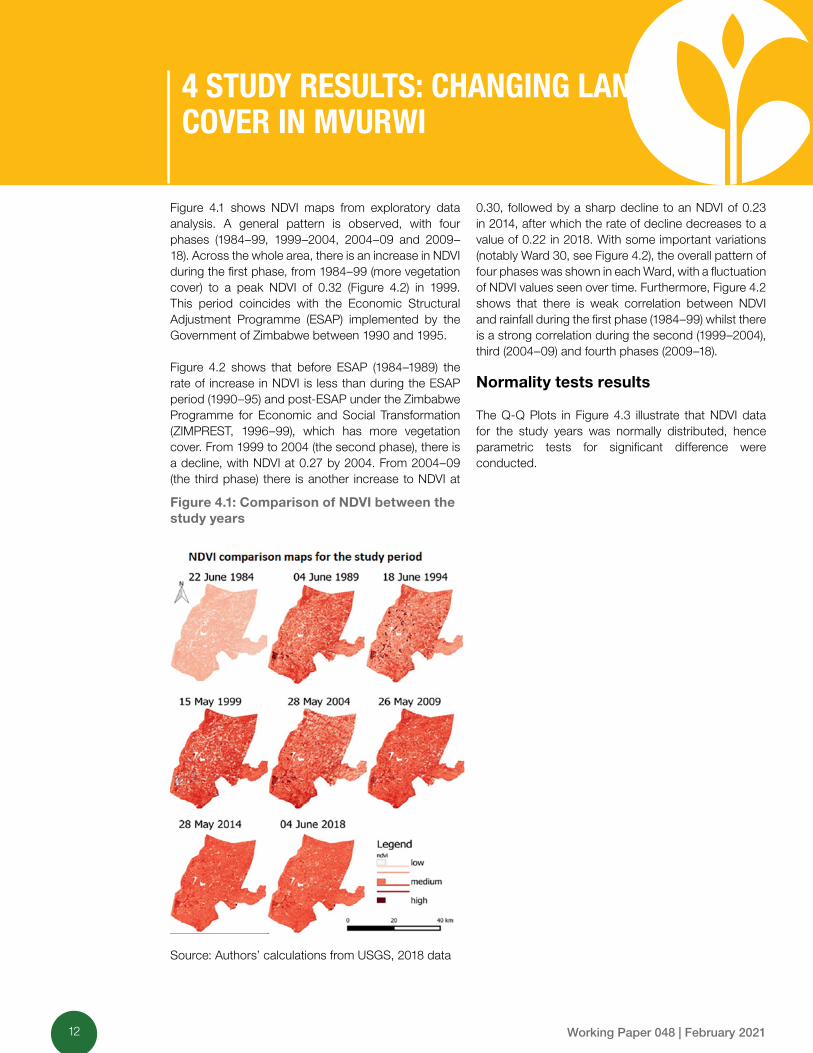
Figure 4.1 shows NDVI maps from exploratory data analysis. A general pattern is observed, with four phases (1984–99, 1999–2004, 2004–09 and 2009–18). Across the whole area, there is an increase in NDVI during the first phase, from 1984–99 (more vegetation cover) to a peak NDVI of 0.32 (Figure 4.2) in 1999. This period coincides with the Economic Structural Adjustment Programme (ESAP) implemented by the Government of Zimbabwe between 1990 and 1995.
Figure 4.2 shows that before ESAP (1984–1989) the rate of increase in NDVI is less than during the ESAP period (1990–95) and post-ESAP under the Zimbabwe Programme for Economic and Social Transformation (ZIMPREST, 1996–99), which has more vegetation cover. From 1999 to 2004 (the second phase), there is a decline, with NDVI at 0.27 by 2004. From 2004–09 (the third phase) there is another increase to NDVI at
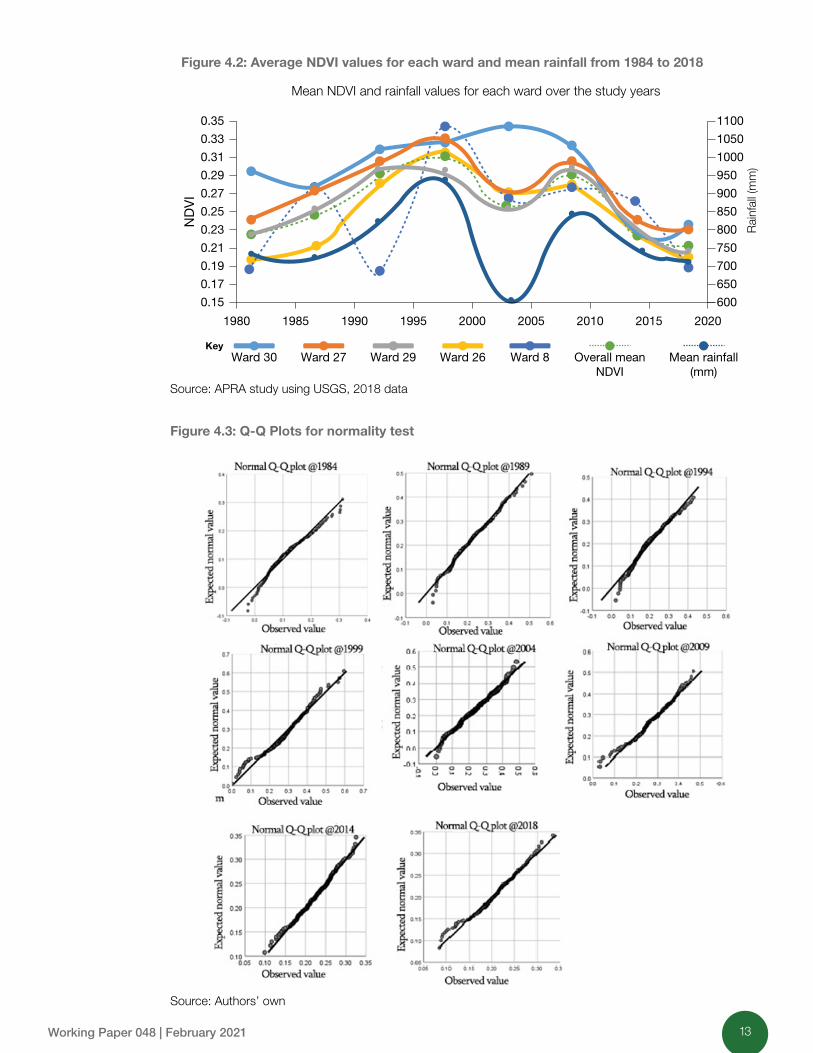
0.30, followed by a sharp decline to an NDVI of 0.23 in 2014, after which the rate of decline decreases to a value of 0.22 in 2018. With some important variations (notably Ward 30, see Figure 4.2), the overall pattern of four phases was shown in each Ward, with a fluctuation of NDVI values seen over time. Furthermore, Figure 4.2 shows that there is weak correlation between NDVI and rainfall during the first phase (1984–99) whilst there is a strong correlation during the second (1999–2004), third (2004–09) and fourth phases (2009–18).
Normality tests results
The Q-Q Plots in Figure 4.3 illustrate that NDVI data for the study years was normally distributed, hence parametric tests for significant difference were conducted.
4 STUDY RESULTS: CHANGING LAND COVER IN MVURWI
Figure 4.1: Comparison of NDVI between the study years
Source: Authors’ calculations from USGS, 2018 data
13Working Paper 048 | February 2021
Figure 4.2: Average NDVI values for each ward and mean rainfall from 1984 to 2018
Rai
nfal
l (m
m)
ND
VI
1980 1985 1990 1995 2000 2005 2010 2015 2020
0.15
0.17
0.19
0.21
0.23
0.25
0.27
0.29
0.31
0.33
0.35
600
650
700
750
800
850
900
950
1000
1050
1100
Overall meanNDVI
Mean rainfall(mm)
Key
Mean NDVI and rainfall values for each ward over the study years
Ward 30 Ward 27 Ward 29 Ward 26 Ward 8
Source: APRA study using USGS, 2018 data
Figure 4.3: Q-Q Plots for normality test
Source: Authors’ own
14 Working Paper 048 | February 2021
4.1 Paired sample t-test results
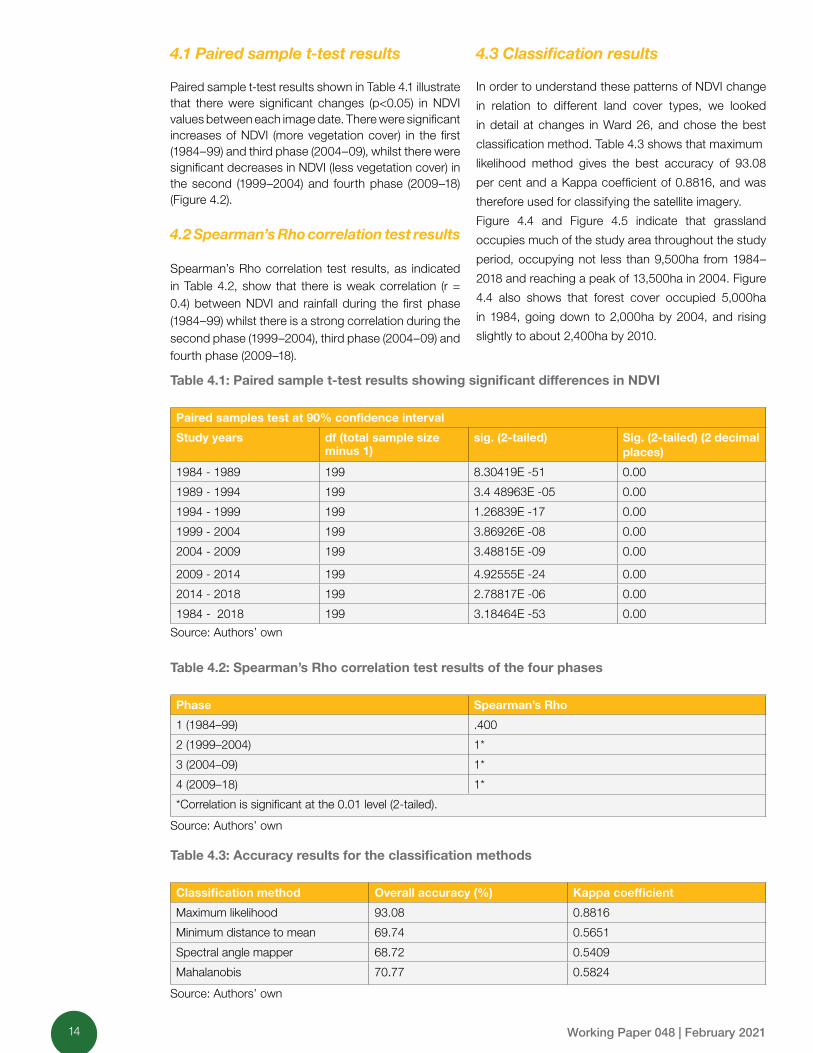
Paired sample t-test results shown in Table 4.1 illustrate that there were significant changes (p<0.05) in NDVI values between each image date. There were significant increases of NDVI (more vegetation cover) in the first (1984–99) and third phase (2004–09), whilst there were significant decreases in NDVI (less vegetation cover) in the second (1999–2004) and fourth phase (2009–18) (Figure 4.2).
4.2 Spearman’s Rho correlation test results
Spearman’s Rho correlation test results, as indicated in Table 4.2, show that there is weak correlation (r = 0.4) between NDVI and rainfall during the first phase (1984–99) whilst there is a strong correlation during the second phase (1999–2004), third phase (2004–09) and fourth phase (2009–18).
4.3 Classification results
In order to understand these patterns of NDVI change
in relation to different land cover types, we looked
in detail at changes in Ward 26, and chose the best
classification method. Table 4.3 shows that maximum
likelihood method gives the best accuracy of 93.08
per cent and a Kappa coefficient of 0.8816, and was
therefore used for classifying the satellite imagery.
Figure 4.4 and Figure 4.5 indicate that grassland
occupies much of the study area throughout the study
period, occupying not less than 9,500ha from 1984–
2018 and reaching a peak of 13,500ha in 2004. Figure
4.4 also shows that forest cover occupied 5,000ha
in 1984, going down to 2,000ha by 2004, and rising
slightly to about 2,400ha by 2010.
Table 4.1: Paired sample t-test results showing significant differences in NDVI
Paired samples test at 90% confidence interval
Study years df (total sample size minus 1)
sig. (2-tailed) Sig. (2-tailed) (2 decimal places)
1984 - 1989 199 8.30419E -51 0.00
1989 - 1994 199 3.4 48963E -05 0.00
1994 - 1999 199 1.26839E -17 0.00
1999 - 2004 199 3.86926E -08 0.00
2004 - 2009 199 3.48815E -09 0.00
2009 - 2014 199 4.92555E -24 0.00
2014 - 2018 199 2.78817E -06 0.00
1984 - 2018 199 3.18464E -53 0.00
Source: Authors’ own
Table 4.2: Spearman’s Rho correlation test results of the four phases
Phase Spearman’s Rho
1 (1984–99) .400
2 (1999–2004) 1*
3 (2004–09) 1*
4 (2009–18) 1*
*Correlation is significant at the 0.01 level (2-tailed).
Source: Authors’ own
Table 4.3: Accuracy results for the classification methods
Classification method Overall accuracy (%) Kappa coefficient
Maximum likelihood 93.08 0.8816
Minimum distance to mean 69.74 0.5651
Spectral angle mapper 68.72 0.5409
Mahalanobis 70.77 0.5824
Source: Authors’ own
15Working Paper 048 | February 2021
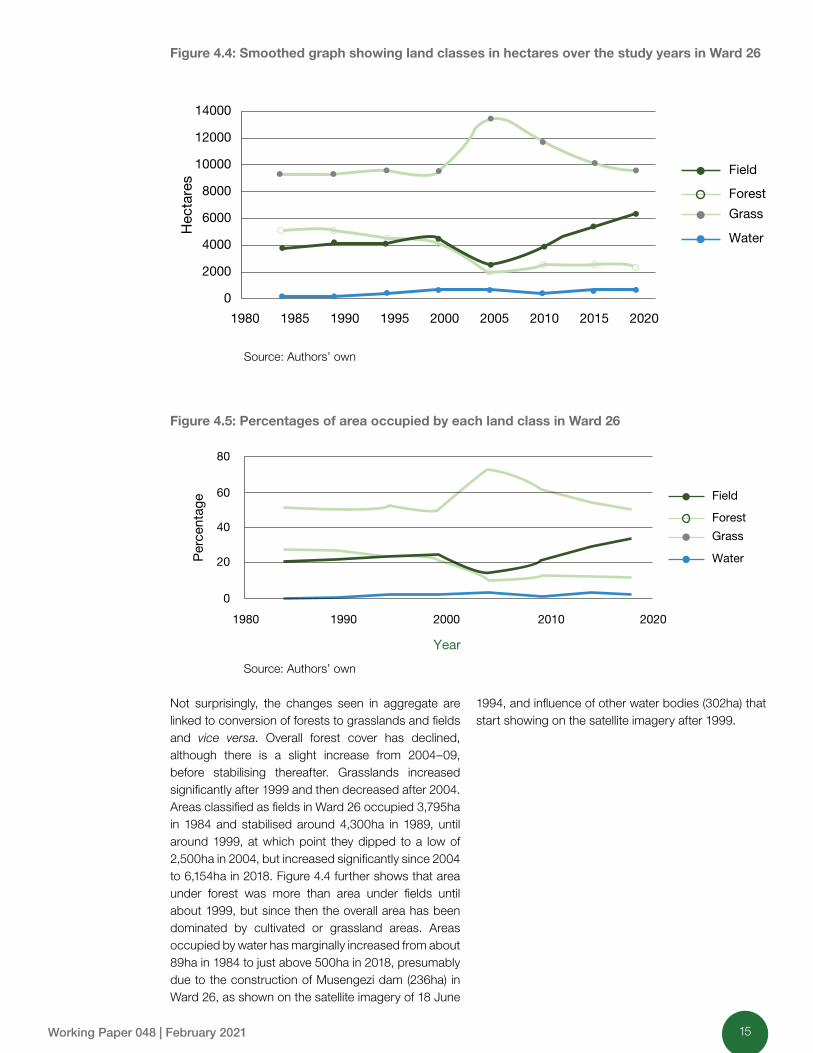
Not surprisingly, the changes seen in aggregate are linked to conversion of forests to grasslands and fields and vice versa. Overall forest cover has declined, although there is a slight increase from 2004–09, before stabilising thereafter. Grasslands increased significantly after 1999 and then decreased after 2004. Areas classified as fields in Ward 26 occupied 3,795ha in 1984 and stabilised around 4,300ha in 1989, until around 1999, at which point they dipped to a low of 2,500ha in 2004, but increased significantly since 2004 to 6,154ha in 2018. Figure 4.4 further shows that area under forest was more than area under fields until about 1999, but since then the overall area has been dominated by cultivated or grassland areas. Areas occupied by water has marginally increased from about 89ha in 1984 to just above 500ha in 2018, presumably due to the construction of Musengezi dam (236ha) in Ward 26, as shown on the satellite imagery of 18 June
1994, and influence of other water bodies (302ha) that start showing on the satellite imagery after 1999.
Figure 4.4: Smoothed graph showing land classes in hectares over the study years in Ward 26
14000
12000
10000
8000
6000
4000
2000
1980 1985 1990 1995 2000 2005 2010 2015 2020
0
Hec
tare
sField
Forest
Grass
Water
Source: Authors’ own
Figure 4.5: Percentages of area occupied by each land class in Ward 26
Year
1980
80
60
40
20
0
1990 2000 2010 2020
Per
cent
age Field
Forest
Grass
Water
Source: Authors’ own
16 Working Paper 048 | February 2021
The previous section has presented the results of the NDVI/land cover analyses both for the area as a whole and for the sample Ward. A general pattern is observed, with four phases. The first phase (1984–99) recorded an increase in forest cover. The second phase (1999–2004) recorded a decline in forest cover due to land clearance after the land reform of 2000. There was an increase in forest cover in the third phase (2004–09) due to the indirect effect of hyperinflation. The fourth and last phase (2009–18) with a variation from 2014 showed a decline in forest cover. While there is a clear shift to more cultivated area/grassland over time, there are important variations; for example, in the late 1990s and between 2004 and 2009 there were increases in denser vegetation. What explains these changes in overall vegetation cover across the area, and the particular land cover changes in Ward 26?
One explanation might simply be rainfall. Studies in Zimbabwe (UNDP 2017) successfully classified rainfall seasons from 1981 to present into different El Niño Southern Oscillation (ENSO) classes. El Niño years often coincide with drought conditions in Zimbabwe (1982–1983; 1997–1998; 2015–2016). 2015/16, a very strong El Niño year, led to a drought in Zimbabwe and the rest of Southern Africa, whilst La Niña years coincide with wet conditions (1998–1999; 1999–2000; 2007–2008; 2010–2011) (UNDP 2017). For the period 1980–2016, El Niño years have been characterised by lower yields compared to non-El Niño nor La Niña years, and La Niña years at national level (UNDP 2017).
However, as Figure 4.2 and Table 4.2 show, there is no significant correlation between land cover/NDVI and rainfall. In some periods, a decrease in both NDVI and rainfall (1999–2004 and 2009–2018) is recorded, but from 1994 to 1999, rainfall rose steeply and NDVI rose gently. However, between 2009 and 2014, rainfall decreased gently even though NDVI decreased sharply. Clearly, the explanation is more complex and, therefore, rainfall level may not be the only variable influencing rainfall-vegetation spatio-temporal relationship. Similarly, Chen, Wang and Fu (2020) concluded that it is reasonable to consider that vegetation response to rainfall anomalies can be influenced by some other factors, for example climatic
and biogeographical factors. More so, others have observed (e.g. Kochy 2008; Camberlin et al. 2007; Wang, Rich and Price 2003; Li, Tao and Dawson 2002) that, for tree-dominated ecological zones, NDVI anomalies exhibit weak correlations with rainfall anomalies, because trees with well-developed root systems are able to reach deep soil water resources and are weakly influenced by soil moisture variations. A similar study in Chipinge district of Zimbabwe by Jombo (2016) showed that from 1992 to 2014, rainfall did not have an impact on LULCC. So, if rainfall does not fully explain the changes in land cover, what does? The next sub-sections explore possible drivers.
Phase 1: 1984–99
Focusing on the first period within this phase (1984–1989), we see an increase in vegetation cover in what were the large-scale commercial farms (LSCFs) (Wards 26, 27, 29). This potentially indicates recovery of vegetation cover from the severe drought of 1982 to 1984 (Kinsey et al. 1998); however, there were other major droughts in this period (including 1986–1987) where a similar pattern is not observed. As discussed earlier, rainfall patterns do not appear to be a major determining factor.
Forest cover increases in this period may, however, be a response to the impact of sectoral and macroeconomic policies on the agricultural sector in Zimbabwe. Specifically, the impact of the relatively high cost of doing business in a highly regulated business environment involving price controls, labour market restrictions and trade and investment restrictions during this period. Across the country, this led to a general crop decline in the large-scale commercial sector (Jansen and Rukovo 1992). Following Independence in 1980, and despite the pronunciation of the national reconciliation policy, large-scale commercial agriculture experienced a decline in production in the early Independence years due to multiple uncertainties (Shonhe 2018; Weiner 1988).
The pattern in the core LSCF Wards, however, contrasts with Ward 8 (communal) and Ward 30 (also LSCF) during this period. In these LSCF Wards, there was a decrease in forest cover. After Independence,
5 EXPLAINING LAND COVER CHANGES, 1984–2018
17Working Paper 048 | February 2021
the coming of peace and the abandonment of the Protected Villages in Chiweshe, people in the communal areas were able to re-establish extensive fieldsiii (see also, Scoones et al. 2020). The contraction of large-scale commercial farming likely resulted in the shedding of farm labour, so former labourers then had to seek livelihoods through farming, which resulted in the clearing of new fields in the communal areas. The post-Independence support for communal area farming also provided incentives to increase production and clear land. After Independence, the Agriculture Finance Company extended support to communal farmers through amendment of the Agricultural Finance Act, which was combined with a massive expansion of agricultural extension, and a range of donor-led projects (Shonhe 2018; Pandey and Ramnarayan 1994).
During the second period in this phase (from 1989 to 1999) there is, by contrast, an increase in NDVI across the whole study area – in all the large-scale commercial farming Wards (26, 27, 29, 30), as well as in the communal area Ward 8. This can be related to a major change in macro-economic policy. Following pressure from the International Monetary Fund and the World Bank, the Government of Zimbabwe implemented ESAP in 1991 (Kawewe and Dibie 2000). ESAP focused on liberalising internal and external trade, by elimination of price controls, reduction of state marketing activities and restructuring of the banking and financial system (Matanda and Jeche 1998). In Zimbabwe, the initial years of ESAP implementation also overlapped with a major drought in 1991–92 (Marquette 1997; Scoones et al. 1996). The commercial farmers in Wards 26, 27, 28 and 30 benefited from ESAP through the boosting of export opportunities and the liberalisation of markets. Many commercial farmers in Mvurwi reduced the area under operation and concentrated on more high-value production for export resulting in large land areas under forest, hence the high NDVI (Wadzanayi Saburi, KII, 26 February 2020; Moyo 2000).
The high interest rates, removal of subsidies on agricultural inputs and reduction in government spending during ESAP period, however, had a negative impact on production in the communal and small-scale farming areas, since they relied on government subsidies for farm inputs (Riphenburg 1996). The cost of inputs became unaffordable to many communal farmers. Specifically, the price of fertilisers went up by 300 per cent in the period 1990 to 1995, leading to reduction in acreage under cultivation (Ismi 2004), consequently, a growth of forest area leading to increasing NDVI values was observed in Ward 8 of Chiweshe communal area.
The increase in forest cover – as signified by the increase in NDVI during the first phase (1984–99) and specifically between 1994 and 1999 in the LSCF Wards (26, 27, 30, and up to 1996 in Ward 29) – may be due to a reduction in the area under controlled commodities like maize and the intensification of horticultural activities in the commercial farming areas. The horticulture sub-sector’s export market channel grew from US$3.6 million in 1986 to reach US$142.7 million in 1999, accounting for 4.5 per cent of the Gross Domestic Product, as Zimbabwe’s horticultural exports attained the ranking as one of the leading exporters of the African, Caribbean and Pacific countries (SNV 2014). However, the observed decrease in NDVI from 1996 to 1999 in Ward 29 was likely a result of the expansion of cropped area by commercial farmers who sought to demonstrate their productivity in order to avoid eviction, as tension on the land question increased.ivv This was during a period of increasing interest in state expropriation of land, accompanied by widespread land occupations (Mkodzongi and Lawrence 2019).
The post-ESAP period of 1994 to 1999 was characterised by many policy reversals, as the government implemented ZIMPREST. While the main objective of ZIMPREST was to correct the mistakes of ESAP, which failed to achieve its results (Bonga 2014), not much was achieved through this new programme either. For instance, many factors between 1994 to 1999 led to a decline in agricultural performance: (1) poor rainfall during the 1997-98 season; (2) a sharp depreciation of the Zimbabwe dollar in 1998, which was due to low prices of Zimbabwe’s major minerals on the international market and low international prices of tobacco reducing foreign exchange earnings; (3) the slowdown in global economic performance in 1998, which reduced demand for exports; and (4) an unstable macro-economic environment, characterised by increasing inflation rates, high interest rates and a weak currency that negatively affected performance in most sectors of the economy, particularly manufacturing (Bonga 2014).
The deterioration in the macro-economic environment was also linked to the country’s participation in the Democratic Republic of Congo war and the large pay-out to war veterans, which led to Black Friday of 14 November 1997 (Shonhe 2018). Economic challenges were therefore linked to a decline in cropping area, signified by the increase in NDVI as shown in the satellite images of 18 June 1994 and 15 May 1999.
18 Working Paper 048 | February 2021
Phase 2: 1999–2004
The second phase spans from 1999 to 2004. On 15 July 2000, Zimbabwe launched The Fast Track Land Reform Programme (FTLRP) to speed up the pace of land acquisition and resettlement (Sachikonye 2005). In addition to the communal areas and the remaining LSCF areas, the FTLRP (2000–2002) increased the numbers of small-scale producers to over 145,000 through the A1 model and about 23,000 producers through small, medium and large-scale commercial farms of the A2 model (Matondi 2012; Moyo 2011; Scoones et al. 2011; Utete 2003). The decline in NDVI from around 1999 to 2004 is associated with the opening up of virgin and under-utilised land in the former LSCF areas. During an FGD, farmers in Ward 29 on 15 February 2020 indicated:vi
At the time of our arrival in this area, most of
the lands were lying idle. Extensive thick forests
covered what is now our village and fields, and
so a lot of work went into tree cutting and land
clearing as we settled in 2000. We were shocked
to learn that, despite opposition to our settlement
here, white farmers were barely using most of the
land. Only cattle roamed in the fenced forests,
with less than 200ha of the 2,500ha farm being
used for crop production.
Studies in Zimbabwe have demonstrated that there was significant under–utilisation of a land in the large-scale commercial farming (LSCF) areas (Roth and Bruce 1994; Roth 1990; Weiner 1988). However, while there was a general decline in NDVI across all LSCF Wards, there is an increase in NDVI in Ward 30 between 1999 and 2004, as well as a decrease between 2004 and 2009. As BM, an indigenous large-scale commercial farmer revealed during a KII in August 2017, the cutting down of trees was not as extensive in their area compared to others because their farm, surrounded by an electric fence, protected over 2,000ha. Initially, the family wanted to venture into eco-tourism, specialising in wildlife management. However, some newly settled A1 farmers removed the fence in the mid-2000s, and this led to deforestation from 2005.
The FTLRP coincided with unfavourable macro-economic conditions and a general dip in production of all commodities, specifically production by large-scale white farmers of wheat, tobacco, soya beans and sunflower which experienced both reduced area plantings and output volumes (30–70 per cent). In addition, 2002–2003 was a poor agriculture season characterised by erratic rainfall, and many farmers got insufficient inputs for their requirements due to
foreign currency shortages, supply disincentives and the reduction of seed producers (Moyo 2004a). Furthermore, there was capital flight associated with economic sanctions (European Union 2002 and USA 2003) imposed on Zimbabwe (Ogbonna 2017; Kairiza 2012; Chingono 2010). These factors contributed to reductions in planting of the opened up lands in the land reform areas.
In the communal areas, the post-2000 era was characterised by an influx of former farm workers who did not secure employment or allocated land, and relocated to their communal areas (Moyo 2004a). Furthermore, some former farm workers who could afford land purchases went on to acquire land in the nearby communal areas. This exerted pressure on the already congested communal lands, resulting in more land area being cleared for opening up fields and thus low NDVI values; for example, only 0.15 in Ward 8 of Chiweshe communal area in 2004.
Support for tobacco production in the communal areas accelerated land clearance, both for production and curing. In 2000, TABEX Holdings Limited – which was linked to the United Kingdom and was contracting smallholder farmers – focused support on communal farmers, avoiding the resettlement areas due to sanctions. Furthermore, a FGD in Chiweshevii revealed that, from 2002–2004 Agribank started giving loans to the communal sector, while in 2004, the Tobacco Industry Marketing Board started contracting farmers through loans.
Phase 3: 2004–09
The third phase between 2004 and 2009 is characterised by a significant (p<0.05) (Table 4.1) increase in forest NDVI (Figure 4.2). Due to capital flight, there was a lack of investments/funds on the domestic front in the agriculture sector (both commercial and communal sectors), and a major economic deterioration occurred over this period. The resettled farmers failed to gain access to investment resources and finance, partly due to the insecurity of their land tenure (Moyo 2004b). Inflation soared from about 20 per cent in December 1997 to 623 per cent in January 2004 (RBZ 2007). Inflation continued to rise between 2004 and 2007, caused in part by the Reserve Bank of Zimbabwe’s quasi-fiscal activities (Muñoz 2007).These activities included the provision of agricultural equipment and inputs such as fertilisers, transfers to parastatals, subsidised direct lending to banks and other companies, subsidised foreign exchange transfers and the purchase of military supplies and hardware (Center for Global Development 2014).
19Working Paper 048 | February 2021
Zimbabwe formally entered hyperinflation, according to Cagan's (1956) definition, in March 2007 when month-on-month inflation reached 50.54 per cent and year-on-year 2,200 per cent (RBZ 2007). The newly settled farmers were able to cultivate only about 50 per cent of the total arable land allocated to them during this period, owing to shortages of tractor/draught power, fuel and investment in infrastructure/improvements and absenteeism on the part of some new settler beneficiaries, especially in the medium-scale A2 farm areas (FAO and WFP 2009).
In addition to the collapse of agriculture due to the economic conditions, a FGD in Mvurwi on 18 February 2020 suggested that the significant increase in forest cover from 2004 to 2009 in the now settled former commercial farms may also have been accentuated by the removal of illegal land occupiers in many areas by government officials from 2006 (Matondi 2012). From 2000, in addition to settlers who gained permits to occupy (offer letters) following the land reform, there were also many illegal land occupiers who settled mainly in forests in the new resettlement areas and other commercial farms that were yet to be allocated (for example for A2 medium-scale farms). Alongside the sanctioned settlers under the FTLRP, they opened up fields that led to a decrease in forest cover during this period. However, attempts to evict illegal land occupiers declined after 2006, and many illegal land occupiers have since settled in grazing areas and forests.viii
Phase 4: 2009–18
The turning point in the agricultural sector and the economy in general was at the beginning of the fourth phase (2009–18), after the signing of the Global Political Agreement (GPA). The GPA was an agreement between the Zimbabwe African National Union-Patriotic Front (ZANU-PF) and the two Movement for Democratic Change (MDC) parties. The Government of National Unity (GNU) in Zimbabwe was born on 11 February 2009.ix The GPA was concerned about the challenges that faced Zimbabwe and the multiple threats to the well-being of the people and therefore determined to resolve these permanently (Mukuhlani 2014). With this accord, after 2009, the economy stabilised when a multi-currency system was introduced through the Short Term Emergency Recovery Programme (STERP), which addressed issues of runaway inflation and economic instability. Through STERP, the agricultural sector commodity marketing was liberalised.
By 2012, there was a surge in the numbers of tobacco contracting companies in Mvurwi, which by 2014 included Zimbabwe Leaf Tobacco, Chidziva, Boost Africa and TRIBAC/Shasha (Scoones et al. 2018).
Consequently, more farmers ventured into tobacco farming, taking advantage of the contract services and the ready availability of farming inputs in the local shops, resulting in a tobacco boom in Mvurwi (Scoones et al. 2018). This increased the demand for firewood for flue curing of tobacco and hence the resultant decline in forest cover from 2009 to 2014 became inevitable.
Furthermore, in 2013 the European Union relaxed its sanctions on Zimbabwe following the successful completion of the constitution-making process (Mukuhlani 2014). The improved economic environment saw inflation dipping to below 5 per cent by 2013 (ZIMSTATS 2013) In addition, the liberalisation of agricultural commodity trade and the removal of restrictions on foreign currency retention resulted in increased agricultural financing through reinvestment of sales proceeds associated with contract farming (Shonhe 2018). The increase in agriculture financing motivated the newly resettled farmers and the communal farmers to open up more land for agricultural activities and, in the process, resulted in cutting of trees and a consequent decrease in forest cover.
The period from 2014 to 2018 experienced a significant decrease in forest cover, as shown in Figures 4 and 6. However, Figure 4.2 indicates that the rate of decrease was lower than that of 1999 to 2004 and 2009 to 2014. A FGD in Mvurwi in February 2020 highlighted that most of FTLRP beneficiaries had already settled during this period, and so the rate of clearing land for settlement and new fields was reduced. Gum trees and coal for tobacco curing were gradually introduced from 2012, reducing the impact on indigenous woodlands. Tobacco companies and marketing boards also advocated for the use of gum trees and coal, and supplied these to the farmers as part of contracts and environmental rehabilitation projects. Several gum plantations, notably in community-owned ones in the communal area of Ward 8 and individual ones across the study area, are growing and have had a positive impact on the forest cover of the area, as shown in Figure 4.2.
However, although there is reduced stress on trees, a more subtle deforestation with a bias towards bigger trees was still practised during the 2014 to 2018 period, and would not have necessarily shown up in simple land cover analysis. Electricity shortages that lead to load shedding was experienced across the Mvurwi area. KIIs indicated that some people are illegally cutting trees (especially at night) for sale as a source of energy in Mvurwi and Concession towns. In Muswenede area of Ward 26, firewood is sold to Chiweshe communal area in support of tobacco production as well as other people, including makorokoza (illegal miners) in Rosa.x
20 Working Paper 048 | February 2021
Data in Figure 4.2 concur with those obtained by Masona (2014), who studied woodland NDVI in a Mashonaland East farm and recorded an increase in woodland NDVI from 1994 to 2000. However, from 2000 to 2005 the NDVI decreased and then increased up to 2009. Based on Figure 4.2, Ward 8 has the lowest forest cover throughout the study period. This concurs with the fact that communal areas have a higher population density and the most pressure on the land and natural resources, as compared to other areas that were once under LSCFs and are now resettlement areas.
5.1 Land cover and land use classification in Ward 26
As our overall assessment shows, many patterns can only be explained by reference to specific changes in particular areas. Our more focused study of Ward 26 provided granular data on NDVI and vegetation cover over the period under review.
Interviews conducted during field visits highlighted that LSCFs such as in Eastwolds/4 grew grass such as katambora, Kikuyu and star grass for use as hay during the first phase (1984–1999). The hay was used to feed mainly cattle and horses, which were reared in some farms such as Blanco. These areas were classified as grassland, but were intensively used. This is one reason why grassland occupied much of the area (averaging 50 per cent) up to 1999, as shown in Figure 4.4. Some of the LSCFs also did not rely on arable farming and fields. They had citrus plantations such as for granadilla, apples, lemons and oranges. Specific farms are Chidziva and Mondyness/B. Yet, through the NDVI analysis, these areas were classified as forests.
Water bodies did not experience significant changes throughout the study period. Figure 4.5 shows that the changes were within the range of 0 to 3 per cent of the total area. However, Musengezi dam, as revealed by the land classification in Figure 4.4, was built between 1989 and 1994, indicated by an increase in water body area. Few smaller dams were built as the years progressed, however.
During the second phase (1999–2004) the area under grassland increased from 51 per cent to 73 per cent, as illustrated in Figures 4.4 and 4.5. The decrease in area under forest (24 per cent to 14 per cent) and area under fields (22 per cent to 11 per cent) between 1999 and 2004 coincided with the FTLRP, which started in 2000. As discussed earlier, the programme led to the opening up of forest areas as new land beneficiaries occupied the newly allocated plots, but
in the first years land was not fully cleared and field areas remained limited. Indeed, on some former fields, bush and grass encroachment occurred. For example, in Pembi Chase farm near Mvurwi town this occurred as people took time to settle the new land and build new dwellings. Land invasions thus resulted in shifts in the classification from forest land to grassland or fields, but expansion of agriculture immediately after settlement in 2000-02 was limited (FGD, Pembi Chase farm, 25 February 2020). Besides maize, the new farmers started to grow tobacco, which needed timber for curing, resulting in a decline in forest cover.
However, there are some areas such as vleis (wetlands) in Mandindindi farm that were converted from grassland to fields as early as 2002. The same farm was originally a citrus plantation that grew guavas for export. However, some of these plantations were converted to fields during the 1999 to 2004 period. Figure 4.5 shows that there was a 41.6 per cent increase in area under fields from 1999 to 2018, as those occupying the land settled and expanded their farms. In the same period, forests recorded a 44 per cent decrease. There was no change in area under grassland and water. However, there is a difference between the spatial distributions of land cover over this period. For instance, some areas that were under grasslands in 1999, such as the vleis in Mandindindi farm, were converted to fields by 2018. Some areas that were forests (natural forests, gum or citrus plantations) in 1999 were converted to grasslands or fields.
However, there were a few plantations (especially those in Forester J Estates and south eastern side of Pembi Chase) that remain managed as plantations. Some former citrus plantations (such orange plantations near Musengezi dam in Sandford farm) are however experiencing invasion by other tree species such as Lantana camara, yet are still recorded as forests. Other plantations, such as in Mondeneys/B and Blanco farms, were recorded as forests or grasslands in 1999 but they were fields by 2018. In other words, the land invasions and subsequent settlement across the area of former LSCFs resulted in major changes in land cover/land use within the study period, with land reform not surprisingly resulting in an increased area of fields and a decline in forest cover. As the analysis of changes in Ward 26 shows, periods of economic crisis affect agricultural production; the area under fields fell drastically in 2004 and later rose as economic stability returned from 2009, eating mainly into grasslands (Figure 4.5).
21Working Paper 048 | February 2021
Our study has shown that land use change across Mvurwi has not been one of linear transformation due to secular change in factors such as population or climate. Instead, shifts have occurred with both increases and decreases in forest cover over time. This is the result of shifts in the wider political and economic context, which drives land use change but in a non-linear manner. Environments are always entwined with a wider political economy, and in the turbulent period since 1984, Mvurwi is no exception. We identified five phases, which were identified by an examination of NDVI changes over the whole study area, as well as through the more granular analysis within Ward 26. Insights from interviews and FGDs across the areaxi helped identify the land use change drivers.
Ground-truthing through interviews and discussions in the field is essential to gain a full picture. Thus, combining NDVI analysis of LULCC using satellite-based imagery with insights from a grounded political economy analysis reveals how environmental changes reflect an interplay of socio-economic, political and environmental factors.
Our analysis highlights, too, that environmental changes are not just the result of local land users’ choices. The wider macro-economic and political situation has a huge impact. For example, the contraction of commercial farm fields in the 1990s was linked to growing incentives to focus on high value crops for export, which required smaller land areas but increased capitalisation, such as for horticulture and floriculture. Similar incentives resulted in a shift to wildlife harvesting, which meant an expansion of forested areas, reducing the area of cropped fields. Equally, the period of hyperinflation in the 2000s, or the lack of government support after ESAP, saw a contraction of agricultural production and reduced levels of field expansion. The effects of climate change will likely continue to be heightened variability in rainfall, with drought shocks combining with wider political and economic drivers in particular ways to create shifts in land use, rather than seeing a simple, uni-directional change over time.
Over the last four decades, land use in Mvurwi area has changed dramatically. Clearly, the land reform has been the major shift, but there have been others, all combining in a complex way to result in a highly variable pattern that shows shifts back and forth in land cover categories in a spatially heterogeneous way. Our study therefore challenges any simplistic, linear interpretation and argues for an analysis of environmental change, focused here on land cover and land use, to be combined with a grounded understanding of political economy over time. Multiple drivers intersect and environmental change must therefore always be understood as co-constituted with social dynamics and political economy.
6 CONCLUSION
22 Working Paper 048 | February 2021
Abburu, S. and Suresh, B.G. (2015) ‘Satellite Image Classification Methods and Techniques: A Review’, International Journal of Computer Applications 119(8): 20–25
Asokan, A. and Anitha, J. (2019) ‘Change Detection Techniques for Remote Sensing Applications: A Survey’, Earth Science Informatics 12: 143–160
Atsalakis, G.S.; Bouri, E., Pasiouras, F. (2020) ‘Natural Disasters and Economic Growth: A Quantile on Quantile Approach’, Annals of Operations Research
Attri, P.; Chaudhry, S. and Sharma, S. (2015) ‘Remote Sensing & GIS based Approaches for LULC Change Detection – A Review’, International Journal of Current Engineering and Technology 5(5): 3126–3137
Bonga, W.G. (2014) ‘Economic Policy Analysis in Zimbabwe: A Review of Zimbabwe Economic Policies: Special Reference to Zimbabwe Agenda for Sustainable Socio-Economic Transformation (Zim Asset)’
Brabyn, L. et al. (2013) ‘Accuracy Assessment of Land Surface Temperature Retrievals from Landsat 7 ETM + in the Dry Valleys of Antarctica using iButton Temperature Loggers and Weather Station Data’, Environmental monitoring and assessment. 186
Brunette, W. et al. (2013) ‘ODK Tables: Building Easily Customizable Information Applications on Android Devices’, Seattle: University of Washington
Cagan, P. (1956) ‘The Monetary Dynamics of Hyperinflation’, in M. Friedman (ed.), Studies in the Quantity Theory of Money, Chicago: University of Chicago Press
Camberlin, P.; Martiny, N., Philippon, N. and Richard, Y. (2007) ‘Determinants of the Interannual Relationships between Remote Sensed Photosynthetic Activity and Rainfall in Tropical Africa’, Remote Sensing of Environment 106(2): 199–216
Center for Global Development (2014) Rebuilding Zimbabwe: lessons from a coalition government. Center for Global Development, Washington D.C.: Center for Global Development
Chasi, M..; Chinembiri, F., Mudiwa, C., Godfrey M. and Johnson, P. (1994) ‘The Commission of Enquiry into Lanure Tenure Systems in Zimbabwe (No. 3), Land Fragmentation’, Government of Zimbabwe: Harare
Chen, Z.; Wang, W. and Fu, J. (2020) ‘Vegetation Response to Precipitation Anomalies under Different Climatic and Biogeographical Conditions in China’, Scientific Reports 10(830)
Chigumira, E. (2010) Zimbabwe’s Fast Track Land Reform: Land Use Practices, Livelihoods and the Natural Environment at Three Resettled Areas in Kadoma District, Zimbabwe. Saarbrucken: LAP LAMBERT Academic Publishing
Chingono, H. (2010) ‘Zimbabwe sanctions: An Analysis of the “Lingo” Guiding the Perceptions of the Sanctioners and the Sanctionees’, African Journal of Political Science and International Relations 4(2): 66–74
CHIRPS (2019) CHIRPS: Rainfall Estimates from Rain Gauge and Satellite Observations, Santa Barbara: Climate Hazards Center https://www.chc.ucsb.edu/data/chirps (accessed 22 June 2019)
REFERENCES
23Working Paper 048 | February 2021
Cliffe, L.; Alexander, J., Cousins, B. and Gaidzanwa, R. (2011) ‘An Overview of Fast Track Land Reform in Zimbabwe: Editorial Introduction’, Journal of Peasant Studies 38(5): 907–938
Coffey, R. (2013) ‘The difference between “land use” and “land cover”’ Michigan State University Extension https://www.canr.msu.edu/news/the_difference_between_land_use_and_land_cover (accessed 11 May 2020)
FAO and WFP (2009) Special Report: FAO/WFP Crop and Food Security Assessment Mission to Zimbabwe, Rome: World Food Program/Food and Agriculture Organization of the United Nations
Gao, B. (1996) ‘A Normalized Difference Water Index for Remote Sensing of Vegetation Liquid Water from Space’, Remote Sensing of Environment 58(3): 257–266
Gómez, C.; White, C. and Wulder, M.A. (2016) ‘Optical Remotely Sensed Time Series Data for Land Cover Classification: A Review’, ISPRS Journal of Photogrammetry and Remote Sensing 116: 55–72
Haque, M. I. and Basak, R. (2017) ‘Land Cover Change Detection using GIS and Remote Sensing Techniques: A Spatio-Temporal Study on Tanguar Haor, Sunamganj, Bangladesh’, The Egyptian Journal of Remote Sensing and Space Science 20: 251–263
Islam, K.; Jashimuddin, M., Nath, B. and Nath, K. (2018) ‘Change Detection in Land-Use/Land-Cover Using Remote Sensing & G.I.S Techniques: A Case Study of Mahananda Catchment, West Bengal, Egypt’, Remote Sensing 21: 37–47
Ismi, A. (2004) Impoverishing a Continent: The World Bank and the IMF in Africa, Ottawa: Canadian Centre for Policy Alternatives
Jansen, D. and Rukovo, D. (1992) ‘Agriculture and the Policy Environment: Zambia and Zimbabwe’ OECD Development Centre Working Papers 74, OECD Publishing
Jennings, M.; Zumbo, B. and Joula, J. (2002) ‘The Robustness of Validity and Efficiency of the Related Samples t-test in the Presence of Outliers’, Psicológica 23: 415–450
Johnson, B.; Tateishi, R. and Hoan, N. 2013 ‘A Hybrid Pan Sharpening Approach and Multiscale Object-Based Image Analysis for Mapping Diseased Pine and Oak Trees’, International Journal of Remote Sensing 34: 6969–6982
Jombo, S.S. (2016) Quantifying the Impact of the Land Reform Programme on Land Use and Land Cover Changes in Chipinge District, Zimbabwe, Based on Landsat Observations, Johannesburg: University of the Witwatersrand
Jombo, S., Adam, E., Odindi, J. (2017) ‘Quantification of Landscape Transformation due to the Fast Track Land Reform Programme (FTLRP) in Zimbabwe using Remotely Sensed Data’, Land Use Policy, 68: 287–294
Kairiza, T. (2012) Unbundling Zimbabwe’s Journey to Hyperinflation and Official Dollarization, Tokyo: GRIPS Policy Information Center. Discussion Paper: 09-12
Kamavisdar, P.; Saluja, S. and Agrawal, S. (2013) ‘A Survey on Image Classification Approaches and Techniques’ International Journal of Advanced Research in Computer and Communication Engineering 2(1): 1005–1009
Kawewe, S.M. and Dibie, R. (2000) ‘The Impact of Economic Structural Adjustment Programs [ESAPs] on Women and Children: Implications for Social Welfare in Zimbabwe’, Journal of Sociology and Social Welfare 27(4): 79–104
Kinsey, B.; Burger, K. and Gunning, J. (1998) ‘Coping with Drought in Zimbabwe: Survey Evidence on Responses of Rural Households to Risk’, World Development 26: 89–110
Kochy, M. (2008) ‘Effects of Simulated Daily Precipitation Patterns on Annual Plant Populations Depend on Life Stage and Climatic Region’, BMC Ecology 8(4): 1–23
24 Working Paper 048 | February 2021
Levin, N. (2015) ‘Human Factors Explain the Majority of MODIS-Derived Trends in Vegetation Cover in Israel: A Densely Populated Country in the Eastern Mediterranean’, Regional Environmental Change 16: 1197–1211
Li, B.; Tao, S. and Dawson, R.W. (2002) ‘Relations between AVHRR NDVI and Ecoclimatic Parameters in China’ International Journal of Remote Sensing 23(5): 989–999
Lillesand, T.M. and Keifer, W. (1994) Remote Sensing and Image Interpretation, 3, Hoboken: John Wiley and Sons, Inc.
Marghany, M. and Hashim, M. (2011) ‘Comparison between Mahalanobis Classification and Neural Network for Oil Spill Detection using RADARSAT-1 SAR Data’ International Journal of Physical Sciences 6: 566–576
Marquette, C.M. (1997) ‘Current Poverty, Structural Adjustment, and Drought in Zimbabwe’, World Development 25(7): 1141–1149
Maselli, F. and Conese, C. (1994) ‘Use of Probability Entropy for the Estimation and Graphical Representation of the Accuracy of Maximum Likelihood Classifications’, Journal of Photogrammetry and Remote Sensing 49(2): 13–20
Masona, E. (2014) Land Use/Land Cover Changes and Stakeholders: Investigating Sustainable Natural Resources Management Options for an A1 Farm. A Case Study of Essexdale Farm in Marondera District, Zimbabwe, Harare: University of Zimbabwe
Matanda, M. and Jeche, P. (ed.) (1998) Impact of ESAP on Agricultural Marketing Activities and Systems, in: Economic Policy Reforms and Meso-Scale Rural Market Changes in Zimbabwe: The Case of Shamva District. Brighton: Institute of Development Studies
Matavire, M.M.; Sibanda, M. and Dube, T. (2015) ‘Assessing the Aftermath of the Fast Track Land Reform Programme in Zimbabwe on Land-Use and Land-Cover Changes’, Transactions of the Royal Society of South Africa 70(2): 181–186
Matondi, P.B. (2012) Zimbabwe’s Fast Track Land Reform, London: Zed Books Ltd.
Matsa, M. and Muringaniza, K. (2011) (19) ‘An Assessment of the Land Use and Land Cover Changes in Shurugwi District Zimbabwe’, Ethiopian Journal of Environmental Studies and Management 4(2): 81–92
Mensah, E.; Wapaburda, S. and Hammond, F. (2017) ‘A Hybrid Image Classification Approach to Monitoring LULC Changes in the Mining District of Prestea-Huni Valley, Ghana’, Journal of Environment and Earth Science 7(3): 1–10
Mkodzongi, G. and Lawrence, P. (2019) ‘The Fast-Track Land Reform and Agrarian Change in Zimbabwe’, Review of African Political Economy 46(159): 1–13
Moyo, S. (2011) ‘Three Decades of Agrarian Reform in Zimbabwe’, The Journal of Peasant Studies 38(3): 493–531
Moyo, S. (2000) Land Reform under Structural Adjustment in Zimbabwe: Land Use Change in the Mashonaland Provinces, Uppsala: Nordic Africa Institute
Moyo, S. (2004a) ‘Overall Impacts of Fast Track Land Reform Programme’ https://www.researchgate.net/publication/242138861_Overall_Impacts_of_Fast_Track_Land_Reform_Programme (accessed 15 April 2020)
Moyo, S. (2004b) ‘The Land and Agrarian Question in Zimbabwe’ Harare: African Institute of Agrarian Studies
Mukuhlani, T. (2014) ‘Zimbabwe’s Government of National Unity: Successes and Challenges in Restoring Peace and Order’ Journal of Power, Politics & Governance 2(2): 169–180
25Working Paper 048 | February 2021
Muñoz, S. (2007) ‘Central Bank Quasi-Fiscal Losses and High Inflation in Zimbabwe: A Note (SSRN Scholarly Paper No. ID 984614)’, Social Science Research Network, Rochester, NY
Murisa, T. (2016) ‘Prospects for Equitable Land Reform in Zimbabwe: Revisiting Sam Moyo’s Work on the Land Question’ Agrarian South: Journal of Political Economy 5(2–3): 240–264
Mutanga, S.; Ramoelo, A. and Gonah, T. (2013) ‘Trend Analysis of Small Scale Commercial Sugarcane Production in Post Resettlement Areas of Mkwasine Zimbabwe, Using Hyper-Temporal Satellite Imagery’ Advances in Remote Sensing 2(1): 29–34
Myneni, R.B.; Keeling, C.D.; Tucker, C.J.; Asrar, G. and Nemani, R.R. (1997) ‘Increased Plant Growth in the Northern High Latitudes from 1981 to 1991’, Nature 386: 698–702
Nageswara, P.; Shobha, S.V., Ramesh, K.S. and Somashekhar, R.K. (2005) ‘Satellite-Based Assessment of Agricultural Drought in Karnataka State’, Journal of the Indian Society of Remote Sensing 33(3): 429–434
Ogbonna, C. (2017) ‘Targeted or Restrictive: Impact of U.S. and EU Sanctions on Education and Healthcare of Zimbabweans’, African Research Review 11(3): 31–41
Pandey, I.M. and Ramnarayan, S. (1994) ‘Agricultural Finance Corporation, Zimbabwe’ Vikalpa 19(2): 47–62
Rawat, J.S. and Kumar, M. (2015) ‘Monitoring Land Use/Cover Change Using Remote Sensing and GIS Techniques: A Case Study of Hawalbagh Block, District Almora, Uttarakhand, India’, The Egyptian Journal of Remote Sensing and Space Science 18(1): 77–84
RBZ (2007) Monetary policy first quarter, Harare: National Bank of Zimbabwe
Riphenburg, C.J. (1996) ‘The Gender-Differentiated Impact of Structural Adjustment on Political Expression and Employment in Zimbabwe’, Asian and African Studies 5(2): 197–219
Roth, M. (1990) ‘Analysis of Agrarian Structure and Land Use Patterns in Zimbabwe’ Background paper prepared for World Bank Agricultural Sector Memorandum, Washington: World Bank
Roth, M. and Bruce, J.W. (1994) ‘Land Tenure, Agrarian Structure, and Comparative Land Use Efficiency in Zimbabwe: Options for Land Tenure Reform and Land Redistribution’, Land Tenure Centre University of Wisconsin-Madison
Rouse, J.W., Jr.; Haas, R.H., Schell, J.A. and Deering, D.W. (1974) ‘Monitoring Vegetation Systems in the Great Plains with Erts’, NASA Special Publication, 351: 309
Sachikonye, L. (2005) ‘The Land is the Economy’, African Security Review 14(3): 31–44
Scoones, I. et al. (1996) ’Hazards and Opportunities. Farming Livelihoods in Dryland Africa. Lessons from Zimbabwe’, Journal of Southern African Studies 23
Scoones, I. et al. (2011) ‘Zimbabwe’s Land Reform: Challenging the Myths’, Journal of Peasant Studies 38: 967–993
Scoones, I.; Mavedzenge, B., Murimbarimba, F. and Sukume, C. (2018) ‘Tobacco, Contract Farming, and Agrarian Change in Zimbabwe’, Journal of Agrarian Change 18(1): 22–42
Scoones, I. et al. (2020) ‘Transformations to Sustainability: Combining Structural, Systemic and Enabling Approaches, Current Opinion in Environmental Sustainability, 42: 65–75
Sharma, R. et al. (2019) ‘Impact of Land Cover Change on Ecosystem Services in a Tropical Forested Landscape’, Resources 8(1): 18
26 Working Paper 048 | February 2021
Shonhe, T. (2018) ‘The Political Economy of Agricultural Commercialisation in Zimbabwe’, APRA, Future Agricultures Consortium
Sibanda, M. and Murwira, A. (2012) ‘The Use of Multi-Temporal MODIS Images with Ground Data to Distinguish Cotton from Maize and Sorghum Fields in Smallholder Agricultural Landscapes’, International Journal of Remote Sensing 33(16): 4841–4855
SNV (2014) Horticulture Sub-Sector Study, The Hague: Netherlands Development Organisation
Solomon, N. et al. (2018) ‘Forest Cover Change, Key Drivers and Community Perception in WujigMahgo Waren Forest of Northern Ethiopia’, Land 7(1): 32
Sun, T.; Chen, F., Zhong, L., Liu, W. and Wang, Y. (2019) ‘GIS-Based Mineral Prospectivity Mapping Using Machine Learning Methods: A Case Study from Tongling Ore District, Eastern China’, Ore Geology Reviews 109: 26–49
Tucker, C.J. (1979) ‘Red and Photographic Infrared Linear Combinations for Monitoring Vegetation’, Remote Sensing of Environment 8(2): 127 –150
Turner, W. et al. (2015) ‘Free and Open-Access Satellite Data are Key to Biodiversity Conservation’, Biological Conservation 182: 173–176
Utete, C.M.B. (2003) ‘Report of the Presidential Land Review Committee under the Chairmanship of Dr Charles MB Utete Volume 1’, Harare: President of the Republic of Zimbabwe
UNDP (2017) El Niño-Southern Oscillation (ENSO) Cycle Events and their Impacts in Zimbabwe, New York: United Nations Development Programme
Wang, J.; Rich, P.M. and Price, K.P. (2003) ‘Temporal Responses of NDVI to Precipitation and Temperature in the Central Great Plains, USA’, International Journal of Remote Sensing 24(11): 2345–2364
Weiner, D. (1988) ‘Agricultural Transformation in Zimbabwe: Lessons for South Africa after Apartheid’, Geoforum, Skilled International Labour Migration 19: 479–496
Wulder, M.A. et al. (2016) ‘The Global Landsat Archive: Status, Consolidation, and Direction’ Remote Sensing of Environment 185: 271–283
Xie, Y.; Sha, Z. and Yu, M. (2008) ‘Remote Sensing Imagery in Vegetation Mapping: A Review’, Journal of Plant Ecology 1(1): 9–23
ZIMSTATS, 2013. Quarterly Digest of Statistics ; 3rd Quarter 2013. Harare: Zimbabwe National Statistics Agency
Zubir, N.S.A. et al. (2018) ‘Statistical Analysis of Agarwood Oil Compounds in Discriminating the Quality of Agarwood’, Journal of Fundamental and Applied Sciences 9: 45

27Working Paper 048 | February 2021
i In the field of vegetation mapping, the most commonly applied sensors include Landsat (mainly TM and ETM+), SPOT, MODIS, NOAA–AVHRR, IKONOS and QuickBird (Xie, Sha and Yu 2008).ii The android-based questionnaire was guided by the following questions:
1. Date 2. Starting time 3. Interviewee number 4. Ward 265. Farm name 6. Plot number 7. Household name 8. Designation 9. Sex of respondent 10. Age of respondent 11. Marital status 12. Level of education 13. When did you start staying in the area? 14. Primary occupation 15. Secondary occupation 16. Number of people in the household 17. GPS coordinates18. Why did you choose to be resettled or to acquire a plot of land? What was your decision
making? Who made the decision or who/what influenced you?19. How did you get the ownership of the plot? (Land ownership type (rental, lease, permit,
nothing)). If renting can they explain how they entered into the rental arrangement, what agreements were signed, do they pay some form of rent/what is the arrangement?
20. What was the initial size of land you cultivate when you arrived on the plot? Which is the area? Where there any changes on size of the cultivated land up to now? What influenced the change or absence of change?
21. What was the land use or land cover when you resettled? Which changes in the state of the land occurred, if there is any and when is that?
22. Can you tell us the type of crops that you have been growing since resettlement? 23. If you grow tobacco, when did you started doing that? What do you use for curing and where
do you get the materials? 24. What motivates you to engage in that type of farming activity?25. Can we have a discussion of the maps of this area which show the state of the land over
several years back? Can you tell us what is happening, do you think it’s true?26. Why do you think we are seeing these changes in the map, what is causing this pattern? 27. What kind of trees is found in this area? Are there any that you think are disappearing and is
so, which ones are these?28. Are there any sacred areas of this farm or this area where trees are not permitted to be cut?
Where are they? Would you be able to show us? Why is it sacred?29. Are there any specific trees best suitable for tobacco curing in these areas .If there are any, are
they found in this area, if not where do you get them?30. What is your main energy source and where do you obtain it from?
ENDNOTES
28 Working Paper 048 | February 2021
Agricultural Policy Research in Africa (APRA) is a programme of the Future Agricultures Consortium (FAC) which is generating new evidence and policy-relevant insights on more inclusive pathways to agricultural
commercialisation in sub-Saharan Africa. APRA is funded with UK aid from the UK Foreign, Commonwealth & Development O�ce (FCDO) and will run from 2016-2022.
The APRA Directorate is based at the Institute of Development Studies (IDS), UK (www.ids.ac.uk), with regional hubs at the Centre for African Bio-Entrepreneurship (CABE), Kenya, the Institute for Poverty, Land and Agrarian Studies (PLAAS), South Africa, and the University of Ghana, Legon. It
builds on more than a decade of research and policy engagement work by the Future Agricultures Consortium (www.future-agricultures.org) and involves more than 100 researchers and communications professionals in Africa, UK, Sweden and USA.
31. In your own view, do you think land cover (grassland, forests, field, waterbodies) in this area has changed? What are the main reasons behind these changes?
32. Is there anything of importance that you would like to tell me, that would help this research?
iii FGD, Chiweshe, 22 February 2020 iv FGD, Hariana, 23 February 2020v Personal interview with WS (Wadzanayi Saburi), 26 February 2020vi FGD, Farmers in Ward 29 on 15 February 2020vii FGD in Chiweshe, 17 February 2020viii Personal interview, KN, 19 February 2020ix The GNU emerged out of mediation by Thabo Mbeki the then South African president. Negotiations started in September 2008 and it subsequently resulted in the signing of the GPA on 15 September 2009 by R.G Mugabe (ZANU-PF), M. Tsvangirai (MDC-T) and A. Mutambara (MDC-M)x Personal observation, 25 March 2020xi FGD, Pembi Chase farm, 25 February 2020
Agricultural Policy Research in Africa (APRA) is a new, Þve-year, Research Programme Consortium funded by UK aid from the UK Government through the Department for International Development
(DFID) and will run from 2016-2021.
The programme is based at the Institute of Development Studies (IDS), UK (www.ids.ac.uk), with regional hubs at the Centre for frican Bio-Entrepreneurship (CABE), Kenya, the Institute for Poverty, Land and Agrarian Studies (PLAAS), South Africa, and the
University of Ghana, Legon. It builds on more than a decade of research and policy engagement work by the Future Agricultures Consortium (www.future-agricultures.org) and involves new partners at Lund University, Sweden, and Michigan State University
and Tufts University, USA.
Agricultural Policy Research in Africa (APRA) is a programme of the Future Agricultures Consortium (FAC) which is generating new evidence and policy-relevant insights on more inclusive pathways to agricultural
commercialisation in sub-Saharan Africa. APRA is funded with UK aid from the UK Foreign, Commonwealth & Development O�ce (FCDO) and will run from 2016-2022.
The APRA Directorate is based at the Institute of Development Studies (IDS), UK (www.ids.ac.uk), with regional hubs at the Centre for African Bio-Entrepreneurship (CABE), Kenya, the Institute for Poverty, Land and Agrarian Studies (PLAAS), South Africa, and the University of Ghana, Legon. It
builds on more than a decade of research and policy engagement work by the Future Agricultures Consortium (www.future-agricultures.org) and involves more than 100 researchers and communications professionals in Africa, UK, Sweden and USA.
This report is funded with UK aid from the UK government (Foreign, Commonwealth & Development O�ce – FCDO, formerly DFID). The opinions are the authors’ and do not necessarily re�ect the views or policies of IDS or the UK government.
Funded by
Maguranyanga, C.; Marozva K., Scoones, I. and Shonhe, T. (2021) The Political Economy of Land Use and Land Cover Change in Mvurwi Area Zimbabwe, 1984–2018, APRA Working Paper 48, Brighton: Future Agricultures Consortium
© APRA 2021
ISBN: 978-1-78118-765-4 DOI: 10.19088/APRA.2021.001
This is an Open Access report distributed under the terms of the Attribution-Non Commercial-No Derivs 4.0 Unported (CC BY-NC-ND 4.0)Attribution — You must give appropriate credit, provide a link to the license, and indicate if changes were made. You may do so in anyreasonable manner, but not in any way that suggests the licensor endorses you or your use. NonCommercial — You may not use the materialfor commercial purposes. NoDerivatives — If you remix, transform, or build upon the material, you may not distribute the modified material.You are free to: Share — copy and redistribute the material in any medium or format.
https://creativecommons.org/licenses/by-nc-nd/4.0/legalcode
If you use the work, we ask that you reference the APRA website (www.future-agricultures.org/apra/) and send a copy of the work or a link toits use online to the following address for our archive: APRA, Future Agricultures Consortium, University of Sussex, Brighton BN1 9RE, UK ([email protected])
All APRA Working Papers go through a review process before publication.
DO YOU HAVE COMMENTS ON THIS PAPER?
We would welcome your feedback on this working paper!
To provide brief comments, please follow this link to our short APRA Working Paper Feedback form: https://goo.gl/forms/1iVnXhhrlGesfR9