Embed Size (px)
Citation preview

Working Papers
8Working Paper
Air Quality Monitoring
NSW Roads and Traffic Authority


Connell Wagner Pty Ltd ABN 54 005 139 873116 Military RoadNeutral Bay New South Wales 2089 Australia
Telephone: +61 2 9465 5599 Facsimile: +61 2 9465 5598 Email: [email protected] www.conwag.com
Air Quality Monitoring
Sapphire to WoolgoolgaPacific Highway Upgrade
Roads & Traffic Authority
9 August 2007 Reference 1093.28/ Revision

Sapphire to Woolgoolga Pacific Highway Upgrade Roads and Traffic Authority
Table of Contents
Section Page
1. Introduction 1
2. Summary of Results 2
3. Conclusions 4
Appendix A Environmental Report – Ambient Air Monitoring Sapphire to Woolgoolga
_2007-08-09_
FINAL.DOC PAGE i


Sapphire to Woolgoolga Pacific Highway Upgrade Roads and Traffic Authority
1. Introduction
As part of the Environmental Assessment process for the proposed upgrade of the Pacific Highway between Sapphire and Woolgoolga (the Proposal), an air quality monitoring station was established at Korora. Air quality monitoring has been undertaken to provide air quality data for a typical section of dual carriageway on the Pacific Highway in or adjacent to a regional centre. The monitoring has been undertaken more to provide additional information to the community regarding air quality rather than being motivated by standard assessment practice or by apparent air quality issues in the area.
The monitoring station was located approximately 0.5 km from the southern extent of the Proposal, on the northern side of the Korora Rural Fire Service shed, approximately 20m from the western edge of the existing four lane dual carriageway Pacific Highway (refer Figure 1). To the west of the monitoring station site is the Korora Nature Reserve, while to the east is the Pacific Highway, Korora Public School and adjacent residential areas.
The sign posted speed limit for the Pacific Highway adjacent to the monitoring site is 100 km/h. While the 2006 annual average daily traffic volume on this section of the highway is approximately 20,500 vehicles per day (veh/day), the period of air quality monitoring at Korora included the 2005/06 Christmas and New Year holidays when traffic volumes were substantially higher than annual average daily traffic volumes. The monitoring equipment is located at a point on the highway where there is a climbing gradient of 5.2% from north to south (ie southbound lanes are climbing).
The Korora monitoring station was established to provide data on air quality adjacent to the Pacific Highway. The air quality monitoring site at Korora is understood to be the first such installation for air quality data collection for a Pacific Highway upgrade project. The monitoring station was equipped to monitor the following air quality and meteorological parameters:
Carbon monoxide (CO)
Oxides of Nitrogen (NOx)
Nitrogen Dioxide (NO2)
Nitrogen monoxide (NO)
Particulate matter (fine particles 10 micrometres( m) or less in size) (PM10)
Particulate matter (fine particles 2.5 micrometres ( m) or less in size) (PM2.5)
Wind speed
Wind direction
Air temperature
Relative humidity
Due to the proximity of the monitoring site to the Pacific Highway, the concentrations of air quality parameters measured include traffic emissions. Therefore, the concentrations detected are likely to be higher than the background levels for the local area and will give a conservative indication of the air quality experienced on the NSW north coast.
Monitoring was undertaken at the site between 14 October 2005 and 31 January 2006. Specific details of the monitoring station are provided in Appendix A.
_2007-08-09_
FINAL.DOC PAGE 1

���������������
���������������������������������������������
���������������������������������������������������������������������������������������������������������������������������������������������������������������������������������������������������������������������������������������������������������������������������������������������������������������������������
�� � ����� � �� ��
�� � ����� � �� ��
�� � ����� � �� ��
�� � ����� � �� ��
�� � ����� � �� ��
�� � ����� � �� ��
�� � ����� � �� ��
�� � ����� � �� ��
�� � ����� � �� ��
�� � ����� � �� ��
�� � ����� � �� ��
�� � ����� � �� ��
�� � ����� � �� ��
�� � ����� � �� ��
�� � ����� � �� ��
�� � ����� � �� ��
�� � ����� � �� ��
�� � ����� � �� ��
�� � ����� � �� ��
�� � ����� � �� ��
�� � ����� � �� ��
�� � ����� � �� ��
�� � ����� � �� ��
�� � ����� � �� ��
�� � ����� � �� ��
�������
��������
��
�������
��������
��
�������
��������
��
�������
��������
��
�������
��������
��
�������
��������
��
�������
��������
��
�������
��������
��
�������
��������
��
�������
��������
��
�������
��������
��
�������
��������
��
�������
��������
��
�������
��������
��
�������
��������
��
�������
��������
��
�������
��������
��
�������
��������
��
�������
��������
��
�������
��������
��
�������
��������
��
�������
��������
��
�������
��������
��
�������
��������
��
�������
��������
��
���� ���� ���� ���� ���� ���� ���� ���� ���� ���� ���� ���� ���� ���� ���� ���� ���� ���� ���� ���� ���� ���� ���� ���� ����
� �������� ���
��������� ���
��������� ���
��������� ���
��������� ���
��������� ���
��������� ���
��������� ���
��������� ���
��������� ���
��������� ���
��������� ���
��������� ���
��������� ���
��������� ���
��������� ���
��������� ���
��������� ���
��������� ���
��������� ���
��������� ���
��������� ���
��������� ���
��������� ���
��������� ���
�������
����
����
����
����
����
����
����
����
����
����
����
����
����
����
����
����
����
����
����
����
����
����
����
����
���
���
���
���
���
���
���
���
���
���
���
���
���
���
���
���
���
���
���
���
���
���
���
���
���
�� ������������������ �����
�������������������������������
� � ���!�"�
#
����$��������������� �����
��%�&�%��� '(��)* ��+����
,� �����
��**'�������-��� ��� �
����%�.��������*'��� ��*'�/0(���1�����%2���� ���3
"� ��+

Sapphire to Woolgoolga Pacific Highway Upgrade Roads and Traffic Authority
_2007-08-09_
FINAL.DOC PAGE 2
2. Summary of Results
This section provides a brief summary of the results of the data collected over the monitoring period, with the full results presented in Appendix A.
In setting air quality goals for NSW, the Department of Environment and Climate Change (DECC), incorporating the Environment Protection Authority (EPA), has looked to the air quality standards outlined by the National Environment Protection Council of Australia, which are part of the National Environment Protection Measures (NEPMs). Three of the parameters measured at the Korora monitoring site are outlined in the NEPM for ambient air quality. These parameters are identified in Table 1 on the following page, as is an advisory reporting standard for PM2.5. The DECC’s assessment goals are numerically equivalent to the NEPM goals, but do not allow for any exceedances.
There are no NEPM goals for the parameters NO and NOx. Key results for the Korora monitoring station were as follows:
The maximum 8-hour average CO concentration was 0.3 mg/m3, compared with the NEPM goal of 10 mg/m3. The 8-hour average CO data is shown in Section 2.5 of Appendix A.
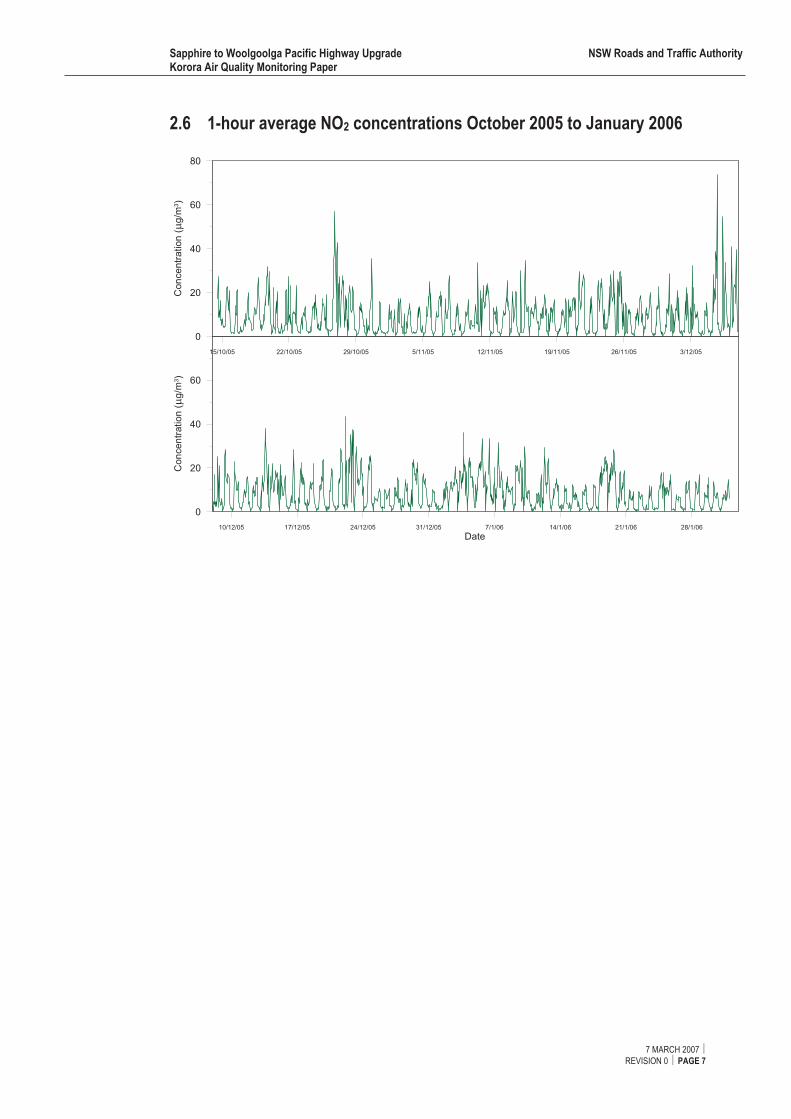
The maximum 1-hour average NO2 concentration was 69.6 g/m3 compared with the NEPM goal
of 246 g/m3. The 1-hour average NO2 data is shown in Section 2.6 of Appendix A.
The maximum 24-hour average PM10 and PM2.5 concentrations were 37.8 g/m3 and 15.4 g/m3
compared with the NEPM goals of 50 g/m3 and 25 g/m3 respectively. 24-hour average PM10 and PM2.5 data is shown in Section 3.5 and Section 3.6 of Appendix A respectively.

goolga Pacific Highway Upgrade Roads and Traffic Authority
_2007-08-09_ FINAL.DOC PAGE 3
Table 1: National Environment Protection Measure for Ambient Air Quality
NEPM Goals Korora Monitoring Results Pollutant AveragingPeriod Maximum
ConcentrationGoal within 10 years (Maximum Allowable
Exceedence)
Maximum Recorded
Concentration
Recorded 90th
percentileConcentration
AverageRecorded
Concentration
National Standards and Goals for Ambient Air Quality
CO 8 hrs 9.0 ppm (10 mg/m3)
1 day a year 0.2 ppm (0.3 mg/m3)
0.07 ppm (0.08 mg/m3)
0.03 ppm (0.04 mg/m3)
NO2 1 hr 0.12 ppm (246 g/m3)
1 day a year 0.037 ppm (69.6 g/m3)
0.010 ppm (18.81 g/m3)
0.004 ppm (9.2 g/m3)
Particles as PM10
1 day 50 g/m3 5 days a year 37.8 g/m3 29.8 g/m3 20.3 g/m3
Advisory Reporting Goals
Particles as PM2.5
1 day 25 g/m3 Goal is to gather sufficient data
nationally to facilitate a review of the goal
15.4 g/m3 10.8 g/m3 7.7 g/m3
Sapphire to Wool

Sapphire to Woolgoolga Pacific Highway Upgrade Roads and Traffic Authority
3. Conclusions
The purpose of the monitoring station at Korora was to establish the level of current emissions due to traffic on the Pacific Highway to ensure that air quality close to the road is satisfactory and that the Proposal would not have a significant impact on ambient air quality.
The monitoring station was set up to monitor a likely “worst case” situation, with the station being close (20m) to the western edge of a four lane section of highway with a significant climbing grade (5.2 percent) and was conducted over the peak traffic (November, December, January) Christmas holiday period.
The results of the Korora monitoring station indicate that immediately adjacent to the highway, peak readings, and the commonly used 90th percentile readings, of the regulated emissions (CO, NO2 and PM10) were all considerably less than the limits specified in the National Environment Protection Measure. Consequently, the recorded air quality at the Korora monitoring station was considerably better than the air quality goals specified in the National Environment Protection Measure.
The non-regulated PM 2.5 was also measured. The levels of PM 2.5 peaked at 15.4 ug/m3 against a possible National Environment Protection Measure goal of 25ug/m3. The 90th percentile reading was 10.8 g/m3.
The highest emission readings generally occurred during holiday periods or at night. On occasions these higher readings could have been due to traffic on the dirt access track next to the monitoring station, activity around the Rural Fire Service shed or to bush fires.
The National Environment Protection Measure goals are actually ambient air quality goals that are intended to be applied at locations away from the influence of significant emission sources. Dispersion would reduce the pollutant levels significantly as the distance from the road increases. For example, levels 100 metres from the road would be closer to ambient levels and would be around half of the levels recorded at the monitoring station.
As the Proposal is predicted to carry less vehicle traffic than at Korora (volumes reduce with distance north from Coffs Harbour), and have a lower grade than the Korora stretch of highway (maximum grade to be 4 percent), it is anticipated that during operation, the Proposal would also comply with the National Environment Protection Measure goals.
Construction air quality impacts are predictable and can be adequately addressed through standard good practice mitigation measures which would be outlined in the Air Quality Management Plan which would form part of the Construction Environmental Management Plan (CEMP) for the Proposal.
_2007-08-09_
FINAL.DOC PAGE 4


Appendix A Environmental Report – Ambient Air Monitoring Sapphire to Woolgoolga


Connell Wagner Pty Ltd ABN 54 005 139 873 116 Military Road Neutral Bay New South Wales 2089 Australia
Telephone: +61 2 9465 5599 Facsimile: +61 2 9465 5598 Email: [email protected] www.conwag.com
Korora Air Quality Monitoring PaperSapphire to Woolgoolga Pacific Highway UpgradeNSW Roads and Traffic Authority
7 March 2007 Reference 109328GE
Revision 2


Sapphire to Woolgoolga Pacific Highway Upgrade NSW Roads and Traffic Authority Korora Air Quality Monitoring Paper
NATA Accredited Laboratory - Connell Wagner Number: 4669
The following parameters are included in the scope of accreditation.
Air monitoring parameters – carbon monoxide; light scattering; nitrogen oxides; ozone; particulates-PM10, total suspended; sulfur dioxide
Meteorological parameters and Radiation – global, net; rainfall; relative humidity; temperature; wind direction; wind speed – horizontal.
Prepared by:
Michelle Manditch.
Checked by:
Maurice Stewartson
NATA Signatory/ Air Monitoring:
Maurice Stewartson.
7 MARCH 2007
REVISION 0 PAGE i


Sapphire to Woolgoolga Pacific Highway Upgrade NSW Roads and Traffic Authority Korora Air Quality Monitoring Paper
7 MARCH 2007
REVISION 0 PAGE ii
Disclaimer
Important Things You Should Know About This Report
Exclusive Benefit and Reliance
This report have been prepared by Connell Wagner Pty Ltd, at the request of and exclusively for the benefit and reliance of its Client This report is not a certification, warranty or guarantee. It is a report scoped in accordance with the Client’s instructions, having due regard to the assumptions that Connell Wagner Pty Ltd can be reasonably expected to make in accordance with sound engineering practice and exercising the obligations and the level of skill, care, and attention required of it under this contract.
Third Parties
It is not possible to make a proper assessment of the report without a clear understanding of the terms of engagement under which the report has be prepared, including the scope of the instructions and directions given to and the assumptions made by the engineer/ scientist/ technician who has prepared the report. The report is a report scoped in accordance with instructions given by or on behalf of the Client. The report may not address issues which would need to be addressed with a third party if that party’s particular circumstances, requirements and experience with such reports were known and may make assumptions about matters of which a third party is not aware. Connell Wagner therefore does not assume responsibility for the use of the report by any third party and the use of the report by any third party is at the risk of that party.
Inherent Risk
The owner, operator or prospective purchaser of any plant or asset necessarily assumes the risk of there being defects inherent in the plant or asset. The information contained in this report can assist an owner or prospective purchaser [or “whatever”] in making an assessment of that risk but does not eliminate that risk.
Limits of Investigation and Information
The report is also based on information provided to Connell Wagner by other parties. The report is provided strictly on the bases that the information that has been provided can be relied on and is accurate, complete and adequate. Connell Wagner takes no responsibility and disclaims all liability whatsoever for any loss or damage that the Client may suffer resulting from any conclusions based on information provided to Connell Wagner, except to the extent that Connell Wagner expressly indicates in the report that it has verified the information to it’s satisfaction.


Sapphire to Woolgoolga Pacific Highway Upgrade NSW Roads and Traffic Authority Korora Air Quality Monitoring Paper
ontentsCSection Page
ow About This Report efit and Reliance
Limits of Investigation and Information ii
1.1.1 Korora 1
y
2.6 1-hour average NO concentrations October 2005 to January 2006 7
3. 10 a onthly summary
5
3.6 24-hour average PM2.5 concentrations October 2005 to January 2006 13
4.
e 4.4 January 2006 windrose 17
h 5.4 January 2006 temperature graph 21
6.h
y 6.4 January 2006 relative humidity 25
Disclaimer iiImportant Things You Should Kn iiExclusive Ben iiThird Parties iiInherent Risk ii
Introduction 1
2. bon f Nitrogen Summaries Car Monoxide and Oxides o 22.1 Korora October 2005 Summary 22.2 Korora November 2005 Summary 32.3 Korora December 2005 Summar 42.4 Korora January 2006 Summary 52.5 8-hour average CO concentrations October 2005 to January 2006 6
2
PM nd PM2.5 m 83.1 October 2005 83.2 November 2005 93.3 December 200 103.4 January 2006 113.5 24-hour average PM10 concentrations October 2005 to January 2006 12
Climatic graphs 144.1 October 2005 Windrose 144.2 November 2005 Windrose 154.3 December 2005 windros 16
5. Temperature Graphs 185.1 October 2005 Temperature Graph 185.2 November 2005 temperature graph 195.3 December 2005 temperature grap 20
Relative Humidity Graphs 226.1 October 2005 relative humidity grap 226.2 November 2005 relative humidity 236.3 December 2005 relative humidit 24
7. Solar Radiation Graphs 267.1 October 2005 solar radiation graph 267.2 November 2005 solar radiation graph 27

Sapphire to Woolgoolga Pacific Highway Upgrade NSW Roads and Traffic Authority Korora Air Quality Monitoring Paper
7 MARCH 2007
REVISION 0 PAGE iv
7.3 December 2005 so 287.4 January 2006 so 29
lar radiation graph lar radiation graph
. Calibration Graphs 308
Sapphire to Woolgoolga Pacific Highway Upgrade NSW Roads and Traffic Authority Korora Air Quality Monitoring Paper
7 MARCH 2007
REVISION 0 PAGE 1
1. Introduction
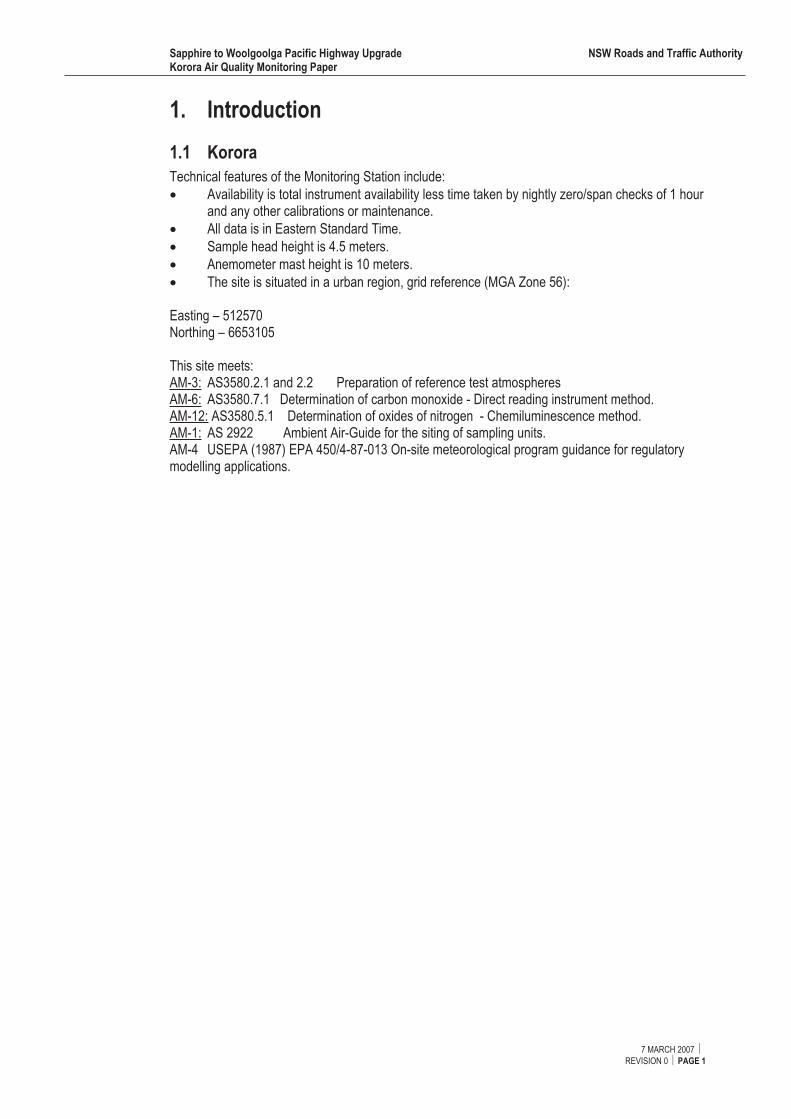
1.1 Korora
Technical features of the Monitoring Station include:
Availability is total instrument availability less time taken by nightly zero/span checks of 1 hour and any other calibrations or maintenance.
All data is in Eastern Standard Time.
Sample head height is 4.5 meters.
Anemometer mast height is 10 meters.
The site is situated in a urban region, grid reference (MGA Zone 56):
Easting – 512570 Northing – 6653105
This site meets: AM-3: AS3580.2.1 and 2.2 Preparation of reference test atmospheres AM-6: AS3580.7.1 Determination of carbon monoxide - Direct reading instrument method. AM-12: AS3580.5.1 Determination of oxides of nitrogen - Chemiluminescence method. AM-1: AS 2922 Ambient Air-Guide for the siting of sampling units. AM-4 USEPA (1987) EPA 450/4-87-013 On-site meteorological program guidance for regulatory modelling applications.

Sapphire to Woolgoolga Pacific Highway Upgrade NSW Roads and Traffic Authority Korora Air Quality Monitoring Paper
2. Carbon Monoxide and Oxides of Nitrogen Summaries
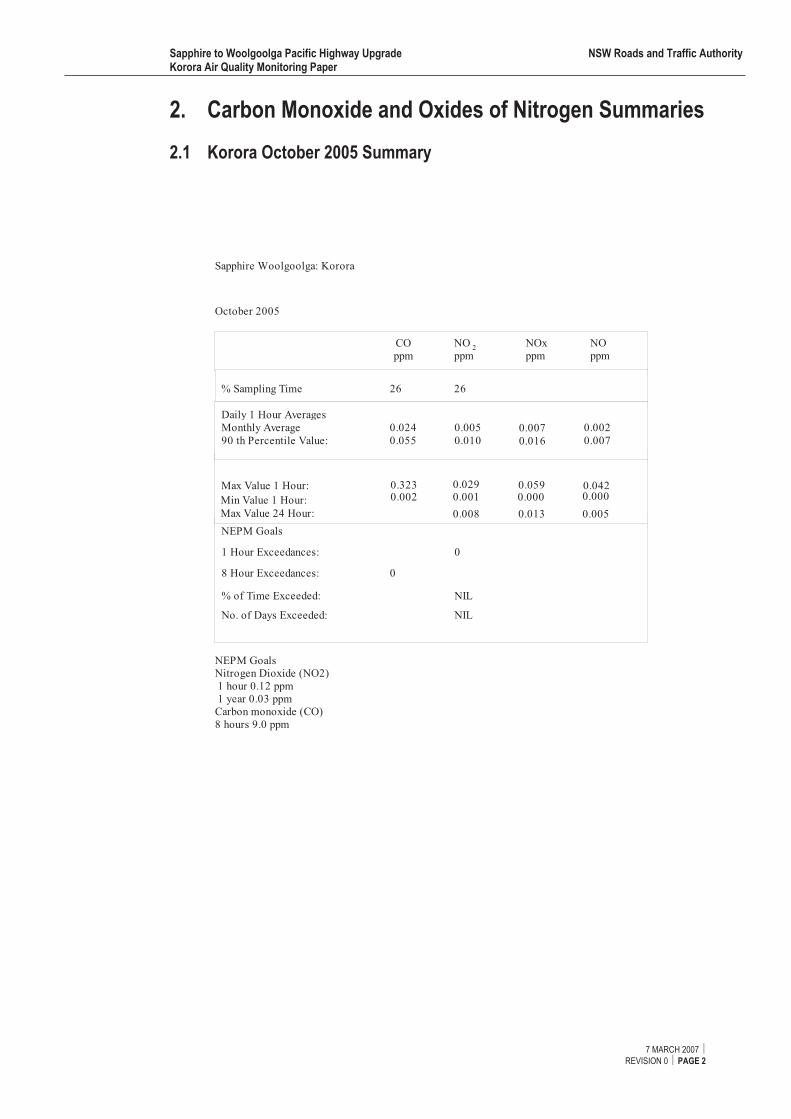
2.1 Korora October 2005 Summary
NO
ppm
Daily 1 Hour Averages
Monthly Average
90 th Percentile Value:
Max Value 1 Hour:
Max Value 24 Hour:
NEPM Goals
8 Hour Exceedances:
% of Time Exceeded:
No. of Days Exceeded:
% Sampling Time
NO
ppm
NOx
ppm
CO
ppm2
0.007
26 26
0.005
0.010 0.016
0.024 0.005 0.007 0.002
0.055
0.042
0
0
0.008
0.059
0.013
0.323 0.029
NIL
NIL
1 Hour Exceedances:
October 2005
Sapphire Woolgoolga: Korora
NEPM Goals
Nitrogen Dioxide (NO2)
1 hour 0.12 ppm
1 year 0.03 ppm
Carbon monoxide (CO)
8 hours 9.0 ppm
Min Value 1 Hour: 0.002 0.001 0.000 0.000
7 MARCH 2007
REVISION 0 PAGE 2

Sapphire to Woolgoolga Pacific Highway Upgrade NSW Roads and Traffic Authority Korora Air Quality Monitoring Paper
.22 Korora November 2005 Summary
NO
ppm
Daily 1 Hour Averages
Monthly Average
90 th Percentile Value:
Max Value 1 Hour:
Max Value 24 Hour:
NEPM Goals
8 Hour Exceedances:
% of Time Exceeded:
No. of Days Exceeded:
% Sampling Time
NO
ppm
NOx
ppm
CO
ppm2
0.007
96 96
0.007
0.009 0.016
0.025 0.004 0.007 0.003
0.054
0.029
0
0
0.008
0.041
0.015
0.372 0.017
NIL
NIL
1 Hour Exceedances:
November 2005
Sapphire Woolgoolga: Korora
NEPM Goals
Nitrogen Dioxide (NO2)
1 hour 0.12 ppm
1 year 0.03 ppm
Carbon monoxide (CO)
8 hours 9.0 ppm
Min Value 1 Hour: 0.001 0.000 0.000 0.000
7 MARCH 2007
REVISION 0 PAGE 3

Sapphire to Woolgoolga Pacific Highway Upgrade NSW Roads and Traffic Authority Korora Air Quality Monitoring Paper
2.3 Korora December 2005 Summary
NO
ppm
Daily 1 Hour Averages
Monthly Average
90 th Percentile Value:
Max Value 1 Hour:
Max Value 24 Hour:
NEPM Goals
8 Hour Exceedances:
% of Time Exceeded:
No. of Days Exceeded:
% Sampling Time
NO
ppm
NOx
ppm
CO
ppm2
0.007
96 96
0.004
0.010 0.016
0.037 0.005 0.007 0.002
0.083
0.031
0
0
0.010
0.055
0.012
0.500 0.037
NIL
NIL
1 Hour Exceedances:
December 2005
Sapphire Woolgoolga: Korora
NEPM Goals
Nitrogen Dioxide (NO2)
1 hour 0.12 ppm
1 year 0.03 ppm
Carbon monoxide (CO)
8 hours 9.0 ppm
Min Value 1 Hour: 0.002 0.000 0.000 0.000
7 MARCH 2007
REVISION 0 PAGE 4

Sapphire to Woolgoolga Pacific Highway Upgrade NSW Roads and Traffic Authority Korora Air Quality Monitoring Paper
2.4 Korora January 2006 Summary
NO
ppm
Daily 1 Hour Averages
Monthly Average
90 th Percentile Value:
Max Value 1 Hour:
Max Value 24 Hour:
NEPM Goals
8 Hour Exceedances:
% of Time Exceeded:
No. of Days Exceeded:
% Sampling Time
NO
ppm
NOx
ppm
CO
ppm2
0.010
95 95
0.011
0.009 0.018
0.035 0.004 0.008 0.004
0.069
0.034
0
0
0.009
0.044
0.020
1.003 0.017
NIL
NIL
1 Hour Exceedances:
January 2006
Sapphire Woolgoolga: Korora
NEPM Goals
Nitrogen Dioxide (NO2)
1 hour 0.12 ppm
1 year 0.03 ppm
Carbon monoxide (CO)
8 hours 9.0 ppm
Min Value 1 Hour: 0.002 0.000 0.000 0.000
7 MARCH 2007
REVISION 0 PAGE 5

Sapphire to Woolgoolga Pacific Highway Upgrade NSW Roads and Traffic Authority Korora Air Quality Monitoring Paper
2.5 8-hour average CO concentrations October 2005 to January 2006
7/11/05 22/11/05 7/12/05 23/12/05 7/1/06 22/1/06D ate
0
0.1
0.2
0.3
Co
nce
ntr
ati
on
(m
g/m
³)
7 MARCH 2007
REVISION 0 PAGE 6
Sapphire to Woolgoolga Pacific Highway Upgrade NSW Roads and Traffic Authority Korora Air Quality Monitoring Paper
2.6 1-hour average NO2 concentrations October 2005 to January 2006
15/10/05 22/10/05 29/10/05 5/11/05 12/11/05 19/11/05 26/11/05 3/12/05
0
20
40
60
80
Con
ce
ntr
ation
(g
/m3)
10/12/05 17/12/05 24/12/05 31/12/05 7/1/06 14/1/06 21/1/06 28/1/06
Date
0
20
40
60
Con
ce
ntr
atio
n (
g/m
3)
7 MARCH 2007
REVISION 0 PAGE 7

Sapphire to Woolgoolga Pacific Highway Upgrade NSW Roads and Traffic Authority Korora Air Quality Monitoring Paper
3. PM10 and PM2.5 monthly summary
3.1 October 2005
Date
Wind
Speed
m/s
Wind
Direction
deg
Sigma
Theta deg
PM10
µg/m³
PM2.5
µg/m³
1/10/2005
2/10/2005
3/10/2005
4/10/2005
5/10/2005
6/10/2005
7/10/2005
8/10/2005
9/10/2005
10/10/2005
11/10/2005
12/10/2005
13/10/2005
14/10/2005
15/10/2005
16/10/2005
17/10/2005
18/10/2005
19/10/2005
20/10/2005
21/10/2005
22/10/2005
23/10/2005
24/10/2005
25/10/2005
26/10/2005 0.9 324 34 23 10
27/10/2005 0.3 349 42 23 10
28/10/2005 0.4 135 41 27 10
29/10/2005 1.4 22 27 21 8
30/10/2005 0.6 358 44 19 7
31/10/2005 0.6 334 35 15 5
7 MARCH 2007
REVISION 0 PAGE 8

Sapphire to Woolgoolga Pacific Highway Upgrade NSW Roads and Traffic Authority Korora Air Quality Monitoring Paper
3.2 November 2005
Date
Wind
Speed
m/ s
Wind
Direc tion
deg
Sigma
Theta
deg
PM10
µg/ m³
PM2.5
µg/ m³
1/ 11/ 2005 0.9 15 33 17 6
2/ 11/ 2005 1.1 10 33 18 6
3/ 11/ 2005 1.7 10 34 18 6
4/ 11/ 2005 1.2 6 43 18 8
5/ 11/ 2005 0.2 96 35 18 8
6/ 11/ 2005 1.0 173 49 15 5
7/ 11/ 2005 0.5 61 29 19 6
8/ 11/ 2005 1.0 12 31 16 6
9/ 11/ 2005 1.3 11 40 17 6
10/ 11/ 2005 1.2 351 42 20 8
11/ 11/ 2005 0.7 142 44 31 9
12/ 11/ 2005 1.2 14 27 21 7
13/ 11/ 2005 0.9 165 47 20 8
14/ 11/ 2005 0.4 73 40 17 7
15/ 11/ 2005 0.4 238 39 17 8
16/ 11/ 2005 2.3 185 53 31 8
17/ 11/ 2005 1.5 191 53 15 6
18/ 11/ 2005 0.1 71 38 9 4
19/ 11/ 2005 1.0 23 44 24 15
20/ 11/ 2005 0.8 162 45 28 13
21/ 11/ 2005 0.5 152 46 17 8
22/ 11/ 2005 0.6 350 31 16 7
23/ 11/ 2005 0.3 139 42 14 7
24/ 11/ 2005 0.5 136 48 14 6
25/ 11/ 2005 0.1 238 37 8 5
26/ 11/ 2005 0.8 17 40 13 5
27/ 11/ 2005 0.4 17 44 12 5
28/ 11/ 2005 0.9 171 52 16 6
29/ 11/ 2005 0.7 356 29 14 6
30/ 11/ 2005 1.2 4 40 17 7
7 MARCH 2007
REVISION 0 PAGE 9

Sapphire to Woolgoolga Pacific Highway Upgrade NSW Roads and Traffic Authority Korora Air Quality Monitoring Paper
.33 December 2005
Date
Wind
Speed
m/ s
Wind
Direc tion
deg
Sigma
Theta
deg
PM10
µg/ m³
PM2.5
µg/ m³
1/ 12/ 2005 1.2 11 35 20 8
2/ 12/ 2005 1.1 348 36 20 6
3/ 12/ 2005 0.4 67 33 16 5
4/ 12/ 2005 0.5 9 27 17 5
5/ 12/ 2005 0.4 31 27 26 8
6/ 12/ 2005 0.6 338 33 28 11
7/ 12/ 2005 0.4 337 44 31 14
8/ 12/ 2005 0.4 301 42 22 7
9/ 12/ 2005 0.6 172 34 24 9
10/ 12/ 2005 0.4 41 20 20 9
11/ 12/ 2005 0.5 151 51 20 8
12/ 12/ 2005 0.4 138 42 18 7
13/ 12/ 2005 0.3 38 39 25 11
14/ 12/ 2005 1.6 177 47 22 10
15/ 12/ 2005 0.6 73 43 14 6
16/ 12/ 2005 0.4 314 44 13 6
17/ 12/ 2005 0.5 34 31 21 6
18/ 12/ 2005 0.4 150 34 23 8
19/ 12/ 2005 0.1 156 32 17 6
20/ 12/ 2005 0.8 11 23 19 8
21/ 12/ 2005 0.4 12 30 25 9
22/ 12/ 2005 0.0 71 41 33 13
23/ 12/ 2005 0.5 98 40 31 14
24/ 12/ 2005 0.6 338 34 32 11
25/ 12/ 2005 1.1 157 38 37 12
26/ 12/ 2005 0.8 53 26 26 10
27/ 12/ 2005 1.4 28 31 28 11
28/ 12/ 2005 0.8 3 40 23 6
29/ 12/ 2005 0.5 58 41 26 9
30/ 12/ 2005 1.7 30 37 8
31/ 12/ 2005 2.1 17 37 18 7
7 MARCH 2007
REVISION 0 PAGE 10

Sapphire to Woolgoolga Pacific Highway Upgrade NSW Roads and Traffic Authority Korora Air Quality Monitoring Paper
3.4 January 2006
Date
Wind
Speed
m/ s
Wind
Direc tion
deg
Sigma
Theta
deg
PM10
µg/ m³
PM2.5
µg/ m³
1/ 01/ 2006 1.0 11 42 23 8
2/ 01/ 2006 1.0 165 43 30 11
3/ 01/ 2006 0.4 130 42 31 13
4/ 01/ 2006 0.7 186 47 27 11
5/ 01/ 2006 0.5 129 46 22 8
6/ 01/ 2006 0.5 176 52 2
7/ 01/ 2006 0.8 135 44 7
8/ 01/ 2006 1.0 155 50 9
9/ 01/ 2006 0.6 150 44 6
10/ 01/ 2006 1.5 23 36 9
11/ 01/ 2006 1.2 11 41 9
12/ 01/ 2006 0.5 159 49 10
13/ 01/ 2006 0.6 32 36 7
14/ 01/ 2006 0.7 24 33 5
15/ 01/ 2006 0.7 37 24 7
16/ 01/ 2006 1.1 22 28 6
17/ 01/ 2006 0.8 348 36 6
18/ 01/ 2006 0.9 177 51 8
19/ 01/ 2006 0.5 176 49 7
20/ 01/ 2006 0.1 64 40 8
21/ 01/ 2006 0.7 26 20 7
22/ 01/ 2006 0.6 29 24 6
23/ 01/ 2006 1.3 21 39 6
24/ 01/ 2006 1.0 30 39 9 7
25/ 01/ 2006 0.4 201 48 17 6
26/ 01/ 2006 0.5 47 25 14 6
27/ 01/ 2006 0.7 27 29 18 6
28/ 01/ 2006 0.3 32 26 17 6
29/ 01/ 2006 0.2 116 33 17 6
30/ 01/ 2006 0.3 121 41 15 6
31/ 01/ 2006 0.5 160 41 17 7
7 MARCH 2007
REVISION 0 PAGE 11

Sapphire to Woolgoolga Pacific Highway Upgrade NSW Roads and Traffic Authority Korora Air Quality Monitoring Paper
3.5 24-hour average PM10 concentrations October 2005 to January 2006
22/10/05 7/11/05 22/11/05 7/12/05 23/12/05 7/1/06 22/1/06Date
0
10
20
30
40
Co
nce
ntr
ati
on
(g
/m³)
7 MARCH 2007
REVISION 0 PAGE 12

Sapphire to Woolgoolga Pacific Highway Upgrade NSW Roads and Traffic Authority Korora Air Quality Monitoring Paper
3.6 24-hour average PM2.5 concentrations October 2005 to January 2006
22/10/05 7/11/05 22/11/05 7/12/05 23/12/05 7/1/06 22/1/06Date
0
5
10
15
20
25
24-hour goal = 25 g/m3
24-hour average concentrations of PM2.5 at Coffs Harbour
October 2005 to January 2006
Concentr
ation
g/m
³)
7 MARCH 2007
REVISION 0 PAGE 13

Sapphire to Woolgoolga Pacific Highway Upgrade NSW Roads and Traffic Authority Korora Air Quality Monitoring Paper
4. Climatic graphs
4.1 October 2005 Windrose
CW
Station: Korora
Wind
October 2005
90
68
45
22
0
338
315
292
270
248
225
202
180
158
135
112
0%
10%
20%
.2 to 1
1 to 2
2 to 5
5 to 10
10 to 15
15 to 20
> 20
Magnitude(m/s)
0.86% calm
N
69.3% Valid Data
7 MARCH 2007
REVISION 0 PAGE 14

Sapphire to Woolgoolga Pacific Highway Upgrade NSW Roads and Traffic Authority Korora Air Quality Monitoring Paper
4.2 November 2005 Windrose
CW
Station: Korora
Wind
November 2005
90
68
45
22
0
338
315
292
270
248
225
202
180
158
135
112
0%
10%
20%
.2 to 1
1 to 2
2 to 5
5 to 10
10 to 15
15 to 20
> 20
Magnitude(m/s)
0.76% calm
N
100.0% Valid Data
7 MARCH 2007
REVISION 0 PAGE 15

Sapphire to Woolgoolga Pacific Highway Upgrade NSW Roads and Traffic Authority Korora Air Quality Monitoring Paper
.34 December 2005 windrose
CW
Station: Korora
Wind
December 2005
90
68
45
22
0
338
315
292
270
248
225
202
180
158
135
112
0%
10%
20%
.2 to 1
1 to 2
2 to 5
5 to 10
10 to 15
15 to 20
> 20
Magnitude(m/s)
1.78% calm
N
99.8% Valid Data
7 MARCH 2007
REVISION 0 PAGE 16

Sapphire to Woolgoolga Pacific Highway Upgrade NSW Roads and Traffic Authority Korora Air Quality Monitoring Paper
4.4 January 2006 windrose
CW
Station: Korora
Wind
January 2006
90
68
45
22
0
338
315
292
270
248
225
202
180
158
135
112
0%
10%
20%
.2 to 1
1 to 2
2 to 5
5 to 10
10 to 15
15 to 20
> 20
Magnitude(m/s)
2.43% calm
N
99.0% Valid Data
7 MARCH 2007
REVISION 0 PAGE 17

Sapphire to Woolgoolga Pacific Highway Upgrade NSW Roads and Traffic Authority Korora Air Quality Monitoring Paper
5. Temperature Graphs
5.1 October 2005 Temperature Graph
Connell Wagner
Ambient Temperature °C 1 hour averages compiled from 5 min. data
14 21 28
October 2005
Day
-10.0
0.0
10.0
20.0
30.0
40.0
50.0
°C
Station: Korora RFBS
7 MARCH 2007
REVISION 0 PAGE 18

Sapphire to Woolgoolga Pacific Highway Upgrade NSW Roads and Traffic Authority Korora Air Quality Monitoring Paper
.5 2 November 2005 temperature graph
Connell Wagner
Ambient Temperature °C 1 hour averages compiled from 5 min. data
1 8 15 22 29
November 2005
Day
-10.0
0.0
10.0
20.0
30.0
40.0
50.0
°C
Station: Korora RFBS
7 MARCH 2007
REVISION 0 PAGE 19

Sapphire to Woolgoolga Pacific Highway Upgrade NSW Roads and Traffic Authority Korora Air Quality Monitoring Paper
5.3 December 2005 temperature graph
Connell Wagner
Ambient Temperature °C 1 hour averages compiled from 5 min. data
1 8 15 22 29
December 2005
Day
-10.0
0.0
10.0
20.0
30.0
40.0
50.0
°C
Station: Korora RFBS
7 MARCH 2007
REVISION 0 PAGE 20

Sapphire to Woolgoolga Pacific Highway Upgrade NSW Roads and Traffic Authority Korora Air Quality Monitoring Paper
5.4 January 2006 temperature graph
Connell Wagner
Ambient Temperature °C 1 hour averages compiled from 5 min. data
1 8 15 22 29
January 2006
Day
-10.0
0.0
10.0
20.0
30.0
40.0
50.0
°C
Station: Korora RFBS
7 MARCH 2007
REVISION 0 PAGE 21

Sapphire to Woolgoolga Pacific Highway Upgrade NSW Roads and Traffic Authority Korora Air Quality Monitoring Paper
6. Relative Humidity Graphs
6.1 October 2005 relative humidity graph
Connell Wagner
Relative Humidity % 1 hour averages compiled from 5 min. data
1 8 15 22 29
October 2005
Day
0.0
10.0
20.0
30.0
40.0
50.0
60.0
70.0
80.0
90.0
100.0
110.0
%
Station: Korora RFBS
7 MARCH 2007
REVISION 0 PAGE 22

Sapphire to Woolgoolga Pacific Highway Upgrade NSW Roads and Traffic Authority Korora Air Quality Monitoring Paper
6.2 November 2005 relative humidity
Connell Wagner
Relative Humidity % 1 hour averages compiled from 5 min. data
1 8 15 22 29
November 2005
Day
0.0
10.0
20.0
30.0
40.0
50.0
60.0
70.0
80.0
90.0
100.0
110.0
%
Station: Korora RFBS
7 MARCH 2007
REVISION 0 PAGE 23

Sapphire to Woolgoolga Pacific Highway Upgrade NSW Roads and Traffic Authority Korora Air Quality Monitoring Paper
.36 December 2005 relative humidity
Connell Wagner
Relative Humidity % 1 hour averages compiled from 5 min. data
1 8 15 22 29
December 2005
Day
0.0
10.0
20.0
30.0
40.0
50.0
60.0
70.0
80.0
90.0
100.0
110.0
%
Station: Korora RFBS
7 MARCH 2007
REVISION 0 PAGE 24

Sapphire to Woolgoolga Pacific Highway Upgrade NSW Roads and Traffic Authority Korora Air Quality Monitoring Paper
6.4 January 2006 relative humidity
Connell Wagner
Relative Humidity % 1 hour averages compiled from 5 min. data
1 8 15 22 29
January 2006
Day
0.0
10.0
20.0
30.0
40.0
50.0
60.0
70.0
80.0
90.0
100.0
110.0
%
Station: Korora RFBS
7 MARCH 2007
REVISION 0 PAGE 25

Sapphire to Woolgoolga Pacific Highway Upgrade NSW Roads and Traffic Authority Korora Air Quality Monitoring Paper
7. Solar Radiation Graphs
7.1 October 2005 solar radiation graph
Connell Wagner
Solar Radiation W/m² 1 hour averages compiled from 5 min. data
14 21 28
October 2005
Day
-100.0
100.0
300.0
500.0
700.0
900.0
1100.0
1300.0
1500.0
W/m²
Station: Korora RFBS
7 MARCH 2007
REVISION 0 PAGE 26

Sapphire to Woolgoolga Pacific Highway Upgrade NSW Roads and Traffic Authority Korora Air Quality Monitoring Paper
.27 November 2005 solar radiation graph
Connell Wagner
Solar Radiation W/m² 1 hour averages compiled from 5 min. data
1 8 15 22
November 2005
Day29
-100.0
100.0
300.0
500.0
700.0
900.0
1100.0
1300.0
1500.0
W/m²
Station: Korora RFBS
7 MARCH 2007
REVISION 0 PAGE 27

Sapphire to Woolgoolga Pacific Highway Upgrade NSW Roads and Traffic Authority Korora Air Quality Monitoring Paper
7.3 December 2005 solar radiation graph
Connell Wagner
Solar Radiation W/m² 1 hour averages compiled from 5 min. data
1 8 15 22 29
December 2005
Day
-100.0
100.0
300.0
500.0
700.0
900.0
1100.0
1300.0
1500.0
W/m²
Station: Korora RFBS
7 MARCH 2007
REVISION 0 PAGE 28

Sapphire to Woolgoolga Pacific Highway Upgrade NSW Roads and Traffic Authority Korora Air Quality Monitoring Paper
7.4 January 2006 solar radiation graph
Connell Wagner
Solar Radiation W/m² 1 hour averages compiled from 5 min. data
1 8 15 22 2
January 2006
Day
9-100.0
100.0
300.0
500.0
700.0
900.0
1100.0
1300.0
1500.0
W/m²
Station: Korora RFBS
7 MARCH 2007
REVISION 0 PAGE 29

Sapphire to Woolgoolga Pacific Highway Upgrade NSW Roads and Traffic Authority Korora Air Quality Monitoring Paper
8. Calibration Graphs
ECOTECH Quality Procedure9830 Calibration and Linearity Check
Customer ID Number TS40648
Unit Carbon Monoxide Analyser 00-0187
Site Model 38639
Engineer Date 14/10/2005
Serial No.
Holmes Enviro
Korora
S.Thompson
Linearity Check
y = 1.0012x - 0.1762
R2 = 0.9999
-5.0
0.0
5.0
10.0
15.0
20.0
25.0
30.0
35.0
40.0
45.0
0.0 5.0 10.0 15.0 20.0 25.0 30.0 35.0 40.0 45.0
Expected Concentration (ppm)
Ac
tua
l C
on
ce
ntr
ati
on
(p
pm
)
7 MARCH 2007
REVISION 0 PAGE 30


Sapphire to Woolgoolga Pacific Highway Upgrade NSW Roads and Traffic Authority Korora Air Quality Monitoring Paper
Customer 40699
Unit 00-0040
Site 9841
Engineer Date 14/10/2005S.THOMPSON
Serial No.
ID Number
ModelKorora
Connell Wagner PPI Calibration and Linearity Check
Holmes enviro
Nitrogen Oxides Analyser
Linearity Check
y = 1.0254x - 0.092
R2 = 1
0.0
5.0
10.0
15.0
20.0
25.0
30.0
35.0
40.0
45.0
50.0
0.0 5.0 10.0 15.0 20.0 25.0 30.0 35.0 40.0 45.0 50.0
Expected Concentration (pphm)
Ac
tua
l C
on
ce
ntr
ati
on
(p
ph
m)
7 MARCH 2007
REVISION 0 PAGE 31