Embed Size (px)
Citation preview

Working with Colleagues, Parents and Students
Course: Using CEM Data in Practice
Day 2 Session 3
Thursday 28th February 2013
Rob Smith: CEM Inset Provider

Interpreting IPRsExercise
Have a look at the three IPRs on the following pages.
What do the scores suggest about the students and how would you use this information to aid the teaching and learning process for each of them?

1

2

Proof-Reading 88PSA 108
3
Name Overall Vocab Maths Non Verbal Average A Level subjects chosen
St.Score Band St.Score Band St.Score Band St.Score Band GCSE
A 78 D 49 D 99 B 92 C na Biology, Maths, Business, Art
B 94 C 115 A 85 D 104 B na Biology, Business, Psychology, English
C 88 D 97 C 85 D 104 B 5.6 History, Psychology, English, Media
D 101 B 107 B 97 C 80 D 5.9 Business, History, English, Drama
E 104 B 87 D 112 A 116 A na Biology, Physics, Maths, Business
F 81 D 47 D 103 B 111 B na Maths, Further Maths, Business
G 93 C 113 A 84 D 113 A na Biology, Business, French, Geography
H 97 C 111 A 89 D 99 C 7 Art, English, Psychology, Religious St.
I 87 D 68 D 100 B 109 B 5.4 Maths, Geography, French, Music
J 105 B 67 D 124 A 85 D 6.1Maths, Further Maths, Psychology, Economics
K 96 C 71 D 110 A 97 C na Biology, Maths, Art, English
L 92 C 60 D 111 A 97 C na Maths, History Religious St., English
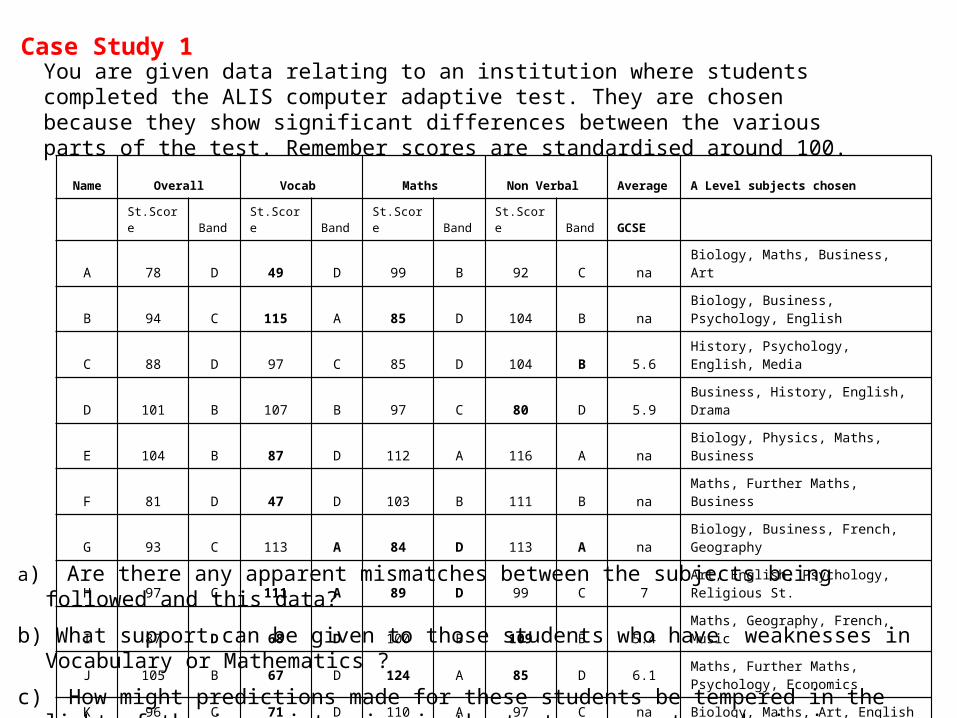
You are given data relating to an institution where students completed the ALIS computer adaptive test. They are chosen because they show significant differences between the various parts of the test. Remember scores are standardised around 100.
a) Are there any apparent mismatches between the subjects being followed and this data?
b) What support can be given to those students who have weaknesses in Vocabulary or Mathematics ?
c) How might predictions made for these students be tempered in the light of the inconsistencies in the test components and missing average GCSE points scores?
Case Study 1

Case Study 2
What are the Strengths and weaknesses of this A/AS level student?
To use the IPR (Individual pupil record) familiarise yourself with the terms standard score, band, stanine, percentile and confidence band
a)Which AS/A level subjects might be avoided?
b) This student chose English, Film Studies, Music Technology and Psychology. Is this a good choice? Do you foresee any problems?

Here is the Individual Pupil Record from the ALIS computer adaptive test done in Year 12 for a current Year 13 student.
This student had a high positive value added in every GCSE subject as measured using MidYIS as a baseline.
( Average GCSE score 7.44)
On the next page are her A level predictions and chances graphs
Why are the predictions different?
Are the chances graphs useful here?
Case Study 3

Using PARIS software and tweaking the predictions for prior value added by these subjects, then from a GCSE baseline A*s are predicted in three of the four.
If we did the same for the adaptive test baseline solid Bs might be predicted in all three.
It is also worth looking at the value added at GCSE. See commentary

The differences in prediction from the GCSE baseline and the computer adaptive test for some students are interesting and these can be in either direction. Here there has been a very large value added at GCSE which may or may not be sustainable at A level. This student’s history is shown below
Drama English English Lit German Latin Maths MusicGCSE PREDICTIONS MIDYIS ALL 5.8 6 6 5.5 6.5 6 5.9 5.8 from year7 dataGSCE Grade predictions B- B B B/C A/B B B- B-GCSE ACHIEVED A* A* A A A* A* A AVALUE ADDED RAW 2.2 2 1 1.5 1.5 2 1.1 1.2
GCSE PREDICTIONS MIDYIS IND. 6.6 6.8 6.7 6.5 6.9 6.9 6.9 6.9 from year9 dataGSCE Grade predictions A/B A- A- A/B A- A- A- A-GCSE ACHIEVED A* A* A A A* A* A AVALUE ADDED RAW IND 1.4 1.2 0.3 0.5 1.1 1.1 0.1 0.1
Average GCSE score =7.44
Science
The value added here at GCSE is between 1 and 2 grades (for all institution data at year 7) and significantly positive for subjects (for the Independent school data from year 9)Actually if we measure this student’s value added from an average GCSE score of 7.44 next year, it does not tell the whole story. We need to look as well at the value added from the adaptive test too.The chances graphs should be used with extreme caution here and the growth mindset is vital if used with students
Commentary
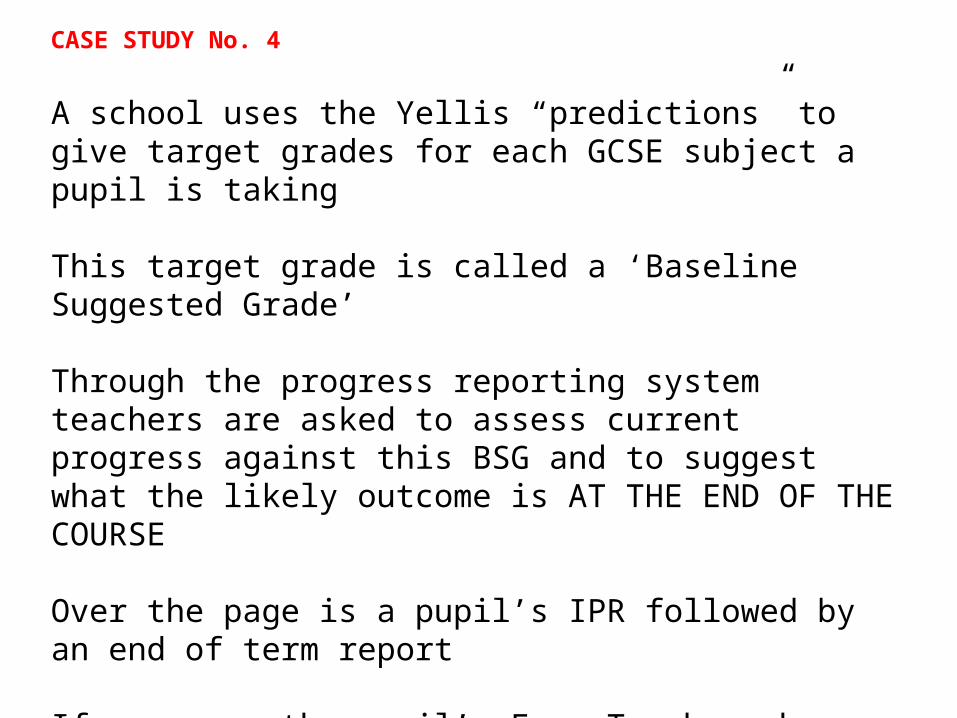
A school uses the Yellis “predictions” to give target grades for each GCSE subject a pupil is taking
This target grade is called a ‘Baseline Suggested Grade’
Through the progress reporting system teachers are asked to assess current progress against this BSG and to suggest what the likely outcome is AT THE END OF THE COURSE
Over the page is a pupil’s IPR followed by an end of term report
If you were the pupil’s Form Teacher, how would you approach a discussion with his/her parents at a Parents’ Evening?
CASE STUDY No. 4


Subjects

Who should data be
shared with?

Colleagues
Subject Teachers
Heads of Department
Pastoral Staff
Managers

1. This will be interpreted as a personalised prediction
2. The data doesn’t work for this particular student
3. You’re raising false expectation – he’ll never get that result
4. You’re making us accountable for guaranteeing particular grades – when the pupils don’t get them we’ll get sacked and the school will get sued
Subject Teachers/HODs

Remind them that:1. Baseline data can give useful information
about a pupil’s strengths and weaknesses which can assist teaching and learning
2. “Predictions” are not a substitute for their professional judgement
Reassure them that:3. It is not a “witch hunt”4. Value added data is used to assess pupil
performance not teacher performance!
Subject Teachers/HODs

Pupils
1. Make sure they know why they are taking the test.
2. Make sure they take it seriously
3. Make sure they don’t deliberately mess it up in order to lower their BSGs!
4. Be prepared to look for clear anomalies and re-test if necessary
5. Explain the chances graphs to them clearly

Parents
1. Make sure they know why the pupils are taking the test
2. Explain the results to them
3. Explain lots of times that the chances graphs and BSGs do NOT give personalised predictions
4. Ensure that they receive good quality feedback from staff when ambers or reds are awarded
5. Encourage them to ask lots of questions