Embed Size (px)
Citation preview
Working with Non-NDF Carbohydrates with Manure Evaluation and Environmental Considerations
Mary Beth Hall
Department of Animal Sciences University of Florida, Gainesville
Introduction
The non-NDF carbohydrates (NFC) are an important source of energy in the rations of high producing cows, however they vary in their effects on performance. Starch in particular has been associated both with the potential for high production, as well as with problems related to ruminal acidosis (Sutton et al., 1987; Nocek, 1997) which leads to impaired health and production. Understanding how the array of NFC fit within the total ration picture, and how they differ in the nutrients they supply to the animal, will give a better sense of how we should use them in ration formulation.
Definitions
Although the terms NFC and NSC (nonstructural carbohydrates) have often been used interchangeably, they do not describe the same carbohydrates. NSC
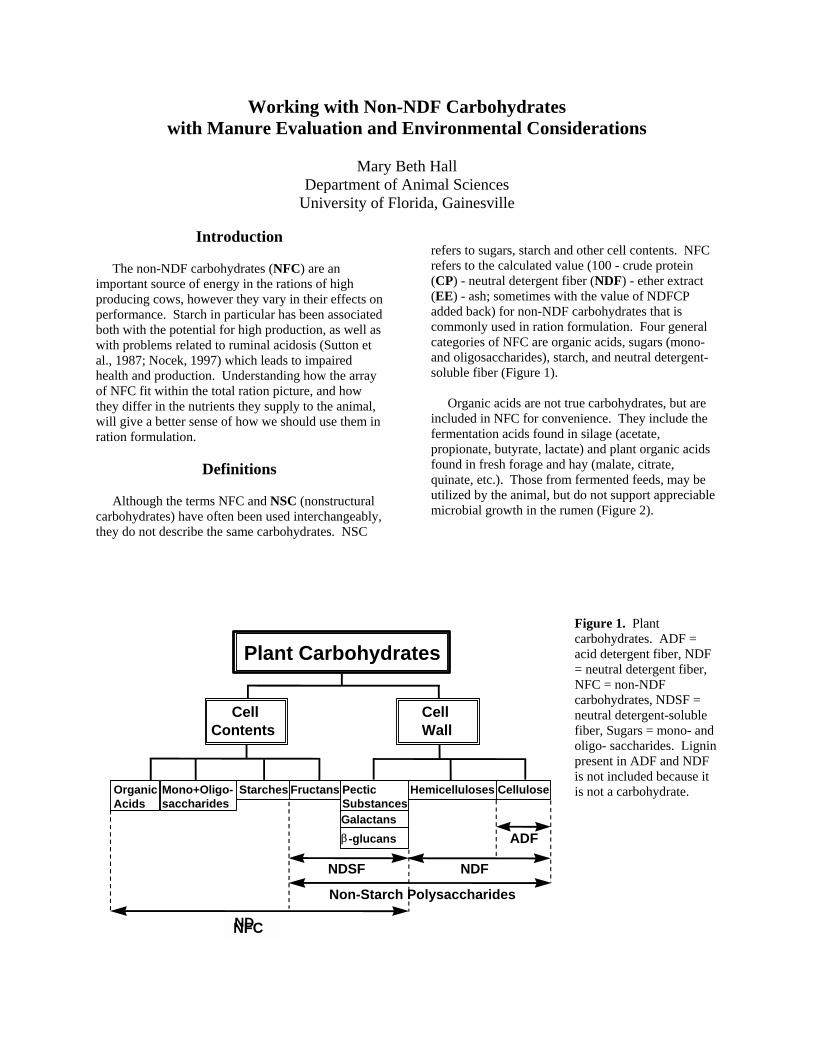
refers to sugars, starch and other cell contents. NFC refers to the calculated value (100 - crude protein (CP) - neutral detergent fiber (NDF) - ether extract (EE) - ash; sometimes with the value of NDFCP added back) for non-NDF carbohydrates that is commonly used in ration formulation. Four general categories of NFC are organic acids, sugars (mono- and oligosaccharides), starch, and neutral detergent-soluble fiber (Figure 1).
Organic acids are not true carbohydrates, but are included in NFC for convenience. They include the fermentation acids found in silage (acetate, propionate, butyrate, lactate) and plant organic acids found in fresh forage and hay (malate, citrate, quinate, etc.). Those from fermented feeds, may be utilized by the animal, but do not support appreciable microbial growth in the rumen (Figure 2).
Figure 1. Plant carbohydrates. ADF = acid detergent fiber, NDF = neutral detergent fiber, NFC = non-NDF carbohydrates, NDSF = neutral detergent-soluble fiber, Sugars = mono- and oligo- saccharides. Lignin present in ADF and NDF is not included because it is not a carbohydrate.
Plant Carbohydrates
CellContents
CellWall
HemicellulosesPecticSubstances
β-glucans
FructansStarchesMono+Oligo-saccharides
OrganicAcids
Cellulose
ADF
NDSF
SC
Galactans
Non-Starch Polysaccharides
NDF
NDNFC
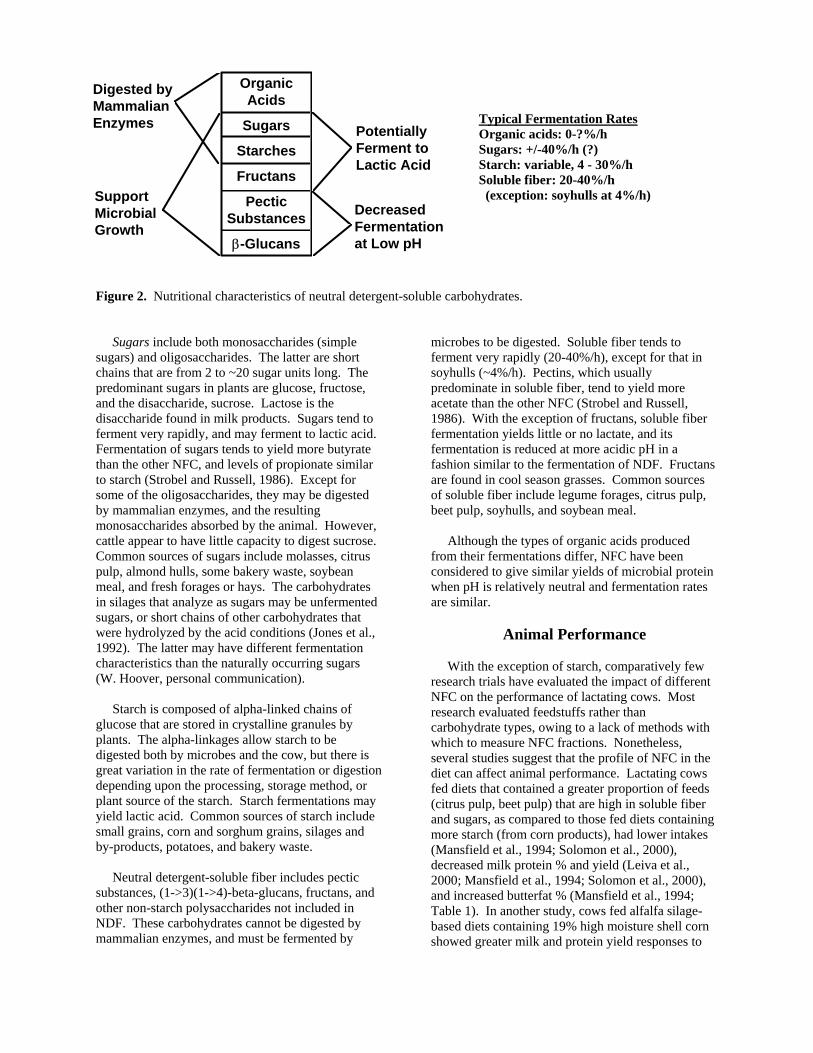
Typical Fermentation Rates Organic acids: 0-?%/h PoteS Sugars: +/-40%/h (?) FeStarc Starch: variable, 4 - 30%/h La Soluble fiber: 20-40%/h Fr (exception: soyhulls at 4%/h) Pe
Digested byMammalianEnzymes
SupportMicrobialGrowth
ntiallyrment toctic Acid
DecreasedFermentationat Low pH
OrganicAcids
ugars
hes
uctans
cticSubstances
β-Glucans
Figure 2. Nutritional characteristics of neutral detergent-soluble carbohydrates. Sugars include both monosaccharides (simple sugars) and oligosaccharides. The latter are short chains that are from 2 to ~20 sugar units long. The predominant sugars in plants are glucose, fructose, and the disaccharide, sucrose. Lactose is the disaccharide found in milk products. Sugars tend to ferment very rapidly, and may ferment to lactic acid. Fermentation of sugars tends to yield more butyrate than the other NFC, and levels of propionate similar to starch (Strobel and Russell, 1986). Except for some of the oligosaccharides, they may be digested by mammalian enzymes, and the resulting monosaccharides absorbed by the animal. However, cattle appear to have little capacity to digest sucrose. Common sources of sugars include molasses, citrus pulp, almond hulls, some bakery waste, soybean meal, and fresh forages or hays. The carbohydrates in silages that analyze as sugars may be unfermented sugars, or short chains of other carbohydrates that were hydrolyzed by the acid conditions (Jones et al., 1992). The latter may have different fermentation characteristics than the naturally occurring sugars (W. Hoover, personal communication).
Starch is composed of alpha-linked chains of glucose that are stored in crystalline granules by plants. The alpha-linkages allow starch to be digested both by microbes and the cow, but there is great variation in the rate of fermentation or digestion depending upon the processing, storage method, or plant source of the starch. Starch fermentations may yield lactic acid. Common sources of starch include small grains, corn and sorghum grains, silages and by-products, potatoes, and bakery waste.
Neutral detergent-soluble fiber includes pectic substances, (1->3)(1->4)-beta-glucans, fructans, and other non-starch polysaccharides not included in NDF. These carbohydrates cannot be digested by mammalian enzymes, and must be fermented by
microbes to be digested. Soluble fiber tends to ferment very rapidly (20-40%/h), except for that in soyhulls (~4%/h). Pectins, which usually predominate in soluble fiber, tend to yield more acetate than the other NFC (Strobel and Russell, 1986). With the exception of fructans, soluble fiber fermentation yields little or no lactate, and its fermentation is reduced at more acidic pH in a fashion similar to the fermentation of NDF. Fructans are found in cool season grasses. Common sources of soluble fiber include legume forages, citrus pulp, beet pulp, soyhulls, and soybean meal. Although the types of organic acids produced from their fermentations differ, NFC have been considered to give similar yields of microbial protein when pH is relatively neutral and fermentation rates are similar.
Animal Performance With the exception of starch, comparatively few research trials have evaluated the impact of different NFC on the performance of lactating cows. Most research evaluated feedstuffs rather than carbohydrate types, owing to a lack of methods with which to measure NFC fractions. Nonetheless, several studies suggest that the profile of NFC in the diet can affect animal performance. Lactating cows fed diets that contained a greater proportion of feeds (citrus pulp, beet pulp) that are high in soluble fiber and sugars, as compared to those fed diets containing more starch (from corn products), had lower intakes (Mansfield et al., 1994; Solomon et al., 2000), decreased milk protein % and yield (Leiva et al., 2000; Mansfield et al., 1994; Solomon et al., 2000), and increased butterfat % (Mansfield et al., 1994; Table 1). In another study, cows fed alfalfa silage-based diets containing 19% high moisture shell corn showed greater milk and protein yield responses to
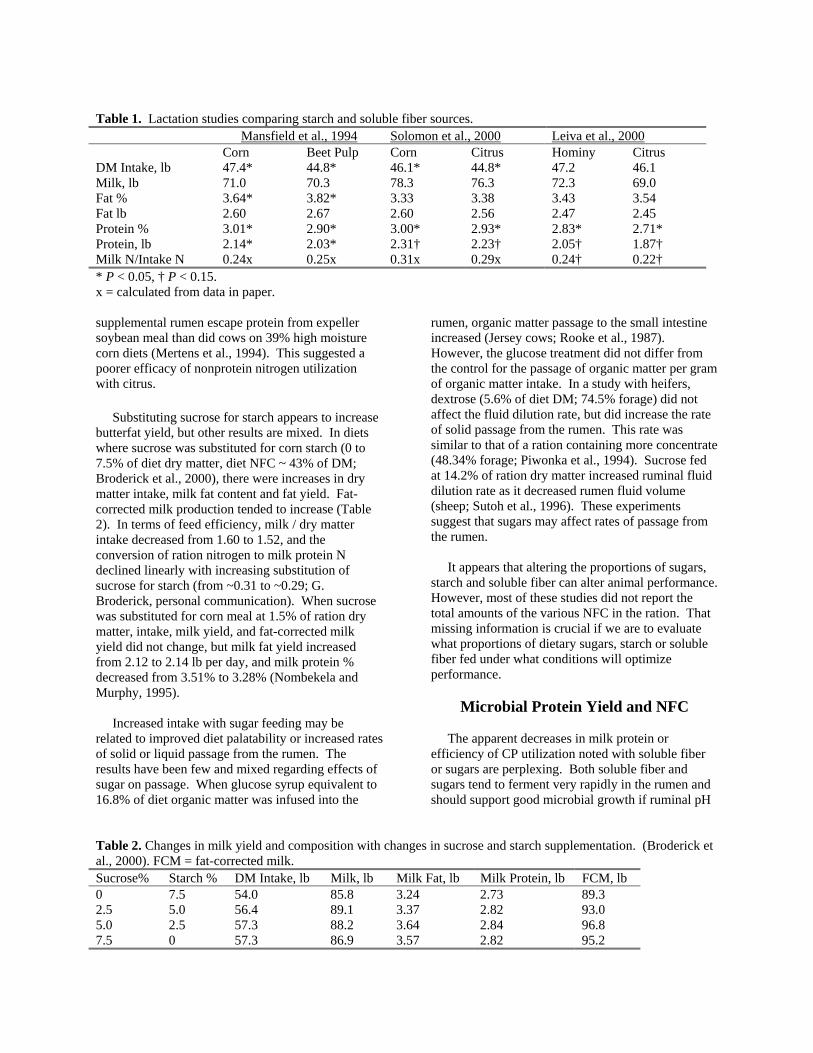
Table 1. Lactation studies comparing starch and soluble fiber sources. Mansfield et al., 1994 Solomon et al., 2000 Leiva et al., 2000 Corn Beet Pulp Corn Citrus Hominy Citrus DM Intake, lb 47.4* 44.8* 46.1* 44.8* 47.2 46.1 Milk, lb 71.0 70.3 78.3 76.3 72.3 69.0 Fat % 3.64* 3.82* 3.33 3.38 3.43 3.54 Fat lb 2.60 2.67 2.60 2.56 2.47 2.45 Protein % 3.01* 2.90* 3.00* 2.93* 2.83* 2.71* Protein, lb 2.14* 2.03* 2.31† 2.23† 2.05† 1.87† Milk N/Intake N 0.24x 0.25x 0.31x 0.29x 0.24† 0.22† * P < 0.05, † P < 0.15. x = calculated from data in paper. supplemental rumen escape protein from expeller soybean meal than did cows on 39% high moisture corn diets (Mertens et al., 1994). This suggested a poorer efficacy of nonprotein nitrogen utilization with citrus. Substituting sucrose for starch appears to increase butterfat yield, but other results are mixed. In diets where sucrose was substituted for corn starch (0 to 7.5% of diet dry matter, diet NFC ~ 43% of DM; Broderick et al., 2000), there were increases in dry matter intake, milk fat content and fat yield. Fat-corrected milk production tended to increase (Table 2). In terms of feed efficiency, milk / dry matter intake decreased from 1.60 to 1.52, and the conversion of ration nitrogen to milk protein N declined linearly with increasing substitution of sucrose for starch (from ~0.31 to ~0.29; G. Broderick, personal communication). When sucrose was substituted for corn meal at 1.5% of ration dry matter, intake, milk yield, and fat-corrected milk yield did not change, but milk fat yield increased from 2.12 to 2.14 lb per day, and milk protein % decreased from 3.51% to 3.28% (Nombekela and Murphy, 1995). Increased intake with sugar feeding may be related to improved diet palatability or increased rates of solid or liquid passage from the rumen. The results have been few and mixed regarding effects of sugar on passage. When glucose syrup equivalent to 16.8% of diet organic matter was infused into the
rumen, organic matter passage to the small intestine increased (Jersey cows; Rooke et al., 1987). However, the glucose treatment did not differ from the control for the passage of organic matter per gram of organic matter intake. In a study with heifers, dextrose (5.6% of diet DM; 74.5% forage) did not affect the fluid dilution rate, but did increase the rate of solid passage from the rumen. This rate was similar to that of a ration containing more concentrate (48.34% forage; Piwonka et al., 1994). Sucrose fed at 14.2% of ration dry matter increased ruminal fluid dilution rate as it decreased rumen fluid volume (sheep; Sutoh et al., 1996). These experiments suggest that sugars may affect rates of passage from the rumen. It appears that altering the proportions of sugars, starch and soluble fiber can alter animal performance. However, most of these studies did not report the total amounts of the various NFC in the ration. That missing information is crucial if we are to evaluate what proportions of dietary sugars, starch or soluble fiber fed under what conditions will optimize performance.
Microbial Protein Yield and NFC The apparent decreases in milk protein or efficiency of CP utilization noted with soluble fiber or sugars are perplexing. Both soluble fiber and sugars tend to ferment very rapidly in the rumen and should support good microbial growth if ruminal pH
Table 2. Changes in milk yield and composition with changes in sucrose and starch supplementation. (Broderick et al., 2000). FCM = fat-corrected milk. Sucrose% Starch % DM Intake, lb Milk, lb Milk Fat, lb Milk Protein, lb FCM, lb 0 7.5 54.0 85.8 3.24 2.73 89.3 2.5 5.0 56.4 89.1 3.37 2.82 93.0 5.0 2.5 57.3 88.2 3.64 2.84 96.8 7.5 0 57.3 86.9 3.57 2.82 95.2
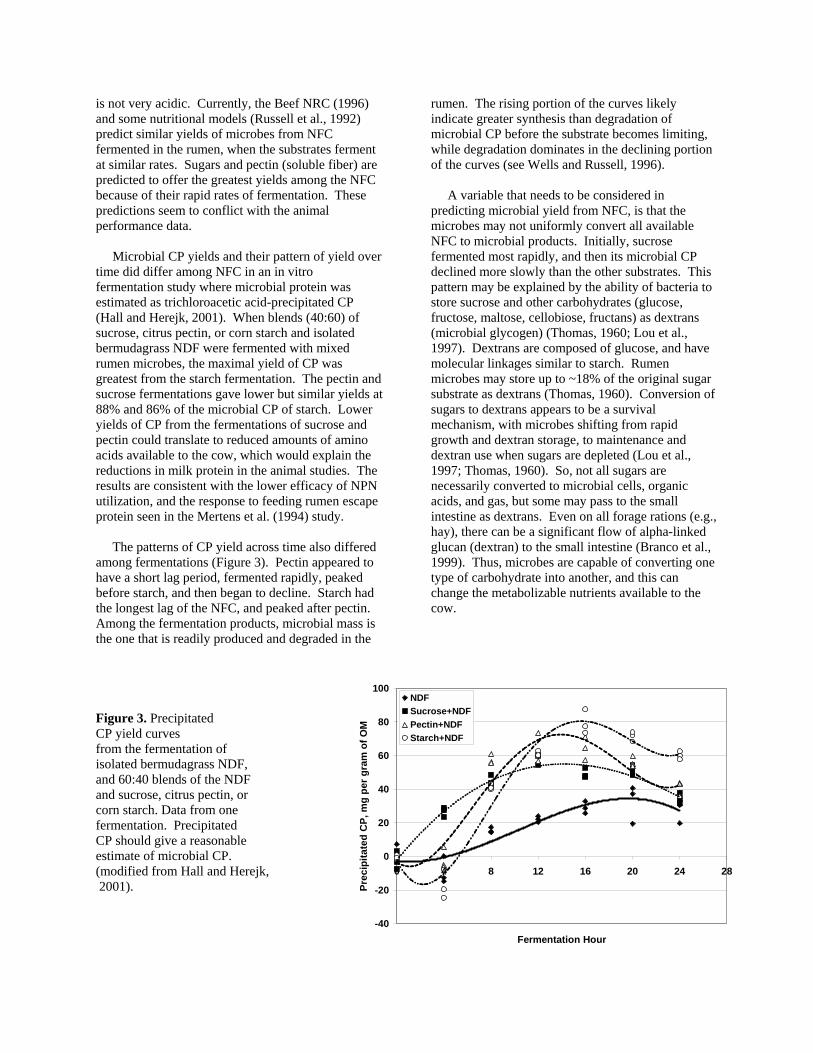
is not very acidic. Currently, the Beef NRC (1996) and some nutritional models (Russell et al., 1992) predict similar yields of microbes from NFC fermented in the rumen, when the substrates ferment at similar rates. Sugars and pectin (soluble fiber) are predicted to offer the greatest yields among the NFC because of their rapid rates of fermentation. These predictions seem to conflict with the animal performance data. Microbial CP yields and their pattern of yield over time did differ among NFC in an in vitro fermentation study where microbial protein was estimated as trichloroacetic acid-precipitated CP (Hall and Herejk, 2001). When blends (40:60) of sucrose, citrus pectin, or corn starch and isolated bermudagrass NDF were fermented with mixed rumen microbes, the maximal yield of CP was greatest from the starch fermentation. The pectin and sucrose fermentations gave lower but similar yields at 88% and 86% of the microbial CP of starch. Lower yields of CP from the fermentations of sucrose and pectin could translate to reduced amounts of amino acids available to the cow, which would explain the reductions in milk protein in the animal studies. The results are consistent with the lower efficacy of NPN utilization, and the response to feeding rumen escape protein seen in the Mertens et al. (1994) study. The patterns of CP yield across time also differed among fermentations (Figure 3). Pectin appeared to have a short lag period, fermented rapidly, peaked before starch, and then began to decline. Starch had the longest lag of the NFC, and peaked after pectin. Among the fermentation products, microbial mass is the one that is readily produced and degraded in the
rumen. The rising portion of the curves likely indicate greater synthesis than degradation of microbial CP before the substrate becomes limiting, while degradation dominates in the declining portion of the curves (see Wells and Russell, 1996).
A variable that needs to be considered in predicting microbial yield from NFC, is that the microbes may not uniformly convert all available NFC to microbial products. Initially, sucrose fermented most rapidly, and then its microbial CP declined more slowly than the other substrates. This pattern may be explained by the ability of bacteria to store sucrose and other carbohydrates (glucose, fructose, maltose, cellobiose, fructans) as dextrans (microbial glycogen) (Thomas, 1960; Lou et al., 1997). Dextrans are composed of glucose, and have molecular linkages similar to starch. Rumen microbes may store up to ~18% of the original sugar substrate as dextrans (Thomas, 1960). Conversion of sugars to dextrans appears to be a survival mechanism, with microbes shifting from rapid growth and dextran storage, to maintenance and dextran use when sugars are depleted (Lou et al., 1997; Thomas, 1960). So, not all sugars are necessarily converted to microbial cells, organic acids, and gas, but some may pass to the small intestine as dextrans. Even on all forage rations (e.g., hay), there can be a significant flow of alpha-linked glucan (dextran) to the small intestine (Branco et al., 1999). Thus, microbes are capable of converting one type of carbohydrate into another, and this can change the metabolizable nutrients available to the cow.
Figure 3. Precipitated CP yield curves from the fermentation of isolated bermudagrass NDF, and 60:40 blends of the NDF and sucrose, citrus pectin, or corn starch. Data from one fermentation. Precipitated CP should give a reasonable estimate of microbial CP. (modified from Hall and Herejk, 2001).
-40
-20
0
20
40
60
80
100
0 4 8 12 16 20 24 28
Fermentation Hour
Prec
ipita
ted
CP,
mg
per g
ram
of O
M
NDFSucrose+NDFPectin+NDFStarch+NDF
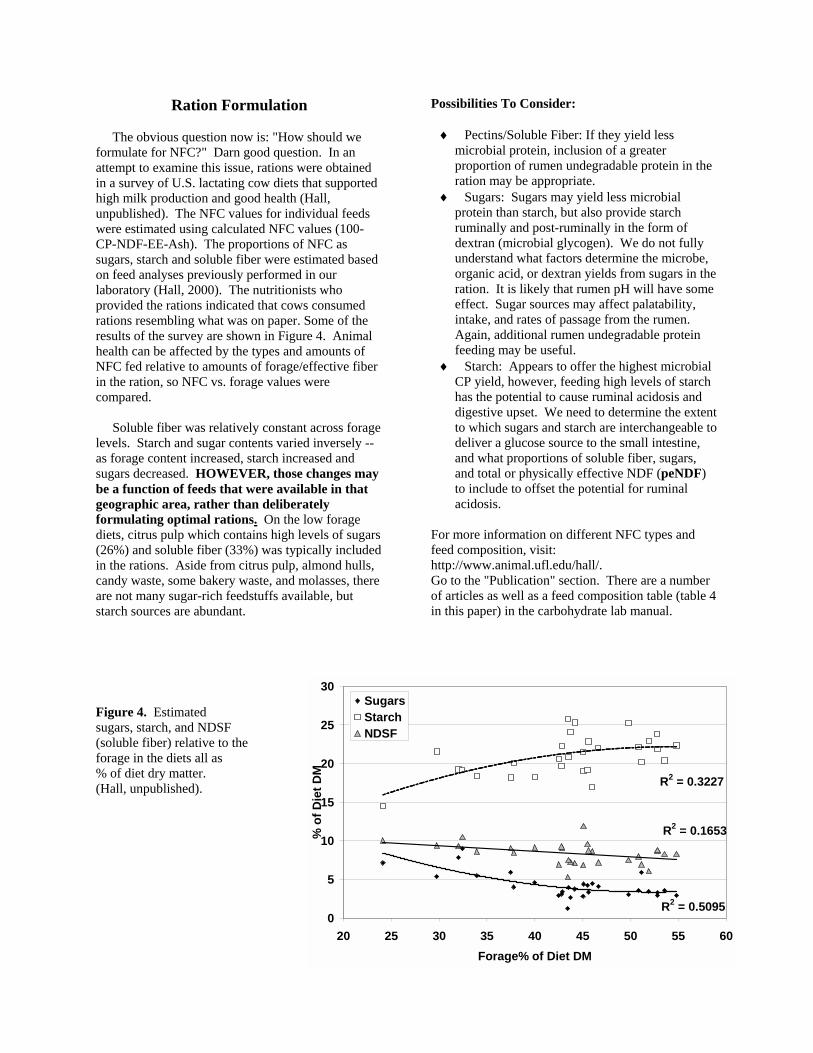
Ration Formulation The obvious question now is: "How should we formulate for NFC?" Darn good question. In an attempt to examine this issue, rations were obtained in a survey of U.S. lactating cow diets that supported high milk production and good health (Hall, unpublished). The NFC values for individual feeds were estimated using calculated NFC values (100-CP-NDF-EE-Ash). The proportions of NFC as sugars, starch and soluble fiber were estimated based on feed analyses previously performed in our laboratory (Hall, 2000). The nutritionists who provided the rations indicated that cows consumed rations resembling what was on paper. Some of the results of the survey are shown in Figure 4. Animal health can be affected by the types and amounts of NFC fed relative to amounts of forage/effective fiber in the ration, so NFC vs. forage values were compared. Soluble fiber was relatively constant across forage levels. Starch and sugar contents varied inversely -- as forage content increased, starch increased and sugars decreased. HOWEVER, those changes may be a function of feeds that were available in that geographic area, rather than deliberately formulating optimal rations. On the low forage diets, citrus pulp which contains high levels of sugars (26%) and soluble fiber (33%) was typically included in the rations. Aside from citrus pulp, almond hulls, candy waste, some bakery waste, and molasses, there are not many sugar-rich feedstuffs available, but starch sources are abundant.
Possibilities To Consider:
♦ Pectins/Soluble Fiber: If they yield less microbial protein, inclusion of a greater proportion of rumen undegradable protein in the ration may be appropriate.
♦ Sugars: Sugars may yield less microbial protein than starch, but also provide starch ruminally and post-ruminally in the form of dextran (microbial glycogen). We do not fully understand what factors determine the microbe, organic acid, or dextran yields from sugars in the ration. It is likely that rumen pH will have some effect. Sugar sources may affect palatability, intake, and rates of passage from the rumen. Again, additional rumen undegradable protein feeding may be useful.
♦ Starch: Appears to offer the highest microbial CP yield, however, feeding high levels of starch has the potential to cause ruminal acidosis and digestive upset. We need to determine the extent to which sugars and starch are interchangeable to deliver a glucose source to the small intestine, and what proportions of soluble fiber, sugars, and total or physically effective NDF (peNDF) to include to offset the potential for ruminal acidosis.
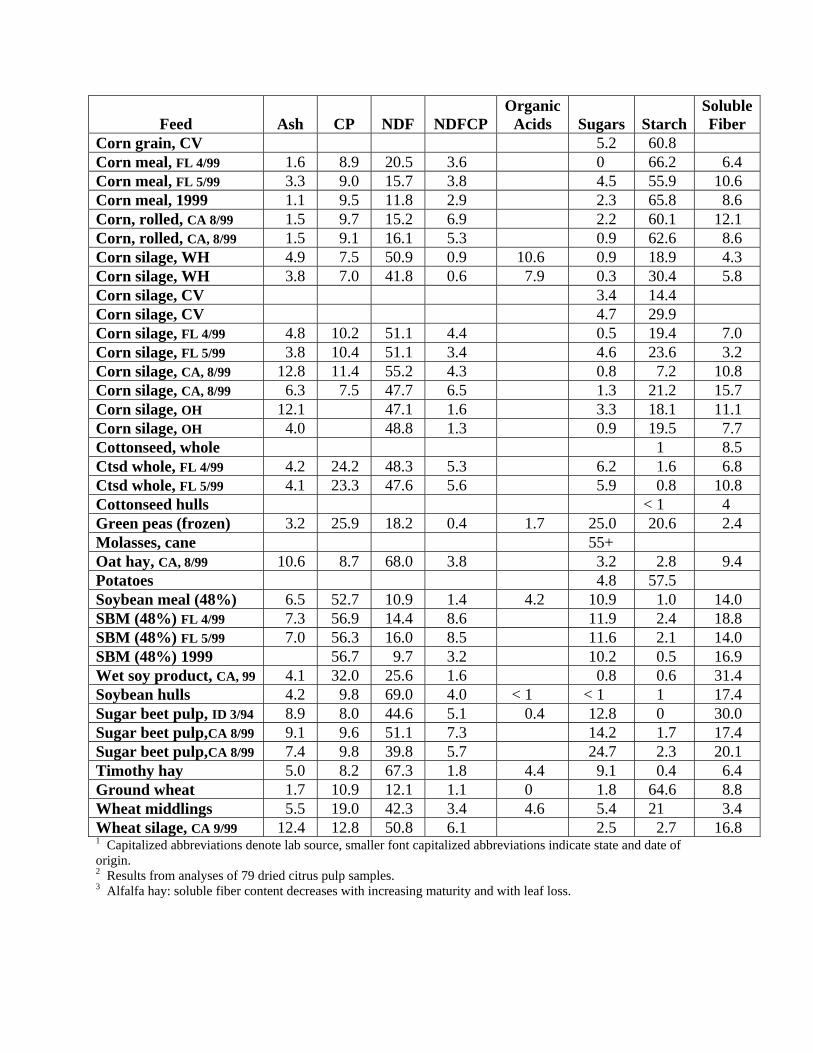
For more information on different NFC types and feed composition, visit: http://www.animal.ufl.edu/hall/. Go to the "Publication" section. There are a number of articles as well as a feed composition table (table 4 in this paper) in the carbohydrate lab manual.
R2 = 0.1653
R2 = 0.3227
R2 = 0.50950
5
10
15
20
25
30
20 25 30 35 40 45 50 55 60Forage% of Diet DM
% o
f Die
t DM
SugarsStarchNDSF
Figure 4. Estimated sugars, starch, and NDSF (soluble fiber) relative to the forage in the diets all as % of diet dry matter. (Hall, unpublished).
55.25.45.65.8
66.26.46.6
Cool Hot HR HG C-HR H-HR C-HG H-HG
Rum
en p
H
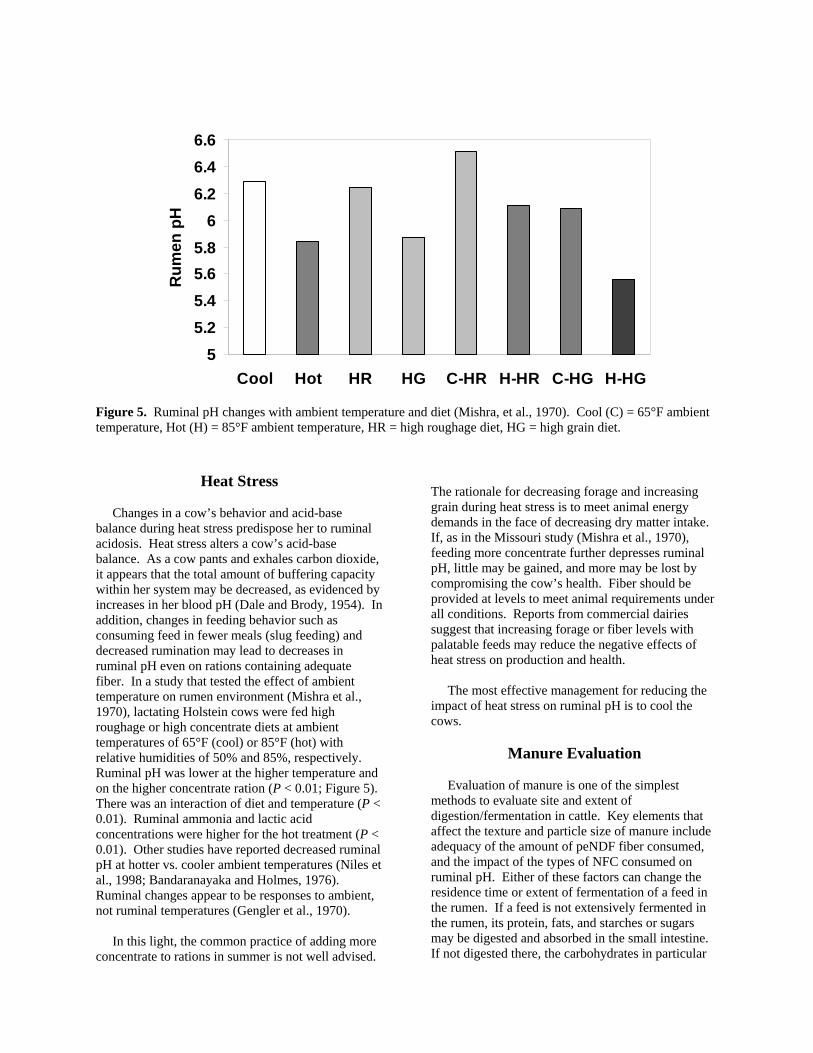
Figure 5. Ruminal pH changes with ambient temperature and diet (Mishra, et al., 1970). Cool (C) = 65°F ambient temperature, Hot (H) = 85°F ambient temperature, HR = high roughage diet, HG = high grain diet.
Heat Stress
Changes in a cow’s behavior and acid-base balance during heat stress predispose her to ruminal acidosis. Heat stress alters a cow’s acid-base balance. As a cow pants and exhales carbon dioxide, it appears that the total amount of buffering capacity within her system may be decreased, as evidenced by increases in her blood pH (Dale and Brody, 1954). In addition, changes in feeding behavior such as consuming feed in fewer meals (slug feeding) and decreased rumination may lead to decreases in ruminal pH even on rations containing adequate fiber. In a study that tested the effect of ambient temperature on rumen environment (Mishra et al., 1970), lactating Holstein cows were fed high roughage or high concentrate diets at ambient temperatures of 65°F (cool) or 85°F (hot) with relative humidities of 50% and 85%, respectively. Ruminal pH was lower at the higher temperature and on the higher concentrate ration (P < 0.01; Figure 5). There was an interaction of diet and temperature (P < 0.01). Ruminal ammonia and lactic acid concentrations were higher for the hot treatment (P < 0.01). Other studies have reported decreased ruminal pH at hotter vs. cooler ambient temperatures (Niles et al., 1998; Bandaranayaka and Holmes, 1976). Ruminal changes appear to be responses to ambient, not ruminal temperatures (Gengler et al., 1970). In this light, the common practice of adding more concentrate to rations in summer is not well advised.
The rationale for decreasing forage and increasing grain during heat stress is to meet animal energy demands in the face of decreasing dry matter intake. If, as in the Missouri study (Mishra et al., 1970), feeding more concentrate further depresses ruminal pH, little may be gained, and more may be lost by compromising the cow’s health. Fiber should be provided at levels to meet animal requirements under all conditions. Reports from commercial dairies suggest that increasing forage or fiber levels with palatable feeds may reduce the negative effects of heat stress on production and health. The most effective management for reducing the impact of heat stress on ruminal pH is to cool the cows.
Manure Evaluation Evaluation of manure is one of the simplest methods to evaluate site and extent of digestion/fermentation in cattle. Key elements that affect the texture and particle size of manure include adequacy of the amount of peNDF fiber consumed, and the impact of the types of NFC consumed on ruminal pH. Either of these factors can change the residence time or extent of fermentation of a feed in the rumen. If a feed is not extensively fermented in the rumen, its protein, fats, and starches or sugars may be digested and absorbed in the small intestine. If not digested there, the carbohydrates in particular
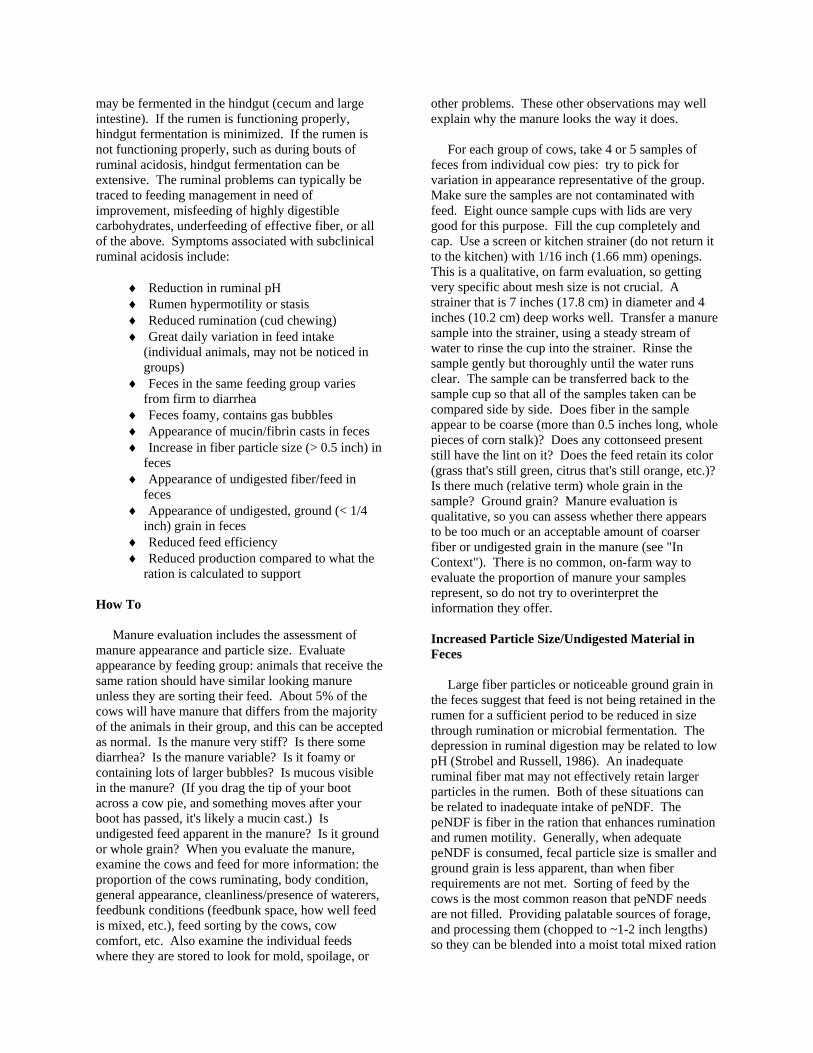
may be fermented in the hindgut (cecum and large intestine). If the rumen is functioning properly, hindgut fermentation is minimized. If the rumen is not functioning properly, such as during bouts of ruminal acidosis, hindgut fermentation can be extensive. The ruminal problems can typically be traced to feeding management in need of improvement, misfeeding of highly digestible carbohydrates, underfeeding of effective fiber, or all of the above. Symptoms associated with subclinical ruminal acidosis include:
♦ Reduction in ruminal pH ♦ Rumen hypermotility or stasis ♦ Reduced rumination (cud chewing) ♦ Great daily variation in feed intake
(individual animals, may not be noticed in groups)
♦ Feces in the same feeding group varies from firm to diarrhea
♦ Feces foamy, contains gas bubbles ♦ Appearance of mucin/fibrin casts in feces ♦ Increase in fiber particle size (> 0.5 inch) in
feces ♦ Appearance of undigested fiber/feed in
feces ♦ Appearance of undigested, ground (< 1/4
inch) grain in feces ♦ Reduced feed efficiency ♦ Reduced production compared to what the
ration is calculated to support How To Manure evaluation includes the assessment of manure appearance and particle size. Evaluate appearance by feeding group: animals that receive the same ration should have similar looking manure unless they are sorting their feed. About 5% of the cows will have manure that differs from the majority of the animals in their group, and this can be accepted as normal. Is the manure very stiff? Is there some diarrhea? Is the manure variable? Is it foamy or containing lots of larger bubbles? Is mucous visible in the manure? (If you drag the tip of your boot across a cow pie, and something moves after your boot has passed, it's likely a mucin cast.) Is undigested feed apparent in the manure? Is it ground or whole grain? When you evaluate the manure, examine the cows and feed for more information: the proportion of the cows ruminating, body condition, general appearance, cleanliness/presence of waterers, feedbunk conditions (feedbunk space, how well feed is mixed, etc.), feed sorting by the cows, cow comfort, etc. Also examine the individual feeds where they are stored to look for mold, spoilage, or
other problems. These other observations may well explain why the manure looks the way it does. For each group of cows, take 4 or 5 samples of feces from individual cow pies: try to pick for variation in appearance representative of the group. Make sure the samples are not contaminated with feed. Eight ounce sample cups with lids are very good for this purpose. Fill the cup completely and cap. Use a screen or kitchen strainer (do not return it to the kitchen) with 1/16 inch (1.66 mm) openings. This is a qualitative, on farm evaluation, so getting very specific about mesh size is not crucial. A strainer that is 7 inches (17.8 cm) in diameter and 4 inches (10.2 cm) deep works well. Transfer a manure sample into the strainer, using a steady stream of water to rinse the cup into the strainer. Rinse the sample gently but thoroughly until the water runs clear. The sample can be transferred back to the sample cup so that all of the samples taken can be compared side by side. Does fiber in the sample appear to be coarse (more than 0.5 inches long, whole pieces of corn stalk)? Does any cottonseed present still have the lint on it? Does the feed retain its color (grass that's still green, citrus that's still orange, etc.)? Is there much (relative term) whole grain in the sample? Ground grain? Manure evaluation is qualitative, so you can assess whether there appears to be too much or an acceptable amount of coarser fiber or undigested grain in the manure (see "In Context"). There is no common, on-farm way to evaluate the proportion of manure your samples represent, so do not try to overinterpret the information they offer. Increased Particle Size/Undigested Material in Feces Large fiber particles or noticeable ground grain in the feces suggest that feed is not being retained in the rumen for a sufficient period to be reduced in size through rumination or microbial fermentation. The depression in ruminal digestion may be related to low pH (Strobel and Russell, 1986). An inadequate ruminal fiber mat may not effectively retain larger particles in the rumen. Both of these situations can be related to inadequate intake of peNDF. The peNDF is fiber in the ration that enhances rumination and rumen motility. Generally, when adequate peNDF is consumed, fecal particle size is smaller and ground grain is less apparent, than when fiber requirements are not met. Sorting of feed by the cows is the most common reason that peNDF needs are not filled. Providing palatable sources of forage, and processing them (chopped to ~1-2 inch lengths) so they can be blended into a moist total mixed ration
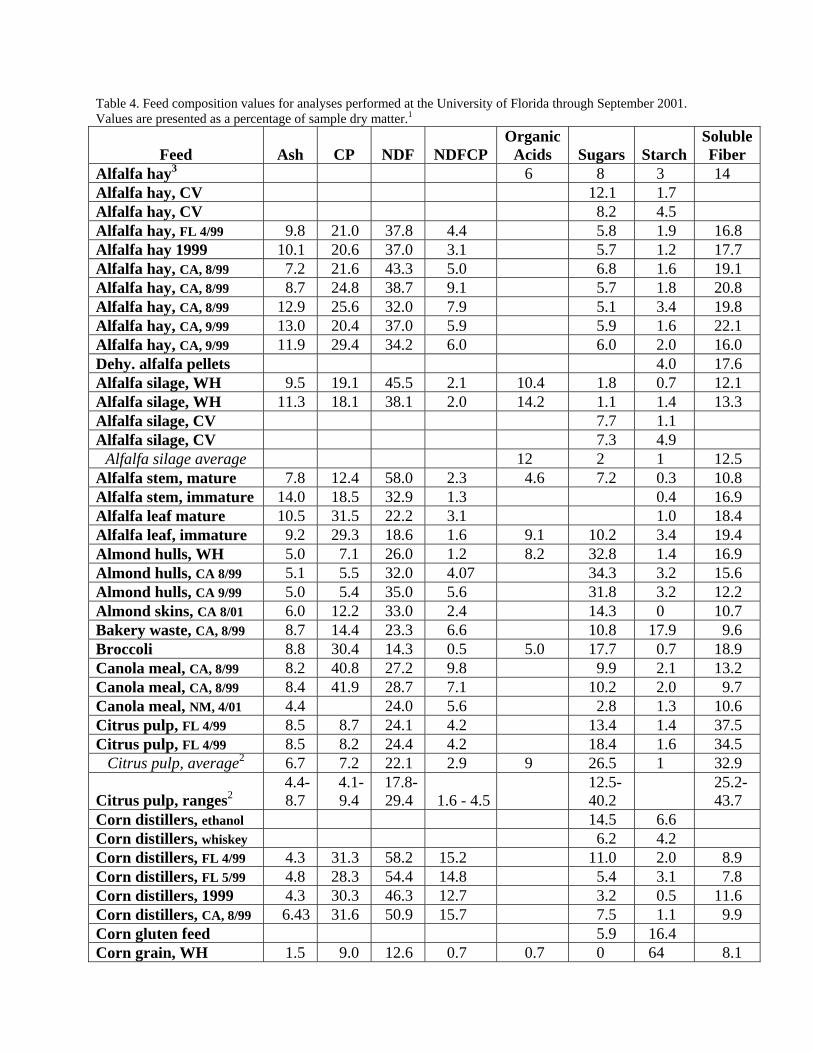
Table 4. Feed composition values for analyses performed at the University of Florida through September 2001. Values are presented as a percentage of sample dry matter.1
Feed
Ash
CP
NDF
NDFCP
Organic Acids
Sugars
Starch
Soluble Fiber
Alfalfa hay3 6 8 3 14 Alfalfa hay, CV 12.1 1.7 Alfalfa hay, CV 8.2 4.5 Alfalfa hay, FL 4/99 9.8 21.0 37.8 4.4 5.8 1.9 16.8 Alfalfa hay 1999 10.1 20.6 37.0 3.1 5.7 1.2 17.7 Alfalfa hay, CA, 8/99 7.2 21.6 43.3 5.0 6.8 1.6 19.1 Alfalfa hay, CA, 8/99 8.7 24.8 38.7 9.1 5.7 1.8 20.8 Alfalfa hay, CA, 8/99 12.9 25.6 32.0 7.9 5.1 3.4 19.8 Alfalfa hay, CA, 9/99 13.0 20.4 37.0 5.9 5.9 1.6 22.1 Alfalfa hay, CA, 9/99 11.9 29.4 34.2 6.0 6.0 2.0 16.0 Dehy. alfalfa pellets 4.0 17.6 Alfalfa silage, WH 9.5 19.1 45.5 2.1 10.4 1.8 0.7 12.1 Alfalfa silage, WH 11.3 18.1 38.1 2.0 14.2 1.1 1.4 13.3 Alfalfa silage, CV 7.7 1.1 Alfalfa silage, CV 7.3 4.9
Alfalfa silage average 12 2 1 12.5 Alfalfa stem, mature 7.8 12.4 58.0 2.3 4.6 7.2 0.3 10.8 Alfalfa stem, immature 14.0 18.5 32.9 1.3 0.4 16.9 Alfalfa leaf mature 10.5 31.5 22.2 3.1 1.0 18.4 Alfalfa leaf, immature 9.2 29.3 18.6 1.6 9.1 10.2 3.4 19.4 Almond hulls, WH 5.0 7.1 26.0 1.2 8.2 32.8 1.4 16.9 Almond hulls, CA 8/99 5.1 5.5 32.0 4.07 34.3 3.2 15.6 Almond hulls, CA 9/99 5.0 5.4 35.0 5.6 31.8 3.2 12.2 Almond skins, CA 8/01 6.0 12.2 33.0 2.4 14.3 0 10.7 Bakery waste, CA, 8/99 8.7 14.4 23.3 6.6 10.8 17.9 9.6 Broccoli 8.8 30.4 14.3 0.5 5.0 17.7 0.7 18.9 Canola meal, CA, 8/99 8.2 40.8 27.2 9.8 9.9 2.1 13.2 Canola meal, CA, 8/99 8.4 41.9 28.7 7.1 10.2 2.0 9.7 Canola meal, NM, 4/01 4.4 24.0 5.6 2.8 1.3 10.6 Citrus pulp, FL 4/99 8.5 8.7 24.1 4.2 13.4 1.4 37.5 Citrus pulp, FL 4/99 8.5 8.2 24.4 4.2 18.4 1.6 34.5
Citrus pulp, average2 6.7 7.2 22.1 2.9 9 26.5 1 32.9 Citrus pulp, ranges2
4.4-8.7
4.1-9.4
17.8-29.4
1.6 - 4.5
12.5-40.2
25.2-43.7
Corn distillers, ethanol 14.5 6.6 Corn distillers, whiskey 6.2 4.2 Corn distillers, FL 4/99 4.3 31.3 58.2 15.2 11.0 2.0 8.9 Corn distillers, FL 5/99 4.8 28.3 54.4 14.8 5.4 3.1 7.8 Corn distillers, 1999 4.3 30.3 46.3 12.7 3.2 0.5 11.6 Corn distillers, CA, 8/99 6.43 31.6 50.9 15.7 7.5 1.1 9.9 Corn gluten feed 5.9 16.4 Corn grain, WH 1.5 9.0 12.6 0.7 0.7 0 64 8.1
Feed
Ash
CP
NDF
NDFCP
Organic Acids
Sugars
Starch
Soluble Fiber
Corn grain, CV 5.2 60.8 Corn meal, FL 4/99 1.6 8.9 20.5 3.6 0 66.2 6.4 Corn meal, FL 5/99 3.3 9.0 15.7 3.8 4.5 55.9 10.6 Corn meal, 1999 1.1 9.5 11.8 2.9 2.3 65.8 8.6 Corn, rolled, CA 8/99 1.5 9.7 15.2 6.9 2.2 60.1 12.1 Corn, rolled, CA, 8/99 1.5 9.1 16.1 5.3 0.9 62.6 8.6 Corn silage, WH 4.9 7.5 50.9 0.9 10.6 0.9 18.9 4.3 Corn silage, WH 3.8 7.0 41.8 0.6 7.9 0.3 30.4 5.8 Corn silage, CV 3.4 14.4 Corn silage, CV 4.7 29.9 Corn silage, FL 4/99 4.8 10.2 51.1 4.4 0.5 19.4 7.0 Corn silage, FL 5/99 3.8 10.4 51.1 3.4 4.6 23.6 3.2 Corn silage, CA, 8/99 12.8 11.4 55.2 4.3 0.8 7.2 10.8 Corn silage, CA, 8/99 6.3 7.5 47.7 6.5 1.3 21.2 15.7 Corn silage, OH 12.1 47.1 1.6 3.3 18.1 11.1 Corn silage, OH 4.0 48.8 1.3 0.9 19.5 7.7 Cottonseed, whole 1 8.5 Ctsd whole, FL 4/99 4.2 24.2 48.3 5.3 6.2 1.6 6.8 Ctsd whole, FL 5/99 4.1 23.3 47.6 5.6 5.9 0.8 10.8 Cottonseed hulls < 1 4 Green peas (frozen) 3.2 25.9 18.2 0.4 1.7 25.0 20.6 2.4 Molasses, cane 55+ Oat hay, CA, 8/99 10.6 8.7 68.0 3.8 3.2 2.8 9.4 Potatoes 4.8 57.5 Soybean meal (48%) 6.5 52.7 10.9 1.4 4.2 10.9 1.0 14.0 SBM (48%) FL 4/99 7.3 56.9 14.4 8.6 11.9 2.4 18.8 SBM (48%) FL 5/99 7.0 56.3 16.0 8.5 11.6 2.1 14.0 SBM (48%) 1999 56.7 9.7 3.2 10.2 0.5 16.9 Wet soy product, CA, 99 4.1 32.0 25.6 1.6 0.8 0.6 31.4 Soybean hulls 4.2 9.8 69.0 4.0 < 1 < 1 1 17.4 Sugar beet pulp, ID 3/94 8.9 8.0 44.6 5.1 0.4 12.8 0 30.0 Sugar beet pulp,CA 8/99 9.1 9.6 51.1 7.3 14.2 1.7 17.4 Sugar beet pulp,CA 8/99 7.4 9.8 39.8 5.7 24.7 2.3 20.1 Timothy hay 5.0 8.2 67.3 1.8 4.4 9.1 0.4 6.4 Ground wheat 1.7 10.9 12.1 1.1 0 1.8 64.6 8.8 Wheat middlings 5.5 19.0 42.3 3.4 4.6 5.4 21 3.4 Wheat silage, CA 9/99 12.4 12.8 50.8 6.1 2.5 2.7 16.8 1 Capitalized abbreviations denote lab source, smaller font capitalized abbreviations indicate state and date of origin. 2 Results from analyses of 79 dried citrus pulp samples. 3 Alfalfa hay: soluble fiber content decreases with increasing maturity and with leaf loss.
that cows cannot readily sort can help to prevent sorting.
MBH Observation: Effectiveness of fiber is not only related to particle size, but to a variety of factors that affect rate of digestion. For example, grass NDF tends to ferment more slowly than does that in legume forages. Additionally, the particles in grass tend to be more needle-shaped, and those in legumes to be more cuboidal. In my experience, grass has tended to be a more effective peNDF source than legume forages possibly because the fiber is retained in the rumen for a longer period of time. One to 3 inch long pieces of very tender or pliable grasses can sometimes be found in the feces - they seem to be able to bed and escape the rumen. The peNDF has to be in the rumen to be effective. A greater amount of NDF from a more rapidly fermented peNDF source would have to be fed to provide the same amount of peNDF as from a more slowly fermenting source. Take as an example that a small amount of chopped straw included in a ration can quickly resolve problems due to peNDF inadequacy of the ration. The need to provide adequate peNDF to allow for proper rumen function and ration digestion is a balancing act with providing adequate nutrients. It is best done with high quality forages and feeds in adequate quantities.
Undigested feed in feces is indicative of an overall reduction in digestibility of the ration. Both fiber and starch can escape digestion. Long pieces of fiber from forage, or even cottonseed with the lint still intact can pass undigested through the gastrointestinal tract, if they are not retained in the rumen for digestion. The visible particles of ground grain in feces may contain 6 to 18% starch (M. B. Hall, unpublished). Reduced digestion of feed represents a loss of ration nutrients. Consequently, the predicted protein and energy supplies for the ration overestimate what the cow actually receives. High producing cows with high dry matter intakes may also show an increased passage of undigested feed, but they should not show evidence of ruminal acidosis. Mucin/Fibrin Casts or Gas Bubbles in Feces When feed is fermented in the rumen, the organic acids are absorbed across the rumen wall, the gas (carbon dioxide and methane) is eructated (belched) out by the cow, and the microbial cells pass to the small intestine for digestion and absorption. When fermentable substrates pass to the hindgut (cecum and large intestine) they are fermented there by bacteria. The microbial protein produced is not absorbed, but passes out with the manure. Gas
produced from hindgut fermentation can appear as bubbles in the manure, sometimes to the point that the feces have the texture of shaving cream. The organic acids can be absorbed by the gut. However, a major difference between the hindgut and the rumen is the potential for the fermentation to be buffered. Where rumination and mixing with saliva provide buffers to reduce the extent of pH decline in the rumen, a system of that magnitude does not exist for the hindgut. When a great deal of fermentable carbohydrate reaches the hindgut, its fermentation to organic acids may result in injury to the gut. The increased acidity may result in a damage to and sloughing of the surface cells (epithelium) in the large intestine. When the damage is sufficiently severe, the intestine secretes mucous or fibrin to protect the injury (Argenzio et al., 1988; Argenzio and Meuten, 1991). Depending upon the severity of the damage, the gut can repair itself in a few hours to a day (R. A. Argenzio, personal communication). The mucin/fibrin casts found in the feces often have the tubular form of the gut; they are evidence that intestinal damage has occurred. Damage to the large intestine and increased concentrations of organic acids in the gut lumen may play a role in causing the diarrhea often seen with ruminal acidosis. Reduced Feed Efficiency If the site of digestion is shifted from the rumen to the hindgut due to a poorly functioning rumen, it is no wonder that feed efficiency suffers. Compared to our usual predictions, the amounts of nutrients available to the cow are diminished. The argument has been raised that increased grain and decreased forage are necessary to meet the energy requirements of the cow. However, if concentrate levels are increased to the point that fiber needs are not met, the analyzed or tabular TDN or net energy levels used to formulate the ration are meaningless. In the pursuit of providing the cow with more energy, violation of the rules for formulating a balanced ration actually reduces the amount of energy that the ration provides. This quote by Dr. Paul W. Moe, a USDA researcher who did much work in the area of net energy, explains the situation (Moe, 1976):
“…The net energy value of a single feedstuff, however, is not a constant but is influenced by such factors as the composition of the remaining portion of the diet, the level of the feed intake, the physiological state of the animal that consumes the feed, etc. This means that while a net energy value may represent the best estimate of the real energy value of a feed in a given situation, it should not be
considered as a constant. ….The net energy value listed in a table usually represents an optimum value, that is the value of that feed when incorporated into a “normal” or “balanced” diet. The value may be considerably less than that if fed in excessive amount or in a diet which has a nutrient deficiency.”
In this light, including excessive amounts of concentrates in an effort to increase ration energy levels is self-defeating. In Context So, what to do with the information from evaluating manure in a herd? Combine it with information on cow health (digestive upset, acidosis, laminitis, etc.), cow performance (milk and milkfat yields), rumination (at least 40% of cows not eating or sleeping should be chewing their cuds), cow observations (sorting the ration or not, comfortable or not), ration & feed evaluation, etc. Manure evaluation describes the interaction of the cow and her ration. The story it tells adds to a body of evidence that something within the ration or in cow and feeding management does or does not need to be modified. If everything else looks fine, but the manure does not seem quite right, keep observing the cows to make certain that they continue to do well, and question what you haven't checked. Transient problems like eating patterns changing with weather fronts, a passing problem with silage, etc. can also generate changes in the manure.
Conclusions
Variation in the digestion characteristics of the non-NDF carbohydrates can affect animal performance, both in terms of production and health. Ration formulation that considers NFC types can support good production while reducing the risk of ruminal acidosis. However, there is much we still need to learn about how NFC vary in rations, and more refined guidelines for their feeding are needed. Manure evaluation offers a simple way to assess rumen function, and how well and where a cow is digesting/fermenting her feed. It is a qualitative system. When used in context with other observations, it can offer confirmation and direction for ration and management changes.
Literature Cited Argenzio, R. A., C. K. Henrikson, and J. A. Liacos. 1988. Restitution of barrier and transport function of porcine colon after acute mucosal injury. Am. J. Physiol. 255:G62.
Argenzio, R. A., and D. J. Meuten. 1991. Short-chain fatty acids induce reversible injury of porcine colon. Digestive Diseases and Sciences. 36:1459. Bandaranayaka, D. D., and C. W. Holmes. 1976. Changes in the composition of milk and rumen contents in cows exposed to a high ambient temperature with controlled feeding. Trop. Anim. Hlth. Prod. 8:38. Branco, A. F., D. L. Harmon, D. W. Bohnert, B. T. Larson, and M. L. Bauer. 1999. Estimating true digestibility of nonstructural carbohydrates in the small intestine of steers. J. Anim. Sci. 77:1889-1895. Broderick, G. A., N. D. Luchini, W. J. Smith, S. Reynal, G. A. Varga, and V. A. Ishler. 2000. Effect of replacing dietary starch with sucrose on milk production in lactating dairy cows. J. Dairy Sci. 83(Suppl. 1):248 (Abstr.). Dale, H. E., and S. Brody. 1954. Environment physiology and shelter engineering XXX. Thermal stress and acid-base balance in dairy cattle. University of Missouri Agricultural Experiment Station, Columbia, MO. Research Bulletin 562:1-27. Gengler, W. R., F. A. Martz, H. D. Johnson, G. F. Krause, and L. Hahn. 1970. Effect of temperature on food and water intake and rumen fermentation. J. Dairy Sci. 53:434. Hall, M. B. 2000. Neutral detergent-soluble carbohydrates: nutritional relevance and analysis, a laboratory manual. University of Florida Extension Bulletin 339. Hall, M. B., and C. Herejk.2001. Differences among carbohydrates in yields of crude protein from in vitro fermentation with mixed ruminal microbes. J. Dairy Sci. 84:2486-2493. Jones, B. A., R. D. Hatfield, and R. E. Muck. 1992. Effect of fermentation and bacterial inoculation on lucerne cell walls. J. Sci. Food Agric. 60: 147-153. Leiva, E., M. B. Hall, and H. H. Van Horn. 2000. Performance of dairy cattle fed citrus pulp or corn products as sources of neutral detergent-soluble carbohydrates. J. Dairy Sci. 83:2866-2875. Lou, J., K. A. Dawson, and H. J. Strobel. 1997. Glycogen formation by the ruminal bacterium Prevotella ruminicola. Appl. Environ. Microbiol. 63:1483-1488. Mansfield, H. R., M. D. Stern, and D. E. Otterby. 1994. Effects of beet pulp and animal by-products on milk yield and in vitro fermentation by rumen microorganisms. J. Dairy Sci. 77:205-216. Mertens, D. R., G. A. Broderick, and R. Simons. 1994. Efficacy of carbohydrate sources for improving utilization of N in alfalfa silage. J. Dairy Sci. 77(Suppl. 1):240 (Abstr.). Mishra, M., F. A. Martz, R. W. Stanley, H. D. Johnson, J. R. Campbell, and E. Hilderbrand. 1970. Effect of diet and ambient tempeature-humidity on ruminal pH, oxidation reduction potential, ammonia and lactic acid in lactating cows. J. Anim. Sci. 30:1023. Moe, P. W. 1976. The net energy approach to formulating dairy cattle rations. Proc. Cornell Nutr. Conf., Syracuse, N.Y. p.72. National Research Council. 1996. Nutrient requirements of beef cattle, 7th rev. edition. National Academy Press, Washington, DC. Niles, M. A., R. J. Collier, and W. J. Croom, Jr. 1998. Effects of heat stress on rumen and plasma metabolite and plasma hormone concentrations in Holstein cows. J. Anim. Sci. 50(Suppl. 1):152 (Abstract).
Nocek, J. E. 1997. Bovine acidosis: implications on laminitis. J. Dairy Sci. 80:1005-1028. Nombekela, S. W., and M. R. Murphy. 1995. Sucrose supplementation and feed intake of dairy cows in early lactation. J. Dairy Sci. 78:880-885. Piwonka, E. J., J. L. Firkins, and B. L. Hull. 1994. Digestion in the rumen and total tract of forage-based diets with starch or dextrose supplements fed to Holstein heifers. J. Dairy Sci. 77:1570-1579. Rooke, J. A., N. H. Lee, and D. G. Armstrong. 1987. The effects of intraruminal infusions of urea, casein, glucose syrup and a mixture of casein and glucose syrup on nitrogen digestion in the rumen of cattle receiving grass-silage diets. Brit. J. Nutr. 57:89-98. Russell, J. B., J. D. O'Connor, D. G. Fox, P. J. Van Soest, and C. J. Sniffen. 1992. A net carbohydrate and protein system for evaluating cattle diets: I. ruminal fermentation. J. Anim. Sci. 70:3551-3561. Solomon, R., L. E. Chase, D. Ben-Ghedalia, and D. E. Bauman. 2000. The effect of nonstructural carbohydrate and addition of full fat extruded soybeans on the concentration of conjugated linoleic acid in the milk fat of dairy cows. J. Dairy Sci. 83:1322-1329.
Strobel, H. J., and B. Russell. 1986. Effect of pH and energy spilling on bacterial protein synthesis by carbohydrate-limited cultures of mixed rumen bacteria. J. Dairy Sci. 69:2941-2947. Sutoh, M., Y. Obara, and S. Miyamoto. 1996. The effect of sucrose supplementation on kinetics of nitrogen, ruminal propionate and plasma glucose in sheep. J. Agric. Sci. (Camb.) 126:99-105. Sutton, J. D., J. A. Bines, S. V. Morant, D. J. Napper, and D. I. Givens. 1987. A comparison of starchy and fibrous concentrates for milk production, energy utilization and hay intake by Friesian cows. J. Agric. Sci. (Camb.) 109:375-386. Thomas, G. J. 1960. Metabolism of the soluble carbohydrates of grasses in the rumen of the sheep. J. Agric. Sci. 54:360-372. Wells, J. E., and J. B. Russell. 1996. The effect of growth and starvation on the lysis of the ruminal cellulolytic bacterium Fibrobacter succinogenes. Appl. Environ. Microbiol. 62:1342-1346.