Embed Size (px)
Citation preview

How$sa'sfied$are$the$self0employed?$A$life$
domain$view$
Mar'n$Binder$
Alex$Coad$
Working$Paper$Series$$
SWPS$2014017$
$
September,)2014)

Disclaimer$
The$works$available$here$are$the$responsibility$of$the$individual$author(s)$and$do$not$necessarily$represent$the$
views$of$other$SPRU$researchers.$As$maPers$of$policy$and$prac'ce,$SPRU$does$not$endorse$individual$research$
contribu'ons.$
Guidelines.for.authors$
Papers$shall$be$submiPed$in$pdf$or$Word$format.$They$should$contain$a$'tle,$an$abstract,$and$keywords.$Papers$
should$be$submiPed$to$one$of$the$Editors,$who$will$process$them$and$send$them$to$the$appropriate$Associate$
Editor.$Two$members$of$SPRU$will$be$asked$to$provide$a$short$wriPen$review$within$three$weeks.$The$revised$
versions$of$the$paper,$together$with$a$reply$to$the$reviewers,$should$be$sent$to$the$Associate$Editor,$who$will$
propose$to$the$Editors$its$publica'on$on$the$series.$When$submiSng$the$authors$should$indicate$if$the$paper$
has$already$undergone$peer0reviewing,$in$which$case$the$Associate$Editors$may$decide$to$skip$internal$review$
process.$
Website$
SWPS:$www.sussex.ac.uk/spru/research/swps$
IDEAS:$ideas.repec.org/s/sru/ssewps.html$
Editors( Contact(Tommaso&Ciarli& [email protected]/Daniele&Rotolo& [email protected]/
Associate(Editors& Area&Florian&Kern& Energy& [email protected]/
Paul&Nightingale&& Science,&&&Technology&Policy& [email protected]/
Matias&Ramirez& Development& [email protected]/
Joe&Tidd&&&Carlos&Sato&&
Technology&Innovation&Management& [email protected]/[email protected]/
Maria&Savona&&&Mariana&Mazzucato&&
Economics&of&Technological&Change& [email protected]/[email protected]/
Andrew&Stirling& Transitions& [email protected]/
Caitriona&McLeish& Civil&military&interface&& [email protected]/
SPRU.Working.Paper.Series$
The$SPRU$Working$Paper$Series$aims$to$accelerate$the$public$availability$of$the$research$undertaken$by$SPRU0
associated$ people$ of$ all$ categories,$ and$ excep'onally,$ other$ research$ that$ is$ of$ considerable$ interest$ within$
SPRU.$It$presents$research$results$that$in$whole$or$part$are$suitable$for$submission$to$a$refereed$journal,$to$a$
sponsor,$to$a$major$conference$or$to$the$editor$of$a$book.$Our$inten'on$is$to$provide$access$to$early$copies$of$
SPRU$research.$

How satisfied are the self-employed? A life domain viewI
Martin Binder⇤,a,b,c, Alex Coadc,d,e
aBard College Berlin, Platanenstr. 24, 13156 Berlin, GermanybMax Planck Institute of Economics, Evolutionary Economics Group, Kahlaische Str.10, 07745 Jena,
GermanycScience and Technology Policy Research Unit, University of Sussex, Falmer, Brighton, BN1 9SL, UK
dRATIO, P.O. Box 3203, SE-10364 Stockholm, SwedeneDepartment of Business and Management, Aalborg University, Fibigerstræde 4, 9220 Aalborg Ø, DK
Abstract
It is well-known in the literature that self-employment positively influences job satisfaction,
but the e↵ects on other life domains and overall life satisfaction are much less clear. Our
study analyzes the welfare e↵ects of self-employment apart from its monetary aspects, and
focuses on the overall life satisfaction as well as di↵erent domain satisfactions of self-employed
individuals in our German sample from 1997 to 2010. Using matching estimators to create
an appropriate control group and di↵erentiating between di↵erent types of self-employment,
we find that voluntary self-employment brings with it positive benefits apart from work
satisfaction, and leads to higher overall life satisfaction as well as increased health satisfaction,
all of which increase in the first three years of self-employment. Being forced into self-
employment to escape unemployment, however, confers no such benefits. Additionally, both
types of self-employment lead to increasing dissatisfaction with one’s leisure time.
Key words: subjective well-being, self-employment, domain satisfaction, matching
estimators, SOEP
JEL-classification: L26, J24, J28
IWe are grateful to Simon Parker for many helpful comments. This research was funded by the ESRC-TSB-BIS-NESTA as part of the ES/J008427/1 grant on Skills, Knowledge, Innovation, Policy and Practice(SKIPPY). The data used in this publication were made available to us by the German Socio EconomicPanel Study (GSOEP) at the German Institute for Economic Research (DIW), Berlin. Neither the originalcollectors of the data nor the Archive bears any responsibility for the analyses or interpretations presentedhere. The usual caveat applies.
⇤Corresponding authorEmail addresses: [email protected] (Martin Binder), [email protected] (Alex Coad)
April 16, 2014

1. Introduction
With society undergoing rapid change in its forms of work organization, entrepreneurs
and the self-employed have come to the attention of researchers. Small, high-growth firms are
one important driver for employment growth (Henrekson and Johansson, 2010) and policy-
makers are interested in fostering a more entrepreneurial society (Storey, 1994). But what
about entrepreneurs and the self-employed themselves? There is much research interest
in which factors make for a successful entrepreneur (Sarasvathy, 2004), but we are also
interested in what the outcomes of successful entrepreneurship are: despite the self-employed
usually earning less than their employed counterparts (Hamilton, 2000), large numbers of
individuals find becoming their own boss highly attractive (Blanchflower, 2004). One common
explanation for this is the high degree of autonomy and work satisfaction individuals can
derive from self-employment (Benz and Frey, 2008a).
This paper expands on this latter theme. High work satisfaction for the self-employed has
often been interpreted to mean that the self-employed are happier with their lives, although
strictly speaking, the evidence on the self-employment-happiness relationship is considerably
weaker and more mixed than with work satisfaction. Many studies confirm a high work
satisfaction of the self-employed, but only few find a direct relationship with life satisfac-
tion/happiness measures (e.g., Binder and Coad, 2013a). As has been argued in previous
work on the topic, one explanation for this puzzling finding could lie in a crowding-out phe-
nomenon: self-employed who are much happier with their work than the employed spend
considerably more time with their job thus crowding-out other important domains of life
(such as leisure time) and leading in sum to a neutral e↵ect on overall life satisfaction (ibid.).
An alternative explanation could lie in self-employed individuals being a heterogeneous group
of people and only certain forms of self-employment might be conducive for subjective well-
being, for example when individuals pursue entrepreneurial opportunities as opposed to be-
ing forced into self-employment to avoid unemployment (Reynolds et al., 2005; Block and
Koellinger, 2009; Binder and Coad, 2013a).
In the present study we explore these questions with a large German household panel
data set and ask whether the self-employed in Germany are more satisfied with work and
life than their employed counterparts. Given the need for high-quality replication studies
2

(Aguinis and Edwards, 2014; Evanschitzky et al., 2007), we replicate and substantively extend
a study from the UK with German data (Binder and Coad, 2013a). We mainly rely on
matching techniques (see, e.g., Lechner, 2009; Bockerman and Ilmakunnas, 2009; Oakes and
Kaufman, 2006), in order to replicate the aforementioned study faithfully, but also because
multivariate regression modeling gives no consideration to the distribution of covariates in
the treatment versus control groups. Unless there is substantial overlap in the two sets of
covariate distributions, multivariate regression estimates rely heavily on extrapolation, and
can be misleading (Imbens, 2004; Ichino et al., 2008, pp. 312-313). Matching estimators
are preferable because an appropriate control group is established. Another advantage of
matching methods is that they avoid assumptions on functional forms.
In addition, our paper goes beyond previous work by contributing novel insights to the
literature in a variety of ways: in order to explore the crowding-out hypothesis, we analyze to
what extent self-employment impacts di↵erent domains of life of the self-employed, making
use of the rich data set at hand. We thus take a broader “life domain view” and look
into whether going into self-employment has an impact on life domains ranging from work
satisfaction to satisfaction with health, household income, leisure time, standard of living,
dwelling, housework and family life. With this focus on di↵erent domain satisfaction as a
complement to life satisfaction as dependent variable, our paper is related to some recent
papers that try to unpack life satisfaction into its constituent parts (van Praag et al., 2003;
Powdthavee, 2012; Binder and Coad, 2013a). Analysing the impact of self-employment on
di↵erent domain satisfactions is also worthwhile because these domain measures tend to be
more reliable than global judgements of overall life satisfaction (Schwarz and Strack, 1999;
Krueger and Schkade, 2008).
We also explore the self-employment-happiness nexus by distinguishing whether individu-
als pursue self-employment in order to exploit new business opportunities versus individuals
who become self-employed out of sheer necessity in order to escape unemployment. It has
been shown in previous work that this distinction can account for di↵erences in life satisfac-
tion of the self-employed, with opportunity pursuing entrepreneurs being significantly more
happy than their employed peer and necessity entrepreneurs not being so Binder and Coad
(2013b). Finally, we also look into the question whether company size, autonomy of one’s
3

job as well as the industry in which one works have a bearing on work and life satisfaction
of our German sample.
Our paper proceeds in the following way: we first give a short overview over the pertinent
literature background in Section 2 and proceed then to our analysis in Section 3, where we
discuss data set and variables, present our results as well as a number of extensions. We
conclude in Section 4.
2. Literature background
Subjective well-being (SWB, or synonymously “happiness”) has been intensively studied
in recent years and is linked to a range of determinants that seem to reliably influence it
the world over (Frey and Stutzer, 2002, 2005; Dolan et al., 2008; Graham, 2009; Layard
et al., 2012): opportunities for gainful employment and work organization are one of its
most important determinants. But the relationship between subjective well-being and self-
employment1 is complicated: if we measure subjective well-being as job/work satisfaction,
findings are consistently positive. Multiple studies report “rather robust finding[s] across the
nations on which data are available” that self-employment is related to higher overall job
satisfaction (Blanchflower, 2004), this being the case in the US (Blanchflower and Oswald,
1998; Kawaguchi, 2008) and other OECD countries (Blanchflower, 2000; Blanchflower et al.,
2001; Clark et al., 2008).
High job satisfaction is thus one principal return to entrepreneurship, despite a number
of drawbacks such as lower monetary returns to self-employment (Hamilton, 2000),2 higher
variability of returns (Praag and Versloot, 2007), fewer fringe benefits (Storey, 1994, Ch. 6),
longer working hours (Ajayi-obe and Parker, 2005; Hyytinen and Ruuskanen, 2007) and
higher levels of stress (Andersson, 2008; Schieman et al., 2006; Parasuraman and Simmers,
2001).
1We (and much of the literature) use the terms self-employment and entrepreneurship interchangeably forease of reference (on this practice see also Carter, 2011). Some might consider there to be di↵erences betweenentrepreneurship and self-employment, e.g. in terms of innovation, growth ambition, etc. Bear in mind thatwhen talking about entrepreneurship in this paper, we refer to self-employment.
2Typical returns to self-employment are lower than compared to earnings for being employed, but thereare issues of underreporting of returns of the self-employed for tax reasons, as well as other considerationsthat warrant further research on this front (Carter, 2011).
4

Positive overall job satisfaction despite some objectively worse outcomes of self-employment
has been explained with reference to “procedural utility” that the self-employed derive from
their work (Benz and Frey, 2008a,b): self-employed individuals obtain satisfaction from lead-
ing an independent lifestyle and “being their own bosses”. Hundley (2001) finds that the
self-employed are more satisfied with their jobs mainly because of greater autonomy, but
also because of more flexibility, skill utilization and, to some extent, higher (perceived) job
security (see also, Carter et al., 2003; Feldman and Bolino, 2000; Parasuraman and Simmers,
2001).3 The autonomy of being self-employed here is probably the most consistent expla-
nation for higher job satisfaction and finds corroboration through self-determination theory
(Deci and Ryan, 2000): the need for autonomy and its satisfaction were shown in psycho-
logical research to be robustly related to better psychological functioning and well-being.
Such an explanation would also be consistent with findings that employees have a lower job
satisfaction in large firms compared to small firms (Idson, 1990; Benz and Frey, 2008a).4
But one should also be aware of the fact that there remain issues of reverse causality
regarding the relationship between job satisfaction and self-employment: Kawaguchi (2008)
observes that job quitting tends to follow low job satisfaction and Noorderhaven et al. (2004)
find a positive association of the levels of “dissatisfaction with life” observed in a society
with high self-employment rates. This means that low satisfaction (with job or life) could
“push” individuals into self-employment (but see the negative evidence for this in Schjoedt
and Shaver, 2007). At least on the macro level, an association with low satisfaction and self-
employment could also be explained with reference to necessity entrepreneurship, i.e. large
numbers of individuals in poor countries are forced into self-employment to escape unem-
ployment and there would be no reason to suspect that these individuals would experience
higher well-being from their situation (compare also Bianchi, 2012).
The above findings notwithstanding, satisfaction with work (as analyzed in most studies
as proxy for well-being) does not equal life satisfaction, but is merely one life domain amongst
3Interestingly, the latter has been identified to decrease job satisfaction in a recent study of Europeanself-employment (Millan et al., 2013).
4Also, the positive e↵ect of being self-employed on job satisfaction diminishes markedly when taking intoaccount the heterogeneity of the control group of the employed in terms of the size of the firm they areworking in Benz and Frey (2008a, p. 374).
5

others, which all together determine an individual’s life satisfaction (van Praag et al., 2003;
Schjoedt and Shaver, 2007; Powdthavee, 2012; Binder and Coad, 2013b). If self-employment
would contribute positively to work satisfaction but decrease satisfaction with other domains
of life (e.g., with the financial situation or with leisure time), it is not prima facie clear what
the net e↵ect on life satisfaction would be (see also McAdams et al., 2012, on this “bottom-
up” approach as to how domain satisfactions contribute to life satisfaction). As such, taking
job satisfaction results and arguing that individuals derive higher (overall) well-being from
being self-employed seems to be a sleight-of-hand that might distract from the direct analysis
of the relationship between self-employment and life satisfaction.
When looking for evidence for the impact of self-employment on life satisfaction proper,
the picture becomes much more ambiguous (Dolan et al., 2008, p. 101): Blanchflower and
Oswald (1998) report for cross-sectional data from the US that young self-employed are
happier, and in a similar vein Craig et al. (2007) provide some evidence for this relationship
from Australian small businesses. Looking at European countries, Blanchflower (2004) fails
to find overly strong e↵ects of self-employment on life satisfaction (only for subgroups, self-
employment is significantly related to life satisfaction; and strongly depending on the data
set used). Evidence about this relationship is scant (Harbi and Grolleau, 2012; Andersson,
2008, p. 231).
The empirically weak association between self-employment and life satisfaction might be
a result of the above-mentioned domain view of well-being. Highly satisfied with their jobs,
the self-employed ignore other important life domains and turn out to be less satisfied in
those, leading to an overall sketchy association of self-employment and global well-being.
But at the same time, it is also clear that the self-employed are a rather heterogeneous group
(Santarelli and Vivarelli, 2007) and only subsets of self-employed are indeed happier with
their life overall. This hypothesis has been pursued by Binder and Coad (2013a), who distin-
guished between what has been called necessity and opportunity self-employment (Reynolds
et al., 2005), and argued that individuals who seek self-employment out of necessity and to
avoid unemployment might not profit at all from becoming self-employed (Fuchs-Schundeln,
2009). Only individuals who voluntarily go into self-employment to pursue entrepreneurial
opportunities can be conjectured to enjoy the entrepreneurial life-style and enjoy procedu-
6

ral utility from becoming self-employed.5 With BHPS data, it could indeed be shown that
opportunity self-employed were significantly more satisfied with their life overall than their
employed counterparts (Binder and Coad, 2013a, but a similar di↵erence could not be estab-
lished for the necessity case).6 From a theoretical point of view, this finding is also in line with
self-determination theory that argues that individuals only derive well-being benefits from
autonomous action, whereas being forced into self-employment seems to be a paradigmatic
case of the opposite (even if the self-employed afterwards enjoy some autonomy in their job
itself).
Given these two observations about di↵erent types of self-employment as well as the under-
researched question of domain satisfactions of the self-employed in domains other than work
satisfaction, our empirical approach will attempt to fill these gaps and analyze the satisfaction
of the self-employed in di↵erent life domains as well as separating the self-employed into a
group of opportunity and a group of necessity entrepreneurs.
3. Analysis
3.1. Data set and variables
We use the German Socio-Economic Panel (SOEP) longitudinal data set which contains
household and individual level micro-data on social and economic change in Germany. The
data set now comprises around 12,000 households (approximately 20,000 persons). It has
started out in 1984 with 6,000 households which were selected following multistage random
sampling, aiming at a nationally representative selection of German households (for more
information see Wagner et al., 2007; Haisken-DeNew and Frick, 2005).
We focus mostly on working individuals, tracking those individuals who transition from
either employment or unemployment into self-employment. We omitted those cases where
individuals did not report our main variables, and e↵ectively have an unbalanced panel sample
5Cooper and Artz (1995) found that entrepreneurs with initially high expectations for their businessventure performance turned out to be more satisfied than other entrepreneurs, suggesting that these moresatisfied individuals have some more optimistic personality traits that influence their subsequent job satisfac-tion. Wether there are certain personality traits that facilitate self-employment and the related satisfactionderived from it is still a matter of active research (e.g. Caliendo and Kritikos, 2011).
6Block and Koellinger (2009) find a similar di↵erence in terms of satisfaction with the startup, i.e. necessityentrepreneurs do not receive satisfaction from what they are forced to be doing.
7

employed self-employed unemployedmean sd count mean sd count mean sd count
Satisfaction With. . .Life Today 7.12 1.60 96941 7.10 1.72 12355 6.44 2.03 44216Work 7.04 1.96 95797 7.28 2.00 12204 3.76 3.34 4009Health 7.01 1.96 96770 7.06 2.01 12335 6.04 2.40 44133Household Income 6.52 2.04 96069 6.51 2.29 12266 5.55 2.58 43724Leisure Time 6.45 2.15 96677 5.63 2.55 12306 7.42 2.13 44006Standard Of Living 7.15 1.66 70683 7.24 1.83 8772 6.53 2.14 33954Dwelling 7.72 1.86 96620 7.93 1.87 12322 7.53 2.06 44047Housework 6.69 1.98 64917 6.44 2.16 7629 6.56 2.01 37634Family Life 7.70 1.93 32850 7.60 2.06 4576 7.69 2.09 13445
log(income) 10.03 0.43 96941 10.36 0.60 12355 9.69 0.56 44216Marriage dummies
married 0.62 0.49 96941 0.68 0.47 12355 0.72 0.45 44216separated 0.02 0.14 96941 0.03 0.16 12355 0.02 0.14 44216widowed 0.01 0.11 96941 0.02 0.13 12355 0.05 0.22 44216divorced 0.08 0.28 96941 0.10 0.31 12355 0.08 0.28 44216spouseaway 0.00 0.03 96941 0.00 0.00 12355 0.00 0.03 44216
Household type dummies1-Pers.-HH 0.13 0.34 96941 0.13 0.34 12355 0.11 0.31 44216Couple Without Children 0.29 0.46 96941 0.29 0.46 12355 0.40 0.49 44216Single Parent 0.04 0.20 96941 0.03 0.18 12355 0.06 0.23 44216Couple With Children LE 16 0.25 0.43 96941 0.27 0.44 12355 0.17 0.38 44216Couple With Children GT 16 0.19 0.39 96941 0.16 0.37 12355 0.16 0.37 44216Couple With Children LE and GT 16 0.07 0.26 96941 0.08 0.27 12355 0.06 0.24 44216Multiple Generation-HH 0.02 0.12 96941 0.01 0.11 12355 0.02 0.16 44216Other Combination 0.01 0.10 96941 0.02 0.12 12355 0.02 0.12 44216
Number of Persons in HH 2.83 1.25 96941 2.85 1.25 12355 2.76 1.33 44216d disabled 0.05 0.22 96941 0.03 0.18 12355 0.21 0.41 44216gender 0.33 0.47 96941 0.27 0.44 12355 0.64 0.48 44216age 41.62 10.78 96941 46.24 10.60 12355 50.23 13.01 44216age2 133.52 151.34 96941 112.50 149.41 12355 189.13 156.33 44216Education dummies
0 in school 0.00 0.01 96941 0.00 0.01 12355 0.00 0.05 442161a inadeq. compl. 0.01 0.11 96941 0.01 0.07 12355 0.05 0.22 442161b elementary 0.06 0.23 96941 0.03 0.16 12355 0.17 0.37 442161c basic voc. 0.25 0.43 96941 0.21 0.41 12355 0.36 0.48 442162b middle gen. 0.02 0.15 96941 0.02 0.13 12355 0.04 0.19 442162a middle voc. 0.31 0.46 96941 0.26 0.44 12355 0.22 0.42 442162c gen: hi gen. 0.01 0.11 96941 0.03 0.17 12355 0.01 0.11 442162c voc: hi voc. 0.08 0.27 96941 0.08 0.27 12355 0.04 0.19 442163a low tert. 0.08 0.27 96941 0.10 0.30 12355 0.03 0.18 442163b high tert. 0.18 0.38 96941 0.28 0.45 12355 0.08 0.26 44216
subj. health 3.60 0.83 96941 3.62 0.84 12355 3.10 1.01 44216d German 0.92 0.28 96941 0.94 0.23 12355 0.86 0.34 44216Observations 96941 12355 44216
Table 1: Descriptive statistics, broken down by employment type.
of 270, 094 observations spanning 1997 to 2010, due to the subjective health variable only
being asked quite late into the panel as well as the self-employment variable being changed in
1997. A summary overview of the variables used in subsequent analysis is given in Table 1,
where we split the sample into employed, self-employed and unemployed individuals.
For our analysis, the main dependent variables are life satisfaction, work satisfaction as
well as a number of other domain satisfactions. The SOEP has contained a life satisfaction
question from 1984 on. Respondents are asked how satisfied, all in all, they are with their
8

life at the moment (“today”). The answer is given on an ordinally scaled, eleven point Likert
scale ranging from 0 (lowest satisfaction) to 10 (highest satisfaction). This measure has been
extensively used in the literature on subjective well-being. The validity of such subjective
well-being measures has been established within the psychological and economic literature
(Diener et al., 1999; Helliwell and Wang, 2012; Layard et al., 2010), and subjective well-being
measures correlate in the expected directions with a number of objective factors such as e.g.
emotional expressions like smiling (Fernandez-Dols and Ruiz-Belda, 1995). Individuals are
also able to (ordinally) compare and assess other individuals’ happiness, for example when
individuals’ self-reports are correlated with reports of friends and family (Sandvik et al.,
1993; Diener and Lucas, 1999). As regards these measures’ reliability, the consensus is that
they quite reliably measure the intended individual well-being. The test-retest reliability of
subjective well-being constructs lies between 0.5 and 0.7 (over two weeks, see Krueger and
Schkade, 2008).7 We also look at other domain satisfactions, ranging from work satisfaction
(which measures the overall satisfaction with the job) to satisfaction with health, household
income, leisure time, standard of living, dwelling, housework and family life. These are
measured on the same scale as life satisfaction but many domain satisfactions were only
elicited in fewer waves. Moreover, while life satisfaction was available for our full sample
(for the FE regressions), work satisfaction, for instance, was mostly reported by employed
individuals and very few unemployed individuals (FE regression sample size of 159, 920).
Empirically, domain satisfaction judgements turn out to be more reliable than life satisfaction
judgements (Schwarz and Strack, 1999; Krueger and Schkade, 2008), with reliabilities from
0.68 to 0.74 as opposed to 0.54 for the more global life satisfaction (Krueger and Schkade,
2008, p. 1838). This does make sense from a theoretical point of view if one considers
that individuals can more easily assess their life in a single domain as opposed to somehow
aggregating their domain satisfaction judgments into a comprehensive well-being assessment
(it is likely that such life satisfaction assessments are arrived at via heuristics, for example by
recourse to recent salient events or using current mood as a proxy, see Schwarz and Strack,
7We treat this measure as cardinal at various instances throughout our analysis since it was shown inthe literature that this does not alter findings substantially and it allows us to use a fixed-e↵ects regressionframework Ferrer-i-Carbonell and Frijters (2004).
9

1999).
Our main independent variable is self-employment and other labor-force statuses as con-
trol categories. We count individuals as self-employed who work full-time and are self-
employed (10, 194 obs.), freelance (4, 766 obs.) or help in their family business (642 obs.).
We have excluded the category of self-employed farmers (685 obs.) because of di�culties
in comparing this work with other jobs (Hundley, 2001, p. 299). Beside unemployment (we
have included as unemployed those who report their labor-force status as “not working -
unemployed” as well as those who report to be “non-working”), employment (we focus on
individuals working full-time) and self-employment, we have added maternity-leave, retire-
ment, being in education and completing one’s civil or military service in the fixed-e↵ects
regressions. In our main analysis, however, we focus only on these individuals who either
switch from (un)employment to self-employment (treatment group) or those who remain in
(un)employment (control group).
Our measure of income is equivalized (with the International Experts’ scale) and deflated
post-government household income (i.e. income after taxes and government transfers; see
similarly Headey et al., 2004; D’Ambrosio and Frick, 2007). In line with the literature, we
use the logarithm of the income measure as a regressor in our analysis, assuming that a
given change in the proportion of income leads to the same proportional change in well-being
(Stevenson and Wolfers, 2008; Layard et al., 2008).
As a measure for an individual’s health, we use self-rated health. Self-rated health is a
subjective health indicator, ordinally scaled on a five point Likert scale ranging from 1 (“very
good”) to 5 (“bad”) and a dummy variable for being disabled. Lastly, we have included a
number of ordinary control variables (see Table 1) which comprise gender, di↵erent marital
statuses, household size and composition variables, age, and age2 (the squared di↵erence
between age and mean-age to be precise). We control for year e↵ects and regions (German
“Bundeslaender” and East vs. West-Germany) but do not report this to conserve space. Also
included is an educational control variable, viz. an individual’s highest level of education, as
measured by the CASMIN scale. This is measured by converting the reported categories,
ranging from zero (“In School”) to nine (“Higher Tertiary Education”), into a series of
dummy variables (Table 7 in the Appendix shows the contemporaneous correlations of our
10

main variables).
3.2. Main results: work and life satisfaction
Are the self-employed in Germany more satisfied with their work and life than other
individuals? Neither the simple comparison of means (Table 1) nor our baseline fixed-e↵ects
regressions (see Table 2, column 1) would suggest that the self-employed are happier with
their lives than the control group. However, they are more satisfied with their work (0.30⇤⇤⇤).
To compare the e↵ect size of self-employment consider the strong negative e↵ect (�2.58⇤⇤⇤)
of unemployment on work satisfaction (where reported, see Table 2, column 2) and life
satisfaction (�0.30⇤⇤⇤).8 These findings are typical for most of the literature, as are many
of the coe�cients for our control variables (we refrain from further discussing these here to
conserve space, but compare Dolan et al., 2008; Layard et al., 2012).
Our matching estimates of becoming self-employed on subjective well-being are presented
in Tables 3 and 4. Matching estimates (Rubin, 1974; Imbens, 2004; Caliendo and Kopeinig,
2008) allow us to more carefully select a control group of similar individuals to those who
go into self-employment (“perfect twins” with the one exception that these control individ-
uals do not actually get into self-employment but remain either employed or switch from
unemployment into employment, Almus and Czarnitzki, 2003, p. 231). It is an econometric
technique that bears similarities to an experimental setup in medical research but can be
applied to observational data to recreate a “control group” that is comparable to the “treat-
ment group” in terms of observed variables (without actually having to conduct a trial).
The identifying assumption is a conditional independence assumption (CIA), which holds
that the potential outcome (subjective well-being) and “treatment” participation (going into
self-employment) are independent for individuals with the same exogenous characteristics,
i.e. we rule out di↵erences between the control and treatment groups in terms of unobserved
variables. CIA may be a strong assumption, and moreover it cannot be verified directly but
only with reference to theoretical considerations of what drives treatment and outcome. In
order to justify the identifying assumption, we have selected our matching variables drawing
8Excluding “non-working” individuals and focussing only on individuals whose labor-force status is “un-employed” doubles the coe�cient size to �0.60⇤⇤⇤.
11

(1) (2)life satisfaction (FE) job satisfaction (FE)
log(income) 0.1581⇤⇤⇤ (12.99) 0.1240⇤⇤⇤ (5.37)Employment dummies
unemployed -0.3022⇤⇤⇤ (-20.98) -2.5761⇤⇤⇤ (-36.48)selfemployed 0.0168 (0.54) 0.3021⇤⇤⇤ (6.51)maternityleave 0.0197 (0.76) -0.6788⇤⇤⇤ (-6.07)retired -0.1738⇤⇤⇤ (-8.60) -1.4187⇤⇤⇤ (-6.33)education 0.0227 (0.99) -0.5422⇤⇤⇤ (-5.26)civmilservice -0.1072 (-1.07) -0.3917 (-1.64)
Marriage dummiesmarried 0.0721⇤⇤ (2.72) 0.0512 (1.27)separated -0.1272⇤⇤ (-2.77) 0.1568⇤ (2.47)widowed -0.1091 (-1.86) 0.0712 (0.58)divorced 0.1192⇤⇤ (2.92) -0.0106 (-0.17)spouseaway 1.0082⇤ (2.19) -0.9045⇤ (-2.10)
Household type dummiesCouple Without Children 0.1803⇤⇤⇤ (7.08) -0.0418 (-1.05)Single Parent -0.0932⇤⇤ (-2.70) 0.1023 (1.84)Couple With Children LE 16 0.1984⇤⇤⇤ (5.78) 0.0752 (1.38)Couple With Children GT 16 0.0657⇤ (1.97) 0.0515 (0.96)Couple With Children LE and GT 16 0.1331⇤⇤⇤ (3.52) 0.0857 (1.42)Multiple Generation-HH 0.1533⇤⇤ (2.66) 0.0160 (0.16)Other Combination 0.0391 (0.80) -0.1601 (-1.91)
Number of Persons in HH -0.0076 (-0.80) 0.0028 (0.17)d disabled -0.1468⇤⇤⇤ (-6.73) -0.1203⇤ (-2.42)age -0.0035⇤ (-2.39) -0.0246⇤⇤⇤ (-9.48)age2 -0.0001⇤ (-2.44) 0.0000 (0.17)Education dummies
(0) In School 0.2931⇤⇤⇤ (4.40) -0.5696⇤⇤ (-2.84)(1b) General Elementary School 0.1504⇤⇤ (2.67) 0.0593 (0.57)(1c) Basic Vocational Qualificat. 0.0804 (1.35) 0.0277 (0.26)(2b) Intermediate General Qualif. 0.1230 (1.92) 0.1271 (1.04)(2a) Intermediate Vocational 0.1097 (1.77) 0.0873 (0.76)(2c gen) General Maturity Certif. 0.1244 (1.89) 0.2926⇤ (2.16)(2c voc) Vocational Maturity Certif. 0.1073 (1.58) 0.2199 (1.68)(3a) Lower Tertiary Education 0.1806⇤ (2.50) 0.3373⇤ (2.44)(3b) Higher Tertiary Education 0.1235 (1.76) 0.3243⇤ (2.34)
subj. health 0.4950⇤⇤⇤ (89.99) 0.4159⇤⇤⇤ (45.68)d EastGermany -0.0953 (-1.07) -0.0614 (-0.37)Constant 3.9640⇤⇤⇤ (22.14) 5.1243⇤⇤⇤ (15.85)Observations 270094 159920R2 0.086 0.074F 185.5822 75.4303df r 40475 29512
t statistics in parentheses⇤ p < 0.05, ⇤⇤ p < 0.01, ⇤⇤⇤ p < 0.001
Table 2: Baseline regressions.
on the subjective well-being and entrepreneurship literature (and with an eye to maintaining
comparability to the study of Binder and Coad, 2013a). The second matching assumption
is known as “overlap”, or the “common support condition”. This assumption ensures that
individuals with the same characteristics have a positive probability of being either “partic-
ipants” (i.e. becoming self-employed) or “nonparticipants” (staying in (un)employment). In
further analysis we find considerable support for the common support condition (the method-
ological background of matching is further discussed in Oakes and Kaufman, 2006; Caliendo
12

and Kopeinig, 2008; Binder and Coad, 2013a).
FE models such as our baseline regressions obscure the number of observations on which
coe�cients for treatment variables are based, and can su↵er from problems of endogeneity
and self-selection, as well as the lack of potential common support for treatment and control
group. More reliable estimates of the impact of self-employment on subjective well-being may
be gained by using matching estimates that are less prone to the aforementioned problems.
In our matching analysis, we compare individuals that are similar at time point t in terms of a
large number of covariates of interest such as income, health etc. We then look at individuals
that (1) move from being employed in t to self-employment in t + 1 and later periods, and
compare them to individuals who stay employed during the three following lags. We interpret
this as the “opportunity self-employment case”, where individuals leave their employment to
pursue innovative opportunities. We (2) contrast this case with the case where individuals
are unemployed in t and move to self-employment in t+1 and later periods. In this “necessity
self-employment case”, our control group are individuals who move from unemployment into
employment in the subsequent lags. Obviously both cases are quite coarse operationalizations
of opportunity and necessity entrepreneurship, however, it is di�cult to otherwise infer the
motivation for self-employment in the data set used in our analysis.
We use two di↵erent matching estimators, namely propensity-score matching (Leuven
and Sianesi, 2003) and nearest-neighbour-matching (Abadie et al., 2004). Nearest neighbour
matching finds a match in many dimensions simultaneously while propensity score matching
collapses all covariates into one composite variable (the so-called “propensity score”). We
use the same set of covariates in both cases, namely previous change in subjective well-
being, previous subjective well-being, log(income), subjective health, being disabled, diverse
marital dummies (being married, separated, divorced or widowed, having a spouse outside
of Germany), gender, age, a quadratic age term, household size, dummies for education,
household type, state dummies, a dummy for living in East Germany as well as year dummies.
The results look rather similar across di↵erent matching algorithms, which provides al-
ready a test of the robustness of our results (Caliendo and Kopeinig, 2008). We can see that
there are actually not as many cases where individuals transition from unemployment into
employment or self-employment, something that is somewhat obscured in typical regression
13

life satisfaction job satisfactionE to SE vs. E to E E to SE vs. E to E
ATT Controls Treated ATT Controls Treated
1 lag 0.128+ 60,843 485 0.436*** 60,289 481SE 0.075 0.094t-stat 1.71 4.642 lags 0.173+ 47,312 308 0.477*** 46,711 304SE 0.093 0.109t-stat 1.86 4.373 lags 0.306** 36,713 215 0.488*** 36,916 215SE 0.109 0.132t-stat 2.80 3.69UE to SE vs. UE to E UE to SE vs. UE to E
ATT Controls Treated ATT Controls Treated
1 lag -0.044 1,628 194 0.140 1,634 185SE 0.135 0.178t-stat -0.33 0.792 lags -0.255 793 108 0.355+ 773 109SE 0.194 0.207t-stat -1.32 1.723 lags -0.075 499 68 0.236 491 65SE 0.217 0.269t-stat -0.35 0.88
Table 3: Matching estimates. We use propensity score matching (PSM, Leuven and Sianesi, 2003) and reportAverage Treatment e↵ects for the Treated (ATTs) with t-statistics. Dependent variables are same as in thebaseline regressions. Key to significance levels: + p < 0.10, * p < 0.05, ** p < 0.01, *** p < 0.001.
tables (such as Table 2). Focussing on transitions into self-employment that last for up to
three consecutive years further reduces the number of cases in our data set. Since matching
also discards observations that are o↵-support, i.e. individuals that are very di↵erent in terms
of matching covariates are not compared with each other in order to avoid “comparing apples
with oranges”, we have to rely on a comparatively smaller number of cases. Yet matching
creates a better comparable treatment and control group and thus despite a smaller sample
yields significant results. Discarding the “evil twins” in favor of finding the “perfect twin”
(Almus and Czarnitzki, 2003, p. 231) for each observation thus increases the explanatory
power of our estimates.
In our interpretation we focus on the propensity score matching results subset: we can
see that in the case of “opportunity self-employment”, both work and life satisfaction of the
self-employed are significantly higher than that of their employed counterparts. While the
e↵ect for work satisfaction is 0.44⇤⇤⇤ in lag t+ 1 and increases to 0.49⇤⇤⇤ in year t+ 3 (both
highly significant), the e↵ect is less pronounced but also increasing for life satisfaction (from
0.13+ in year t + 1 to 0.31⇤⇤ in year t + 3). If one does pursue self-employment from the
security of one’s previous job and leaves employment for self-employment, there seems to be
14
positive returns to work and life satisfaction for the self-employed. As self-employment is
unlikely to result in higher incomes of the self-employed (except for a few exceptional cases,
see Hamilton, 2000), this increased satisfaction must be due to other work related factors of
self-employment, most likely the autonomy that is a↵orded by being one’s own boss (Deci
and Ryan, 2000; Feldman and Bolino, 2000; Benz and Frey, 2008a).
The necessity case is markedly di↵erent: both life satisfaction and work satisfaction show
no significant change for the treatment as opposed to the control group. In the case of work
satisfaction, coe�cients are positive and insignificant (the exception is a positive coe�cient
in lag t + 2). In the case of life satisfaction, coe�cients are negative and insignificant. We
interpret this as evidence consistent with the hypothesis that pursuing self-employment to
escape unemployment has no benefits in terms of work and life satisfaction for the newly self-
employed. This interpretation is consistent with the data, where the autonomy of necessity
self-employed individuals is lower (t-test highly significant) than that of opportunity cases.
Comparatively more individuals are in the lower categories of the autonomy variable that is
present in the data set. From the point of view of self-determination theory, these results
are not surprising, since being forced into self-employment is not an autonomous decision,
and it can be conjectured that the necessity self-employed thus experience their new life (and
lifestyle) as something they cannot strongly identify with. Our results are rendered more
surprising given findings in the literature that happy individuals are more likely to pursue
necessity self-employment (Krause, 2012). Such reverse causality should actually inflate the
impact of necessity self-employment on subjective well-being.
From a policy point of view, being self-employed as opposed to being unemployed might
certainly be preferable (in terms of individuals earning their own income). Our findings for
the necessity case should not be understood to discourage self-employment as an alternative
to being on welfare. However, this type of self-employment cannot be expected to be as
beneficial for the self-employed as is the case for “opportunity self-employment”.
We can compare our results also to the results for the British case (see Binder and Coad,
2013a) and have to conclude that both analyses yield similar estimates: in the British case
as well, transitioning from employment to self-employment yields positive life satisfaction
changes (.17⇤⇤ to .23⇤ for the nearest-neighbour-matching estimator and .11⇤ to .20⇤ for the
15

life satisfaction job satisfactionE to SE vs. E to E E to SE vs. E to E1 lag 0.241** 62,998 0.525*** 62,447SE 0.079 0.105z-stat 3.06 5.022 lags 0.176+ 49,737 0.410** 49,286SE 0.101 0.125z-stat 1.74 3.283 lags 0.330** 39,327 0.459** 39,156SE 0.117 0.150z-stat 2.81 3.05UE to SE vs. UE to E1 lag -0.096 1,912 0.052 1,882SE 0.145 0.197z-stat -0.67 0.272 lags -0.373+ 1,067 0.188 1,058SE 0.197 0.239z-stat -1.90 0.783 lags -0.107 728 0.140 719SE 0.231 0.304z-stat -0.46 0.46
Table 4: Matching estimates. We use nearest-neighbour-matching (NNM, Abadie et al., 2004) and reportSample Average Treatment E↵ects (SATEs) with z-statistics. Dependent variables are same as in the baselineregressions. Key to significance levels: + p < 0.10, * p < 0.05, ** p < 0.01, *** p < 0.001. 4 matches areselected for each treatment observation.
propensity score matching estimator; only two years studied; no work satisfaction results).9
We should be careful in attributing higher impact for the German case since life satisfaction
in the British sample was measured on a 7-point Likert scale. Similarly, no gains in life sat-
isfaction were found in the UK for the transition out of unemployment into self-employment.
This comparison provides evidence that the British findings were not something culturally
limited to the UK but might apply more broadly in Europe as well.
3.3. Results: other life domains
It is instructive to see whether transitioning into self-employment will impact on subjective
well-being more broadly. To that matter and to explore further whether going into self-
employment does have broader e↵ects beside the ones on an individual’s work satisfaction,
we look into other life domains and the individual’s satisfaction with them after becoming
self-employed. In Table 5, we show results similar to the analysis for work and life satisfaction
(we match on the same covariates and with the same matching algorithms), but have di↵erent
9Note that matching estimates refer to total e↵ects on subjective well-being while regression coe�cientsare ceteris paribus e↵ect sizes, holding all other variables of interest constant (Oakes and Kaufman, 2006,p. 382). They should not be directly compared with each other, thus, and comparison of our results withother studies using multivariate regression is not straightforward.
16

domain satisfactions as our dependent variables. The upper half of the table shows the results
for the opportunity case while the lower half shows the necessity case. Our results here are
quite striking in showing that self-employment has a quite contained impact only on few life
domains. The most important results pertain to satisfaction with health and spare time.
No matter what type of self-employment analyzed, the self-employed are significantly less
satisfied with their spare time. The negative influence of lack of leisure time is increasing over
time and even stronger for those, who are self-employed out of necessity. Here our analysis
confirms previous studies that find that the self-employed find themselves in a situation that
puts high demand on their time and leads to lack of leisure time (Hyytinen and Ruuskanen,
2007). Our findings here complement the literature by showing that this lack of leisure time
does translate into dissatisfaction (at least in this specific domain; for a European data set,
the self-employed also reported low satisfaction with their working hours, see Blanchflower,
2004, p. 48).10 While one could conjecture that lack of leisure time is something only fully
committed opportunity cases would exhibit, we clearly see a similar pattern for the necessity
case. Even if forced self-employment has no benefit on work and life satisfaction, the self-
employed clearly experience the negative impact of lower spare time satisfaction. Since the
necessity self-employed arguably did not choose their self-employment fully voluntarily, it is
even harder for them to deal with the time demands of their new career path, increasing
dissatisfaction with amount of time outside their job. These findings can be related to a
study of Dutch entrepreneurs whose satisfaction with leisure time was negatively associated
with firm performance and positively with the motivation to combine work- and life-balance
(Carree and Verheul, 2012, p. 381). Care needs to be exercised in comparing both sets of
results, since the Dutch analysis is cross-sectional and it only asks what influences leisure
satisfaction of entrepreneurs (no control group). It thus may be that the negative impact of
self-employment on satisfaction with spare time found in our study might be mitigated for
those self-employed who pursue self-employment to get a more favourable work-/life balance
and be better able to organize their workload to cope with multiple responsibilities (cf. ibid.).
10The opposite pattern was found for unemployment, where the unemployed exhibited higher satisfactionwith their amount of leisure time in a British sample (Powdthavee, 2012).
17

Employmentto
Self-employmentcase
:psm
matchin
g,nn
matchin
g;di↵
ere
ntwell-b
ein
gdomain
s
t+1
t+2
t+3
transitions
Domain
PSM
:b
set-stat
obs
PSM
:b
set-stat
obs
PSM
:b
set-stat
obs
t+1
t+1
t+2
t+2
t+3
t+3
NN:b
sez-sta
tobs
NN:b
sez-sta
tobs
NN:b
sez-sta
tobs
health
sat.
0.3737⇤⇤⇤
0.0858
4.3566
61493
0.3806⇤⇤⇤
0.1127
3.3760
48311
0.5122⇤⇤⇤
0.1381
3.7093
37073
605
73737
383
58253
265
46481
0.4244⇤⇤⇤
0.0959
4.4266
62887
0.3796⇤⇤
0.1244
3.0508
49646
0.5682⇤⇤⇤
0.1497
3.7956
39258
hh
incomesa
t.0.1172
0.1039
1.1284
61031
0.0741
0.1264
0.5859
47746
0.0926
0.1468
0.6309
36942
602
73276
381
57927
264
46240
0.1680
0.1062
1.5816
62521
0.0938
0.1299
0.7218
49371
0.1610
0.1529
1.0530
39047
spare
timesa
t.-0
.5696⇤⇤⇤
0.1090
-5.2259
61230
-0.6770⇤⇤⇤
0.1330
-5.0912
47523
-0.8726⇤⇤⇤
0.1691
-5.1602
37134
606
73676
382
58209
264
46451
-0.5812⇤⇤⇤
0.1157
-5.0249
62835
-0.6871⇤⇤⇤
0.1428
-4.8114
49615
-0.9106⇤⇤⇤
0.1777
-5.1254
39229
st.oflivin
gsa
t.0.1264
0.0982
1.2880
39717
-0.0342
0.1309
-0.2612
28908
-0.1268
0.1732
-0.7321
18922
606
73738
383
58261
265
46495
0.0680
0.1028
0.6615
42288
0.0013
0.1383
0.0093
31454
0.1571
0.1740
0.9026
23005
domicilesa
t.-0
.0961
0.0889
-1.0811
61034
-0.0677
0.1009
-0.6708
47329
-0.1718
0.1346
-1.2766
37154
603
73673
383
58212
264
46453
0.0022
0.0967
0.0223
62833
0.0360
0.1107
0.3250
49613
-0.0078
0.1409
-0.0553
39231
role
inhh
sat.
-0.1886
0.1194
-1.5794
41287
-0.1533
0.1572
-0.9754
31373
-0.2232
0.1792
-1.2455
25624
372
49601
230
39380
171
31622
-0.1215
0.1351
-0.8990
42668
0.0401
0.1738
0.2307
33898
-0.1112
0.1973
-0.5634
26927
family
sat.
-0.1797
0.1988
-0.9038
14043
-0.6697⇤
0.3394
-1.9732
6433
-0.3390
0.4037
-0.8397
1890
606
73610
381
58123
266
46349
0.0750
0.2136
0.3513
15314
-0.8724⇤
0.3919
-2.2263
8907
-0.8325
0.5173
-1.6093
3892
Unemploymentto
Self-employmentcase
:psm
matchin
g,nn
matchin
g;di↵
ere
ntwell-b
ein
gdomain
s
t+1
t+2
t+3
transitions
Domain
PSM
:b
set-stat
obs
PSM
:b
set-stat
obs
PSM
:b
set-stat
obs
t+1
t+1
t+2
t+2
t+3
t+3
NN:b
sez-sta
tobs
NN:b
sez-sta
tobs
NN:b
sez-sta
tobs
health
sat.
0.0783
0.1586
0.4938
1826
0.0848
0.2213
0.3831
881
0.0306
0.2779
0.1102
556
605
73737
383
58253
265
46481
0.1069
0.1732
0.6172
1909
0.1339
0.2338
0.5728
1064
0.2200
0.2918
0.7539
725
hh
incomesa
t.-0
.1850
0.1843
-1.0039
1801
-0.5287⇤
0.2468
-2.1426
891
-0.3701
0.2932
-1.2622
565
602
73276
381
57927
264
46240
-0.4266⇤
0.1960
-2.1770
1898
-0.8924⇤⇤⇤
0.2522
-3.5378
1057
-0.3935
0.2982
-1.3197
716
spare
timesa
t.-0
.5878⇤⇤
0.1963
-2.9951
1833
-0.8968⇤⇤⇤
0.2684
-3.3412
887
-1.3175⇤⇤⇤
0.3493
-3.7717
561
606
73676
382
58209
264
46451
-0.6884⇤⇤
0.2131
-3.2301
1908
-0.9738⇤⇤⇤
0.2776
-3.5082
1061
-1.4876⇤⇤⇤
0.3699
-4.0211
725
st.oflivin
gsa
t.-0
.1552
0.1674
-0.9270
1266
-0.3745
0.2632
-1.4229
475
-0.7136
0.3868
-1.8448
174
606
73738
383
58261
265
46495
-0.1937
0.1873
-1.0338
1367
-0.3708
0.2687
-1.3797
679
-0.4764
0.3661
-1.3012
402
domicilesa
t.-0
.0199
0.1708
-0.1165
1804
-0.1564
0.2255
-0.6936
824
-0.1476
0.2488
-0.5933
548
603
73673
383
58212
264
46453
-0.0257
0.1884
-0.1364
1898
-0.0767
0.2426
-0.3160
1060
0.0356
0.2768
0.1287
723
role
inhh
sat.
-0.1317
0.2009
-0.6557
1167
-0.2752
0.2652
-1.0379
609
-0.7924⇤
0.3696
-2.1438
408
372
49601
230
39380
171
31622
-0.3257
0.2238
-1.4552
1344
-0.0715
0.2783
-0.2570
734
-1.3187⇤⇤⇤
0.3606
-3.6570
513
family
sat.
too
few
obse
rvations
Tab
le5:
Matchingestimates
fordi↵erentdom
ain
satisfactions.
Upper
halfoftable
refers
to“opportunityself-employment”
whilelower
halfrefers
to“n
ecessity
self-employment”.Weuse
propensity
score
matching(P
SM,LeuvenandSianesi,2003)
andreport
AverageTreatm
ente↵
ects
forthe
Treated
(ATTs)
witht-statistics.For
nearest-neighbour-matching(N
NM,Abadie
etal.,2004)
wereport
Sample
AverageTreatm
entE↵ects
(SATEs)
withz-statistics.Key
tosign
ificance
levels:+
p<
0.10,*p<
0.05,**p<
0.01,***p<
0.001.4matches
are
selected
foreach
treatm
entobservation
intheNNM
case.Right-mostpartof
thetable
listsnumbersofobservationstransitioninginto
self-employmentfollow
edbynumber
ofcontrolcases
foreach
timelagan
ddom
ainsatisfaction
.
18

A second finding of note pertains to health satisfaction, which is positively impacted
by going into opportunity self-employment (but not going into necessity self-employment).
While one can conjecture that both types of self-employment have positive autonomy as their
result compared to the typical employment situation, there seems to be more associated with
the voluntary self-employment case, in that it seems beneficial not only for an individual’s
mental health (subjective well-being) but also for the individual’s self-rated satisfaction with
overall health. If the voluntary entrepreneurial pursuit thus also positively impacts on the self-
employed’s health, this would constitute another benefit of entrepreneurship beyond possible
material gain.
We have to be careful in interpreting positive health satisfaction as positive health, how-
ever. A study on Swedish self-employed did similarly find that the self-employed report
themselves under less mental strain, while at the same time exhibiting more mental health
problems such as tiredness (Andersson, 2008). An alternative explanation for this find-
ing might thus lie in systematic personality di↵erences between individuals who voluntarily
pursue self-employment as opposed to those who do so involuntarily. If this is the case,
satisfaction with health and life might be driven by this personality and not be a result of
opportunity employment per se. It could be conjectured, for example, that more extravert
individuals are more confident and thus more likely to pursue self-employment and would
simultaneously rate themselves more positively in terms of health and well-being. This alter-
native explanation, while prima facie plausible, would be di�cult to reconcile with the fact
that satisfaction in other domains of life of the self-employed does not exhibit a systemat-
ically higher score for the opportunity self-employed. Further research might explore these
findings in the health domain (preferably measured via objective indicators).
Our results are consistent with other research on life domains:11 the high importance
of health, job and leisure time (in that order of importance) was also found in an analysis
of the overall contribution of life domains to life satisfaction (van Praag et al., 2003). In
extension of these results, we can, however, see a marked asymmetry between opportunity
11Our results cannot confirm the finding that self-employment creates work-home-conflict, e.g. by decreasingfamily satisfaction (this was found by Parasuraman and Simmers, 2001): while the coe�cient for familysatisfaction is negative in our sample as well, in most cases it is not statistically significant.
19

and necessity self-employment over the di↵erent life domains analyzed: while the opportunity
self-employed profit in work and health domains and su↵er from lack of spare time (which
could explain the moderate net gain in overall life satisfaction), the necessity self-employed
profit from their self-employment in none of the life domains yet su↵er from all the drawbacks
(of negative spare time satisfaction).
3.4. Results: robustness tests
Given that autonomy is likely to be an important driver for our results, it makes sense to
unpack this relationship further. We have thus analyzed for our sample whether the autonomy
of one’s occupation as well as the company size and industry type one works in have an impact
on work and life satisfaction. In order to analyze this further, the SOEP data set provides
information on the autonomy of an individual’s type of work via a variable that distinguishes
autonomy levels inter alia based on task descriptions, vocational training, responsibilities and
company size for civil servants, workers and employees and the self-employed. It distinguishes
five regular autonomy levels plus the lowest level of apprenticeship (encompassing also interns
and trainees). Low autonomy levels are related to manual workers, whereas manager and
freelance academics are in the highest autonomy level group. Self-employed individuals are
categorized into autonomy levels 3 to 5 depending on the number of employees they have.
Figure 1: Box plot of life satisfaction by 1-digit industry type.
Company size for employed and self-employed individuals is available in our data set and
20
o↵ers a coarse division into the size categories of less than 20 core employees (our control
category), 20 to 200, 200 to 2000 and more than 2000 employees. There is also the category
of being self-employed with no other employees. The SOEP further contains 1 digit industry
codes for individuals that are working, ranging from Agriculture to the Service industry (the
latter of which we use as base category).
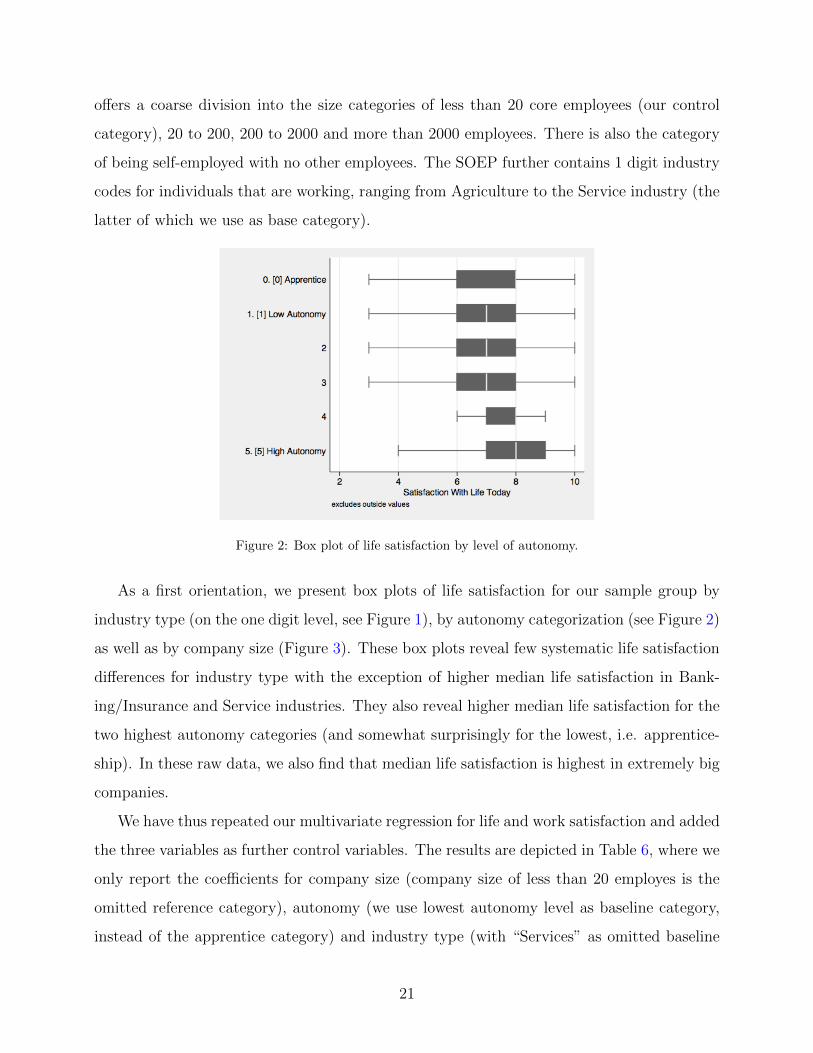
Figure 2: Box plot of life satisfaction by level of autonomy.
As a first orientation, we present box plots of life satisfaction for our sample group by
industry type (on the one digit level, see Figure 1), by autonomy categorization (see Figure 2)
as well as by company size (Figure 3). These box plots reveal few systematic life satisfaction
di↵erences for industry type with the exception of higher median life satisfaction in Bank-
ing/Insurance and Service industries. They also reveal higher median life satisfaction for the
two highest autonomy categories (and somewhat surprisingly for the lowest, i.e. apprentice-
ship). In these raw data, we also find that median life satisfaction is highest in extremely big
companies.
We have thus repeated our multivariate regression for life and work satisfaction and added
the three variables as further control variables. The results are depicted in Table 6, where we
only report the coe�cients for company size (company size of less than 20 employes is the
omitted reference category), autonomy (we use lowest autonomy level as baseline category,
instead of the apprentice category) and industry type (with “Services” as omitted baseline
21

Figure 3: Box plot of life satisfaction by company size.
category). For industry types, we find no e↵ect on life satisfaction and only few industries
relate negatively to work satisfaction (as compared to the control group of Services), namely
manufacturing, construction and trade. With the other two variables, we find clear associa-
tions for both work and life satisfaction. Higher autonomy is beneficial for both work and life
satisfaction, increasing with autonomy level. Interestingly, compared to the low autonomy
level reference category, we find a positive impact of apprenticeship for life satisfaction. With
company size, we find positive coe�cients also for both life and work satisfaction for medium
and large companies. These findings are surprising as a reverse relationship is usually found
in the literature (e.g., Benz and Frey, 2008a; Idson, 1990): it is typically argued that smaller
companies o↵er better working conditions and more autonomy to their employees than larger
companies, thus leading to higher work satisfaction for employees in smaller firms. Why this
is not the case here warrants further research (the e↵ect is not driven by the self-employed
but persists when redoing the regressions only for employed individuals).
Finally, note that life satisfaction is negatively impacted for those individuals who are self-
employed with no coworkers, maybe because these also represent necessity self-employment.
Alternatively, a driver of well-being for the self-employed (beside autonomy) is being in charge
of a company. The latter has been already observed in the literature (Blanchflower, 2004,
pp. 55-57) and might also account for the heterogeneous results regarding the life satisfaction
22
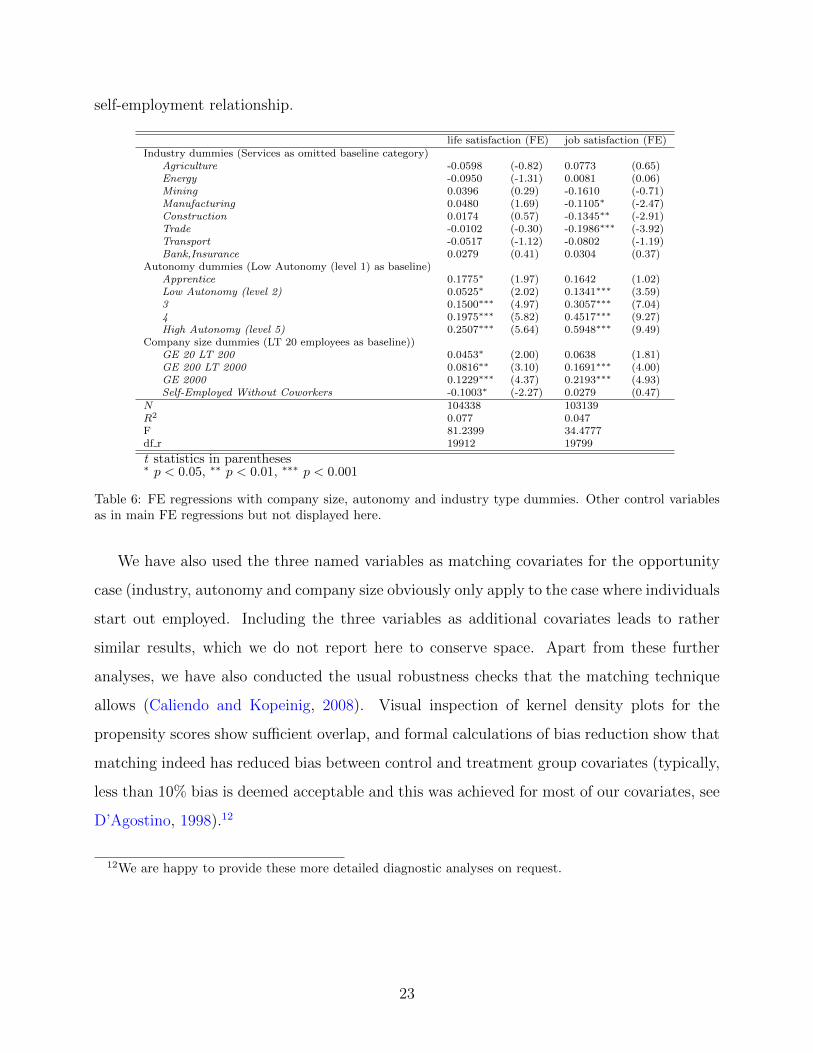
self-employment relationship.
life satisfaction (FE) job satisfaction (FE)Industry dummies (Services as omitted baseline category)
Agriculture -0.0598 (-0.82) 0.0773 (0.65)Energy -0.0950 (-1.31) 0.0081 (0.06)Mining 0.0396 (0.29) -0.1610 (-0.71)Manufacturing 0.0480 (1.69) -0.1105⇤ (-2.47)Construction 0.0174 (0.57) -0.1345⇤⇤ (-2.91)Trade -0.0102 (-0.30) -0.1986⇤⇤⇤ (-3.92)Transport -0.0517 (-1.12) -0.0802 (-1.19)Bank,Insurance 0.0279 (0.41) 0.0304 (0.37)
Autonomy dummies (Low Autonomy (level 1) as baseline)Apprentice 0.1775⇤ (1.97) 0.1642 (1.02)Low Autonomy (level 2) 0.0525⇤ (2.02) 0.1341⇤⇤⇤ (3.59)3 0.1500⇤⇤⇤ (4.97) 0.3057⇤⇤⇤ (7.04)4 0.1975⇤⇤⇤ (5.82) 0.4517⇤⇤⇤ (9.27)High Autonomy (level 5) 0.2507⇤⇤⇤ (5.64) 0.5948⇤⇤⇤ (9.49)
Company size dummies (LT 20 employees as baseline))GE 20 LT 200 0.0453⇤ (2.00) 0.0638 (1.81)GE 200 LT 2000 0.0816⇤⇤ (3.10) 0.1691⇤⇤⇤ (4.00)GE 2000 0.1229⇤⇤⇤ (4.37) 0.2193⇤⇤⇤ (4.93)Self-Employed Without Coworkers -0.1003⇤ (-2.27) 0.0279 (0.47)
N 104338 103139R2 0.077 0.047F 81.2399 34.4777df r 19912 19799
t statistics in parentheses⇤ p < 0.05, ⇤⇤ p < 0.01, ⇤⇤⇤ p < 0.001
Table 6: FE regressions with company size, autonomy and industry type dummies. Other control variablesas in main FE regressions but not displayed here.
We have also used the three named variables as matching covariates for the opportunity
case (industry, autonomy and company size obviously only apply to the case where individuals
start out employed. Including the three variables as additional covariates leads to rather
similar results, which we do not report here to conserve space. Apart from these further
analyses, we have also conducted the usual robustness checks that the matching technique
allows (Caliendo and Kopeinig, 2008). Visual inspection of kernel density plots for the
propensity scores show su�cient overlap, and formal calculations of bias reduction show that
matching indeed has reduced bias between control and treatment group covariates (typically,
less than 10% bias is deemed acceptable and this was achieved for most of our covariates, see
D’Agostino, 1998).12
12We are happy to provide these more detailed diagnostic analyses on request.
23

4. Conclusion
Becoming self-employed is a transformative life event that has an impact on the well-
being of the self-employed. While it is well-known in the entrepreneurship literature that
self-employment positively influences job satisfaction, the e↵ects on overall life satisfaction
as well as on satisfaction in di↵erent life domains have been less clear. Our study contributed
to a better understanding of the welfare e↵ects of self-employment apart from its monetary
aspects.
For our German sample, we have found that voluntary (“opportunity”) self-employment
brings with it positive benefits apart from work satisfaction, and leads to higher overall
life satisfaction as well as increased health satisfaction, all of which increase in the first
three years of self-employment. Being forced into (“necessity”) self-employment to escape
unemployment, however, confers no such benefits. Even more so, necessity self-employment
leads to increasing dissatisfaction with one’s leisure time, an e↵ect that also pertains to a
lesser degree to the opportunity self-employed. Our study thus confirms findings for Great
Britain (Binder and Coad, 2013a) and in some parts also confirms results for a study of the
same German sample (the discrepancies in results here might be due to di↵erent measurement
methodologies and warrant further research; compare Benz and Frey, 2008a).
Overall, it seems that self-employment only enhances the well-being of the self-employed if
it is chosen voluntarily and thus satisfies an individual’s need for autonomy (Deci and Ryan,
2000). This is not to say that self-employment cannot be a valid alternative to unemployment
and thus be promoted by policy-makers. In these cases, however, where unemployed are
prodded and coaxed into (necessity) self-employment, we should not expect that they are
happier with this than a comparison group of regular employees.
ca. 6,000 words; Date: April 16, 2014
Appendix
24

LifeSatisfaction
Work
Satisfaction
demployed
dse
lfemployed
dunemployed
log(income)
ddisabled
gender
age
subj.
health
LifeSatisfaction
1.0000
Work
Satisfaction
0.4552⇤⇤⇤
1.0000
(0.0000)
demployed
0.0565⇤⇤⇤
0.0629⇤⇤⇤
1.0000
(0.0000)
(0.0000)
dse
lfemployed
0.0139⇤⇤⇤
0.0461⇤⇤⇤
-0.1638⇤⇤⇤
1.0000
(0.0000)
(0.0000)
(0.0000)
dunemployed
-0.1360⇤⇤⇤
-0.2353⇤⇤⇤
-0.3310⇤⇤⇤
-0.0969⇤⇤⇤
1.0000
(0.0000)
(0.0000)
(0.0000)
(0.0000)
log(income)
0.2146⇤⇤⇤
0.1362⇤⇤⇤
0.1835⇤⇤⇤
0.1883⇤⇤⇤
-0.1745⇤⇤⇤
1.0000
(0.0000)
(0.0000)
(0.0000)
(0.0000)
(0.0000)
ddisabled
-0.1561⇤⇤⇤
-0.0792⇤⇤⇤
-0.1395⇤⇤⇤
-0.0529⇤⇤⇤
0.1416⇤⇤⇤
-0.0591⇤⇤⇤
1.0000
(0.0000)
(0.0000)
(0.0000)
(0.0000)
(0.0000)
(0.0000)
gender
0.0022
-0.0100⇤⇤⇤
-0.2779⇤⇤⇤
-0.1094⇤⇤⇤
0.1042⇤⇤⇤
-0.0659⇤⇤⇤
-0.0413⇤⇤⇤
1.0000
(0.2600)
(0.0001)
(0.0000)
(0.0000)
(0.0000)
(0.0000)
(0.0000)
age
-0.0576⇤⇤⇤
-0.0556⇤⇤⇤
-0.2539⇤⇤⇤
-0.0156⇤⇤⇤
0.0705⇤⇤⇤
-0.0060⇤⇤
0.2761⇤⇤⇤
0.0157⇤⇤⇤
1.0000
(0.0000)
(0.0000)
(0.0000)
(0.0000)
(0.0000)
(0.0019)
(0.0000)
(0.0000)
subj.
health
0.4247⇤⇤⇤
0.3000⇤⇤⇤
0.1566⇤⇤⇤
0.0510⇤⇤⇤
-0.1370⇤⇤⇤
0.1349⇤⇤⇤
-0.3613⇤⇤⇤
-0.0470⇤⇤⇤
-0.4091⇤⇤⇤
1.0000
(0.0000)
(0.0000)
(0.0000)
(0.0000)
(0.0000)
(0.0000)
(0.0000)
(0.0000)
(0.0000)
Obse
rvations
270094
P-values
inparentheses
⇤p<
0.05,⇤⇤
p<
0.01,
⇤⇤⇤p<
0.001
Table
7:Contemporaneouscorrelations.
25

References
Abadie, A., Drukker, D., Herr, J. L., and Imbens, G. W. (2004). Implementing matchingestimators for average treatment e↵ects in stata. The Stata Journal, 4(3):290–311.
Aguinis, H., and Edwards J. R., (2014). Methodological Wishes for the Next Decade andHow to Make Wishes Come True. Journal of Management Studies, 51(1):143–174.
Ajayi-obe O. and Parker, S.C. (2005). The Changing Nature of Work among the Self-Employed in the 1990s: Evidence from Britain. Journal of Labor Research, XXVI(3):501–517.
Almus, M. and Czarnitzki, D. (2003). The e↵ects of public R&D subsidies on firms’ innovationactivities: The case of Eastern Germany. Journal of Business and Economic Statistics,21(2):226–236.
Andersson, P. (2008). Happiness and health: Well-being among the self-employed. Journalof Socio-Economics, 37(1):213 – 236.
Benz, M. and Frey, B. S. (2008a). Being independent is a great thing: Subjective evaluationsof self-employment and hierarchy. Economica, 75:362–383.
Benz, M. and Frey, B. S. (2008b). The value of doing what you like: Evidence from the self-employed in 23 countries. Journal of Economic Behavior & Organization, 68(3–4):445–455.
Bianchi, M. (2012). Financial development, entrepreneurship, and job satisfaction. Reviewof Economics and Statistics, 94(1):273–286.
Binder, M. and Coad, A. (2013a). Life satisfaction and self-employment: A matching ap-proach. Small Business Economics, 40(4):1009–1033.
Binder, M. and Coad, A. (2013b). Subjective well-being and unemployment: A quantiletreatment approach. Mimeo.
Blanchflower, D. G. (2000). Self-employment in OECD countries. Labour Economics,7(5):471–505.
Blanchflower, D. G. (2004). Self-employment: More may not be better. Swedish EconomicPolicy Review, 11:15–73.
Blanchflower, D. G., Oswald, A., and Stutzer, A. (2001). Latent entrepreneurship acrossnations. European Economic Review, 45(4–6):680–691.
Blanchflower, D. G. and Oswald, A. J. (1998). What makes an entrepreneur? Journal ofLabor Economics, 16(1):26–60.
Block, J. and Koellinger, P. (2009). I can’t get no satisfaction - necessity entrepreneurshipand procedural utility. Kyklos, 62(2):191–209.
Bockerman, P. and Ilmakunnas, P. (2009). Unemployment and self-assessed health: Evidencefrom panel data. Health Economics, 18:161–179.
26

Caliendo, M. and Kopeinig, S. (2008). Some practical guidance for the implementation ofpropensity score matching. Journal of Economic Surveys, 22(1):31–72.
Caliendo, M. and Kritikos, A. (2011). Searching for the entrepreneurial personality: Newevidence and avenues for further research. Mimeo.
Carree, M. A. and Verheul, I. (2012). What makes entrepreneurs happy? determinants ofsatisfaction among founders. Journal of Happiness Studies, 13(2):371–387.
Carter, N. M., Gartner, W. B., Shaver, K. G., and Gatewood, E. J. (2003). The careerreasons of nascent entrepreneurs. Journal of Business Venturing, 18(1):13–39.
Carter, S. (2011). The rewards of entrepreneurship: Exploring the incomes, wealth andeconomic well-being of entrepreneurial households. Entrepreneurship Theory and Practice,35(1):39–55.
Clark, A., Colombier N., and Masclet D. (2008). Never the same after the first time: thesatisfaction of the second-generation self-employed. International Journal of Manpower,29(7):591–609.
Cooper, A. C. and Artz, K. W. (1995). Determinants of satisfaction for entrepreneurs.Journal of Business Venturing, 10:439–457.
Craig, J. B., Schaper, M., and Dibrell, C. (2007). Life in small business in australia: Evidencefrom the hilda survey. Mimeo.
D’Agostino, R. B. (1998). Propensity score methods for bias reduction in the comparison ofa treatment to a non-randomized control group. Statistics in Medicine, 17(19):2265–2281.
D’Ambrosio, C. and Frick, J. R. (2007). Individual well-being in a dynamic per-spective. IZA Discussion Paper No. 2618; SOEP Paper No. 5. Available at SSRN:http://ssrn.com/abstract=969617.
Deci, E. L. and Ryan, R. M. (2000). The ”what” and ”why” of goal pursuits: Human needsand the self-determination of behavior. Psychological Inquiry, 11(4):227–268.
Diener, E. and Lucas, R. E. (1999). Personality and subjective well-being. In Kahnemanet al. (1999), chapter 11, pages 213–229.
Diener, E., Suh, E., Lucas, R. E., and Smith, H. L. (1999). Subjective well-being: Threedecades of progress. Psychological Bulletin, 125(2):276–302.
Dolan, P., Peasgood, T., and White, M. (2008). Do we really know what makes us happy?A review of the economic literature on the factors associated with subjective well-being.Journal of Economic Psychology, 29:94–122.
Evanschitzky, H., Baumgarth, C., Hubbard, R., and Armstrong J.S., (2007). Replicationresearch’s disturbing trend. Journal of Business Research 60:411–415.
27

Feldman, D. and Bolino, M. (2000). Career patterns of the self-employed: career motivationsand career outcomes. Journal of Small Business Management, 38(3):53–68.
Fernandez-Dols, J.-M. and Ruiz-Belda, M.-A. (1995). Are smiles a sign of happiness?: Goldmedal winners at the Olympic games. Journal of Personality and Social Psychology,69(6):1113–1119.
Ferrer-i-Carbonell, A. and Frijters, P. (2004). How important is methodology for the estimatesof the determinants of happiness? The Economic Journal, 114:641–659.
Frey, B. S. and Stutzer, A. (2002). What can economists learn from happiness research?Journal of Economic Literature, 40(2):402–435.
Frey, B. S. and Stutzer, A. (2005). Beyond outcomes: Measuring procedural utility. OxfordEconomic Papers, 57:90–111.
Fuchs-Schundeln, N. (2009). On preferences for being self-employed. Journal of EconomicBehavior & Organization, 71(2):162–171.
Graham, C. (2009). Happiness around the world. Oxford University Press, Oxford/NewYork.
Haisken-DeNew, J. and Frick, J. R. (2005). DTC - Desktop Companion to the GermanSocio-Economic Panel (SOEP). Version 8.0 - Dec 2005, Berlin.
Hamilton, B. H. (2000). Does entrepreneurship pay? an empirical analysis of the returns ofself-employment. Journal of Political Economy, 108(3):604–631.
Harbi, S. E. and Grolleau, G. (2012). Does self-employment contribute to national happiness?The Journal of Socio-Economics, 41(5):670–676.
Headey, B., Mu↵els, R., and Wooden, M. (2004). Money doesn’t buy happiness ... or doesit? A reconsideration based on the combined e↵ects of wealth, income and consumption.Melbourne Institute Working Paper No.15/04.
Helliwell, J. F. and Wang, S. (2012). The state of world happiness. In Helliwell, J., Layard,R., and Sachs, J., editors, World Happiness Report, chapter 2. The Earth Institute.
Henrekson, M. and Johansson, D. (2010). Gazelles as job creators: a survey and interpretationof the evidence. Small Business Economics, 35:227–244.
Hundley, G. (2001). Why and when are the self-employed more satisfied with their work?Industrial Relations: A Journal of Economy and Society, 40(2):293–316.
Hyytinen, A. and Ruuskanen, O. (2007). Time use of the self-employed. Kyklos, 60(1):105–122.
Ichino, A., Mealli, F., and Nannicini, T. (2008). From temporary help jobs to permanentemployment: What can we learn from matching estimators and their sensitivity? Journalof Applied Econometrics, 23(3):305–327.
28
Idson, T. L. (1990). Establishment size, job satisfaction and the structure of work. AppliedEconomics, 22(8):1007–1018.
Imbens, G. W. (2004). Nonparametric estimation of average treatment e↵ects under exo-geneity: A review. The Review of Economics and Statistics, 86(1):4–29.
Kahneman, D., Diener, E., and Schwarz, N., editors (1999). Well-Being: The Foundationsof Hedonic Psychology. Russell Sage Foundation, New York.
Kawaguchi, D. (2008). Self-employment rents: Evidence from job satisfaction scores. Hitot-subashi Journal of Economics, 49(1):35–45.
Krause, A. (2012). Don’t worry, be happy? happiness and reemployment. Mimeo.
Krueger, A. B. and Schkade, D. (2008). The reliability of subjective well-being measures.Journal of Public Economics, 92:1833–1845.
Layard, R., Clark, A. E., and Senik, C. (2012). The causes of happiness and misery. InHelliwell, J., Layard, R., and Sachs, J., editors, World Happiness Report, chapter 3, pages58–90. The Earth Institute.
Layard, R., Mayraz, G., and Nickell, S. (2008). The marginal utility of income. Journal ofPublic Economics, 92:1846–1857.
Layard, R., Mayraz, G., and Nickell, S. (2010). Does relative income matter? Are the criticsright? In Diener, E., Helliwell, J. F., and Kahneman, D., editors, International Di↵erencesin Well-Being. Oxford University Press, New York.
Lechner, M. (2009). Long-run labour market and health e↵ects of individual sports activities.Journal of Health Economics, 28(4):839–854.
Leuven, E. and Sianesi, B. (2003). Psmatch2: Stata module to perform full mahalanobis andpropensity score matching, common support graphing, and covariate imbalance testing.http://ideas.repec.org/c/boc/bocode/s432001.html.
McAdams, K., Lucas, R., and Donnellan, M. (2012). The role of domain satisfaction inexplaining the paradoxical association between life satisfaction and age. Social IndicatorsResearch, 109(2):295–303.
Millan, J., Hessels, J., Thurik, R., and Aguado, R. (2013). Determinants of job satisfaction:a european comparison of self-employed and paid employees. Small Business Economics,40(3):651–670.
Noorderhaven, N., Thurik, R., Wennekers, S., and Stel, A. v. (2004). The role of dissatis-faction and per capita income in explaining self-employment across 15 european countries.Entrepreneurship Theory and Practice, 28(5):447–466.
Oakes, J. M. and Kaufman, J. S. (2006). Propensity score matching for social epidemiology.In Oakes, J. M. and Kaufman, J. S., editors, Methods in Social Epidemiology, chapter 15,pages 364–386. Jossey-Bass/Wiley, San Francisco.
29

Parasuraman, S. and Simmers C. A. (2001). Type of employment, work-family conflict andwell-being: a comparative study. Journal of Organizational Behavior, 22:551–568.
Powdthavee, N. (2012). Jobless, friendless and broke: What happens to di↵erent areas of lifebefore and after unemployment? Economica, 79(315):557–575.
Praag, M. C. v. and Versloot, P. H. (2007). What is the value of entrepreneurship? a reviewof recent research. Small Business Economics, 29:351–382.
Reynolds, P., Bosma, N., Autio, E., Hunt, S., De Bono, N., Servais, I., Lopez-Garcia, P., andChin, N. (2005). Global entrepreneurship monitor: data collection design and implemen-tation 1998-2003. Small Business Economics, 24(3):205–231.
Sandvik, E., Diener, E., and Seidlitz, L. (1993). Subjective well-being: The convergence andstability of self-report and non-self-report measures. Journal of Personality, 61(3):317–342.
Santarelli, E. and Vivarelli, M. (2007). Entrepreneurship and the process of firms’ entry,survival and growth. Industrial and Corporate Change, 16(3):455–488.
Sarasvathy, S. D. (2004). The questions we ask and the questions we care about: refor-mulating some problems in entrepreneurship research. Journal of Business Venturing,19:707–717.
Schieman, S., Whitestone, Y. K., and Van Gundy, K. (2006). The Nature of Work and theStress of Higher Status. Journal of Health and Social Behavior, 47:242–257.
Schjoedt, L. and Shaver, K. G. (2007). Deciding on an entrepreneurial career: A test ofthe pull and push hypotheses using the panel study of entrepreneurial dynamics data.Entrepreneurship Theory and Practice, 31(5):733–752.
Schwarz, N. and Strack, F. (1999). Reports of subjective well-being: Judgmental processesand their methodological implications. In Kahneman et al. (1999), chapter 4, pages 61–84.
Stevenson, B. and Wolfers, J. (2008). Economic growth and subjective well-being: Reassess-ing the Easterlin paradox. Brookings Papers on Economic Activity, Spring 2008:1–87.
Storey, D. J. (1994). Understanding the Small Business Sector. Routledge, London.
van Praag, B., Frijters, P., and i Carbonell, A. F. (2003). The anatomy of subjective well-being. Journal of Economic Behavior & Organization, 51(1):29–49.
Wagner, G. G., Frick, J. R., and Schupp, J. (2007). The German Socio-Economic PanelStudy (SOEP) - Scope, Evolution and Enhancements. Schmollers Jahrbuch, 1:139–169.
30

SPRU.Science.Policy.Research.Unit.University$of$Sussex$
Falmer,$Brighton,$BN1$9SL,$UK$
www.sussex.ac.uk/spru$
Recent.papers.in.the.SPRU.Working.Paper.Series:.$
SWPS$2014006.$Andy$S'rling.$April$2014.$“From$Sustainability$to$Transforma'on:$Dynamics$and$diversity$in$
reflexive$governance$of$vulnerability.”$
SWPS$2014007.$Ralitsa$Petrova$Hiteva$$and$Tomas$Maltby.$April$2014.$“Standing$in$the$way$by$standing$in$the$
middle:$the$case$of$state0owned$natural$gas$intermediaries$in$Bulgaria.”$
SWPS$2014008.$Sabine$Hielscher$and$Adrian$Smith.$May$2014.$“Community0based$digital$fabrica'on$
workshops:$A$review$of$the$research$literature.”$$
SWPS$2014009.$José$García0Quevedo,$Gabriele$Pellegrino$and$Maria$Savona.$May$2014.$“Reviving$demand0pull$
perspec'ves:$The$effect$of$demand$uncertainty$and$stagnancy$on$R&D$strategy.”$
SWPS$2014010.$Daniele$Rotolo,$Ismael$Rafols,$Michael$Hopkins,$and$Loet$Leydesdorff.$June$2014.$
“Scientometric$Mapping$as$a$Strategic$Intelligence$Tool$for$the$Governance$of$Emerging$Technologies.”$
SWPS$2014011.$Andy$S'rling$and$Josie$Coburn.$June$2014.$“Mul'criteria$Mapping$Manual$Version$1.0.”$
SWPS$2014012.$Anabel$Marin,$Lilia$Stubrin$and$Patrick$van$Zwanenberg.$June$2014.$“Developing$capabili'es$in$
the$seed$industry:$which$direc'on$to$follow?.”$
SWPS$2014013:$Mariana$Mazzucato,$Carlota$Perez.$July$2014.$“Innova'on$as$Growth$Policy:$the$challenge$for$
Europe.”$
SWPS$2014014:$Daniele$Rotolo$,$Loet$Leydesdorff.$July$2014.$“Matching$MEDLINE/PubMed$Data$with$Web$of$
Science$(WoS):$A$Rou'ne$in$R$language.”$
SWPS$2014015:$Patrick$van$Zwanenberg,$Erik$Millstone.$August$2014.$“Taste$and$power:$The$flavouring$
industry$and$flavour$addi've$regula'on.”$
SWPS$2014016:$Steve$Sorrell.$August$2014.$“Energy$Subs'tu'on,$Technical$Change$and$Rebound$Effects.”$
![TLE ANALYSER · TLE ANALYSER User Manual v2.8 TLE analysis ... TLE ANALYSER Version 2.8 - 2013 TLE ANALYSER - User Manual [4] 2. TLE Analyser Setup and Options TLE Updater allow to](https://img.pdfslide.net/doc/110x75/5aa68a5c7f8b9a517d8ea13c/tle-analyser-analyser-user-manual-v28-tle-analysis-tle-analyser-version-28.jpg)