Embed Size (px)
Citation preview

Workings of T OWNSHIPR ESIDENTIALP ROPERTYM ARKETS
A research project sponsored by the F inM ark Trust , Ford Foundat ion,
Micro F inance Regulatory Counci l / USAID, South Afr ican Nat ional Treasury and the Nat ional Hous ing F inance Corporat ion.
Phase Three: Findings, Conclusions & Implications
Cape Town Metro Findings
June 2004
Shisaka Development Management Services (Pty) Ltd
4th Floor, JHI House, Cnr. Cradock Ave. & Baker Str., RosebankTel. 011 447 6388; Fax. 011 447 8504

Workings of Township Property Markets: Phase 3: Cape Town Metro Findings
This research project into the
Workings of Township Residential Property Markets was undertaken by
Shisaka Development Management Services (Pty) Ltd.
Authors of this ReportMatthew Nell, Ros Gordon & Andreas Bertoldi
ContributorsJolene Adams, Gemey Abrahams, Dr. Penelope Hawkins, Maurice Makathini,
Kgaogelo Mamabolo, Ishmael Mkhabela, Nana Ndlovu, Dr. Steven Robins and
Rudolph Willemse.
Service ProvidersProgressus Research & Development (Reathe Taljaard, Dirk Taljaard &
Gaph Phatedi)
Hlakanaphila Analytics (Dr. Rod Alence)
M & M Consultants (Merle Werbeloff)
AdministrationKendel Nordin & Lindie Thompson
Acknowledgements
FundersThe FinMark Trust, Ford Foundation, Micro Finance Regulatory Council / USAID,
South African National Treasury and the National Housing Finance Corporation.
CoordinatorKecia Rust
A special thank you to the TRPM Advisory Committee members for their
time and guidance.
Thank you also, to all the focus group, interview and survey respondents,
as well as officials and councillors in the four metropolitan areas.

Workings of Township Property Markets: Phase 3: Cape Town Metro Findings
Other Reports
The following reports prepared as part of this research programme, are available:
Phase One: General Research:
1. General Research Overview Report, October 2003
2. Economic Dimensions Report, October 2003
3. Socio-Cultural Dimensions Report, October 2003
4. Sub-Market Scoping Analysis Report, October 2003
5. Land Markets Overview Report, October 2003
6. Legal Aspects Report, October 2003
7. Macro Trend Analysis Report, October 2003
8. Fieldwork Proposals, October 2003
Phase Two: Detailed Research
9. Detailed Research Overview Report, May 2004
10. Contextual Review Report, May 2004
11. Cadastral Review Report, May 2004
12. Social Survey Data Report, May 2004
Phase Three: Findings, Conclusions & Implications
13. Final Report: Findings, Conclusions & Implications, June 2004 This Report
14. FinMark Trust, TRPM Research Overview, June 2004 (PowerPoint Presentation)
15. TRPM Findings, Conclusions & Implications, June 2004 (PowerPoint Presentation)
16. TRPM Findings – eThekwini Metropolitan Area, June 2004
17. TRPM Findings – Cape Town Metropolitan Area, June 2004
18. TRPM Findings – Johannesburg & Ekurhuleni Metropolitan Areas, August 2004
The above reports and presentations are available from
http://www.finmarktrust.org.za/themes_and_projects/themes_and_projects.asp

Workings of Township Property Markets: Phase 3: Cape Town Metro Findings
Shisaka Development Management Services (Pty) Ltd. Page i
Contents
1. Introduction ..........................................................................................................1
2. Overview of Sites Surveyed in Cape Town.......................................................1
2.1. Overview of the Sites Selected....................................................................................................3
2.2. Summary of the Contextual Analysis ..........................................................................................4
2.3. Summary of the Cadastral Analysis ............................................................................................6
3. Findings – Cape Town Metropolitan Area.........................................................9
3.1. Informal Sub-Market.....................................................................................................................9
3.2. Site & Service Sub-Market.........................................................................................................10
3.3. RDP Sub-Market ........................................................................................................................11
3.4. Old Township Stock Sub-Market ...............................................................................................12
3.5. Private Sector Sub-market.........................................................................................................13
4. Conclusions........................................................................................................14
5. Annexure A: Data Tables ..................................................................................16
5.1. Informal Sub-Market...................................................................................................................16
5.2. Site and Service Sub-Market .....................................................................................................21
5.3. RDP Sub-Market ........................................................................................................................26
5.4. Old Township Stock Sub-Market ...............................................................................................30
5.5. Privately Developed Sub-Market ...............................................................................................34
List of Tables
Table 1: Summary of Sub-Markets within South African Townships ............................................................1
Table 2: Research Sites...................................................................................................................................2
Table 3: Historical Background & Current Status ...........................................................................................3
Table 4: Comparative Analysis of the Survey Sites by Key Characteristics.................................................5
Table 5: Current Township Establishment Status ..........................................................................................6
Table 6: Total Secondary Registrations (Broad Definition) over 5 Years by Proclaimed Township ...........7
Table 7: Household Demographics & Economic Characteristics in Informal Settlements .........................16
Table 8: Housing Characteristics in Informal Settlements ...........................................................................17
Table 9: Housing Perceptions in Informal Settlements ................................................................................18
Table 10: Household Demographics & Other Factors in Site & Services Areas ........................................21
Table 11: Housing Characteristics in Site & Services Areas .......................................................................22
Table 12: Housing Perceptions in Site & Services Areas ............................................................................23
Table 13: Household Demographics & Other Factors in RDP Areas..........................................................26
Table 14: Housing Characteristics in RDP Areas.........................................................................................27
Table 15: Housing Perceptions in RDP Areas..............................................................................................28
Table 16: Household Demographics in Old Township Stock Areas ............................................................30
Table 17: Housing Characteristics in Old Township Stock Areas ...............................................................31
Table 18: Housing Perceptions in Old Township Stock Areas ....................................................................32
Table 19: Household Demographics in Private Sector Areas .....................................................................34
Table 20: Housing Characteristics in Private Sector Areas .........................................................................35
Table 21: Housing Perceptions in Private Sector Areas ..............................................................................36

Workings of Township Property Markets: Phase 3: Cape Town Metro Findings
Shisaka Development Management Services (Pty) Ltd. Page 1
1. Introduction
The FinMark Trust, together with the Micro Finance Regulatory Council /
USAID, the Ford Foundation, the National Housing Finance Corporation and
South African National Treasury has commissioned research into the workings
of township residential property markets1 with an overall emphasis on the
secondary market
The research comprised the collection of both primary and secondary data from four
Metropolitan areas namely Johannesburg, Ekurhuleni (East Rand), eThekwini
(Durban) and Cape Town.
This report outlines findings of particular relevance to the Cape Town Metropolitan
area. The overall findings, conclusions and implications of the research are detailed
in a separate report entitled Final Report: Findings, Conclusions and
Implications. This report includes:
� Overview of sites surveyed in the Cape Town Metropolitan area;
� Findings in terms of the Cape Town Metropolitan area;
� Conclusions.
2. Overview of Sites Surveyed in Cape Town
The research was undertaken in 18 research sites in 4 metropolitan areas. The
research sites were selected so as to provide insight into six sub markets.
Of the 18 research sites 6 were selected from the Cape Town Metropolitan area.
Table 1 below provides details of the six sub markets and Table 2 the survey sites
selected. This section provides an overview of each of the sites in the Cape Town
Metropolitan area and the findings in respect of these sites in terms of the Contextual
and Cadastral surveys.
Table 1: Summary of Sub-Markets within South African Townships
Sub-Market Definition
Old township stock A formal housing unit including freestanding houses, row and semi-detachedhouses and flats. The stock was provided by Government (national, provincial or local) between 1948 and 1960, so as to provide rental housing to Africans.
The most common form of house provided in respect of African Townships was a four-roomed house typically known as a 51/6 or 51/9 (provided with an internal toilet). From 1991 the Government has undertaken a programme to transfer this stock into private ownership. The stock is generally old and in
poor condition.
Private housing
stock - middle & upper income
Formal housing developed by the private sector. The type of housing typically
comprises a formal freestanding housing unit developed by a private sector developer who sells the unit to a buyer on some form of long term leasehold (99 years) or freehold title. Development commenced in the first half of the 1980’s after the promulgation of 99 year leasehold.
1 The research focused on Black Townships which were townships originally designed for occupation
by African South Africans only.

Workings of Township Property Markets: Phase 3: Cape Town Metro Findings
Shisaka Development Management Services (Pty) Ltd. Page 2
Sub-Market Definition
RDP housing stock RDP stock comprises housing stock built as part of the national housing subsidy programme since 1994. The stock comprises either a formalfreestanding housing unit provided on an ownership basis, a flat, cluster or free standing house provided for rental or a site with funding for the
development of a dwelling.
Site and service stock
Site and service stock is provided as part of a project whereby households areprovided with a site and services and are required to develop the top structure
incrementally on their own.
Informal stock Informal stock comprises informal dwellings erected by the occupants using non conventional building materials. Structures are erected on the land without
permission of the owner
Table 2: Research Sites
No Area Township Extension/Suburb Housing Sub-Market type
1 Johannesburg Soweto Protea North Private Sector – Middle Income
2 Johannesburg Soweto Diepkloof Ext. 1 & 2 Private Sector – Upper Income
3 Johannesburg Soweto Dube Old Township stock
4 Johannesburg Soweto Kliptown Informal Settlement
5 East Rand Katlehong Phooko Ext. 1 & 2 Old Township stock
6 East Rand Tsakane Ext. 11 and 15 RDP housing
7 Johannesburg Grassmere Fine Town Site & Service
8 Durban Lamontville Lamontville Old Township stock
9 Durban Inanda GlebePrivate Sector – Middle Income
10 Durban Newlands West Westriche & Riverdene RDP
11 Durban Ntuzuma C Section (Lindelani) Informal Settlement
12 Durban Umlazi E Thokoza Site & Service
13 Cape Town Langa Bhunga (Harlem) Old Township Stock
14 Cape Town Khayelitsha Elita Park Private Sector – Middle
Income
15 Cape Town Langa Settlersway Phase 1 Private Sector – Upper Income
16 Cape Town Delft Delft South RDP
17 Cape Town Khayelitsha Mewway Road Informal Settlement
18 Cape Town Khayelitsha Site B, Q Area Site & Service
Workings of Township Property Markets: Phase 3: Cape Town Metro Findings
Shisaka Development Management Services (Pty) Ltd. Page 3
2.1. Overview of the Sites Selected
A brief historical background and current status of each of the sites selected in the
Cape Town Metropolitan area is detailed in Table 3 below.
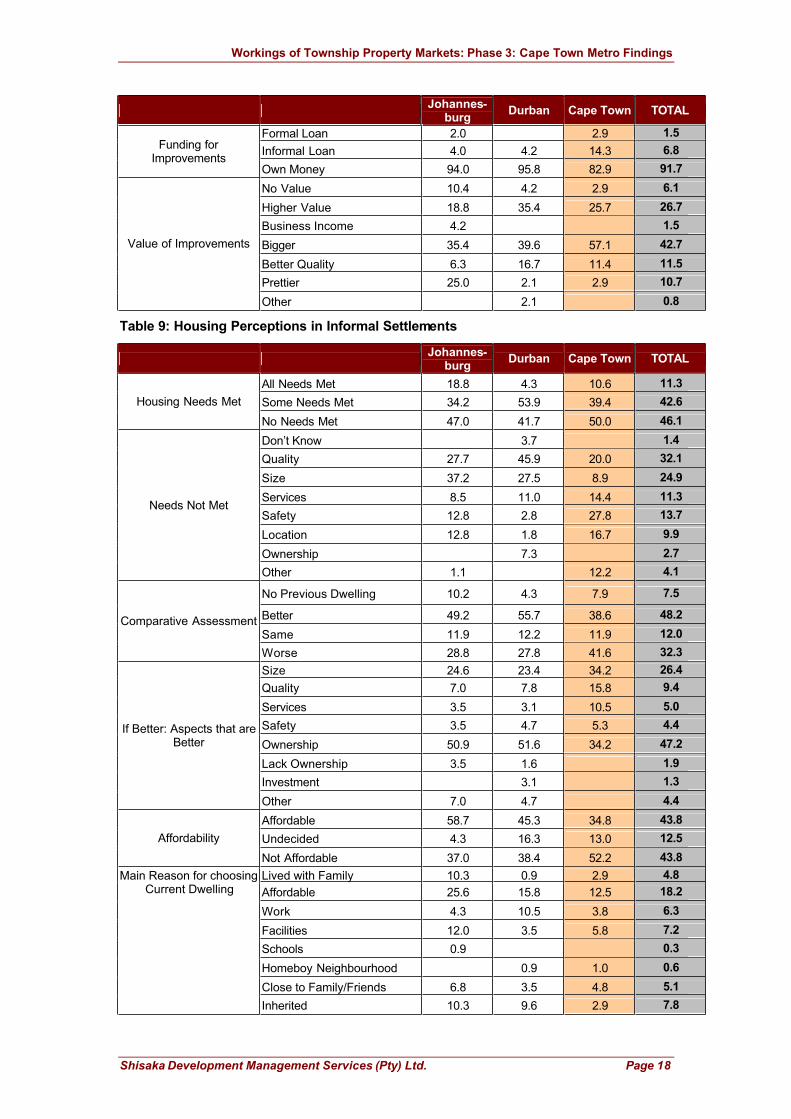
Table 3: Historical Background & Current Status
Name Extension/Suburb Type Historical Background & Current Status
Bhunga (Harlem) Old Township Stock
Langa
Settlersway Phase 1
Private Sector
– Upper Income
Langa was established in 1927. It was designed to be a model location for Africans. In terms of Act 40 of 1902, amended in 1905, all Africans
living in urban areas of Cape Town werecompelled to move to Langa. Housing wasprovided for both single men and households. Single quarters were built to house
approximately 13,000 men, as well asapproximately 550 houses.
Mewway Road Informal
Settlement
Site B, Q Area Site & Service
Khayelitsha
Elita Park Private Sector
– Middle Income
Khayelitsha was established in 1983 by the
apartheid government. The inhabitants of the existing African Townships in Cape Town (Langa, Nyanga, Gugulethu, Crossroads and KTC) were intended to move there. It was intended to house 200,000 people over a period of 15 years but soon increased to 400,000
people in hostels and informal structures. To encourage the voluntary migration of Africans to Khayelitsha from the established townships all building and development in these areas were stopped.
Delft Delft South RDP
Delft was established between 1987 and 1995. The households living there were relocated there from other locations in Cape Town. As a result of
this the area lacks social cohesion and a sense of community. The community has beenengaged in continuous battles with the City of Cape Town regarding the quality of their houses.A number of houses were built with asbestos.

Workings of Township Property Markets: Phase 3: Cape Town Metro Findings
Shisaka Development Management Services (Pty) Ltd. Page 4
2.2. Summary of the Contextual Analysis
Table 4 provides a summary of the contextual analysis undertaken in respect of all of
the 18 Survey sites.
On the basis of the table the following is evident in respect of the sites located in the
Cape Town metropolitan area:
� Informal Settlement sub-market: Conditions in the Mewway Road informal
settlement (Khayelitsha) are extremely poor and while similar to informal
settlements in other metropolitan areas, it displays slightly better conditions than
those in Durban.
� Site and Service Sub-Market: Conditions in the Site B, Q Area scheme
(Khayelitsha) are good in respect of roads, streetlights and engineering services.
Location and facilities are fair. Open space is poor. There are high levels of
backyard dwellings and significant investment and consolidation occurring. The
area displays slightly better conditions than Site & Service schemes in other
metropolitan areas.
� RDP Sub-Market: Conditions appear to be good in respect of the provision of
services in the Delft South RDP area. Access to facilities and location is fair.
Housing quality is very poor. The area has a significantly higher number of
backyard dwellings that the other RDP areas. Investment levels are very poor.
The area displays similar conditions to those found in RDP housing areas in other
metropolitan areas.
� Old Township Stock: Conditions are good in respect of the provision of
services, access to facilities and location in Bhunga (Langa). Housing quality is
fair, with little maintenance having been undertaken by many residents.
Investment levels are high. There are few backyard dwellings. The area displays
slightly better characteristics to other Old Township housing sub-markets in the
other metropolitan areas.
� Privately Developed: Elita Park (Khayelitsha) displays worse conditions in
respect of access to facilities and locational amenity than other areas. Conditions
appear to be good in both Elita Park and Settlersway (Langa) in respect of the
provision of services. There are no backyard dwellings. There are high levels of
investment in Settlersway and significantly lower in Elita Park. The condition of
the houses appears to be good.

Wo
rkin
gs o
f T
ow
nsh
ip P
rop
ert
y M
ark
ets
: P
hase 3
: C
ap
eT
ow
n M
etr
o F
ind
ing
s
Sh
isa
ka
Develo
pm
en
tM
an
ag
em
en
tS
erv
ice
s(P
ty)
Ltd
. P
ag
e 5
Tab
le4:
Co
mp
ara
tive A
naly
sis
of
the S
urv
ey S
ites b
y K
ey C
hara
cte
risti
cs
Info
rmal S
ett
lem
en
tS
ite
an
d S
erv
ice
RD
PO
ld T
ow
nsh
ip S
tock
Pri
va
tely
De
ve
lop
ed
Na
me
Ntu
zum
a
C S
ectio
n
Me
ww
ay
Ro
ad
Klip
tow
nT
ho
ko
za
Site
B,
Q
Are
a
Fin
eto
wn
We
st-
rich
e &
R
iver-
de
ne
De
lft
So
uth
Tsa
ka
ne
Ext
11
&
15
Lam
ont-
vill
e
Bh
un
ga
(Ha
rle
m)
Du
be
Ph
oo
ko
Ext
1/2
Gle
be
Settle
rs-
way
Elit
a P
ark
Die
pklo
of
1/2
Pro
tea
No
rth
Are
aD
urb
an
(Ina
nd
a)
Cape
To
wn
(Kh
aye
-lit
sh
a)
Jhb
(Sow
eto
)
Du
rba
n
(Um
lazi E
)
Cape
To
wn
(Kh
aye
-lit
sh
a)
Jhb
(Gra
ss-
me
re)
Du
rba
n
(In
an
da
)
Cape
To
wn
(De
lft)
East
Rand
Du
rba
n
(Um
lazi)
Ca
pe
To
wn
(La
ng
a)
Jhb
(Sow
eto
)
East R
and
(Ka
tle
ho
ng
)
Du
rba
n
(In
an
da
)
Ca
pe
To
wn
(La
ng
a)
Ca
pe
To
wn
(Kh
aye
lits
ha)
Johannes
burg
(So
we
to)
Johannes
burg
(So
we
to)
No
of
erv
en
±1000
site
s2
10
0 s
ite
s±1
00
0site
s± 5
00
site
s2
56
6erv
en
± 8
00 s
ites
3010
erv
en
37
46
erv
en
21
20
&
17
00
erv
en
24
23
38
57
23
18
510
21
12
erv
en
±5
00
erv
en
36
65
erv
en
±5
00
erv
en
3094 e
rv
Es
tab
lis
he
d1
98
0’s
na
19
04
(Form
al)
Late
19
50
’s
na
Mid
19
80
’s1
99
51
99
6–
19
99
19
98
19
34
19
30
’s1
95
51
95
0’s
18
57
na
19
80
’s1
95
51
98
0’s
Lo
ca
tio
n�
��
��
��
��
��
��
��
��
�
Fa
cil
itie
s�
��
��
��
��
��
��
��
��
�
Ro
ad
s�
��
��
��
��
��
��
��
��
�
Str
ee
t li
gh
ts�
��
��
��
��
��
��
��
��
�
Ho
us
eq
ua
lity
��
��
��
��
��
��
��
��
��
Ba
ck
ya
rdd
we
llin
gs
Na
na
na
� (
< 2
0%
)�
(>
80
%)
� (
>8
0%
)�
(<
5%
)�
(>
50
%)
� (
< 5
%)
� (
>
20
%)
� (
< 2
0%
)�
(<
20
%)
� (
> 2
0%
)�
(0
%)
� (
0%
)�
(0
%)
� (
0%
)�
(0
%)
Inv
es
tme
nt
lev
els
��
��
(>
70
%)�
(>
80
%)
� (
>8
0%
)�
(>
80
%)
� (
< 5
%)
� (
30%
-4
0%
)�
(<
7
0%
)�
(>
70
%)�
(>
70
%)
� (
< 7
0%
)�
(>
80
%)�
(>
70
%)�
(<
50
%)
��
Wa
ter
��
��
(1
00
%)
� (
10
0%
)�
Up
gra
de
� (
10
0%
)�
(1
00
%)
� (
10
0%
)�
(100%
)�
(1
00
%)
� (
10
0%
)�
(1
00
%)
� 1
00%
� (
10
0%
)�
(1
00
%)�
(>
70
%)�
(1
00
%)
Se
we
rag
e�
� (
ch
em
./
co
m)
�
(chem
co
m)
� (
10
0%
)�
(1
00
%)
�
up
gra
de
� (
10
0%
)�
(1
00
%)
� (
10
0%
)�
(1
00
%)�
(1
00
%)
� (
10
0%
)�
(1
00
%)
� 1
00%
� (
10
0%
)�
(1
00
%)
� (
10
0%
)�
(1
00
%)
Ele
ctr
icit
y�
(p
art
ial)
�
(no
t cle
ar)
� (
ille
ga
l)�
(1
00
%)
� (
10
0%
)�
(1
00
%)
� (
10
0%
)�
(1
00
%)
� (
10
0%
)�
(1
00
%)�
(1
00
%)
� (
10
0%
)�
(1
00
%)
� 1
00%
� (
10
0%
)�
(1
00
%)
� (
10
0%
)�
100%
Op
en
sp
ace
��
��
��
��
��
��
��
��
� (
10
0%
)�
�-
Absent, v
ery
poor
or
a c
onsid
era
ble
pro
ble
m
�-
Lim
itations a
pplic
able
, either
positiv
e o
r negative
�-
Good/p
ositiv
e f
eatu
re
Perc
enta
ges indic
ate
level of
a p
art
icula
r fe
atu
re in r
espect
of
the n
um
ber
of
dw
elli
ngs

Workings of Township Property Markets: Phase 3: Cape Town Metro Findings
Shisaka Development Management Services (Pty) Ltd. Page 6
2.3. Summary of the Cadastral Analysis
Table 5 shows the current township establishment status of the survey sites in the
Cape Town municipal area.
Table 5: Current Township Establishment Status
Suburb Name Housing Sub-
Market
Establishment
Status
No. of
Sites2
No. of
ProclaimedErven
3
No. of
RegisterableErven
4
Basis of
Tenure
Bhunga(Harlem),Langa
Old Township Stock
Proclaimed & Township
Register Open
300 36995
na 99 Year Lease/Title
Deed
Elita Park,Khayelitsha
Private Sector – Middle Income
Proclaimed & Township
Register Open
3665 3665 3665 Title Deed
SettlerswayPhase 1, Langa
Private Sector – Upper Income
Proclaimed & Township
Register Open
500 3699 na Title Deed
MewwayRoad,Khayelitsha
InformalSettlement
Not proclaimed 2000 na na na
Site B, Q Area,Khayelitsha
Site & Service Proclaimed &
TownshipRegister Open
2566 2566 2566 Title Deed
Delft South,Delft
6 RDP
Proclaimed &Township
Register –delayed title
transfer
± 3000 5807 5313 Title Deed, transfers in
process
It should be noted that the registerable erven in Bhunga and Settlersway (Langa)
could not be determined as only a single deeds registry exists for the whole of Langa,
i.e. suburbs could not be disaggregated.
On the basis of the above table the following is evident:
� While a township register has been opened in the Delft South RDP area, there
have been some delays in transferring individual title (see footnote comment);.
� The Mewway Road informal settlement is not proclaimed.
The above is problematic in respect of the secondary residential property market as it
means that households do not own their properties and therefore cannot sell them.
This is in line with the other Metropolitan areas, which display similar characteristics.
2 This is the total estimated or known number of erven in the survey site.
3 Data Source: Surveyor Generals Office, unless indicated otherwise. This reflects proclaimed non-
agricultural / farm erven only. These may or may not be registerable depending on the township register status.4 Erven that exist in the deeds registry where title can be transferred.
5 Only a single deeds register exists for the whole of Langa indicating a total of 3699. A breakdown per
suburb is not available6
Revised following information received from Gerry Adlard (Caleb Consulting). Delft South comprises RDP Phases 1 & 2 (2061 erven – 1850 transfers to date) and Phases 3 & 4 (3746 erven –3463 transfers to date). Feedback following Cape Town presentation.

Workings of Township Property Markets: Phase 3: Cape Town Metro Findings
Shisaka Development Management Services (Pty) Ltd. Page 7
Table 6 reflects the total secondary registrations that have occurred over 5 years in
respect of the proclaimed townships in the Cape Town Municipal area. Due to the
fact that only a single deeds register exists for the whole of Langa, with a breakdown
per suburb not being available, the sub-markets in this area are not included.
Table 6: Total Secondary Registrations (Broad Definition) over 5 Years by Proclaimed
Township
Elita Park, KhayelitshaPrivately developed
Site B, Q Area, KhayelitshaSite & Service
Total No. of Proclaimed Erven 3665 2566
Total Registrations 769 302
Secondary Registrations 516 99
Secondary Registrations as % of
Total Erven (total for sub-market)
14,1%
(67.1%)
3.9%
(32,8%)
Type of Transactions
Estate Transactions 1.2% 1.0%
Properties in Possession 66.5% 57.6%
Other 32.4% 41.4%
Total 100% 100%
House Data
Median Erf Size (m2) 222 195
Median Purchase Price R5000 R 7,496
Mean Purchase Price R 29,671 R 28,435
Bond Registrations 191 28
Bond Erven as % of Total
Proclaimed. Erven
(Average for submarket)
5.2%
(7,1%)
1.1%
(1,2%)
Median Bond Value R 84,000 R 75,000
Mean Bond Value R 84,266 R 73,573
Median PIP Resale Price R 50,200 R 47,700
Mean PIP Resale Price R 44,792 R 51,658
Bond Holders
Commercial Banks 87% 96%
Specialist Finance Providers 4% 0%
Employers 8% 4%
Life Insurance Companies 1% 0%
Other 0% 0%
Total 100% 100%

Workings of Township Property Markets: Phase 3: Cape Town Metro Findings
Shisaka Development Management Services (Pty) Ltd. Page 8
On the basis of the above table the following is evident:
� The extent of the secondary market in both of the proclaimed areas is extremely
limited. In respect of both areas the extent of registrations is similar to the
average for the sub-markets in the survey.
� Of the transactions undertaken a significant number (67% in Elita Park and 58%
in Site B, Q Area, Khayelitsha) are as a result of properties in possession. In both
cases this is significantly higher than other areas in the study. This reflects a high
level of economic vulnerability in these markets.
� The extent of bond registrations is extremely low (5.2% in Elita Park and 1.1% in
Site B, Q Area, Khayelitsha). In the case of Site B, Q Area this is similar to the
average for the sub-market in terms of the survey sites in the study. In terms of
Elita Park this is slightly lower than the average for the sub-markets in the
sample.

Workings of Township Property Markets: Phase 3: Cape Town Metro Findings
Shisaka Development Management Services (Pty) Ltd. Page 9
3. Findings – Cape Town Metropolitan Area
This section sets out the findings from the Households Survey by Metropolitan area
for each sub-market.
The detailed data for each sub-market is provided in Annexure A and covers:
� Details on household demographics
� An overview of the housing characteristics
� The housing perceptions of the households
The key findings in respect of each sub-market are detailed below.
3.1. Informal Sub-Market
The areas surveyed in this sub-market included:
� Kliptown (Johannesburg)
� Ntuzuma C (Lindelani Informal) (Durban)
� Mewway Road (Cape Town)
Key findings in respect of Mewway Road (see Tables Table 7 to Table 9, Annexure
A) are as follows:
� The age of household heads is 37 years which is lower than those living in the
other metropolitan areas.
� Education levels are low with 66% of household heads having secondary
education or below. At the same time there are significantly more household
heads (43%) with a matric or higher in this area than other metropolitan areas.
� Approximately 50% of households heads are unemployed or informally
employed.
� One third (31%) are single parent families.
� Just under one third of households 28%) are multinodal where the head of
household and/or spouse live in a different place from the rest of the households.
The main place (62%) where the other part of the household lives is in the rural
areas. The main reason (41%) for the multinodal situation is that the grandmother
watches over the children. This is consistent with the other metropolitan areas.
� The mean duration of stay in the area is 8 years. This is lower than for the other
metropolitan areas.
� Approximately 54% of household heads have access to a bank. This is higher
than for the other metropolitan areas. The main form of account being either an
ATM (80%) or savings (66%)
� The mean number of rooms is 2.6.
� 3% have a backyard dwelling this is lower than for the other metropolitan areas
(5% Johannesburg and 11% in Durban). No households earn an income from
these backyard dwellings.

Workings of Township Property Markets: Phase 3: Cape Town Metro Findings
Shisaka Development Management Services (Pty) Ltd. Page 10
� 24% of households run a business from home this is higher than in the other
Metropolitan areas (19% in Johannesburg and 13% in Durban). Most households
(64%) used their own money to start the business and 32% obtained an informal
loan.
� 40% of households have extended the house and most (83%) used their own
money to do this.
� 39% of households felt that some of their housing needs are met and that their
current accommodation is better (39%). In respect of the latter this is lower than
for the other metropolitan areas.
� 64% of households chose the dwelling because it was the only one they could
find. The house was found through friends and family (34%) or through a
personal search (47%).
� Most households (97%) feel secure, the reason being that they own their
properties (56%).
� 74% of household heads felt that the community is close.
� 28% of households will never sell their properties. This is significantly lower than
for the other metropolitan areas (64% in Johannesburg and 85% in Durban).
3.2. Site & Service Sub-Market
The areas surveyed in this sub-market included:
� Finetown (Johannesburg)
� Site B Q Area (Cape Town)
� Thokoza Umlazi E (Durban)
Key findings in respect of Site B, Q Area (see Table 10 to Table 12, Annexure A) are
as follows:
� The age of household heads is 46 years, which is slightly higher to the other
metropolitan areas.
� Education levels are low with 84% of households having secondary education or
below.
� Approximately 54% of households heads are unemployed or informally
employed.
� 44% of households are nuclear (31%). This is higher than for the other
metropolitan areas.
� 14% of households are multinodal. This is significantly lower than the other
metropolitan areas. The main places where the other part of the household lives
is in the rural areas (58%). The main reason for the multinodal situation is that the
grandmother watches over the children (25%) and that the other home is the
family home (33%).
� The mean duration of stay in the area is 13 years. This is slightly higher than for
the other metropolitan areas.

Workings of Township Property Markets: Phase 3: Cape Town Metro Findings
Shisaka Development Management Services (Pty) Ltd. Page 11
� Approximately 48% of household heads have access to a bank. This is higher
than for the other metropolitan areas. The main form of account is either an ATM
(58%) or savings (63%)
� The mean number of rooms is 3.5. This is higher than for the other metropolitan
areas.
� 8% have a backyard dwelling. This is significantly lower than for the other
metropolitan areas. 17% of households earn an income from these backyard
dwellings this is lower than the other Metropolitan areas.
� 9% of households run a business from home. Households used either their own
money (43%) or an informal loan (43%) to start the business. This is slightly
different from other metropolitan areas where informal loans are less evident.
� 60% of households made improvements to their properties. This is higher than in
other metropolitan areas.
� 73% of households felt that some or all of their housing needs are met and that
their current accommodation is better (80%). There are higher levels of
satisfaction than in other metropolitan areas.
� 31% of households chose the dwelling because it affordable. This is slightly
different from the other metropolitan areas where the house was chosen because
it was the only one that could be found. The house was found through the waiting
list. This is also different than for the other metropolitan areas where the house
was found through friends and family or through a personal search.
� Most households (92%) feel secure, the reason being that they own their
properties (87%).
� 79% of household heads felt that the community is close.
� 83% of households will never sell their properties. This is similar to other
metropolitan areas.
3.3. RDP Sub-Market
The areas surveyed in this sub-market included:
� Tsakane (Johannesburg)
� Westrich & Riverdene (Durban)
� Delft South (Cape Town)
Key findings in respect of Delft South (see Table 13 to Table 15, Annexure A) are as
follows:
� The age of household heads is 40 years.
� Education levels are higher than for the site and service schemes and informal
settlements with 67% of households having secondary education or higher. This
is slightly lower than for the other metropolitan areas.
� Approximately 51% of household heads have informal or irregular employment or
are unemployed.

Workings of Township Property Markets: Phase 3: Cape Town Metro Findings
Shisaka Development Management Services (Pty) Ltd. Page 12
� 30% of households are one-parent families and 36% nuclear. In respect of the
latter this is higher than for the other metropolitan areas.
� 16% of households are multinodal. This is lower than for other metropolitan
areas. The main place where the other part of the household lives is in the same
city (66%). The main reason (28%) is that the grandmother can watch the
children.
� The mean duration of stay in the area is 7 years. This is higher than for the other
metropolitan areas.
� Approximately 46% of household heads have access to a bank with the main
form of account being either an ATM (91%) or savings (75%)
� The mean number of rooms is 1,8.
� 19% have a backyard dwelling. 29% of households earn an income from these
backyard dwellings. This is significantly higher than for the other metropolitan
areas.
� 13% of households run a business from home. 74% of households used their
own money to start the business.
� Just over half of households (58%) felt that some of their housing needs are met
and that their current accommodation is better (61%).
� 72% of households chose the dwelling because it was the only one they could
find. This is significantly higher than for the other metropolitan areas. The house
was generally found through the waiting list (75%).
� Most households (94%) feel secure, the reason being that they own their
properties (69%).
� 77% of household heads felt that the community is close.
� 83% of households will never sell their properties.
3.4. Old Township Stock Sub-Market
The areas surveyed in this sub-market included:
� Dube (Johannesburg)
� Lamontville (Durban)
� Langa-Bhunga / Harlem (Cape Town)
� Phooko (East Rand)
Key findings in respect of Langa- Bhunga (see Table 16 to Table 18, Annexure A)
are as follows:
� The age of household heads is 51 years.
� 74% of households have a secondary education or above.
� 31% of household heads are pensioners and 29% are formally employed.
� Just under half of households are single parent families (48%).

Workings of Township Property Markets: Phase 3: Cape Town Metro Findings
Shisaka Development Management Services (Pty) Ltd. Page 13
� 3% of households are multinodal. This is significantly lower than for the other
metropolitan areas. The main places where the other part of the household lives
is in the rural areas (33%) and this area (67%). The main reason (33%) for the
multinodal situation is that the grandmother watches over the children.
� The mean duration of stay in the area is 40 years.
� Approximately 46% of household heads have access to a bank with the main
form of account being either an ATM (95%) or savings (60%)
� The mean number of rooms is 3.3.
� 36% have a backyard dwelling. 81% of households earn no income from these
backyard dwellings.
� 7% of households run a business from home. This is lower than for the other
metropolitan areas. 83% of households used their own money and 17% an
informal loan to start the business.
� 68% of households felt that some or all of their housing needs are met.
� 55% of households inherited the house.
� Most households (97%) feel secure, the reason being that they own their
properties (75%).
� 68% of household heads felt that the community is close.
� 100% of households will never sell their properties.
3.5. Private Sector Sub-market
The areas surveyed in this sub-market included:
� Protea North (Johannesburg)
� Diepkloof (Johannesburg)
� Inanda Glebe (Durban)
� Elita Park (Cape Town)
� Settlersway (Cape Town)
Key findings in respect of Elita Park and Settlersway (see Table 19 to Table 21,
Annexure A) are as follows:
� The age of household heads is 43 years.
� 87% of households having secondary education or above.
� 70% of household heads are formally employed.
� 39% of households are nuclear families.
� 13% households are multi-nodal. The main places where the other part of the
household lives is in this city or another city.
� The mean duration of stay in the area is 18 years. This is higher than for the other
metropolitan areas.
� 93% of household heads have access to a bank with the main form of account
being either an ATM (79%) or savings (65%). 57% have access to a mortgage,

Workings of Township Property Markets: Phase 3: Cape Town Metro Findings
Shisaka Development Management Services (Pty) Ltd. Page 14
this is higher than in other metropolitan areas (55% Johannesburg and 8% in
Durban).
� The mean number of rooms is 4.8.
� 9% have a backyard dwelling. 62% of households earn no income from these
backyard dwellings. This is lower than in other metropolitan areas.
� 9% of households run a business from home. Most households (88%) used their
own money to start the business.
� 93% of households felt that all or some of their housing needs are met and that
their current accommodation is better (88%).
� 29% chose the dwelling because it was the only one they could find or because it
was affordable (38%). The house was found through an agent (71%). This is
significantly higher than for the other metropolitan areas.
� Most households (96%) feel secure, the reason being that they own their
properties (64%).
� 50% of household heads felt that the community is close. This is lower than for
the other metropolitan areas.
� 54% of households will never sell their properties. This is lower than for the other
metropolitan areas.
4. Conclusions
� Overall the sub-markets identified in the national study appear to be relevant to
the Cape Town Township markets.
� Conditions in respect of the Informal settlement, Site and Service, Old Township
Stock and Privately Developed sub-markets included in the study appears to be
slightly better than the other metropolitan areas. Conditions in the RDP sub-
market are similar to the other metropolitan areas.
� No township registers have been opened in the Delft South RDP area and the
Mewway Road informal settlement is not proclaimed. This is problematic in
respect of the secondary market.
� The extent of the secondary market in both of the proclaimed areas where there
was data (Elita Park and Site B, Q Area, Khayelitsha) is extremely limited. In
respect of both areas the extent of registrations is similar to the average for the
sub-markets in the survey.
� Of the transactions undertaken a significant number (67% in Elita Park and 58%
in Site B, Q Area, Khayelitsha) are as a result of properties in possession. In both
cases this is significantly higher than other areas in the study. This reflects a high
level of dysfunction in these markets.
� The extent of bond registrations is extremely low (5.2% in Elita Park and 1.1% in
Site B, Q Area, Khayelitsha). In the case of Site B, Q Area this is similar to the
average for the sub-market in terms of the survey sites in the study. In terms of
Elita Park this is slightly lower than the average for the sub-markets in the
sample.

Workings of Township Property Markets: Phase 3: Cape Town Metro Findings
Shisaka Development Management Services (Pty) Ltd. Page 15
� The social research indicates generally similar patters in the Cape Town sub-
markets to the national study. Some key variables where differences occurred are
as follows:
� The extent of multinodal families is lower (Site and service, RDP and Old
township stock)
� Access to bank facilities is higher in some sub-markets (Informal and Site and
service)
� There appears to be greater access to informal loans
� There appears to be a greater willingness to sell than in other metropolitan
areas (Informal, Site and service and Privately Developed)
On the basis of the above and the findings of the overall study implications for the
Cape Town Metropolitan Authority area as follows:
� A programme should be undertaken to improve access to primary title through:
� Formalizing informal settlements.
� Actively facilitating town planning and general plan approvals.
� Expediting the opening of township registers.
� Undertaking or fast tracking a transfer of housing programme so as to transfer
all publicly owned Old Township stock to their occupants.
� Improving the time frame within which valuations are undertaken and the
ease by which potential purchasers obtain municipal clearance certificates.
� A programme should be undertaken to support market development by:
� Improving market information so that potential buyers can easily obtain
information on properties for sale.
� Support the development of estate agents who operate in the sub-markets.
� Active investment in the areas should be undertaken through urban upgrade,
renewal and regeneration projects, so as to improve the investment grade quality
of the areas. This should be undertaken in a manner that mobilises private sector
investment.

Workings of Township Property Markets: Phase 3: Cape Town Metro Findings
Shisaka Development Management Services (Pty) Ltd. Page 16
5. Annexure A: Data Tables
5.1. Informal Sub-Market
Table 7: Household Demographics & Economic Characteristics in Informal Settlements
Johannes-
burgDurban Cape Town TOTAL
Age (Mean) 40.9 45.9 37.2 41.5
None 17.2 11.4 2.9 10.8
Primary 35.3 35.1 16.5 29.4
Secondary 37.9 39.5 46.6 41.1
Matric 9.5 11.4 27.2 15.6
Education
Tertiary -- 2.6 6.8 3.0
Formal/Regular 30.8 43.9 46.2 40.0
Informal/Irregular 29.9 26.3 29.8 28.7
Pensioner/Grant 7.7 16.7 3.8 9.6Employment
Unemployed 31.6 13.2 20.2 21.8
Nuclear 30.8 13.0 25.2 23.0
Single 17.9 19.1 23.3 20.0
One-parent Family 20.5 46.1 31.1 32.5
Extended 11.1 8.7 11.7 10.4
Household Type
Split Nuclear 19.7 13.0 8.7 14.0
Multinodal
Household
(Including all
household types)33.1 34.2 27.9 31.8
This Area 5.1 15.4 3.4 8.4
This City 5.1 17.9 17.2 13.1
Other City 23.1 23.1 17.2 21.5
Rural Area 59.0 43.6 62.1 54.2
Place of Multinodal
Household
Other Country 7.7 -- -- 2.8
Refusal -- 2.6 -- 0.9
Away - WORK 12.8 10.3 3.4 9.3
Better Schools 25.6 5.1 24.1 17.8
Family Home 2.6 7.7 10.3 6.5
No Space 2.6 12.8 6.9 7.5
Grandmother Watches Them 43.6 35.9 41.4 40.2
Divorced 2.6 2.6 -- 1.9
Reason for Multinodal Situation
Other 10.3 23.1 13.8 15.9
Duration of Stay (Years - Mean) 13.2 14.5 7.6 11.9
% Bank Access Banking 36.4 42.6 53.8 43.9
ATM 65.1 38.8 80.4 62.2
Savings Book 16.3 16.3 7.1 12.8
Post Office 23.3 2.0 3.6 8.8
Savings 48.8 67.3 66.1 61.5
Credit Card -- 2.0 -- 0.7
Fixed Deposit -- 4.1 -- 1.4
% Type of Account
Vehicle Finance 5.4 2.0
Workings of Township Property Markets: Phase 3: Cape Town Metro Findings
Shisaka Development Management Services (Pty) Ltd. Page 17
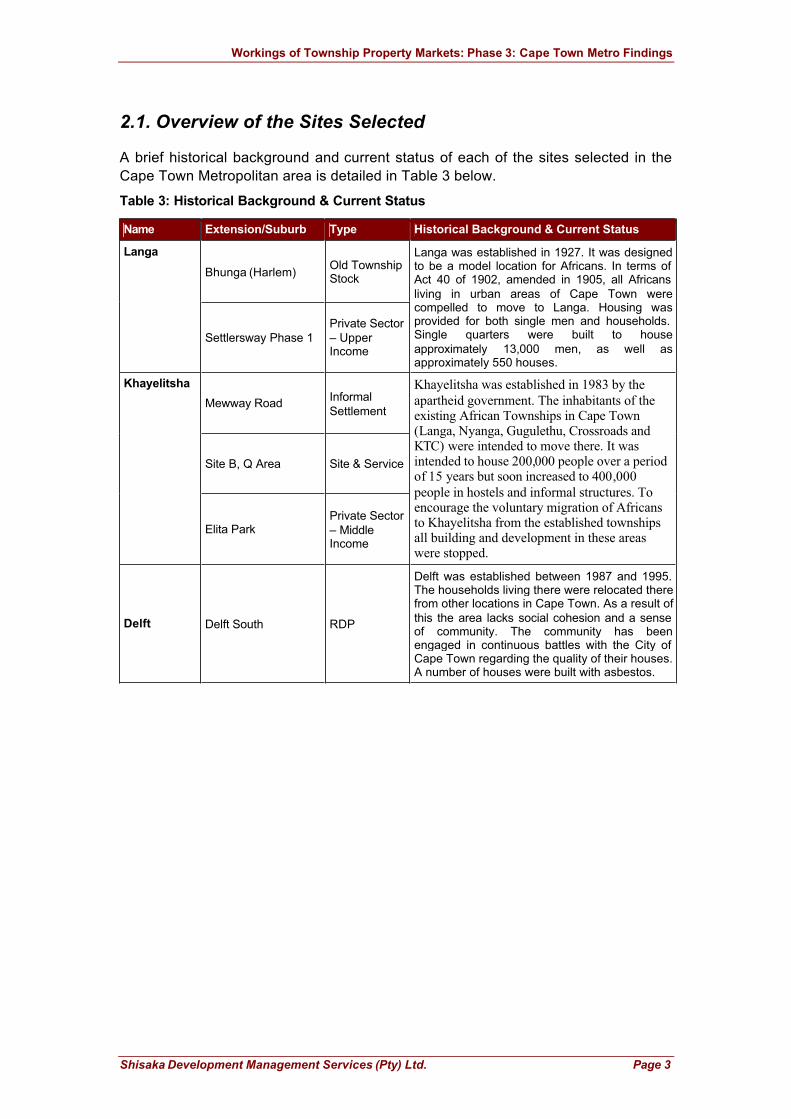
Table 8: Housing Characteristics in Informal Settlements
Johannes-burg
Durban Cape Town TOTAL
Number of Rooms (Mean) 1.6 3.3 2.6 2.5
Electricity 2.6 75.7 95.1 55.7
Paraffin 93.2 23.5 2.9 41.6Energy
Other 4.2 0.8 2.0 0.6
Tap water on Site 14.4 10.5 1.9 1.5
Communal Tap 85.6 80.9 98.1 87.8Water
Other 8.7 2.7
Flush on Site 0.8 0.9 17.3 6.0
Chemical Inside 0.8 0.3
Pit Inside 0.8 3.5 1.5
Bucket Inside 5.1 1.7 26.0 10.4
Flush in Yard 0.8 0.9 1.0 0.9
Chemical in Yard 27.0 9.2
Pit in Yard 1.7 64.3 22.6
Bucket in Yard 9.3 0.9 23.1 10.7
Communal Flush 13.5 4.2
Communal Pit 6.8 0.9 2.7
Communal Chemical 74.6 28.8 35.0
Toilet Facility
Other 4.8 1.5
Backyard Dwellings % with Backyard Dwellings 5.1 10.7 3.4 6.6
Number of Backyard
Units(Mean) 2.8 1.6 2.7 2.2
No Income 100.0 80.0 100.0 88.9Income from Backyard Dwellings Smaller Income 20.0 11.1
Related - ALL 66.7 70.0 100.0 73.7
Related - SOME 16.7 5.3
Not Related 16.7 20.0 15.8
Relation to Occupants of Backyard Dwellings
Empty 10.0 5.3
Business at Home Run Business from Home 19.1 13.2 24.3 18.7
Only Income 47.6 33.3 44.0 42.6
Biggest Income 4.8 33.3 12.0 14.8Income from Business at
HomeSmaller Income 47.6 33.3 44.0 42.6
Formal Loan 4.0 1.6
Informal Loan 33.3 13.3 32.0 27.9Source of Business
Funding
Own Money 66.7 86.7 64.0 70.5
Good Location 77.1 71.1 67.0 71.9
Undecided 6.8 7.9 19.4 11.0Location Perception
Poor Location 16.1 21.1 13.6 17.0
Made Improvements 42.4 41.7 40.4 41.5
Accessed Services 2.0 18.8 7.5
Extended House 54.0 47.9 82.9 59.4
Improved House 42.0 31.3 17.1 31.6
B/yard Rooms - Family 2.1 0.8
Improvements/What Improvements?
B/yard Rooms - Business 2.0 0.8
Workings of Township Property Markets: Phase 3: Cape Town Metro Findings
Shisaka Development Management Services (Pty) Ltd. Page 18
Johannes-burg
Durban Cape Town TOTAL
Formal Loan 2.0 2.9 1.5
Informal Loan 4.0 4.2 14.3 6.8Funding for Improvements
Own Money 94.0 95.8 82.9 91.7
No Value 10.4 4.2 2.9 6.1
Higher Value 18.8 35.4 25.7 26.7
Business Income 4.2 1.5
Bigger 35.4 39.6 57.1 42.7
Better Quality 6.3 16.7 11.4 11.5
Prettier 25.0 2.1 2.9 10.7
Value of Improvements
Other 2.1 0.8
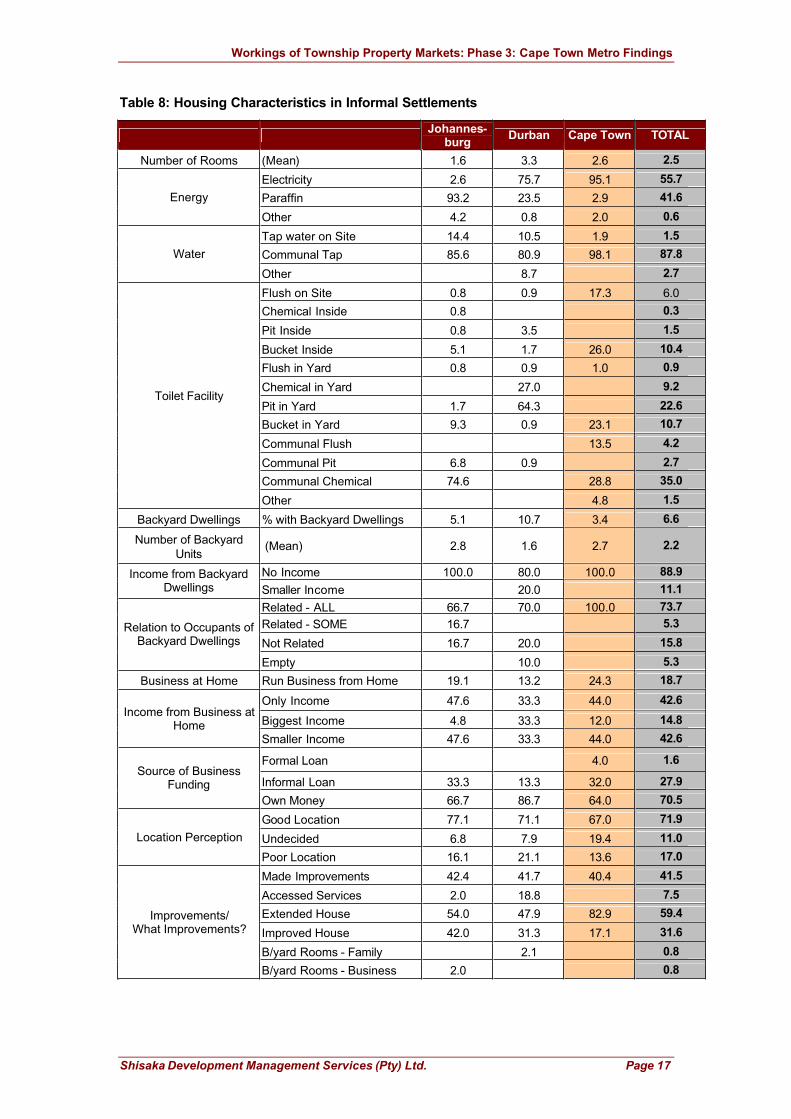
Table 9: Housing Perceptions in Informal Settlements
Johannes-burg
Durban Cape Town TOTAL
All Needs Met 18.8 4.3 10.6 11.3
Some Needs Met 34.2 53.9 39.4 42.6Housing Needs Met
No Needs Met 47.0 41.7 50.0 46.1
Don’t Know 3.7 1.4
Quality 27.7 45.9 20.0 32.1
Size 37.2 27.5 8.9 24.9
Services 8.5 11.0 14.4 11.3
Safety 12.8 2.8 27.8 13.7
Location 12.8 1.8 16.7 9.9
Ownership 7.3 2.7
Needs Not Met
Other 1.1 12.2 4.1
No Previous Dwelling 10.2 4.3 7.9 7.5
Better 49.2 55.7 38.6 48.2
Same 11.9 12.2 11.9 12.0Comparative Assessment
Worse 28.8 27.8 41.6 32.3
Size 24.6 23.4 34.2 26.4
Quality 7.0 7.8 15.8 9.4
Services 3.5 3.1 10.5 5.0
Safety 3.5 4.7 5.3 4.4
Ownership 50.9 51.6 34.2 47.2
Lack Ownership 3.5 1.6 1.9
Investment 3.1 1.3
If Better: Aspects that are Better
Other 7.0 4.7 4.4
Affordable 58.7 45.3 34.8 43.8
Undecided 4.3 16.3 13.0 12.5Affordability
Not Affordable 37.0 38.4 52.2 43.8
Lived with Family 10.3 0.9 2.9 4.8
Affordable 25.6 15.8 12.5 18.2
Work 4.3 10.5 3.8 6.3
Facilities 12.0 3.5 5.8 7.2
Schools 0.9 0.3
Homeboy Neighbourhood 0.9 1.0 0.6
Close to Family/Friends 6.8 3.5 4.8 5.1
Main Reason for choosing Current Dwelling
Inherited 10.3 9.6 2.9 7.8

Workings of Township Property Markets: Phase 3: Cape Town Metro Findings
Shisaka Development Management Services (Pty) Ltd. Page 19
Johannes-burg
Durban Cape Town TOTAL
Only Place Could Find 27.4 55.3 63.5 48.1
Other 2.6 2.9 1.8
Inherited 24.8 13.2 3.8 14.3
Friends/Family 48.7 33.3 33.7 38.8
Waiting List 0.9 1.9 0.9
Self 21.3 45.6 47.1 37.6
Employer 0.9 0.9 0.6
How was Current Dwelling found?
Other 3.4 7.0 13.5 7.8
Easy 59.5 53.5 46.2 53.3
Undecided 4.3 12.3 10.6 9.0Ease of finding Current
Dwelling
Difficult 36.2 34.2 43.3 37.7
No Previous Owner 36.8 68.4 42.3 49.3
Parents 14.5 9.6 4.8 9.9
Relatives 17.1 7.9 16.3 13.7
Friends 11.1 4.4 17.3 10.7
Strangers 20.5 8.8 18.3 15.8
Relation to Previous Owner
Other 0.9 1.0 0.6
Insecure 7.6 6.1 1.9 5.4
Undecided 3.4 1.7 1.0 2.1Security of Tenure
Secure 89.0 92.2 97.1 92.6
None to Help 0.9 3.0 1.3
Owned 68.6 56.6 56.0 60.5
Family Owned 5.7 4.7 3.5
Relation with Landlord 0.9 0.3
Know Influential People 1.0 13.2 4.8
Defend Ownership 22.9 22.6 34.0 26.4
Paid change of Ownership 1.0 4.0 1.6
If Secure: Reason for Security
Other 1.0 0.9 3.0 1.6
No Leaders 2.5 7.0 1.0 3.6
Best Interests of Comm. 33.9 36.5 30.8 33.8
Did Not Do Much 49.2 49.6 51.0 49.9
Community Leaders: Do
they act in best interests of community?
Don't Know 14.4 7.0 17.3 12.8
Distant 22.0 11.3 16.3 16.6
Undecided 10.2 7.0 9.6 8.9Feeling of Togetherness
in CommunityClose 67.8 81.7 74.0 74.5
Refusal 1.7 0.6
Trust 42.4 35.7 28.8 35.9Perception of Trust in
Community
Little Trust 55.9 64.3 71.2 63.5
Lend Money 4.1 7.3 6.7 5.8
Borrow Money 8.2 31.7 30.0 21.7
Look After Children 24.5 9.8 26.7 20.0
Small Tasks 53.1 51.2 30.0 46.7
Help received in
Community
Other 10.2 6.7 5.8
Refusal 0.8 0.3
Move to Family/Friends 8.5 13.9 8.7 10.4
Squat 9.3 9.6 6.5
Risk Management:Where to go if dwelling is
lost through disaster
Rent 15.3 7.8 8.0

Workings of Township Property Markets: Phase 3: Cape Town Metro Findings
Shisaka Development Management Services (Pty) Ltd. Page 20
Johannes-burg
Durban Cape Town TOTAL
Rebuild 63.6 56.5 88.5 68.8
Buy New 1.7 6.1 1.0 3.0
Other 0.8 6.1 1.9 3.0
Insurance 1.6 0.4
Loan: Bank 1.6 5.4 2.6
Loan: Family 18.7 4.7 17.4 14.3
Micro lender 1.1 0.4
Mashonisas 4.0 1.6 1.1 2.2
Employer 9.3 6.3 17.4 11.7
Savings 61.3 76.6 38.0 56.3
Risk Management: If Rebuild, how will you
finance?
Other 6.7 7.8 19.6 12.1
Will SELL 23.1 5.1 48.3 23.4
Never SELL 64.1 84.6 27.6 61.7Willingness to Sell
Temp Dwelling - Not own 12.8 10.3 24.1 15.0

Workings of Township Property Markets: Phase 3: Cape Town Metro Findings
Shisaka Development Management Services (Pty) Ltd. Page 21
5.2. Site and Service Sub-Market
Table 10: Household Demographics & Other Factors in Site & Services Areas
Johannes-burg
Durban Cape Town TOTAL
AGE Mean 40.7 42.3 46.1 42.7
None 12.1 7.8 10.7 10.4
Primary 28.0 30.4 46.4 33.6
Secondary 46.2 46.1 27.4 41.2
Matric 13.6 11.8 11.9 12.6
Education
Tertiary 3.9 3.6 2.2
Formal/Regular 23.3 40.8 39.5 33.2
Informal/Irregular 28.6 20.4 32.6 27.0
Pensioner/Grant 12.0 11.7 7.0 10.6Employment
Unemployed 36.1 27.2 20.9 29.2
Nuclear 37.6 22.1 43.5 34.2
Single 13.5 31.7 15.3 19.9
One-parent Family 27.8 24.0 18.8 24.2
Extended 5.3 7.7 15.3 8.7
Household Type
Split Nuclear 15.8 14.4 7.1 13.0
MultinodalHousehold
24.8 38.5 14.0 26.3
This Area 21.9 12.8 16.7 16.9
This City 18.8 38.5 25.3
Other City 6.3 12.8 25.0 12.0
Place of Split Household
Rural Area 53.1 35.9 58.3 45.8
Away-WORK 6.3 10.5 8.3 8.5
Better Schools 15.6 10.5 8.3 12.2
Family Home 5.3 33.3 7.3
No Space 9.4 18.4 16.7 14.6
Grandmother Watches Them 46.9 39.5 25.0 40.2
Divorced 12.5 4.9
Reason for
Multinodal Situation
Other 9.4 15.8 8.3 12.2
DURATION (Mean - Years) 10.1 9.0 13.4 10.6
% Bank Access Banking 33.3 38.2 48.2 38.8
ATM 79.5 33.3 57.5 57.7
Debit Card 30.0 9.8
Savings Book 2.3 10.3 10.0 7.3
Post Office 25.0 7.7 2.5 12.2
Savings 54.5 59.0 62.5 58.5
Cheque 2.5 0.8
Fixed Deposit 6.8 2.6 3.3
% Type of Account
Mortgage 2.6 0.8
Workings of Township Property Markets: Phase 3: Cape Town Metro Findings
Shisaka Development Management Services (Pty) Ltd. Page 22
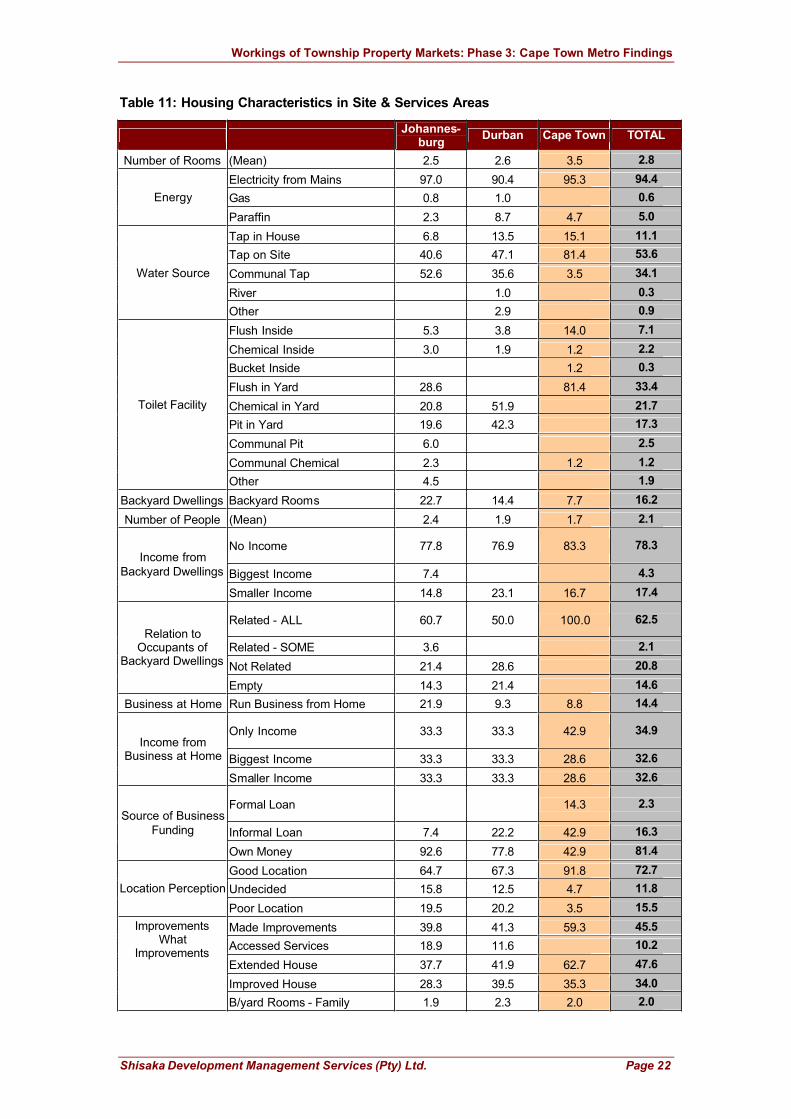
Table 11: Housing Characteristics in Site & Services Areas
Johannes-burg
Durban Cape Town TOTAL
Number of Rooms (Mean) 2.5 2.6 3.5 2.8
Electricity from Mains 97.0 90.4 95.3 94.4
Gas 0.8 1.0 0.6Energy
Paraffin 2.3 8.7 4.7 5.0
Tap in House 6.8 13.5 15.1 11.1
Tap on Site 40.6 47.1 81.4 53.6
Communal Tap 52.6 35.6 3.5 34.1
River 1.0 0.3
Water Source
Other 2.9 0.9
Flush Inside 5.3 3.8 14.0 7.1
Chemical Inside 3.0 1.9 1.2 2.2
Bucket Inside 1.2 0.3
Flush in Yard 28.6 81.4 33.4
Chemical in Yard 20.8 51.9 21.7
Pit in Yard 19.6 42.3 17.3
Communal Pit 6.0 2.5
Communal Chemical 2.3 1.2 1.2
Toilet Facility
Other 4.5 1.9
Backyard Dwellings Backyard Rooms 22.7 14.4 7.7 16.2
Number of People (Mean) 2.4 1.9 1.7 2.1
No Income 77.8 76.9 83.3 78.3
Biggest Income 7.4 4.3
Income from
Backyard Dwellings
Smaller Income 14.8 23.1 16.7 17.4
Related - ALL 60.7 50.0 100.0 62.5
Related - SOME 3.6 2.1
Not Related 21.4 28.6 20.8
Relation to Occupants of
Backyard Dwellings
Empty 14.3 21.4 14.6
Business at Home Run Business from Home 21.9 9.3 8.8 14.4
Only Income 33.3 33.3 42.9 34.9
Biggest Income 33.3 33.3 28.6 32.6
Income from Business at Home
Smaller Income 33.3 33.3 28.6 32.6
Formal Loan 14.3 2.3
Informal Loan 7.4 22.2 42.9 16.3
Source of Business
Funding
Own Money 92.6 77.8 42.9 81.4
Good Location 64.7 67.3 91.8 72.7
Undecided 15.8 12.5 4.7 11.8Location Perception
Poor Location 19.5 20.2 3.5 15.5
Made Improvements 39.8 41.3 59.3 45.5
Accessed Services 18.9 11.6 10.2
Extended House 37.7 41.9 62.7 47.6
Improved House 28.3 39.5 35.3 34.0
ImprovementsWhat
Improvements
B/yard Rooms - Family 1.9 2.3 2.0 2.0

Workings of Township Property Markets: Phase 3: Cape Town Metro Findings
Shisaka Development Management Services (Pty) Ltd. Page 23
Johannes-burg
Durban Cape Town TOTAL
B/yard Rooms - Tenants 2.3 0.7
Formal Loan 1.9 4.7 17.6 8.2
Informal Loan 1.9 2.3 5.9 3.4Funding for
ImprovementsOwn Money 96.2 93.0 76.5 88.4
No Value 7.7 9.3 3.9 6.8
Higher Value 5.8 34.9 17.6 18.5
Rent 2.3 3.9 2.1
Bigger 44.2 32.6 35.3 37.7
Better Quality 32.7 11.6 31.4 26.0
Prettier 7.7 9.3 7.8 8.2
Value of Improvements
Other 1.9 0.7
Table 12: Housing Perceptions in Site & Services Areas
Johannes-
burgDurban Cape Town TOTAL
All Needs Met 14.3 9.7 20.9 14.6
Some Needs Met 60.9 47.6 51.2 54.0Housing Needs Met
No Needs Met 24.8 42.7 27.9 31.4
Quality 43.0 33.3 32.4 37.1
Size 28.1 37.6 55.9 38.2
Services 19.3 11.8 2.9 12.7
Safety 2.6 1.5 1.5
Location 4.4 11.8 1.5 6.2
Ownership 1.8 4.3 5.9 3.6
Needs Not Met
Other 0.9 1.1 0.7
No Previous Dwelling 4.5 1.0 8.1 4.3
Better 65.4 62.5 80.2 68.4
Same 12.0 15.4 5.8 11.5
ComparativeAssessment
Worse 18.0 21.2 5.8 15.8
Size 17.2 9.4 20.6 16.0
Quality 9.2 10.9 27.9 15.5
Services 9.2 3.1 20.6 11.0
Safety 6.9 6.3 1.5 5.0
Ownership 54.0 62.5 29.4 48.9
Lack Ownership 1.6 0.5
Investment 1.1 3.1 1.4
If Better: Aspects that are Better
Other 4.0 5.0 1.0 10.0
Lived with Family 6.1 8.6 8.2 7.5
Affordable 20.5 15.4 31.4 21.7
Work 11.4 10.6 4.7 9.3
Facilities 5.3 4.8 7.0 5.6
Schools 1.0 4.7 1.6
Gvt Subsidy 3.8 1.9 15.1 6.2
Homeboy Neighbourhood 1.0 2.3 0.9
Close to Family/Friends 7.6 7.7 5.6
Only Place Could Find 42.4 47.1 23.3 38.8
Main Reason for choosing Current
Dwelling
Other 3.0 1.9 3.5 2.8

Workings of Township Property Markets: Phase 3: Cape Town Metro Findings
Shisaka Development Management Services (Pty) Ltd. Page 24
Johannes-burg
Durban Cape Town TOTAL
Inherited 7.6 13.5 9.3 9.9
Friends/Family 46.2 44.2 16.3 37.6
Waiting List 32.6 1.9 53.5 28.3
Agent Ad 0.8 3.5 1.2
Self 9.1 36.6 5.8 17.1
How was Current Dwelling found?
Other 3.8 3.8 11.6 5.9
Easy 60.6 51.9 44.7 53.6
Undecided 5.3 10.6 14.1 9.3Ease of finding
Current Dwelling
Difficult 34.1 37.5 41.2 37.1
No Previous Owner 72.2 51.0 65.1 63.5
Parents 4.5 5.8 8.1 5.9
Relatives 8.3 11.5 14.0 10.8
Friends 5.3 6.7 5.8 5.9
Strangers 9.8 24.0 4.7 13.0
Relation to Previous Owner
Other 1.0 2.3 0.9
Insecure 5.3 8.7 2.4 5.6
Undecided 5.3 2.9 5.9 4.7Security of Tenure
Secure 89.5 88.5 91.8 89.8
Owned 69.8 46.7 87.0 77.0
Poor 1.3 0.3
Family Owned 5.0 3.3 3.9 4.2
Relation with Landlord 0.8 2.2 1.0
Know Influential People 4.2 7.6 1.3 4.5
Will Defend Ownership 18.5 40.2 5.2 21.9
If Secure: Reason for Security
Other 1.7 1.3 1.0
No Leaders 4.6 2.9 2.3 3.4
Best Interests of Comm. 29.8 44.2 67.4 44.5
Did Not Do Much 35.9 39.4 24.4 34.0
CommunityLeaders: Do they
act in best interests
of community?Don't Know 29.8 13.5 5.8 18.1
Distant 22.0 14.4 11.6 16.8
Undecided 4.5 7.7 9.3 6.8Feeling of
Togetherness in Community Close 73.5 77.9 79.1 76.4
Trust 40.2 49.0 26.7 39.4Perception of Trust in Community Little Trust 59.8 51.0 73.3 60.6
Lend Money 9.6 15.7 8.7 11.9
Borrow Money 23.1 17.6 13.0 19.0
Look after Children 30.8 11.8 26.1 22.2
Small Tasks 30.8 51.0 47.8 42.1
Help received in community
Other 5.8 3.9 4.3 4.8
Refusal 1.5 0.6
Move to Family/Friends 17.3 16.3 23.5 18.6
Squat 9.8 8.7 27.1 14.0
Rent 11.3 25.0 12.7
Rebuild 56.4 42.3 47.1 49.4
Buy New 0.8 1.9 0.9
Risk Management:Where to go ifdwelling is lost
through disaster
Other 3.0 5.8 2.4 3.7

Workings of Township Property Markets: Phase 3: Cape Town Metro Findings
Shisaka Development Management Services (Pty) Ltd. Page 25
Johannes-burg
Durban Cape Town TOTAL
Don’t Know 1.3 0.6
Insurance 2.5 0.6
Loan: Bank 5.3 25.0 8.8
Loan: Family 13.3 4.5 10.0 10.1
Mashonisas 1.3 2.3 2.5 1.9
Employer 5.3 2.3 10.0 5.7
Building-material Supplier 1.3 0.6
Savings 53.3 84.1 32.5 56.6
Risk Management:If Rebuild, how will
you finance?
Other 18.7 6.8 17.5 15.1
Will SELL 24.2 2.5 16.7 12.9
Never SELL 69.7 82.5 83.3 77.6Willingness to Sell
Temp. Dwelling - Not Own 6.1 15.0 9.4

Workings of Township Property Markets: Phase 3: Cape Town Metro Findings
Shisaka Development Management Services (Pty) Ltd. Page 26
5.3. RDP Sub-Market
Table 13: Household Demographics & Other Factors in RDP Areas
Johannes-burg
Durban Cape Town TOTAL
AGE (Mean) 37.9 38.6 40.1 39.1
None 4.8 6.7 7.1 6.4
Primary 19.2 23.1 25.5 23.2
Secondary 42.3 34.6 42.4 40.3
Matric 30.8 28.8 22.8 26.5
Education
Tertiary 2.9 6.7 2.2 3.6
Formal/Regular 38.1 58.1 39.2 43.9
Informal/Irregular 14.3 16.2 26.3 20.5
Pensioner/Grant 7.6 4.8 9.1 7.6Employment
Unemployed 40.0 21.0 25.3 28.0
Nuclear 26.7 14.6 35.5 27.7
Single 17.1 26.2 15.6 18.8
One-parent Family 36.2 39.8 29.6 34.0
Extended 10.5 9.7 12.4 11.2
Household Type
Split Nuclear 9.5 9.7 7.0 8.4
MultinodalHousehold
Multinodal Households 22.9 45.7 16.1 25.8
This Area 37.5 15.2 3.4 17.2
This City 54.2 23.9 65.5 43.4
Other City 10.9 24.1 12.1
Place of Split Household
Rural Area 8.3 50.0 6.9 27.3
Away-WORK 21.7 3.4 11.1
Better Schools 13.0 13.8 10.1
Family Home 8.3 4.3 6.9 6.1
No Space 20.8 32.6 13.8 24.2
Grandmother can Watch 58.3 19.6 27.6 31.3
Divorced 12.5 2.2 13.8 8.1
Reason for
Multinodal Situation
Other 4.3 17.2 7.1
DURATION 5.1 3.6 6.5 5.3
% Bank Access Banking 34.0 57.1 45.9 45.8
ATM 77.1 53.3 90.6 75.6
Debit Card 5.9 2.8
Savings Book 5.7 18.3 8.2 11.1
Post Office 8.6 2.4 2.8
Savings 31.4 43.3 75.3 56.1
Cheque 2.9 0.6
Credit Card 1.2 0.6
Fixed Deposit 5.7 1.7 1.2 2.2
Mortgage 1.2 0.6
Personal Loan 8.6 1.2 2.2
% Type of Account
Vehicle Finance 1.2 0.6

Workings of Township Property Markets: Phase 3: Cape Town Metro Findings
Shisaka Development Management Services (Pty) Ltd. Page 27
Table 14: Housing Characteristics in RDP Areas
Johannes-burg
Durban Cape Town TOTAL
Number of Rooms (Mean) 1.6 1.6 1.8 1.7
Electricity from Mains 98.1 96.2 100.0 98.5
Paraffin 1.9 2.9 1.3Energy
Other 1.0 0.3
Tap in House 62.9 85.7 97.8 85.4
Tap on Site 37.1 11.4 1.6 13.6Water
Other 2.9 0.5 1.0
Flush Inside 93.3 99.0 99.5 97.7
Flush in Yard 6.7 0.5 2.0Toilet Facility
Other 1.0 0.3
Backyard Dwellings Backyard Rooms 1.9 2.9 19.2 10.2
Number of Backyard
Units (Mean)No. of Rooms 1.0 1.3 2.8 2.6
No Income 100.0 100.0 71.4 75.8
Only Income 10.7 9.1Income from Backyard
DwellingsSmaller Income 17.9 15.2
Related – ALL 66.7 66.7 63.2
Related – SOME 6.1 5.3
Not Related 33.3 24.2 23.7
Relation to Occupants of Backyard Dwellings
Empty 100.0 3.0 7.9
Business at Home Run Business from Home 11.8 9.7 12.8 11.7
Only Income 60.0 20.0 52.2 46.5
Biggest Income 10.0 50.0 17.4 23.3Income from Business
at Home
Smaller Income 30.0 30.0 30.4 30.2
Formal Loan 4.3 2.3
Informal Loan 27.3 21.7 18.2Source of Business
Funding
Own Money 72.7 100.0 73.9 79.5
Good Location 40.0 58.1 60.5 54.4
Undecided 25.7 15.2 12.4 16.7Location Perception
Poor Location 34.3 26.7 27.0 28.9
Made Improvements 48.6 32.4 40.0 40.3
Accessed Services 7.8 5.9 3.8
Extended House 39.2 50.0 58.1 50.3
Improved House 51.0 38.2 35.1 40.9
B/yard Rooms - Family 2.0 2.9 5.4 3.8
ImprovementsWhat Improvements
Other 2.9 1.4 1.3
Formal Loan 9.8 8.8 4.1 7.0
Informal Loan 9.8 6.8 6.3Funding for
ImprovementsOwn Money 80.4 91.2 89.0 86.7
No Value 3.9 3.0 2.8 3.2
Worth More 3.9 24.2 8.3 10.3
Business Income 3.0 0.6
Bigger 31.4 36.4 61.1 46.2
Better Quality 27.5 6.1 15.3 17.3
Prettier 31.4 24.2 12.5 21.2
Value of Improvements
Other 2.0 3.0 1.3

Workings of Township Property Markets: Phase 3: Cape Town Metro Findings
Shisaka Development Management Services (Pty) Ltd. Page 28
Table 15: Housing Perceptions in RDP Areas
Johannes-burg
Durban Cape Town TOTAL
All Needs Met 4.8 12.0 15.2 10.9
Some Needs Met 56.2 56.5 58.1 56.9Housing Needs Met
No Needs Met 39.0 31.5 26.7 32.2
Don’t Know 1.0 0.3
Quality 13.3 26.7 22.5 21.8
Size 79.6 57.8 71.9 67.5
Services 1.0 0.6 1.1 0.9
Safety 8.7 1.1 4.3
Location 1.0 1.2 1.1 1.1
Ownership 3.1 4.3 1.1 3.2
Needs Not Met
Other 1.0 0.6 1.1 0.9
No Previous Dwelling 20.2 1.0 3.2 7.1
Better 40.4 68.3 61.1 57.5
Same 12.5 13.5 4.3 8.9
Comparative
Assessment
Worse 26.9 17.3 31.4 26.5
Size 21.4 12.7 12.4 14.2
Quality 28.6 29.6 46.9 38.1
Services 11.9 19.7 5.3 11.1
Safety 4.8 5.6 2.7 4.0
Ownership 19.0 28.2 29.2 27.0
Lack Ownership 4.8 1.4 2.7 2.7
Investment 2.4 0.9 0.9
If Better: Aspects thatare Better
Other 7.1 2.8 2.2
Affordable 30.8 37.6 59.8 46.7
Undecided 26.9 20.0 7.4 15.4Affordability
Not Affordable 42.3 42.4 32.8 37.8
Affordable 28.6 20.0 8.1 16.7
Work 11.4 8.6 1.1 5.8
Facilities 1.0 1.9 2.7 2.0
Schools 1.0 1.9 0.5 1.0
Gvt Subsidy 11.4 16.2 7.6 10.9
Homeboy Neighbourhood 2.7 1.3
Close to Family/Friends 2.9 4.8 2.0
Inherited 8.6 2.9 3.8 4.8
Only Place Could Find 29.5 40.0 71.9 52.2
Main Reason for choosing Current
Dwelling
Other 5.7 3.8 1.6 3.3
Inherited 9.5 2.9 3.8 5.1
Friends/Family 5.7 21.2 14.1 13.7
Waiting List 82.9 68.3 75.1 75.4
Agent Ad 1.0 1.0 1.6 1.3
Self 1.0 2.9 3.2 2.5
How was Current Dwelling found?
Other 3.8 2.2 2.0
Easy 57.1 41.9 56.2 52.7
Undecided 18.1 7.6 4.3 8.9Ease of finding Current
DwellingDifficult 24.8 50.5 39.5 38.5
Relation to Previous No Previous Owner 84.8 67.6 73.0 74.7

Workings of Township Property Markets: Phase 3: Cape Town Metro Findings
Shisaka Development Management Services (Pty) Ltd. Page 29
Johannes-burg
Durban Cape Town TOTAL
Parents 5.7 1.0 3.2 3.3
Relatives 5.7 5.7 5.9 5.8
Friends 7.6 9.2 6.3
Strangers 3.8 15.2 7.6 8.6
Owner
Other 1.9 1.1 1.0
Insecure 4.8 13.3 4.3 6.9
Undecided 1.0 1.6 1.0Security of Tenure
Secure 94.2 86.7 94.1 92.1
Not Own 1.7 0.8
Poor 0.6 0.3
Owned 58.2 73.6 68.8 67.1
Family Owned 6.1 2.2 0.6 2.5
Relation with Landlord 1.0 1.1 1.2 1.1
Know Influential People 7.1 1.1 2.2
Defend O/ship 26.5 18.7 25.4 24.0
Paid Change Of O/ship 1.0 1.1 1.7 1.4
If Secure: Reason for Security
Other 2.2 0.6
No Leaders 17.1 4.8 4.3 7.9
Best Interests of Comm. 13.3 37.5 27.2 26.2
Did Not Do Much 39.0 35.6 47.3 42.0
Community Leaders: Do they act in best
interests of community?
Don’t Know 30.5 22.1 21.2 23.9
Distant 14.3 17.1 13.0 14.4
Undecided 23.8 9.5 10.3 13.7Feeling of
Togetherness in Community Close 61.9 73.3 76.8 71.9
Trust 21.9 50.5 40.5 38.2Perception of Trust in
Community Little Trust 78.1 49.5 59.5 61.8
Lend Money 14.3 17.0 23.0 19.6
Borrow Money 33.3 17.0 29.7 25.7
Look After Children 9.5 13.2 18.9 15.5
Small Tasks 38.1 47.2 25.7 35.1
Help received in Community
Transport in Crisis 4.8 1.4 1.4
Refusal 1.0 0.3
Move to Family/Friends 40.4 12.4 13.0 20.1
Squat 1.9 7.6 14.6 9.4
Rent 20.2 24.8 6.5 15.0
Rebuild 25.0 45.7 59.5 46.7
Buy New 1.9 5.7 2.0
Other 9.6 3.8 4.3 5.6
Insurance 6.3 2.8 3.3
Loan: Bank 16.0 8.3 0.9 5.0
Loan: Family 24.0 4.2 9.3 10.0
Microlender 1.9 1.1
Mashonisas 8.0 2.1 0.9 2.2
Employer 8.0 13.1 8.9
Savings 28.0 72.9 48.6 52.2
Risk Management:Where to go if dwelling
is lost through disaster
Other 16.0 6.3 21.5 16.7
Will SELL 4.2 12.5 13.3 10.8Willingness to Sell
Never SELL 87.5 66.7 83.3 76.5

Workings of Township Property Markets: Phase 3: Cape Town Metro Findings
Shisaka Development Management Services (Pty) Ltd. Page 30
5.4. Old Township Stock Sub-Market
Table 16: Household Demographics in Old Township Stock Areas
Johannes-burg
Durban Cape Town East Rand TOTAL
AGE (Mean) 60.1 55.7 50.6 56.5 56.0
None 5.8 3.4 2.3 12.8 6.3
Primary 18.3 26.1 23.3 33.3 25.6
Secondary 43.3 47.1 52.3 41.9 45.8
Matric 11.5 19.3 15.1 8.5 13.6
Education
Tertiary 21.2 4.2 7.0 3.4 8.7
Formal/Regular 29.6 27.5 29.1 19.5 26.2
Informal/Irregular 10.2 19.2 22.1 17.8 17.1
Pensioner/Grant 44.4 43.3 31.4 45.8 41.9Employment
Unemployed 15.7 10.0 17.4 16.9 14.8
Nuclear 22.6 10.0 13.6 29.2 19.1
Single 13.2 20.8 47.7 19.2 24.0
One-parent Family 36.8 51.7 35.2 34.2 39.9
Extended 20.8 8.3 3.4 13.3 11.8
Household Type
Split Nuclear 6.6 9.2 4.2 5.3
MultinodalHousehold
Multinodal 15.2 22.5 3.4 14.2 14.5
This Area 38.5 25.9 66.7 64.7 41.7
This City 38.5 29.6 23.5 28.3
Other City 23.1 14.8 5.9 13.3
Place of Split Household
Rural Area 29.6 33.3 5.9 16.7
Away-WORK 22.2 11.8 13.1
Better Schools 14.3 3.3
Family Home 11.1 5.9 6.6
No Space 7.1 33.3 52.9 31.1
Grandmother can Watch 21.4 22.2 33.3 17.6 21.3
Divorced 35.7 5.9 9.8
Reason for MultinodalSituation
Other 21.4 11.1 66.7 5.9 14.8
Duration of Stay (Years) 33.9 37.6 40.4 37.2 37.2
% Bank Access Banking 65.1 42.5 46.0 31.7 45.7
ATM 81.2 45.1 95.0 52.6 69.2
Debit Card 13.0 40.0 12.6
Savings Book 20.3 10.0 10.0 13.2 14.2
Post Office 13.0 4.0 12.5 15.8 11.2
Savings 59.4 60.8 60.0 50.0 58.1
Cheque 11.6 5.0 5.3 6.1
Credit Card 1.4 2.5 5.3 2.0
Fixed Deposit 10.1 2.5 4.0
Money Market 2.9 1.0
Mortgage 4.3 2.5 2.6 2.5
Personal Loan 4.3 2.5 2.0
% Type of Account
Vehicle Finance 1.4 2.6 2.6 1.5

Workings of Township Property Markets: Phase 3: Cape Town Metro Findings
Shisaka Development Management Services (Pty) Ltd. Page 31
Table 17: Housing Characteristics in Old Township Stock Areas
Johannes-burg
Durban Cape Town East Rand TOTAL
Number of Rooms (Mean) 5.0 3.9 3.3 4.3 4.1
Refusal 1.1 0.2
Electricity from Mains 99.1 98.3 98.9 93.3 97.2
Electricity from Generator 1.7 0.5Energy
Paraffin 0.9 1.7 5.0 2.1
Water Source Tap on Site 100.0 100.0 100.0 100.0 100.0
Flush Inside 67.6 92.5 20.7 32.7 55.2
Flush in Yard 32.4 4.2 79.3 67.2 43.5Toilet Facility
Chemical in Yard 3.3 1.3
Backyard Dwellings Backyard Dwellings 70.8 39.8 35.5 61.7 1.2
Number of People Avg People in Backyards 2.2 2.9 3.2 2.6 2.6
No Income 73.0 95.7 80.8 64.4 75.8
Only Income 1.4 8.2 3.2
Biggest Income 6.8 3.8 11.0 6.4
Income from
Backyard Dwellings
Smaller Income 18.9 4.3 15.4 16.4 14.6
Related - ALL 50.7 89.4 81.5 54.2 63.8
Related - SOME 8.0 11.1 19.4 10.4
Not Related 21.3 10.6 3.7 11.1 13.6
Relation to
Occupants of Backyard Dwellings
Empty 20.0 3.7 15.3 12.2
Business at Home Run Business from Home 14.4 9.6 6.8 14.3 11.5
Only Income 57.1 18.2 50.0 56.3 46.8
Biggest Income 14.3 45.5 16.7 12.5 21.3Income from
Business at HomeSmaller Income 28.6 36.4 33.3 25.0 29.8
Informal Loan 7.7 16.7 26.7 13.3Source of Business Funding Own Money 92.3 100.0 83.3 73.3 86.7
Good Location 93.4 90.8 75.9 93.3 89.1
Undecided 1.9 4.2 14.9 4.2 5.8Location Perception
Poor Location 4.7 5.0 9.2 2.5 5.1
Made Improvements 88.7 56.7 73.6 69.2 71.4Improvements
No Improvements 11.3 43.3 26.4 30.8 28.6
Accessed Services 8.7 13.2 4.7 6.0 8.1
Extended House 23.9 22.1 64.1 19.3 30.6
Improved House 53.3 35.3 29.7 62.7 46.9
B/yard Rooms - Family 9.8 26.5 8.4 11.1
B/yard Rooms - Tenants 2.2 2.9 1.3
B/yard Rooms - Business 1.1 0.3
WhatImprovements
Other 1.1 1.6 3.6 1.6
Formal Loan 7.5 2.9 6.3 3.6 5.2
Informal Loan 3.2 5.9 3.1 2.4 3.6Funding for
ImprovementsOwn Money 89.2 91.2 90.6 94.0 91.2
No Value 1.1 6.0 1.6 7.4 4.0
Higher Value 31.2 26.9 43.5 11.1 27.4
Rent 5.4 3.0 1.2 2.6
Bigger 16.1 38.8 33.9 17.3 25.1
Better Quality 24.7 10.4 9.7 35.8 21.5
Value of Improvements
Prettier 20.4 13.4 11.3 27.2 18.8

Workings of Township Property Markets: Phase 3: Cape Town Metro Findings
Shisaka Development Management Services (Pty) Ltd. Page 32
Table 18: Housing Perceptions in Old Township Stock Areas
Johannes-burg
Durban Cape Town East Rand TOTAL
All Needs Met 59.4 19.5 18.5 49.2 37.6
Some Needs Met 36.8 42.4 49.4 42.5 42.4Housing Needs Me
No Needs Met 3.8 38.1 32.1 8.3 20.0
Quality 28.9 35.8 23.1 39.3 32.3
Size 60.0 41.1 60.0 47.5 50.4
Services 2.2 8.4 9.2 4.9 6.8
Safety 1.1 3.1 1.6 1.5
Location 4.4 6.3 1.5 4.9 4.5
Ownership 4.2 1.5 1.6 2.3
Needs Not Met
Other 4.4 3.2 1.5 0.0 2.3
No Previous Dwelling 10.4 34.7 65.9 43.3 37.5
Better 69.8 47.5 20.5 47.5 47.5
Same 8.5 12.7 9.1 5.0 8.8
ComparativeAssessment
Worse 11.3 5.1 4.5 4.2 6.3
Size 56.9 9.4 22.2 50.9 39.4
Quality 9.7 15.1 16.7 27.3 16.7
Services 6.9 28.3 11.1 7.3 13.1
Safety 2.8 11.1 2.0
Ownership 19.5 38.6 33.3 14.5 24.7
Investment 1.4 3.8 1.5
If Better: Aspects that are Better
Other 2.8 3.8 5.6 2.5
Affordable 47.7 58.0 43.1 59.3 52.9
Undecided 14.0 14.8 19.6 16.0 15.7Affordability
Not Affordable 38.4 27.3 37.3 24.7 31.4
Inherited 35.9 58.8 55.1 44.5 48.5
Affordable 12.3 5.9 2.3 17.6 10.0
Work 10.4 7.6 4.6 10.9 8.6
Facilities 6.6 3.4 4.6 7.6 5.6
Schools 0.8 0.2
Gvt Subsidy 0.8 4.6 5.9 2.8
Homeboy Neighbourhood 0.9 1.7 0.7
Close to Family/Friends 4.7 1.7 4.6 0.8 2.8
Main Reason for choosing Current
Dwelling
Only Place Could Find 22.6 15.1 16.1 7.6 15.1
Other 6.6 4.2 8.0 5.0 5.8
Inherited 41.5 58.3 62.5 52.9 53.6
Friends/Family 14.2 16.7 6.8 14.3 13.4
Waiting List 30.2 10.0 18.2 21.8 19.9
Agent Ad 5.7 0.8 3.4 2.5
Self 2.8 4.2 1.1 0.8 2.3
Employer 0.9 3.3 3.4 1.8
How was Current Dwelling found?
Other 4.7 6.7 8.0 6.7 6.5
Easy 72.4 74.2 76.7 70.8 73.3
Undecided 5.7 7.5 12.8 9.2 8.6Ease of finding
Current DwellingDifficult 21.9 18.3 10.5 20.0 18.1
No Previous Owner 37.7 18.3 21.8 32.5 27.7Relation to Previous
OwnerParents 37.7 58.3 58.6 44.2 49.4

Workings of Township Property Markets: Phase 3: Cape Town Metro Findings
Shisaka Development Management Services (Pty) Ltd. Page 33
Johannes-burg
Durban Cape Town East Rand TOTAL
Relatives 5.7 3.3 5.7 7.5 5.5
Friends 5.7 3.3 3.4 0.8 3.2
Strangers 13.2 15.0 9.2 14.2 13.2
Other 1.7 1.1 0.8 0.9
Insecure 8.5 5.0 3.4 2.5 4.8
Undecided 5.7 5.0 5.0 4.2Security of Tenure
Secure 85.8 90.0 96.6 92.5 91.0
Owned 58.2 50.0 75.0 46.8 56.3
Family Owned 16.5 18.5 10.7 26.1 18.5
Relation with Landlord 0.9 2.4 0.8
Know Influential People 1.1 7.4 2.3
Defend O/ship 23.1 23.1 6.0 25.2 20.1
Paid Change of O/ship 1.8 0.5
If Secure: Reason for security
Other 1.1 6.0 1.6
No Leaders 3.8 4.2 10.0 4.8
Best Interests of Comm. 24.5 29.2 53.4 36.7 35.0
Did Not Do Much 50.9 45.8 36.4 26.7 39.9
CommunityLeaders: Do they
act in best interests of community?
Don’t Know 20.8 20.8 10.2 26.7 20.3
Distant 10.4 15.0 5.7 28.3 15.7
Undecided 13.2 5.8 26.1 13.3 13.8
Feeling of Togetherness in
CommunityClose 76.4 79.2 68.2 58.3 70.5
Refusal 0.8 0.2
Trust 74.5 50.8 11.5 32.8 43.8Perception of Trust
in CommunityLittle Trust 25.5 49.2 88.5 66.4 56.0
Lend Money 6.4 19.3 20.5 13.1
Borrow Money 6.4 19.3 11.1 20.5 13.7
Look After Children 9.0 7.0 11.1 5.1 7.7
Small Tasks 55.1 40.4 77.8 41.0 48.6
Transport in Crisis 3.8 7.0 5.1 4.9
Help received in
Community
Other 19.2 7.0 7.7 12.0
Refusal 10.8 3.0
Move to Family/Friends 32.4 18.3 42.5 20.8 27.3
Squat 9.5 12.5 9.2 11.7 10.9
Rent 5.7 11.7 15.0 8.8
Rebuild 32.4 38.3 28.7 22.5 30.6
Buy New 5.7 1.7 3.4 1.7 3.0
Risk Management:
Where to go if dwelling is lost
through disaster
Other 14.3 15.8 16.1 17.5 16.0
Insurance 17.6 8.0 7.4 7.6
Loan: Bank 23.5 8.9 8.0 11.1 13.0
Loan: Family 14.7 8.9 20.0 10.7
Mashonisas 4.0 3.7 1.5
Employer 2.9 4.4 4.0 3.1
Building-material Supplier 2.2 3.7 1.5
Savings 32.4 68.9 52.0 48.1 51.9
Risk management:
If Rebuild, how will you finance?
Other 8.8 6.7 4.0 25.9 10.7
Will SELL 12.5 7.4 5.9 7.9Willingness to Sell
Never SELL 87.5 88.9 100.0 94.1 90.5

Workings of Township Property Markets: Phase 3: Cape Town Metro Findings
Shisaka Development Management Services (Pty) Ltd. Page 34
5.5. Privately Developed Sub-Market
Table 19: Household Demographics in Private Sector Areas
Johannes-burg
Durban Cape Town Total
AGE (Mean) 49.3 44.3 42.9 45.9
None 1.0 4.7 4.4 3.0
Primary 2.9 15.9 8.3 7.7
Secondary 19.8 39.3 21.0 24.4
Matric 31.9 29.0 26.0 29.1
Education
Tertiary 44.4 11.2 40.3 35.8
Formal/Regular 53.6 62.6 70.0 61.7
Informal/Irregular 12.0 11.2 6.8 9.9
Pensioner/Grant 20.1 11.2 12.1 15.2Employment
Unemployed 14.4 15.0 11.1 13.2
Nuclear 48.6 38.3 39.3 42.9
Single 3.8 10.3 14.7 9.3
One-parent Family 32.7 29.0 25.7 29.2
Extended 10.6 15.9 13.6 12.8
Household Type
Split Nuclear 4.3 6.5 6.8 5.7
Multinodal Household % Multinodal 6.7 13.1 12.5 10.3
This Area 35.7 4.8 12.2
This City 21.4 35.7 47.6 36.7
Other City 21.4 35.7 28.6 28.6
Rural Area 14.3 28.6 14.3 18.4
Place of Split
Household
Other Country 7.1 4.8 4.1
Away - WORK 14.3 13.6 10.2
Better Schools 38.5 7.1 13.6 18.4
Family Home 7.7 14.3 9.1 10.2
No Space 7.1 4.5 4.1
Grandmother Watches Them 15.4 21.4 13.6 16.3
Divorced 23.1 22.7 16.3
Reason for Multinodal Situation
Other 15.4 35.7 22.7 24.5
Duration of Stay (Years) 14.9 10.8 18.3 15.3
% Bank Access Banking 87.6 82.1 92.6 88.3
ATM 80.1 47.1 78.9 73.1
Debit Card 19.9 2.3 22.3 17.4
Savings Book 17.0 8.0 14.9 14.4
Post Office 3.4 2.3 2.3
Savings 61.9 69.0 65.1 64.6
Cheque 33.5 2.3 18.9 21.5
Credit Card 25.0 5.7 12.0 16.0
Fixed Deposit 15.9 14.9 3.4 10.7
Money Market 4.5 1.1 0.6 2.3
Mortgage 54.5 8.0 57.1 46.3
Personal Loan 16.5 1.1 12.0 11.6
% Type of Account
Vehicle Finance 8.5 13.7 8.9

Workings of Township Property Markets: Phase 3: Cape Town Metro Findings
Shisaka Development Management Services (Pty) Ltd. Page 35
Table 20: Housing Characteristics in Private Sector Areas
Johannes-burg
Durban Cape Town Total
Number of Rooms 6.3 4.8 4.8 5.4
Electricity from Mains 99.0 98.1 100.0 99.2
Electricity from Generator 0.5 0.2
Gas 0.9 0.2
Paraffin 0.9 0.2
Number of Rooms/Energy
Solar 0.5 0.2
Water Source Tap in House 100.0 100.0 100.0 100.0
Toilet Facility Flush Inside 100.0 100.0 100.0 100.0
Backyard Dwellings Backyard Dwellings 20.7 7.5 8.5 13.4
Number of People Number of ROOMS 1.1 0.8 1.4 1.2
No Income 78.0 100.0 61.5 76.7
Only Income 4.9 7.7 5.0
Biggest Income 2.4 1.7
Income from Backyard Dwellings
Smaller Income 14.6 30.8 16.7
Related - ALL 28.6 25.0 58.3 33.9
Related - SOME 4.8 8.3 4.8
Not Related 19.0 25.0 25.0 21.0
Relation to Occupants of Backyard Dwellings
Empty 47.6 50.0 8.3 40.3
Business at Home Run Business from Home 12.5 9.0 9.3 10.6
Only Income 45.8 28.6 31.3 38.3
Biggest Income 20.8 42.9 18.8 23.4Income from Business
at Home
Smaller Income 33.3 28.6 50.0 38.3
Formal Loan 14.3 6.3 4.3
Informal Loan 13.0 14.3 6.3 10.9Source of Business
Funding
Own Money 87.0 71.4 87.5 84.8
Good Location 85.1 56.1 83.2 78.3
Undecided 9.1 15.0 6.3 9.3Location Perception
Poor Location 5.8 29.0 10.5 12.5
Made Improvements 79.9 54.2 48.4 62.6
Accessed Services 3.0 12.1 2.2 4.5
Extended House 23.6 37.9 24.4 26.5
Improved House 69.7 46.6 64.4 63.9
B/yard Rooms - Family 1.8 3.4 1.1 1.9
B/yard Rooms - Tenants 1.2 0.6
Improvements/What Improvements?
B/yard Rooms - Business 0.6 1.1 0.6
Formal Loan 12.6 12.3 9.9 11.7
Informal Loan 1.8 1.8 1.1 1.6Funding for
Improvements
Own Money 85.6 86.0 89.0 86.7

Workings of Township Property Markets: Phase 3: Cape Town Metro Findings
Shisaka Development Management Services (Pty) Ltd. Page 36
Table 21: Housing Perceptions in Private Sector Areas
Johannes-burg
Durban Cape Town Total
All Needs Met 55.6 40.2 55.8 52.4
Some Needs Met 41.1 35.5 36.8 38.3Housing Needs Met
No Needs Met 3.4 24.3 7.4 9.3
Don’t Know 1.2 0.4
Quality 26.5 21.0 27.1 25.3
Size 54.1 50.0 50.6 51.8
Services 7.1 11.3 3.5 6.9
Safety 7.1 9.7 7.1 7.8
Location 2.0 4.8 7.1 4.5
Ownership 1.0 1.6 3.5 2.0
Needs not Met
Other 2.0 1.6 0.0 1.2
No Previous Dwelling 1.0 6.5 2.6 2.8
Better 93.3 79.4 87.5 88.2
Same 4.3 8.4 3.6 4.9
Comparative
Assessment
Worse 1.4 5.6 6.3 4.1
Size 55.4 13.3 28.1 37.2
Quality 11.9 31.3 32.3 23.3
Services 4.7 12.0 4.2 5.9
Safety 4.7 2.4 4.8 4.3
Ownership 22.3 39.8 28.7 28.0
Lack Ownership 0.5 1.2 0.6 0.7
Investment 0.6 0.2
If Better: Aspects that are Better
Other 0.5 0.6 0.5
Affordable 53.5 49.5 56.0 53.6
Undecided 13.5 19.6 20.7 17.5Affordability
Not Affordable 33.0 30.9 23.4 28.9
Lived with Family 4.3 12.1 3.7 5.4
Affordable 30.6 13.1 37.9 29.6
Work 15.3 14.0 8.4 12.5
Facilities 13.9 6.5 4.2 8.7
Schools 1.0 0.9 0.5 0.8
Gvt Subsidy 2.9 10.3 7.4 6.1
Homeboy Neighbourhood 0.5 0.9 0.4
Close to Family/Friends 2.4 5.6 3.2 3.4
Only Place Could Find 18.7 36.4 28.9 26.3
Main Reason for Choosing Current
Dwelling
Other 11.5 5.3 6.7
Inherited 2.4 9.3 1.1 3.4
Friends/Family 25.8 18.7 8.0 17.7
Waiting List 8.1 11.2 4.3 7.3
Agent Ad 43.5 7.5 70.7 46.0
Self 3.9 11.2 1.6 4.6
Employer 12.9 35.5 7.4 15.7
How Current Dwelling
was found
Other 3.3 6.5 6.9 5.4
Easy 68.3 58.9 68.8 66.5
Undecided 8.2 15.0 15.9 12.5Ease of finding
Current DwellingDifficult 23.6 26.2 15.3 21.0

Workings of Township Property Markets: Phase 3: Cape Town Metro Findings
Shisaka Development Management Services (Pty) Ltd. Page 37
Johannes-burg
Durban Cape Town Total
No Previous Owner 61.5 72.4 77.6 69.9
Parents 3.4 3.8 1.6 2.8
Relatives 1.9 4.8 2.1 2.6
Friends 9.6 3.8 3.6 6.1
Strangers 23.6 11.4 14.1 17.4
Relation to Previous Owner
Other 3.8 1.0 1.2
Insecure 3.8 2.6 2.6
Undecided 0.5 1.9 1.0 1.0Security of Tenure
Secure 95.7 98.1 96.4 96.4
Owned 77.9 63.9 89.7 79.3
Family Owned 3.0 1.9 1.6
Relation with Landlord 0.5 2.9 0.5 1.0
Know Influential People 1.5 8.6 2.5
Defend Ownership 16.6 22.9 7.1 14.3
Paid Change Of O/ship 1.1 0.4
If Secure: Reason for Security
Other 0.5 1.6 0.8
No Leaders 15.4 8.4 16.1 14.2
Best Interests of Comm. 27.4 37.4 20.3 26.8
Did Not Do Much 29.3 45.8 28.6 32.5
Community Leaders: Do they act in best
interests of community?
Don't Know 27.9 8.4 32.3 25.4
Distant 13.5 8.4 14.7 12.9
Undecided 13.9 5.6 35.8 20.4
Feeling of Togetherness in
Community Close 72.6 86.0 49.5 66.7
Refusal 1.0 0.4
Trust 76.9 48.6 35.4 55.2Perception of Trust in
CommunityLittle Trust 22.1 51.4 64.6 44.4
Lend Money 3.9 16.7 4.7
Borrow Money 1.9 7.8 22.7 8.0
Look After Children 9.4 9.8 12.1 10.1
Small Tasks 70.4 72.5 31.8 61.6
Store Credit 0.6 0.4
Transport in Crisis 3.1 4.5 2.9
Other 14.5 5.9 12.1 12.4
Help received in Community
Refusal 1.5 0.6
Move to Family/Friends 10.2 13.1 2.6 7.9
Squat 1.5 2.8 4.1 2.8
Rent 3.9 7.5 3.6 4.5
Rebuild 65.0 57.9 80.8 69.6
Buy New 15.5 9.3 5.2 10.3
Risk Management:
Where to go if dwelling is lost through disaster
Other 2.4 9.3 3.6 4.3
Don’t Know 0.8 0.3
Insurance 81.5 37.7 87.5 76.4
Loan: Bank 6.9 27.9 5.3 9.9
Loan: Family 0.8 1.6 0.7 0.9
Microlender 1.6 0.3
Risk management: If Rebuilt, how will you
finance?
Mashonisas 0.8 0.3

Workings of Township Property Markets: Phase 3: Cape Town Metro Findings
Shisaka Development Management Services (Pty) Ltd. Page 38
Johannes-burg
Durban Cape Town Total
Employer 3.3 0.7 0.9
Savings 5.4 27.9 5.9 9.6
Other 3.8 1.5
Will SELL 21.4 21.4 45.8 32.7Willingness to Sell
Never SELL 78.6 78.6 54.2 67.3