Embed Size (px)
Citation preview
Workplace Engagement, Well-Being and Alumni AttachmentHow Gallup Assesses the Outcomes of University Graduates CAPELLA UNIVERSITY 2016
COPYRIGHT AND TRADEMARK STANDARDS
This document contains proprietary research, copyrighted materials and literary property of Gallup, Inc. It is for your guidance only and is not to be copied, quoted, published or divulged to others. All of Gallup, Inc.’s content, unless otherwise noted, is protected by copyright © 2016. All rights reserved. This document is of great value to Gallup, Inc. Accordingly, international and domestic laws and penalties guaranteeing patent, copyright, trademark and trade secret protection safeguard the ideas, concepts and recommendations related within this document.
No changes may be made to this document without the express written permission of Gallup, Inc.
Gallup®, Gallup Panel™, Gallup-Healthways Well-Being Index® and Gallup-Healthways Well-Being 5 View™ are trademarks of Gallup, Inc. All rights reserved. All other trademarks and copyrights are the property of their respective owners.
Workplace Engagement, Well-Being and Alumni Attachment: Capella University 2016
Contents
Introduction 1
Workplace Engagement 2
Well-Being 3
Alumni Attachment 4
National Comparisons 5
Some of Gallup’s Most Important Findings 6
Capella Alumni Workplace Engagement 10
Capella Alumni Well-Being 15
Capella Alumni Attachment 19
Methodology 28
About 30

1Copyright © 2016 Gallup, Inc. All rights reserved.
Workplace Engagement, Well-Being and Alumni Attachment: Capella University 2016
Introduction
FOR YEARS, THE VALUE OF a degree has been determined not by the most important outcomes of an education, but by the easiest outcomes to measure — namely, job and graduate school placement rates and alumni salaries (usually only from their first job out of college). While these metrics have some merit, they do not provide a holistic view of graduates’ lives. These outcomes do not reflect the missions of higher education institutions and they do not reflect the myriad reasons why students go to college.
Together, Gallup and Purdue University created an index that examines the long-term success of graduates as they pursue a good job and a better life. This index — the Gallup-Purdue Index — provides insight into the relationship between the college experience and long-term outcomes in various areas. This report explores the relationship between Capella University graduates’ experiences and long-term outcomes based on their responses to the Capella University outcomes survey.
CAPELLA UNIVERSITY COMMISSIONED AND PAID for Gallup’s survey of Capella’s alumni population, and for Gallup’s preparation of this report. Capella also participated in the drafting of this report.
2Copyright © 2016 Gallup, Inc. All rights reserved.
Workplace Engagement, Well-Being and Alumni Attachment: Capella University 2016
Workplace Engagement
WORKPLACE ENGAGEMENT IS MORE NUANCED than simple job satisfaction. It involves employees being intellectually and emotionally connected with their organizations and work teams because they are able to do what they’re best at, they like what they do at work and they have someone at work who cares about their development.
Gallup’s expertise in engagement in the workplace is rooted in more than 30 years of research on the 12 elements that best predict employee and workgroup performance. Based on responses to questions that measure the 12 elements, Gallup categorizes workers as engaged, not engaged or actively disengaged. People who are engaged at work are more involved in and enthusiastic about their work. They are loyal and productive. Those who are not engaged may be productive and satisfied with their workplaces, but they are not intellectually and emotionally connected to them. Workers who are actively disengaged are physically present but intellectually and emotionally disconnected. They are unhappy with their work, share their unhappiness with their colleagues and are likely to jeopardize the performance of their teams.
Recent Gallup research shows that only 30% of Americans are engaged in their jobs, meaning U.S. workplaces are missing significant opportunities to raise their employees’ productivity and well-being and the potential economic benefits from doing this.
3Copyright © 2016 Gallup, Inc. All rights reserved.
Workplace Engagement, Well-Being and Alumni Attachment: Capella University 2016
Well-Being
WELL-BEING IS NOT ONLY ABOUT being happy or wealthy, nor is it only synonymous with physical health. Rather, it is about the interaction and interdependency between many aspects of life, such as finding fulfillment in daily work and interactions, having strong social relationships and access to the resources people need, feeling financially secure, being physically healthy and taking part in a true community.
Gallup and Healthways developed the Gallup-Healthways Well-Being 5 View to measure these important aspects. This survey, based on findings from the Gallup-Healthways Well-Being Index and years of joint research, asks 10 questions that gauge well-being in five elements:
Purpose Well-Being: Liking what you do each day and being motivated to achieve your goals
Social Well-Being: Having strong and supportive relationships and love in your life
Financial Well-Being: Effectively managing your economic life to reduce stress and increase security
Community Well-Being: The sense of engagement you have with the area where you live, liking where you live and feeling safe and having pride in your community
Physical Well-Being: Having good health and enough energy to get things done on a daily basis
BASED ON PEOPLE’S RESPONSES, GALLUP categorizes their well-being in each of the elements as “thriving,” “struggling” and “suffering.” Those who are thriving are strong, consistent and progressing, while those who are struggling are moderate or inconsistent. Those who are suffering are at high risk.
Understanding how people think about and experience their lives is one of the first steps in determining the appropriate interventions organizations, communities and institutions of higher education need to take to solve their biggest challenges. This research can provide colleges and universities with insight on how to improve the lives of current graduates in these key areas that are within their control.
4Copyright © 2016 Gallup, Inc. All rights reserved.
Workplace Engagement, Well-Being and Alumni Attachment: Capella University 2016
Alumni Attachment
THE GALLUP-PURDUE INDEX UNCOVERS WHICH college experiences and perceptions are related to greater gains in the workplace and in well-being.
Gallup’s research across hundreds of organizations in many industries shows that fully engaged customers buy more and stay with companies longer than average customers — in good economic times and in bad.
The Gallup-Purdue Index measures graduates’ current emotional attachment to their alma mater by adapting Gallup’s research on customer engagement to assess graduates’ perceptions of their colleges — retrospectively concerning their undergraduate and postgraduate experiences and currently as alumni.
Because students spend significant resources preparing for life outside of college, it is crucial to gauge whether the experiences they had in college have promoted a well-lived life. This includes whether they perceive that their college was a great fit for them, that they had professors who cared about them and made them excited about learning and, most importantly, that their school prepared them well for life outside of college.
The Gallup-Purdue Index attempts to uncover which college experiences and perceptions are related to more positive and engaging work lives and higher levels of overall well-being.

Workplace Engagement, Well-Being and Alumni Attachment: Capella University 2016
5Copyright © 2016 Gallup, Inc. All rights reserved.
National Comparisons
THROUGHOUT THIS REPORT, GALLUP COMPARES data collected from the Capella alumni who participated in the Gallup survey with data from graduates from other colleges and universities nationally. Gallup describes data across these groups as “similar to,” “on par with” or “the same as” one another in cases where there are no differences between the estimates or the differences between the estimates are not sufficient enough to be statistically significant. In cases where estimates are described as “higher” or “more likely” or “less likely” or “lower” than other estimates, Gallup has tested for statistical significance to ensure differences are meaningful.
Capella undergraduate alumni are compared with undergraduate alumni nationally who were 25 years old or older at graduation. The Capella undergraduate alumni are compared with undergraduate alumni who obtained their degrees from private for-profit, private not-for-profit or public colleges nationally.
Capella postgraduate alumni (those who received a master’s or doctoral degree from Capella) are compared with postgraduate alumni nationally who were 25 years old or older at graduation. Due to small sample sizes, postgraduate alumni results are not available by school type and results reflect all postgraduate alumni who obtained their degrees from private for-profit, private not-for-profit and public colleges nationally. Capella alumni who completed a master’s degree are compared with other national master’s degree holders and Capella alumni who completed doctoral degrees are compared with other national doctoral degree holders.
Capella Undergraduate Alumni (Bachelor’s Degree)
Capella Master’s Degree Alumni
Capella Doctoral Degree Alumni
National Public
University
Undergraduate
Alumni
National Private
Not-For-Profit
University
Undergraduate
Alumni
National Private
For-Profit
University
Undergraduate
Alumni
National Master’s
Degree Alumni
National Doctoral
Degree Alumni

6Copyright © 2016 Gallup, Inc. All rights reserved.
Workplace Engagement, Well-Being and Alumni Attachment: Capella University 2016
Some of Gallup’s Most Important Findings
Background
• Capella University was founded in 1993 and offers online bachelor’s, masters and doctoral degrees and certificate programs. As of July 31st, 2016, more than 70% of the students were enrolled in graduate programs. Capella University’s programs are designed to meet the needs of busy, working professionals and aim to provide innovative solutions for adult learners. The programs are intended to provide the critical skills, knowledge, theories and abilities — or competencies — required to master the subject matter of each degree program. This competency-based education aims to enable students to succeed in their fields.
• Capella’s mission is to extend access to high-quality degree programs for adults who seek to maximize their personal and professional potential. Capella learners are diverse and come from a wide variety of backgrounds. Capella offers a range of program options and services to support them in successful degree completion and the attainment of their professional goals.
• The findings presented in this report are based on the responses of the Capella alumni who participated in the Gallup survey.
Work Engagement
• The percentage of Capella undergraduates who report being employed full time for an employer is similar to the proportion reported by alumni from private not-for-profit institutions (74% vs. 71%, respectively) and higher than that reported by alumni from public and private for-profit institutions (both 66%). Capella undergraduates are also more likely to meet Gallup’s definition of workplace engagement — 42% are engaged, compared with 36% of private non-profit institution alumni.
• Capella alumni who hold postgraduate degrees (master’s and doctoral degrees) report having lower levels of full-time employment than reported by postgraduate alumni nationally (71% vs. 79% for master’s degree alumni and 72% vs. 82% for doctoral

7Copyright © 2016 Gallup, Inc. All rights reserved.
Workplace Engagement, Well-Being and Alumni Attachment: Capella University 2016
degree alumni). A similar percentage of Capella postgraduate alumni meet Gallup’s definition of being engaged at work compared with postgraduates nationally (43% vs. 41% for master’s degree alumni and 47% vs. 45% for doctoral degree alumni).
Well-Being • Of Capella undergraduate alumni, 84% say they are satisfied with their personal lives
today, a greater percentage than alumni from public and private for-profit institutions (79% and 74%, respectively) and similar to private not-for-profit alumni (81%).
• Ten percent of Capella undergraduate alumni are thriving in all five of Gallup’s elements of well-being — purpose, social, financial, community and physical. This is greater than the percentages of national undergraduates from public institutions and private for-profit institutions (both 4%) and similar to not-for-profit alumni (7%).
• Eighty-four percent of Capella master’s degree alumni and 90% of doctoral degree alumni say they are satisfied with their personal lives today, lower than master’s degree holders nationally (88%) and similar to the percentages of doctoral degree holders nationally (90%).
• Capella master’s degree alumni are as likely to be thriving in all five of Gallup’s measures of well-being as other master’s degree alumni nationally (8% vs. 10%, respectively) while doctoral degree alumni are more likely to be thriving in all five of Gallup’s measures of well-being as other doctoral degree alumni nationally (17% vs. 12%, respectively).
Alumni Attachment
• Both undergraduate and postgraduate alumni of Capella are more likely than other alumni nationally to agree that their school was the perfect school for people like them. This finding is interesting in light of how different the Capella experience is from a traditional classroom setting.
• In addition, Capella undergraduate alumni are more likely than private for-profit alumni to strongly agree that they can’t imagine a world without their university (22% vs. 12%, respectively). Postgraduate Capella alumni have similar levels of agreement with alumni nationally that they can’t imagine a world without their university.
• Capella undergraduate alumni have higher levels of attachment, as defined by Gallup, to their alma mater, than alumni from public and private for-profit institutions (22% vs. 15% and 12%, respectively) and they are similar in this regard to graduates of private not-for-profit institutions (18%). Capella master’s degree alumni have higher levels of attachment and doctoral degree holders have similar levels of attachment as alumni nationally (20% vs. 14% for master’s degree alumni and 18% vs. 15% for doctoral degree alumni).
• Capella undergraduate alumni and private not-for-profit institution alumni are on par
8Copyright © 2016 Gallup, Inc. All rights reserved.
Workplace Engagement, Well-Being and Alumni Attachment: Capella University 2016
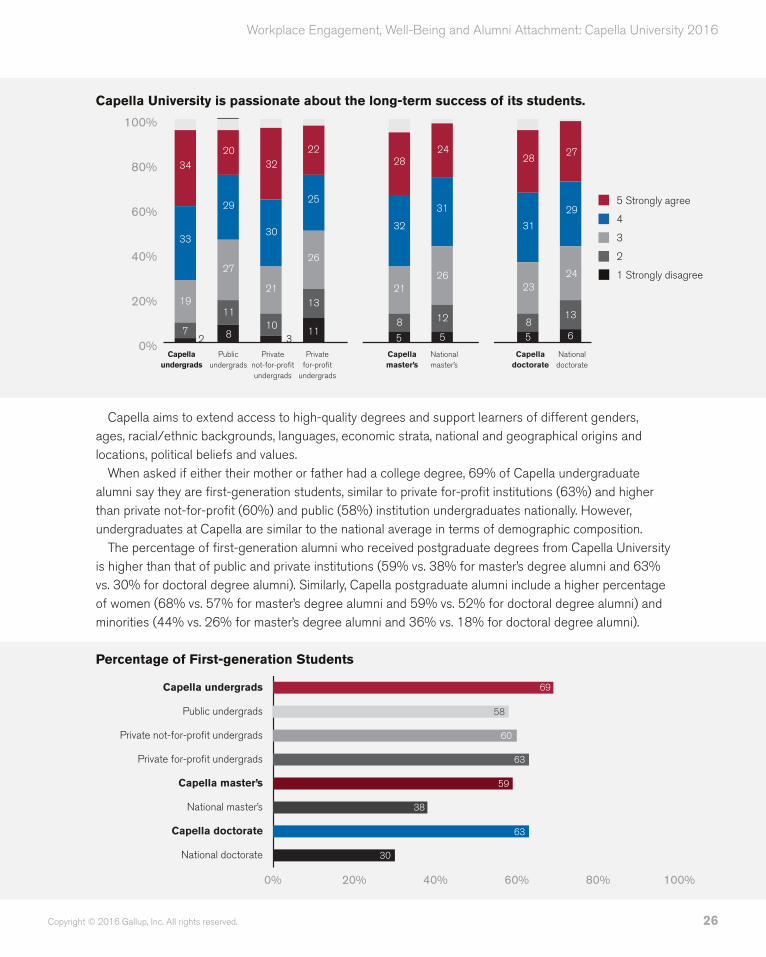
regarding whether they strongly agree that their university prepared them well for life outside of college (24% vs. 25%, respectively), but Capella undergraduate alumni are more likely than undergraduate alumni from public (20%) and private for-profit (20%) institutions to strongly agree that the school prepared them well for life outside of college. Capella undergraduate alumni are also more likely to strongly agree that their university is passionate about the long-term success of its students than are public and private for-profit alumni (34% vs. 20% and 22%, respectively), and they are similar to private not-for-profit alumni (32%) in this regard.
• Postgraduate alumni from Capella are similar to postgraduate alumni nationally in terms of strongly agreeing that their university prepared them well for life outside of college (25% vs. 27% for master’s degree alumni and 31% vs. 30% for doctoral degree alumni). Capella postgraduate alumni are also similar to postgraduate alumni nationally in terms of strongly agreeing that their university is passionate about the long-term success of its students (28% vs. 24% for master’s degree alumni and 28% vs. 27% for doctoral degree alumni).
• Capella’s degree programs are online and therefore offer a different experience to alumni than a traditional classroom setting. It is interesting to note that more than a quarter of combined bachelor’s, master’s and doctoral degree alumni (27%) strongly agree that their professors cared about them as people and more than half (58%) strongly agree that they had at least one professor who made them excited about learning. Undergraduate alumni from Capella are less likely than private not-for-profit institution alumni to strongly agree that their professors cared about them as people (25% vs. 35%, respectively), but similar to public institution graduates (27%) and private for-profit alumni (20%). Capella undergraduate alumni are similar to private for-profit alumni in terms of strongly agreeing that they had at least one professor who made them excited about learning (51% vs. 55%, respectively) but are less likely than public and private not-for-profit alumni to strongly agree (66% and 61%, respectively).
• Capella postgraduates are less likely than postgraduate alumni nationally to strongly agree that their professors cared about them as people (25% vs. 30% for master’s degree alumni and 33% vs. 39% for doctoral degree alumni). Capella master’s degree alumni (52%) are also less likely than master’s alumni from other institutions nationally (61%) to strongly agree they had at least one professor who made them excited about learning while doctoral alumni are level with alumni nationally (both 70%).
• Overall, Capella bachelor’s degree alumni are similar to other alumni nationally in terms of the percentage of first-generation students1, women and minorities. However, Capella master’s and doctoral degree alumni, who as of July 31st, 2016, comprise more than 70% of the students, are more likely to be first-generation students, women and minorities.
1 Neither of the student’s parents was a college graduate.
9Copyright © 2016 Gallup, Inc. All rights reserved.
Workplace Engagement, Well-Being and Alumni Attachment: Capella University 2016
CAPELLA ALUMNI HAVE UNIQUE CHARACTERISTICS compared with the average college graduate. Many are working adults while enrolled, they are more likely to be first-generation students and they include a greater percentage of women and minorities than alumni from other institutions nationally.
Capella alumni are overall as likely as other alumni nationally to report being engaged at work. They also are as likely overall to be thriving in all five of Gallup’s elements of well-being as well as to report being satisfied with their personal lives today.
In addition, Capella alumni are more likely than other alumni nationally to strongly agree that their school was the perfect school for people like them. They are also overall as likely as other alumni nationally to strongly agree that their university prepared them well for life outside of college.
Given Capella University’s commitment to extend access to quality degrees and the fact that the programs are online, these findings provide valuable insight into the opinions of nontraditional students who obtain degrees outside of a traditional classroom setting.

10Copyright © 2016 Gallup, Inc. All rights reserved.
Workplace Engagement, Well-Being and Alumni Attachment: Capella University 2016
Capella Alumni Workplace Engagement
IF EMPLOYEES MEET GALLUP’S DEFINITION of workplace engagement, research shows they are more likely to be loyal and productive in the workplace, as well as more likely to report high levels of overall well-being. Gallup workplace engagement studies show that business or work units that score in the top half of their organizations in engagement have nearly double the odds of success (based on a composite of financial, customer retention, safety, quality, shrinkage and absenteeism metrics) compared with those in the bottom half.
With regards to these measures of workplace engagement, while undergraduate alumni from Capella University have similar or higher rates of full-time employment for an employer when compared with alumni nationally, they are more likely than private not-for-profit undergraduates to be engaged at work. Postgraduate Capella alumni have lower levels of full-time employment compared with other postgraduate alumni nationally, but they are also as likely as alumni from other institutions to indicate they are engaged at work.
11Copyright © 2016 Gallup, Inc. All rights reserved.
Workplace Engagement, Well-Being and Alumni Attachment: Capella University 2016
Undergraduate Alumni Employment
0% 20% 40% 60% 80% 100%
9
11
11
11
5
6
7
4
6
10
6
6
6
4
7
2
3
3
4
3
71
66
66
74
0% 20% 40% 60% 80% 100%
16
16
13
49
45
36 49
36
42
38
Alumni Employment
Alumni Workplace Engagement
Capella undergrads
Public undergrads
Private not-for-profit undergrads
Private for-profit undergrads
Note: This data on employment does not measure whether students receive jobs because of their Capella degree.
Undergraduate Alumni Workplace Engagement
0% 20% 40% 60% 80% 100%
9
11
11
11
5
6
7
4
6
10
6
6
6
4
7
2
3
3
4
3
71
66
66
74
0% 20% 40% 60% 80% 100%
16
16
13
49
45
36 49
36
42
38
Alumni Employment
Alumni Workplace Engagement
Capella undergrads
Public undergrads
Private not-for-profit undergrads
Engaged Not Engaged Actively Disengaged
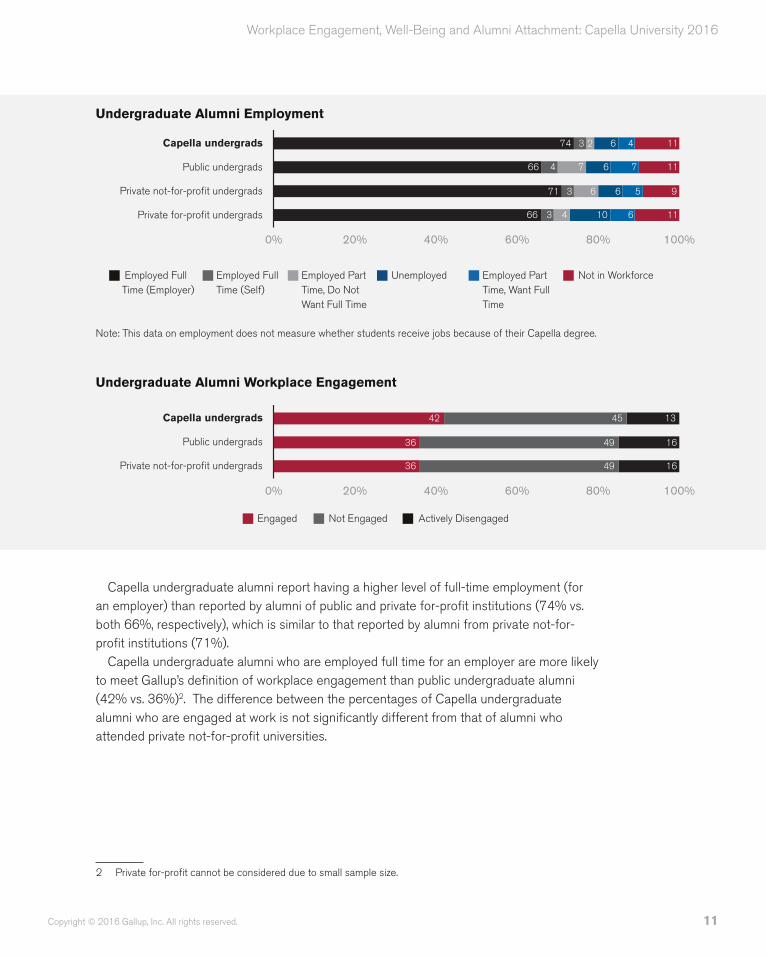
Capella undergraduate alumni report having a higher level of full-time employment (for an employer) than reported by alumni of public and private for-profit institutions (74% vs. both 66%, respectively), which is similar to that reported by alumni from private not-for-profit institutions (71%).
Capella undergraduate alumni who are employed full time for an employer are more likely to meet Gallup’s definition of workplace engagement than public undergraduate alumni (42% vs. 36%)2. The difference between the percentages of Capella undergraduate alumni who are engaged at work is not significantly different from that of alumni who attended private not-for-profit universities.
2 Private for-profit cannot be considered due to small sample size.
Employed Full Time (Employer)
Employed Full Time (Self)
Employed Part Time, Do Not Want Full Time
Unemployed Employed Part Time, Want Full Time
Not in Workforce
12Copyright © 2016 Gallup, Inc. All rights reserved.
Workplace Engagement, Well-Being and Alumni Attachment: Capella University 2016
Postgraduate Alumni Employment
0% 20% 40% 60% 80% 100%
7
6
10
8
7
4
6
4
4
2
7
2
7
3
3
6
4
2
3
1
72
82
71
79
0% 20% 40% 60% 80% 100%
12
9
11
45
48
47 41
45
41
134443
38
Alumni Employment
Alumni Workplace Engagement
Capella master’s
National master’s
Capella doctorate
National doctorate
Note: This data on employment does not measure whether students receive jobs because of their Capella degree.
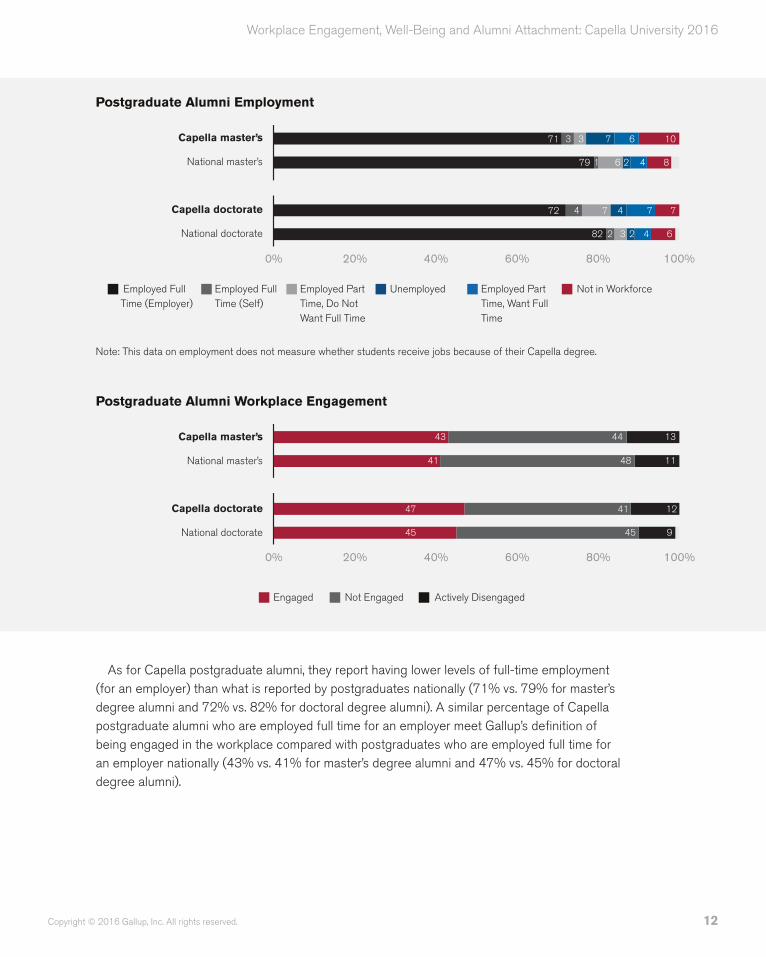
As for Capella postgraduate alumni, they report having lower levels of full-time employment (for an employer) than what is reported by postgraduates nationally (71% vs. 79% for master’s degree alumni and 72% vs. 82% for doctoral degree alumni). A similar percentage of Capella postgraduate alumni who are employed full time for an employer meet Gallup’s definition of being engaged in the workplace compared with postgraduates who are employed full time for an employer nationally (43% vs. 41% for master’s degree alumni and 47% vs. 45% for doctoral degree alumni).
Postgraduate Alumni Workplace Engagement
0% 20% 40% 60% 80% 100%
7
6
10
8
7
4
6
4
4
2
7
2
7
3
3
6
4
2
3
1
72
82
71
79
0% 20% 40% 60% 80% 100%
12
9
11
45
48
47 41
45
41
134443
38
Alumni Employment
Alumni Workplace Engagement
Capella master’s
National master’s
Capella doctorate
National doctorate
Engaged Not Engaged Actively Disengaged
Employed Full Time (Employer)
Employed Full Time (Self)
Employed Part Time, Do Not Want Full Time
Unemployed Employed Part Time, Want Full Time
Not in Workforce

13Copyright © 2016 Gallup, Inc. All rights reserved.
Workplace Engagement, Well-Being and Alumni Attachment: Capella University 2016
How satisfied are you with
your organization as a
place to work?
I am deeply interested in
the work that I do.
My job gives me the
opportunity to do work
that interests me.
I have the ideal job for me.
Capella undergrads
Public undergrads
Private not-for-profit
undergrads
Private for-profit
undergrads
Capella undergrads
Public undergrads
Private not-for-profit
undergrads
Private for-profit
undergrads
Capella undergrads
Public undergrads
Private not-for-profit
undergrads
Private for-profit
undergrads
Capella undergrads
Public undergrads
Private not-for-profit
undergrads
Private for-profit
undergrads
5 Strongly agree
4
3
2
1 Strongly disagree
5 Strongly agree
4
3
2
1 Strongly disagree
5 Strongly agree
4
3
2
1 Strongly disagree
5 Very satisfied
4
3
2
1 Not at all satisfied
Twenty-eight percent of Capella undergraduate alumni report being extremely satisfied with their organization as a place to work. The percentages of Capella undergraduate alumni who strongly agree they are deeply interested in the work that they do (43%) and that their jobs give them the opportunity to do work that interests them (39%) are similar to other undergraduate alumni nationally across all comparison groups. Capella undergraduates are also similar to all comparison groups in terms of strongly agreeing that they have the ideal job for them (24%).
Forty-six percent of undergraduate Capella alumni, when asked if their current work is completely related, somewhat related or not at all related to their degree from Capella University, report that it is completely related. This is higher than the percentage of public institution graduates who say the same (37%) and similar to private not-for-profit alumni (41%) and private for-profit alumni (40%).
46% of Capella alumni report that their current work is completely related to their degree
0%
20%
40%
60%
80%
100%
68
20
39
28
411
23
35
23
61118
43
23
611
22
38
22
0%
20%
40%
60%
80%
100%
4612
33
43
78
18
26
39
4618
30
42
99
13
31
37
0%
20%
40%
60%
80%
100%
65
15
33
39
98
16
26
39
47
18
31
39
97
19
30
35
0%
20%
40%
60%
80%
100%
1111
22
29
24
1610
21
27
23
611
18
43
23
611
22
38
22
0%
20%
40%
60%
80%
100%
68
20
39
28
411
23
35
23
61118
43
23
611
22
38
22
0%
20%
40%
60%
80%
100%
4612
33
43
78
18
26
39
4618
30
42
99
13
31
37
0%
20%
40%
60%
80%
100%
65
15
33
39
98
16
26
39
47
18
31
39
97
19
30
35
0%
20%
40%
60%
80%
100%
1111
22
29
24
1610
21
27
23
611
18
43
23
611
22
38
22
0%
20%
40%
60%
80%
100%
68
20
39
28
411
23
35
23
61118
43
23
611
22
38
22
0%
20%
40%
60%
80%
100%
4612
33
43
78
18
26
39
4618
30
42
99
13
31
37
0%
20%
40%
60%
80%
100%
65
15
33
39
98
16
26
39
47
18
31
39
97
19
30
35
0%
20%
40%
60%
80%
100%
1111
22
29
24
1610
21
27
23
611
18
43
23
611
22
38
22
0%
20%
40%
60%
80%
100%
68
20
39
28
411
23
35
23
61118
43
23
611
22
38
22
0%
20%
40%
60%
80%
100%
4612
33
43
78
18
26
39
4618
30
42
99
13
31
37
0%
20%
40%
60%
80%
100%
65
15
33
39
98
16
26
39
47
18
31
39
97
19
30
35
0%
20%
40%
60%
80%
100%
1111
22
29
24
1610
21
27
23
611
18
43
23
611
22
38
22
14Copyright © 2016 Gallup, Inc. All rights reserved.
Workplace Engagement, Well-Being and Alumni Attachment: Capella University 2016
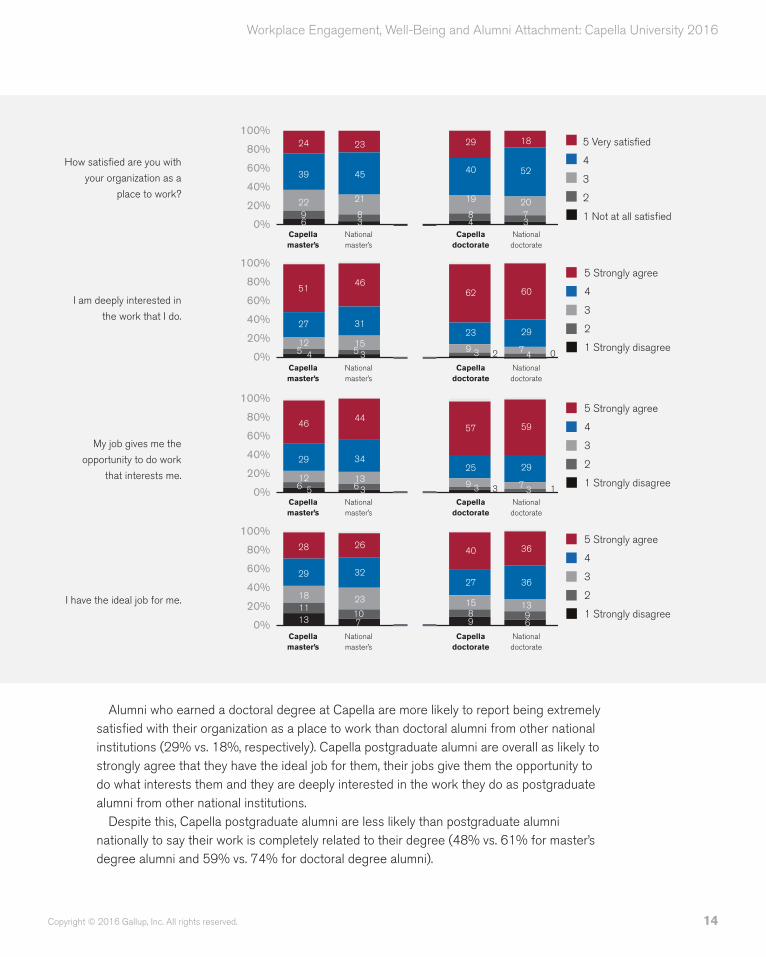
Alumni who earned a doctoral degree at Capella are more likely to report being extremely satisfied with their organization as a place to work than doctoral alumni from other national institutions (29% vs. 18%, respectively). Capella postgraduate alumni are overall as likely to strongly agree that they have the ideal job for them, their jobs give them the opportunity to do what interests them and they are deeply interested in the work they do as postgraduate alumni from other national institutions.
Despite this, Capella postgraduate alumni are less likely than postgraduate alumni nationally to say their work is completely related to their degree (48% vs. 61% for master’s degree alumni and 59% vs. 74% for doctoral degree alumni).
How satisfied are you with
your organization as a
place to work?
I am deeply interested in
the work that I do.
My job gives me the
opportunity to do work
that interests me.
I have the ideal job for me.
5 Strongly agree
4
3
2
1 Strongly disagree
5 Strongly agree
4
3
2
1 Strongly disagree
5 Strongly agree
4
3
2
1 Strongly disagree
5 Very satisfied
4
3
2
1 Not at all satisfied
Capella master’s
National master’s
Capella doctorate
National doctorate
Capella master’s
National master’s
Capella doctorate
National doctorate
Capella master’s
National master’s
Capella doctorate
National doctorate
Capella master’s
National master’s
Capella doctorate
National doctorate
0%
20%
40%
60%
80%
100%
69
22
39
24
38
21
45
23
37
20
52
18
48
19
40
29
0%
20%
40%
60%
80%
100%
45
12
27
51
3515
31
46
47
29
60
2 039
23
62
0%
20%
40%
60%
80%
100%
5612
29
46
3613
34
44
37
29
59
3 139
25
57
0%
20%
40%
60%
80%
100%
131118
29
28
710
23
32
26
913
36
36
9 68
15
27
40
0%
20%
40%
60%
80%
100%
69
22
39
24
38
21
45
23
37
20
52
18
48
19
40
29
0%
20%
40%
60%
80%
100%
45
12
27
51
3515
31
46
47
29
60
2 039
23
62
0%
20%
40%
60%
80%
100%
5612
29
46
3613
34
44
37
29
59
3 139
25
57
0%
20%
40%
60%
80%
100%
131118
29
28
710
23
32
26
913
36
36
9 68
15
27
40
0%
20%
40%
60%
80%
100%
69
22
39
24
38
21
45
23
37
20
52
18
48
19
40
29
0%
20%
40%
60%
80%
100%
45
12
27
51
3515
31
46
47
29
60
2 039
23
62
0%
20%
40%
60%
80%
100%
5612
29
46
3613
34
44
37
29
59
3 139
25
57
0%
20%
40%
60%
80%
100%
131118
29
28
710
23
32
26
913
36
36
9 68
15
27
40
0%
20%
40%
60%
80%
100%
69
22
39
24
38
21
45
23
37
20
52
18
48
19
40
29
0%
20%
40%
60%
80%
100%
45
12
27
51
3515
31
46
47
29
60
2 039
23
62
0%
20%
40%
60%
80%
100%
5612
29
46
3613
34
44
37
29
59
3 139
25
57
0%
20%
40%
60%
80%
100%
131118
29
28
710
23
32
26
913
36
36
9 68
15
27
40
15Copyright © 2016 Gallup, Inc. All rights reserved.
Workplace Engagement, Well-Being and Alumni Attachment: Capella University 2016
Capella Alumni Well-Being
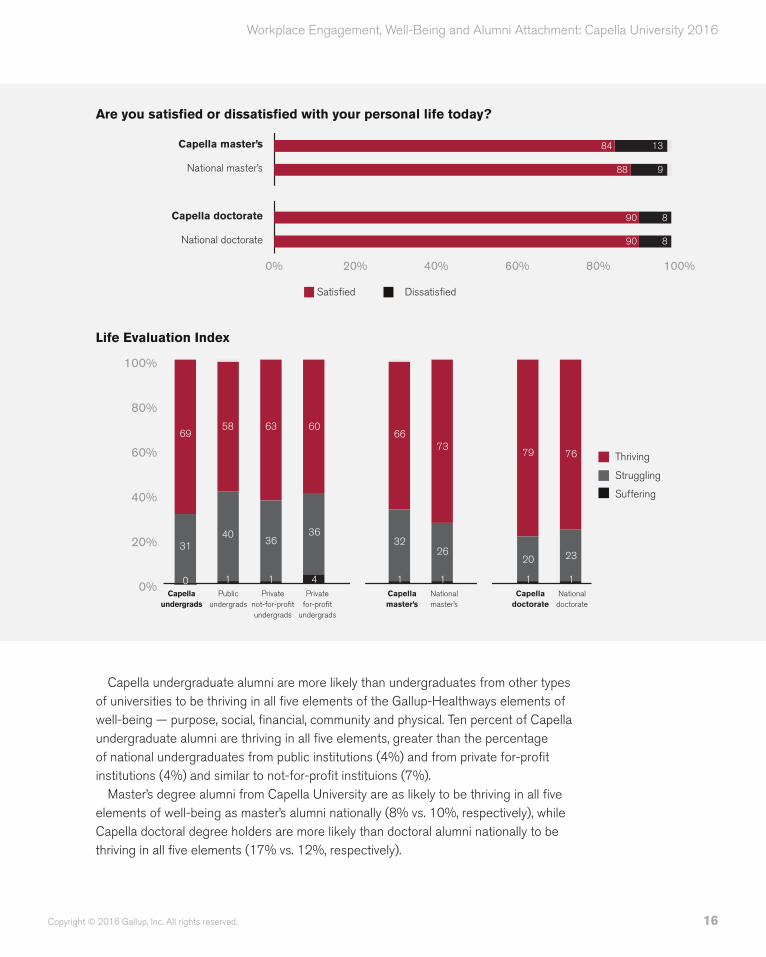
EIGHTY-FOUR PERCENT OF CAPELLA UNDERGRADUATE alumni report being satisfied with their personal lives today, a greater percentage than alumni from public and private for-profit institutions (79% and 74%, respectively) and similar to private not-for-profit alumni (81%). Eighty-four percent of Capella master’s degree alumni say they are satisfied with their personal lives today, slightly less than the percentage of master’s degree holders nationally (88%). Capella doctoral degree alumni are as likely as doctoral alumni nationally to say they are satisfied with their personal lives today (both 90%).
Based on Gallup’s Life Evaluation Index, which measures an individual’s evaluation of his or her present and future life and places him or her in one of three groups, alumni can be thriving, struggling or suffering. Sixty-nine percent of Capella bachelor’s degree alumni are thriving, which is a greater percentage than alumni from public, private for-profit and private not-for-profit institutions (58%, 60% and 63%, respectively). Sixty-six percent of Capella master’s degree alumni are thriving, a lower percentage than master’s alumni from other institutions (73%). Seventy-nine percent of Capella doctoral alumni are thriving, similar to doctoral degree holders nationally (76%).
Are you satisfied or dissatisfied with your personal life today?
0% 20% 40% 60% 80% 100%
16
21
16
74
79
1384
81
Are you satisfied or dissatisfied with your personal life today?
Capella undergrads
Public undergrads
Private not-for-profit undergrads
Private for-profit undergrads
Satisfied Dissatisfied
16Copyright © 2016 Gallup, Inc. All rights reserved.
Workplace Engagement, Well-Being and Alumni Attachment: Capella University 2016
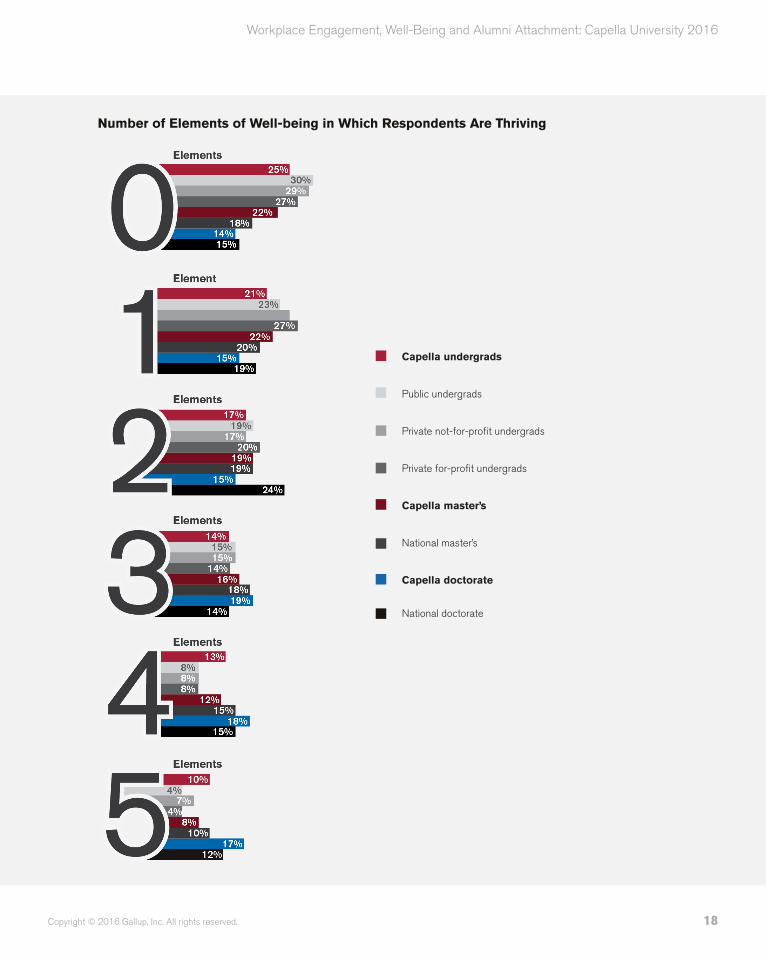
Capella undergraduate alumni are more likely than undergraduates from other types of universities to be thriving in all five elements of the Gallup-Healthways elements of well-being — purpose, social, financial, community and physical. Ten percent of Capella undergraduate alumni are thriving in all five elements, greater than the percentage of national undergraduates from public institutions (4%) and from private for-profit institutions (4%) and similar to not-for-profit instituions (7%).
Master’s degree alumni from Capella University are as likely to be thriving in all five elements of well-being as master’s alumni nationally (8% vs. 10%, respectively), while Capella doctoral degree holders are more likely than doctoral alumni nationally to be thriving in all five elements (17% vs. 12%, respectively).
Are you satisfied or dissatisfied with your personal life today?
0% 20% 40% 60% 80% 100%
8
8
9
90
88
1384
90
Are you satisfied or dissatisfied with your personal life today?
Capella master’s
National master’s
Capella doctorate
National doctorate
Satisfied Dissatisfied
Life Evaluation Index
Capella undergrads
Public undergrads
Private not-for-profit undergrads
Private for-profit
undergrads
Capella master’s
National master’s
Capella doctorate
National doctorate
0%
20%
40%
60%
80%
100%
73
26
1
66
32
1
63
36
1
60
36
4
76
23
1
79
20
1
69
31
0
58
40
1
Life Evaluation Index
Thriving
Struggling
Suffering

17Copyright © 2016 Gallup, Inc. All rights reserved.
Workplace Engagement, Well-Being and Alumni Attachment: Capella University 2016
Purpose
Financial
Community
Social
Physical
Suffering Struggling Thriving
Suffering Struggling Thriving
Suffering Struggling Thriving
Suffering Struggling Thriving
Suffering Struggling Thriving
Capella undergrads
Public undergrads
Private not-for-profit undergrads
Private for-profit undergrads
Capella master’s
National master’s
Capella doctorate
National doctorate
Capella undergrads
Public undergrads
Private not-for-profit undergrads
Private for-profit undergrads
Capella master’s
National master’s
Capella doctorate
National doctorate
Capella undergrads
Public undergrads
Private not-for-profit undergrads
Private for-profit undergrads
Capella master’s
National master’s
Capella doctorate
National doctorate
Capella undergrads
Public undergrads
Private not-for-profit undergrads
Private for-profit undergrads
Capella master’s
National master’s
Capella doctorate
National doctorate
Capella undergrads
Public undergrads
Private not-for-profit undergrads
Private for-profit undergrads
Capella master’s
National master’s
Capella doctorate
National doctorate
Purpose Well-Being: Liking what you do each day and
being motivated to achieve your goals
Social Well-Being: Having strong and supportive
relationships and love in your life
Financial Well-Being: Effectively managing your
economic life to reduce stress and increase security
Community Well-Being: The sense of engagement you
have with the area where you live, liking where you live and
feeling safe, and having pride in your community
Physical Well-Being: Having good health and enough
energy to get things done on a daily basis
18Copyright © 2016 Gallup, Inc. All rights reserved.
Workplace Engagement, Well-Being and Alumni Attachment: Capella University 2016
Number of Elements of Well-being in Which Respondents Are Thriving
Capella undergrads
Public undergrads
Private not-for-profit undergrads
Private for-profit undergrads
Capella master’s
National master’s
Capella doctorate
National doctorate

19Copyright © 2016 Gallup, Inc. All rights reserved.
Workplace Engagement, Well-Being and Alumni Attachment: Capella University 2016
Capella Alumni Attachment
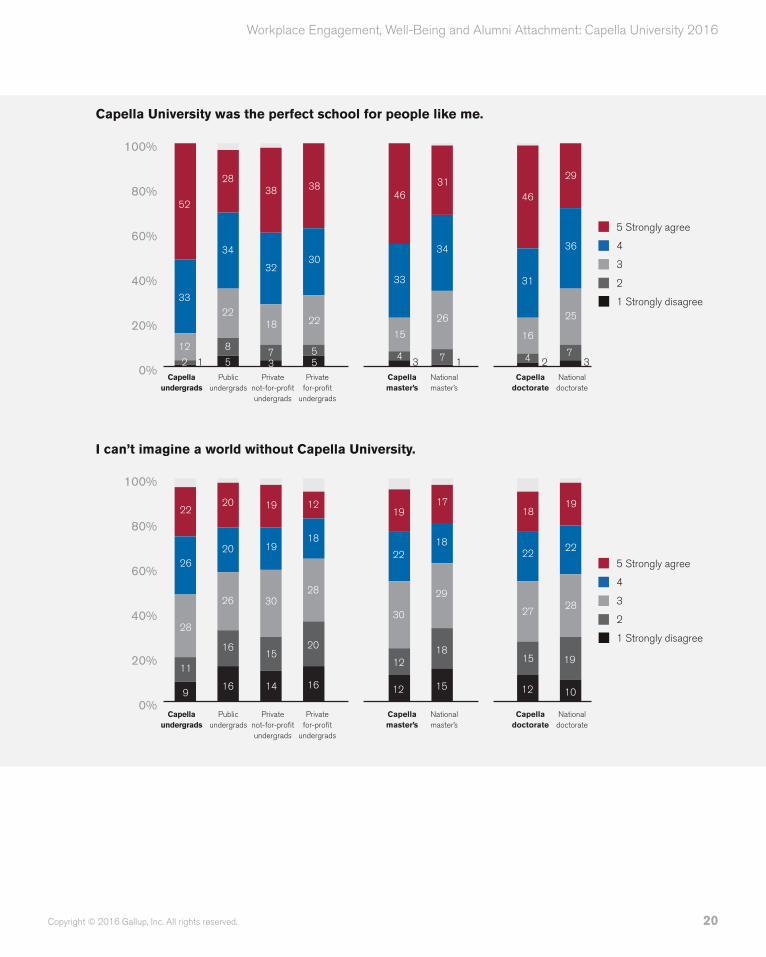
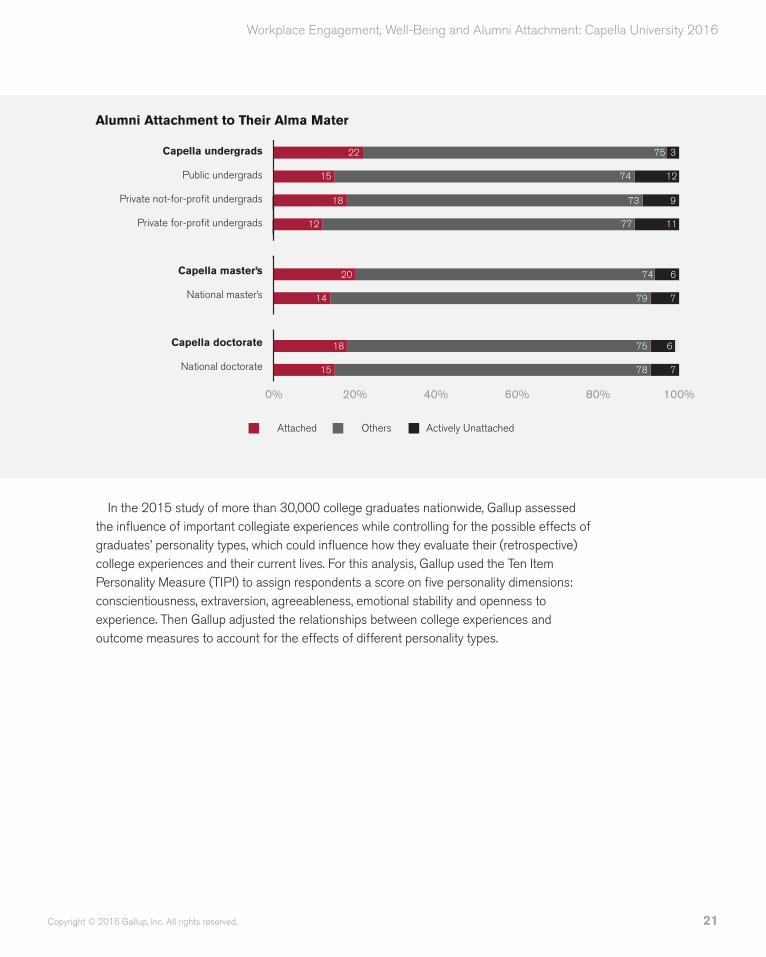
GALLUP EXPLORES THE CONNECTION BETWEEN alumni and their alma maters by looking at their level of agreement with two questions: “I can’t imagine a world without [College name]” and “[College name] was the perfect school for people like me.” Gallup defines graduates who strongly agree with both items as being “emotionally attached” to their alma mater.
Both undergraduate and postgraduate Capella alumni are more likely than undergraduate and postgraduate alumni nationally to strongly agree their university was the perfect school for people like them. The strong agreement to this statement observed among alumni is interesting considering how unique the Capella experience is. Capella degrees are obtained online and they are structured to meet the needs of working adults.
In addition, Capella undergraduate alumni are more likely than private for-profit undergraduate alumni to “strongly agree” that they can’t imagine a world without their university (22% vs. 12%, respectively). Postgraduate alumni have similar levels of agreement with postgraduate alumni nationally that they can’t imagine a world without their university.
Based on the level of agreement with these two statements, Capella undergraduate alumni have higher levels of emotional attachment to their alma mater (22%) than undergraduate alumni nationally from public (15%) and private for-profit (12%) institutions. Master’s degree alumni have higher levels of attachment to their alma mater than master’s alumni nationally (20% vs. 14%) and Capella doctoral alumni are similar to doctoral alumni nationally (18% vs. 15%, respectively).
20Copyright © 2016 Gallup, Inc. All rights reserved.
Workplace Engagement, Well-Being and Alumni Attachment: Capella University 2016
Capella University was the perfect school for people like me.
Capella undergrads
Public undergrads
Private not-for-profit undergrads
Private for-profit
undergrads
Capella master’s
National master’s
Capella doctorate
National doctorate
0%
20%
40%
60%
80%
100%
34
31
26
11 7
46
33
43
15
29
36
32
25
7
46
31
4
16
52
33
2
12
28
34
5
22
8
38
32
18
37
38
30
22
55
0%
20%
40%
60%
80%
100%
Q22 Capella University was the perfect school for people like me.
Q23 I can't imagine a world without Capella University.
18
17
29
15
18
19
22
12
12
30
19
22
1012
28
19
18
22
15
27
22
26
11
9
28
20
20
16
26
16
19
19
30
14
15
12
18
28
16
20
I can’t imagine a world without Capella University.
Capella undergrads
Public undergrads
Private not-for-profit undergrads
Private for-profit
undergrads
Capella master’s
National master’s
Capella doctorate
National doctorate
0%
20%
40%
60%
80%
100%
34
31
26
11 7
46
33
43
15
29
36
32
25
7
46
31
4
16
52
33
2
12
28
34
5
22
8
38
32
18
37
38
30
22
55
0%
20%
40%
60%
80%
100%
Q22 Capella University was the perfect school for people like me.
Q23 I can't imagine a world without Capella University.
18
17
29
15
18
19
22
12
12
30
19
22
1012
28
19
18
22
15
27
22
26
11
9
28
20
20
16
26
16
19
19
30
14
15
12
18
28
16
20
5 Strongly agree
4
3
2
1 Strongly disagree
5 Strongly agree
4
3
2
1 Strongly disagree
21Copyright © 2016 Gallup, Inc. All rights reserved.
Workplace Engagement, Well-Being and Alumni Attachment: Capella University 2016
In the 2015 study of more than 30,000 college graduates nationwide, Gallup assessed the influence of important collegiate experiences while controlling for the possible effects of graduates’ personality types, which could influence how they evaluate their (retrospective) college experiences and their current lives. For this analysis, Gallup used the Ten Item Personality Measure (TIPI) to assign respondents a score on five personality dimensions: conscientiousness, extraversion, agreeableness, emotional stability and openness to experience. Then Gallup adjusted the relationships between college experiences and outcome measures to account for the effects of different personality types.
Alumni Attachment to Their Alma Mater
9
11
12
77
74
375
73
0% 20% 40% 60% 80% 100%
Alumni Attachment to Their Alma Mater
779
674
778
675
12
15
22
18
14
20
15
18
Capella undergrads
Public undergrads
Private not-for-profit undergrads
Private for-profit undergrads
Capella master’s
National master’s
Capella doctorate
National doctorate
Attached Others Actively Unattached

22Copyright © 2016 Gallup, Inc. All rights reserved.
Workplace Engagement, Well-Being and Alumni Attachment: Capella University 2016
The tables show that, regardless of personality type, the odds that a given college graduate is engaged at work increase if he or she strongly agrees to having had certain critical college experiences. For example, if graduates strongly agree that professors cared about them as a person, they are 1.7 times more likely to be engaged in their current jobs than those who do not strongly agree. Strong agreement with this item also increases the odds that graduates are thriving in all five elements of well-being, after controlling for personality factors, by 1.4 times. If they strongly agree with this item, graduates are also 1.9 times more likely to say their education was worth the cost.
The odds of being engaged at work are:
The odds of thriving in all five elements of well-being are:
The odds of strongly agreeing education was worth the cost are:
1.7x Higher if ... My professors at Capella University cared about me as a person.
1.7x Higher if ... I had at least one professor at Capella University who made me excited about learning.
1.4x Higher if ... My professors at Capella University cared about me as a person.
1.4x Higher if ... I had at least one professor at Capella University who made me excited about learning.
1.9x Higher if ... My professors at Capella University cared about me as a person.
1.8x Higher if ... I had at least one professor at Capella University who made me excited about learning.
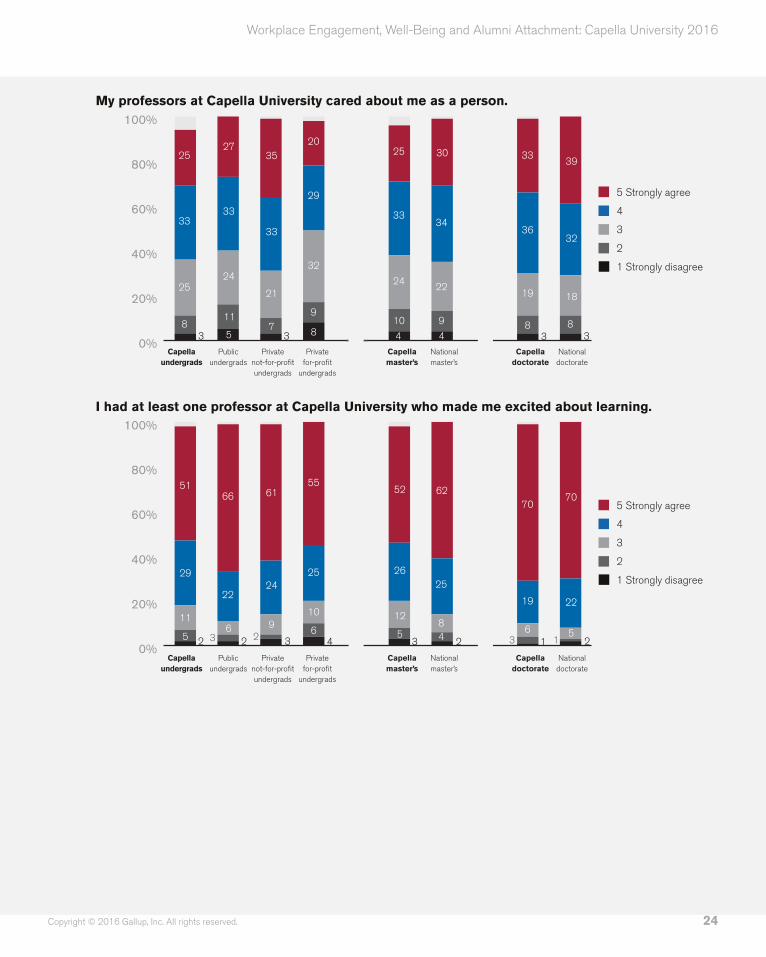
Given that Capella students’ experience at the university is online, it is interesting to note that more than a quarter of all alumni (27%) strongly agree that their professors cared about them as people and more than half (58%) strongly agree that they had at least one professor who made them excited about learning.
Undergraduate alumni from Capella, while less likely than private not-for-profit institution undergraduate alumni to strongly agree that their professors cared about them as people (25% vs. 35%, respectively), are similar to public institution graduates (27%) and private for-profit alumni (20%). Capella undergraduate alumni are similar to private for-profit undergraduate alumni in terms of strongly agreeing that they had at least one professor who made them excited about learning (51% vs. 55%, respectively) but are less likely than public and private not-for-profit alumni to strongly agree (66% and 61%, respectively).
Postgraduate alumni from Capella are less likely than postgraduate alumni nationally to strongly agree that their professors cared about them as people (25% vs. 30% for master’s degree alumni and 33% vs. 39% for doctoral degree alumni). Capella master’s alumni
23Copyright © 2016 Gallup, Inc. All rights reserved.
Workplace Engagement, Well-Being and Alumni Attachment: Capella University 2016
(52%) are also less likely than master’s alumni from other institutions nationally (62%) to strongly agree they had at least one professor who made them excited about learning, while doctoral alumni are level with doctoral alumni nationally (both 70%).
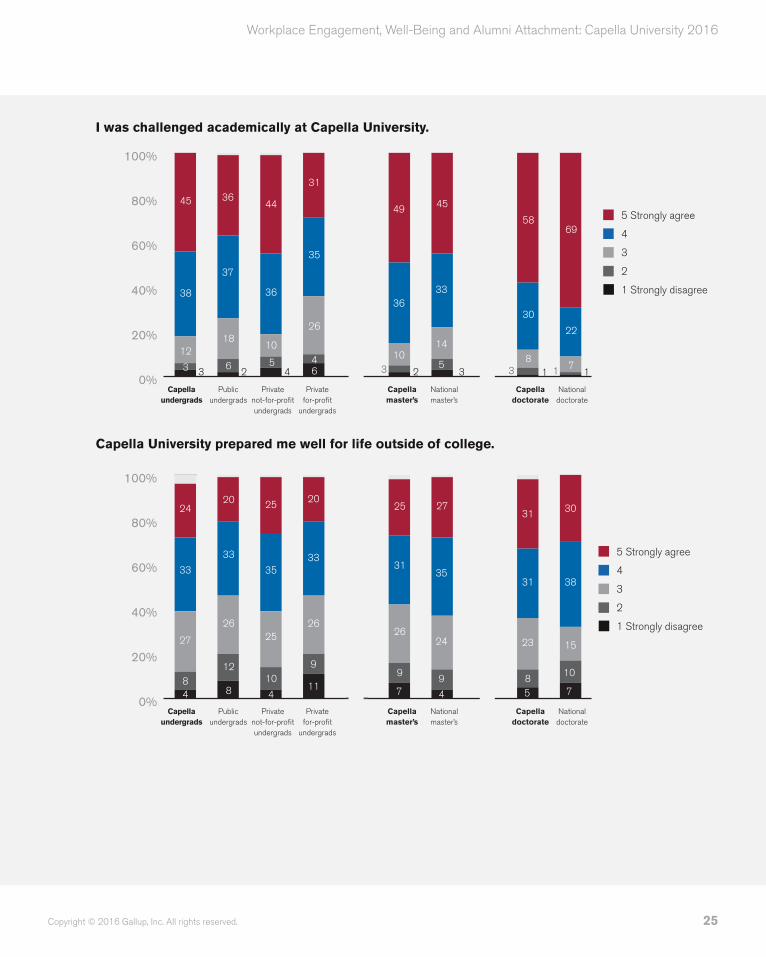
In addition, 45% of undergraduate alumni strongly agree that Capella challenged them academically. This is similar to undergraduate alumni from private not-for-profit institutions (44%) and higher than undergraduate alumni of public (36%) and private for-profit (31%) institutions. Capella master’s alumni are more likely than master’s alumni nationally to strongly agree they were challenged academically (49% vs. 45%, respectively), but doctoral alumni from Capella are less likely to strongly agree with this same statement than doctoral alumni nationally (58% vs. 69%, respectively).
Capella undergraduate alumni report having levels of strong agreement similar to undergraduates from private not-for-profit institutions regarding whether their university prepared them well for life outside of college (24% vs. 25%, respectively) and higher than undergraduate alumni from public and private for-profit institutions (both 20%). Postgraduate alumni from Capella are similar to postgraduate alumni nationally in terms of strongly agreeing their university prepared them well for life outside of college (25% vs. 27%, respectively, for master’s degree alumni and 31% vs. 30%, respectively, for doctoral degree alumni).
Capella undergraduate alumni are more likely than public and private for-profit undergraduate alumni to strongly agree that Capella is passionate about the long-term success of its students (34% vs. 20% and 22%, respectively), and they are similar to private not-for-profit undergraduate alumni (32%). Capella postgraduate alumni are similar to postgraduate alumni nationally in terms of strongly agreeing that their university is passionate about the long-term success of its students (28% vs. 24% for master’s degree alumni and 28% vs. 27% for doctoral degree alumni).
24Copyright © 2016 Gallup, Inc. All rights reserved.
Workplace Engagement, Well-Being and Alumni Attachment: Capella University 2016
My professors at Capella University cared about me as a person.
Capella undergrads
Public undergrads
Private not-for-profit undergrads
Private for-profit
undergrads
Capella master’s
National master’s
Capella doctorate
National doctorate
0%
20%
40%
60%
80%
100%
0%
20%
40%
60%
80%
100%
Q24 My professors at Capella University cared about me as a person.
Q25 I had at least one professor at Capella University who made me excited about learning.
Q31A I was challenged academically at Capella University.
0%
20%
40%
60%
80%
100%
33
45
14
35
49
36
3 2
10
69
22
171 1
58
30
38
45
38
3 3
12
36
2
37
18
6
44
36
10
45
31
35
26
64
25
62
8
24
52
26
53
12
70
22
15
1 2
70
19
336
51
29
5 2
11
66
2
22
6
61
24
9
32
55
25
10
46
34
30
22
4
9
25
33
10
4
24
39
32
3
18
83
33
36
8
19
25
33
83
25
27
33
5
24
11
35
33
21
37
20
29
32
8
9
I had at least one professor at Capella University who made me excited about learning.
Capella undergrads
Public undergrads
Private not-for-profit undergrads
Private for-profit
undergrads
Capella master’s
National master’s
Capella doctorate
National doctorate
0%
20%
40%
60%
80%
100%
0%
20%
40%
60%
80%
100%
Q24 My professors at Capella University cared about me as a person.
Q25 I had at least one professor at Capella University who made me excited about learning.
Q31A I was challenged academically at Capella University.
0%
20%
40%
60%
80%
100%
33
45
14
35
49
36
3 2
10
69
22
171 1
58
30
38
45
38
3 3
12
36
2
37
18
6
44
36
10
45
31
35
26
64
25
62
8
24
52
26
53
12
70
22
15
1 2
70
19
336
51
29
5 2
11
66
2
22
6
61
24
9
32
55
25
10
46
34
30
22
4
9
25
33
10
4
24
39
32
3
18
83
33
36
8
19
25
33
83
25
27
33
5
24
11
35
33
21
37
20
29
32
8
9
5 Strongly agree
4
3
2
1 Strongly disagree
5 Strongly agree
4
3
2
1 Strongly disagree
25Copyright © 2016 Gallup, Inc. All rights reserved.
Workplace Engagement, Well-Being and Alumni Attachment: Capella University 2016
5 Strongly agree
4
3
2
1 Strongly disagree
I was challenged academically at Capella University.
Capella undergrads
Public undergrads
Private not-for-profit undergrads
Private for-profit
undergrads
Capella master’s
National master’s
Capella doctorate
National doctorate
0%
20%
40%
60%
80%
100%
0%
20%
40%
60%
80%
100%
Q24 My professors at Capella University cared about me as a person.
Q25 I had at least one professor at Capella University who made me excited about learning.
Q31A I was challenged academically at Capella University.
0%
20%
40%
60%
80%
100%
33
45
14
35
49
36
3 2
10
69
22
171 1
58
30
38
45
38
3 3
12
36
2
37
18
6
44
36
10
45
31
35
26
64
25
62
8
24
52
26
53
12
70
22
15
1 2
70
19
336
51
29
5 2
11
66
2
22
6
61
24
9
32
55
25
10
46
34
30
22
4
9
25
33
10
4
24
39
32
3
18
83
33
36
8
19
25
33
83
25
27
33
5
24
11
35
33
21
37
20
29
32
8
9
Capella University prepared me well for life outside of college.
Capella undergrads
Public undergrads
Private not-for-profit undergrads
Private for-profit
undergrads
Capella master’s
National master’s
Capella doctorate
National doctorate
0%
20%
40%
60%
80%
100%
0%
20%
40%
60%
80%
100%
Q26 Capella University prepared me well for life outside of college.
Q28 Capella University is passionate about the long-term success of its students.
35
27
24
4
9
25
31
9
7
26
30
38
5
15
10
7
31
31
8
23
24
33
84
27
20
33
8
26
12
25
35
25
4
10
20
33
26
11
9
31
24
26
5
12
28
32
8
5
21
27
29
5
24
13
6
28
31
8
23
34
33
72
19
20
29
8
27
11
32
30
21
310
22
25
26
11
13
5 Strongly agree
4
3
2
1 Strongly disagree
26Copyright © 2016 Gallup, Inc. All rights reserved.
Workplace Engagement, Well-Being and Alumni Attachment: Capella University 2016
Capella University is passionate about the long-term success of its students.
Capella undergrads
Public undergrads
Private not-for-profit undergrads
Private for-profit
undergrads
Capella master’s
National master’s
Capella doctorate
National doctorate
0%
20%
40%
60%
80%
100%
0%
20%
40%
60%
80%
100%
Q26 Capella University prepared me well for life outside of college.
Q28 Capella University is passionate about the long-term success of its students.
35
27
24
4
9
25
31
9
7
26
30
38
5
15
10
7
31
31
8
23
24
33
84
27
20
33
8
26
12
25
35
25
4
10
20
33
26
11
9
31
24
26
5
12
28
32
8
5
21
27
29
5
24
13
6
28
31
8
23
34
33
72
19
20
29
8
27
11
32
30
21
310
22
25
26
11
13
Capella aims to extend access to high-quality degrees and support learners of different genders, ages, racial/ethnic backgrounds, languages, economic strata, national and geographical origins and locations, political beliefs and values.
When asked if either their mother or father had a college degree, 69% of Capella undergraduate alumni say they are first-generation students, similar to private for-profit institutions (63%) and higher than private not-for-profit (60%) and public (58%) institution undergraduates nationally. However, undergraduates at Capella are similar to the national average in terms of demographic composition.
The percentage of first-generation alumni who received postgraduate degrees from Capella University is higher than that of public and private institutions (59% vs. 38% for master’s degree alumni and 63% vs. 30% for doctoral degree alumni). Similarly, Capella postgraduate alumni include a higher percentage of women (68% vs. 57% for master’s degree alumni and 59% vs. 52% for doctoral degree alumni) and minorities (44% vs. 26% for master’s degree alumni and 36% vs. 18% for doctoral degree alumni).
Percentage of First-generation Students
0% 20% 40% 60% 80% 100%
59
69
58
60
63
63
38
30
Percentages by race
0%
20%
40%
60%
80%
100%
Percentage of First-generation students
0%
20%
40%
60%
80%
100%Percentages by gender
43
57
31
68
48
52
40
59
45
54
48
52
42
58
44
56
57
1
2
0
111
2
1
7 559 12 5 12
13
74
1
56
34
6
7
82
3
27
64
2
22
66
3
12
72
2
16
76
2
23
62
Capella undergrads
Public undergrads
Private not-for-profit undergrads
Private for-profit undergrads
Capella master’s
National master’s
Capella doctorate
National doctorate
5 Strongly agree
4
3
2
1 Strongly disagree

27Copyright © 2016 Gallup, Inc. All rights reserved.
Workplace Engagement, Well-Being and Alumni Attachment: Capella University 2016
Male
Female
Hispanic
Asian
Black
Other
White
Percentages by Gender
Capella undergrads
Public undergrads
Private not-for-profit undergrads
Private for-profit
undergrads
Capella master’s
National master’s
Capella doctorate
National doctorate
0% 20% 40% 60% 80% 100%
59
69
58
60
63
63
38
30
Percentages by race
0%
20%
40%
60%
80%
100%
Percentage of First-generation students
0%
20%
40%
60%
80%
100%Percentages by gender
43
57
31
68
48
52
40
59
45
54
48
52
42
58
44
56
57
1
2
0
111
2
1
7 559 12 5 12
13
74
1
56
34
6
7
82
3
27
64
2
22
66
3
12
72
2
16
76
2
23
62
Percentages by Race
Capella undergrads
Public undergrads
Private not-for-profit undergrads
Private for-profit
undergrads
Capella master’s
National master’s
Capella doctorate
National doctorate
0% 20% 40% 60% 80% 100%
59
69
58
60
63
63
38
30
Percentages by race
0%
20%
40%
60%
80%
100%
Percentage of First-generation students
0%
20%
40%
60%
80%
100%Percentages by gender
43
57
31
68
48
52
40
59
45
54
48
52
42
58
44
56
57
1
2
0
111
2
1
7 559 12 5 12
13
74
1
56
34
6
7
82
3
27
64
2
22
66
3
12
72
2
16
76
2
23
62
28Copyright © 2016 Gallup, Inc. All rights reserved.
Workplace Engagement, Well-Being and Alumni Attachment: Capella University 2016
Methodology
CAPELLA UNIVERSITY COMMISSIONED GALLUP TO conduct a study of Capella graduates who obtained their degrees between 2000 and 2015. Results for the Capella University study are based on web surveys conducted between December 2, 2015–January 18, 2016, with a sample of 38,490 Capella University undergraduate and graduate school alumni. The sample of alumni email addresses was provided by Capella University. Alumni were included in the study if the institution had an email address on file. Gallup invited 38,490 Capella graduates to participate in the survey via web; 5,121 completed the survey, representing a 13% participation rate among Capella graduates. A series of five email reminders were sent to sample members to encourage participation and minimize nonresponse. Reminder emails were utilized until the point at which only marginal gains were made to the total participation rate, and sufficient sample size was achieved to allow for analysis at the university and subgroup level.
Results for the Gallup-Purdue Index, the national study used for comparison purposes, are based on web surveys conducted December 16, 2014–June 29, 2015, with a random sample of 30,151 respondents with a bachelor’s degree or higher, aged 18 and older, with Internet access, living in all 50 U.S. states and the District of Columbia. For the purposes of this report, 2,352 undergraduate degree holders were selected for analysis if they graduated in 2000 or later and were age 25 or older at graduation. From January 25–February 25, 2016, 3,762 postgraduate degree holders were recontacted to answer additional questions about their postgraduate experience via subsequent web survey. For the purposes of this report, 3,118 postgraduate degree holders were selected for analysis if they graduated in 2000 or later and were age 25 or older at graduation.
The Gallup-Purdue Index sample was recruited via the Gallup Daily Tracking survey. The Gallup Daily tracking survey sample includes national adults with a minimum quota of 50% cellphone respondents and 50% landline respondents, with additional minimum quotas by time zone within region. Landline and cellular telephone numbers are selected using RDD methods. Landline respondents are chosen at random within each household on the basis of which member had the most recent birthday. Gallup Daily tracking respondents with a college degree, who agreed to future contact, were invited to take the Gallup-Purdue Index survey online.
29Copyright © 2016 Gallup, Inc. All rights reserved.
Workplace Engagement, Well-Being and Alumni Attachment: Capella University 2016
Gallup-Purdue Index interviews are conducted via the web, in English only. Samples are weighted to correct for unequal selection probability and nonresponse. The data are weighted to match national demographics of gender, age, race, Hispanic ethnicity, education and region. Demographic weighting targets are based on the most recent Current Population Survey figures for the aged 18 and older U.S. bachelor’s degree or higher population.
All reported margins of sampling error for the Gallup-Purdue Index of all college graduates include the computed design effects for weighting. For the purposes of this report, the national comparison groups include only those graduates who were age 25 or older at degree completion. Margins of error are calculated for the national comparison groups only, at the 95% confidence level.
For results based on the total sample of 1,360 graduates with a bachelor’s degree from a public university, the margin of sampling error is ±3.9 percentage points. For results based on employee engagement for the 985 employed graduates with a bachelor’s degree from a public college or university, the margin of sampling error is ±4.6 percentage points.
For results based on the total sample of 656 graduates with a bachelor’s degree from a private not-for-profit university, the margin of sampling error is ±5.6 percentage. For results based on employee engagement for the 492 employed graduates with a bachelor’s degree from a private not-for-profit college or university, the margin of sampling error is ±6.5 percentage points.
For results based on the total sample of 336 graduates with a bachelor’s degree from a private for-profit university, the margin of sampling error is ±7.8 percentage points. No margin of sampling error is available with regards to employee engagement for this population due to small overall sample sizes.
For results based on the total sample of 2,543 graduates with master’s degrees from a college or university, the margin of sampling error is ±2.9 percentage points. For results based on employee engagement for the 2,055 employed graduates with a master’s degree from a college or university, the margin of sampling error is ±3.2 percentage points.
For results based on the total sample of 575 graduates with doctoral degrees from a college or university, the margin of sampling error is ±6.1 percentage points. For results based on employee engagement for the 484 employed graduates with doctoral degrees from a college or university, the margin of sampling error is ±6.7 percentage points.
In addition to sampling error, question wording and practical difficulties in conducting surveys can introduce error or bias into the findings of public opinion polls.
30Copyright © 2016 Gallup, Inc. All rights reserved.
Workplace Engagement, Well-Being and Alumni Attachment: Capella University 2016
About
About Capella UniversityCapella University (www.capella.edu) is accredited by the Higher Learning Commission.
Founded in 1993, the university is dedicated to providing flexible, professionally aligned online degree programs designed to help working adults advance in their careers. As of July 31st, 2016, more than 38,000 students were enrolled in Capella’s bachelor’s, master’s, doctoral and certificate programs, with more than 70 percent in its graduate programs. Known for its commitment to learner success, academic quality and innovations in online education, Capella pioneered competency-based direct assessment programs allowing students to learn at their own pace. Capella University is a wholly owned subsidiary of Capella Education Company (NASDAQ: CPLA).
About GallupGallup delivers analytics and advice to help leaders and organizations solve their most
pressing problems. Combining more than 80 years of experience with its global reach, Gallup knows more about the attitudes and behaviors of employees, customers, students and citizens than any other organization in the world.
About HealthwaysHealthways is an independent, global well-being company that provides comprehensive
improvement solutions to increase performance and lower healthcare costs in its client populations. Dedicated to creating a healthier world one person at a time, Healthways uses the science of well-being and behavior change to produce and measure well-being improvement for its customers. Healthways provides personalized support to individuals to optimize each participant’s health and productivity and to reduce health-related costs, and also advises leaders on how to maximize well-being across an organization.