Embed Size (px)
Citation preview
DIRECTORATE-GENERAL INTERNAL POLICIES OF THE UNION - DIRECTORATE A -
ECONOMIC AND SCIENTIFIC POLICIES
Workshop on the economic impact of rising oil prices
28 June 2006 European Parliament Brussels
9.30h – 18.00h
Table of Contents Page n° Programme 01
Session I 04
Part 1: Macroeconomic consequences of rising oil prices 04Dietrich DOMANSKI, BIS 05Marcelo SANCHEZ, ECB 17Dr. Hans DE JONG, ABN Amro 30 Part 2: Consequences of rising oil prices for financial stability
43
Jeffrey CURRIE, Goldman Sachs 44Christie SANDERS, Sanders Research 102Pekka LÖSÖNEN, EUROSTAT 138Dr. C. CAMPBELL, Association for the Study of Peak Oil (ASPO) 157 Session II Part 1: Microeconomic consequences of rising oil prices, competitiveness and taxation
198
David BALDOCK, Institute for European Environmental Policy 199Stephan HERBST, Toyota Motors Europe 207Dr. Manfred MEIER, Volkswagen 227Olivier SCHAEFFER, EREC N/A Part 2: Geopolitics and Security of Supply 239Dr. Hasan QABAZARD, OPEC 240Pierre SIGONNEY, TOTAL 251Raphael SAUTER, SPRU Energy Group, University of Essex 265Alexandre CLAUWAERT, SUEZ 275
DIRECTORATE-GENERAL INTERNAL POLICIES OF THE UNION - DIRECTORATE A -
ECONOMIC AND SCIENTIFIC POLICIES
Workshop on the economic impact of rising oil prices Draft Programme
28 June 2006
European Parliament Brussels Room ASP 5G3 9.30h – 18.00h
9.30 - 12.30 Session 1 Macroeconomic consequences of rising oil prices
• Comparing previous oil price shocks to the current situation: Why does the economy react differently this time round (low inflation, so far no second-round effects)?
• What macroeconomic consequences can be expected from the current oil price situation? - inflation - demand - employment - growth
• Which macroeconomic policies would be appropriate?
Guest speakers: - Dietrich Domanski, Head of Macroeconomic Monitoring Unit, BIS - Marcelo Sanchez, Senior Economist, ECB - Drs Han. de Jong, Chief Economist, ABN Amro 10.45 - 11.00 Coffee break
Page 1 of 291
Consequences of rising oil prices for financial stability
• Is there speculation going on in the financial markets in a noticable volume? Are new instruments being created to speculate on oil price changes? Can speculation or the use of speculative instruments seriously endanger financial stability?
• How can the lack of transparency be tackled (Joint Oil Data Initiative)? • Recycling of petrodollars • Peak oil discussion
Guest speakers: - Mr. Jeffrey Currie, Goldman Sachs, Managing Director and Head of Commodities Research - Christie Sanders, Managing Director Sanders Research - Pekka Lösönen, Eurostat - Joint Oil Data Initiative Representative - Dr C. Campbell, Chairman & Founder of the Association for the study of Peak Oil (ASPO) 14.30 - 18.00 Session 2 Microeconomic consequences of rising oil prices, competitiveness and taxation
• Sectoral impacts due to substitution effects based on the assumption of high standing oil prices. Who will be the winners/losers? Which are the impacts on economic sectors, notably on transport, petrochemicals, automotive, farming, tourism etc. Which types of substitution effects might occur?
• Potential impacts on trade due to rising transportation costs. Which are the impacts on division of work within firms and among firms, their current organisation being based on cheap transportation costs?
• How to take advantage of the move towards a new era of high oil prices in terms of competitiveness and new economic activities for the EU? Can public policies speed up the adaptation of the EU economy to an era of high oil/fossil energy prices? Which are the best policy tools: industrial policy, R&D policy, taxation? Is there room for economic policy to decrease the level of uncertainty about future energy situation? Which are the links with environmental considerations, notably environmental taxation?
• How to take into account all costs related with energy production, consumption and use, notably negative side effects (negative externalities) so that economic decisions are based on all parameters? How to better 'internalise' negative externalities due to oil consumption? Opportunity for an EU tax?
Guest speakers: - David Baldock, Institute for European Environmental Policy - Stephan Herbst, Toyota Motor Europe, Manager Environmental Analysis and Strategy - Dr Manfred Meier, Director Technology Science,Volkswagen, - Olivier Schaeffer, Policy Director, EREC Panellist: - Robert Klotz, European Commission, DG Comp, Unit Energy and Water
Page 2 of 291
16.00 - 16.15 Coffee break Geopolitics and Security of Supply
• Visionary and strategic assessment of the situation • Are there competition issues on a global level? (oligopoly structure) • Which would be the best structure of the EU energy market taking into account the need
for security of supply? • Oil versus gas – repercussion on the gas market and gas price changes • New industrial revolution, futuristic visionary thinking, moving towards an exit from oil
dependency • To which extent can renewable energy contribute to security of supply? Which renewable
energy should be preferred? Which are the drawbacks of renewable energies? Are all renewable energies neutral for the environment?
Guest speakers: - Dr Hasan Qabazard, Director Research Division, OPEC - Mr Pierre Sigonney, Strategy Department of Total - Raphael Sauter , SPRU Energy Group University of Sussex (author of Exploiting the oil GDP effect to support renewables redeployed) - Alexandre Clauwaert, Strategy department Suez (gas, electricity and renewables) Panellist: - Ioannis Samoulidis, European Commission, DG Tren, Energy Policy and Security of Supply
Page 3 of 291
Session I Part 1: Macroeconomic consequences of rising oil prices
Page 4 of 291
28 June 2006
Restricted
1
Why is the current oil price shock different? A macroeconomic assessment
Workshop on the economic impact of rising oil pricesEuropean ParliamentBrussels
Dietrich DomanskiHead of Macroeconomic Monitoring Bank for International Settlements
1Page 5 of 291
Restricted
2
Overview
2
How large is the current oil price shock compared to those in the 1970s?Why have oil importing economies been much more resilient than in the past?Will the effects of high energy prices remain benign?
Page 6 of 291
Restricted
3
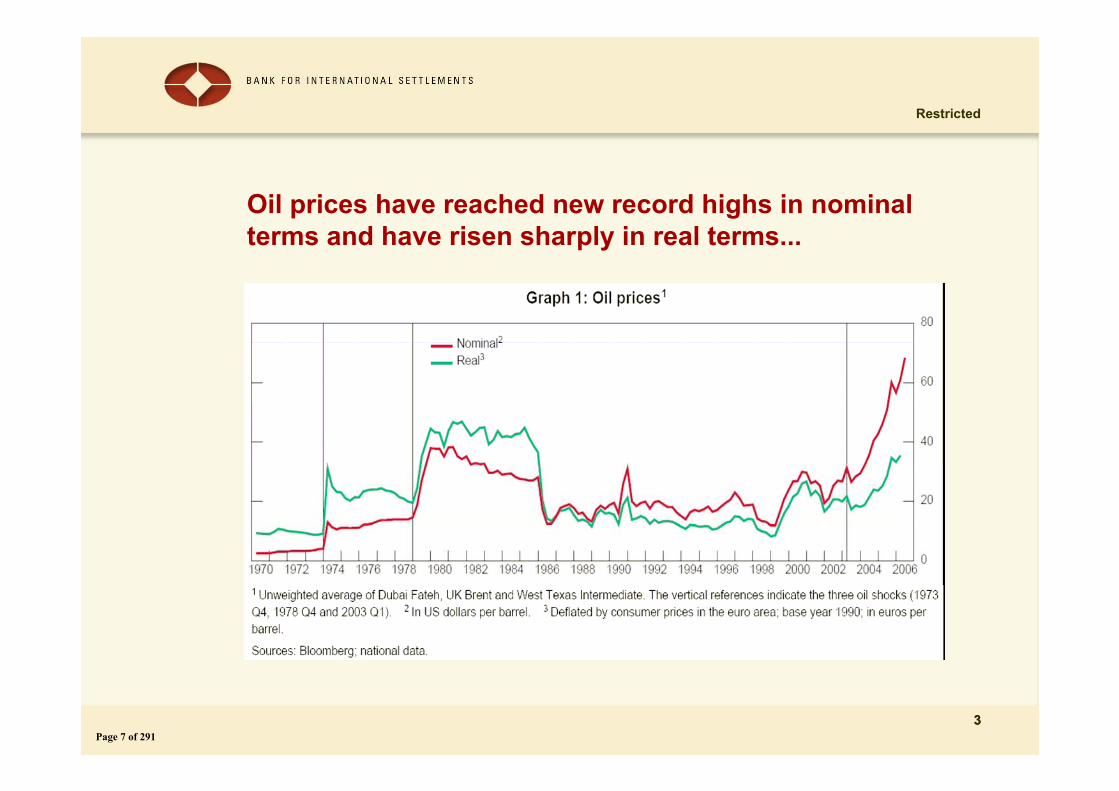
Oil prices have reached new record highs in nominal terms and have risen sharply in real terms...
3Page 7 of 291
Restricted
4
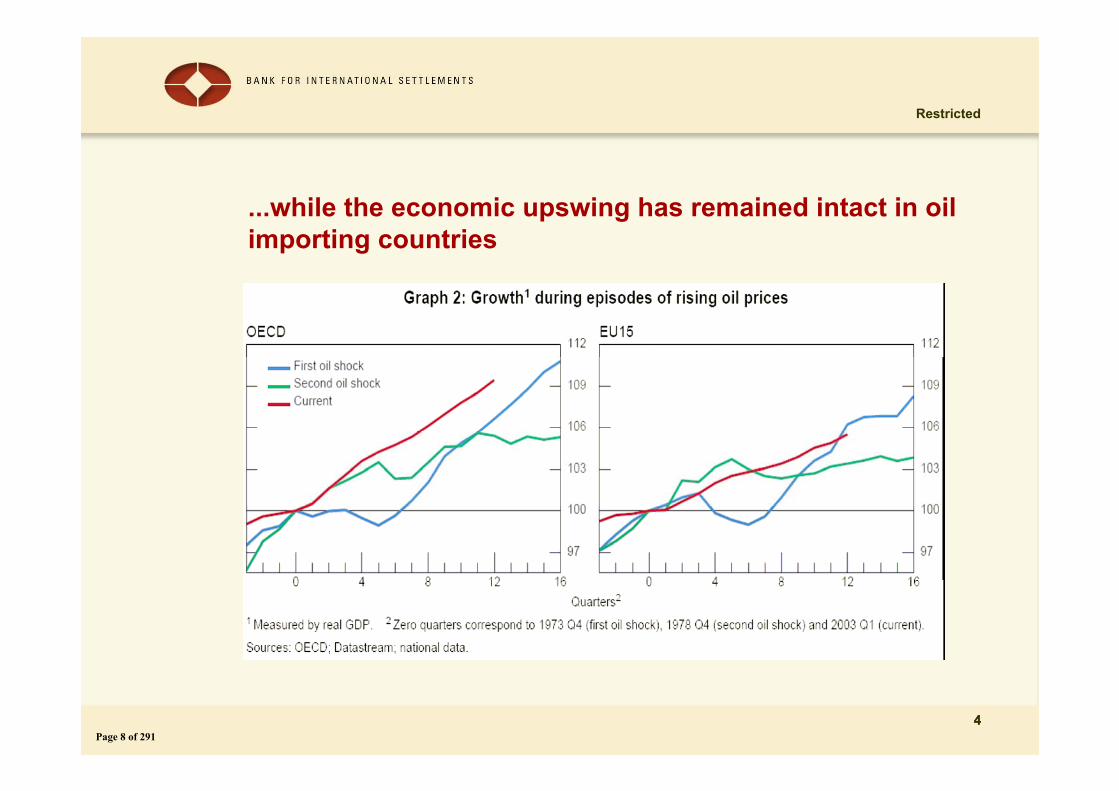
...while the economic upswing has remained intact in oil importing countries
4Page 8 of 291
Restricted
5
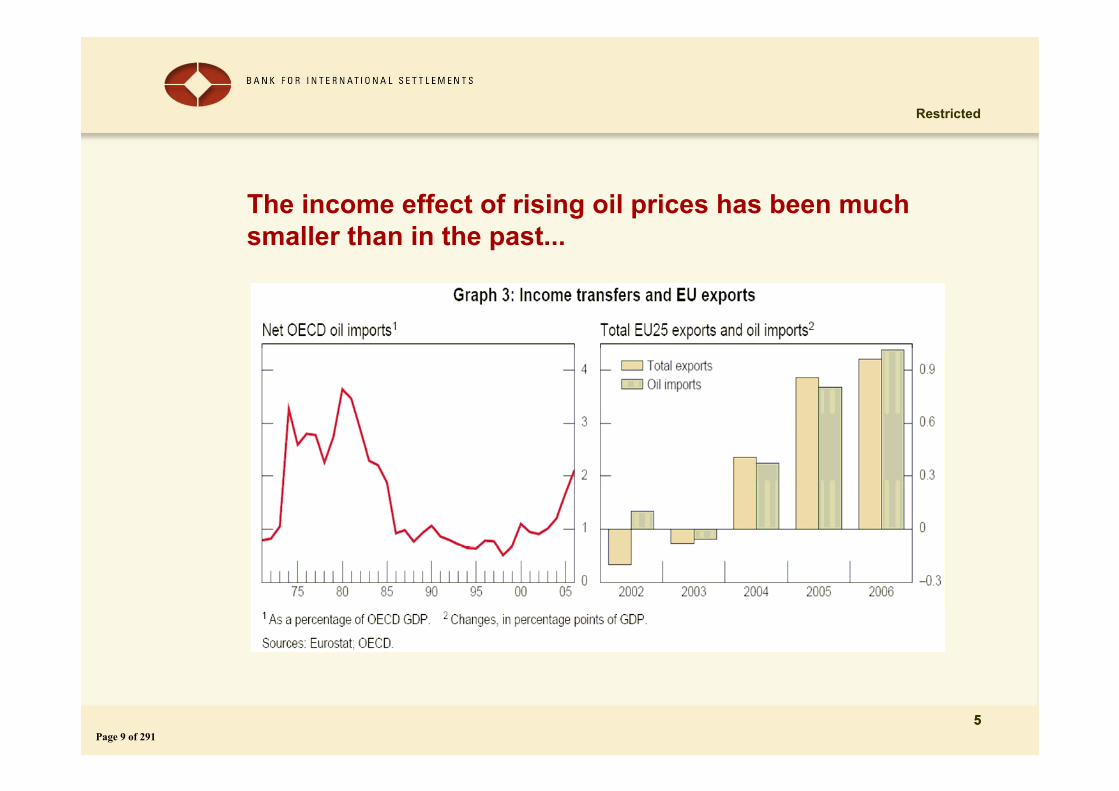
The income effect of rising oil prices has been much smaller than in the past...
5Page 9 of 291
Restricted
6
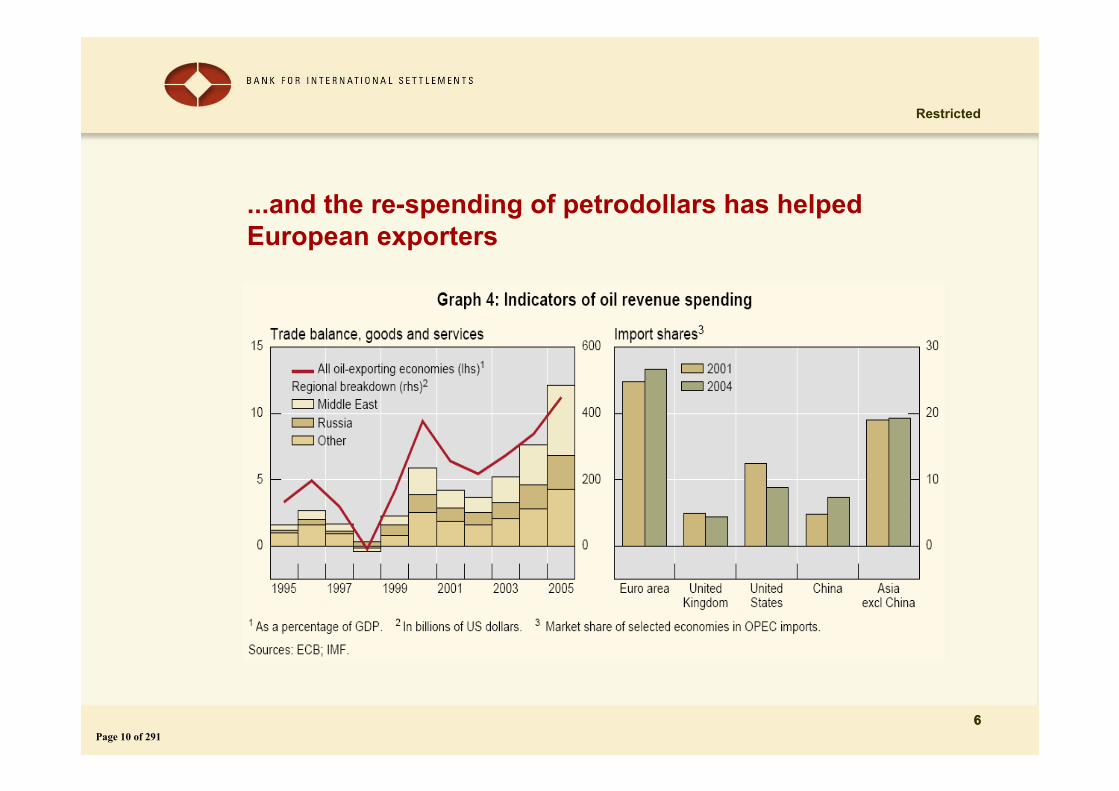
...and the re-spending of petrodollars has helped European exporters
6Page 10 of 291
Restricted
7
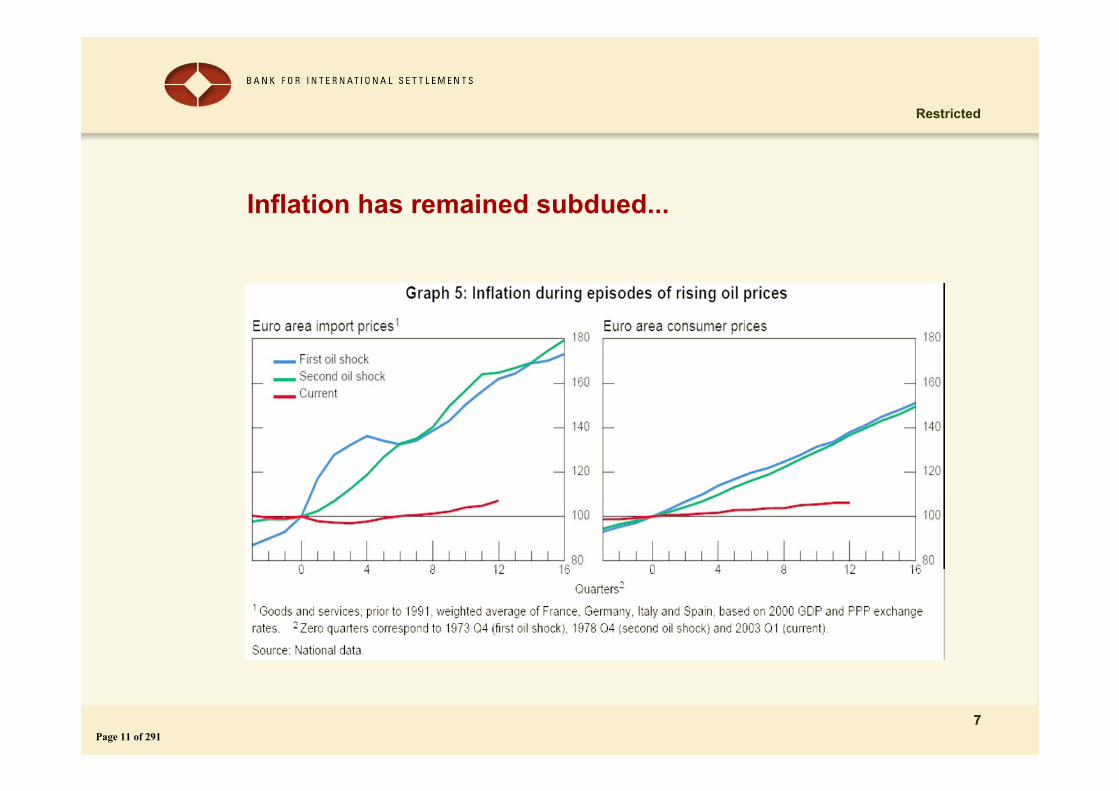
Inflation has remained subdued...
7Page 11 of 291
Restricted
8
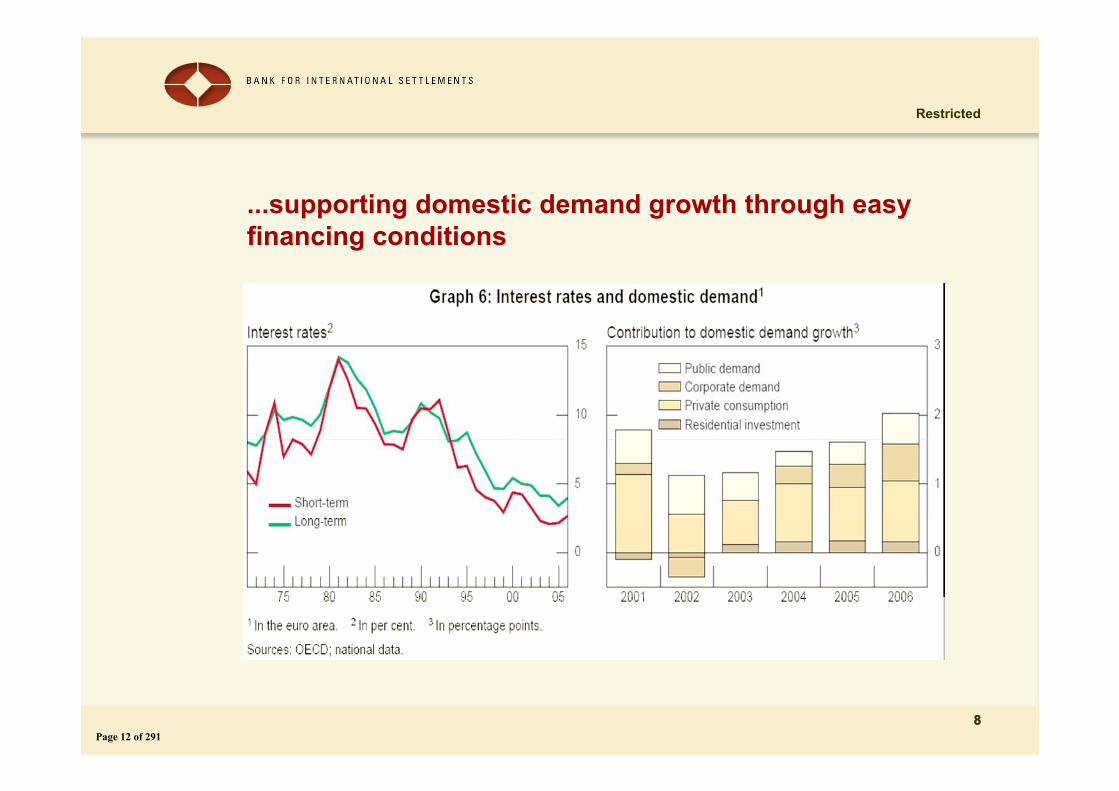
...supporting domestic demand growth through easy financing conditions
8Page 12 of 291
Restricted
9
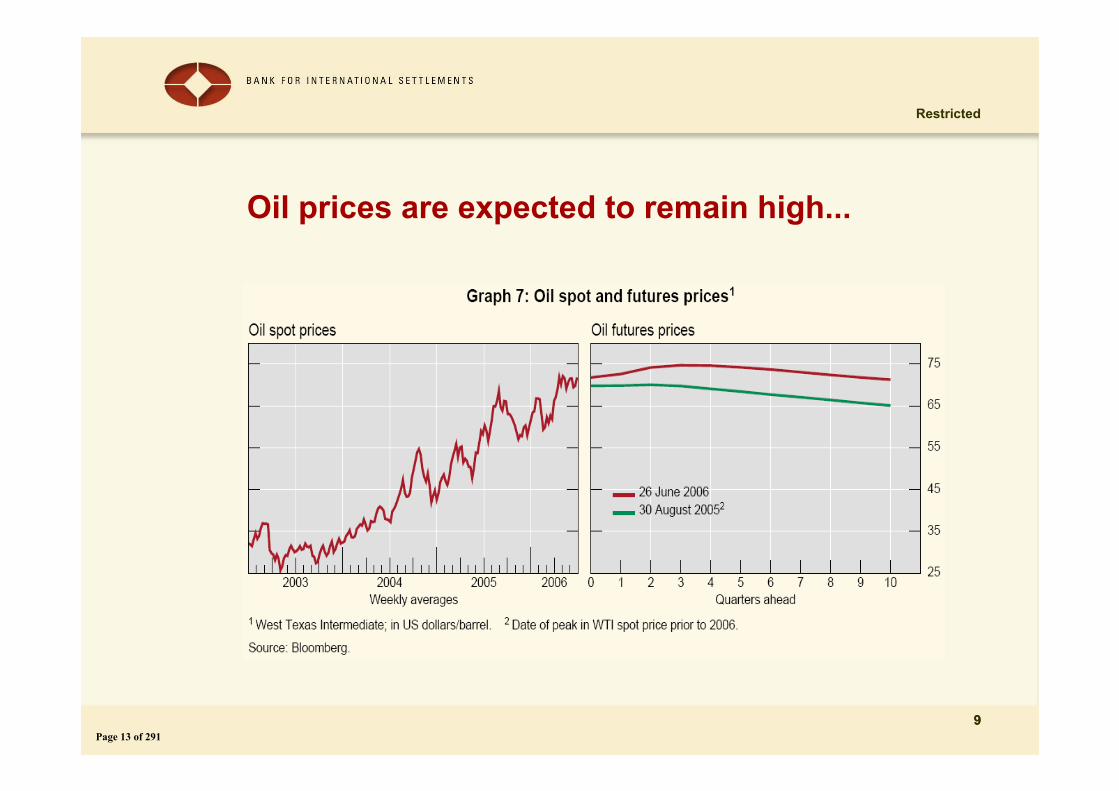
Oil prices are expected to remain high...
9Page 13 of 291
Restricted
10
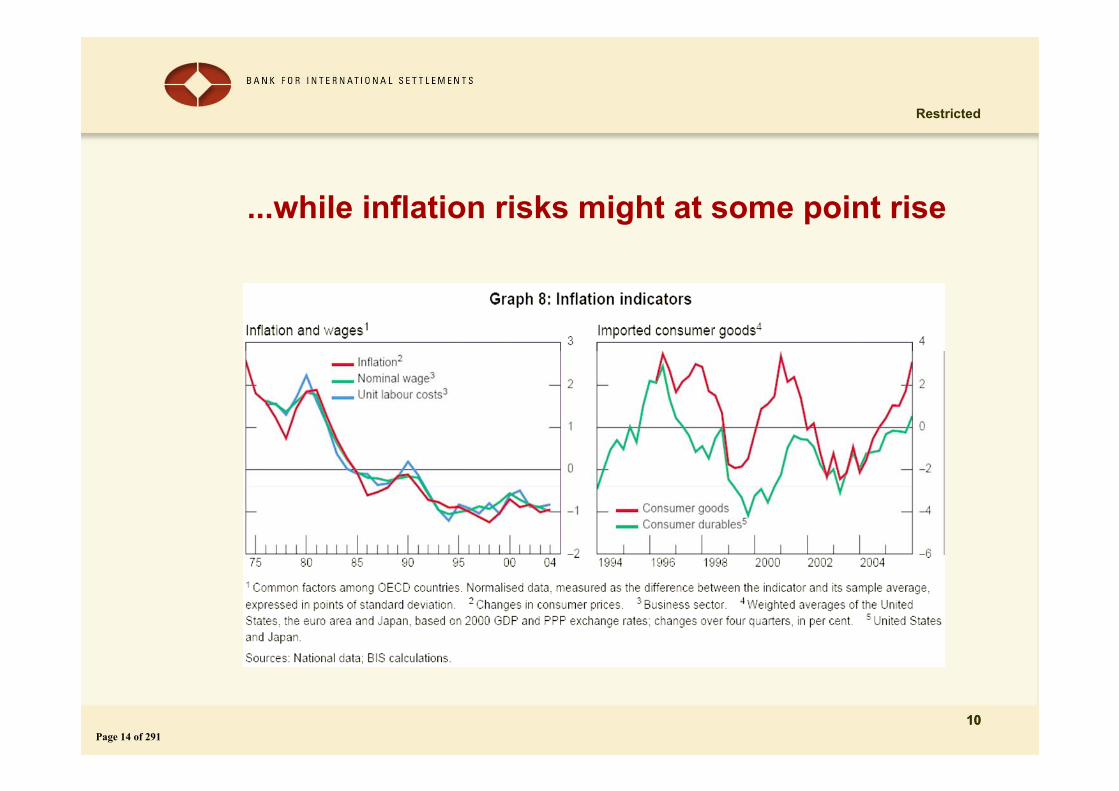
...while inflation risks might at some point rise
10Page 14 of 291
Restricted
11
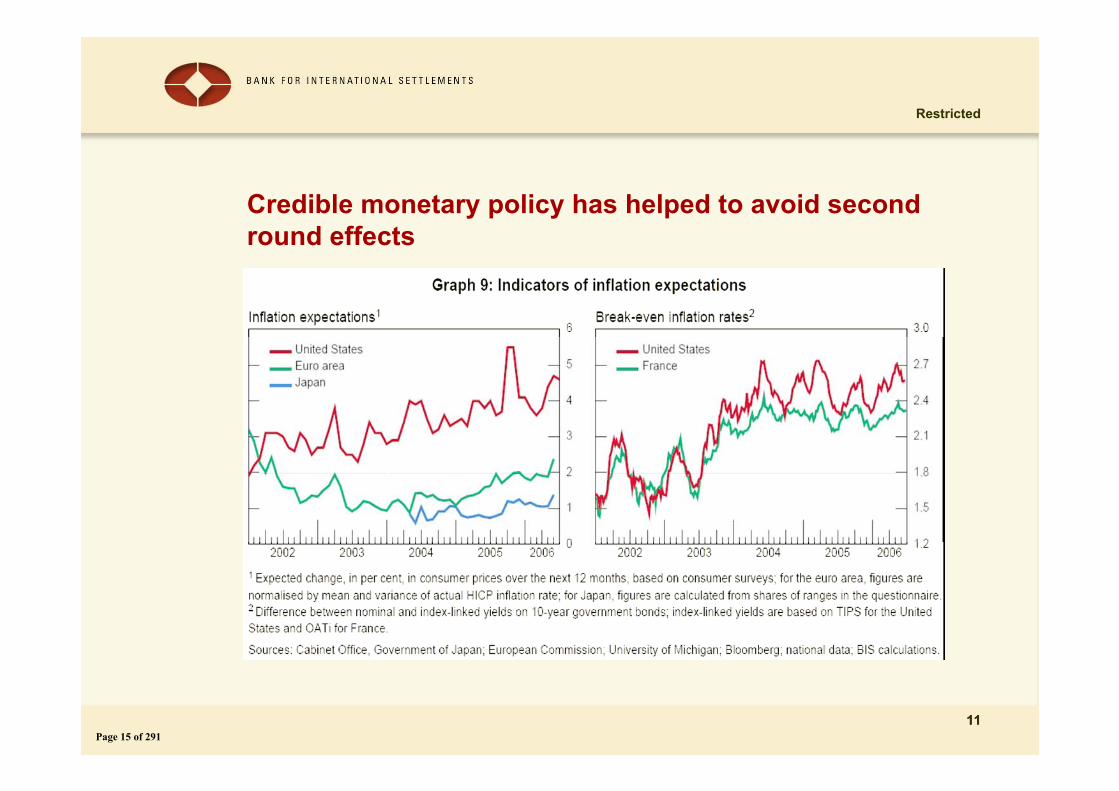
Credible monetary policy has helped to avoid second round effects
11Page 15 of 291
Restricted
12
Conclusion
Oil prices have risen primarily because of strong global demand growth and not disruptions of oil supply.Low and stable inflation has mitigated the impact of rising energy prices on oil importing countries.But concerns about oil supply have grown and inflation risks seem to have increased recently.
12Page 16 of 291
Oil price shocks and macroeconomic developments
Marcelo SánchezEuropean Central Bank
Workshop on the economic impact of rising oil prices
European Parliament, Brussels, 28 June 2006Page 17 of 291
1 Motivation
• Monitoring developments over the medium term
• highlight in red;
Outline
• Transmission channels
• The evidence
• Additional remarks
Page 18 of 291
1 Motivation
• Monitoring developments over the medium term
• highlight in red;
Outline
• Transmission channels
• The evidence
• Additional remarks
Page 19 of 291
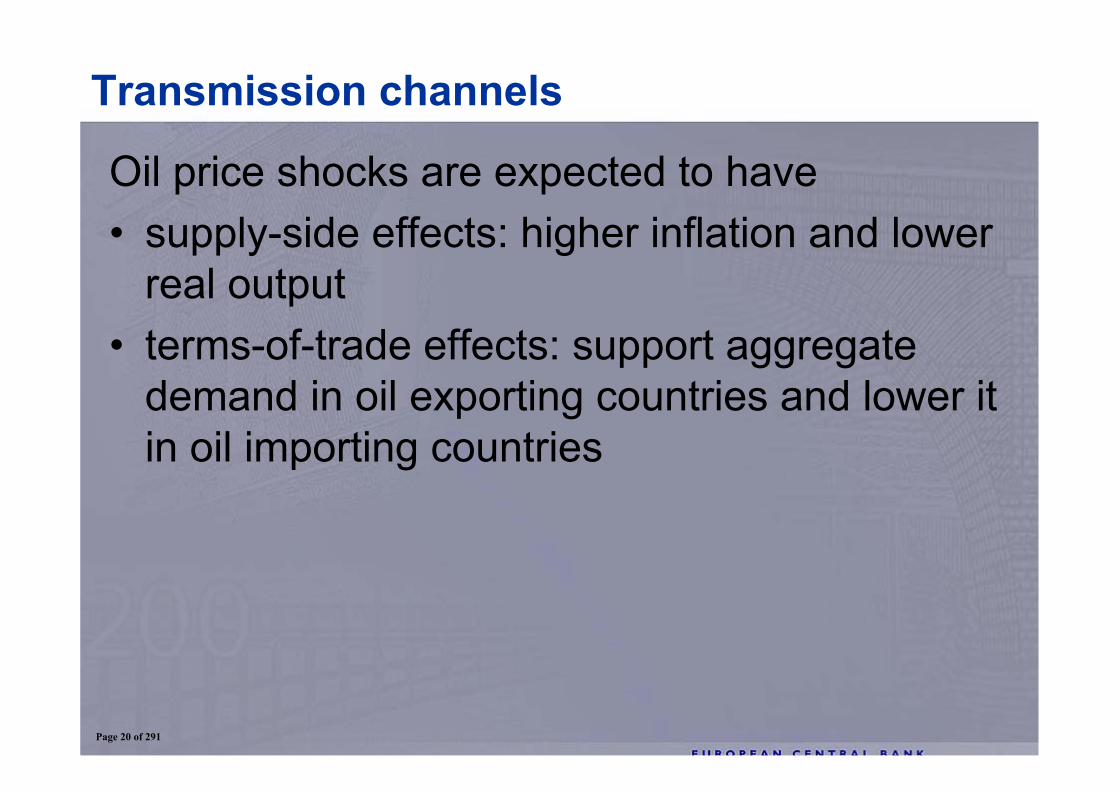
Oil price shocks are expected to have• supply-side effects: higher inflation and lower
real output• terms-of-trade effects: support aggregate
demand in oil exporting countries and lower it in oil importing countries
Transmission channels
Page 20 of 291
1 Motivation
• Monitoring developments over the medium term
• highlight in red;
Outline
• Transmission channels
• The evidence
• Additional remarks
Page 21 of 291
Empirical analysis favours non-linear models- non-linear models predict larger macroeconomic impact that the linear one - “scaled” model rescales oil prices taking into account their changing variability over time
The evidence
Page 22 of 291
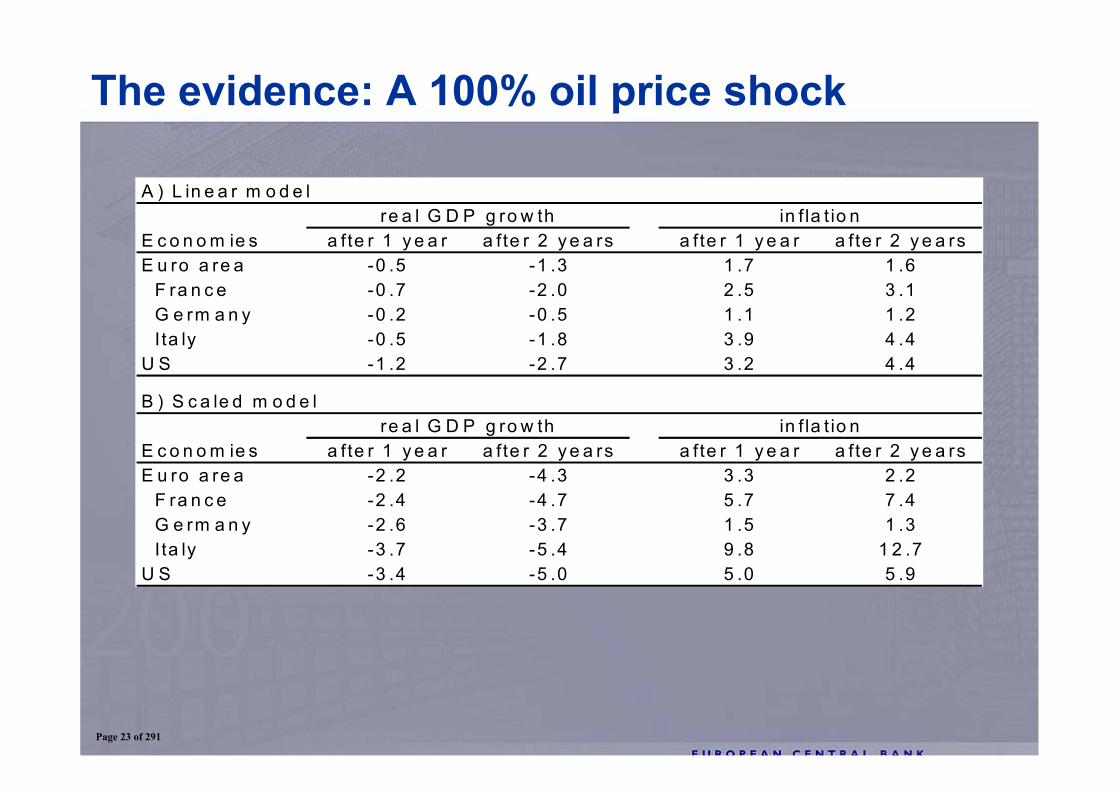
The evidence: A 100% oil price shock
A ) L in e a r m o d e l
E c o n o m ie s a fte r 1 y e a r a fte r 2 y e a rs a fte r 1 y e a r a fte r 2 y e a rsE u ro a re a -0 .5 -1 .3 1 .7 1 .6 F ra n c e -0 .7 -2 .0 2 .5 3 .1 G e rm a n y -0 .2 -0 .5 1 .1 1 .2 I ta ly -0 .5 -1 .8 3 .9 4 .4U S -1 .2 -2 .7 3 .2 4 .4
B ) S c a le d m o d e l
E c o n o m ie s a fte r 1 y e a r a fte r 2 y e a rs a fte r 1 y e a r a fte r 2 y e a rsE u ro a re a -2 .2 -4 .3 3 .3 2 .2 F ra n c e -2 .4 -4 .7 5 .7 7 .4 G e rm a n y -2 .6 -3 .7 1 .5 1 .3 I ta ly -3 .7 -5 .4 9 .8 1 2 .7U S -3 .4 -5 .0 5 .0 5 .9
re a l G D P g ro w th in f la t io n
re a l G D P g ro w th in f la t io n
Page 23 of 291
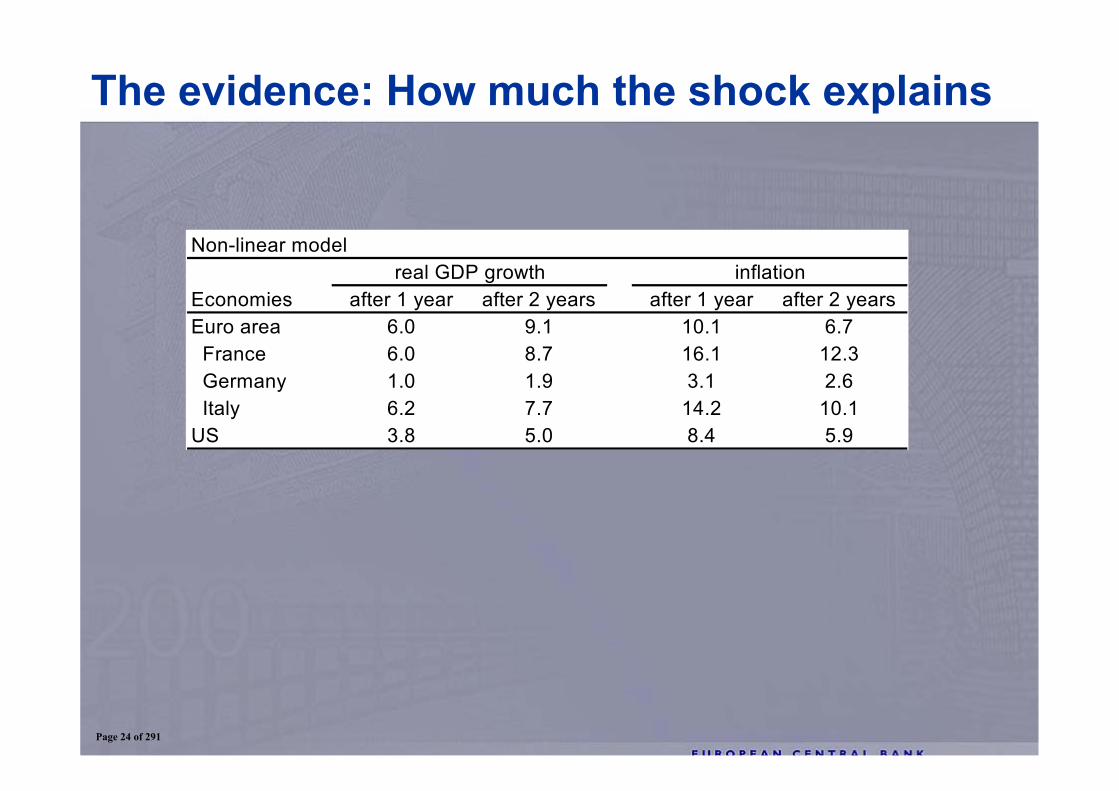
The evidence: How much the shock explains
Non-linear model
Economies after 1 year after 2 years after 1 year after 2 yearsEuro area 6.0 9.1 10.1 6.7 France 6.0 8.7 16.1 12.3 Germany 1.0 1.9 3.1 2.6 Italy 6.2 7.7 14.2 10.1US 3.8 5.0 8.4 5.9
real GDP growth inflation
Page 24 of 291
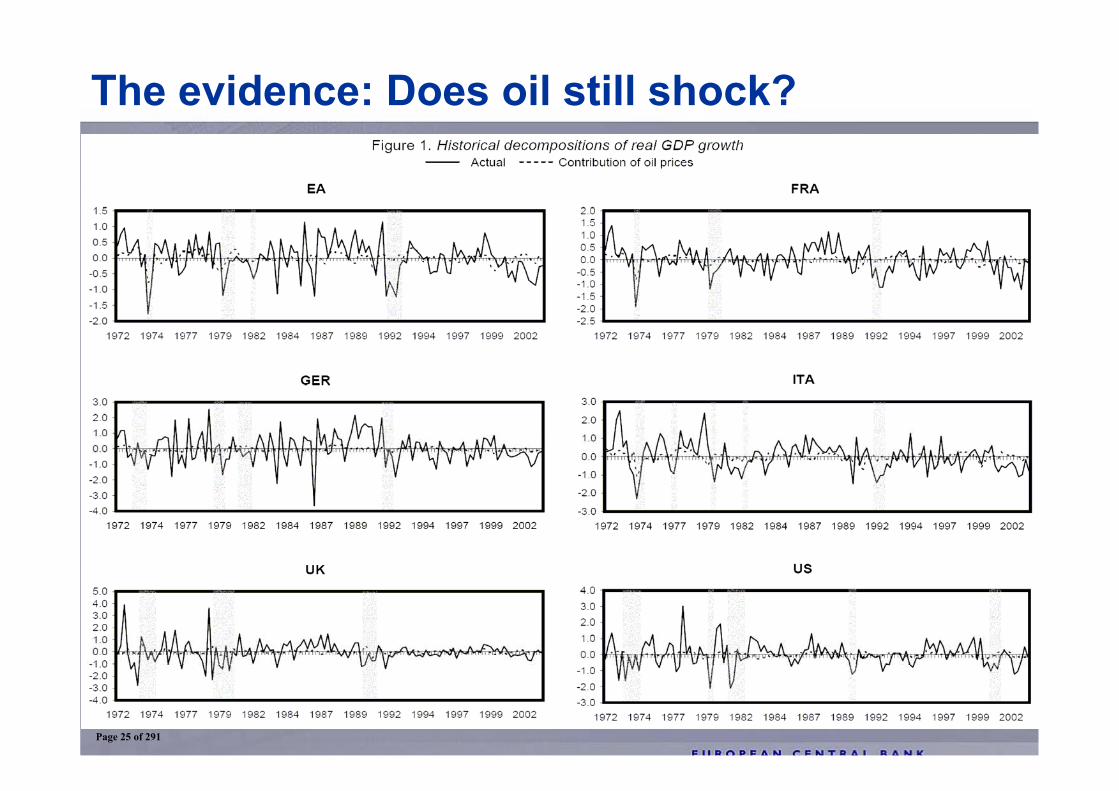
The evidence: Does oil still shock?
Page 25 of 291
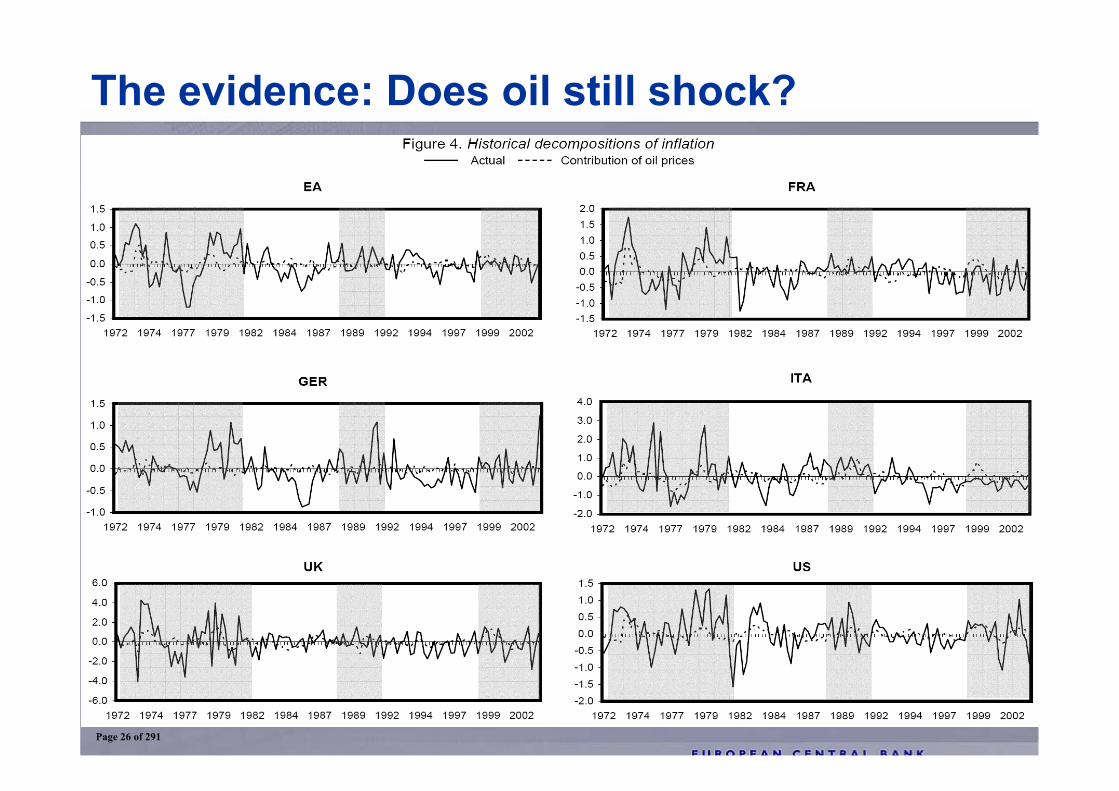
The evidence: Does oil still shock?
Page 26 of 291
1 Motivation
• Monitoring developments over the medium term
• highlight in red;
Outline
• Transmission channels
• The evidence
• Additional remarks
Page 27 of 291
Additional remarks
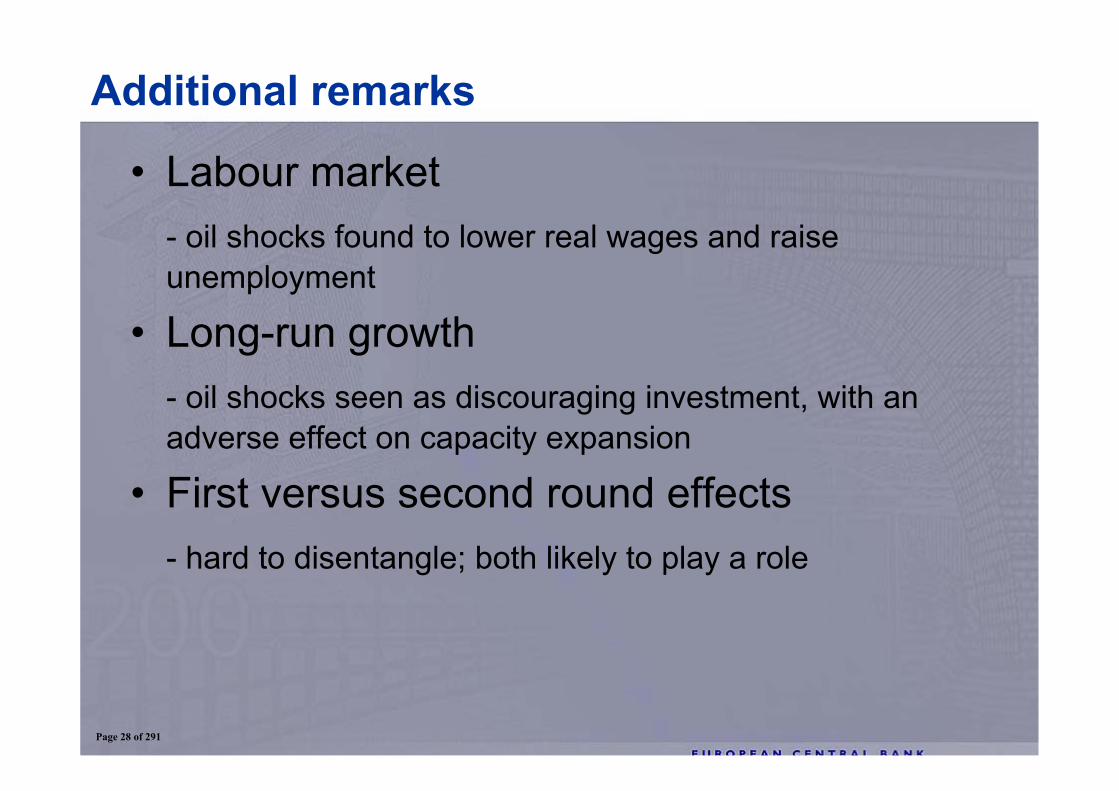
• Labour market- oil shocks found to lower real wages and raise unemployment
• Long-run growth- oil shocks seen as discouraging investment, with an adverse effect on capacity expansion
• First versus second round effects- hard to disentangle; both likely to play a role
Page 28 of 291

[The end]
Page 29 of 291
Economic impact of rising oil pricesPresentation to workshop of the European Parliament
28 June 2006
Han de Jong, Chief Economist
Page 30 of 291
2
Key areas of focus
Differences between various oil price shocks and the implications
Desirable policy response
Page 31 of 291
3
Different impact 70s/80s versus now
Smaller impact on inflation
Smaller negative impact on economic activity
Page 32 of 291
4
Differences with 1970s and 1980s
Magnitude of oil price rise
Importance of the oil price
Cause of the oil price rise
Economic setting- Transmission process
- Policy setting
Page 33 of 291
5
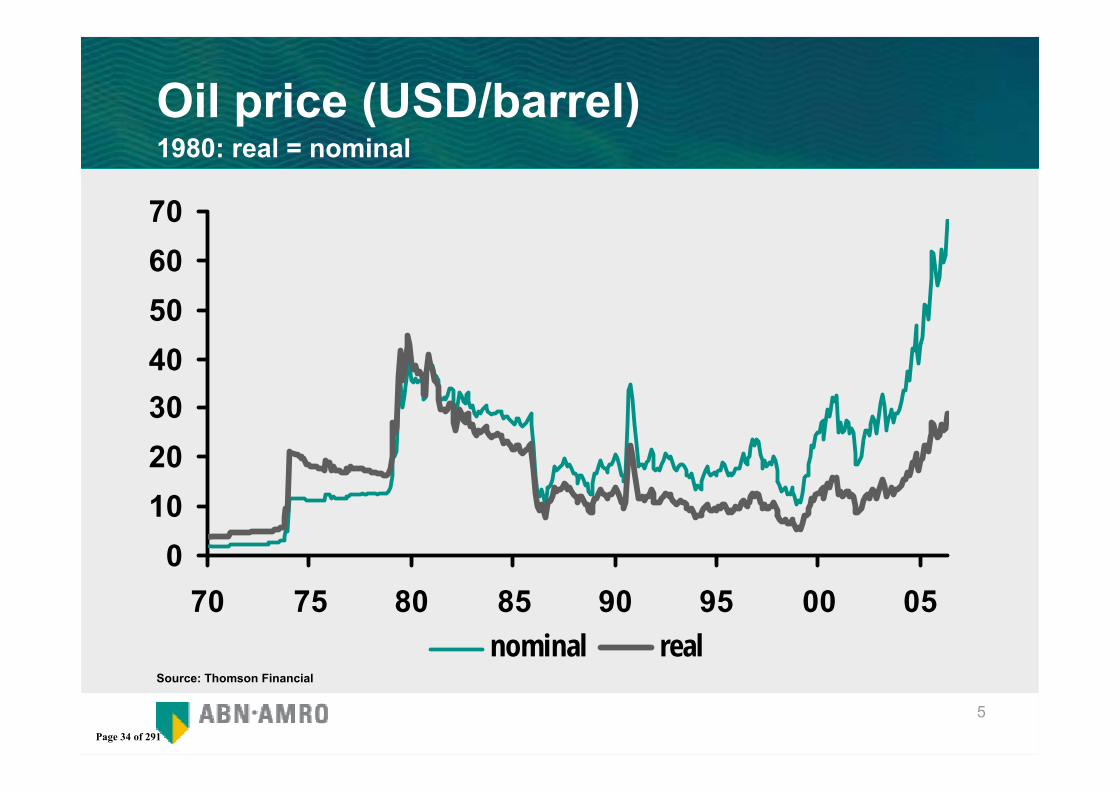
Oil price (USD/barrel)1980: real = nominal
Source: Thomson Financial
010203040506070
70 75 80 85 90 95 00 05nominal real
Page 34 of 291
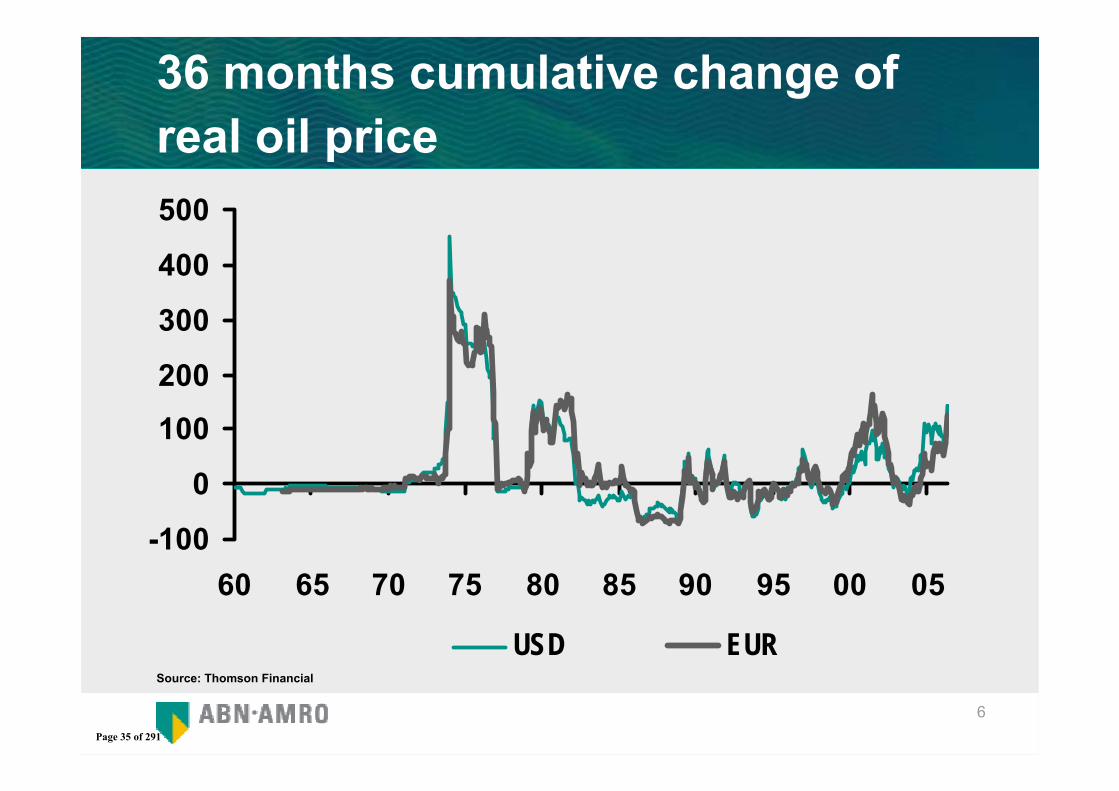
6
36 months cumulative change of real oil price
Source: Thomson Financial
-100
0
100
200
300
400
500
60 65 70 75 80 85 90 95 00 05
USD EUR
Page 35 of 291
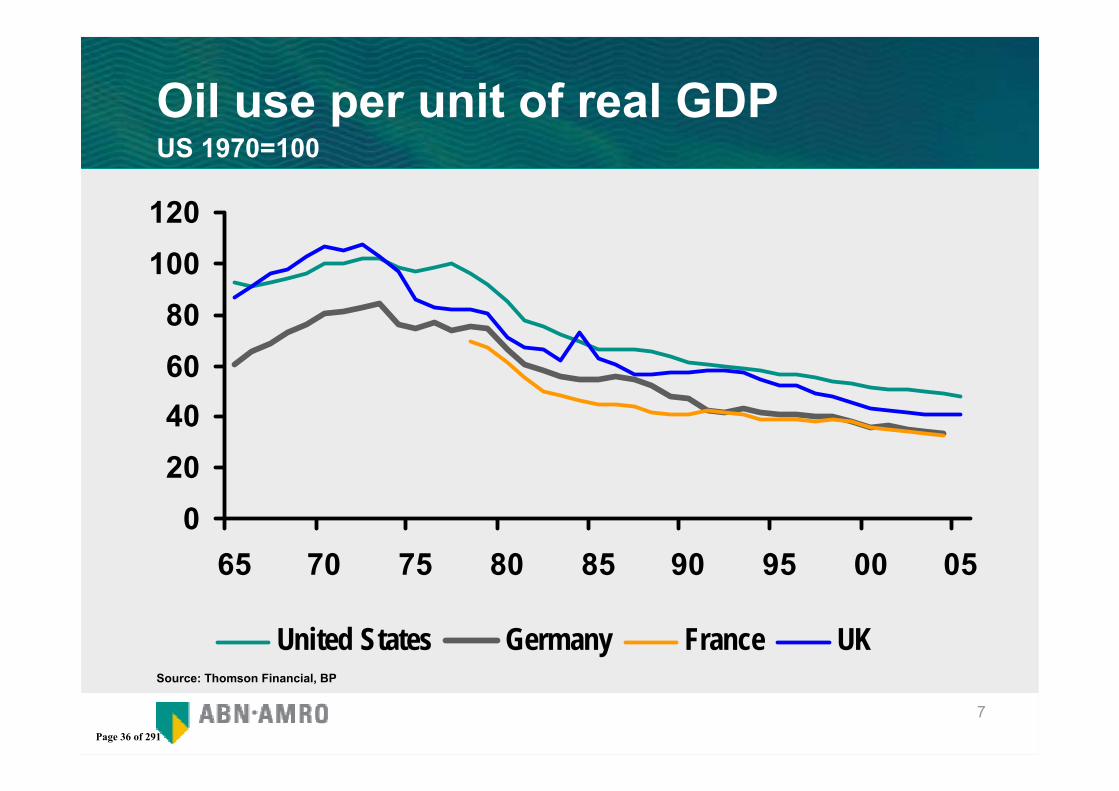
7
Oil use per unit of real GDPUS 1970=100
Source: Thomson Financial, BP
020406080
100120
65 70 75 80 85 90 95 00 05
United States Germany France UK
Page 36 of 291
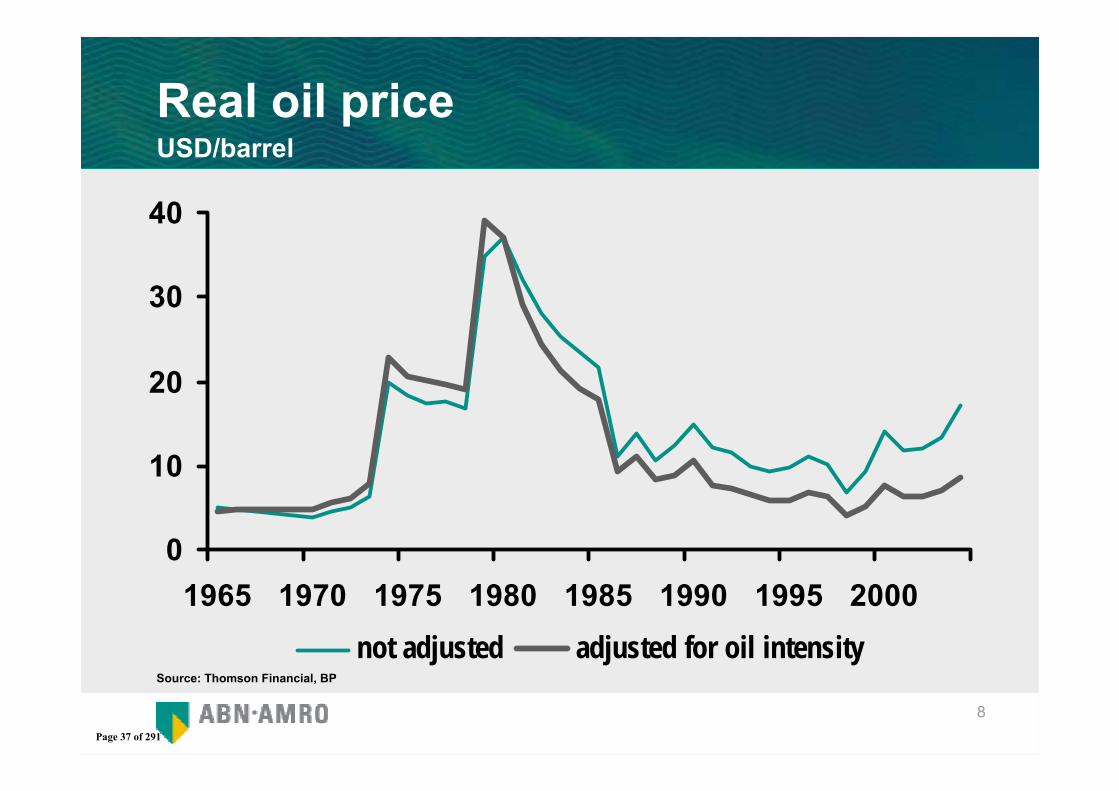
8
Real oil priceUSD/barrel
Source: Thomson Financial, BP
0
10
20
30
40
1965 1970 1975 1980 1985 1990 1995 2000not adjusted adjusted for oil intensity
Page 37 of 291
9
Cause of oil price increase
70s and 80s: exogenous shocks
Now: demand driven disturbance of supply-demand balance
Page 38 of 291
10
Economic setting
Transmission process globalisation has put a lid on inflation (temporary or permanent?)
Policy setting: monetary policy
Page 39 of 291
11
Conclusions economic impact
Inflation remains a risk
Modest growth impact
Redistribution of wealth to oil exporters
Page 40 of 291
12
Desirable policy response
Monetary policy?
General government- Lower fuel taxes?
- Budgetary stimulus?
- Tax oil industry’s profits?
- Market transparancy?
- Stimulate alternatives?
Page 41 of 291
13
Disclaimer
This presentation is provided to you for information purposes only. Before investing in any product of ABN AMRO Bank N.V., you should inform yourself about various consequences that you may encounter under the laws of your country. ABN AMRO Bank N.V. has taken all reasonable care to ensure that the information contained in this document is correct but does not accept liability for any misprints. ABN AMRO Bank N.V. reserves the right to make amendments to this presentation.
Page 42 of 291
Session I Part 2: Consequences of rising oil prices for financial stability
Page 43 of 291
Reassessing long-term commodity prices
June 2006
Jeffrey Currie Goldman Sachs International 44 (0)20 7774 6112 [email protected]
The Goldman Sachs Group, Inc. does and seeks to do business with companies covered in its research reports. As a result, investors should be aware that the firm may have a conflict of interest that could affect the objectivity of this report. Investors should consider this report as only a single factor in making their investment decision.
For important disclosures, see page 55, go to http://www.gs.com/research/hedge.html, or contact your investment representative.
The Goldman Sachs Group, Inc.
Page 44 of 291
The revenge of the old economy
Page 45 of 291
Goldman Sachs Global Investment Research 3
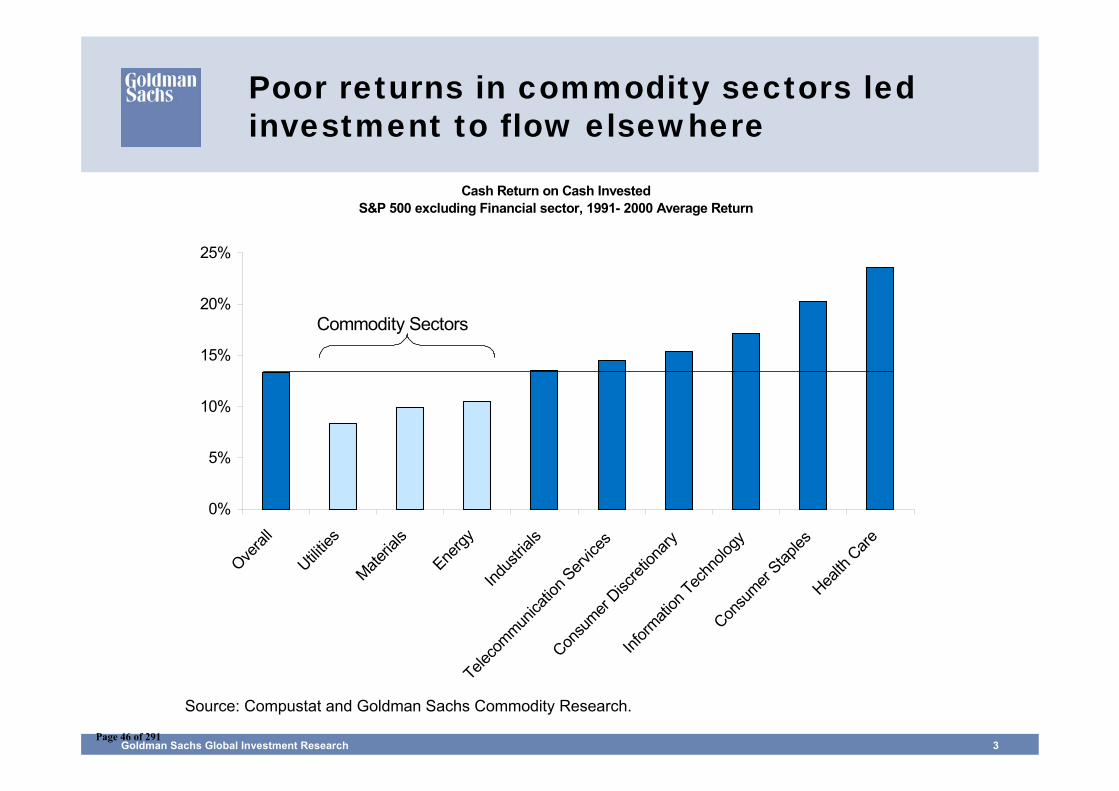
Poor returns in commodity sectors led investment to flow elsewhere
Source: Compustat and Goldman Sachs Commodity Research.
Cash Return on Cash InvestedS&P 500 excluding Financial sector, 1991- 2000 Average Return
0%
5%
10%
15%
20%
25%
Overal
l
Utilities
Materia
ls
Energy
Indus
trials
Teleco
mmunica
tion S
ervice
s
Consu
mer Disc
retion
ary
Inform
ation
Tech
nolog
yCon
sumer
Staples
Health
Care
Commodity Sectors
Page 46 of 291
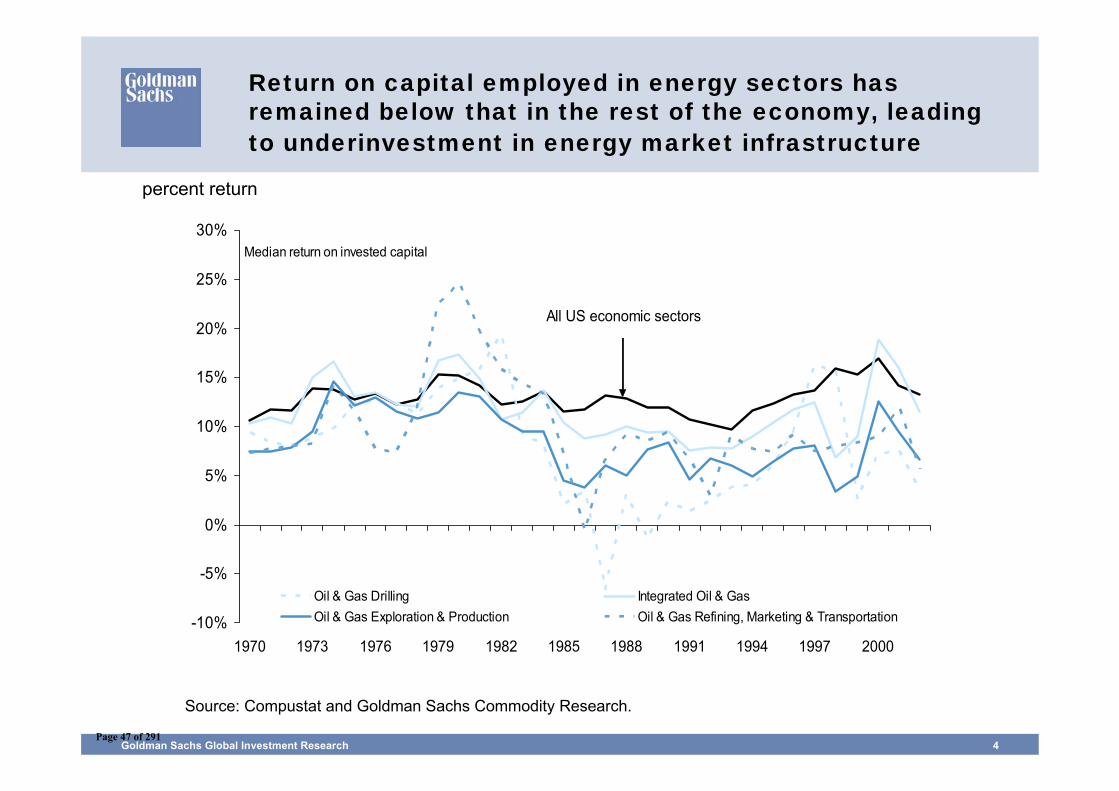
Goldman Sachs Global Investment Research 4
Return on capital employed in energy sectors has remained below that in the rest of the economy, leading to underinvestment in energy market infrastructure
Source: Compustat and Goldman Sachs Commodity Research.
percent return
-10%
-5%
0%
5%
10%
15%
20%
25%
30%
1970 1973 1976 1979 1982 1985 1988 1991 1994 1997 2000
Oil & Gas Drilling Integrated Oil & GasOil & Gas Exploration & Production Oil & Gas Refining, Marketing & Transportation
All US economic sectors
Median return on invested capital
Page 47 of 291

The transition between an exploitation phase and an investment phase: The revenge of the old economy, Part II
Page 48 of 291
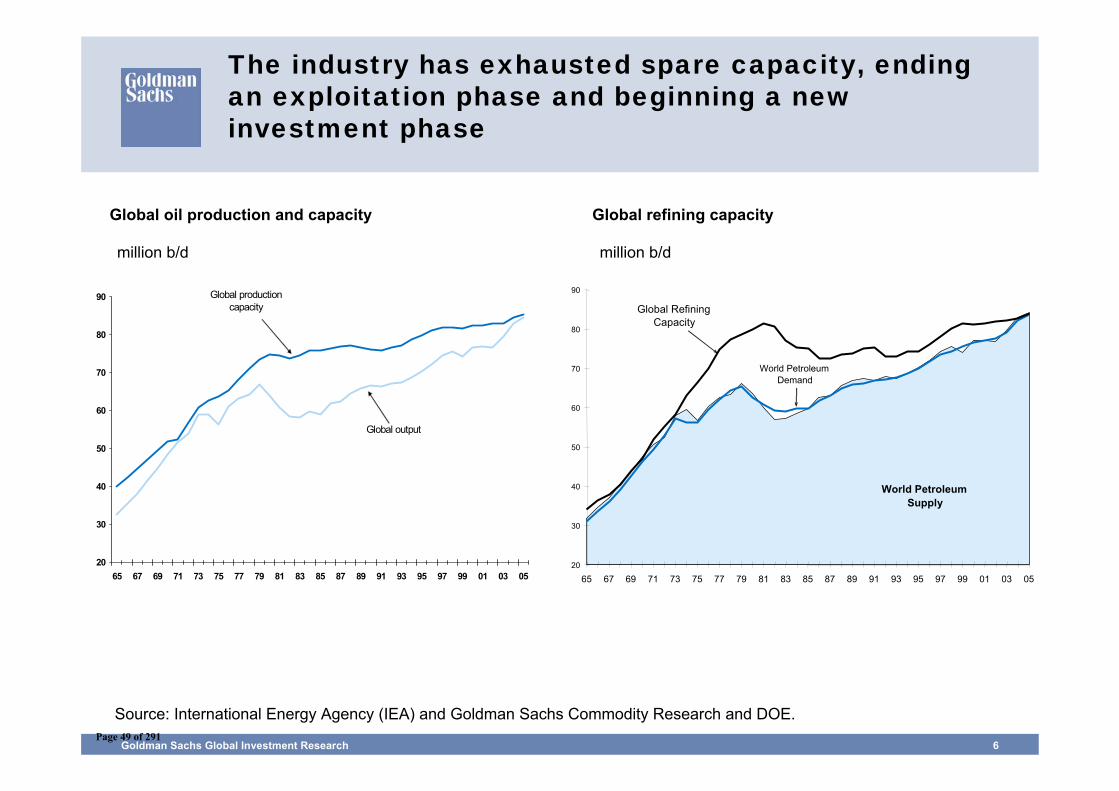
Goldman Sachs Global Investment Research 6
The industry has exhausted spare capacity, ending an exploitation phase and beginning a new investment phase
20
30
40
50
60
70
80
90
65 67 69 71 73 75 77 79 81 83 85 87 89 91 93 95 97 99 01 03 05
Global production capacity
Global output
Source: International Energy Agency (IEA) and Goldman Sachs Commodity Research and DOE.
million b/d
Global oil production and capacity Global refining capacity
million b/d
20
30
40
50
60
70
80
90
65 67 69 71 73 75 77 79 81 83 85 87 89 91 93 95 97 99 01 03 05
Global Refining Capacity
World Petroleum Supply
World Petroleum Demand
Page 49 of 291
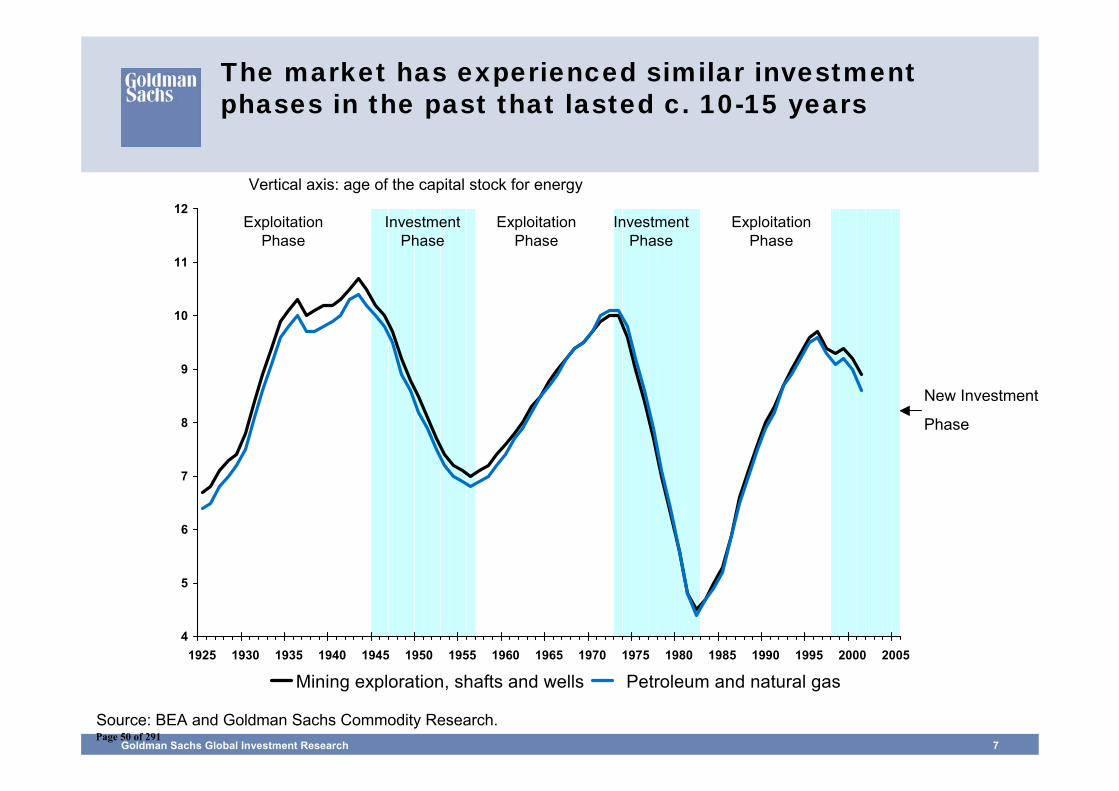
Goldman Sachs Global Investment Research 7
The market has experienced similar investment phases in the past that lasted c. 10-15 years
Source: BEA and Goldman Sachs Commodity Research.
Vertical axis: age of the capital stock for energy
New Investment
Phase
4
5
6
7
8
9
10
11
12
1925 1930 1935 1940 1945 1950 1955 1960 1965 1970 1975 1980 1985 1990 1995 2000 2005
Mining exploration, shafts and wells Petroleum and natural gas
Exploitation Phase
Investment Phase
Investment Phase
Exploitation Phase
Exploitation Phase
Page 50 of 291
Goldman Sachs Global Investment Research 8
0
1
2
3
4
5
6
7
1925 1930 1935 1940 1945 1950 1955 1960 1965 1970 1975 1980 1985 1990 1995 2000 2005
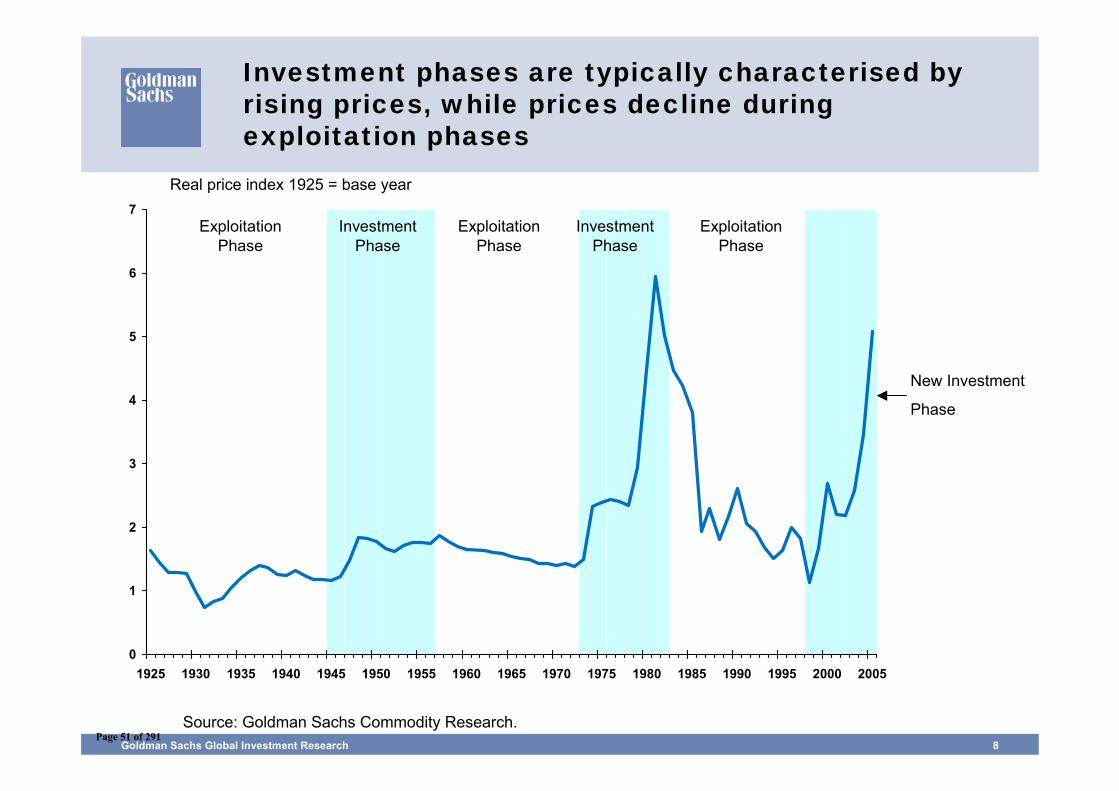
Investment Phase
Investment Phase
Exploitation Phase
Exploitation Phase
Exploitation Phase
Investment phases are typically characterised by rising prices, while prices decline during exploitation phases
Source: Goldman Sachs Commodity Research.
Real price index 1925 = base year
New Investment
Phase
Page 51 of 291
Goldman Sachs Global Investment Research 9
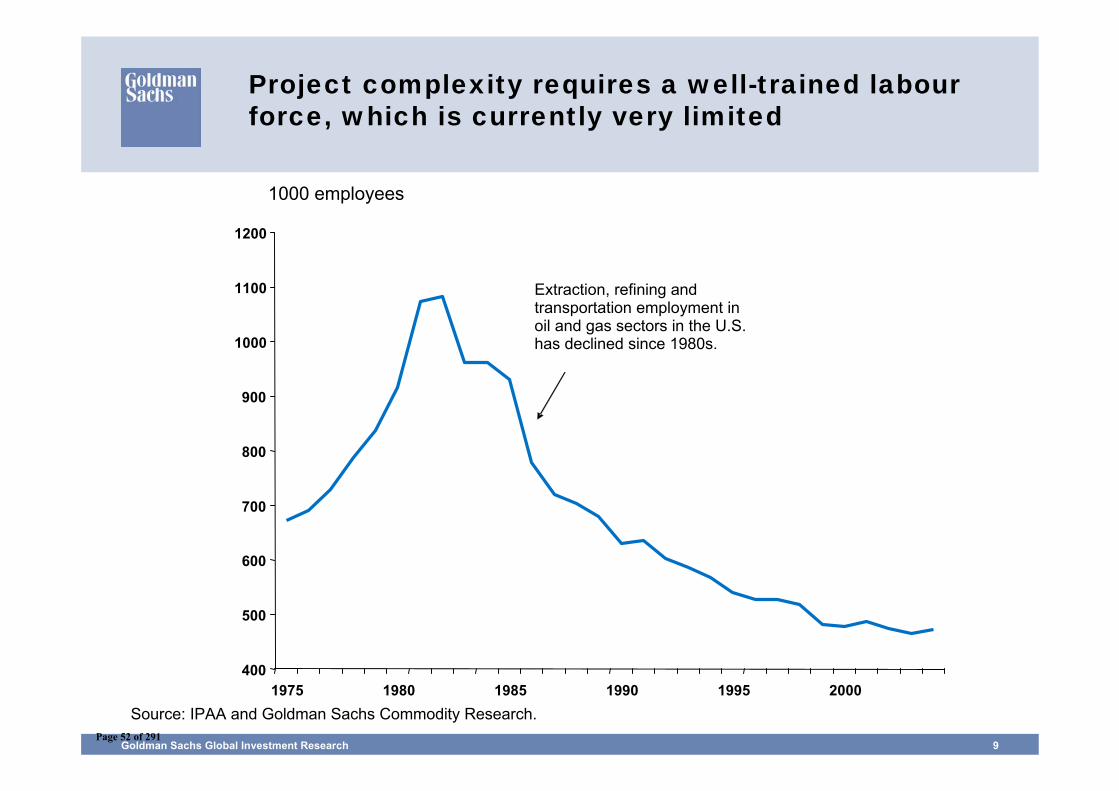
Project complexity requires a well-trained labour force, which is currently very limited
Source: IPAA and Goldman Sachs Commodity Research.
1000 employees
400
500
600
700
800
900
1000
1100
1200
1975 1980 1985 1990 1995 2000
Extraction, refining and transportation employment in oil and gas sectors in the U.S. has declined since 1980s.
Page 52 of 291
Goldman Sachs Global Investment Research 10
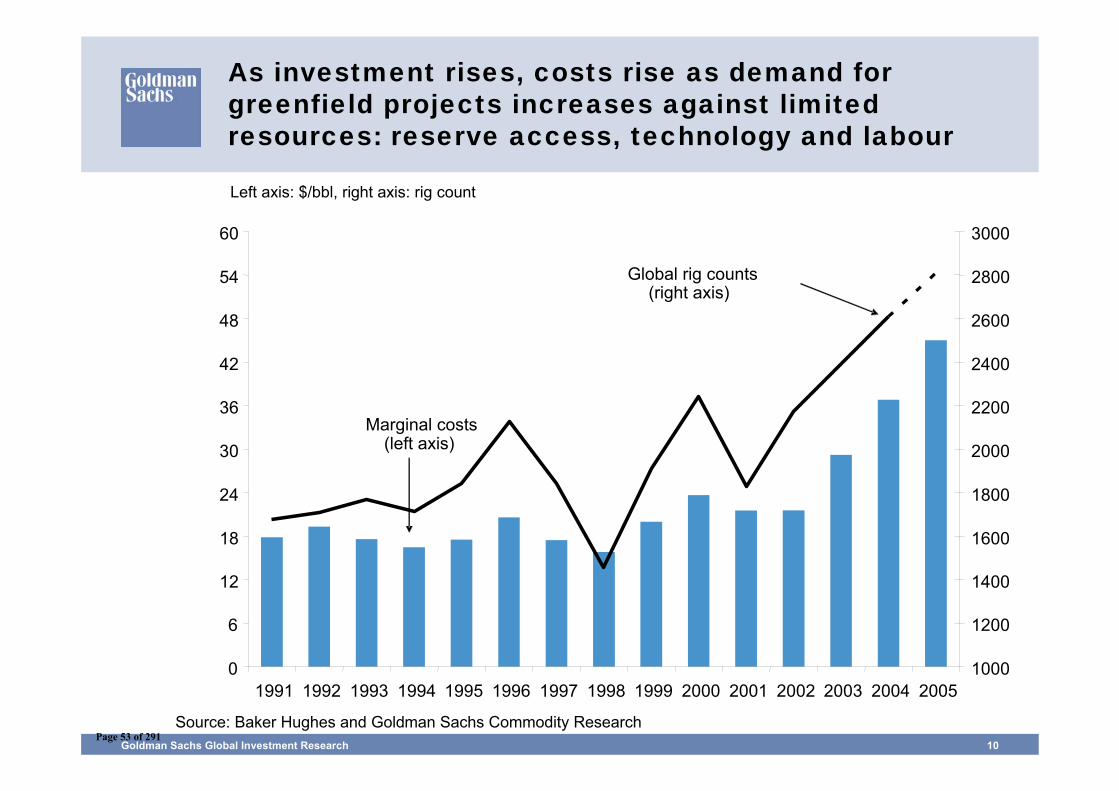
As investment rises, costs rise as demand for greenfield projects increases against limited resources: reserve access, technology and labour
Source: Baker Hughes and Goldman Sachs Commodity Research
Left axis: $/bbl, right axis: rig count
0
6
12
18
24
30
36
42
48
54
60
1991 1992 1993 1994 1995 1996 1997 1998 1999 2000 2001 2002 2003 2004 20051000
1200
1400
1600
1800
2000
2200
2400
2600
2800
3000
Marginal costs (left axis)
Global rig counts (right axis)
Page 53 of 291
Cost structure drives long-term price while fundamentals drive curve shape
Page 54 of 291
Goldman Sachs Global Investment Research 12
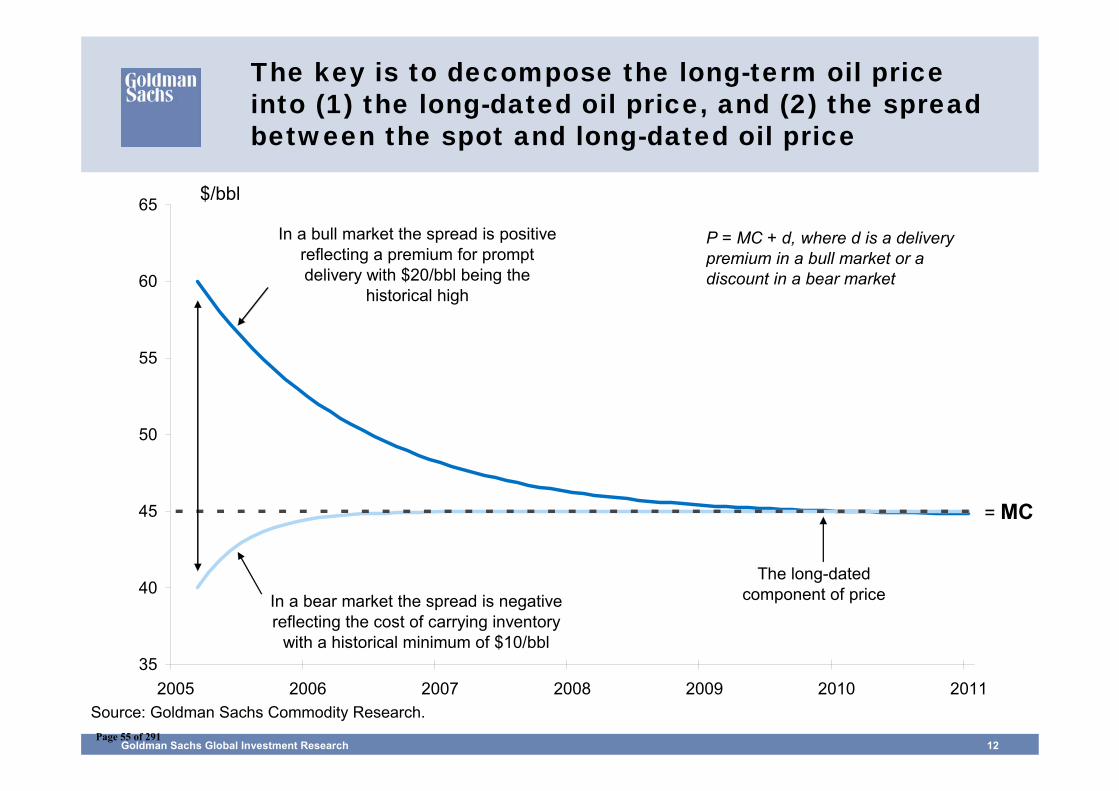
The key is to decompose the long-term oil price into (1) the long-dated oil price, and (2) the spread between the spot and long-dated oil price
$/bbl
Source: Goldman Sachs Commodity Research.
= MC
35
40
45
50
55
60
65
2005 2006 2007 2008 2009 2010 2011
The long-dated component of price
P = MC + d, where d is a delivery premium in a bull market or a discount in a bear market
In a bull market the spread is positive reflecting a premium for prompt delivery with $20/bbl being the
historical high
In a bear market the spread is negative reflecting the cost of carrying inventory
with a historical minimum of $10/bbl
Page 55 of 291
Goldman Sachs Global Investment Research 13
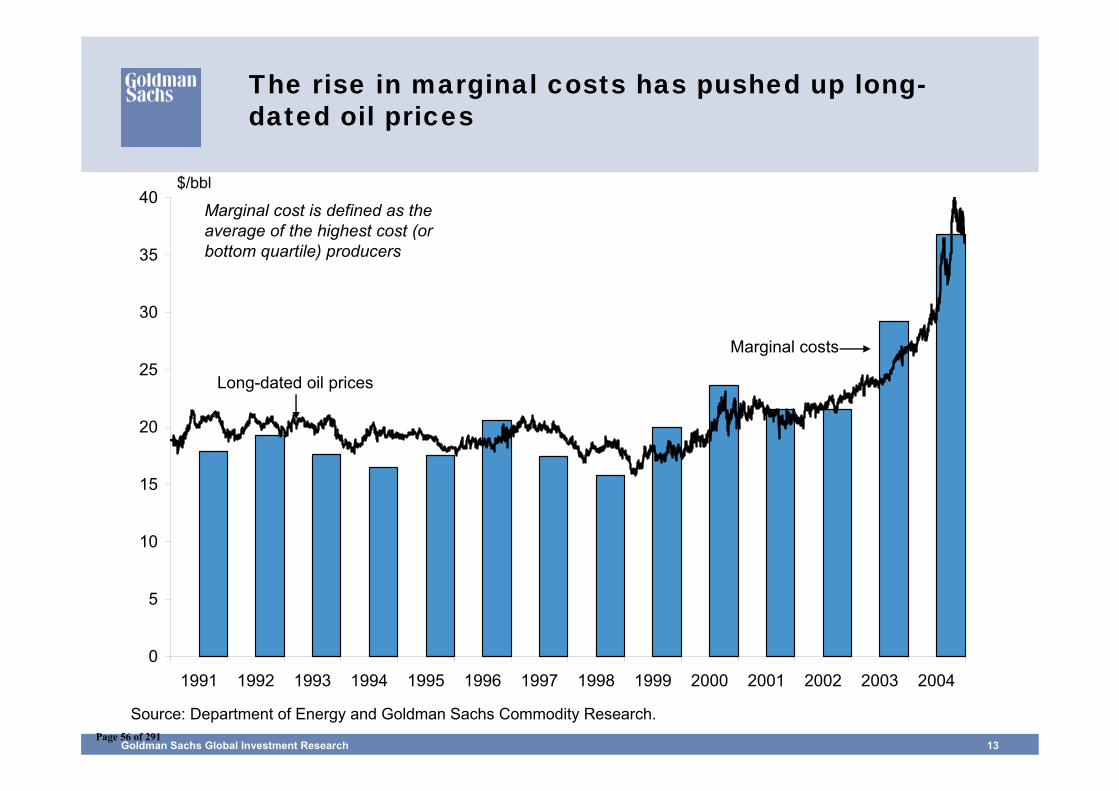
The rise in marginal costs has pushed up long-dated oil prices
Source: Department of Energy and Goldman Sachs Commodity Research.
$/bbl
0
5
10
15
20
25
30
35
40
1991 1992 1993 1994 1995 1996 1997 1998 1999 2000 2001 2002 2003 2004
Long-dated oil prices
Marginal costs
Marginal cost is defined as the average of the highest cost (or bottom quartile) producers
Page 56 of 291
Goldman Sachs Global Investment Research 14
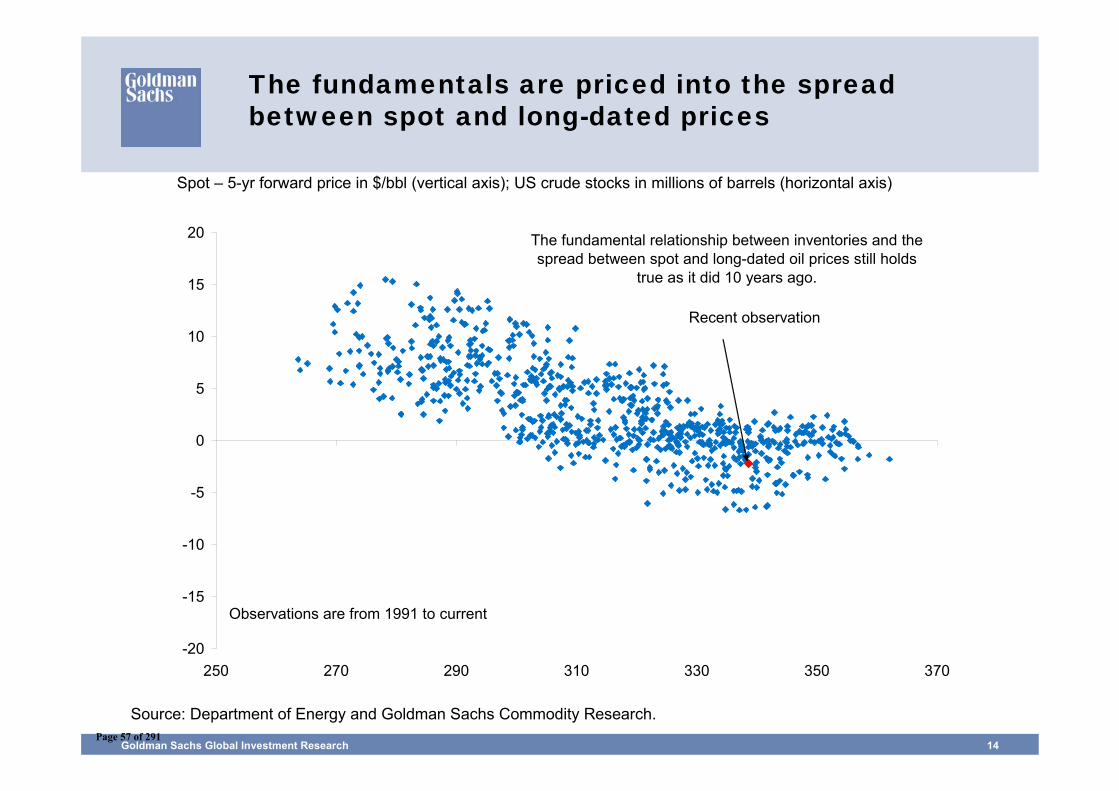
The fundamentals are priced into the spread between spot and long-dated prices
Source: Department of Energy and Goldman Sachs Commodity Research.
Spot – 5-yr forward price in $/bbl (vertical axis); US crude stocks in millions of barrels (horizontal axis)
-20
-15
-10
-5
0
5
10
15
20
250 270 290 310 330 350 370
Recent observation
Observations are from 1991 to current
The fundamental relationship between inventories and the spread between spot and long-dated oil prices still holds
true as it did 10 years ago.
Page 57 of 291

A cyclical bear market at $70/bbl
Page 58 of 291
Goldman Sachs Global Investment Research 16
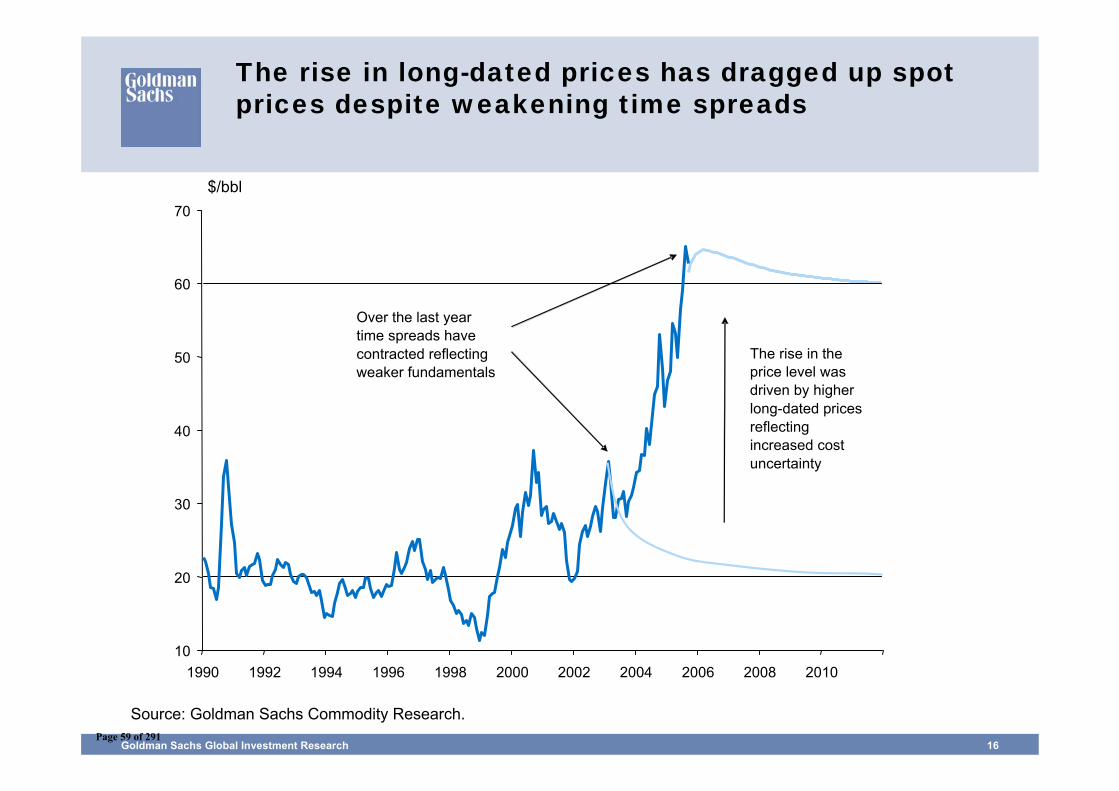
The rise in long-dated prices has dragged up spot prices despite weakening time spreads
Source: Goldman Sachs Commodity Research.
$/bbl
10
20
30
40
50
60
70
1990 1992 1994 1996 1998 2000 2002 2004 2006 2008 2010
The rise in the price level was driven by higher long-dated prices reflecting increased cost uncertainty
Over the last year time spreads have contracted reflecting weaker fundamentals
Page 59 of 291
Rebalancing the oil market
Page 60 of 291
Goldman Sachs Global Investment Research 18
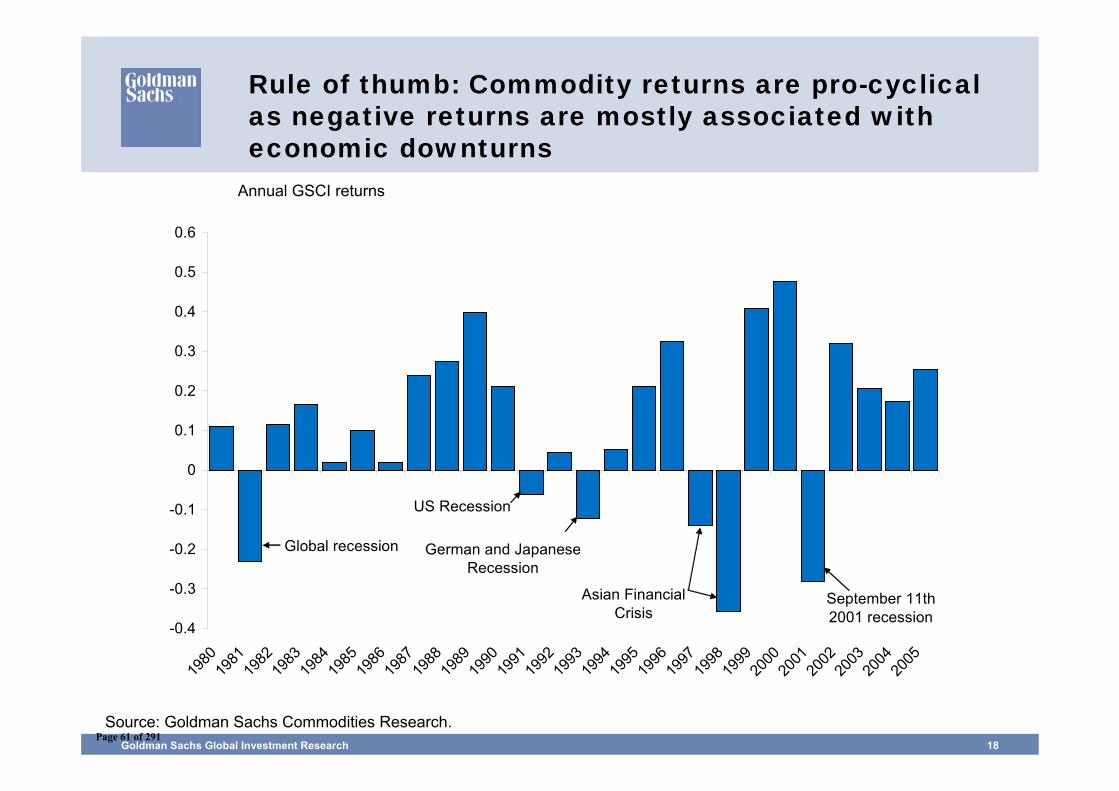
Rule of thumb: Commodity returns are pro-cyclical as negative returns are mostly associated with economic downturns
-0.4
-0.3
-0.2
-0.1
0
0.1
0.2
0.3
0.4
0.5
0.6
1980
1981
1982
1983
1984
1985
1986
1987
1988
1989
1990
1991
1992
1993
1994
1995
1996
1997
1998
1999
2000
2001
2002
2003
2004
2005
Global recession
US Recession
German and Japanese Recession
Asian Financial Crisis
September 11th 2001 recession
Source: Goldman Sachs Commodities Research.
Annual GSCI returns
Page 61 of 291
Goldman Sachs Global Investment Research 19
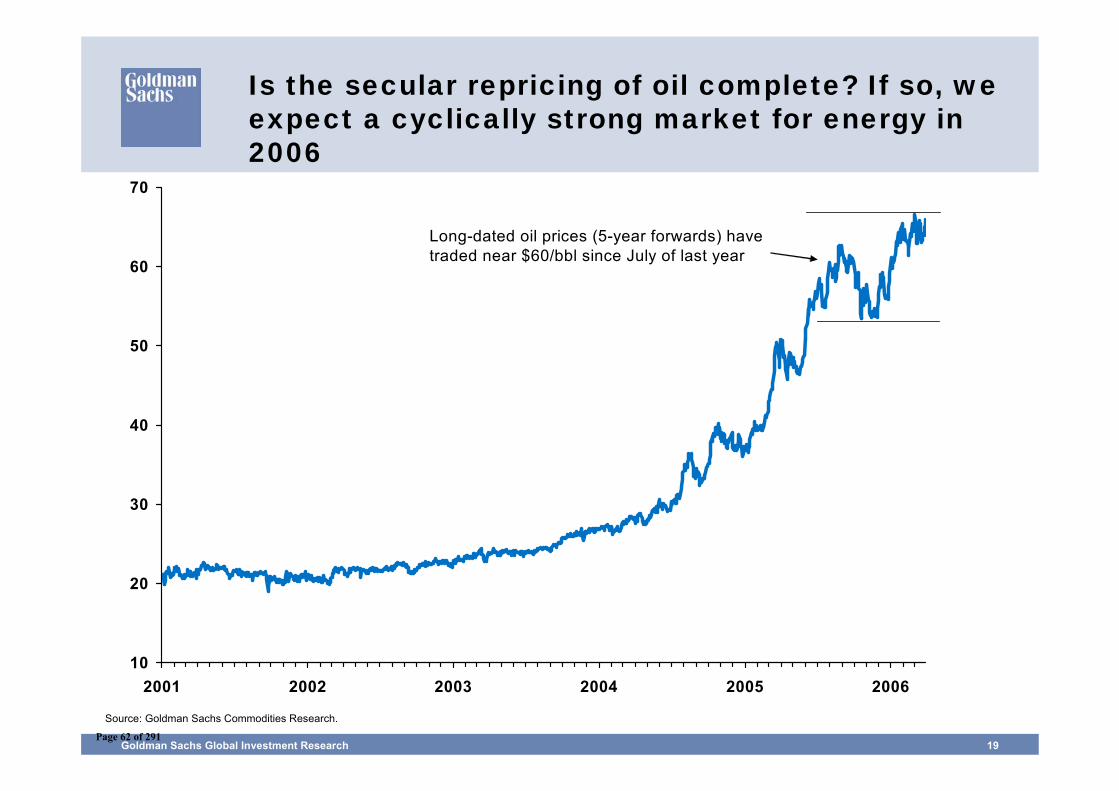
Is the secular repricing of oil complete? If so, we expect a cyclically strong market for energy in 2006
Source: Goldman Sachs Commodities Research.
10
20
30
40
50
60
70
2001 2002 2003 2004 2005 2006
Long-dated oil prices (5-year forwards) have traded near $60/bbl since July of last year
Page 62 of 291
Goldman Sachs Global Investment Research 20
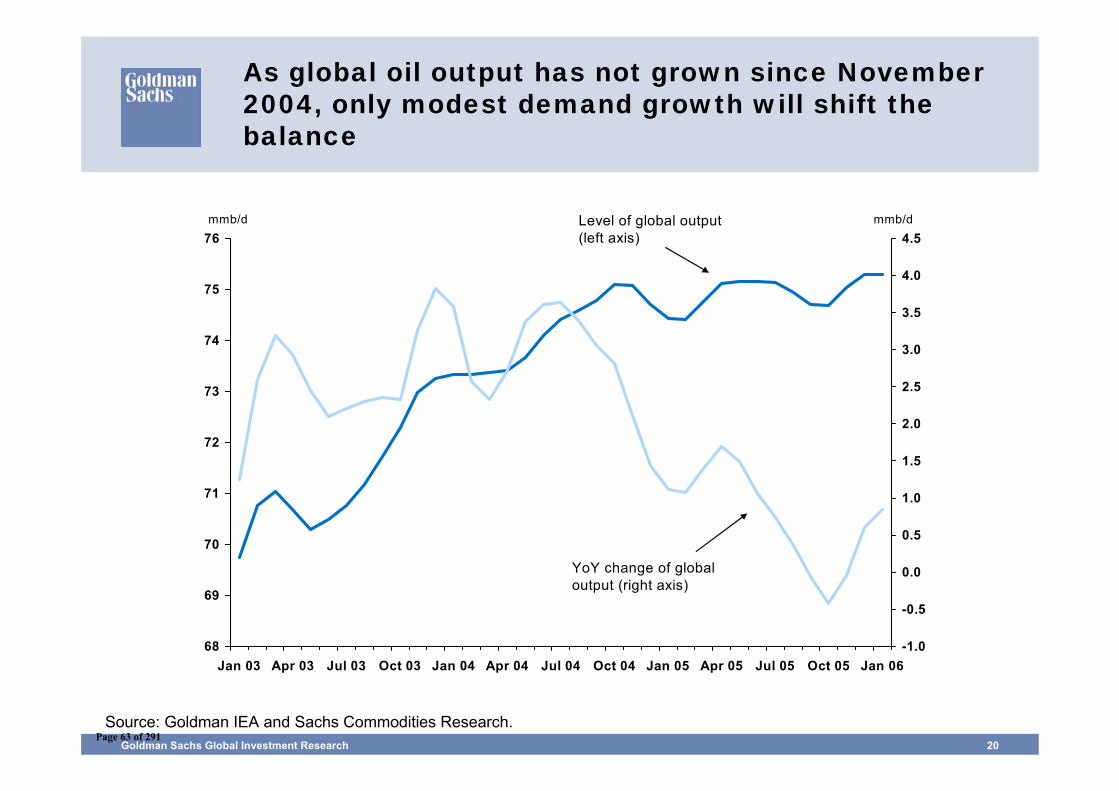
As global oil output has not grown since November 2004, only modest demand growth will shift the balance
68
69
70
71
72
73
74
75
76
Jan 03 Apr 03 Jul 03 Oct 03 Jan 04 Apr 04 Jul 04 Oct 04 Jan 05 Apr 05 Jul 05 Oct 05 Jan 06-1.0
-0.5
0.0
0.5
1.0
1.5
2.0
2.5
3.0
3.5
4.0
4.5Level of global output (left axis)
YoY change of global output (right axis)
mmb/d mmb/d
Source: Goldman IEA and Sachs Commodities Research.Page 63 of 291
Are metals going to follow energy in 2006?
Page 64 of 291
Goldman Sachs Global Investment Research 22
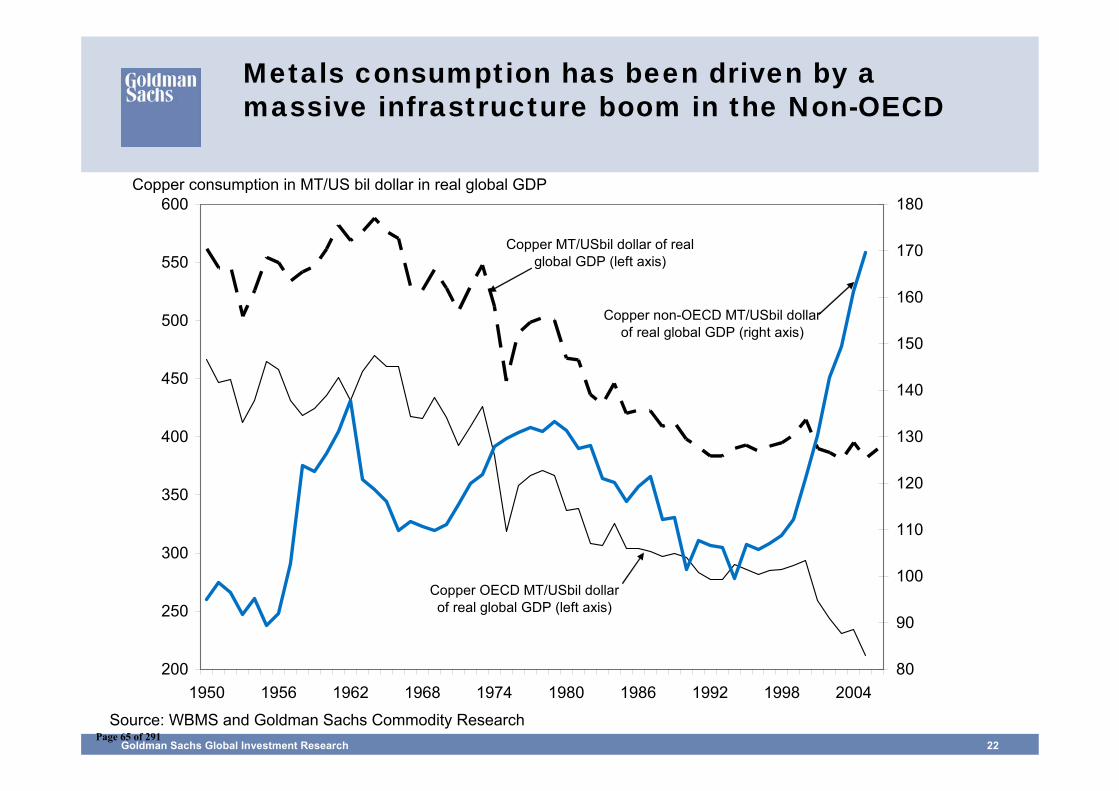
Metals consumption has been driven by a massive infrastructure boom in the Non-OECD
200
250
300
350
400
450
500
550
600
1950 1956 1962 1968 1974 1980 1986 1992 1998 200480
90
100
110
120
130
140
150
160
170
180
Copper MT/USbil dollar of real global GDP (left axis)
Copper OECD MT/USbil dollar of real global GDP (left axis)
Copper non-OECD MT/USbil dollar of real global GDP (right axis)
Source: WBMS and Goldman Sachs Commodity Research
Copper consumption in MT/US bil dollar in real global GDP
Page 65 of 291
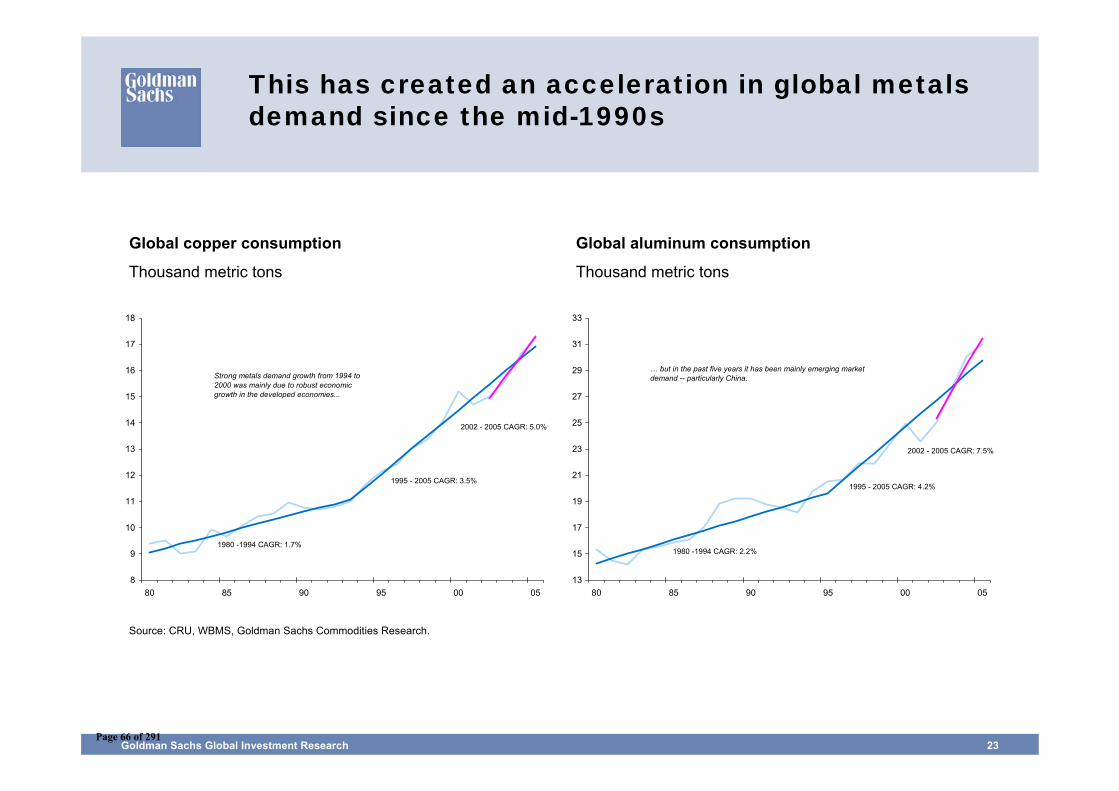
Goldman Sachs Global Investment Research 23
Source: CRU, WBMS, Goldman Sachs Commodities Research.
This has created an acceleration in global metals demand since the mid-1990s
Global copper consumption
Thousand metric tons
Global aluminum consumption
Thousand metric tons
8
9
10
11
12
13
14
15
16
17
18
80 85 90 95 00 05
1980 -1994 CAGR: 1.7%
1995 - 2005 CAGR: 3.5%
2002 - 2005 CAGR: 5.0%
Strong metals demand growth from 1994 to 2000 was mainly due to robust economic growth in the developed economies...
13
15
17
19
21
23
25
27
29
31
33
80 85 90 95 00 05
1980 -1994 CAGR: 2.2%
1995 - 2005 CAGR: 4.2%
2002 - 2005 CAGR: 7.5%
… but in the past five years it has been mainly emerging market demand -- particularly China.
Page 66 of 291
Goldman Sachs Global Investment Research 24
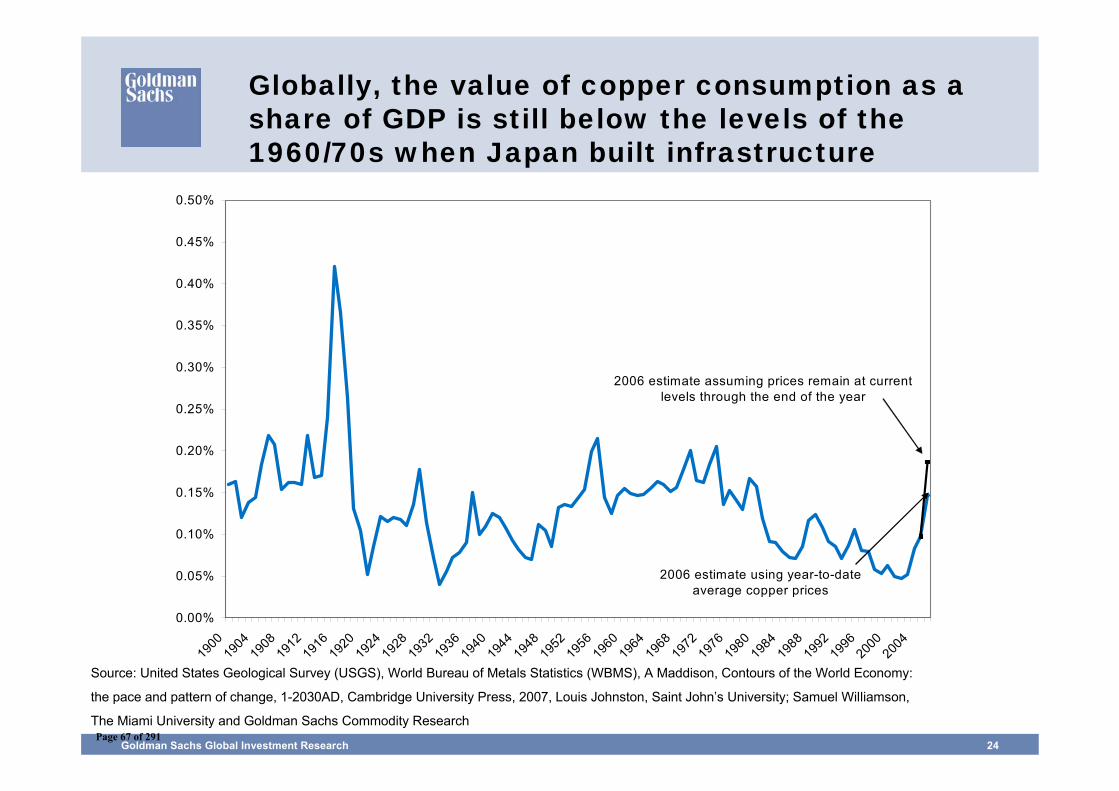
Globally, the value of copper consumption as a share of GDP is still below the levels of the 1960/70s when Japan built infrastructure
0.00%
0.05%
0.10%
0.15%
0.20%
0.25%
0.30%
0.35%
0.40%
0.45%
0.50%
1900
1904
1908
1912
1916
1920
1924
1928
1932
1936
1940
1944
1948
1952
1956
1960
1964
1968
1972
1976
1980
1984
1988
1992
1996
2000
2004
2006 estimate using year-to-date average copper prices
2006 estimate assuming prices remain at current levels through the end of the year
Source: United States Geological Survey (USGS), World Bureau of Metals Statistics (WBMS), A Maddison, Contours of the World Economy:
the pace and pattern of change, 1-2030AD, Cambridge University Press, 2007, Louis Johnston, Saint John’s University; Samuel Williamson,
The Miami University and Goldman Sachs Commodity ResearchPage 67 of 291
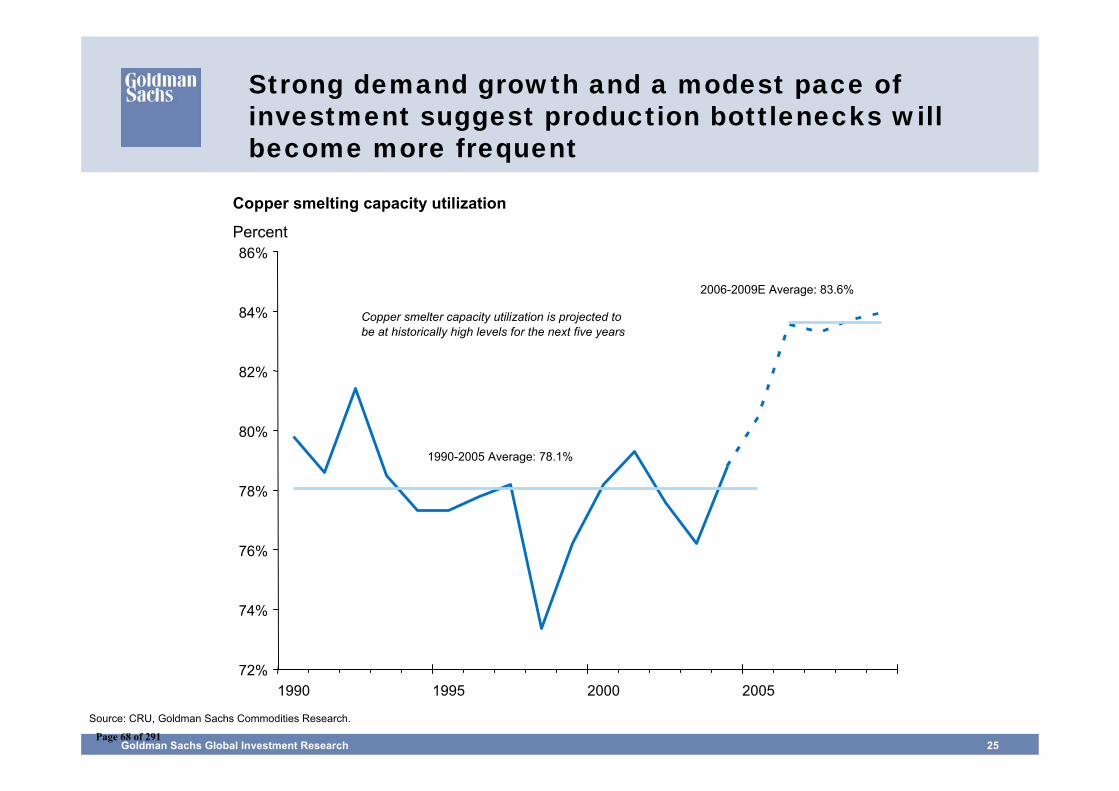
Goldman Sachs Global Investment Research 25
Source: CRU, Goldman Sachs Commodities Research.
Strong demand growth and a modest pace of investment suggest production bottlenecks will become more frequent
Copper smelting capacity utilization
Percent
72%
74%
76%
78%
80%
82%
84%
86%
1990 1995 2000 2005
1990-2005 Average: 78.1%
2006-2009E Average: 83.6%
Copper smelter capacity utilization is projected to be at historically high levels for the next five years
Page 68 of 291
Goldman Sachs Global Investment Research 26
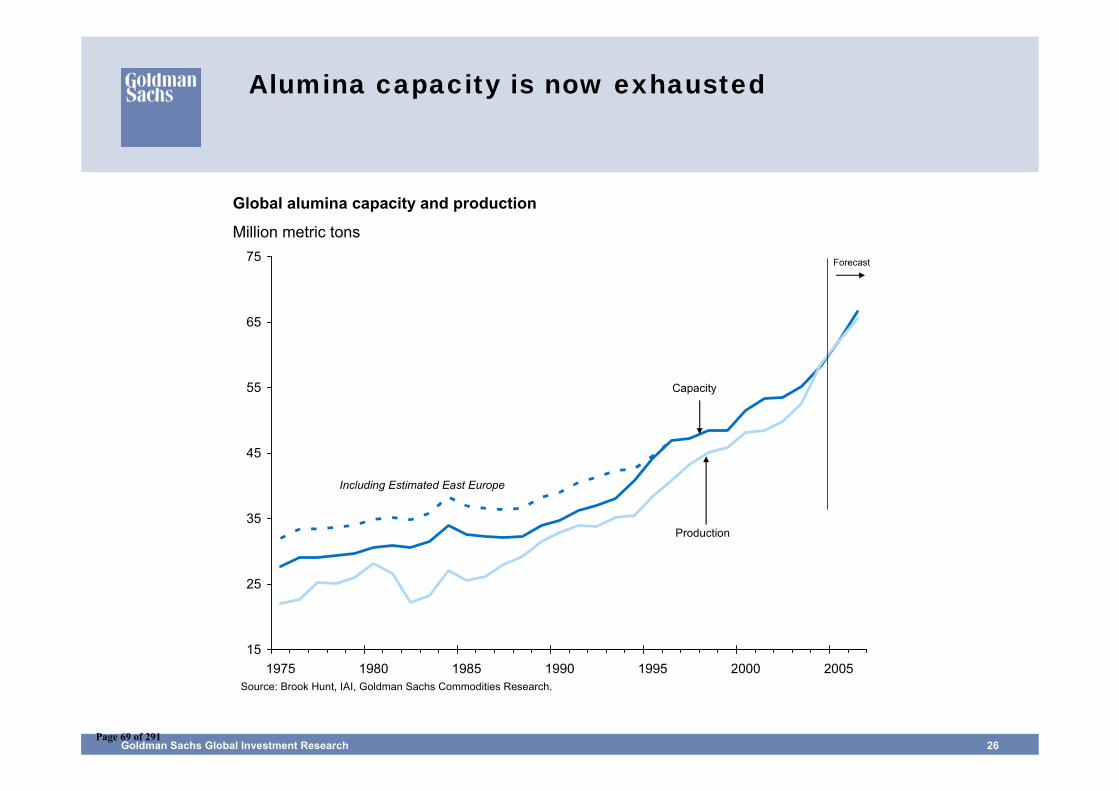
Source: Brook Hunt, IAI, Goldman Sachs Commodities Research.
Alumina capacity is now exhausted
Global alumina capacity and production
Million metric tons
15
25
35
45
55
65
75
1975 1980 1985 1990 1995 2000 2005
Including Estimated East Europe
Capacity
Production
Forecast
Page 69 of 291
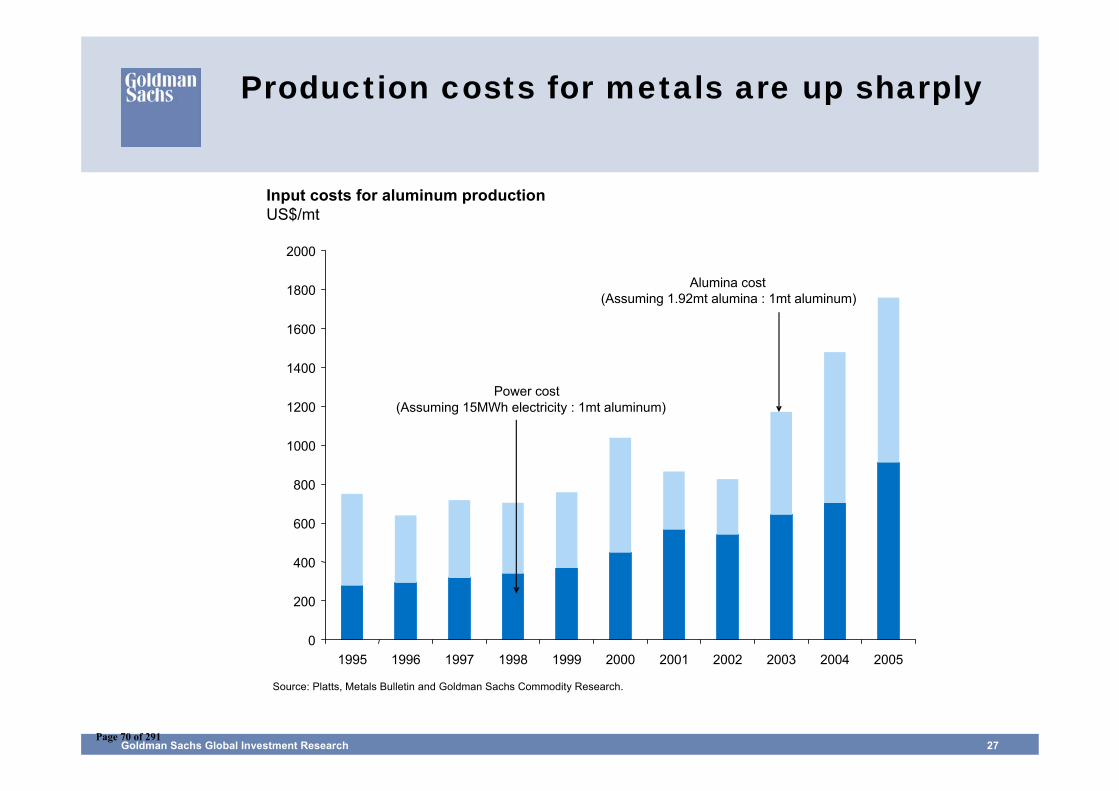
Goldman Sachs Global Investment Research 27
Production costs for metals are up sharply
Input costs for aluminum productionUS$/mt
Source: Platts, Metals Bulletin and Goldman Sachs Commodity Research.
0
200
400
600
800
1000
1200
1400
1600
1800
2000
1995 1996 1997 1998 1999 2000 2001 2002 2003 2004 2005
Power cost (Assuming 15MWh electricity : 1mt aluminum)
Alumina cost(Assuming 1.92mt alumina : 1mt aluminum)
Page 70 of 291
Goldman Sachs Global Investment Research 28
Metals producers are facing an increasingly difficult operating environment
• Producer country governments are raising taxesExamples: Chile has just adopted a new tax law which will require mining companies to pay up to 5% of operating income, while the new Peruvian tax requiring payment of up to 3% of mineral sales has just become effective
• Labour unions are demanding higher payExamples: Just in copper in recent months, we have the strike at Asarco, as well as labour actions at KCM and Chambishi in Zambia, and Zaldivar and Escondida Norte in Chile
• Opposition from local communities is increasingExample: BHP pays 3% of the Tintaya mine’s profits to Peruvian community groups, but unrest continues
• Infrastructure to support mining operations is inadequateExample: Heavy Chinese investment is needed in Brazilian rail and port infrastructure to allow the further development of the Brazilian resource extraction industry
Page 71 of 291
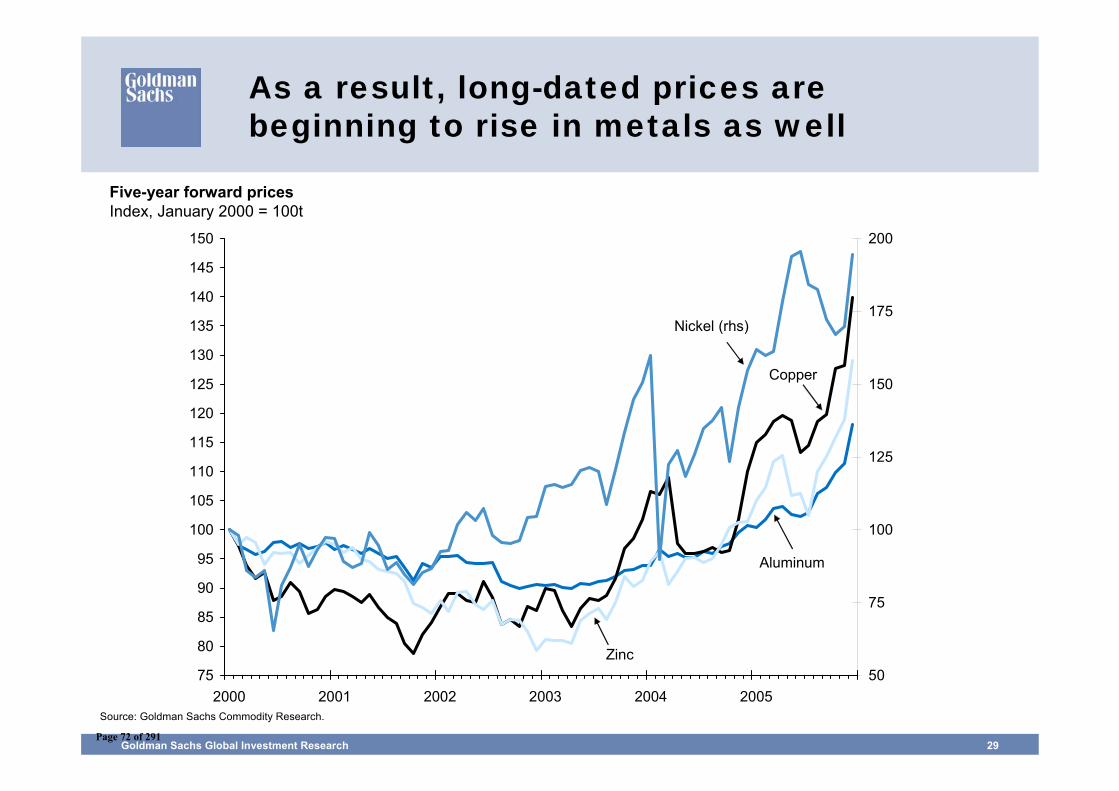
Goldman Sachs Global Investment Research 29
As a result, long-dated prices are beginning to rise in metals as well
75
80
85
90
95
100
105
110
115
120
125
130
135
140
145
150
2000 2001 2002 2003 2004 200550
75
100
125
150
175
200
Nickel (rhs)
Copper
Aluminum
Zinc
Five-year forward pricesIndex, January 2000 = 100t
Source: Goldman Sachs Commodity Research.
Page 72 of 291
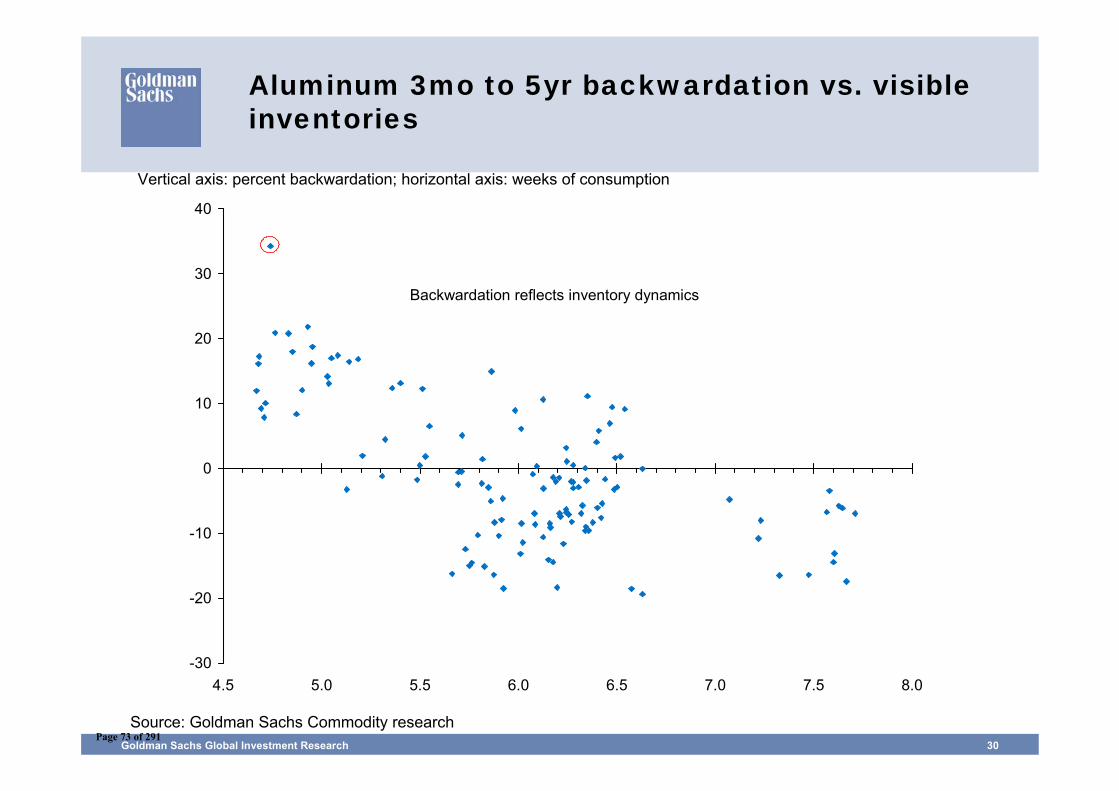
Goldman Sachs Global Investment Research 30
Aluminum 3mo to 5yr backwardation vs. visible inventories
-30
-20
-10
0
10
20
30
40
4.5 5.0 5.5 6.0 6.5 7.0 7.5 8.0
Backwardation reflects inventory dynamics
Source: Goldman Sachs Commodity research
Vertical axis: percent backwardation; horizontal axis: weeks of consumption
Page 73 of 291
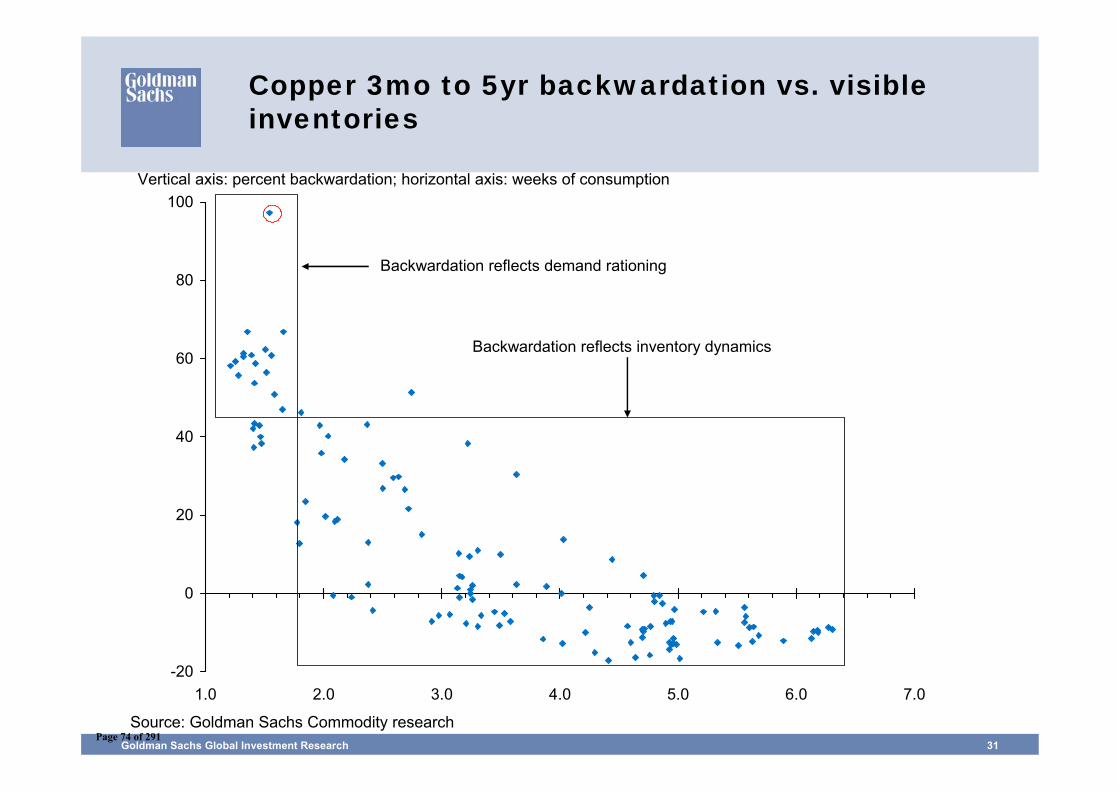
Goldman Sachs Global Investment Research 31
Copper 3mo to 5yr backwardation vs. visible inventories
-20
0
20
40
60
80
100
1.0 2.0 3.0 4.0 5.0 6.0 7.0
Backwardation reflects demand rationing
Backwardation reflects inventory dynamics
Source: Goldman Sachs Commodity research
Vertical axis: percent backwardation; horizontal axis: weeks of consumption
Page 74 of 291
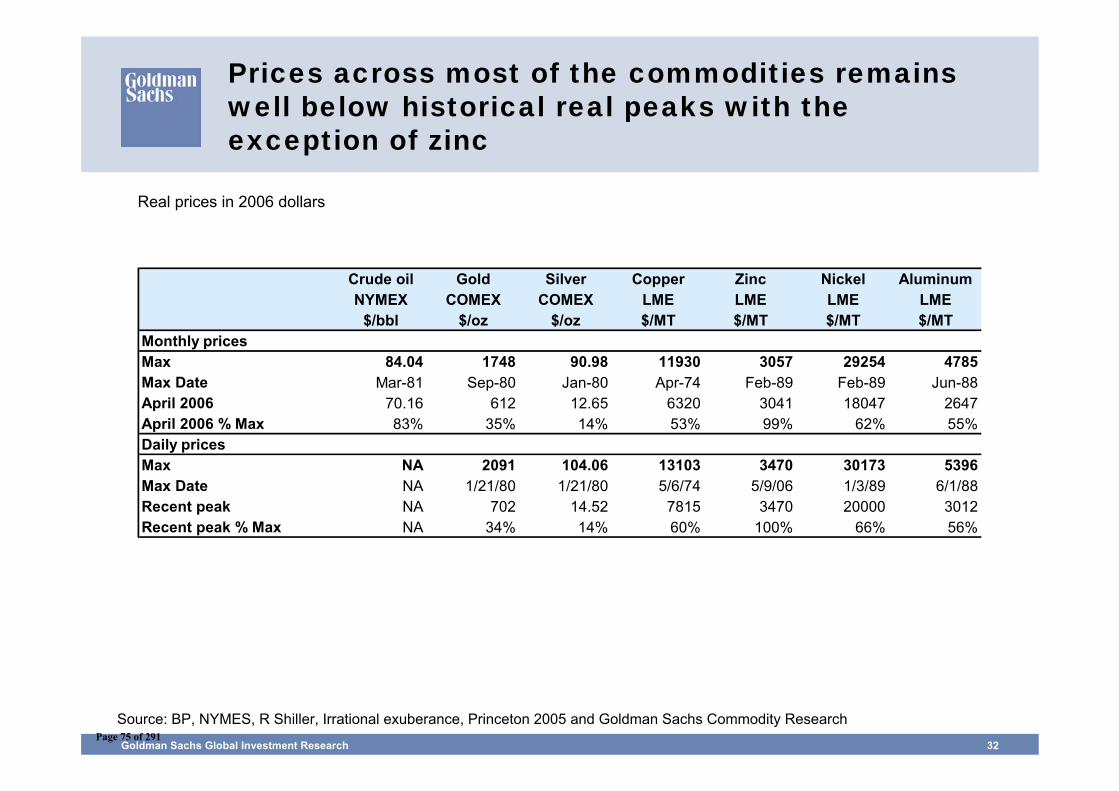
Goldman Sachs Global Investment Research 32
Prices across most of the commodities remains well below historical real peaks with the exception of zinc
Crude oil Gold Silver Copper Zinc Nickel AluminumNYMEX COMEX COMEX LME LME LME LME
$/bbl $/oz $/oz $/MT $/MT $/MT $/MTMonthly pricesMax 84.04 1748 90.98 11930 3057 29254 4785Max Date Mar-81 Sep-80 Jan-80 Apr-74 Feb-89 Feb-89 Jun-88April 2006 70.16 612 12.65 6320 3041 18047 2647April 2006 % Max 83% 35% 14% 53% 99% 62% 55%Daily pricesMax NA 2091 104.06 13103 3470 30173 5396Max Date NA 1/21/80 1/21/80 5/6/74 5/9/06 1/3/89 6/1/88Recent peak NA 702 14.52 7815 3470 20000 3012Recent peak % Max NA 34% 14% 60% 100% 66% 56%
Source: BP, NYMES, R Shiller, Irrational exuberance, Princeton 2005 and Goldman Sachs Commodity Research
Real prices in 2006 dollars
Page 75 of 291
Gold has diverged from fundamentals
Page 76 of 291
Goldman Sachs Global Investment Research 34
Source: LBMA and Goldman Sachs Commodity Research.
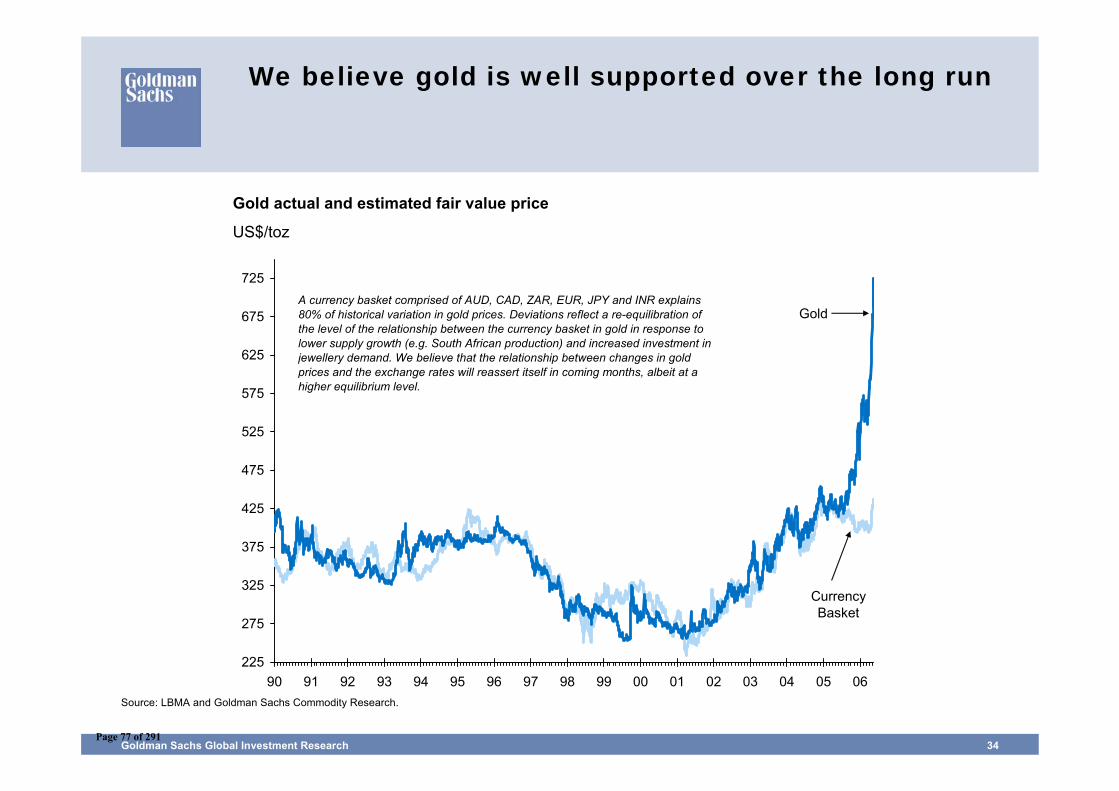
We believe gold is well supported over the long run
Gold actual and estimated fair value price
US$/toz
225
275
325
375
425
475
525
575
625
675
725
90 91 92 93 94 95 96 97 98 99 00 01 02 03 04 05 06
Gold
Currency Basket
A currency basket comprised of AUD, CAD, ZAR, EUR, JPY and INR explains 80% of historical variation in gold prices. Deviations reflect a re-equilibration of the level of the relationship between the currency basket in gold in response to lower supply growth (e.g. South African production) and increased investment in jewellery demand. We believe that the relationship between changes in gold prices and the exchange rates will reassert itself in coming months, albeit at a higher equilibrium level.
Page 77 of 291
Goldman Sachs Global Investment Research 35
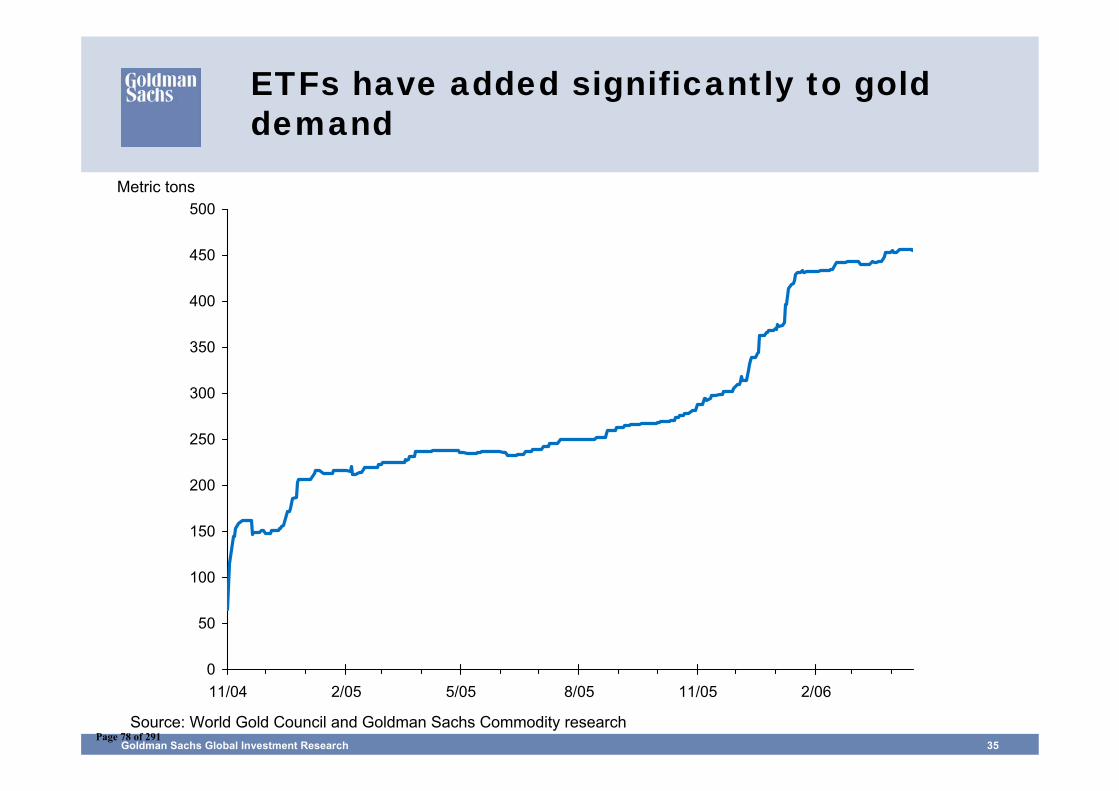
ETFs have added significantly to gold demand
0
50
100
150
200
250
300
350
400
450
500
11/04 2/05 5/05 8/05 11/05 2/06
Source: World Gold Council and Goldman Sachs Commodity research
Metric tons
Page 78 of 291
Goldman Sachs Global Investment Research 36
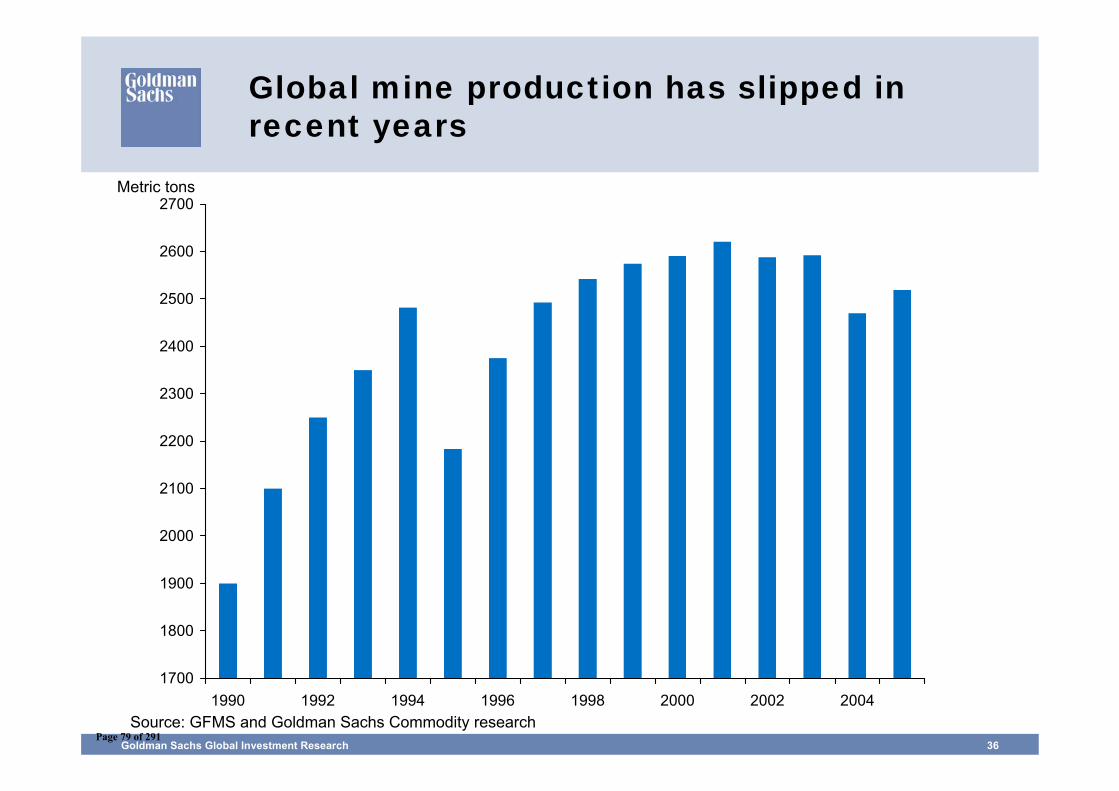
Global mine production has slipped in recent years
1700
1800
1900
2000
2100
2200
2300
2400
2500
2600
2700
1990 1992 1994 1996 1998 2000 2002 2004Source: GFMS and Goldman Sachs Commodity research
Metric tons
Page 79 of 291
Goldman Sachs Global Investment Research 37
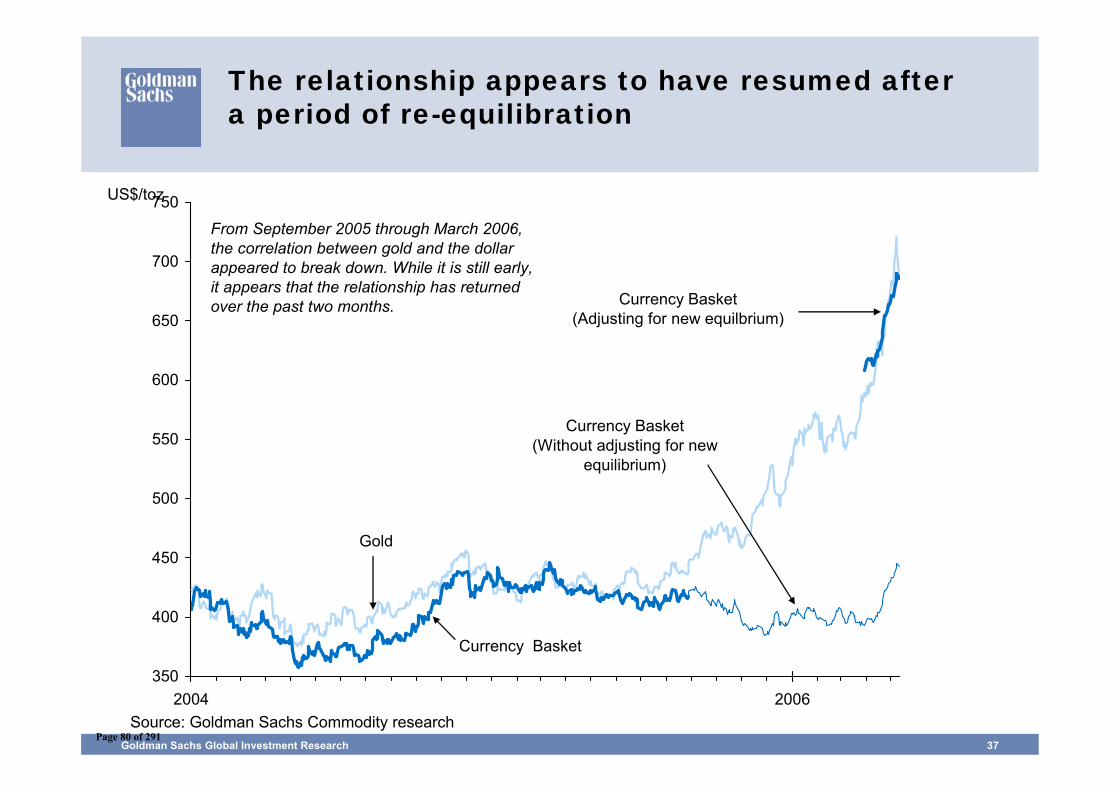
The relationship appears to have resumed after a period of re-equilibration
350
400
450
500
550
600
650
700
750
2004 2006
Gold
Currency Basket(Adjusting for new equilbrium)
Currency Basket
Currency Basket(Without adjusting for new
equilibrium)
From September 2005 through March 2006, the correlation between gold and the dollar appeared to break down. While it is still early, it appears that the relationship has returned over the past two months.
Source: Goldman Sachs Commodity research
US$/toz
Page 80 of 291
Investment uncertainty makes finding a new equilibrium difficult and generates significant upside risk
Page 81 of 291
Goldman Sachs Global Investment Research 39
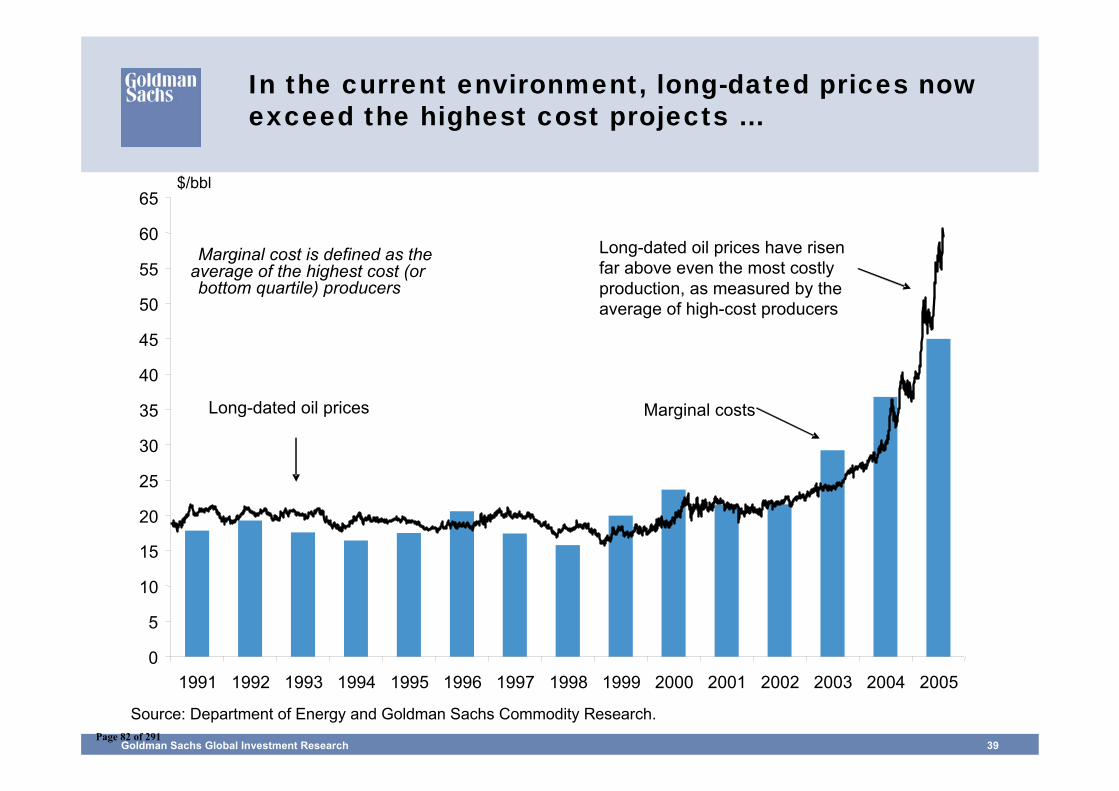
In the current environment, long-dated prices now exceed the highest cost projects …
Source: Department of Energy and Goldman Sachs Commodity Research.
$/bbl
0
5
10
15
20
25
30
35
40
45
50
55
60
65
1991 1992 1993 1994 1995 1996 1997 1998 1999 2000 2001 2002 2003 2004 2005
Long-dated oil prices Marginal costs
Long-dated oil prices have risen far above even the most costly production, as measured by the average of high-cost producers
average of the highest cost (or Marginal cost is defined as the
bottom quartile) producers
Page 82 of 291
Goldman Sachs Global Investment Research 40
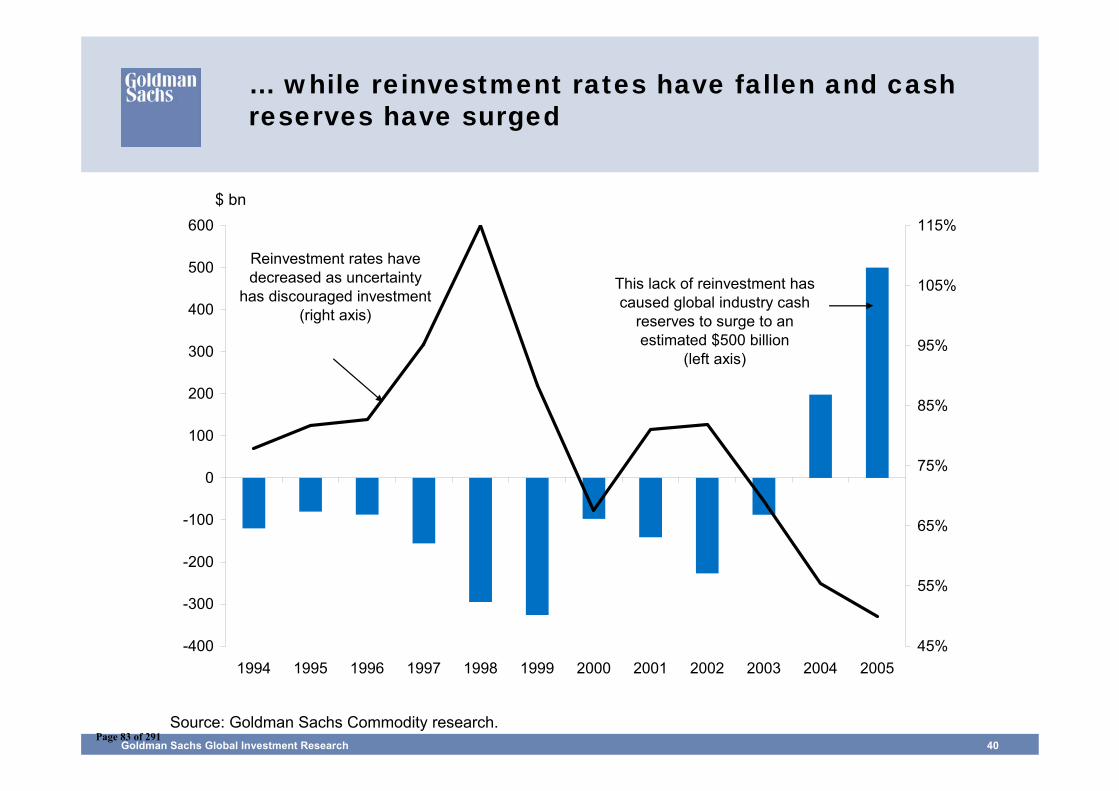
… while reinvestment rates have fallen and cash reserves have surged
Source: Goldman Sachs Commodity research.
-400
-300
-200
-100
0
100
200
300
400
500
600
1994 1995 1996 1997 1998 1999 2000 2001 2002 2003 2004 200545%
55%
65%
75%
85%
95%
105%
115%
This lack of reinvestment has caused global industry cash
reserves to surge to an estimated $500 billion
(left axis)
Reinvestment rates have decreased as uncertainty
has discouraged investment (right axis)
$ bn
Page 83 of 291
Goldman Sachs Global Investment Research 41
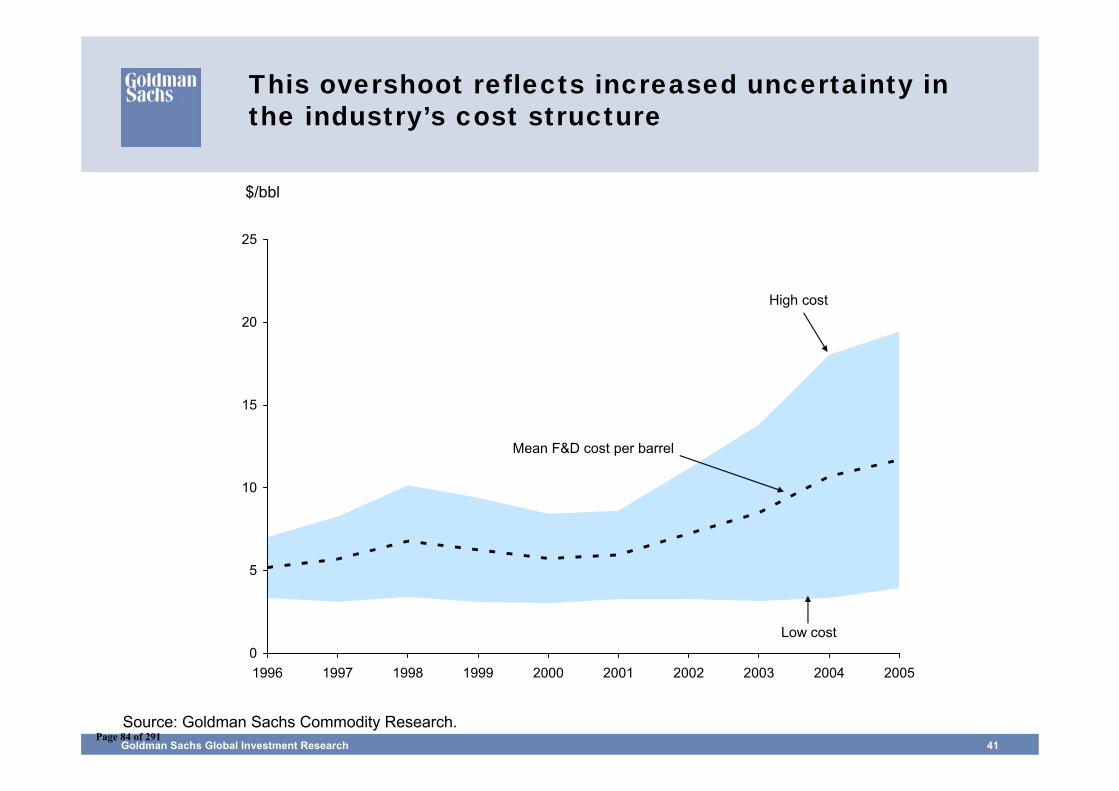
This overshoot reflects increased uncertainty in the industry’s cost structure
Source: Goldman Sachs Commodity Research.
$/bbl
0
5
10
15
20
25
1996 1997 1998 1999 2000 2001 2002 2003 2004 2005
Mean F&D cost per barrel
High cost
Low cost
Page 84 of 291
Goldman Sachs Global Investment Research 42
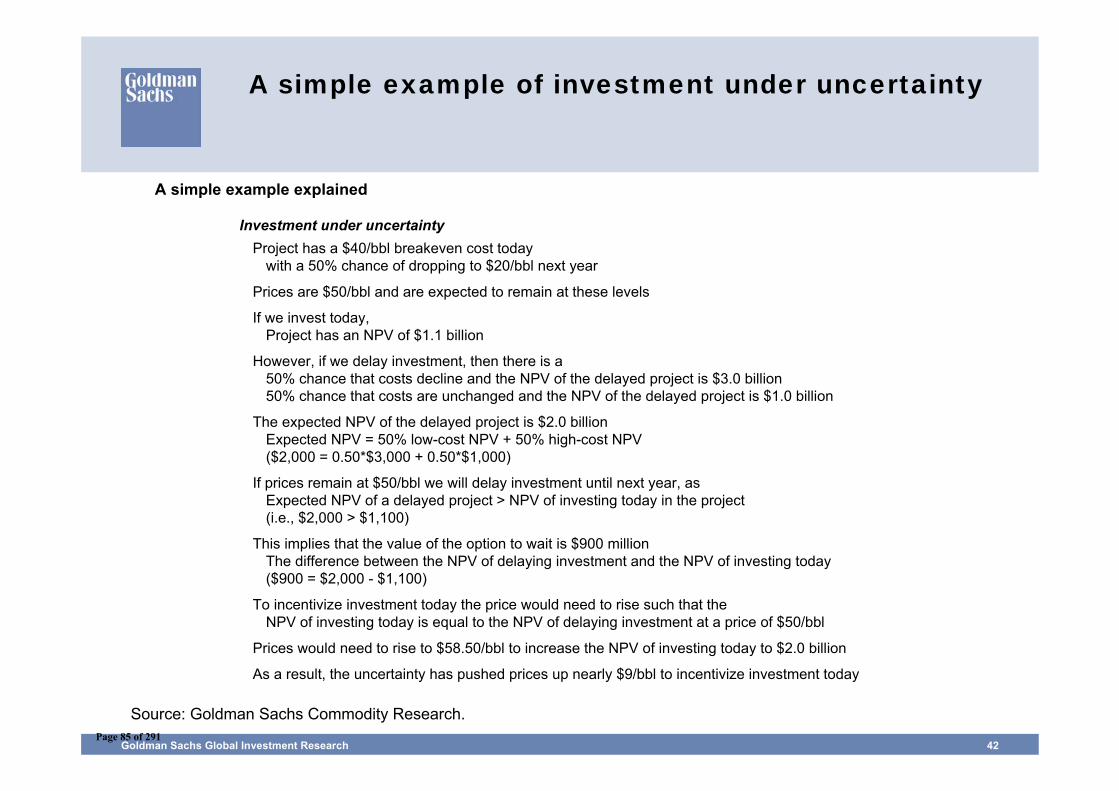
A simple example of investment under uncertainty
A simple example explained
Source: Goldman Sachs Commodity Research.
Investment under uncertaintyProject has a $40/bbl breakeven cost today
with a 50% chance of dropping to $20/bbl next year
Prices are $50/bbl and are expected to remain at these levels
If we invest today,Project has an NPV of $1.1 billion
However, if we delay investment, then there is a 50% chance that costs decline and the NPV of the delayed project is $3.0 billion50% chance that costs are unchanged and the NPV of the delayed project is $1.0 billion
The expected NPV of the delayed project is $2.0 billionExpected NPV = 50% low-cost NPV + 50% high-cost NPV($2,000 = 0.50*$3,000 + 0.50*$1,000)
If prices remain at $50/bbl we will delay investment until next year, asExpected NPV of a delayed project > NPV of investing today in the project(i.e., $2,000 > $1,100)
This implies that the value of the option to wait is $900 millionThe difference between the NPV of delaying investment and the NPV of investing today($900 = $2,000 - $1,100)
To incentivize investment today the price would need to rise such that theNPV of investing today is equal to the NPV of delaying investment at a price of $50/bbl
Prices would need to rise to $58.50/bbl to increase the NPV of investing today to $2.0 billion
As a result, the uncertainty has pushed prices up nearly $9/bbl to incentivize investment today
Page 85 of 291
Goldman Sachs Global Investment Research 43
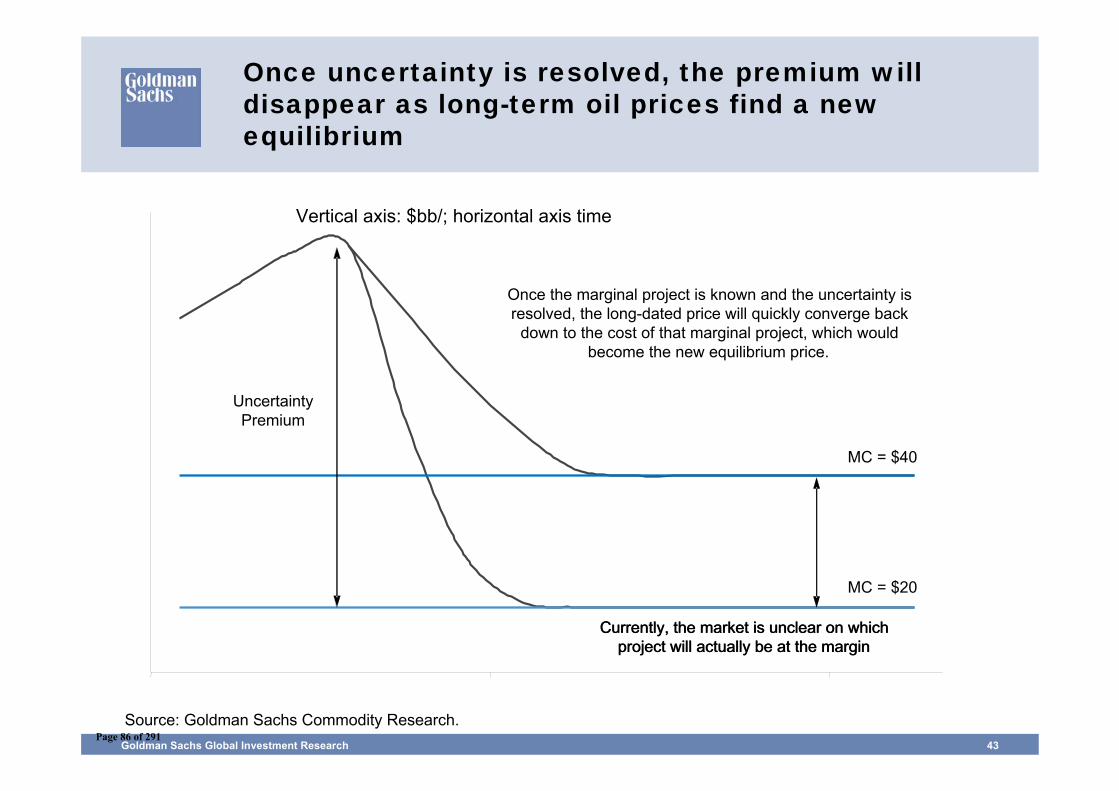
Once uncertainty is resolved, the premium will disappear as long-term oil prices find a new equilibrium
Vertical axis: $bb/; horizontal axis time
Source: Goldman Sachs Commodity Research.
Uncertainty Premium
Once the marginal project is known and the uncertainty is resolved, the long-dated price will quickly converge back
down to the cost of that marginal project, which would become the new equilibrium price.
MC = $40
MC = $20
Currently, the market is unclear on which project will actually be at the margin
Currently, the market is unclear on which project will actually be at the margin
Page 86 of 291
Agriculture prices are likely to be supported by low inventories, Chinese draught, and bio-fuel demand
Page 87 of 291
Goldman Sachs Global Investment Research 45
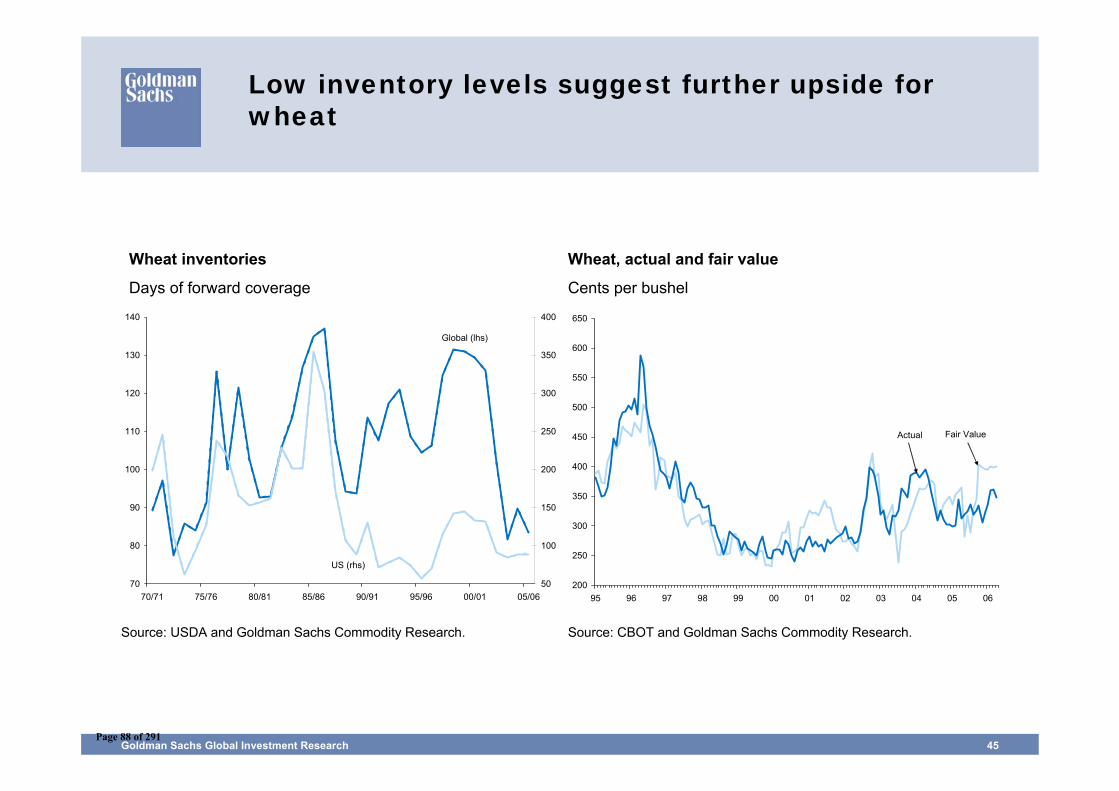
Low inventory levels suggest further upside for wheat
Wheat inventories
Days of forward coverage
Source: USDA and Goldman Sachs Commodity Research.
Wheat, actual and fair value
Cents per bushel
Source: CBOT and Goldman Sachs Commodity Research.
70
80
90
100
110
120
130
140
70/71 75/76 80/81 85/86 90/91 95/96 00/01 05/0650
100
150
200
250
300
350
400
Global (lhs)
US (rhs)
200
250
300
350
400
450
500
550
600
650
95 96 97 98 99 00 01 02 03 04 05 06
Fair ValueActual
Page 88 of 291
Goldman Sachs Global Investment Research 46
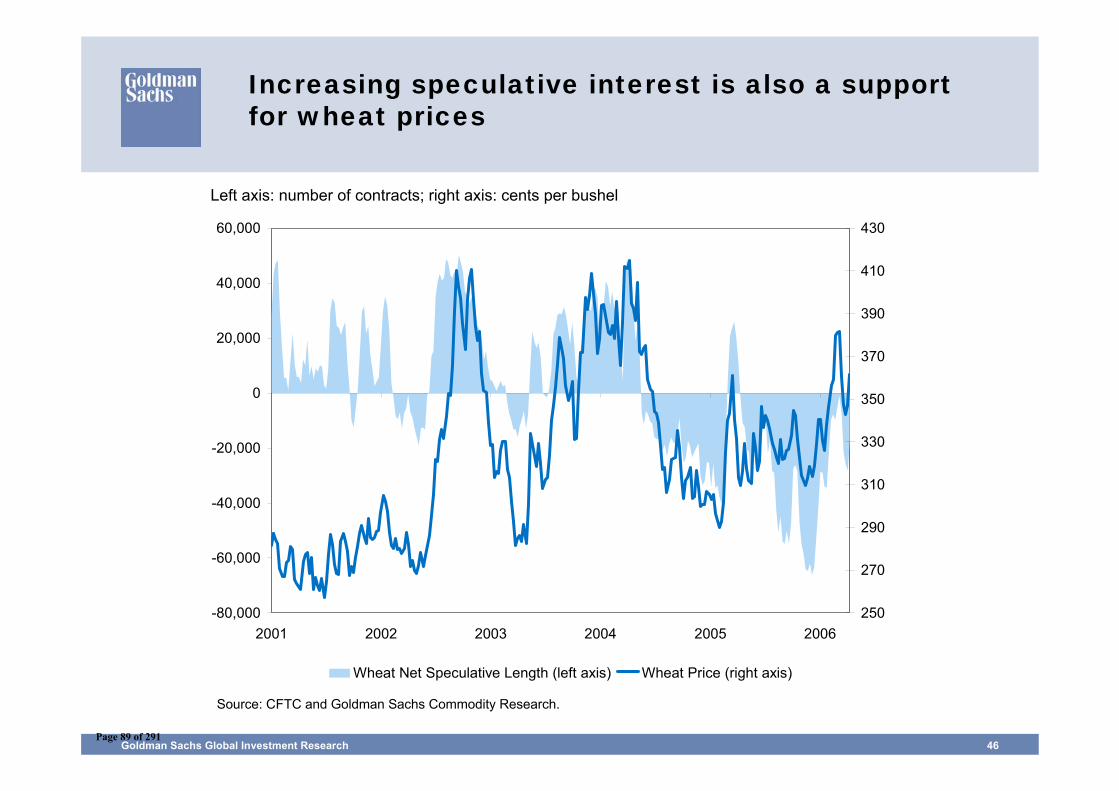
Increasing speculative interest is also a support for wheat prices
Left axis: number of contracts; right axis: cents per bushel
Source: CFTC and Goldman Sachs Commodity Research.
-80,000
-60,000
-40,000
-20,000
0
20,000
40,000
60,000
2001 2002 2003 2004 2005 2006250
270
290
310
330
350
370
390
410
430
Wheat Net Speculative Length (left axis) Wheat Price (right axis)
Page 89 of 291
Goldman Sachs Global Investment Research 47
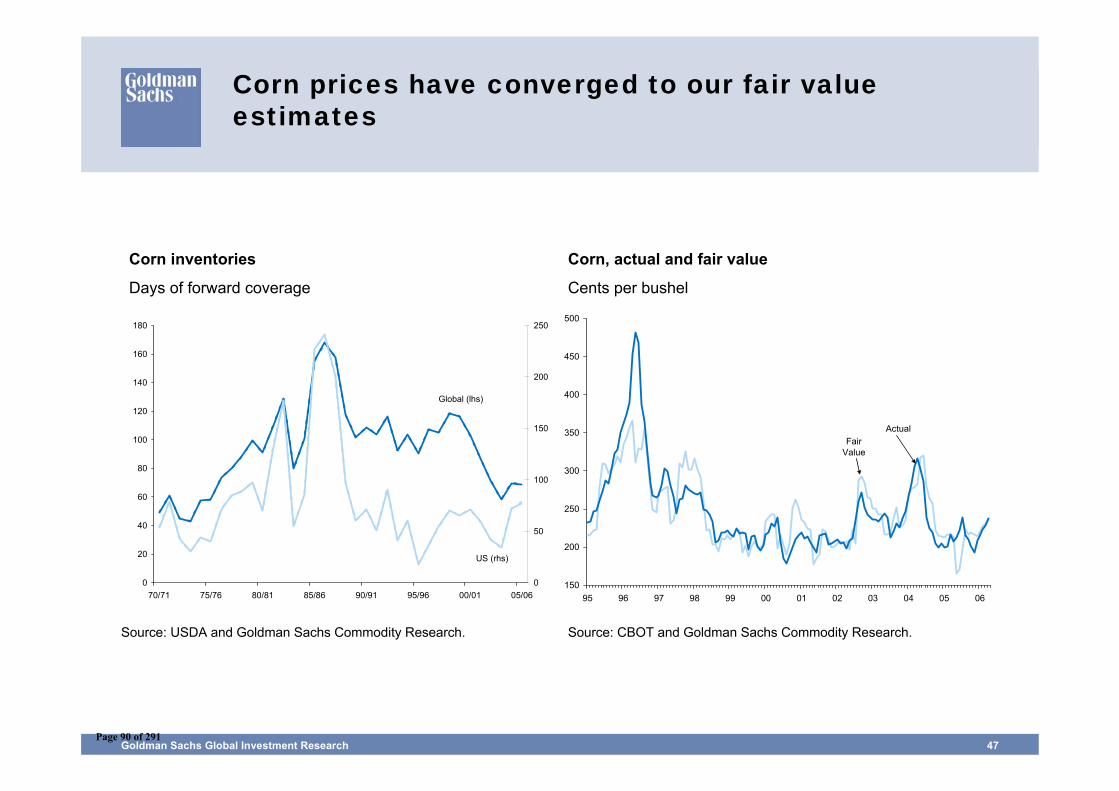
Corn prices have converged to our fair value estimates
Corn inventories
Days of forward coverage
Source: USDA and Goldman Sachs Commodity Research.
Corn, actual and fair value
Cents per bushel
Source: CBOT and Goldman Sachs Commodity Research.
150
200
250
300
350
400
450
500
95 96 97 98 99 00 01 02 03 04 05 06
Fair Value
Actual
0
20
40
60
80
100
120
140
160
180
70/71 75/76 80/81 85/86 90/91 95/96 00/01 05/060
50
100
150
200
250
Global (lhs)
US (rhs)
Page 90 of 291
Goldman Sachs Global Investment Research 48
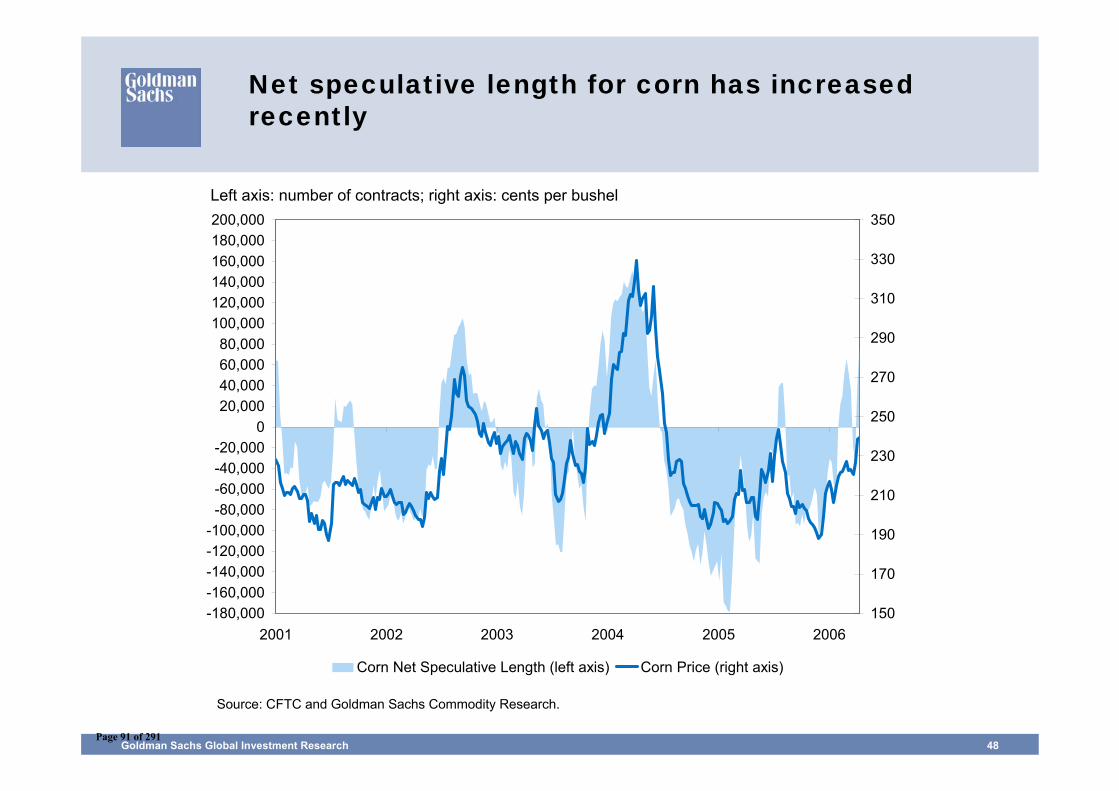
Net speculative length for corn has increased recently
Left axis: number of contracts; right axis: cents per bushel
Source: CFTC and Goldman Sachs Commodity Research.
-180,000-160,000-140,000-120,000-100,000
-80,000-60,000-40,000-20,000
020,00040,00060,00080,000
100,000120,000140,000160,000180,000200,000
2001 2002 2003 2004 2005 2006150
170
190
210
230
250
270
290
310
330
350
Corn Net Speculative Length (left axis) Corn Price (right axis)
Page 91 of 291
Goldman Sachs Global Investment Research 49
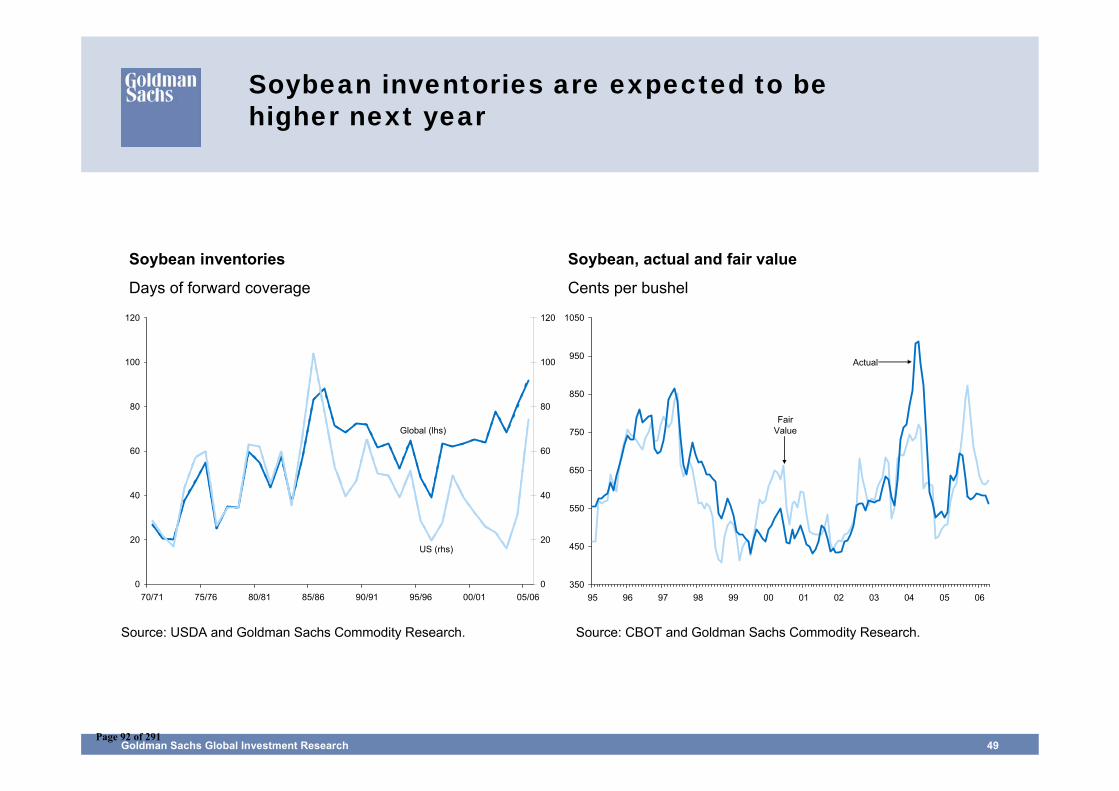
Soybean inventories are expected to be higher next year
Soybean inventories
Days of forward coverage
Source: USDA and Goldman Sachs Commodity Research.
Soybean, actual and fair value
Cents per bushel
Source: CBOT and Goldman Sachs Commodity Research.
0
20
40
60
80
100
120
70/71 75/76 80/81 85/86 90/91 95/96 00/01 05/060
20
40
60
80
100
120
Global (lhs)
US (rhs)
350
450
550
650
750
850
950
1050
95 96 97 98 99 00 01 02 03 04 05 06
Fair Value
Actual
Page 92 of 291
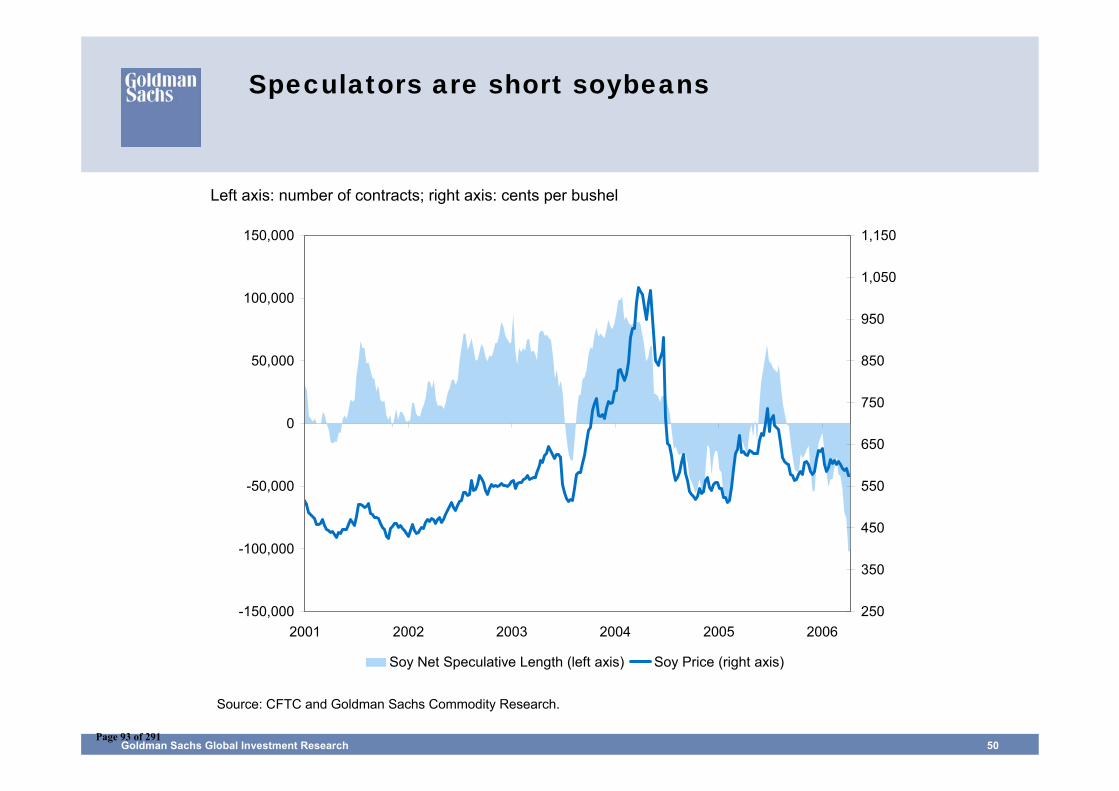
Goldman Sachs Global Investment Research 50
Speculators are short soybeans
Left axis: number of contracts; right axis: cents per bushel
Source: CFTC and Goldman Sachs Commodity Research.
-150,000
-100,000
-50,000
0
50,000
100,000
150,000
2001 2002 2003 2004 2005 2006250
350
450
550
650
750
850
950
1,050
1,150
Soy Net Speculative Length (left axis) Soy Price (right axis)
Page 93 of 291
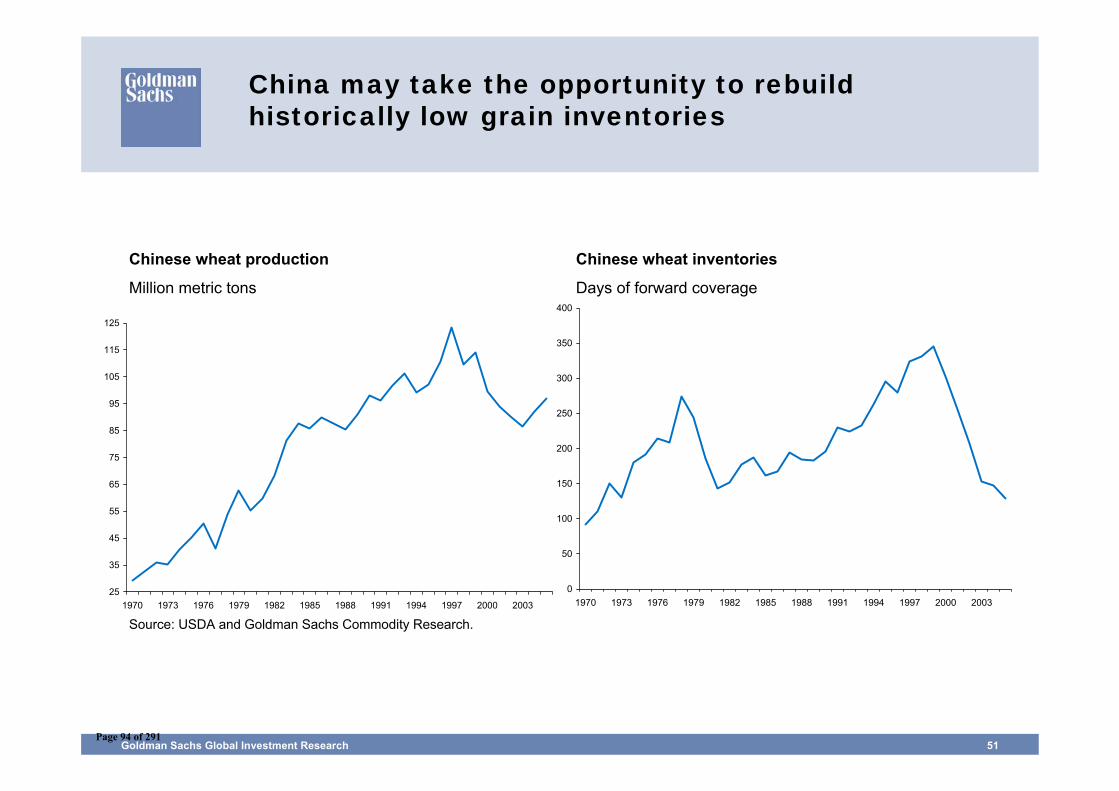
Goldman Sachs Global Investment Research 51
Source: USDA and Goldman Sachs Commodity Research.
China may take the opportunity to rebuild historically low grain inventories
Chinese wheat production
Million metric tons
Chinese wheat inventories
Days of forward coverage
25
35
45
55
65
75
85
95
105
115
125
1970 1973 1976 1979 1982 1985 1988 1991 1994 1997 2000 2003
0
50
100
150
200
250
300
350
400
1970 1973 1976 1979 1982 1985 1988 1991 1994 1997 2000 2003
Page 94 of 291
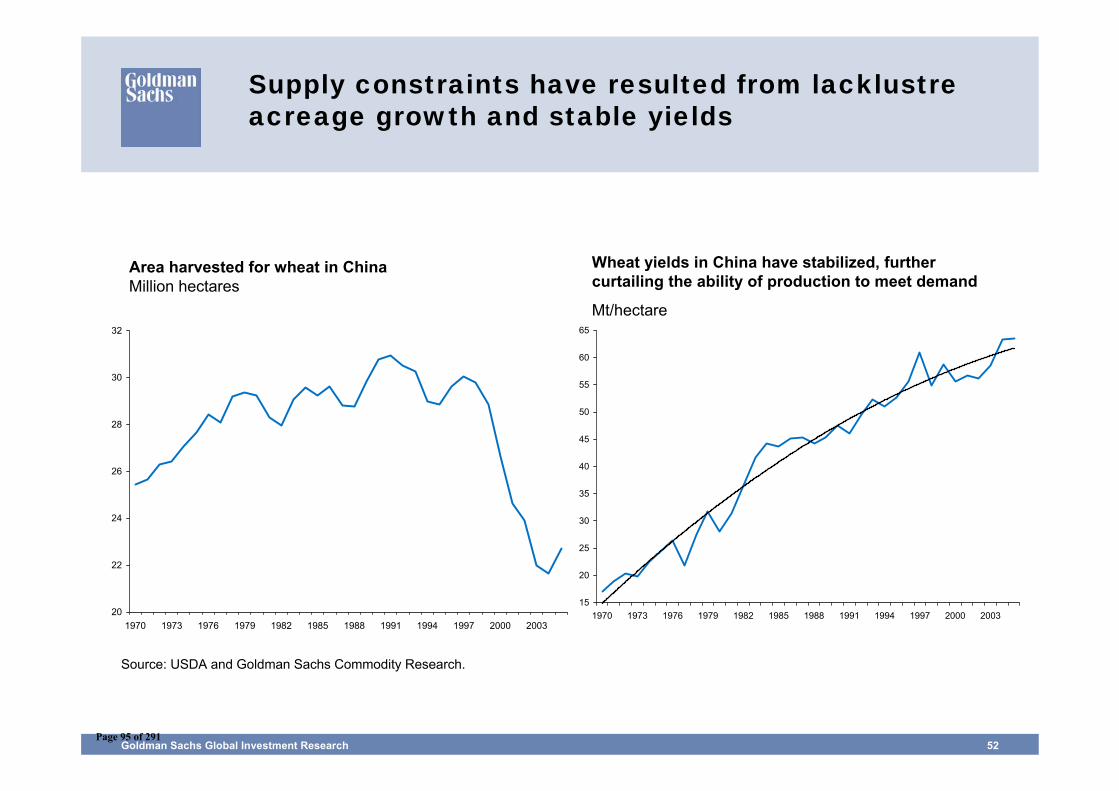
Goldman Sachs Global Investment Research 52
Source: USDA and Goldman Sachs Commodity Research.
Supply constraints have resulted from lacklustre acreage growth and stable yields
Area harvested for wheat in ChinaMillion hectares
Wheat yields in China have stabilized, further curtailing the ability of production to meet demand
Mt/hectare
20
22
24
26
28
30
32
1970 1973 1976 1979 1982 1985 1988 1991 1994 1997 2000 2003
15
20
25
30
35
40
45
50
55
60
65
1970 1973 1976 1979 1982 1985 1988 1991 1994 1997 2000 2003
Page 95 of 291
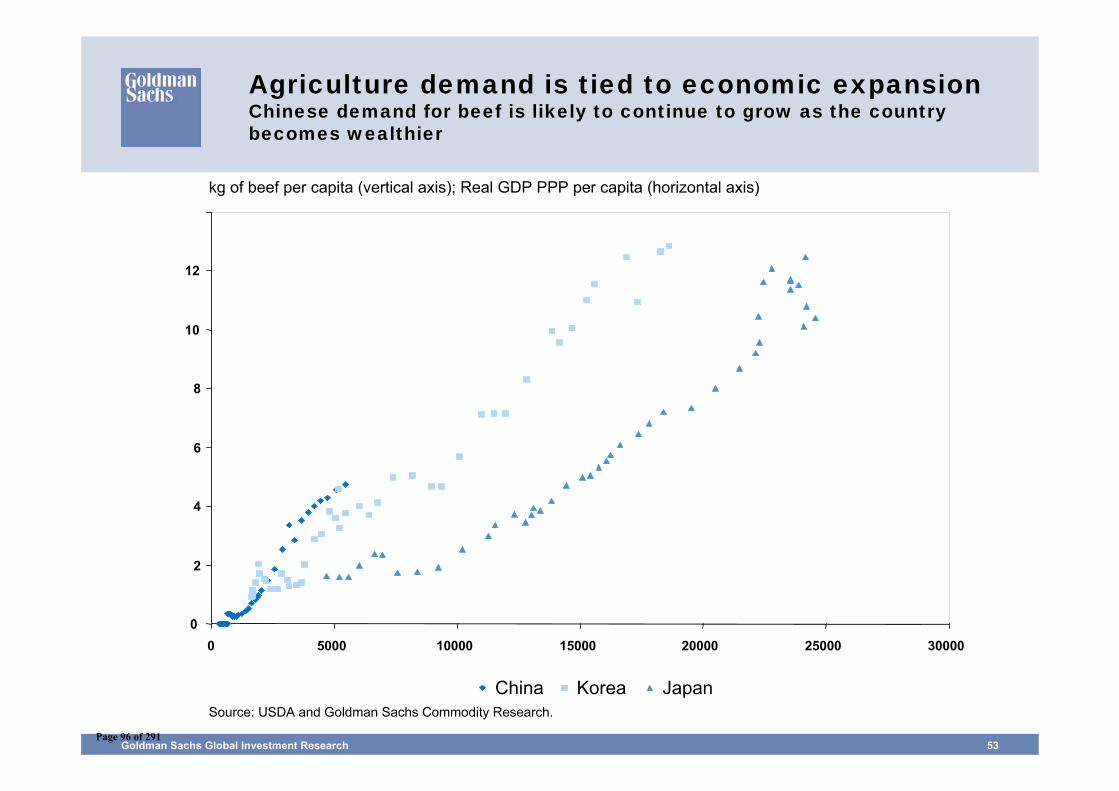
Goldman Sachs Global Investment Research 53
Agriculture demand is tied to economic expansionChinese demand for beef is likely to continue to grow as the country becomes wealthier
Source: USDA and Goldman Sachs Commodity Research.
0
2
4
6
8
10
12
0 5000 10000 15000 20000 25000 30000
China Korea Japan
kg of beef per capita (vertical axis); Real GDP PPP per capita (horizontal axis)
Page 96 of 291
DisclosuresJune 26, 2006
Page 97 of 291
Goldman Sachs Global Investment Research 55
Disclosures
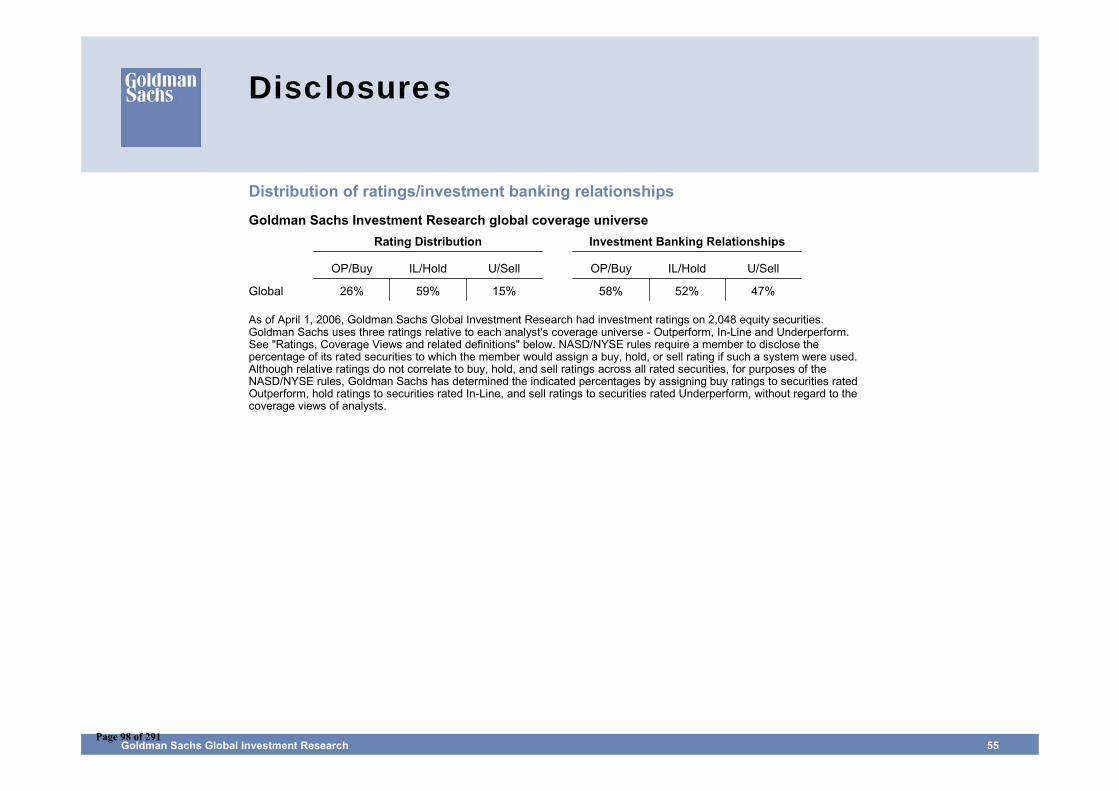
Distribution of ratings/investment banking relationships
Goldman Sachs Investment Research global coverage universeRating Distribution
OP/Buy IL/Hold U/Sell
26% 59% 15%
Investment Banking Relationships
OP/Buy IL/Hold U/Sell
58% 52% 47%Global
As of April 1, 2006, Goldman Sachs Global Investment Research had investment ratings on 2,048 equity securities.Goldman Sachs uses three ratings relative to each analyst's coverage universe - Outperform, In-Line and Underperform.See "Ratings, Coverage Views and related definitions" below. NASD/NYSE rules require a member to disclose thepercentage of its rated securities to which the member would assign a buy, hold, or sell rating if such a system were used.Although relative ratings do not correlate to buy, hold, and sell ratings across all rated securities, for purposes of theNASD/NYSE rules, Goldman Sachs has determined the indicated percentages by assigning buy ratings to securities ratedOutperform, hold ratings to securities rated In-Line, and sell ratings to securities rated Underperform, without regard to thecoverage views of analysts.
Page 98 of 291
Goldman Sachs Global Investment Research 56
Disclosures
Regulatory disclosures
Disclosures required by United States laws and regulationsSee company-specific regulatory disclosures above for any of the following disclosures required as to companies referred to in this report: manager or co-manager in a pending transaction; 1% or other ownership; compensation for certain services; types of client relationships; managed/co-managed public offerings in prior periods; directorships; marketmaking and/or specialist role.
The following are additional required disclosures: Ownership and material conflicts of interest: Goldman Sachs policy prohibits its analysts, professionals reporting to analysts and members of their households from owning securities of any company in the analyst's area of coverage. Analyst compensation: Analysts are paid in part based on the profitability of Goldman Sachs, which includes investment banking revenues. Analyst as officer or director: Goldman Sachs policy prohibits its analysts, persons reporting to analysts or members of their households from serving as an officer, director, advisory board member or employee of any company in the analyst's area of coverage. Distribution of ratings: See the distribution of ratings disclosure above. Price chart: See the price chart, with changes of ratings and price targets in prior periods, above, or, if electronic format or if with respect to multiple companies which are the subject of this report, on the Goldman Sachs website at http://www.gs.com/research/hedge.html.
Additional disclosures required under the laws and regulations of jurisdictions other than the United StatesThe following disclosures are those required by the jurisdiction indicated, except to the extent already made above pursuant to United States laws and regulations. Australia: This research, and any access to it, is intended only for "wholesale clients" within the meaning of the Australian Corporations Act. Canada: Goldman Sachs Canada Inc. has approved of, and agreed to take responsibility for, this research in Canada if and to the extent it relates to equity securities of Canadian issuers. Analysts may conduct site visits but are prohibited from accepting payment or reimbursement by the company of travel expenses for such visits. Hong Kong: Further information on the securities of covered companies referred to in this research may be obtained on request from Goldman Sachs (Asia) L.L.C. Japan: See company-specific disclosures as to any applicable disclosures required by Japanese stock exchanges, the Japanese Securities Dealers Association or the Japanese Securities Finance Company. Korea: Further information on the subject company or companies referred to in this research may be obtained from Goldman Sachs (Asia) L.L.C., Seoul Branch. Singapore: Further information on the covered companies referred to in this research may be obtained from Goldman Sachs (Singapore) Pte. (Company Number: 198602165W). United Kingdom: Goldman Sachs International is authorised and regulated by the Financial Services Authority. Persons who would be categorized as private customers in the United Kingdom, as such term is defined in the rules of the Financial Services Authority, should read this research in conjunction with prior Goldman Sachs research on the covered companies referred to herein and should refer to the risk warnings that have been sent to them by Goldman Sachs International. A copy of these risks warnings, and a glossary of certain financial terms used in this report, are available from Goldman Sachs International on request.
European Union: Disclosure information in relation to Article 4 (1) (d) and Article 6 (2) of the European Commission Directive 2003/126/EC is available at http://www.gs.com/client_services/global_investment_research/europeanpolicy.html
Page 99 of 291
Goldman Sachs Global Investment Research 57
Disclosures
Ratings, coverage groups and views and related definitionsBuy, Neutral, Sell –Analysts recommend stocks as Buys or Sells for inclusion on various regional Investment Lists. Being assigned a Buy or Sell on an Investment List is determined by a stock’s return potential relative to its coverage group as described below. Any stock not assigned as a Buy or a Sell on an Investment List is deemed Neutral. Each regional Investment Review Committee manages various regional Investment Lists to a global guideline of 25-35% of stocks as Buy and 10-15% of stocks as Sell; however, the distribution of Buys and Sells in any particular coverage group may vary as determined by the regional Investment Review Committee.
Return potential represents the price differential between the current share price and the price target expected during the time horizon associated with the price target. Price targets are required for all covered stocks. The return potential, price target and associated time horizon are stated in each report adding or reiterating an Investment List membership.
Coverage groups and views: A list of all stocks in each coverage group is available by primary analyst, stock and coverage group at http://www.gs.com/research/hedge.html. The analyst assigns one of the following coverage views which represents the analyst’s investment outlook on the coverage group relative to the group’s historical fundamentals and/or valuation. Attractive (A). The investment outlook over the following 12 months is favorable relative to the coverage group's historical fundamentals and/or valuation. Neutral (N). The investment outlook over the following 12 months is neutral relative to the coverage group's historical fundamentals and/or valuation. Cautious (C). The investment outlook over the following 12 months is unfavorable relative to the coverage group's historical fundamentals and/or valuation.
Not Rated (NR). The investment rating and target price, if any, have been removed pursuant to Goldman Sachs policy when Goldman Sachs is acting in an advisory capacity in a merger or strategic transaction involving this company and in certain other circumstances. Rating Suspended (RS). Goldman Sachs Research has suspended the investment rating and price target, if any, for this stock, because there is not a sufficient fundamental basis for determining an investment rating or target. The previous investment rating and price target, if any, are no longer in effect for this stock and should not be relied upon. Coverage Suspended (CS). Goldman Sachs has suspended coverage of this company. Not Covered (NC).Goldman Sachs does not cover this company. Not Available or Not Applicable (NA). The information is not available for display or is not applicable. Not Meaningful (NM). The information is not meaningful and is therefore excluded.
Ratings, coverage views and related definitions prior to June 26, 2006Our rating system requires that analysts rank order the stocks in their coverage groups and assign one of three investment ratings (see definitions below) within a ratings distribution guideline of no more than 25% of the stocks should be rated Outperform and no fewer than 10% rated Underperform. The analyst assigns one of three coverage views (see definitions below), which represents the analyst’s investment outlook on the coverage group relative to the group’s historical fundamentals and valuation. Each coverage group, listing all stocks covered in that group, is available by primary analyst, stock and coverage group at http://www.gs.com/research/hedge.html.
DefinitionsOutperform (OP). We expect this stock to outperform the median total return for the analyst's coverage universe over the next 12 months. In-Line (IL). We expect this stock to perform in line with the median total return for the analyst's coverage universe over the next 12 months. Underperform (U). We expect this stock to underperform the median total return for the analyst's coverage universe over the next 12 months
Coverage views: Attractive (A). The investment outlook over the following 12 months is favorable relative to the coverage group's historical fundamentals and/or valuation. Neutral (N). The investment outlook over the following 12 months is neutral relative to the coverage group's historical fundamentals and/or valuation. Cautious (C). The investment outlook over the following 12 months is unfavorable relative to the coverage group's historical fundamentals and/or valuation.
Current Investment List (CIL). We expect stocks on this list to provide an absolute total return of approximately 15%-20% over the next 12 months. We only assign this designation to stocks rated Outperform. We require a 12-month price target for stocks with this designation. Each stock on the CIL will automatically come off the list after 90 days unless renewed by the covering analyst and the relevant Regional Investment Review Committee.
Page 100 of 291
Goldman Sachs Global Investment Research 58
Disclosures
Global product; distributing entitiesThe Global Investment Research Division of Goldman Sachs produces and distributes research products for clients of Goldman Sachs, and pursuant to certain contractual arrangements, on a global basis. Analysts based in Goldman Sachs offices around the world produce equity research on industries and companies, and research on macroeconomics, currencies, commodities and portfolio strategy.
This research is disseminated in Australia by Goldman Sachs JBWere Pty Ltd (ABN 21 006 797 897) on behalf of Goldman Sachs; in Canada by Goldman Sachs Canada Inc. regarding Canadian equities and by Goldman Sachs & Co. (all other research); in Germany by Goldman Sachs & Co. oHG; in Hong Kong by Goldman Sachs (Asia) L.L.C.; in Japan by Goldman Sachs (Japan) Ltd; in the Republic of Korea by Goldman Sachs (Asia) L.L.C., Seoul Branch; in New Zealand by Goldman Sachs JBWere (NZ) Limited on behalf of Goldman Sachs; in Singapore by Goldman Sachs (Singapore) Pte. (Company Number: 198602165W); and in the United States of America by Goldman, Sachs & Co. Goldman Sachs International has approved this research in connection with its distribution in the United Kingdom and European Union.
European Union: Goldman Sachs International, authorised and regulated by the Financial Services Authority, has approved this research in connection with its distribution in the European Union and United Kingdom; Goldman, Sachs & Co. oHG, regulated by the Bundesanstalt für Finanzdienstleistungsaufsicht, may also be distributing research in Germany
General disclosures in addition to specific disclosures required by certain jurisdictionsThis research is for our clients only. Other than disclosures relating to Goldman Sachs, this research is based on current public information that we consider reliable, but we do not represent it is accurate or complete, and it should not be relied on as such. We seek to update our research as appropriate, but various regulations may prevent us from doing so. Other than some industry reports published on a periodic basis, the large majority of reports are published at irregular intervals as appropriate in the analyst’s judgment.
Goldman Sachs conducts a global full-service, integrated investment banking, investment management, and brokerage business. We have investment banking and other business relationships with a substantial percentage of the companies covered by our Global Investment Research Division.
Our salespeople, traders, and other professionals may provide oral or written market commentary or trading strategies to our clients and our proprietary trading desks that reflect opinions that are contrary to the opinions expressed in this research. Our asset management area, our proprietary trading desks and investing businesses may make investment decisions that are inconsistent with the recommendations or views expressed in this research.
We and our affiliates, officers, directors, and employees, excluding equity analysts, will from time to time have long or short positions in, act as principal in, and buy or sell, the securities or derivatives (including options and warrants) thereof of covered companies referred to in this research.
This research is not an offer to sell or the solicitation of an offer to buy any security in any jurisdiction where such an offer or solicitation would be illegal. It does not constitute a personal recommendation or take into account the particular investment objectives, financial situations, or needs of individual clients. Clients should consider whether any advice or recommendation in this research is suitable for their particular circumstances and, if appropriate, seek professional advice, including tax advice. The price and value of the investments referred to in this research and the income from them may fluctuate. Past performance is not a guide to future performance, future returns are not guaranteed, and a loss of original capital may occur. Certain transactions, including those involving futures, options, and other derivatives, give rise to substantial risk and are not suitable for all investors. Current options disclosure documents are available from Goldman Sachs sales representatives or at http://theocc.com/publications/risks/riskstoc.pdf. Fluctuations in exchange rates could have adverse effects on the value or price of, or income derived from, certain investments.
Past performance is not necessarily indicative of future performance.
Our research is disseminated primarily electronically, and, in some cases, in printed form. Electronic research is simultaneously available to all clients.
Disclosure information is also available at http://www.gs.com/research/hedge.html or from Research Compliance, One New York Plaza, New York, NY 10004.
Copyright 2006 The Goldman Sachs Group, Inc.
No part of this material may be (i) copied, photocopied or duplicated in any form by any means or (ii) redistributed without the prior written consent of The Goldman Sachs Group, Inc.Page 101 of 291
Sanders Research Associates
Losing ControlA presentation to the EC Workshop on the
Economic Impact of Rising Oil Prices
June 28, 2006
Page 102 of 291

Sanders Research AssociatesPage 103 of 291
Sanders Research Associates
The world financial system can recycle petrodollars easily
Now the destination is the United States, unlike the 70s, when it was third world borrowers
Derivatives are a potential problem, but for the real economy, not the financial sector per se
Peak oil changes everything
Page 104 of 291
Sanders Research Associates
The world financial system can recycle petrodollars easily
Now the destination is the United States, unlike the 70s, when it was third world borrowers
Derivatives are a potential problem, but for the real economy, not the financial sector per se
Peak oil changes everything
Page 105 of 291
Sanders Research Associates
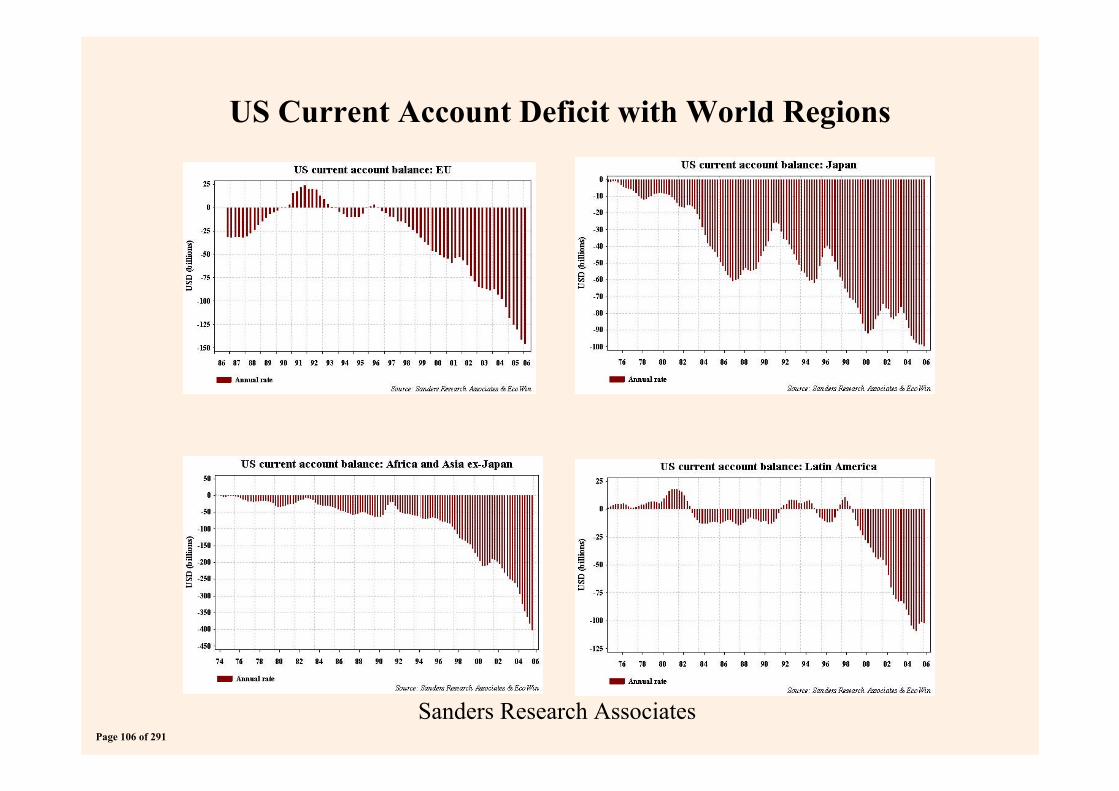
US Current Account Deficit with World Regions
Page 106 of 291
Sanders Research Associates
The world financial system can recycle petrodollars easily
Now the destination is the United States, unlike the 70s, when it was third world borrowers
Derivatives are a potential problem, but for the real economy, not the financial sector per se
Peak oil changes everything
Page 107 of 291
Sanders Research Associates
The world financial system can recycle petrodollars easily
Now the destination is the United States, unlike the 70s, when it was third world borrowers
Derivatives are a potential problem, but for the real economy, not the financial sector per se
Peak oil changes everything
Page 108 of 291

Sanders Research AssociatesPage 109 of 291
Sanders Research Associates
Peak Oil is with us now
Production probably topped out between early November 2005 and late January 2006
Even if it didn’t, production of light sweet crudes has peaked
This means costs are rising
Prices are not yet reflecting this
For the first time in the Age of Oil, the Anglo-Saxon (UKUSA) countries do not control the world’s marginal barrels of crude and units of natural gas
Page 110 of 291
Sanders Research Associates
Peak Oil is with us now
Production probably topped out between early November 2005 and late January 2006
Even if it didn’t, production of light sweet crudes has peaked
This means costs are rising
Prices are not yet reflecting this
For the first time in the Age of Oil, the Anglo-Saxon (UKUSA) countries do not control the world’s marginal barrels of crude and units of natural gas
Page 111 of 291
Sanders Research Associates
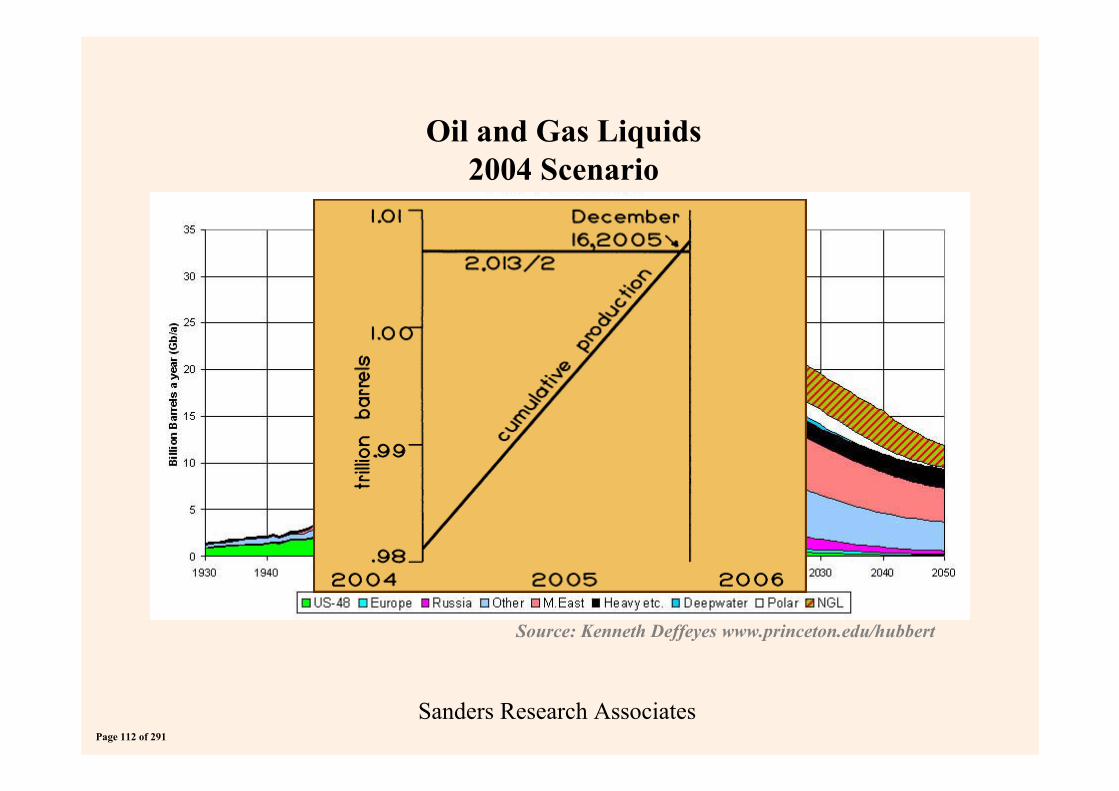
Source: Kenneth Deffeyes www.princeton.edu/hubbert
Oil and Gas Liquids2004 Scenario
Page 112 of 291
Sanders Research Associates
Peak Oil is with us now
Production probably topped out between early November 2005 and late January 2006
Even if it didn’t, production of light sweet crudes has peaked
This means costs are rising
Prices are not yet reflecting this
For the first time in the Age of Oil, the Anglo-Saxon (UKUSA) countries do not control the world’s marginal barrels of crude and units of natural gas
Page 113 of 291
Sanders Research Associates
Peak Oil is with us now
Production probably topped out between early November 2005 and late January 2006
Even if it didn’t, production of light sweet crudes has peaked
This means costs are rising
Prices are not yet reflecting this
For the first time in the Age of Oil, the Anglo-Saxon (UKUSA) countries do not control the world’s marginal barrels of crude and units of natural gas
Page 114 of 291
Sanders Research Associates
Peak Oil is with us now
Production probably topped out between early November 2005 and late January 2006
Even if it didn’t, production of light sweet crudes has peaked
This means costs are rising
Prices are not yet reflecting this
For the first time in the Age of Oil, the Anglo-Saxon (UKUSA) countries do not control the world’s marginal barrels of crude and units of natural gas
Page 115 of 291
Sanders Research Associates
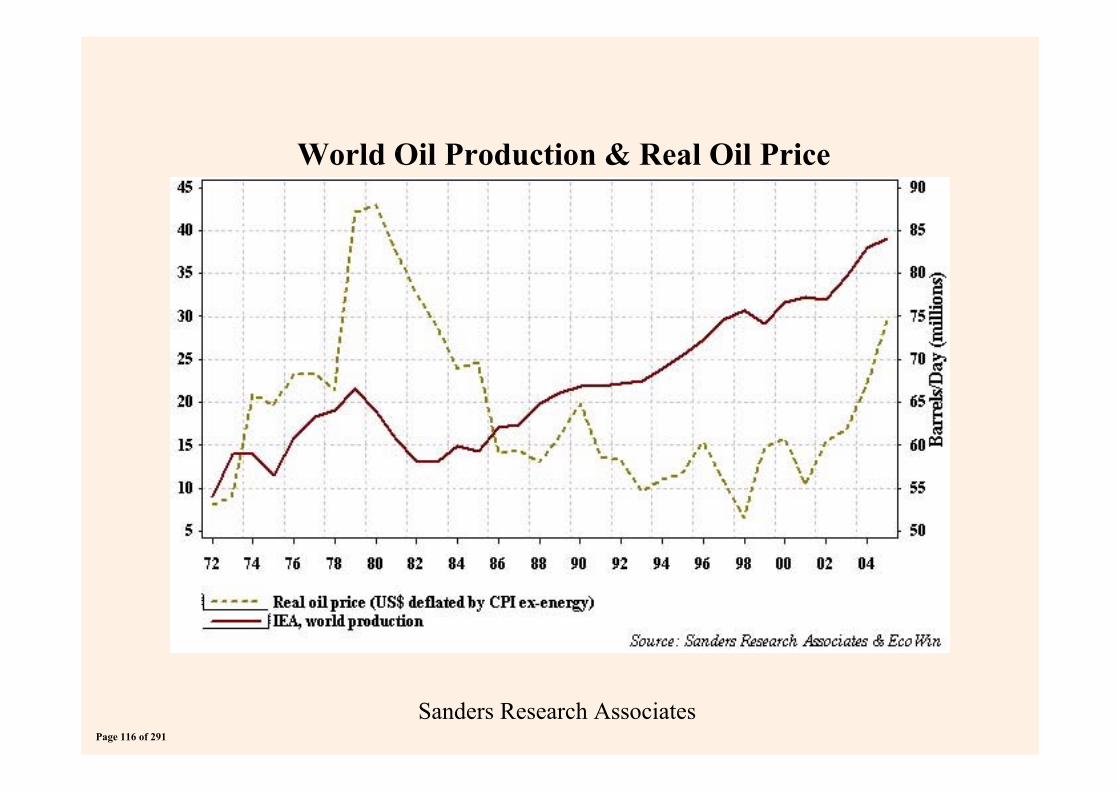
World Oil Production & Real Oil Price
Page 116 of 291
Sanders Research Associates
Peak Oil is with us now
Production probably topped out between early November 2005 and late January 2006
Even if it didn’t, production of light sweet crudes has peaked
This means costs are rising
Prices are not yet reflecting this
For the first time in the Age of Oil, the Anglo-Saxon (UKUSA) countries do not control the world’s marginal barrels of crude and units of natural gas
Page 117 of 291

Sanders Research AssociatesPage 118 of 291
Sanders Research Associates
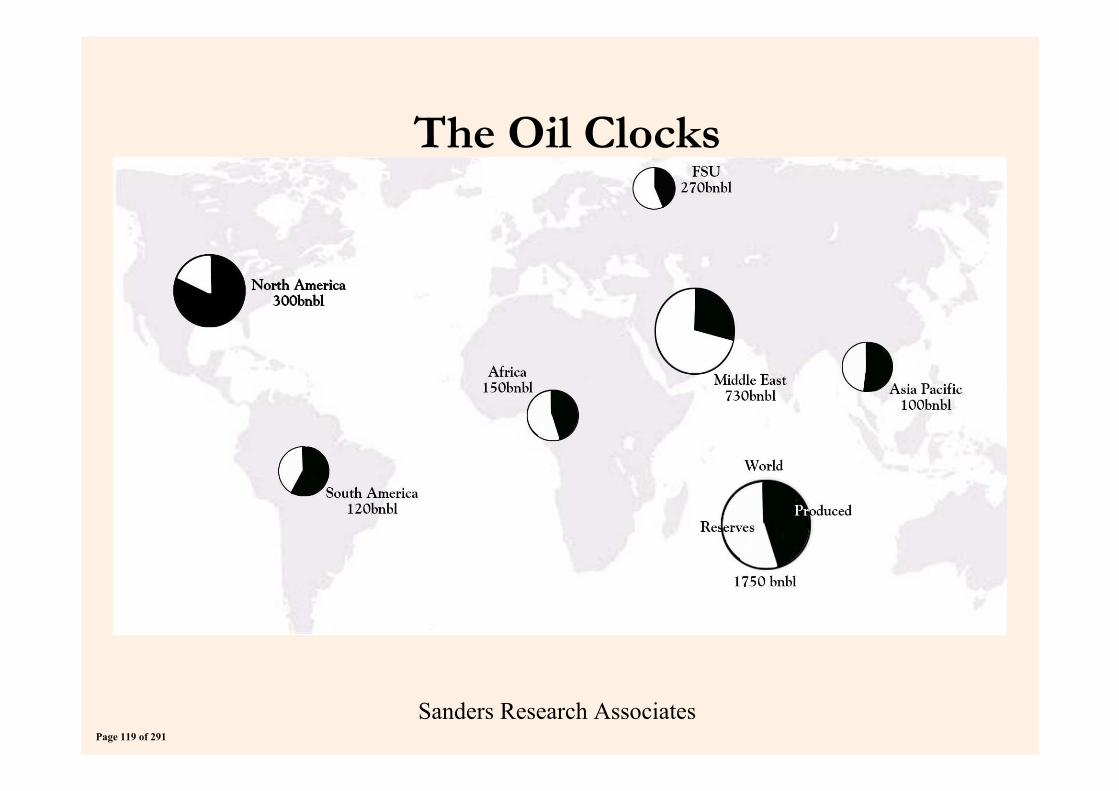
The Oil Clocks
Page 119 of 291

Sanders Research AssociatesPage 120 of 291
Sanders Research Associates
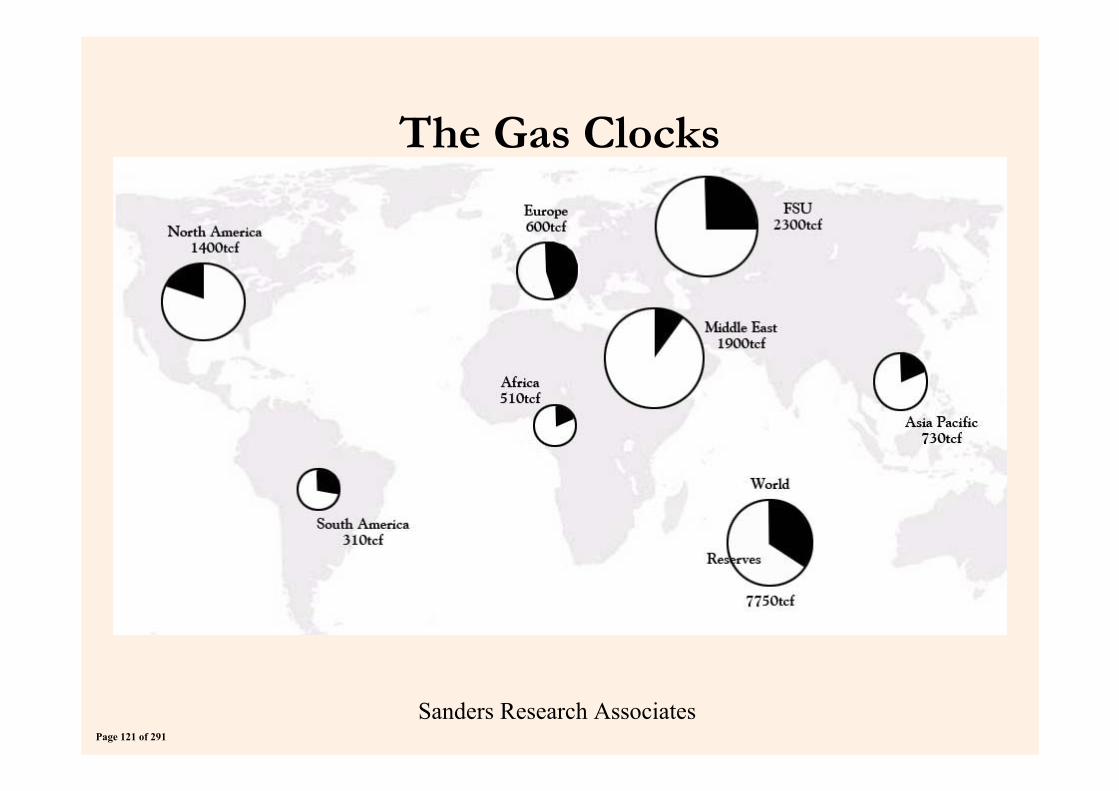
The Gas Clocks
Page 121 of 291

Sanders Research AssociatesPage 122 of 291
Sanders Research Associates
Oil Power is moving East
Shanghai Cooperation Organisation is an alternative framework for Eurasia
Iran is an observer, and wants permanent membership
Between them, Russia and Iran control over 40% of world gas reserves
Page 123 of 291

Sanders Research AssociatesPage 124 of 291
Sanders Research Associates
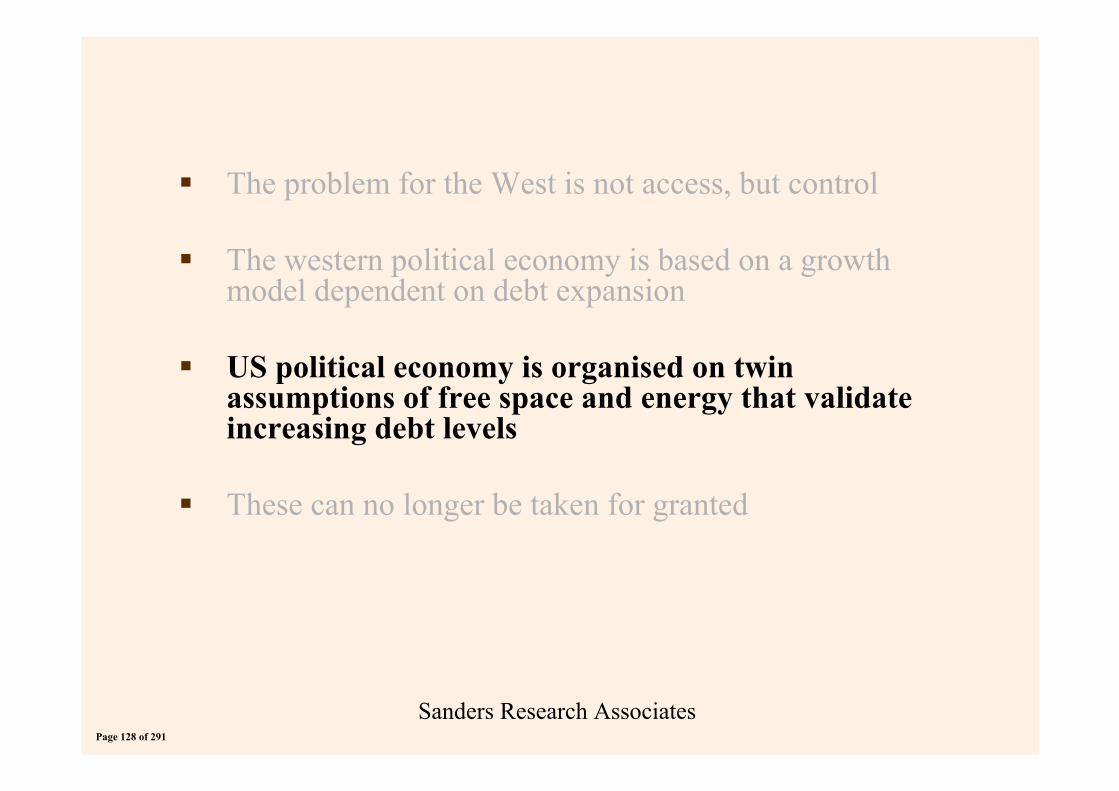
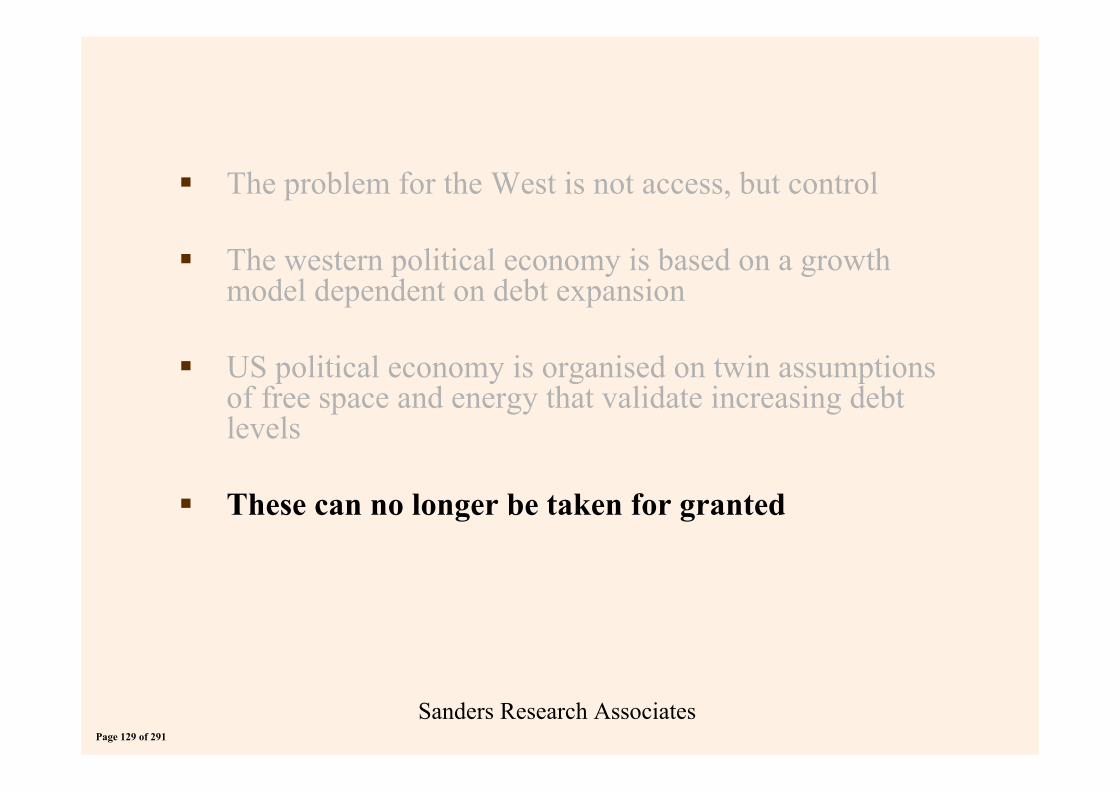
The problem for the West is not access, but control
The western political economy is based on a growth model dependent on debt expansion
US political economy is organised on twin assumptions of free space and energy that validate increasing debt levels
These can no longer be taken for granted
Page 125 of 291
Sanders Research Associates
The problem for the West is not access, but control
The western political economy is based on a growth model dependent on debt expansion
US political economy is organised on twin assumptions of free space and energy that validate increasing debt levels
These can no longer be taken for granted
Page 126 of 291
Sanders Research Associates
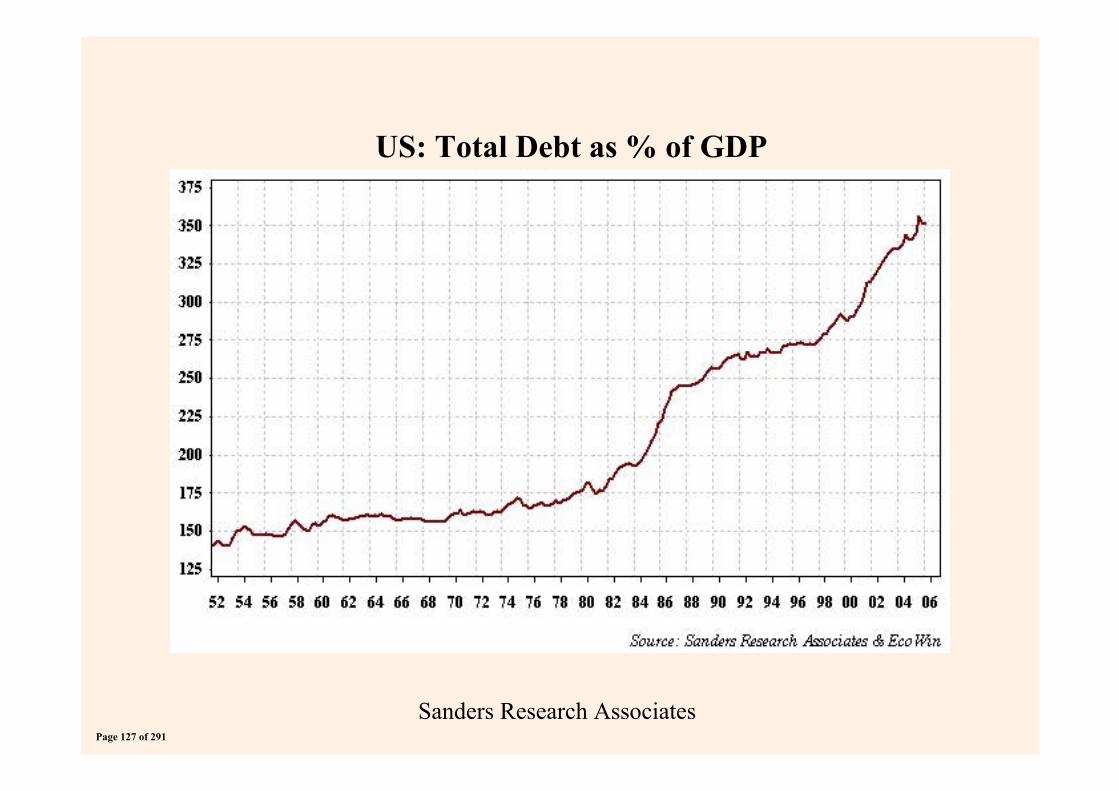
US: Total Debt as % of GDP
Page 127 of 291
Sanders Research Associates
The problem for the West is not access, but control
The western political economy is based on a growth model dependent on debt expansion
US political economy is organised on twin assumptions of free space and energy that validate increasing debt levels
These can no longer be taken for granted
Page 128 of 291
Sanders Research Associates
The problem for the West is not access, but control
The western political economy is based on a growth model dependent on debt expansion
US political economy is organised on twin assumptions of free space and energy that validate increasing debt levels
These can no longer be taken for granted
Page 129 of 291

Sanders Research AssociatesPage 130 of 291
Sanders Research Associates
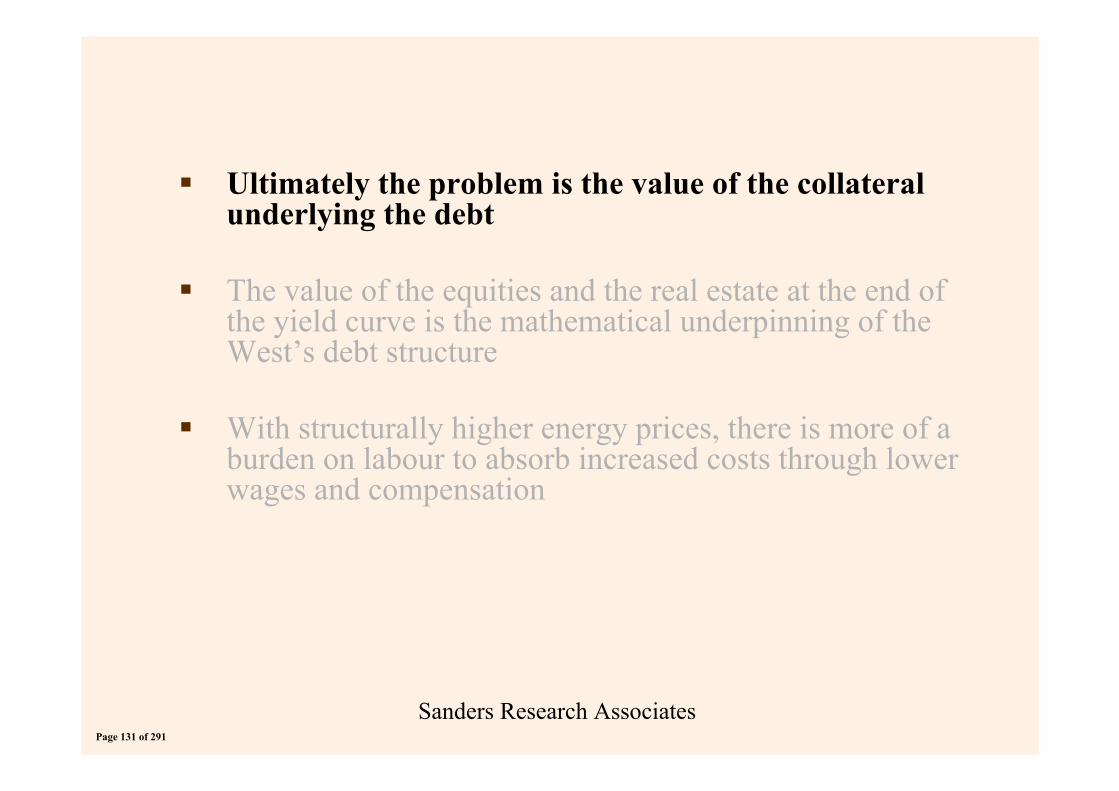
Ultimately the problem is the value of the collateral underlying the debt
The value of the equities and the real estate at the end of the yield curve is the mathematical underpinning of the West’s debt structure
With structurally higher energy prices, there is more of a burden on labour to absorb increased costs through lower wages and compensation
Page 131 of 291
Sanders Research Associates
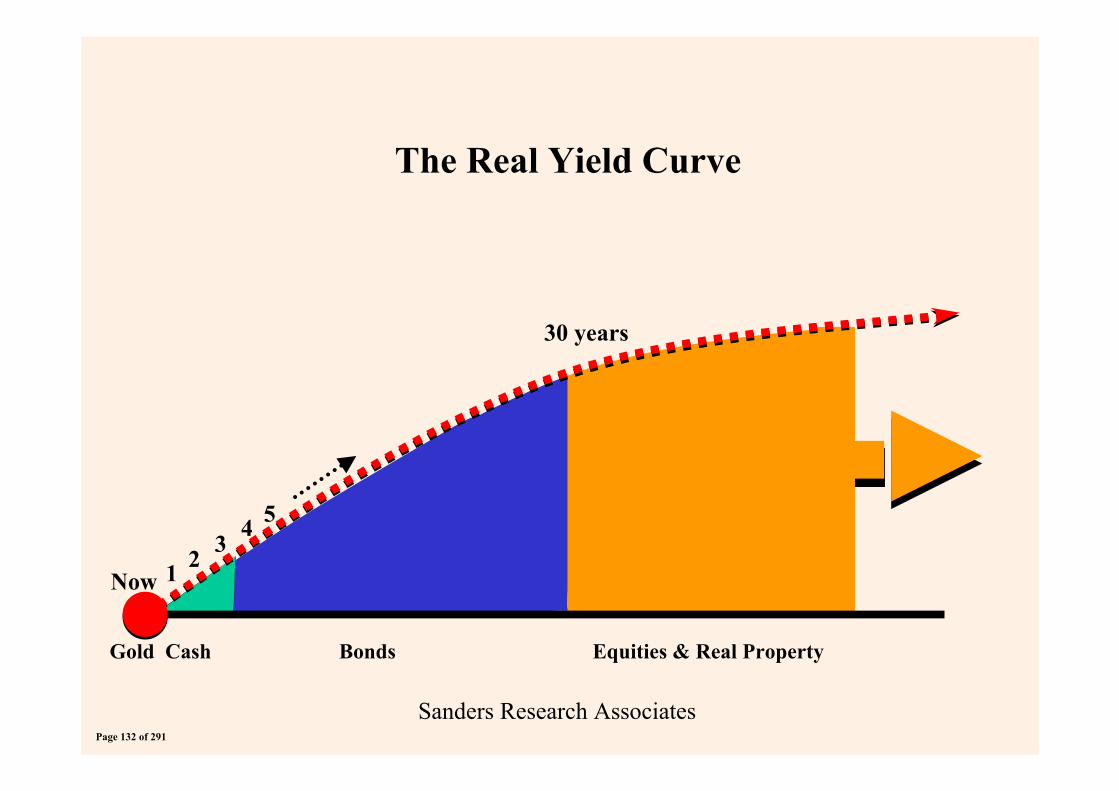
The Real Yield Curve
Gold Cash Bonds Equities & Real Property
Now 1 2 34 5
30 years
Page 132 of 291
Sanders Research Associates
Ultimately the problem is the value of the collateral underlying the debt
The value of the equities and the real estate at the end of the yield curve is the mathematical underpinning of the West’s debt structure
With structurally higher energy prices, there is more of a burden on labour to absorb increased costs through lower wages and compensation
Page 133 of 291
Sanders Research Associates
Ultimately the problem is the value of the collateral underlying the debt
The value of the equities and the real estate at the end of the yield curve is the mathematical underpinning of the West’s debt structure
With structurally higher energy prices, there is more of a burden on labour to absorb increased costs through lower wages and compensation
Page 134 of 291

Sanders Research AssociatesPage 135 of 291

Sanders Research Associates
US to introduce national universal conscription, i.e. corvée
US is building labour camps
North America is consolidating into a regional bloc with UK and Japanese wings
Europe and US are moving to enlarge and centralise when better solutions are to get smaller and decentralise
Page 136 of 291

Sanders Research AssociatesPage 137 of 291
The Joint Oil Data InitiativeThe Joint Oil Data InitiativeA concrete action to improve transparency in oil markets A concrete action to improve transparency in oil markets
Workshop on the economic impact of rising oil pricesWorkshop on the economic impact of rising oil pricesEuropean Parliament, 28 June 2006European Parliament, 28 June 2006
P. Lösönen, EurostatP. Lösönen, Eurostat
Page 138 of 291
At the end of the 90’s At the end of the 90’s
there was an unusually high volatility of oil pricesthere was an unusually high volatility of oil prices
At the same time quality of global oil statistics was At the same time quality of global oil statistics was not satisfactory:not satisfactory:
Supply did not match with demandSupply did not match with demand
Real production, stocks and demand were not Real production, stocks and demand were not known known
The poor quality of oil statistics was identified The poor quality of oil statistics was identified as an aggravating factor for the volatilityas an aggravating factor for the volatility
The need for reliable oil data became evident The need for reliable oil data became evident to have more transparency in the oil marketto have more transparency in the oil market
BackgroundBackground
Page 139 of 291
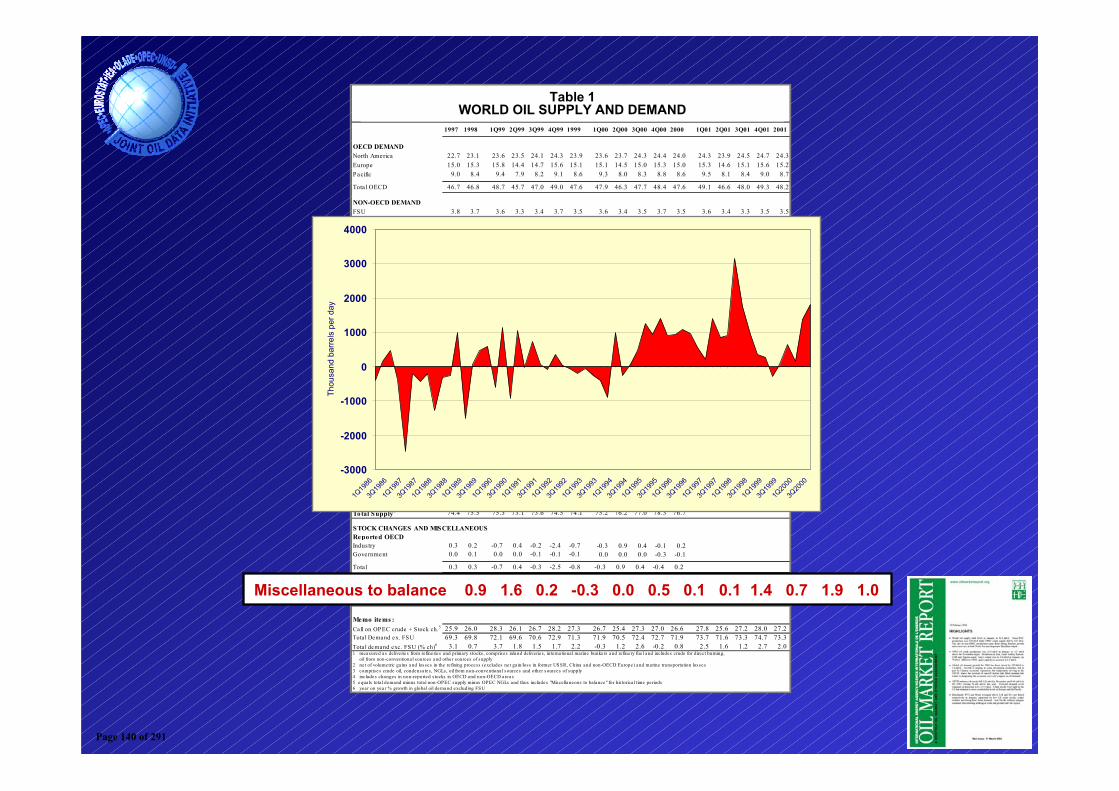
Table 1WORLD OIL SUPPLY AND DEMAND
(million barrels per day)
1997 1998 1Q99 2Q99 3Q99 4Q99 1999 1Q00 2Q00 3Q00 4Q00 2000 1Q01 2Q01 3Q01 4Q01 2001
OECD DEMANDNorth America 22.7 23.1 23.6 23.5 24.1 24.3 23.9 23.6 23.7 24.3 24.4 24.0 24.3 23.9 24.5 24.7 24.3Europe 15.0 15.3 15.8 14.4 14.7 15.6 15.1 15.1 14.5 15.0 15.3 15.0 15.3 14.6 15.1 15.6 15.2Pacific 9.0 8.4 9.4 7.9 8.2 9.1 8.6 9.3 8.0 8.3 8.8 8.6 9.5 8.1 8.4 9.0 8.7
Tota l OECD 46.7 46.8 48.7 45.7 47.0 49.0 47.6 47.9 46.3 47.7 48.4 47.6 49.1 46.6 48.0 49.3 48.2
NON-OECD DEMANDFSU 3.8 3.7 3.6 3.3 3.4 3.7 3.5 3.6 3.4 3.5 3.7 3.5 3.6 3.4 3.3 3.5 3.5Europe 0.8 0.8 0.8 0.7 0.7 0.7 0.7 0.8 0.7 0.7 0.8 0.8 0.8 0.8 0.7 0.8 0.8China 4.2 4.2 4.4 4.6 4.3 4.6 4.5 4.7 4.5 5.1 4.8 4.8 4.9 5.0 5.0 5.3 5.0Other Asia 6.7 6.7 7.0 7.1 7.1 7.1 7.1 7.1 7.3 7.3 7.2 7.2 7.3 7.4 7.5 7.5 7.4Latin America 4.7 4.8 4.6 4.8 4.9 4.8 4.8 4.7 4.8 4.9 4.8 4.8 4.8 4.9 5.0 5.0 4.9Middle East 4.0 4.2 4.3 4.4 4.4 4.2 4.3 4.3 4.4 4.5 4.3 4.4 4.4 4.6 4.7 4.5 4.6Africa 2.3 2.3 2.3 2.3 2.3 2.4 2.3 2.4 2.3 2.3 2.4 2.3 2.4 2.4 2.4 2.4 2.4
Tota l Non-OECD 26.5 26.7 27.0 27.2 27.1 27.5 27.2 27.5 27.6 28.2 27.9 27.8 28.2 28.5 28.7 28.9 28.6
Total Demand1 73.1 73.5 75.8 72.9 74.1 76.5 74.8 75.5 73.9 75.9 76.4 75.4 77.3 75.0 76.7 78.2 76.8
OECD SUPPLYNorth America 14.6 14.5 14.1 13.9 13.9 14.1 14.0 14.3 14.4 14.3 14.2 14.3 14.4 14.5 14.6 14.8 14.6Europe 6.7 6.7 6.8 6.5 6.7 7.1 6.8 7.1 6.6 6.6 6.9 6.8 6.9 6.6 6.5 6.9 6.7Pacific 0.7 0.7 0.6 0.6 0.7 0.7 0.7 0.9 0.9 0.8 0.9 0.9 0.8 0.8 0.8 0.8 0.8
Tota l OECD 22.1 21.9 21.5 20.9 21.3 22.0 21.4 22.3 21.8 21.7 22.0 21.9 22.1 21.9 21.9 22.5 22.1
NON-OECD SUPPLYFSU 7.2 7.3 7.4 7.4 7.5 7.6 7.5 7.7 7.8 8.0 8.2 7.9 8.2 8.2 8.3 8.4 8.3Europe 0.2 0.2 0.2 0.2 0.2 0.2 0.2 0.2 0.2 0.2 0.2 0.2 0.2 0.2 0.2 0.2 0.2China 3.2 3.2 3.2 3.2 3.2 3.2 3.2 3.3 3.2 3.2 3.2 3.2 3.2 3.2 3.2 3.2 3.2Other Asia 2.2 2.2 2.3 2.2 2.2 2.2 2.2 2.2 2.3 2.3 2.3 2.3 2.3 2.3 2.3 2.3 2.3Latin America 3.4 3.6 3.8 3.8 3.8 3.8 3.8 3.7 3.7 3.8 3.9 3.8 3.9 3.9 3.9 3.9 3.9Middle East 1.9 1.9 1.9 1.9 1.9 2.0 1.9 1.9 2.0 2.0 2.0 2.0 2.0 2.0 2.0 2.0 2.0Africa 2.7 2.8 2.7 2.7 2.8 2.9 2.8 2.9 2.9 2.8 2.8 2.8 2.9 2.9 2.9 2.9 2.9Tota l Non-OECD 20.9 21.2 21.5 21.5 21.6 21.8 21.6 21.9 22.0 22.4 22.7 22.2 22.7 22.8 22.8 22.9 22.8
Processing Gains2 1.6 1.6 1.7 1.6 1.6 1.7 1.7 1.7 1.7 1.7 1.7 1.7 1.8 1.7 1.7 1.8 1.8Tota l Non-OPEC 44.5 44.7 44.6 44.0 44.6 45.5 44.7 45.9 45.5 45.7 46.4 45.9 46.6 46.4 46.5 47.1 46.6
OPECCrude 27.2 28.0 27.8 26.3 26.2 26.1 26.6 26.5 27.8 28.4 29.0 27.9NGLs 2.7 2.8 2.8 2.8 2.8 2.8 2.8 2.8 2.9 2.9 2.9 2.9 3.0 3.0 3.0 3.0 3.0Tota l OPEC 29.9 30.8 30.6 29.1 29.1 29.0 29.4 29.3 30.7 31.3 31.9 30.8
Total Supply3 74.4 75.5 75.3 73.1 73.6 74.5 74.1 75.2 76.2 77.0 78.3 76.7
STOCK CHANGES AND MISCELLANEOUSReported OECDIndustry 0.3 0.2 -0.7 0.4 -0.2 -2.4 -0.7 -0.3 0.9 0.4 -0.1 0.2Government 0.0 0.1 0.0 0.0 -0.1 -0.1 -0.1 0.0 0.0 0.0 -0.3 -0.1
Tota l 0.3 0.3 -0.7 0.4 -0.3 -2.5 -0.8 -0.3 0.9 0.4 -0.4 0.2Floating Storage/Oil in Trans it 0.1 0.1 0.0 0.1 -0.1 -0.1 -0.1 0.0 0.1 0.0 0.4 0.1Misce llaneous to ba lance 4 0.9 1.6 0.2 -0.3 0.0 0.5 0.1 0.1 1.4 0.7 1.9 1.0
Total S tock Ch. & Mis c 1.3 2.0 -0.5 0.2 -0.4 -2.0 -0.7 -0.2 2.3 1.2 1.9 1.3
Memo items :Call on OPEC crude + Stock ch.5 25.9 26.0 28.3 26.1 26.7 28.2 27.3 26.7 25.4 27.3 27.0 26.6 27.8 25.6 27.2 28.0 27.2Tota l Demand ex. FSU 69.3 69.8 72.1 69.6 70.6 72.9 71.3 71.9 70.5 72.4 72.7 71.9 73.7 71.6 73.3 74.7 73.3Tota l demand exc. FSU (% ch)6 3.1 0.7 3.7 1.8 1.5 1.7 2.2 -0.3 1.2 2.6 -0.2 0.8 2.5 1.6 1.2 2.7 2.01 measured as de live rie s from re fine rie s and primary s tocks , comprises inland deliverie s , interna tional marine bunkers and refine ry fue l and includes crude for direct burning, oil from non-conventiona l sources and othe r sources of supply
2 ne t of volumetric ga ins and los ses in the re fining process (excludes ne t ga in/loss in former USSR, China and non-OECD Europe) and marine transporta tion losses3 comprises crude oil, condensa tes , NGLs, oil from non-conventional sources and other sources of supply4 includes changes in non-reported s tocks in OECD and non-OECD areas5 equa ls tota l demand minus total non-OPEC supply minus OPEC NGLs and thus includes "Miscellaneous to ba lance" for his torica l time pe riods6 yea r on yea r % growth in global oil demand excluding FSU
Miscellaneous to balance 0.9 1.6 0.2 -0.3 0.0 0.5 0.1 0.1 1.4 0.7 1.9 1.0
Table 1WORLD OIL SUPPLY AND DEMAND
-3000
-2000
-1000
0
1000
2000
3000
4000
1Q19
863Q
1986
1Q19
873Q
1987
1Q19
883Q
1988
1Q19
893Q
1989
1Q19
903Q
1990
1Q19
913Q
1991
1Q19
923Q
1992
1Q19
933Q
1993
1Q19
943Q
1994
1Q19
953Q
1995
1Q19
963Q
1996
1Q19
973Q
1997
1Q19
983Q
1998
1Q19
993Q
1999
1Q20
003Q
2000
Thou
sand
bar
rels
per
day
Page 140 of 291
7th International Energy Forum (IEF) meeting 7th International Energy Forum (IEF) meeting in Riyadh, 2000in Riyadh, 2000
In 2001 six international In 2001 six international organisationsorganisations (APEC, (APEC, Eurostat, IEA, OLADE, OPEC and UNSD) Eurostat, IEA, OLADE, OPEC and UNSD) launched the launched the Joint Oil Data ExerciseJoint Oil Data Exercise ((JODEJODE))
A small questionnaire including main flows A small questionnaire including main flows of crude oil and petroleum productsof crude oil and petroleum products
Deadline one month after the reference Deadline one month after the reference month (Mmonth (M--1 reporting)1 reporting)
OrganisationsOrganisations collect the data from their collect the data from their member countriesmember countries
JODE (2001)JODE (2001)
Page 141 of 291
8th IEF meeting in Osaka, 20028th IEF meeting in Osaka, 2002
Full political support to continue the efforts to Full political support to continue the efforts to increase transparency of oil dataincrease transparency of oil data
The six The six organisationsorganisations made the exercise made the exercise permanent and renamed it permanent and renamed it Joint Oil Data Joint Oil Data Initiative (JODI)Initiative (JODI)
Rotating coordinationRotating coordination
InterInter--secretariat meetingssecretariat meetings
ConferencesConferences
FromFrom JODE JODE toto JODIJODI
Page 142 of 291
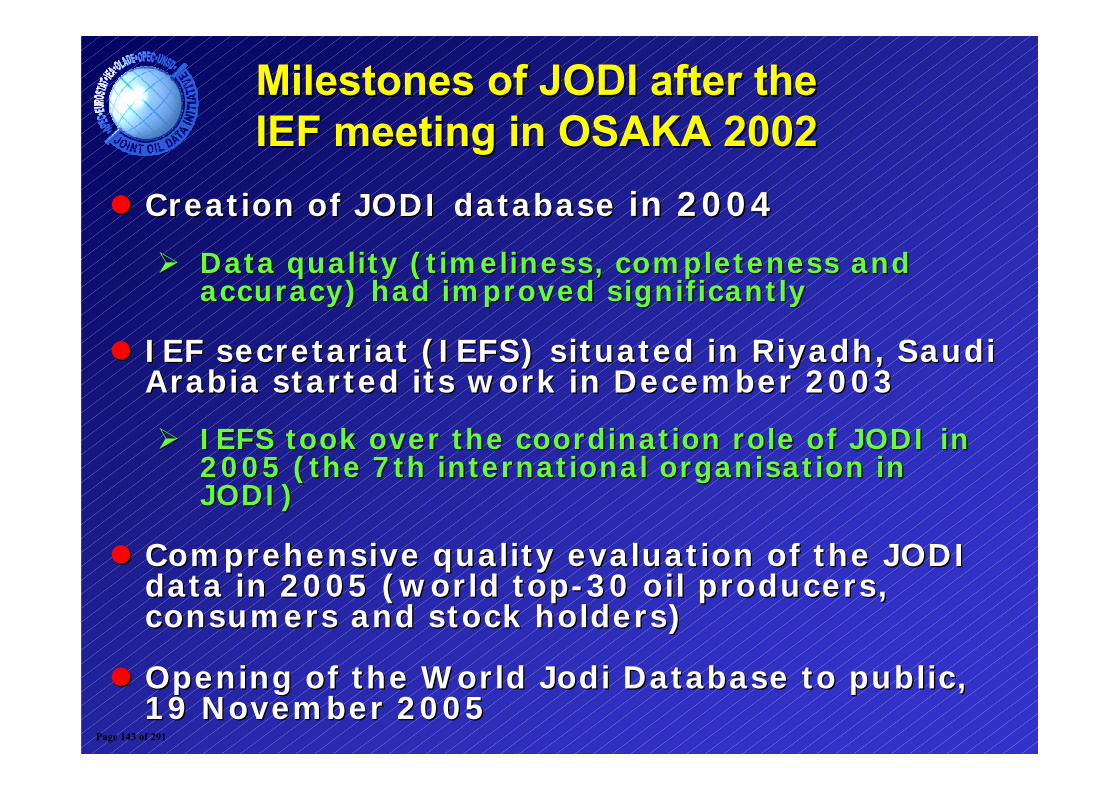
Creation of JODI databaseCreation of JODI database in 2004in 2004
Data quality (timeliness, completeness and Data quality (timeliness, completeness and accuracy) had improved significantlyaccuracy) had improved significantly
IEF secretariat (IEFS) situated in Riyadh, Saudi IEF secretariat (IEFS) situated in Riyadh, Saudi Arabia started its work in December 2003Arabia started its work in December 2003
IEFS took over the coordination role of JODI in IEFS took over the coordination role of JODI in 2005 (the 7th international 2005 (the 7th international organisationorganisation in in JODI)JODI)
Comprehensive quality evaluation of the JODI Comprehensive quality evaluation of the JODI data in 2005 (world topdata in 2005 (world top--30 oil producers, 30 oil producers, consumers and stock holders)consumers and stock holders)
Opening of the World Jodi Database to public, Opening of the World Jodi Database to public, 19 November 200519 November 2005
Milestones of JODI after the Milestones of JODI after the IEF meeting in OSAKA 2002 IEF meeting in OSAKA 2002
Page 143 of 291

King Abdullah of Saudi Arabia King Abdullah of Saudi Arabia launching the JODI World Databaselaunching the JODI World Database
Page 144 of 291
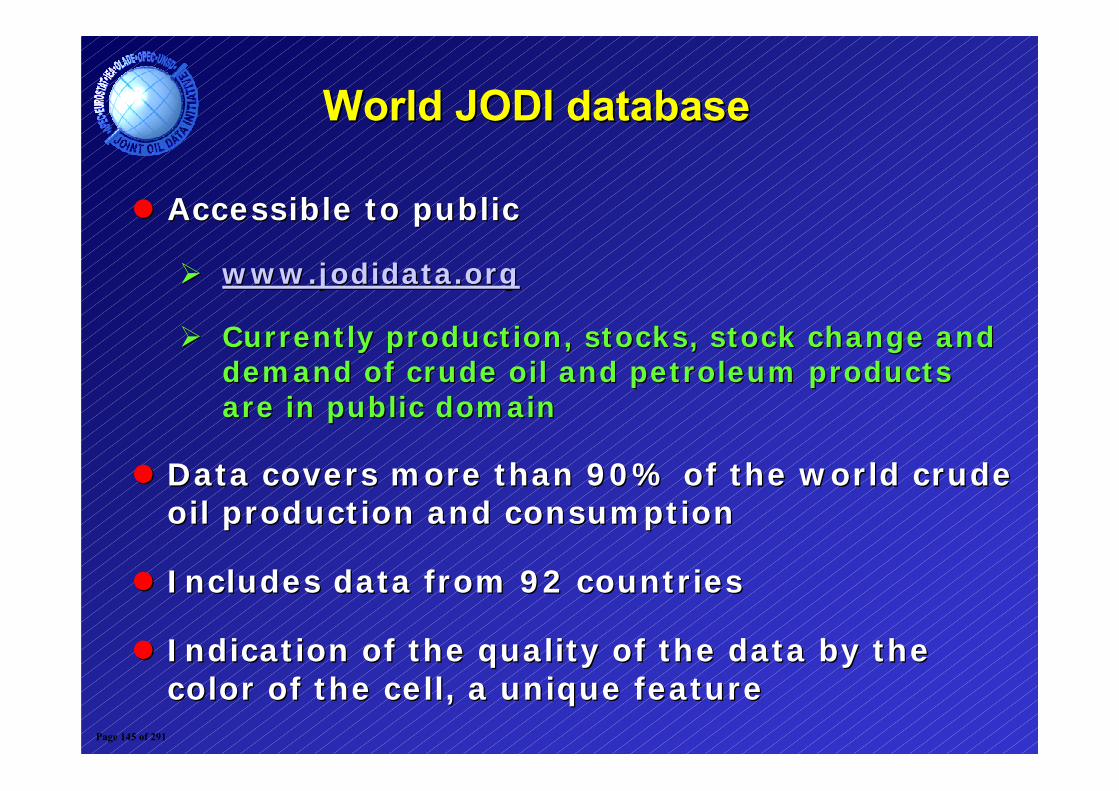
Accessible to publicAccessible to public
www.jodidata.orgwww.jodidata.org
Currently production, stocks, stock change and Currently production, stocks, stock change and demand of crude oil and petroleum products demand of crude oil and petroleum products are in public domainare in public domain
Data covers more than 90% of the world crude Data covers more than 90% of the world crude oil production and consumptionoil production and consumption
Includes data from 92 countries Includes data from 92 countries
Indication of the quality of the data by the Indication of the quality of the data by the color of the cell, a unique feature color of the cell, a unique feature
World JODI databaseWorld JODI database
Page 145 of 291
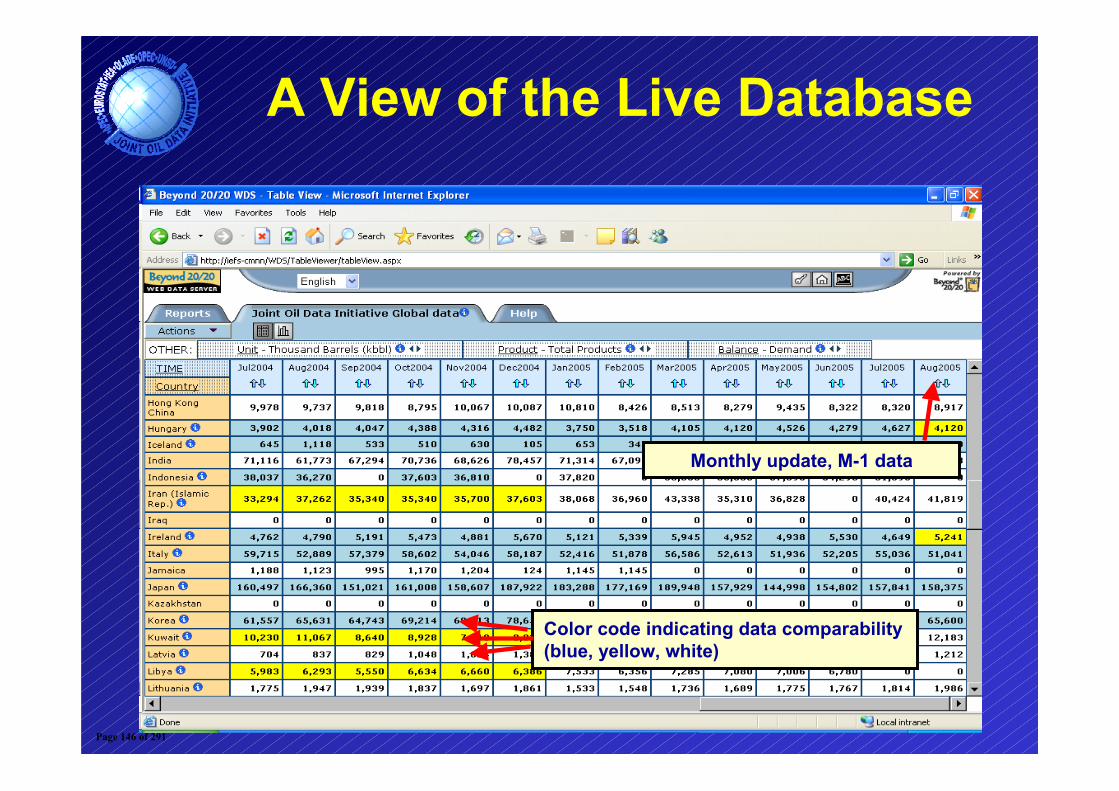
A View of the Live Database
Monthly update, M-1 data
Color code indicating data comparability(blue, yellow, white)
Page 146 of 291
7
6
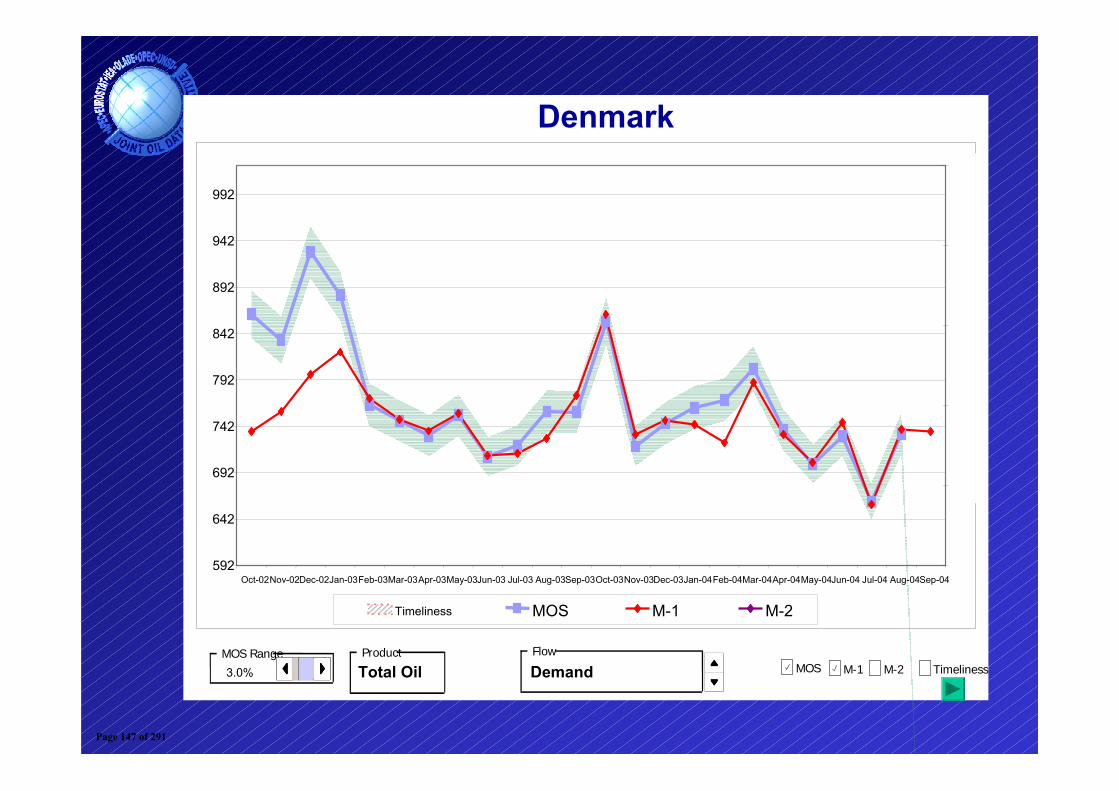
3.0% Total Oil Demand
Denmark
592
642
692
742
792
842
892
942
992
Oct-02Nov-02Dec-02Jan-03Feb-03Mar-03Apr-03May-03Jun-03 Jul-03 Aug-03Sep-03Oct-03Nov-03Dec-03Jan-04Feb-04Mar-04Apr-04May-04Jun-04 Jul-04 Aug-04Sep-040
1
2
3
4
5
Timeliness MOS M-1 M-2
MOS RangeM-1MOS M-2
Product FlowTimeliness
>10
<10
<5
<30
<25
Page 147 of 291
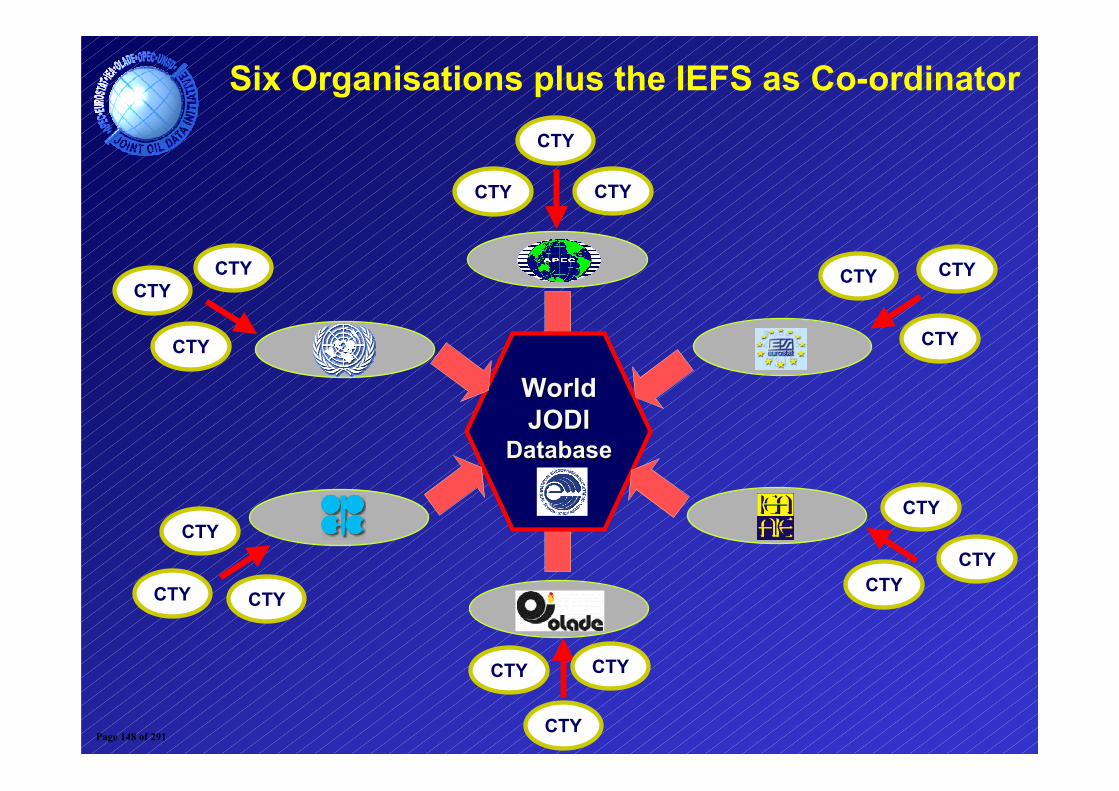
World World JODI JODI
DatabaseDatabase
CTY
CTY
CTY
CTY
CTY
CTY
CTY CTY
CTY
CTY
CTY
CTY
CTY CTY
CTY
CTY
CTY
CTY
Six Organisations plus the IEFS as Co-ordinator
Page 148 of 291
Creation of JODI user and methodology manualCreation of JODI user and methodology manual
First edition scheduled by the end of June 2006First edition scheduled by the end of June 2006
Data providers and data usersData providers and data users
Training of statisticiansTraining of statisticians
Venezuela in August 2006 for Latin American countriesVenezuela in August 2006 for Latin American countries
South Africa at the end of 2006 for African countriesSouth Africa at the end of 2006 for African countries
Enlargement of public part of JODI databaseEnlargement of public part of JODI database
Currently crude oil production, stocks, stock change and Currently crude oil production, stocks, stock change and demand of petroleum products are in public domain demand of petroleum products are in public domain
Quality evaluation of refinery input and output data in Quality evaluation of refinery input and output data in view to opening this data into public in 2006view to opening this data into public in 2006
Preparation of the 6th JODI conference at the end of Preparation of the 6th JODI conference at the end of November in RiyadhNovember in Riyadh
Ongoing activities Ongoing activities
Page 149 of 291
1.1. Political Political awarenessawareness of the difficulties of the difficulties encountered in improving data quality has encountered in improving data quality has risenrisen
2.2. Statistical Statistical systemssystems in many countries are in many countries are improving / have improvedimproving / have improved
3.3. AttitudesAttitudes towards confidentiality and towards confidentiality and reliability are evolvingreliability are evolving
4.4. A worldA world--wide wide networknetwork of oil statisticians have of oil statisticians have been created multiplying contacts between oil been created multiplying contacts between oil companies, countries and organisations companies, countries and organisations paving the way for the global harmonisation paving the way for the global harmonisation of energy statisticsof energy statistics
5.5. JODI has demonstrated that oil producer JODI has demonstrated that oil producer ––consumer dialogue is has lead and is further consumer dialogue is has lead and is further leading to concrete actionsleading to concrete actions
Main achievements of JODI Main achievements of JODI beyond data collectionbeyond data collection
Page 150 of 291
And then, what’s next?And then, what’s next?Expanding the JODI Questionnaire
Horizontally: more products (NGLs, …)
Vertically: more flows (stocks, trade,…)
Duplicating the approach to gas?
Using a similar approach to reserves?
Page 151 of 291
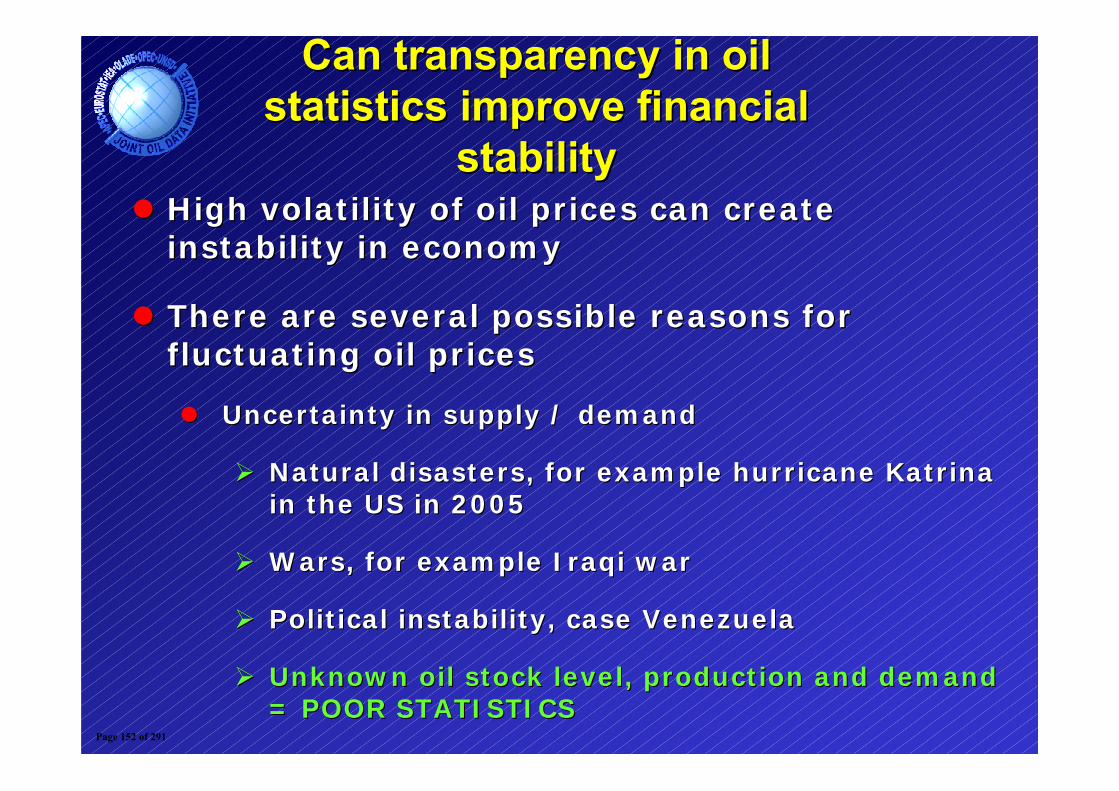
High volatility of oil prices can create High volatility of oil prices can create instability in economyinstability in economy
There are several possible reasons for There are several possible reasons for fluctuating oil pricesfluctuating oil prices
Uncertainty in supply / demandUncertainty in supply / demand
Natural disasters, for example hurricane Katrina Natural disasters, for example hurricane Katrina in the US in 2005in the US in 2005
Wars, for example Iraqi warWars, for example Iraqi war
Political instability, case VenezuelaPolitical instability, case Venezuela
Unknown oil stock level, production and demand Unknown oil stock level, production and demand = POOR STATISTICS= POOR STATISTICS
Can transparency in oil Can transparency in oil statistics improve financial statistics improve financial
stabilitystability
Page 152 of 291
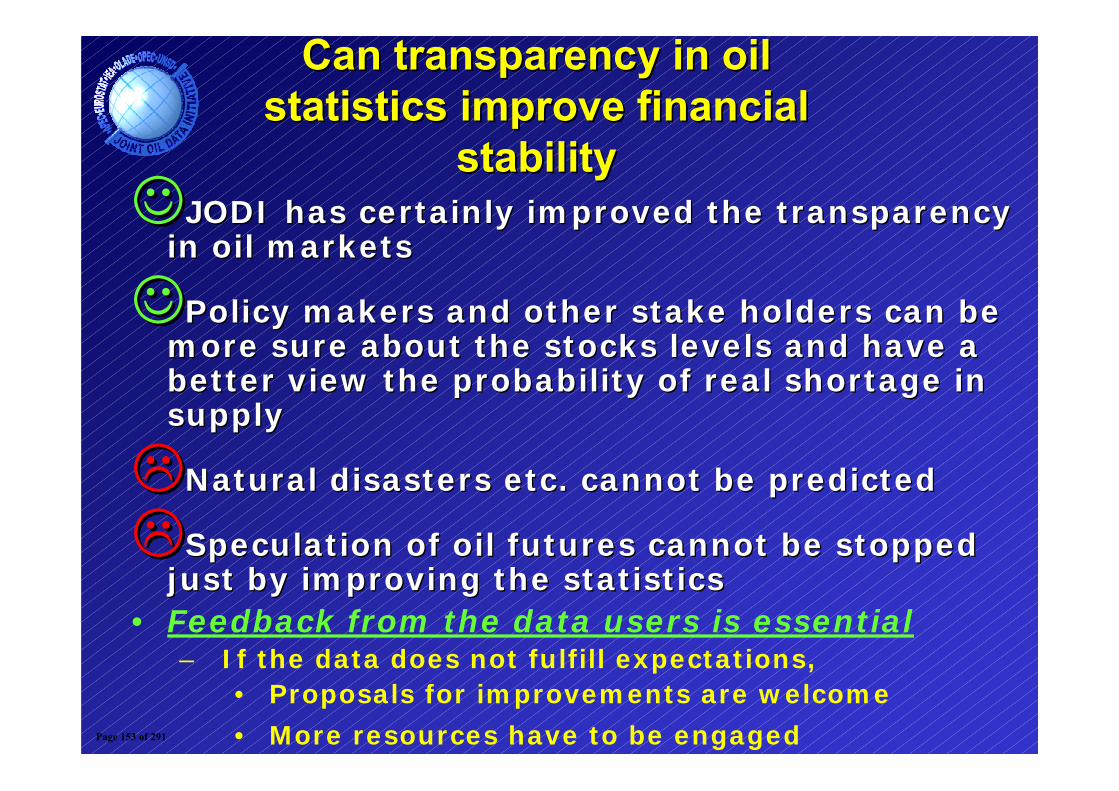
☺☺JODI has certainly improved the transparency JODI has certainly improved the transparency in oil marketsin oil markets
☺☺Policy makers and other stake holders can be Policy makers and other stake holders can be more sure about the stocks levels and have a more sure about the stocks levels and have a better view the probability of real shortage in better view the probability of real shortage in supplysupply
Natural disasters etc. cannot be predictedNatural disasters etc. cannot be predicted
Speculation of oil futures cannot be stopped Speculation of oil futures cannot be stopped just by improving the statisticsjust by improving the statistics
• Feedback from the data users is essential– If the data does not fulfill expectations,
• Proposals for improvements are welcome
• More resources have to be engaged
Can transparency in oil Can transparency in oil statistics improve financial statistics improve financial
stabilitystability
Page 153 of 291
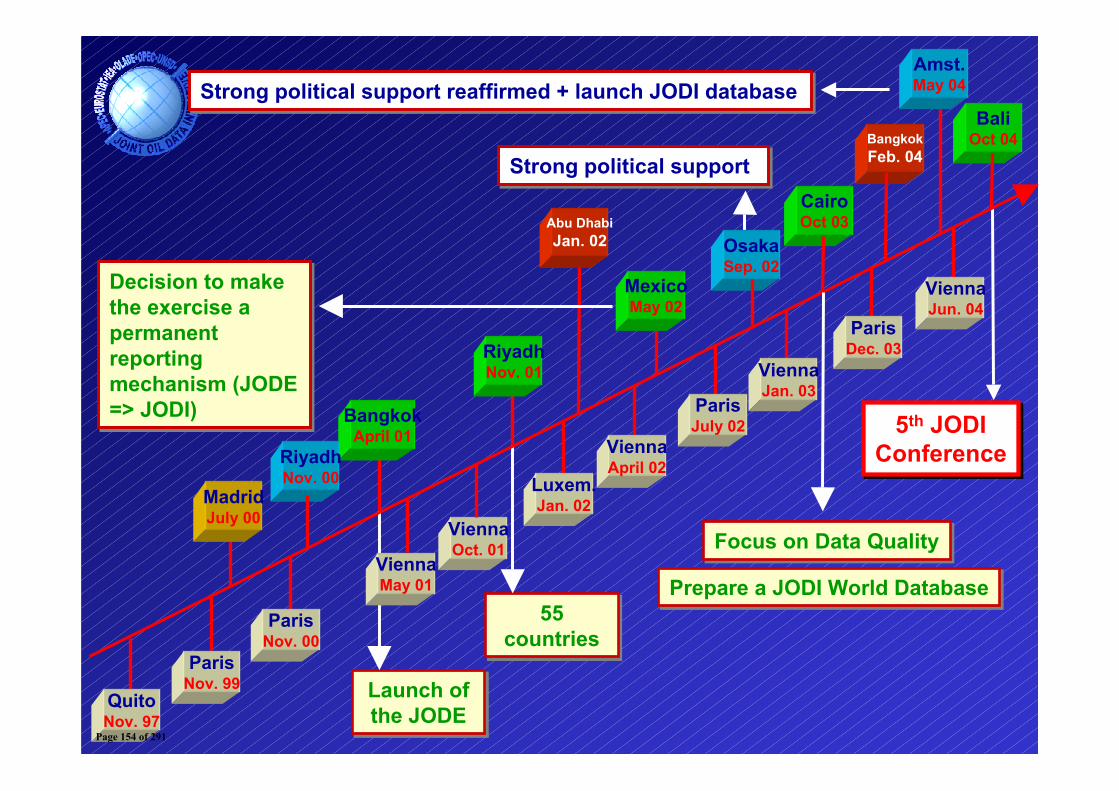
Launch of the JODELaunch of the JODE
55 countries
55 countries
Strong political support reaffirmed + launch JODI databaseStrong political support reaffirmed + launch JODI database
Strong political supportStrong political support
5th JODIConference
5th JODIConference
Amst.May 04
ViennaMay 01
ViennaOct. 01
BangkokApril 01
RiyadhNov. 01
Luxem.Jan. 02
MexicoMay 02
ViennaApril 02
OsakaSep. 02
QuitoNov. 97
MadridJuly 00
ParisNov. 00
ParisNov. 99
RiyadhNov. 00
CairoOct 03Abu Dhabi
Jan. 02
BangkokFeb. 04
ViennaJan. 03
ParisJuly 02
ParisDec. 03
ViennaJun. 04
BaliOct 04
Decision to make the exercise a permanent reporting mechanism (JODE=> JODI)
Decision to make the exercise a permanent reporting mechanism (JODE=> JODI)
Focus on Data QualityFocus on Data Quality
Prepare a JODI World DatabasePrepare a JODI World Database
Page 154 of 291
Lessons from the InitiativeLessons from the Initiative
A lot can be achieved by working together
A close interaction between organisations, countries and the industry is key to move a process
Improving data transparency will not happen over night
Transparency will not happen if not all the parties do not full participate
Page 155 of 291
www.jodidata.org
Thank youThank youPage 156 of 291
Peak Oil&
The Impact of Oil Depletion
ByC.J.Campbell
ASPO IRELANDwww.peakoil.ie
Page 157 of 291
Find it first
It costs money to find oil$10 - 20 million a wildcat
But it takes much more than moneyIt takes the right geology
We have new sophisticated methods to searchBut the same rocks and essentials
Page 158 of 291
The Essentials
Oil & Gas formed in the geological pastA finite resources subject to depletionEach gallon used means one less left
Production mirrors discoveryMany different categories
Some: easy, cheap and fast to produceOthers: difficult, expensive & slow
Page 159 of 291

It is so obvious
Depletion is easy to grasp We are born, we die and pass middle ageThe glass starts full and ends empty
Page 160 of 291

A Pint of Murphy’s Stout
Page 161 of 291
The same applies to Oil
How has such an obvious and important truth been obscured and confused ?
Ambiguous definitionsMisunderstood reporting practicesDifferent mindsets
Page 162 of 291

Mindsets : who to listen to?
The Geologist measures NatureHe can’t change the Cretaceous
The Economist measures MoneyHe can manipulate behaviour
The Engineer does thingsGive him a screwdriver & he goes to the Moon
The Manager makes money & image
Page 163 of 291

The Eternal Conflict between
Fact of FaithPeople once thought the
Earth was flat
and greeted science with suspicion and
resentment.
Some still do.
Page 164 of 291
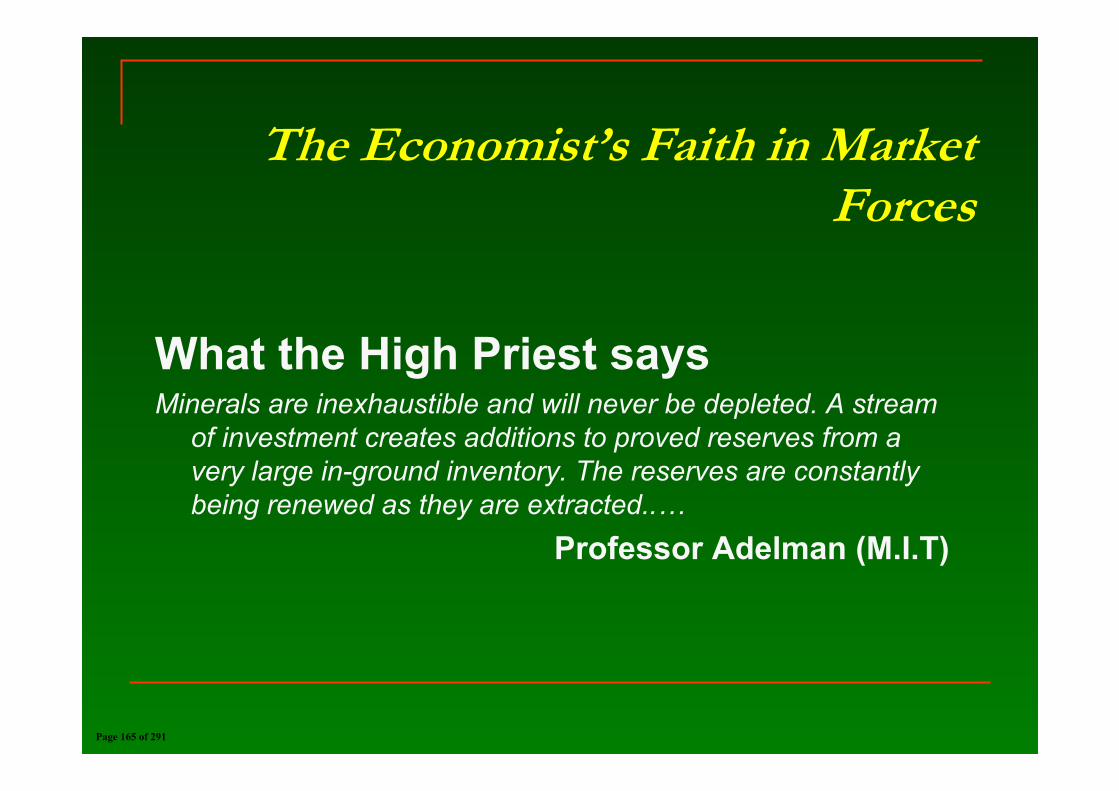
The Economist’s Faith in Market Forces
What the High Priest saysMinerals are inexhaustible and will never be depleted. A stream
of investment creates additions to proved reserves from a very large in-ground inventory. The reserves are constantly being renewed as they are extracted..…
Professor Adelman (M.I.T)
Page 165 of 291
Petroleum Geology in
three minutes
One Viewpoint
Page 166 of 291

On a mule in Colombia in 1960
Technology - no more advanced than the hammer,hand lens and mule - found much of the world’s oil
Page 167 of 291
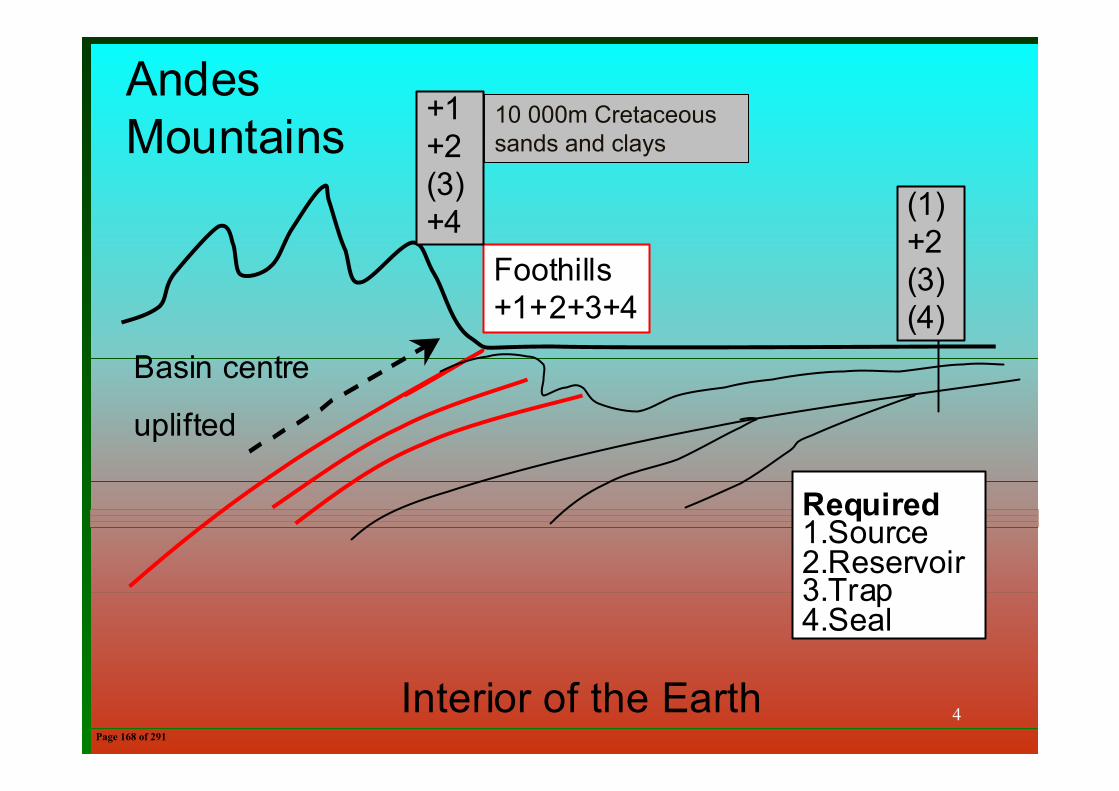
4
AndesMountains
Foothills+1+2+3+4
+1+2(3)+4
Basin centre
uplifted
Interior of the Earth
Required1.Source2.Reservoir3.Trap4.Seal
(1)+2(3)(4)
10 000m Cretaceous sands and clays
Page 168 of 291
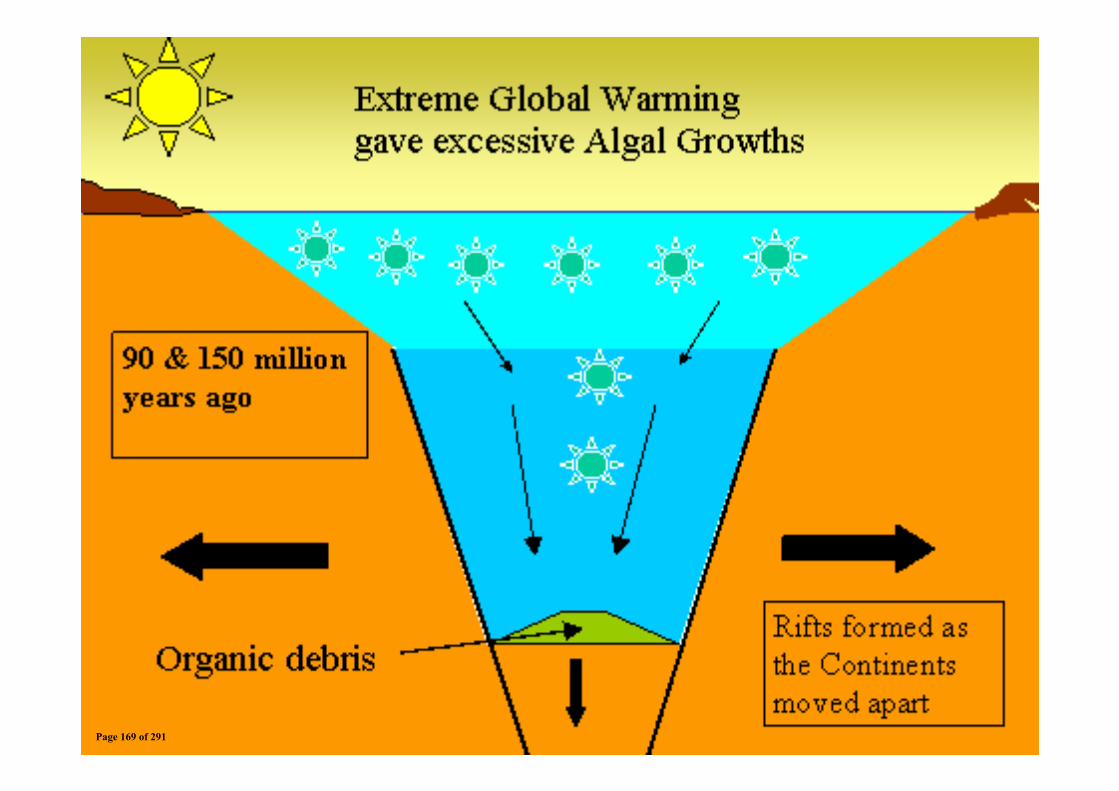
Page 169 of 291
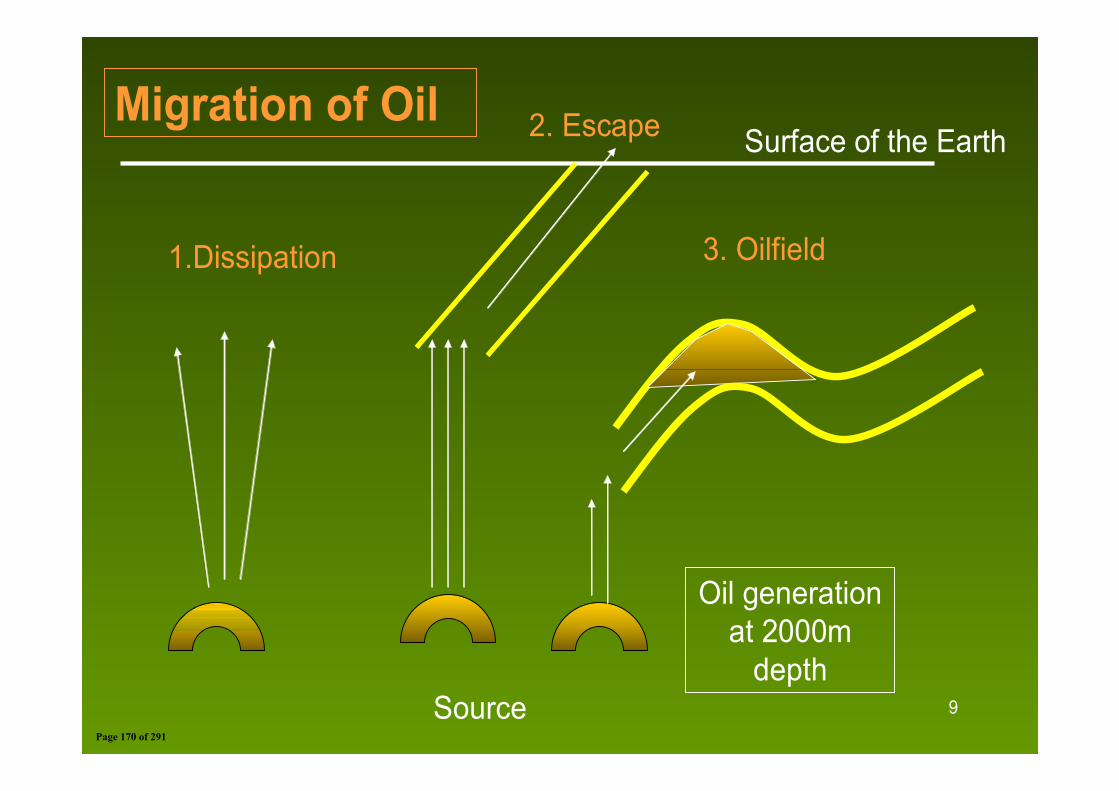
9
1.Dissipation
2. Escape
3. Oilfield
Source
Migration of OilSurface of the Earth
Oil generation at 2000m
depth
Page 170 of 291
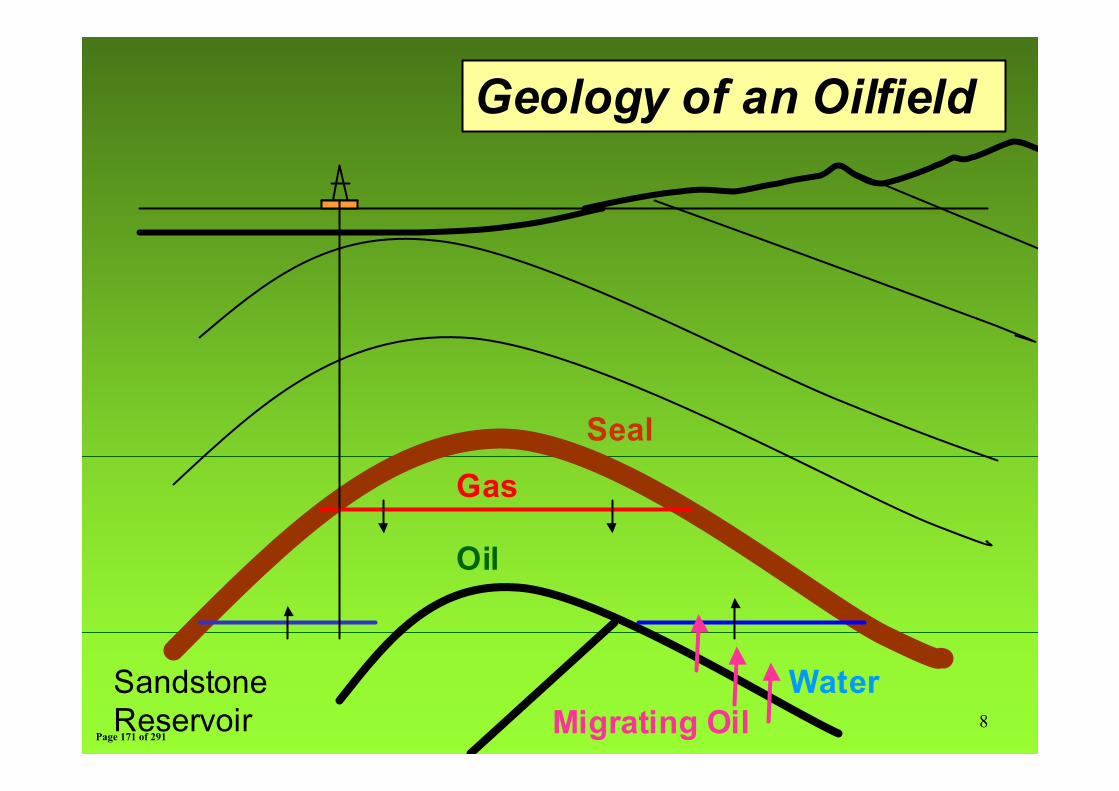
8
Oil
Gas
Water
Geology of an Oilfield
SandstoneReservoir Migrating Oil
Seal
Page 171 of 291
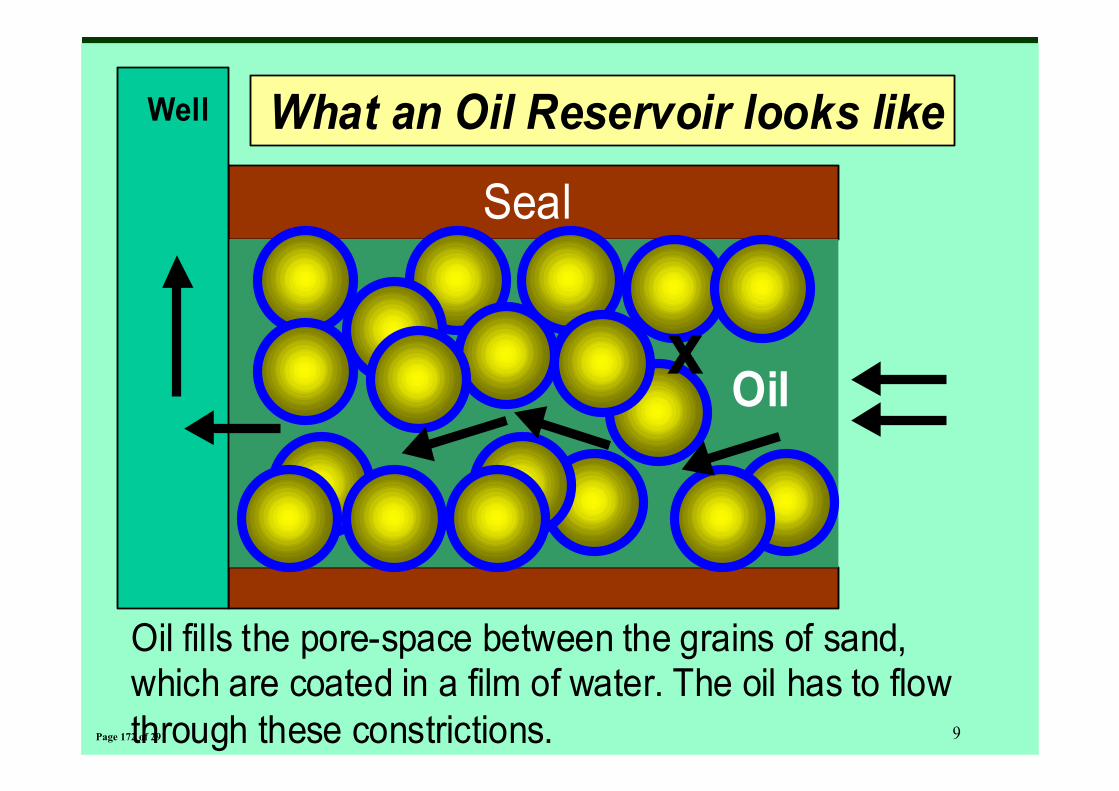
9
What an Oil Reservoir looks like
Oil fills the pore-space between the grains of sand,which are coated in a film of water. The oil has to flowthrough these constrictions.
Oil
Seal
Well
x
Page 172 of 291
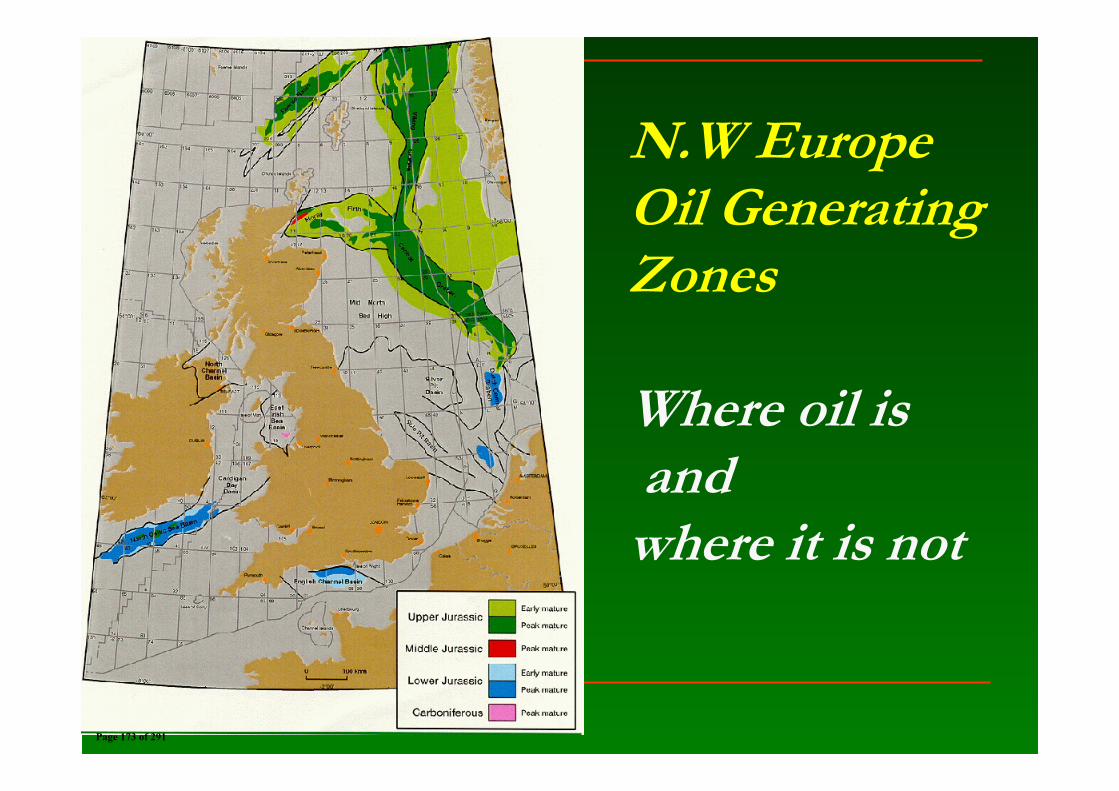
N.W EuropeOil GeneratingZones
Where oil isand
where it is not
Page 173 of 291
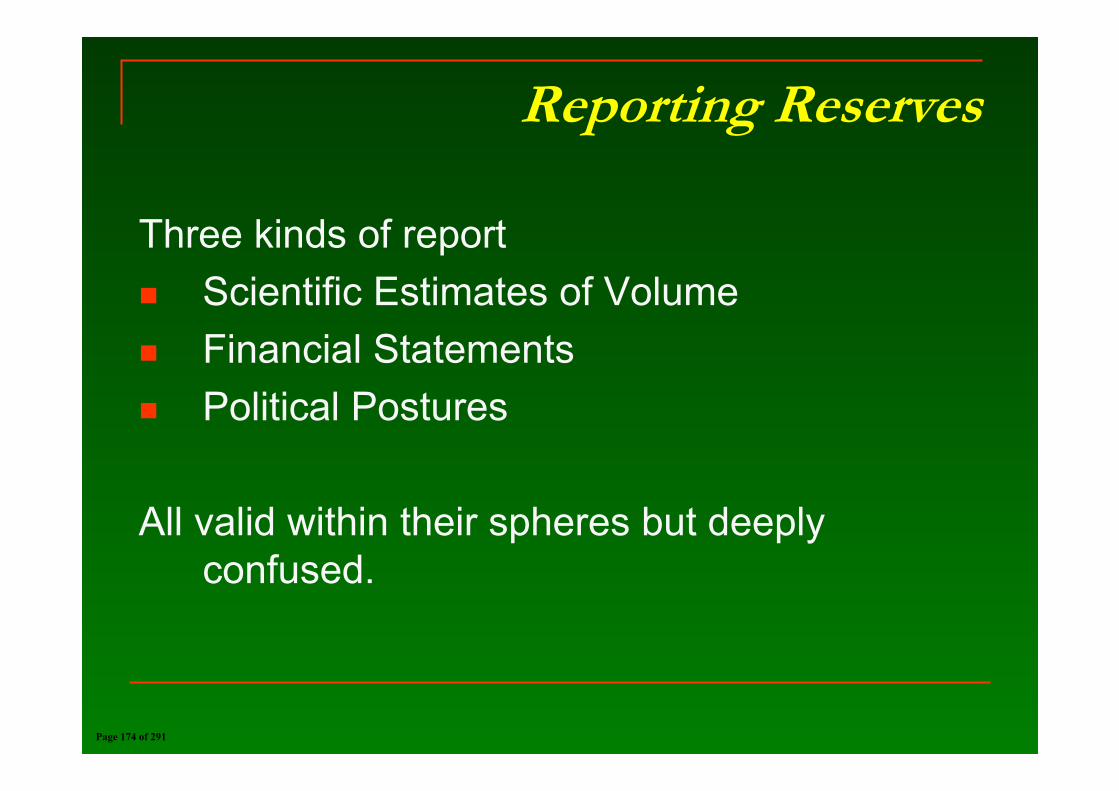
Reporting Reserves
Three kinds of reportScientific Estimates of VolumeFinancial StatementsPolitical Postures
All valid within their spheres but deeply confused.
Page 174 of 291
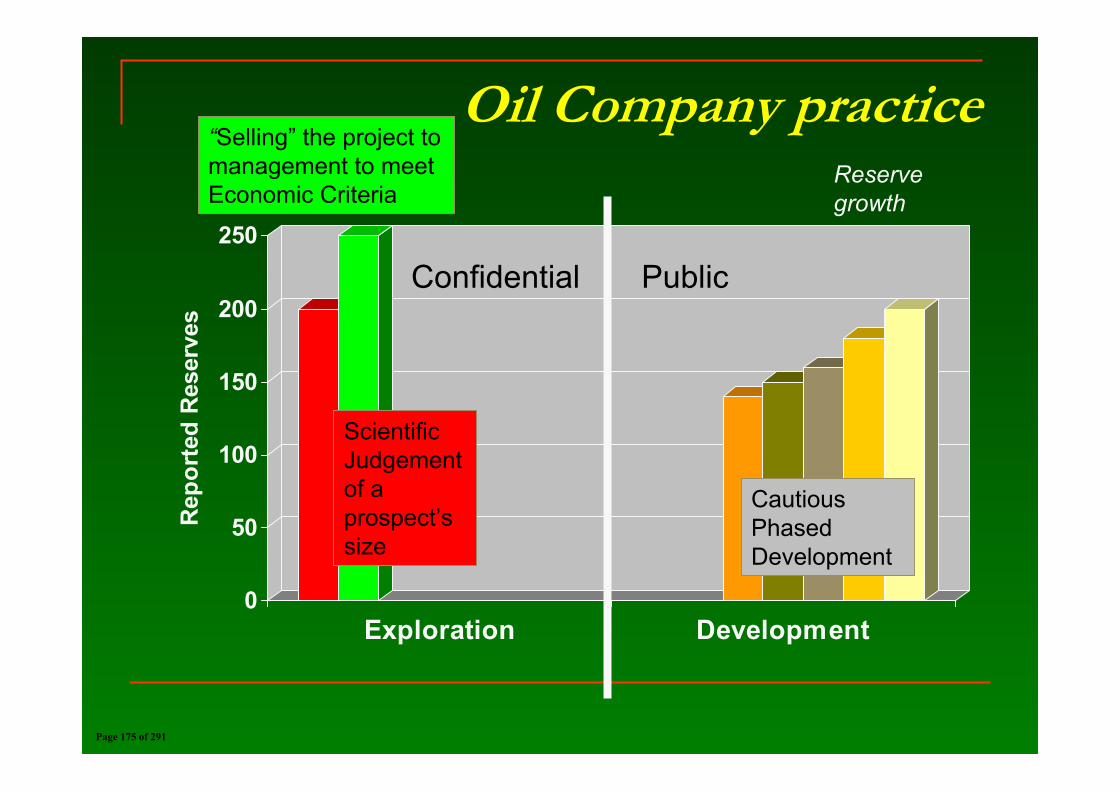
Oil Company practice
0
50
100
150
200
250
Rep
orte
d R
eser
ves
Exploration Development
“Selling” the project to management to meet Economic Criteria
Scientific Judgement of a prospect’s size
Cautious Phased Development
Confidential Public
Reserve growth
Page 175 of 291
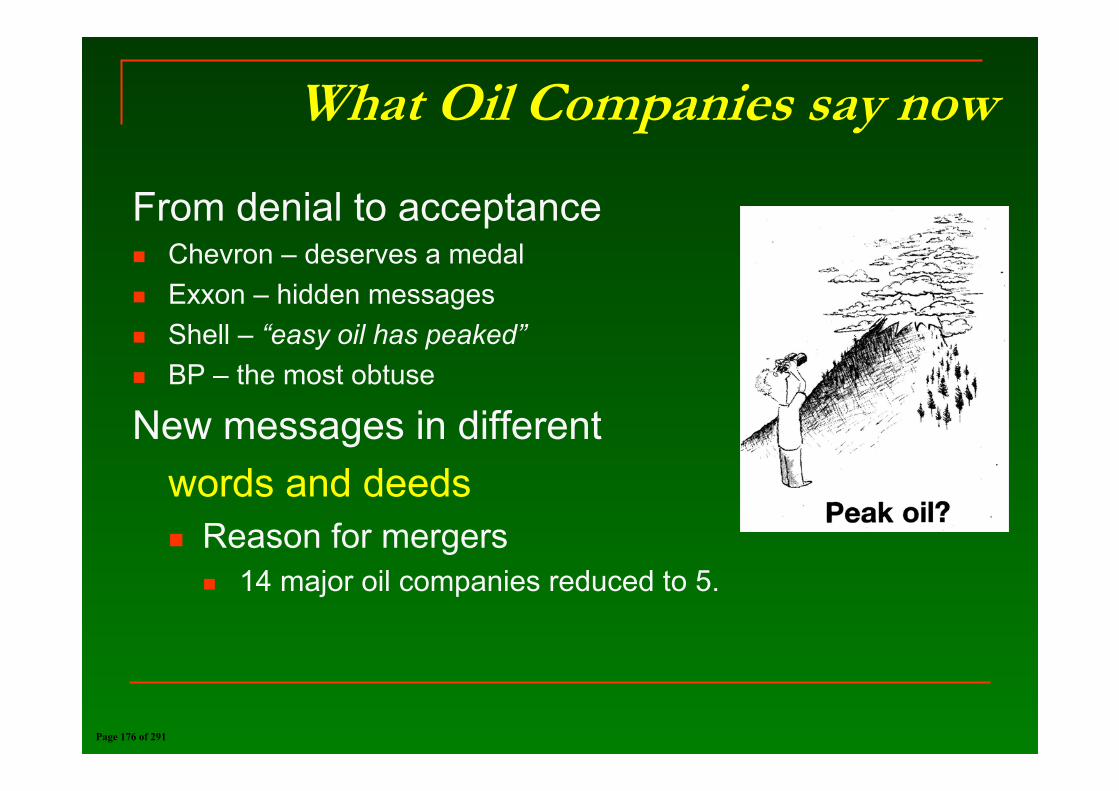
What Oil Companies say now
From denial to acceptanceChevron – deserves a medalExxon – hidden messagesShell – “easy oil has peaked”BP – the most obtuse
New messages in different words and deeds
Reason for mergers14 major oil companies reduced to 5.
Page 176 of 291
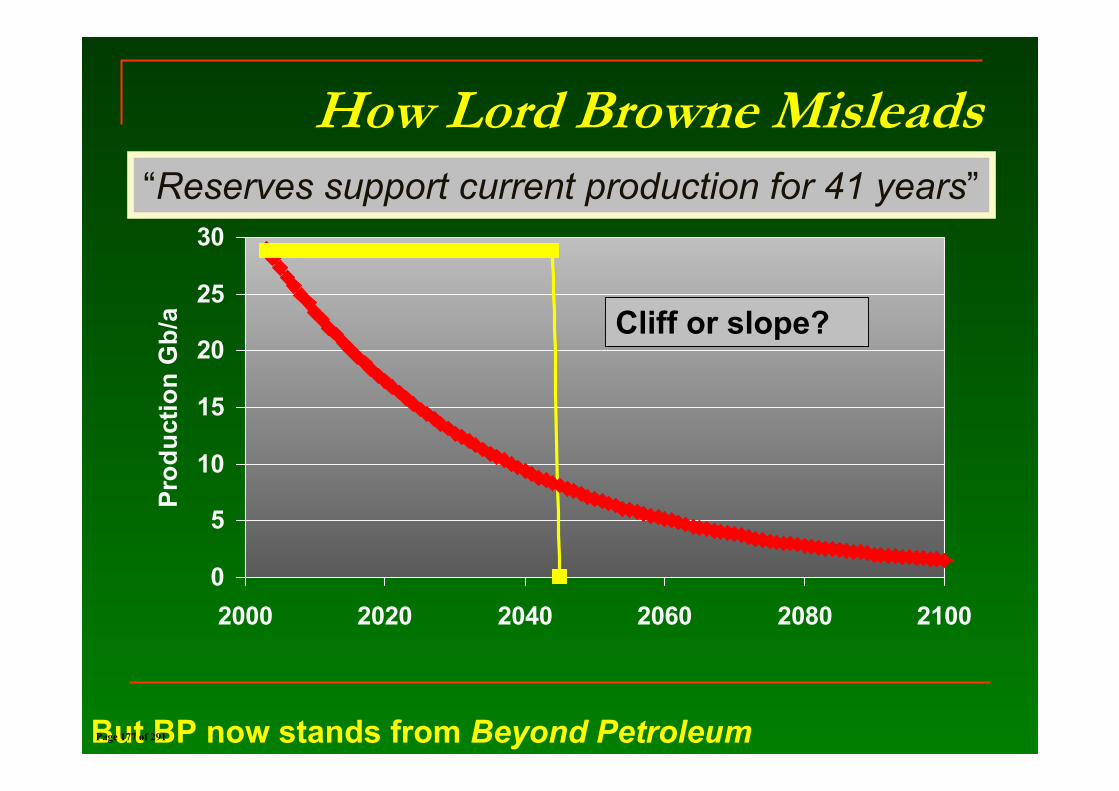
How Lord Browne Misleads
0
5
10
15
20
25
30
2000 2020 2040 2060 2080 2100
Prod
uctio
n G
b/a
“Reserves support current production for 41 years”
Cliff or slope?
But BP now stands from Beyond PetroleumPage 177 of 291
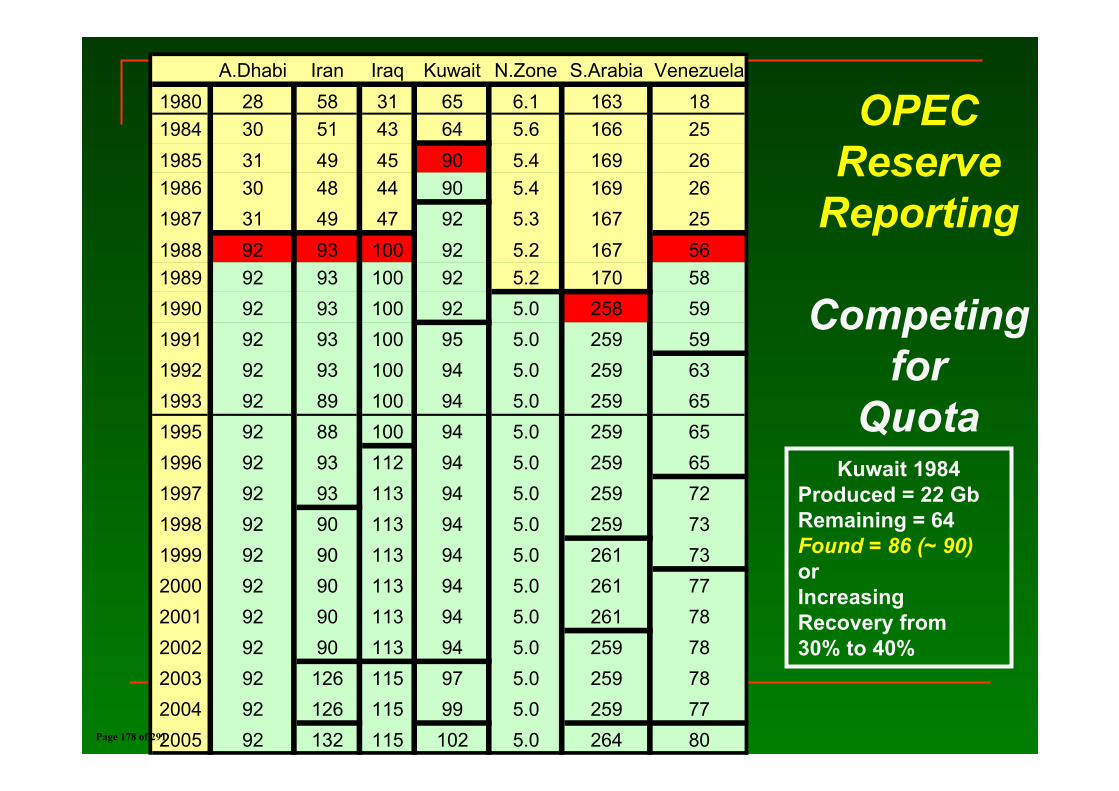
OPECReserve
Reporting
Competingfor
QuotaKuwait 1984
Produced = 22 GbRemaining = 64Found = 86 (~ 90)orIncreasing Recovery from 30% to 40%
A.Dhabi Iran Iraq Kuwait N.Zone S.Arabia Venezuela1980 28 58 31 65 6.1 163 181984 30 51 43 64 5.6 166 251985 31 49 45 90 5.4 169 261986 30 48 44 90 5.4 169 261987 31 49 47 92 5.3 167 251988 92 93 100 92 5.2 167 561989 92 93 100 92 5.2 170 581990 92 93 100 92 5.0 258 591991 92 93 100 95 5.0 259 591992 92 93 100 94 5.0 259 631993 92 89 100 94 5.0 259 651995 92 88 100 94 5.0 259 651996 92 93 112 94 5.0 259 651997 92 93 113 94 5.0 259 721998 92 90 113 94 5.0 259 731999 92 90 113 94 5.0 261 732000 92 90 113 94 5.0 261 772001 92 90 113 94 5.0 261 782002 92 90 113 94 5.0 259 782003 92 126 115 97 5.0 259 782004 92 126 115 99 5.0 259 772005 92 132 115 102 5.0 264 80Page 178 of 291
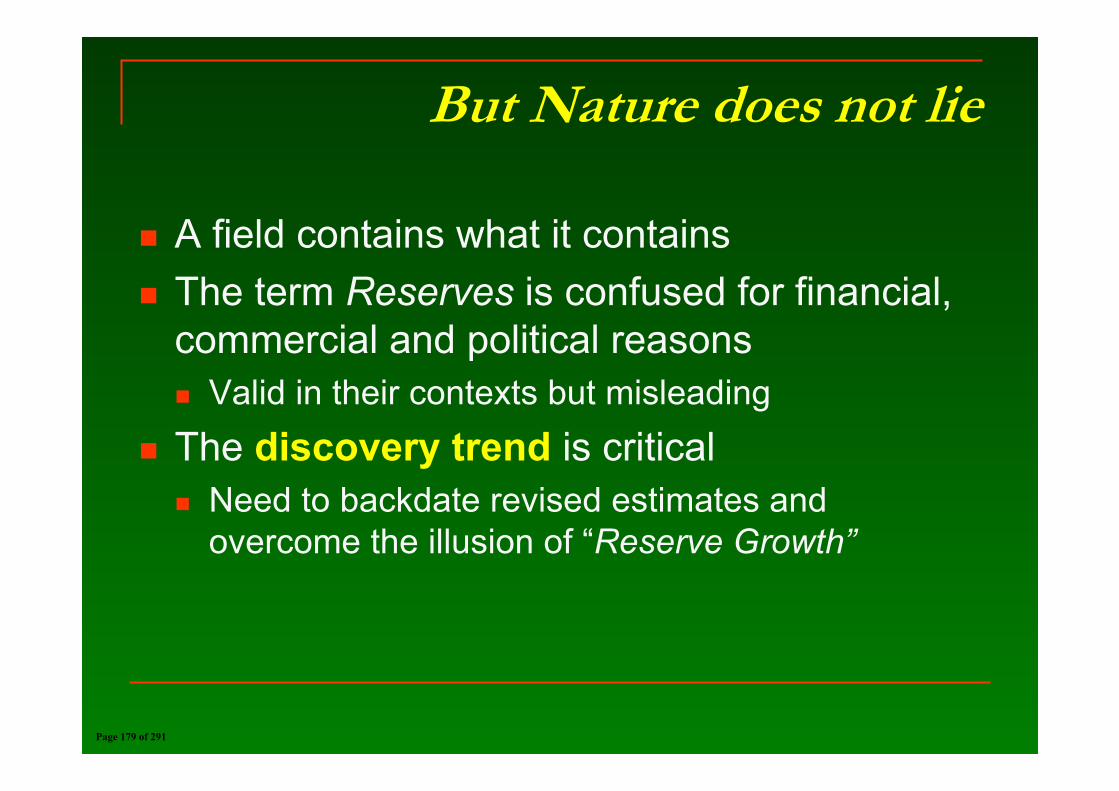
But Nature does not lie
A field contains what it contains The term Reserves is confused for financial, commercial and political reasons
Valid in their contexts but misleadingThe discovery trend is critical
Need to backdate revised estimates and overcome the illusion of “Reserve Growth”
Page 179 of 291
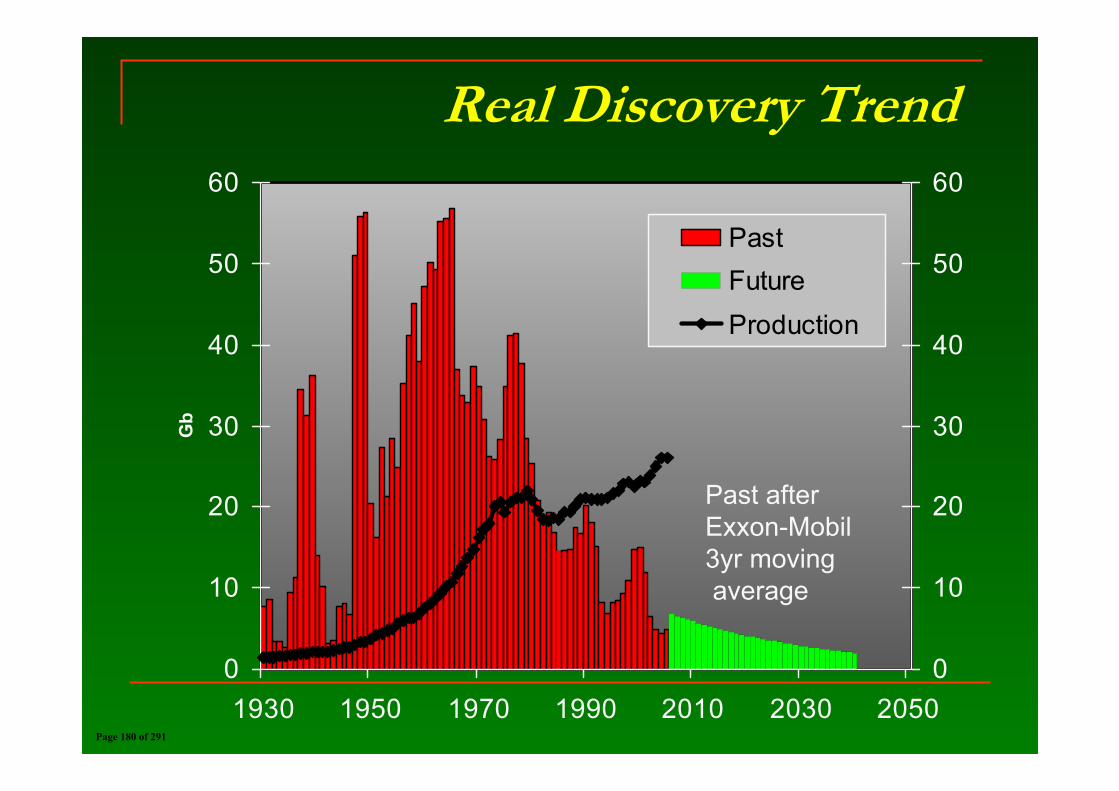
Real Discovery Trend
Past discovery by ExxonMobil
0
10
20
30
40
50
60
1930 1950 1970 1990 2010 2030 2050
Gb
0
10
20
30
40
50
60
PastFutureProduction
Past afterExxon-Mobil3yr movingaverage
Page 180 of 291
Examples
Production mirrors discovery After 20-45 years.
Discovery peaked in most countries long ago.The larger fields were found first
Too big to miss
Page 181 of 291
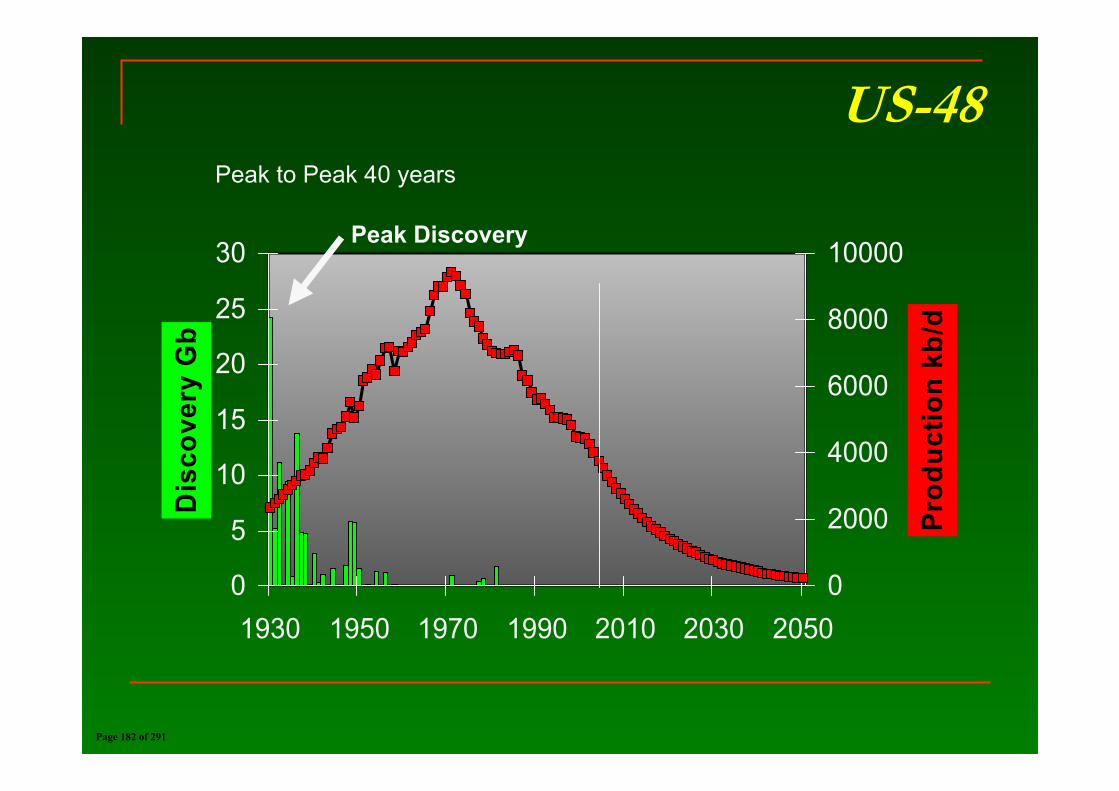
US-48
0
5
10
15
20
25
30
1930 1950 1970 1990 2010 2030 2050
Dis
cove
ry G
b
0
2000
4000
6000
8000
10000
Prod
uctio
n kb
/d
Peak to Peak 40 years
Peak Discovery
Page 182 of 291
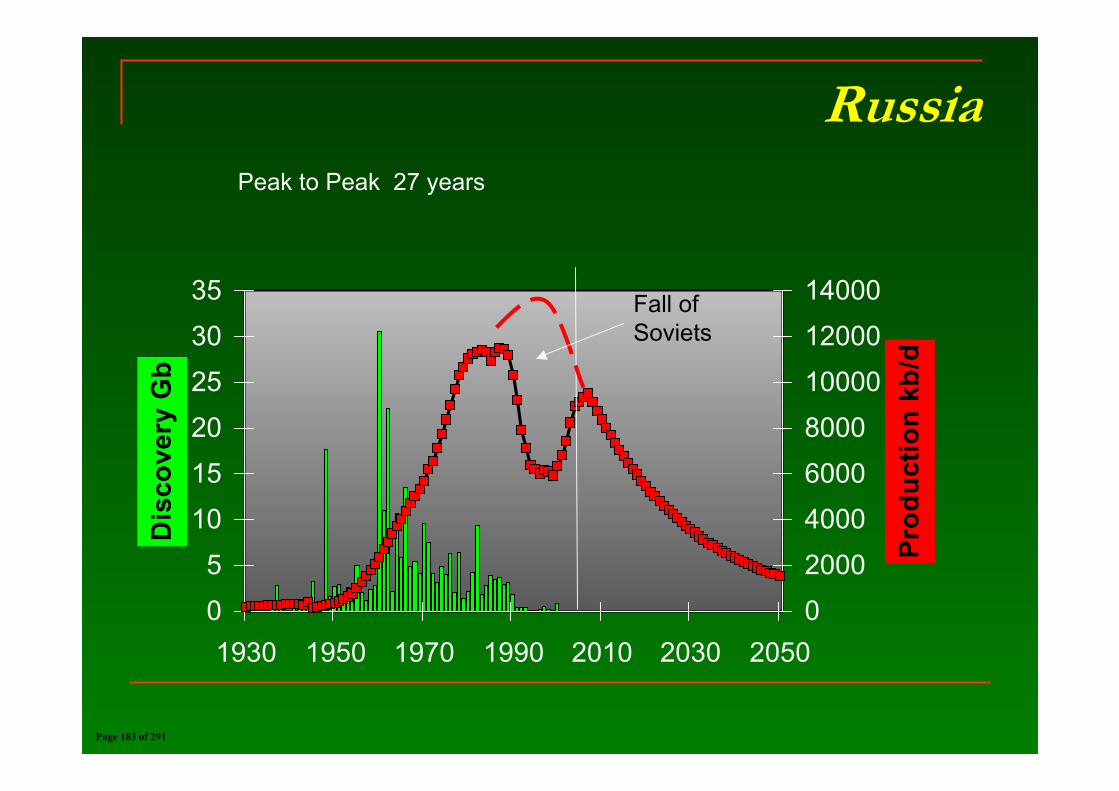
Russia
0
5
10
15
20
25
30
35
1930 1950 1970 1990 2010 2030 2050
Dis
cove
ry G
b
0
2000
4000
6000
8000
10000
12000
14000
Prod
uctio
n kb
/d
Peak to Peak 27 years
Fall of Soviets
Page 183 of 291
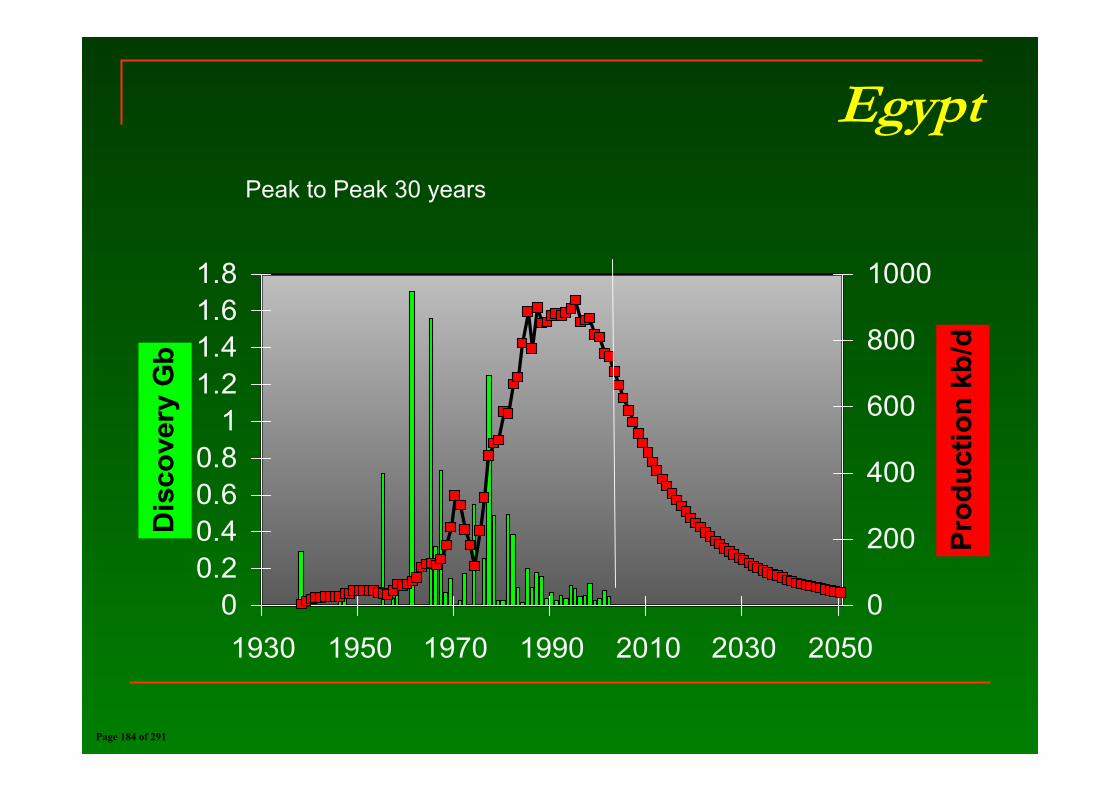
Egypt
00.20.40.60.8
11.21.41.61.8
1930 1950 1970 1990 2010 2030 2050
Dis
cove
ry G
b
0
200
400
600
800
1000
Prod
uctio
n kb
/d
Peak to Peak 30 years
Page 184 of 291
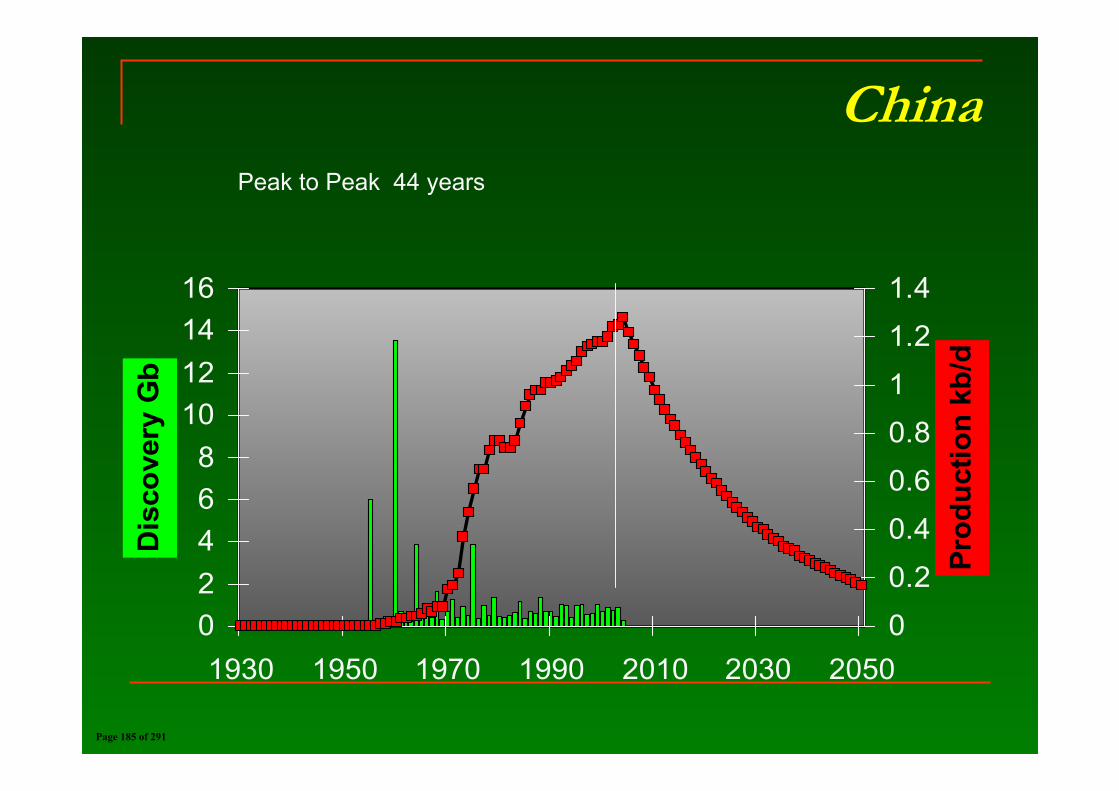
China
02468
10121416
1930 1950 1970 1990 2010 2030 2050
Dis
cove
ry G
b
0
0.2
0.4
0.6
0.8
1
1.2
1.4
Prod
uctio
n kb
/d
Peak to Peak 44 years
Page 185 of 291
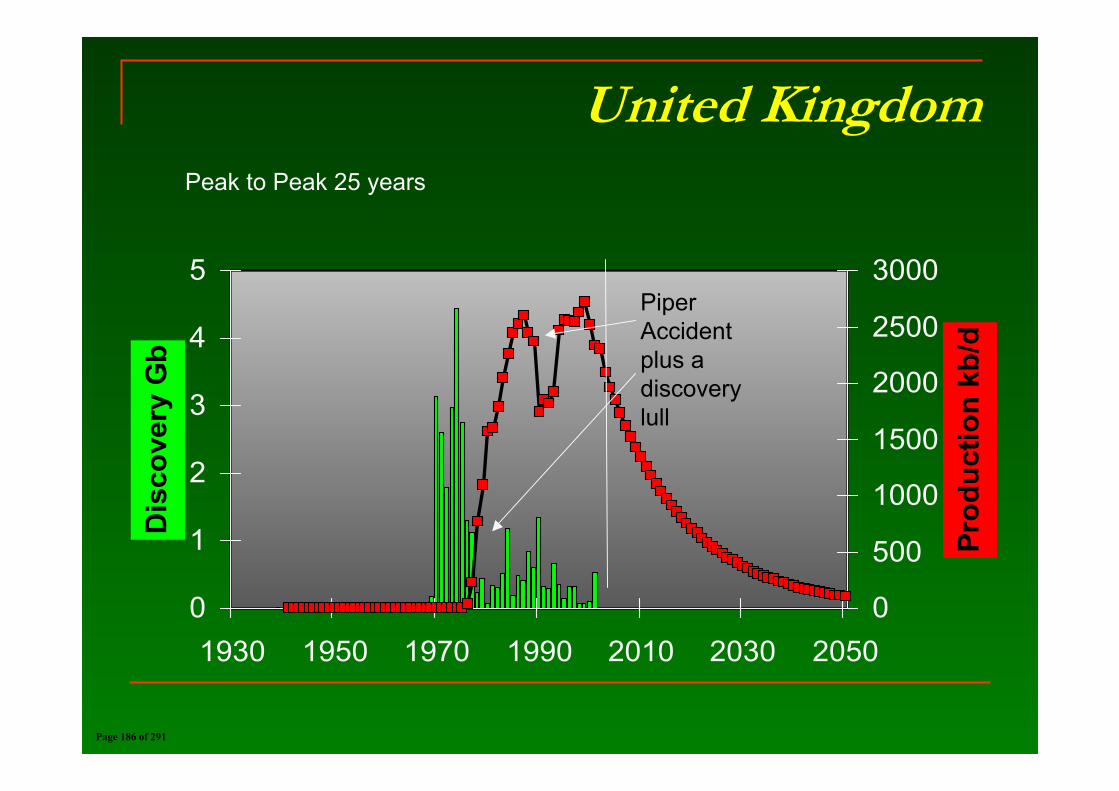
United Kingdom
0
1
2
3
4
5
1930 1950 1970 1990 2010 2030 2050
Dis
cove
ry G
b
0
500
1000
1500
2000
2500
3000
Prod
uctio
n kb
/d
Peak to Peak 25 years
Piper Accident plus a discovery lull
Page 186 of 291
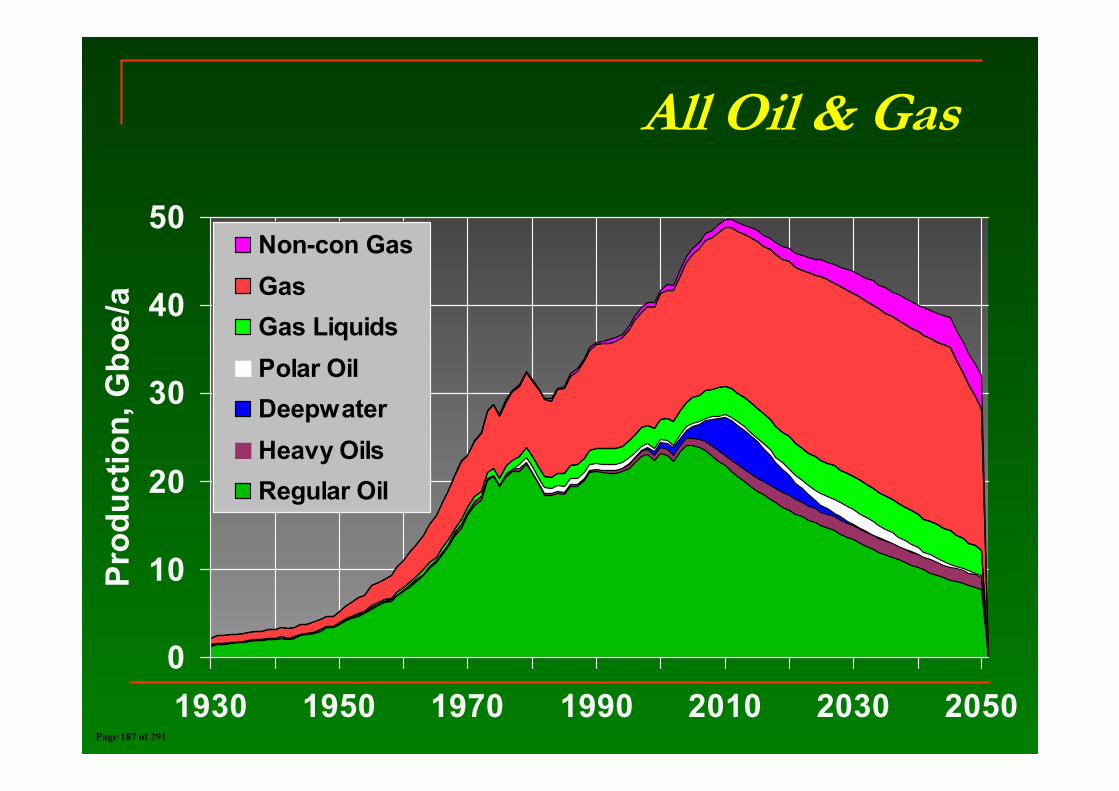
All Oil & Gas
0
10
20
30
40
50
1930 1950 1970 1990 2010 2030 2050
Prod
uctio
n, G
boe/
a
Non-con GasGasGas LiquidsPolar OilDeepwaterHeavy OilsRegular Oil
Page 187 of 291
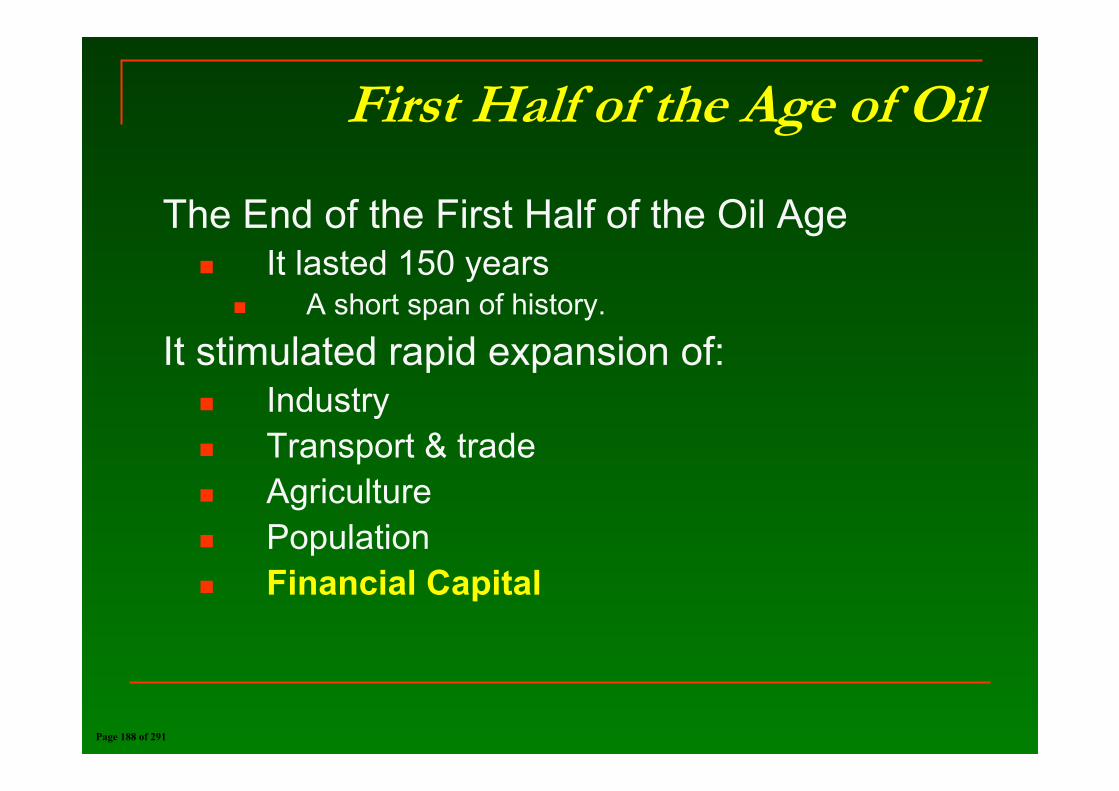
First Half of the Age of Oil
The End of the First Half of the Oil AgeIt lasted 150 years
A short span of history.
It stimulated rapid expansion of:IndustryTransport & tradeAgriculturePopulationFinancial Capital
Page 188 of 291
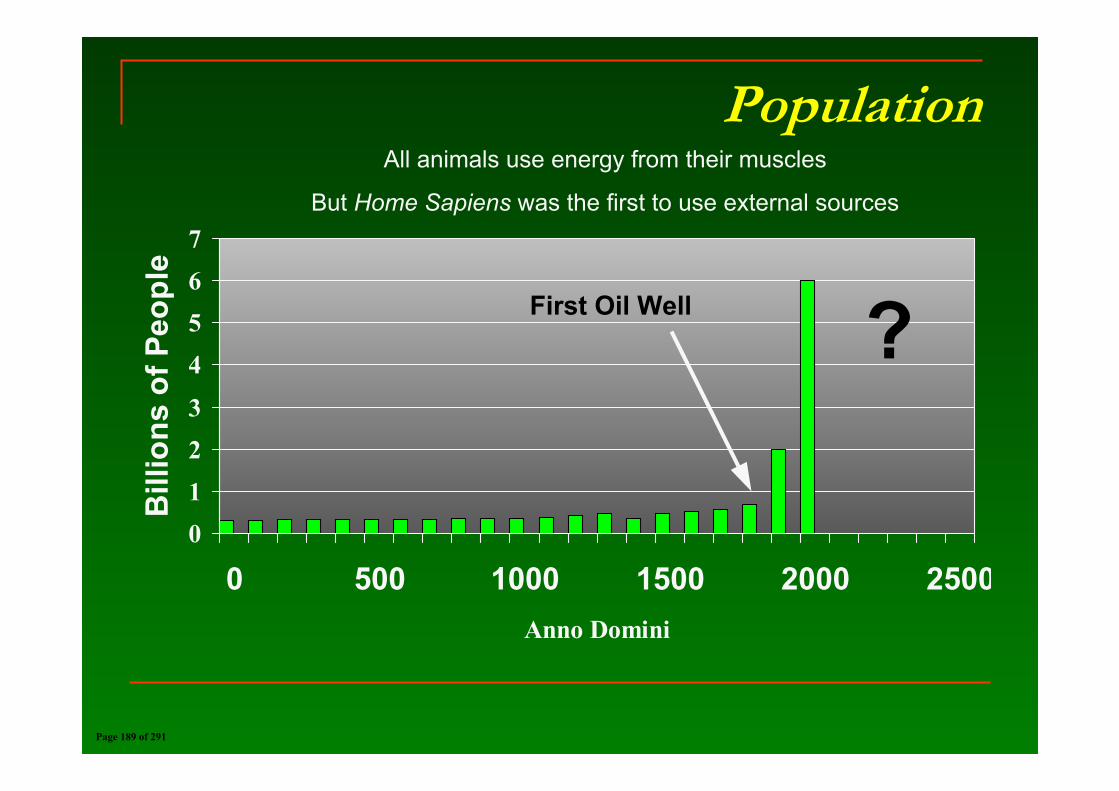
Population
0123
4567
0 500 1000 1500 2000 2500Anno Domini
Bill
ions
of P
eopl
e
First Oil Well ?
All animals use energy from their muscles
But Home Sapiens was the first to use external sources
Page 189 of 291
Evolution of MoneyHomo Sapiens: the first animal to use external energy & trade
Simple barterGold and silver coins
Owning the mine = unearned wealthConquest for gold & silver
The Spanish Empire in Latin AmericaPaper money
At first backed by gold : but later faith aloneEffectively a licence to use energy
Much previously minted by the Federal ReserveNow, Middle East governments through petrodollars
Page 190 of 291

Wall Street & War
Wall Street needsenergy supply: prompting moreresource wars totake what is left.
Page 191 of 291
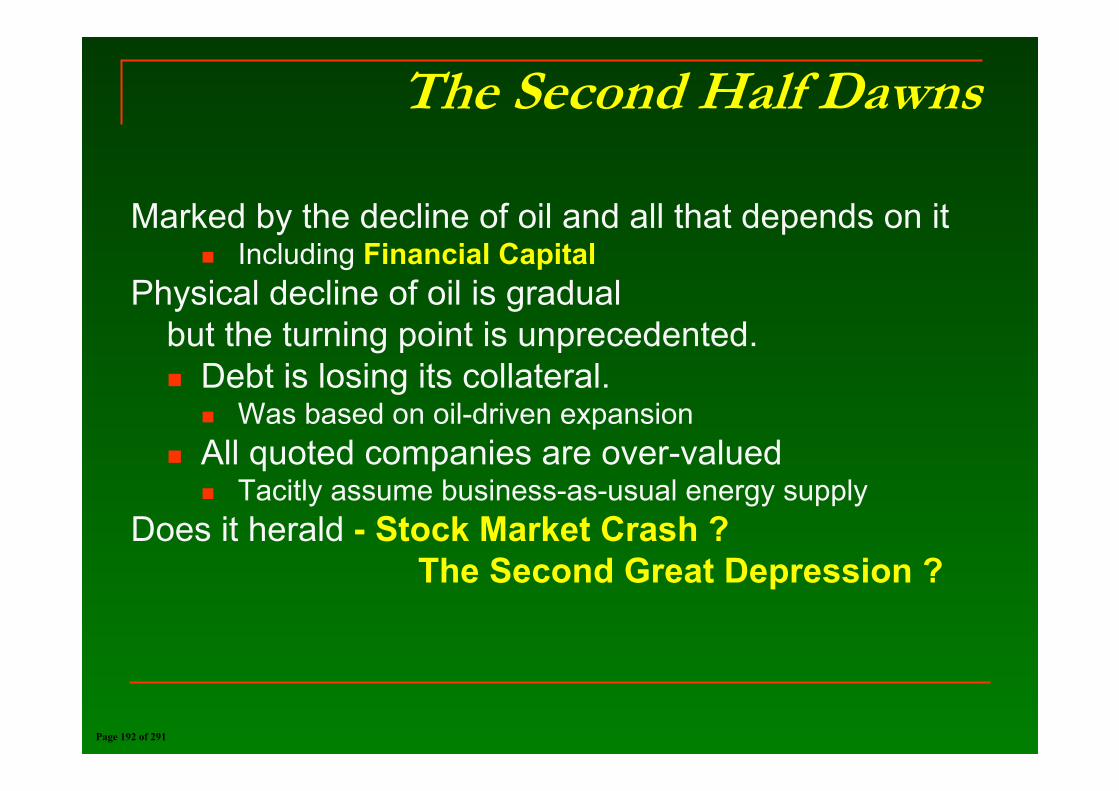
The Second Half Dawns
Marked by the decline of oil and all that depends on itIncluding Financial Capital
Physical decline of oil is gradual but the turning point is unprecedented.
Debt is losing its collateral.Was based on oil-driven expansion
All quoted companies are over-valuedTacitly assume business-as-usual energy supply
Does it herald - Stock Market Crash ? The Second Great Depression ?
Page 192 of 291
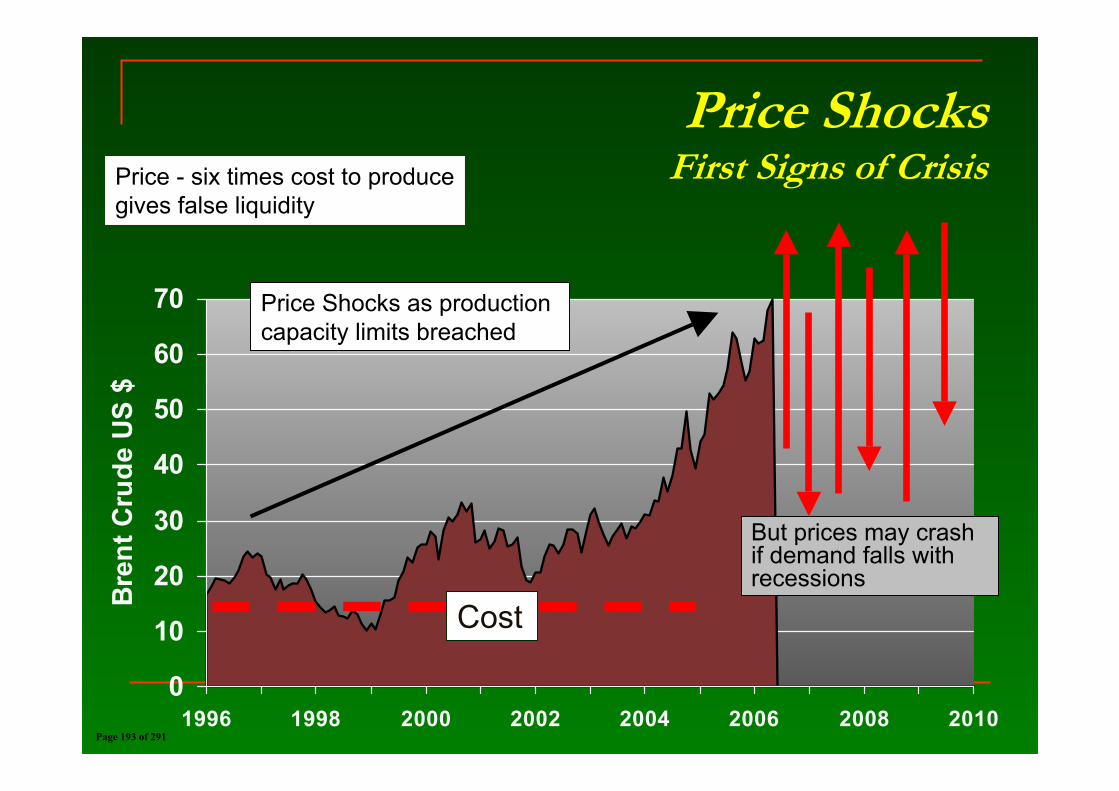
Price Shocks First Signs of Crisis
0
10
20
30
40
50
60
70
1996 1998 2000 2002 2004 2006 2008 2010
Bre
nt C
rude
US
$
But prices may crash if demand falls with recessions
Price Shocks as production capacity limits breached
Price - six times cost to producegives false liquidity
Cost
Page 193 of 291

Plan of ActionCollect proper data.
Use Foreign Service to secure.Resign from International Energy Agency.
Inform the public.Cut waste
Especially in transport sector.New building standards; town planning.Live differently: end consumeristic ethic.
Turn to new energy sources from from tide, sun, wind, bio-mass, ? nuclear.
Page 194 of 291

Regionalise and Ruralise
Rediscover the regions New Community SpiritLiving within their resourcesChange Mindset from “poverty” to success in sustainable living
Urban living becomes more difficultMigration ceases to be viable
Page 195 of 291
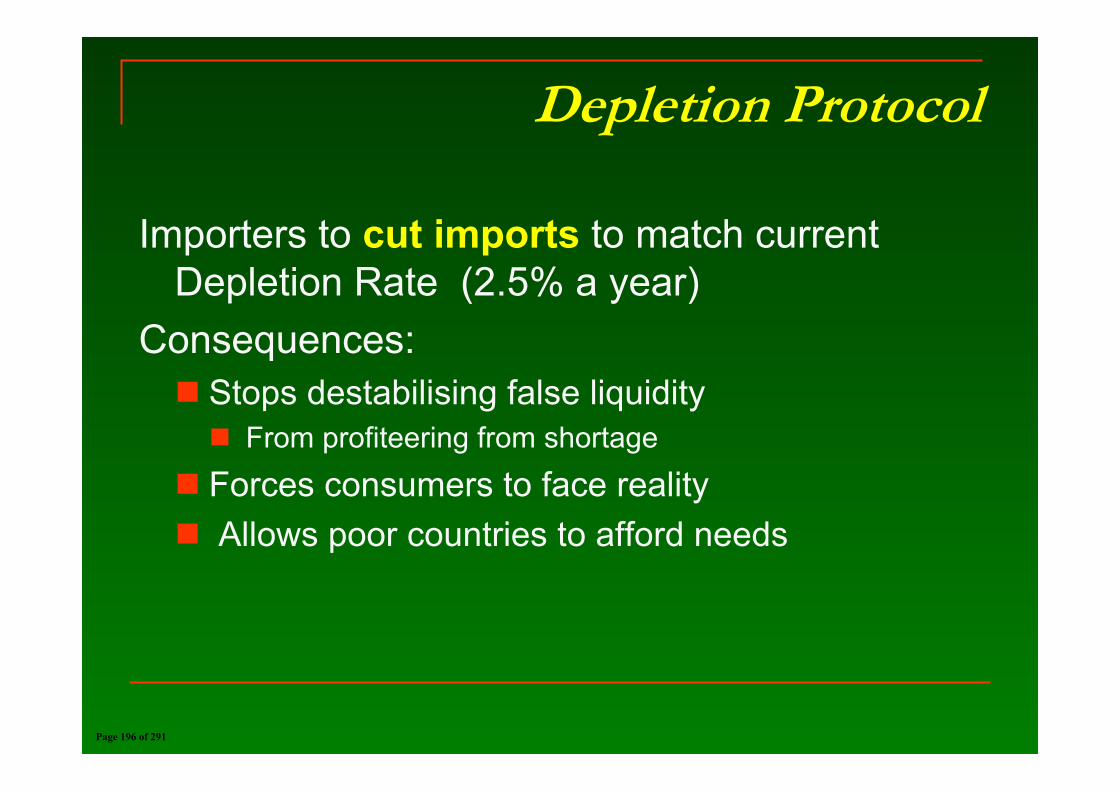
Depletion Protocol
Importers to cut imports to match current Depletion Rate (2.5% a year)
Consequences:Stops destabilising false liquidity
From profiteering from shortageForces consumers to face realityAllows poor countries to afford needs
Page 196 of 291

Thank Youand
Good Luck
Page 197 of 291
Session II Part 1: Microeconomic consequences of rising oil prices, competitiveness and taxation
Page 198 of 291
Oil Prices and Transport Sector Responses
David BaldockDirector
The Institute for European Environmental PolicyWorkshop on Economic Impacts
Of Rising Oil Prices
28 June 2006
www.ieep.org.uk
Page 199 of 291
Outline
• Context• Transport and oil dependency• Elasticities of demand• Decoupling
• Substitution• Alternative fuels• Efficient vehicles
• Policies and Choices
Page 200 of 291
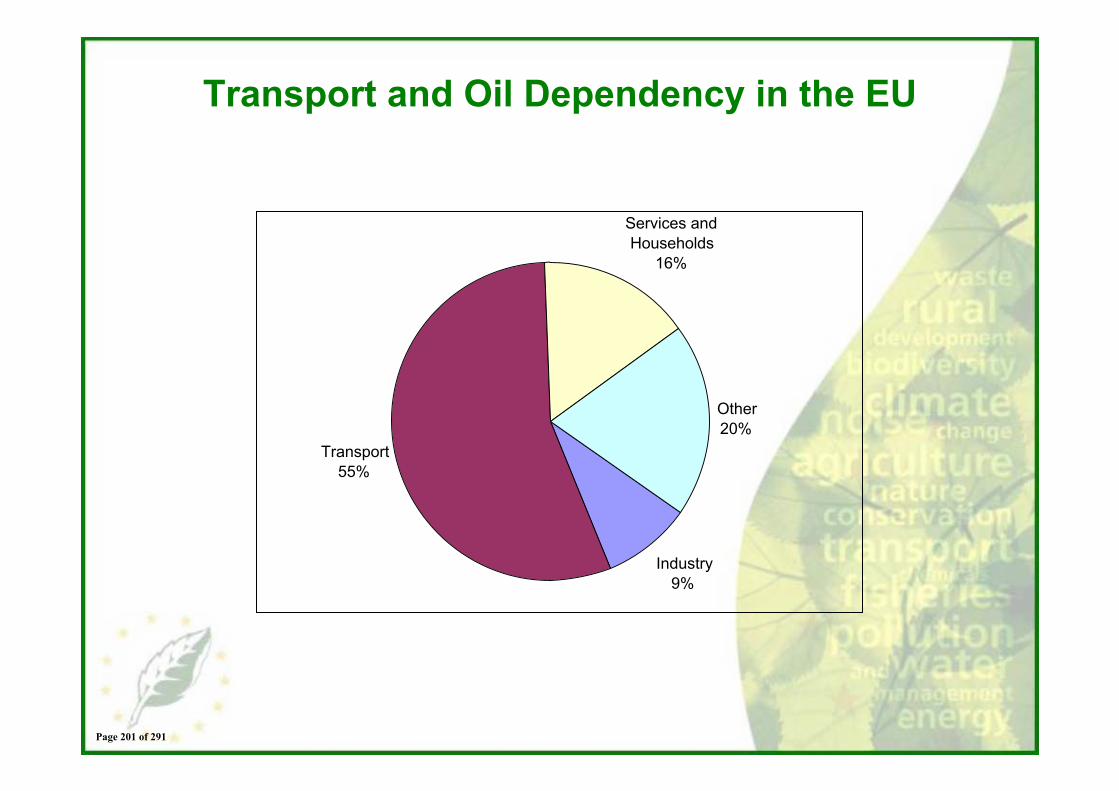
Transport and Oil Dependency in the EU
Industry9%
Transport55%
Services and Households
16%
Other20%
Page 201 of 291
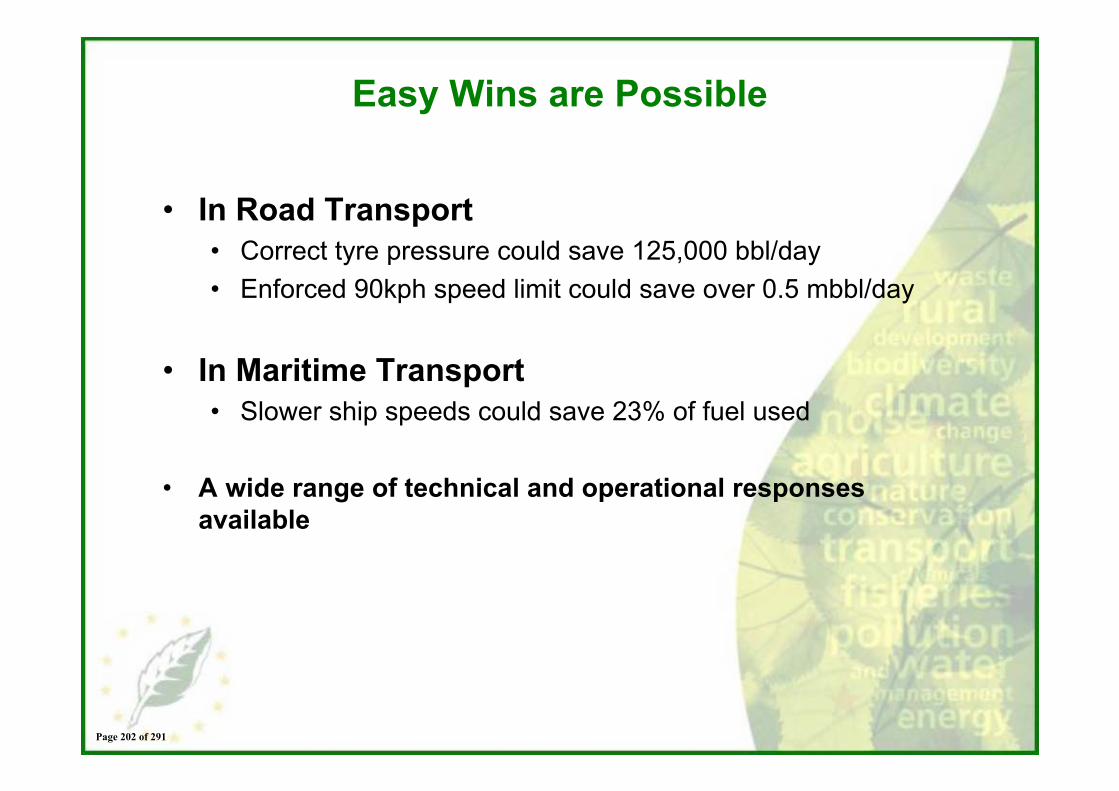
Easy Wins are Possible
• In Road Transport• Correct tyre pressure could save 125,000 bbl/day • Enforced 90kph speed limit could save over 0.5 mbbl/day
• In Maritime Transport• Slower ship speeds could save 23% of fuel used
• A wide range of technical and operational responses available
Page 202 of 291
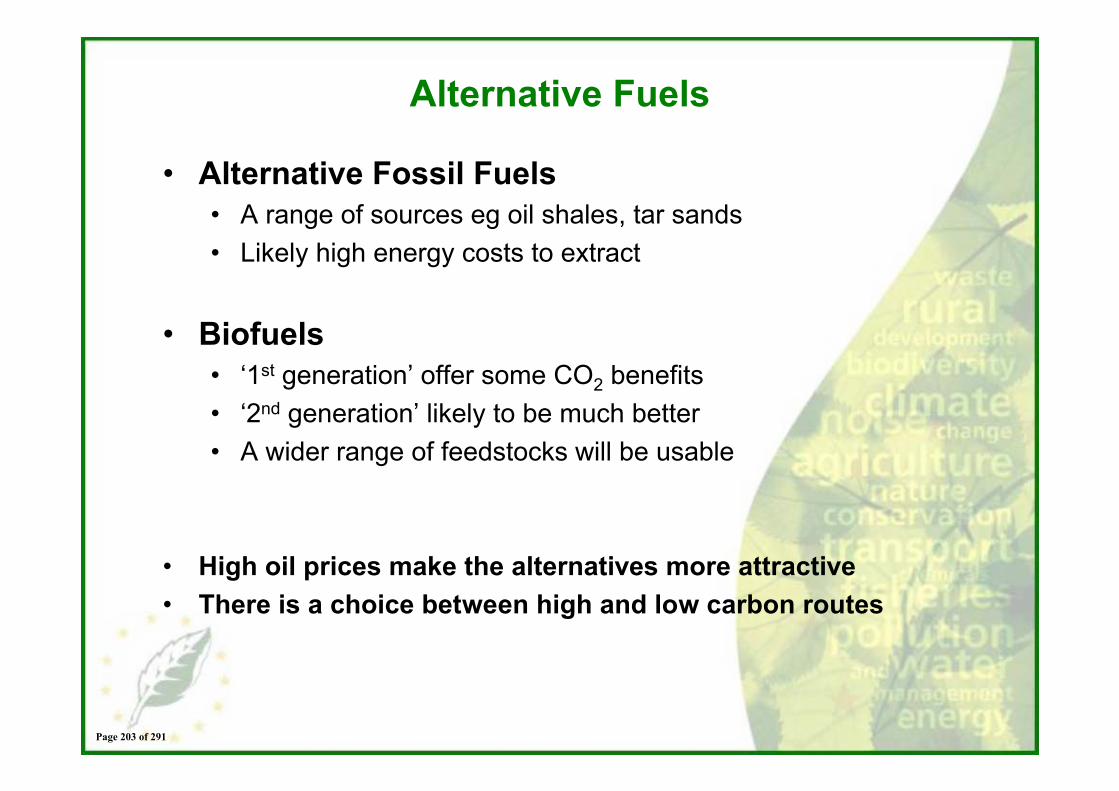
Alternative Fuels
• Alternative Fossil Fuels• A range of sources eg oil shales, tar sands• Likely high energy costs to extract
• Biofuels• ‘1st generation’ offer some CO2 benefits• ‘2nd generation’ likely to be much better • A wider range of feedstocks will be usable
• High oil prices make the alternatives more attractive• There is a choice between high and low carbon routes
Page 203 of 291
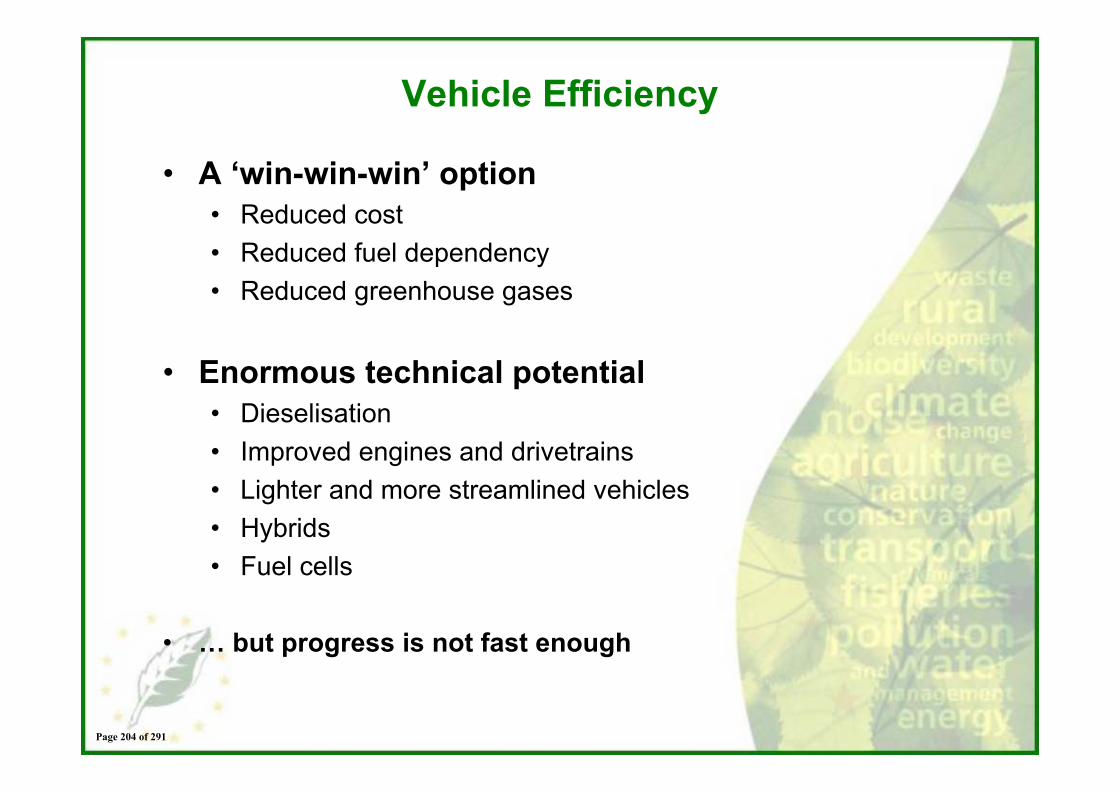
Vehicle Efficiency
• A ‘win-win-win’ option• Reduced cost• Reduced fuel dependency• Reduced greenhouse gases
• Enormous technical potential• Dieselisation• Improved engines and drivetrains• Lighter and more streamlined vehicles• Hybrids• Fuel cells
• … but progress is not fast enough
Page 204 of 291
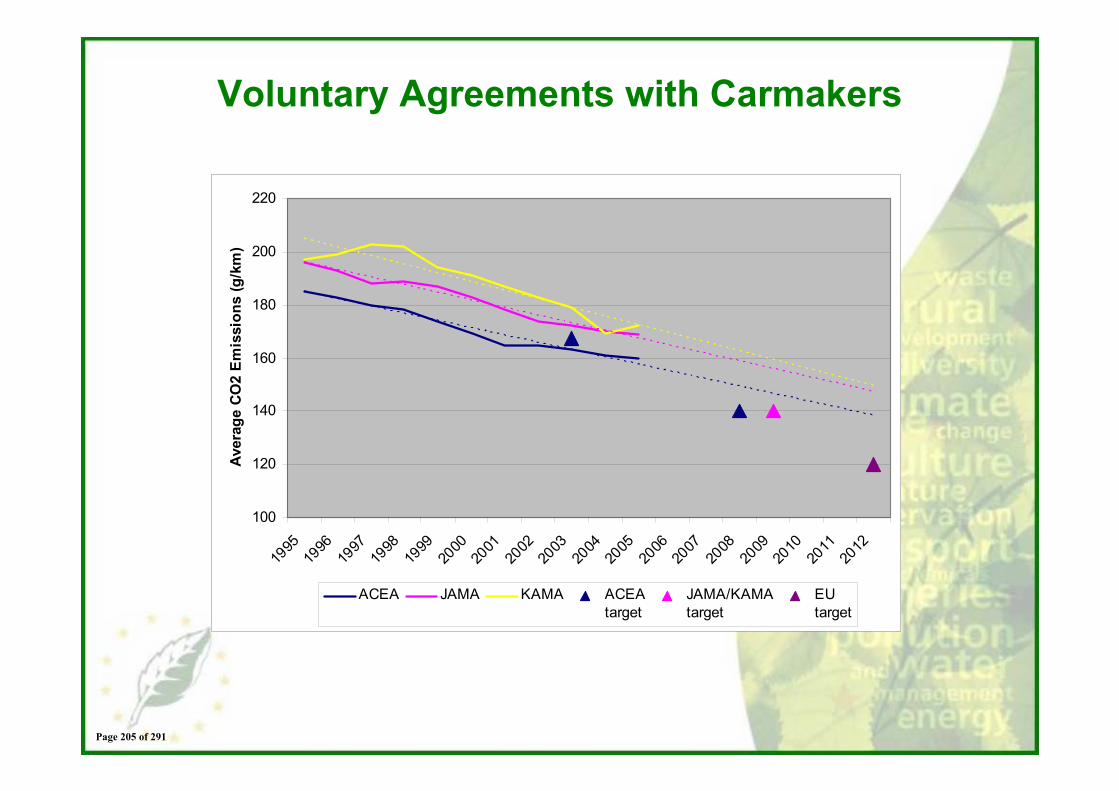
Voluntary Agreements with Carmakers
100
120
140
160
180
200
220
1995
1996
1997
1998
1999
2000
2001
2002
2003
2004
2005
2006
2007
2008
2009
2010
2011
2012
Aver
age
CO2
Emis
sion
s (g
/km
)
ACEA JAMA KAMA ACEAtarget
JAMA/KAMAtarget
EUtarget
Page 205 of 291
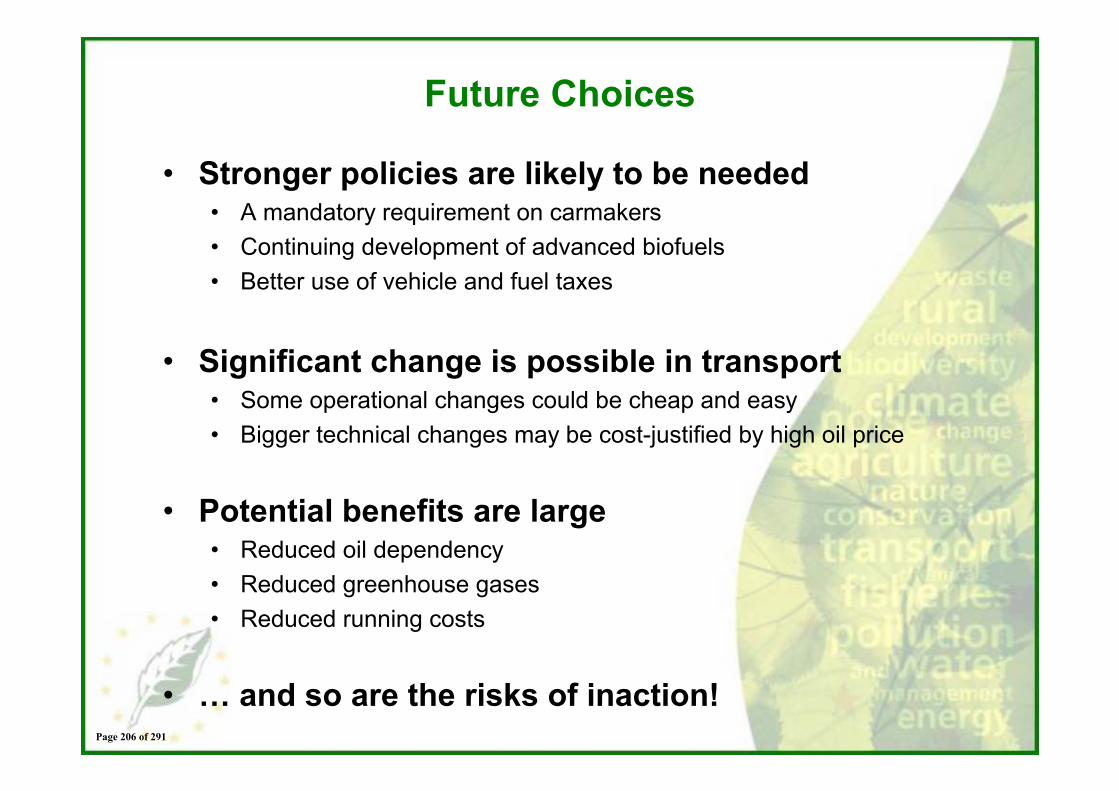
Future Choices
• Stronger policies are likely to be needed• A mandatory requirement on carmakers• Continuing development of advanced biofuels• Better use of vehicle and fuel taxes
• Significant change is possible in transport• Some operational changes could be cheap and easy• Bigger technical changes may be cost-justified by high oil price
• Potential benefits are large• Reduced oil dependency• Reduced greenhouse gases• Reduced running costs
• … and so are the risks of inaction!Page 206 of 291
TOYOTA MOTOR EUROPE
Impact of oil price and climate Impact of oil price and climate change on the car industrychange on the car industry
Dr. Stephan Herbst Manager Analysis & Strategy – Environmental AffairsToyota Motor Europe
Page 207 of 291
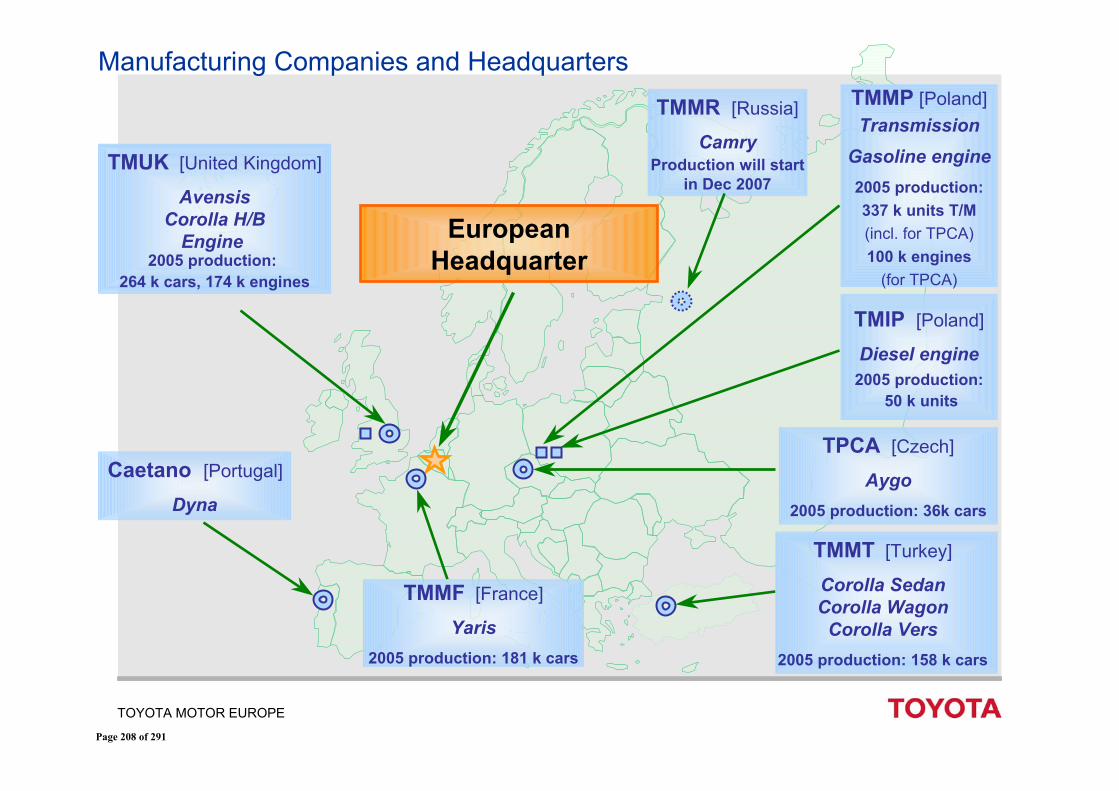
TOYOTA MOTOR EUROPE
TMUK [United Kingdom]
AvensisCorolla H/B
Engine 2005 production:
264 k cars, 174 k engines
TMMP [Poland]Transmission
Gasoline engine2005 production: 337 k units T/M(incl. for TPCA)100 k engines
(for TPCA)
European Headquarter
TMIP [Poland]
Diesel engine2005 production:
50 k units
TMMT [Turkey]
Corolla SedanCorolla Wagon
Corolla Vers2005 production: 158 k cars
TPCA [Czech]
Aygo2005 production: 36k cars
Caetano [Portugal]
Dyna
Manufacturing Companies and Headquarters
TMMF [France]
Yaris2005 production: 181 k cars
TMMR [Russia]
CamryProduction will start
in Dec 2007
Page 208 of 291
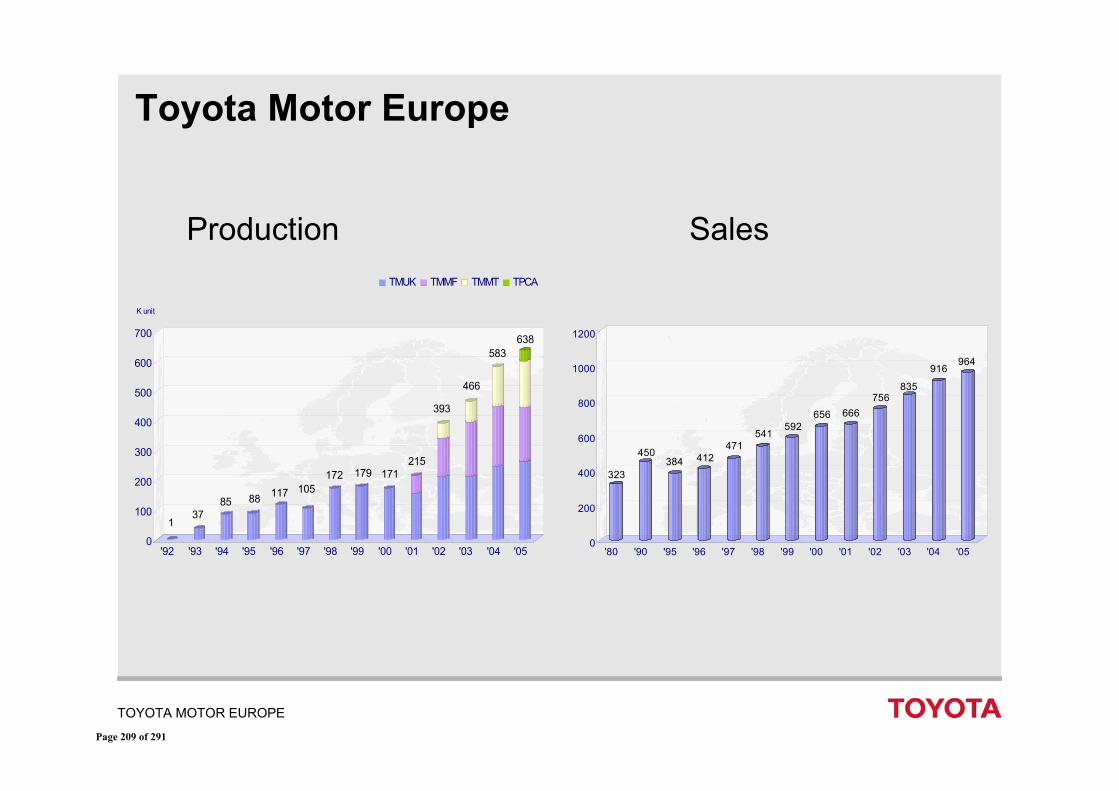
TOYOTA MOTOR EUROPE
Toyota Motor Europe
137
85 88 117 105172 179 171
215
393
466
583638
0
100
200
300
400
500
600
700
K unit
'92 '93 '94 '95 '96 '97 '98 '99 '00 '01 '02 '03 '04 '05
TMUK TMMF TMMT TPCA
323
450384 412
471541
592656 666
756835
916964
0
200
400
600
800
1000
1200
'80 '90 '95 '96 '97 '98 '99 '00 '01 '02 '03 '04 '05
SalesProduction
Page 209 of 291
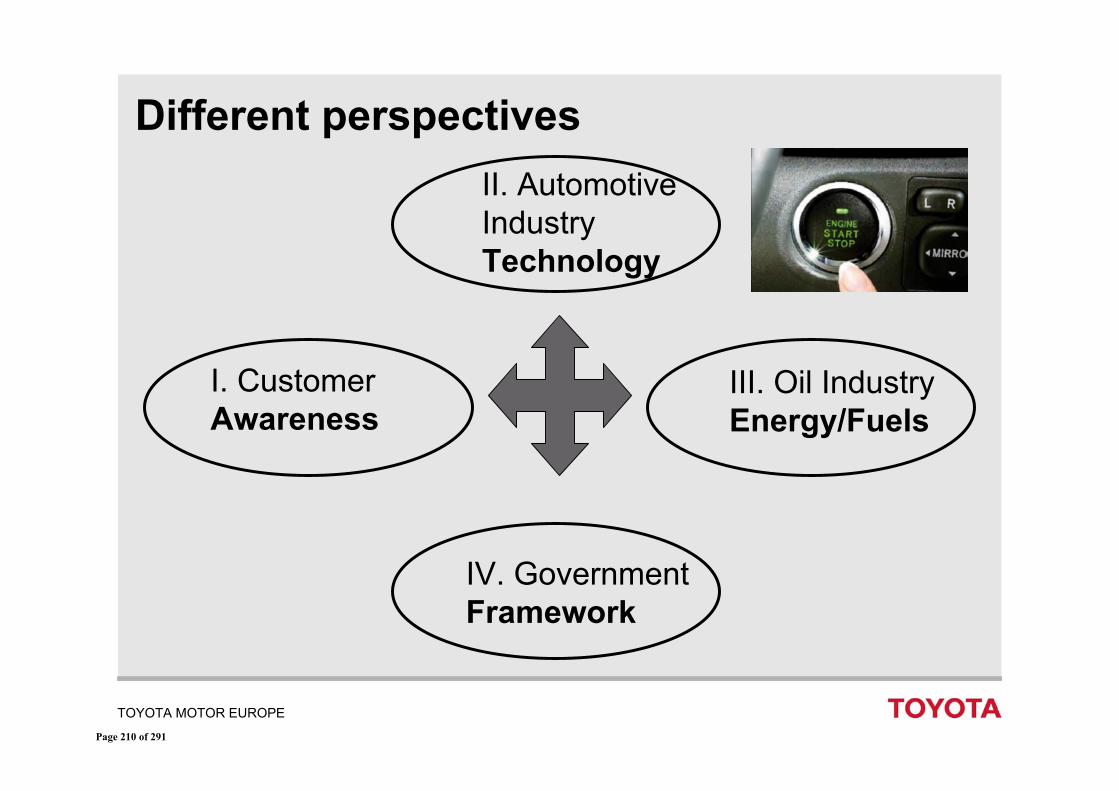
TOYOTA MOTOR EUROPE
Different perspectives II. Automotive Industry Technology
III. Oil Industry Energy/Fuels
IV. Government Framework
I. Customer Awareness
Page 210 of 291
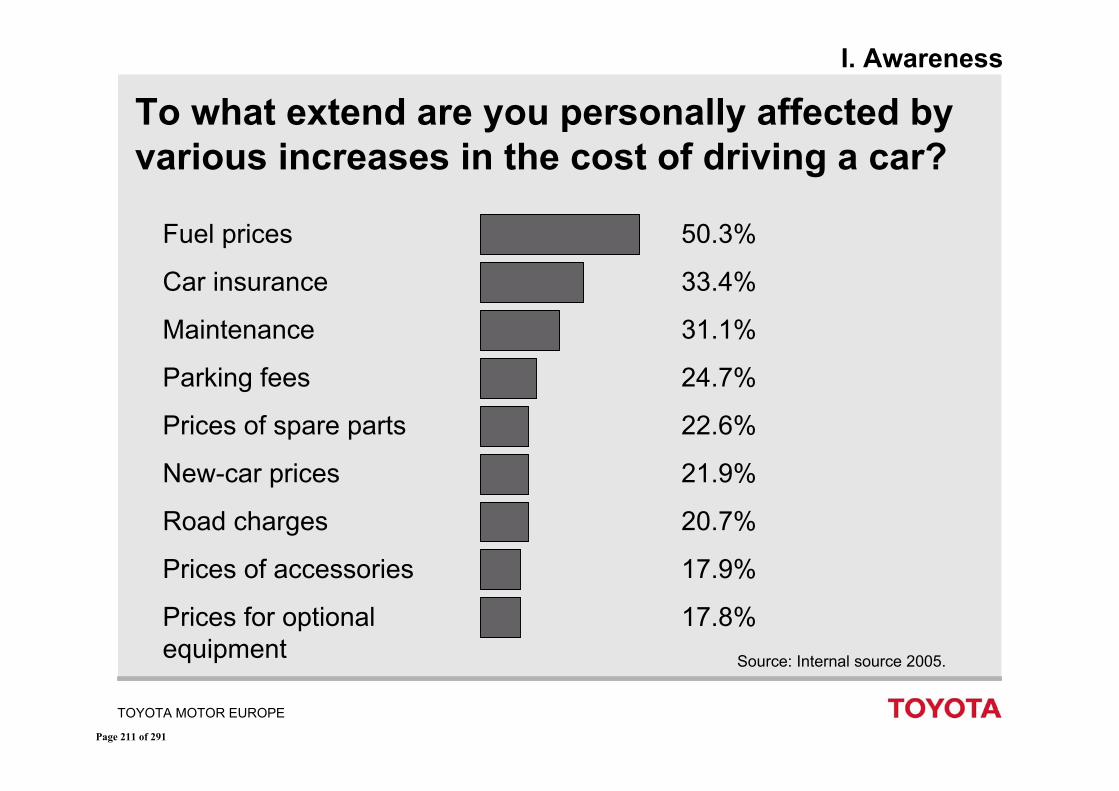
TOYOTA MOTOR EUROPE
To what extend are you personally affected by various increases in the cost of driving a car?
Fuel prices
Car insurance
Maintenance
Parking fees
Prices of spare parts
New-car prices
Road charges
Prices of accessories
Prices for optional equipment
50.3%
33.4%
31.1%
24.7%
22.6%
21.9%
20.7%
17.9%
17.8%Source: Internal source 2005.
I. Awareness
Page 211 of 291
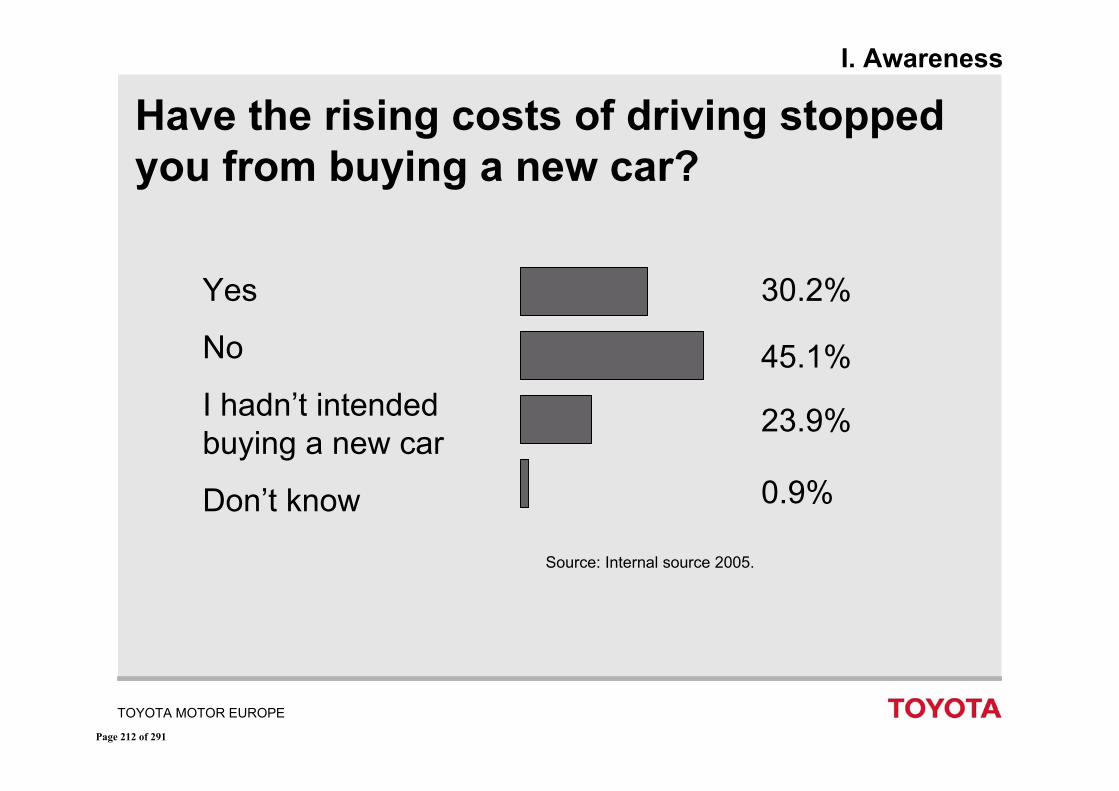
TOYOTA MOTOR EUROPE
Have the rising costs of driving stopped you from buying a new car?
Yes
No
I hadn’t intended buying a new car
Don’t know
30.2%
Source: Internal source 2005.
45.1%
23.9%
0.9%
I. Awareness
Page 212 of 291
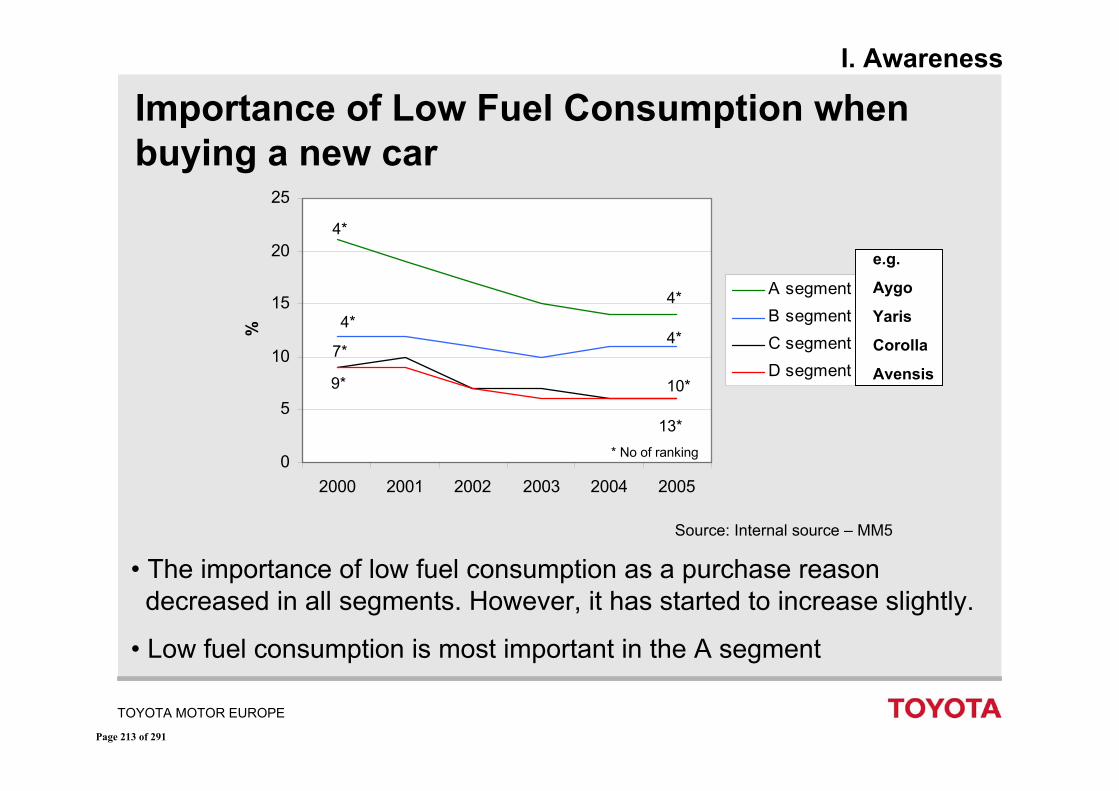
TOYOTA MOTOR EUROPE
Importance of Low Fuel Consumption when buying a new car
• The importance of low fuel consumption as a purchase reason decreased in all segments. However, it has started to increase slightly.
• Low fuel consumption is most important in the A segment
Source: Internal source – MM5
0
5
10
15
20
25
2000 2001 2002 2003 2004 2005
%
A segmentB segmentC segmentD segment
4*
13*
7*
10*9*
4*4*
4*
* No of ranking
I. Awareness
e.g.
Aygo
Yaris
Corolla
Avensis
Page 213 of 291
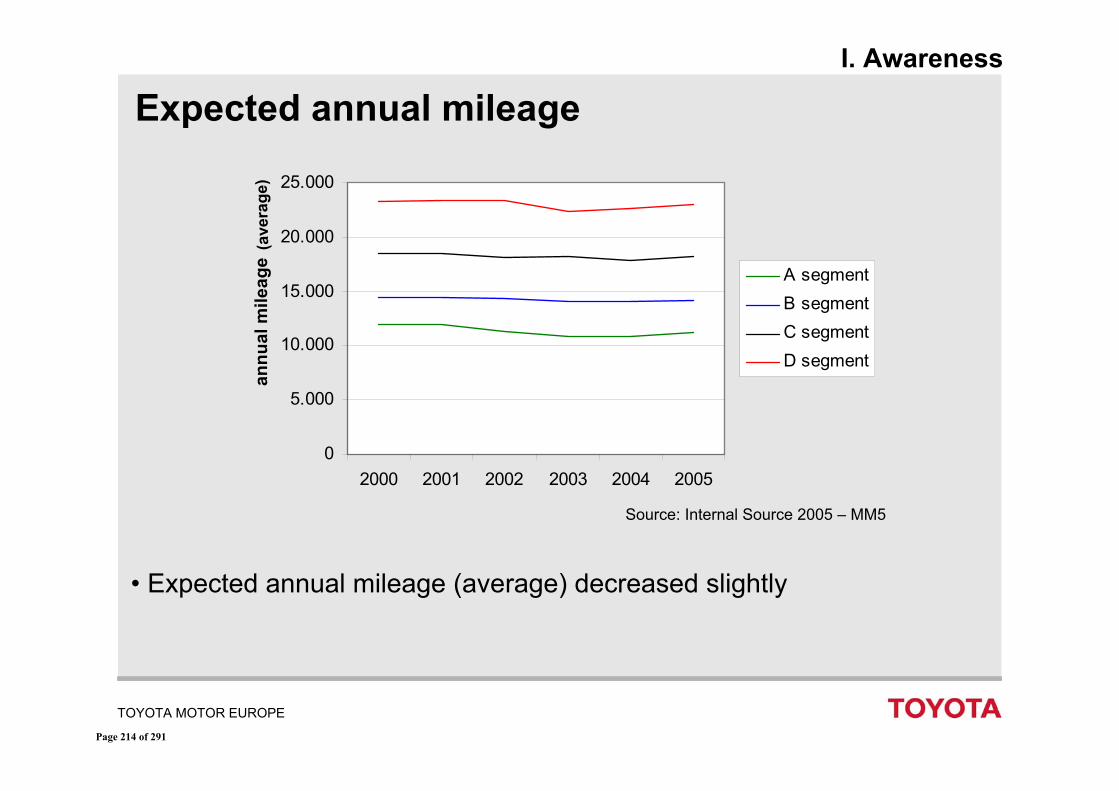
TOYOTA MOTOR EUROPE
Expected annual mileage
• Expected annual mileage (average) decreased slightly
Source: Internal Source 2005 – MM5
0
5.000
10.000
15.000
20.000
25.000
2000 2001 2002 2003 2004 2005
annu
al m
ileag
eA segmentB segmentC segmentD segment
I. Awareness
(ave
rage
)
Page 214 of 291
TOYOTA MOTOR EUROPE
TMC Environmental Forum June 13, 2006President Watanabe’s Key Messages
1. We recognize that Mobility entails negative aspects caused by environmental issues, congestion, and traffic accident
2. Responding to issues of Energy and Climate Change is one of the biggest challenges
3. It is essential to realize a ‘Sustainable Mobility Society’
4. Toyota will give top priority on the development of technologies and products that contribute to tackling environmental and safety issues
II. Technology
Page 215 of 291
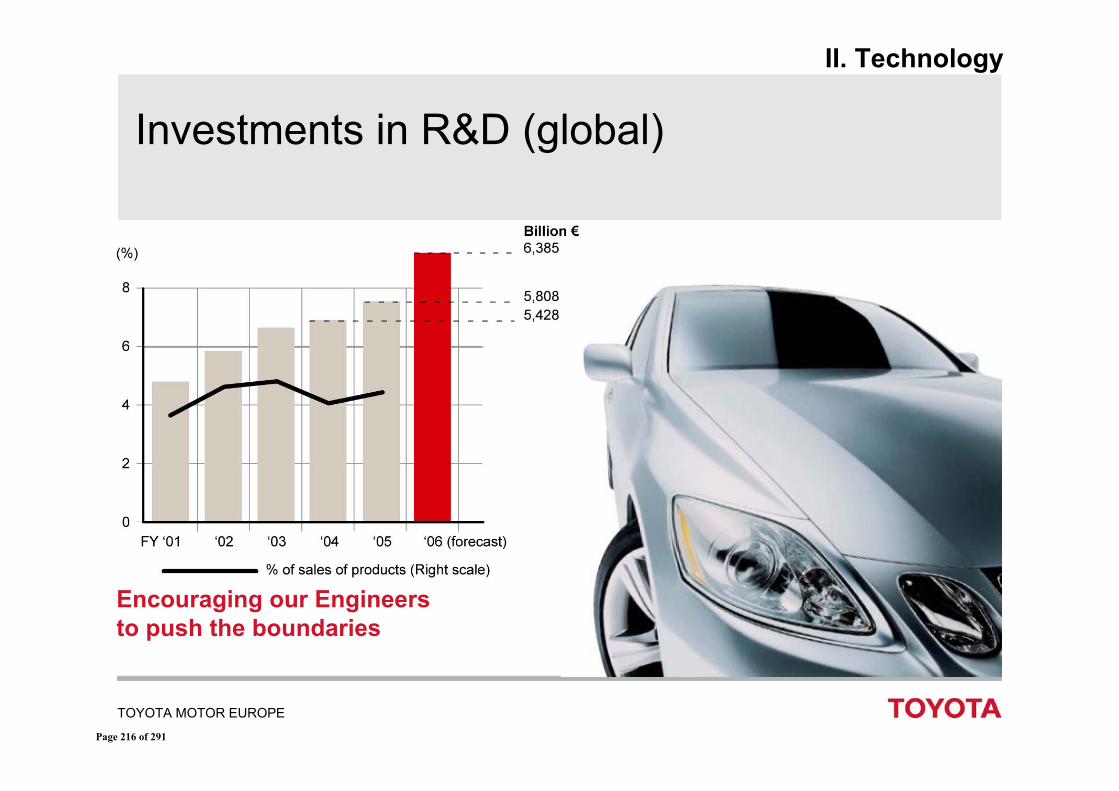
TOYOTA MOTOR EUROPE
Investments in R&D (global)
Encouraging our Engineers to push the boundaries
II. Technology
Page 216 of 291
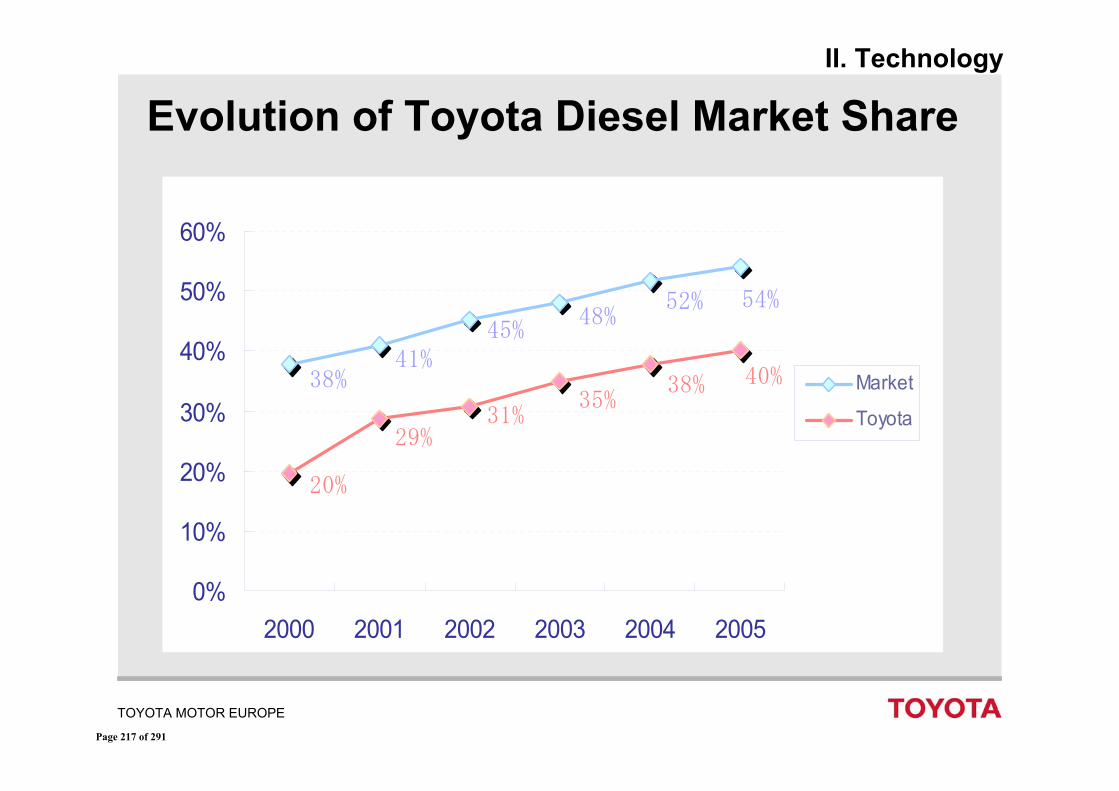
TOYOTA MOTOR EUROPE
Evolution of Toyota Diesel Market Share
54%52%48%
38%41%
45%
20%
29%
40%38%35%
31%
0%
10%
20%
30%
40%
50%
60%
2000 2001 2002 2003 2004 2005
Market
Toyota
II. Technology
Page 217 of 291
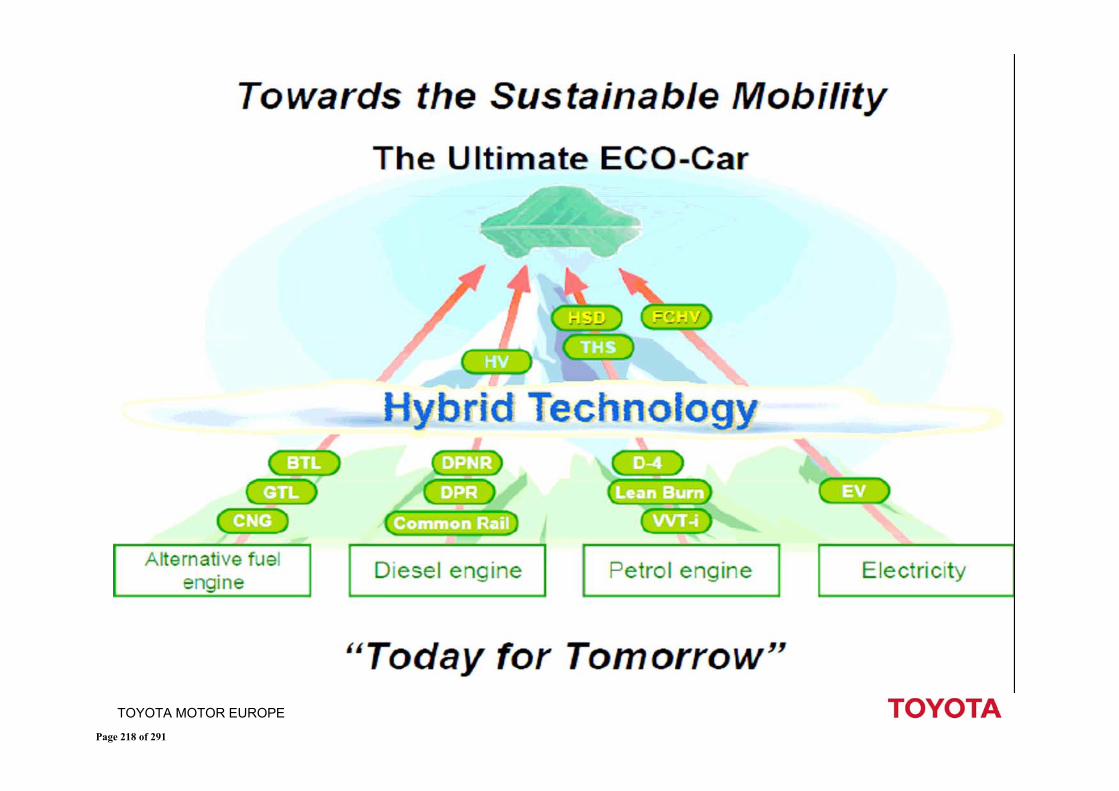
TOYOTA MOTOR EUROPE
Page 218 of 291
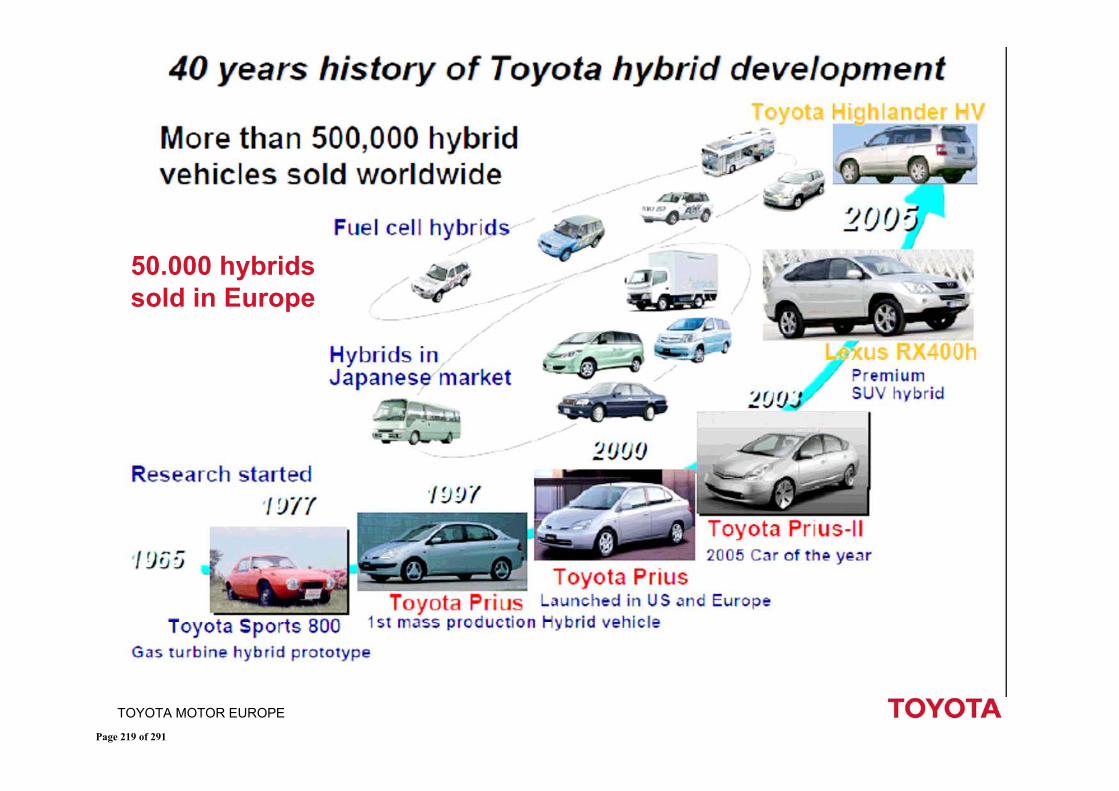
TOYOTA MOTOR EUROPE
50.000 hybrids sold in Europe
Page 219 of 291
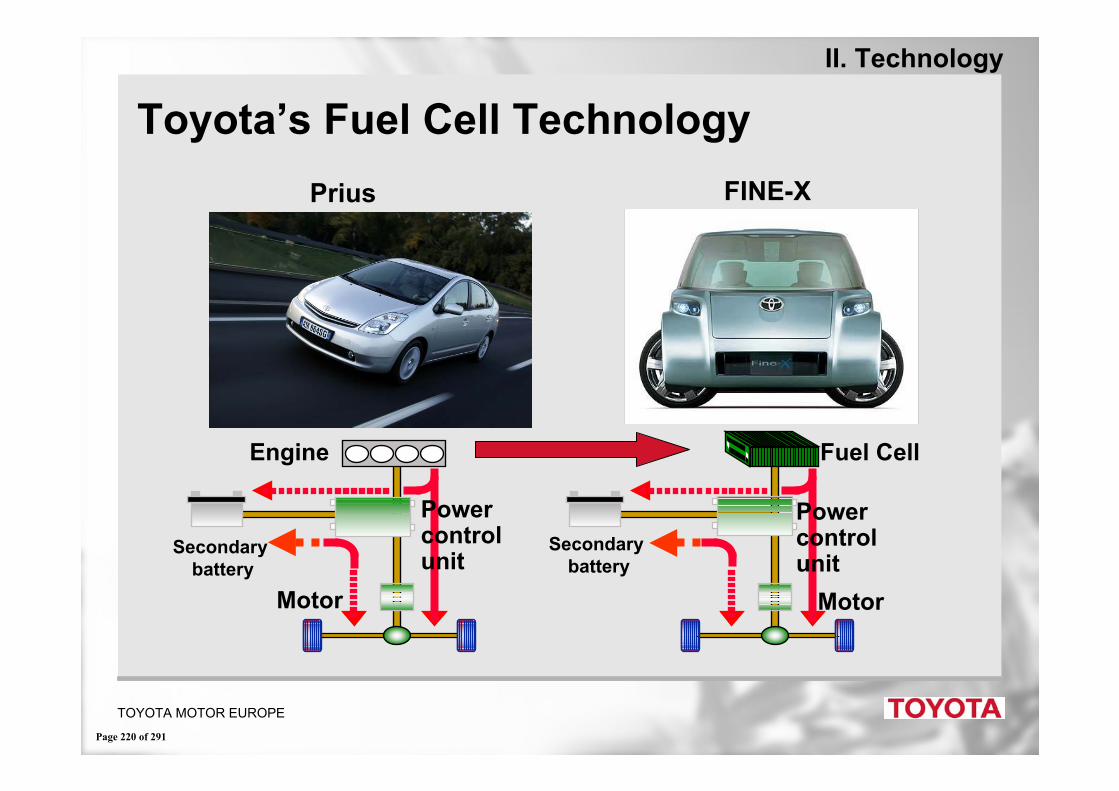
TOYOTA MOTOR EUROPE
Toyota’s Fuel Cell TechnologyPrius FINE-X
Engine Fuel Cell
Secondarybattery
Motor
Power control unit
Power control unitSecondary
battery
Motor
II. Technology
Page 220 of 291
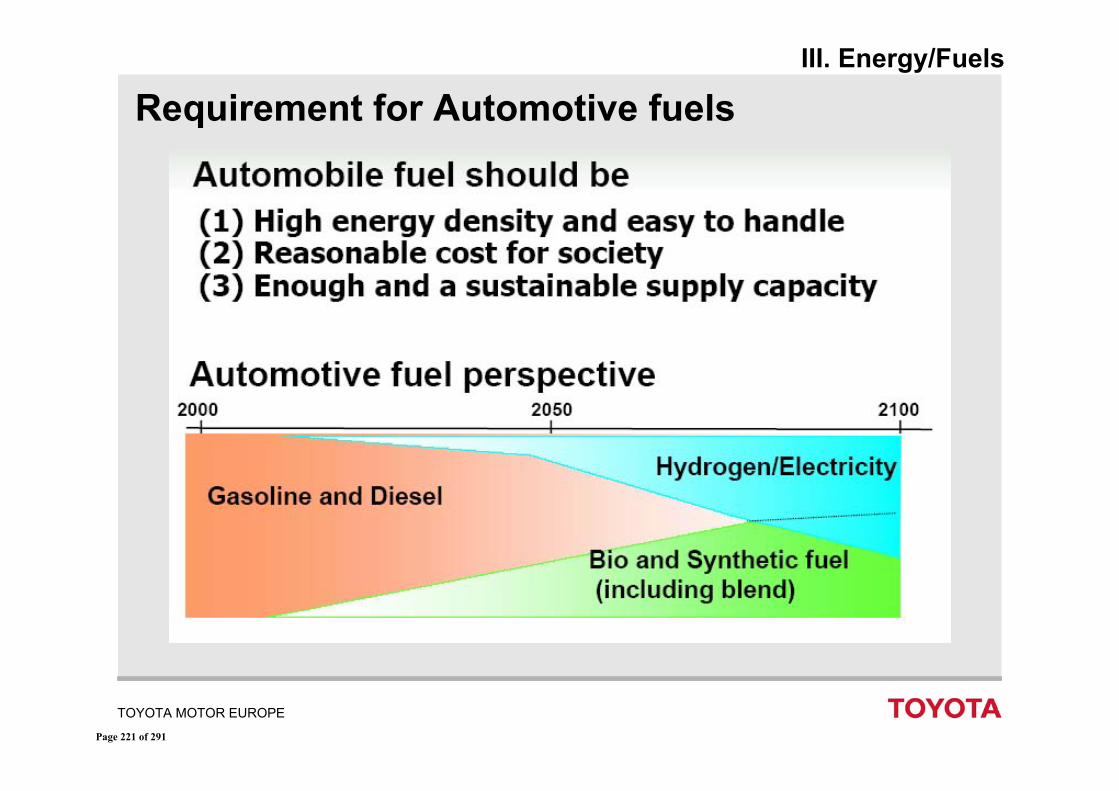
TOYOTA MOTOR EUROPE
Requirement for Automotive fuelsIII. Energy/Fuels
Page 221 of 291
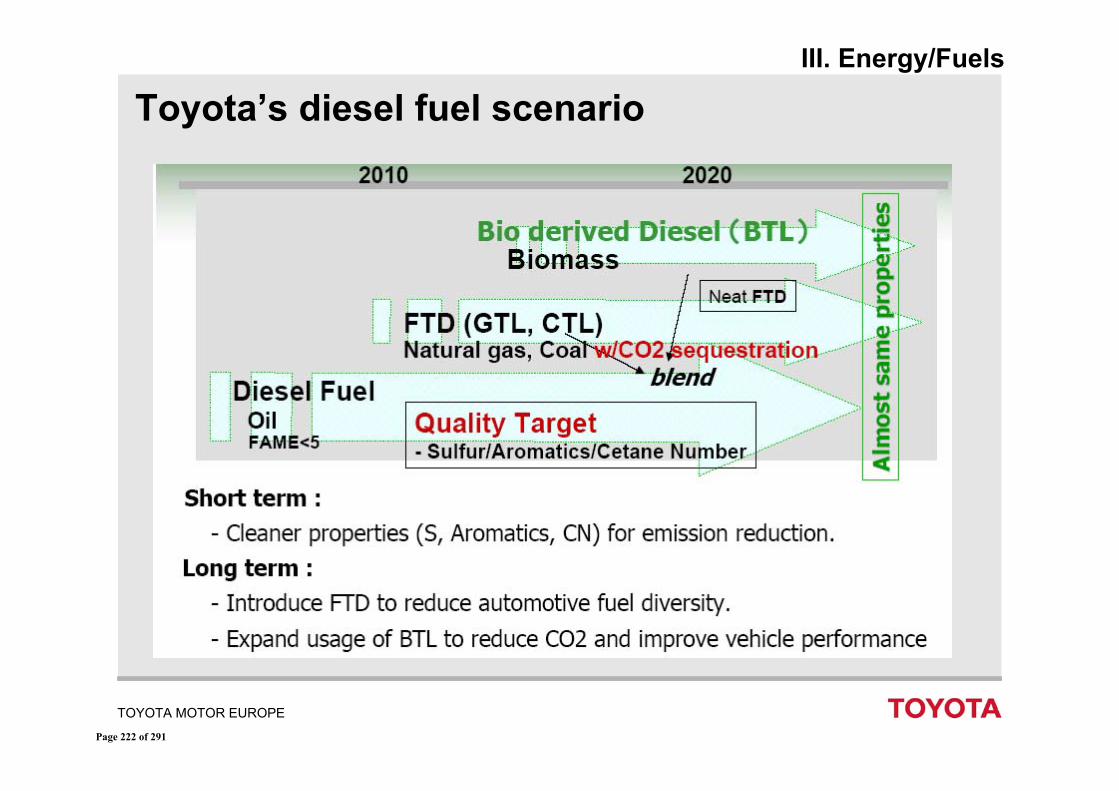
TOYOTA MOTOR EUROPE
Toyota’s diesel fuel scenarioIII. Energy/Fuels
Page 222 of 291
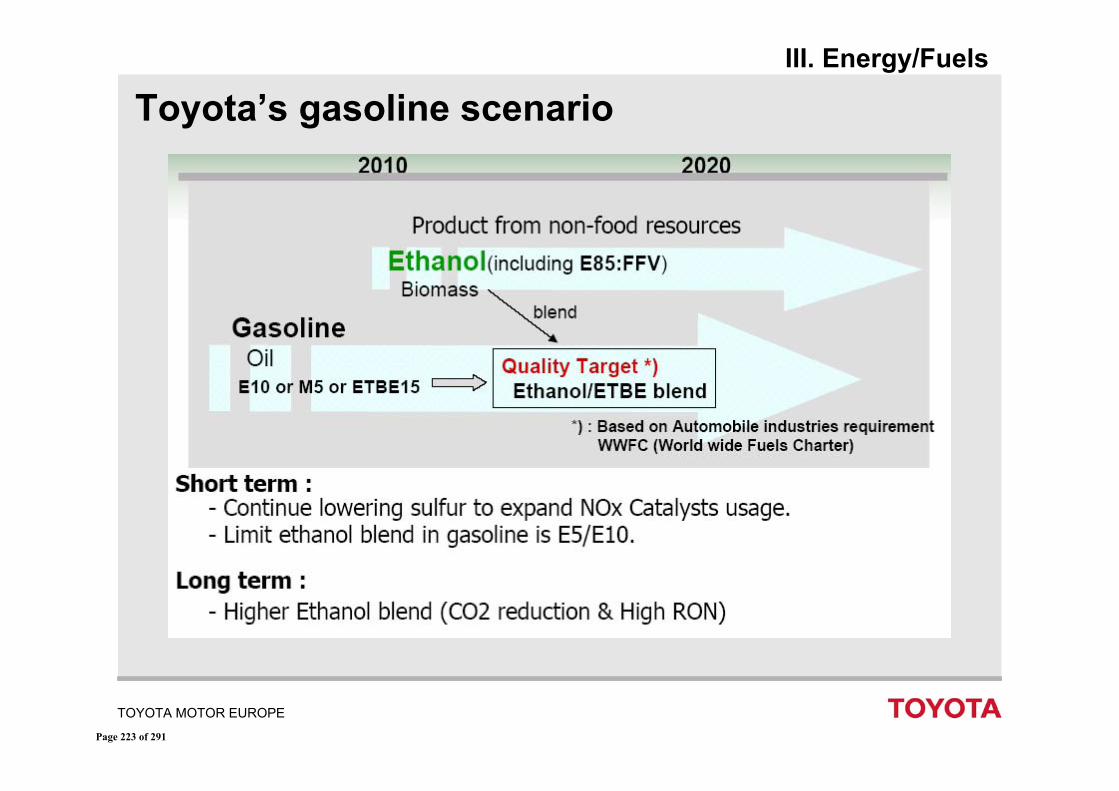
TOYOTA MOTOR EUROPE
Toyota’s gasoline scenarioIII. Energy/Fuels
Page 223 of 291
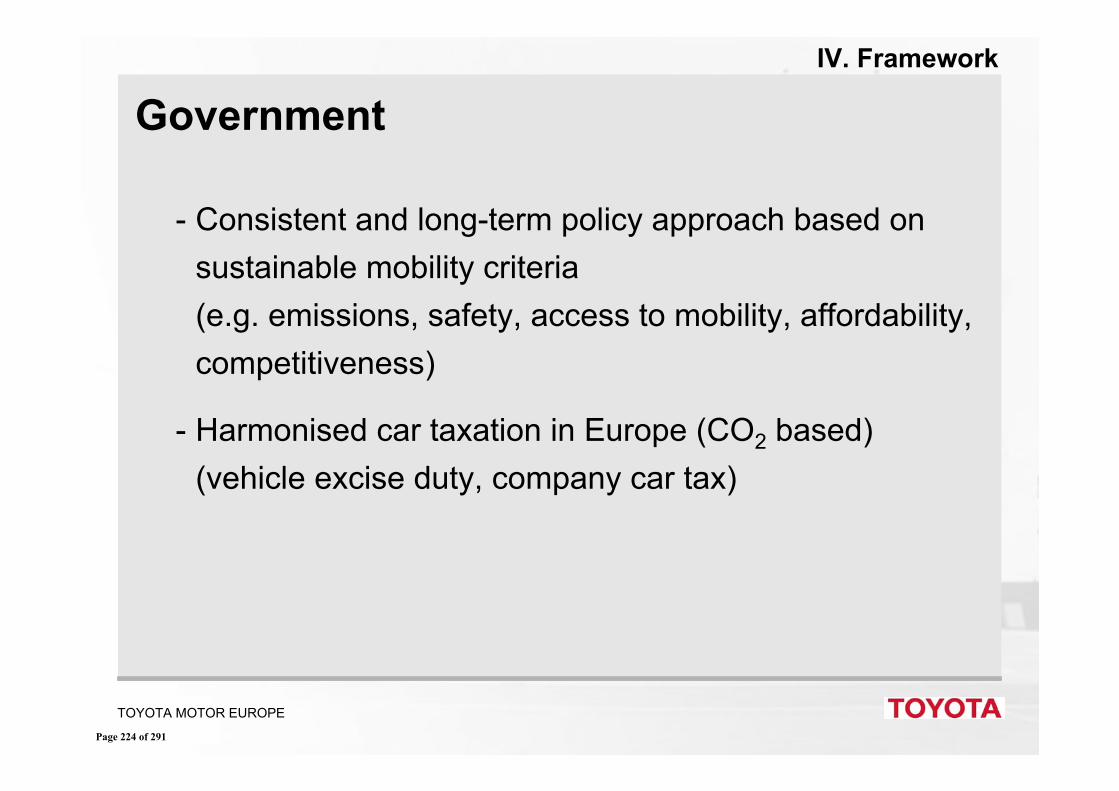
TOYOTA MOTOR EUROPE
Government
- Consistent and long-term policy approach based on sustainable mobility criteria(e.g. emissions, safety, access to mobility, affordability, competitiveness)
- Harmonised car taxation in Europe (CO2 based) (vehicle excise duty, company car tax)
IV. Framework
Page 224 of 291
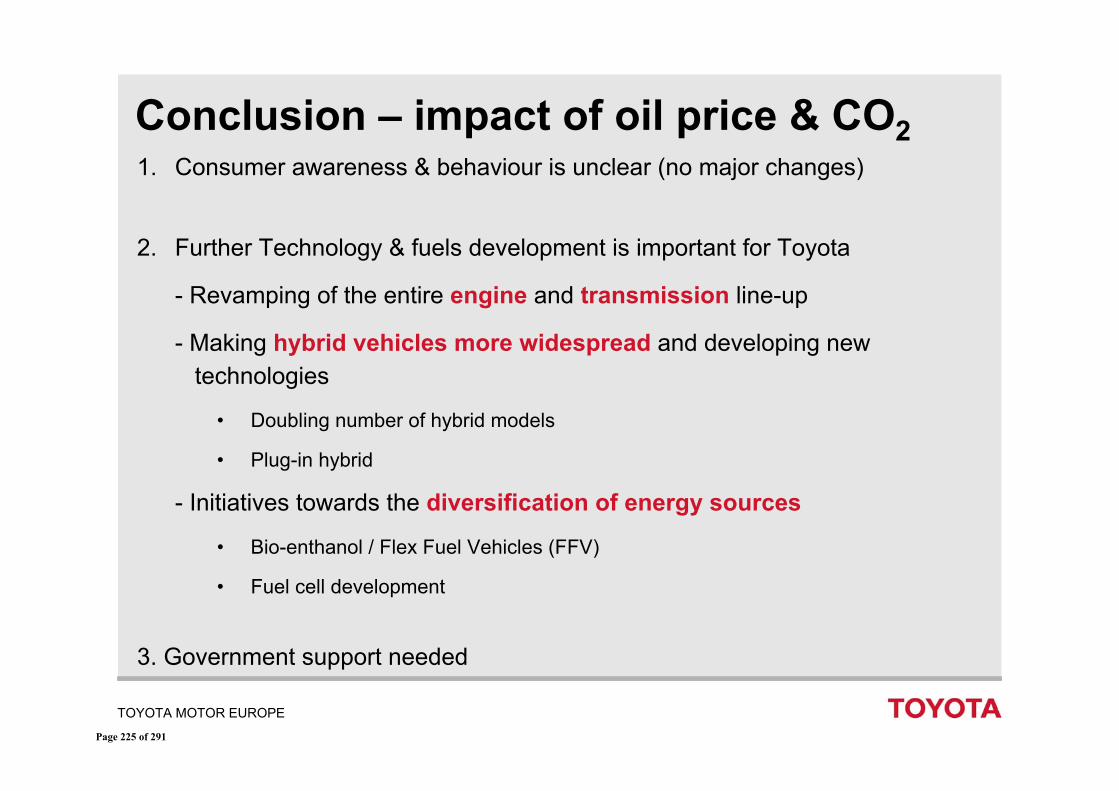
TOYOTA MOTOR EUROPE
Conclusion – impact of oil price & CO21. Consumer awareness & behaviour is unclear (no major changes)
2. Further Technology & fuels development is important for Toyota
- Revamping of the entire engine and transmission line-up
- Making hybrid vehicles more widespread and developing new technologies
• Doubling number of hybrid models
• Plug-in hybrid
- Initiatives towards the diversification of energy sources
• Bio-enthanol / Flex Fuel Vehicles (FFV)
• Fuel cell development
3. Government support needed
Page 225 of 291

TOYOTA MOTOR EUROPE
Thank you for your kind attention !
Page 226 of 291
Group External Relations
Economic impact of rising oil prices
Microeconomic consequences
of rising oil prices, competitiveness and taxation
28th June 2006
Page 227 of 291
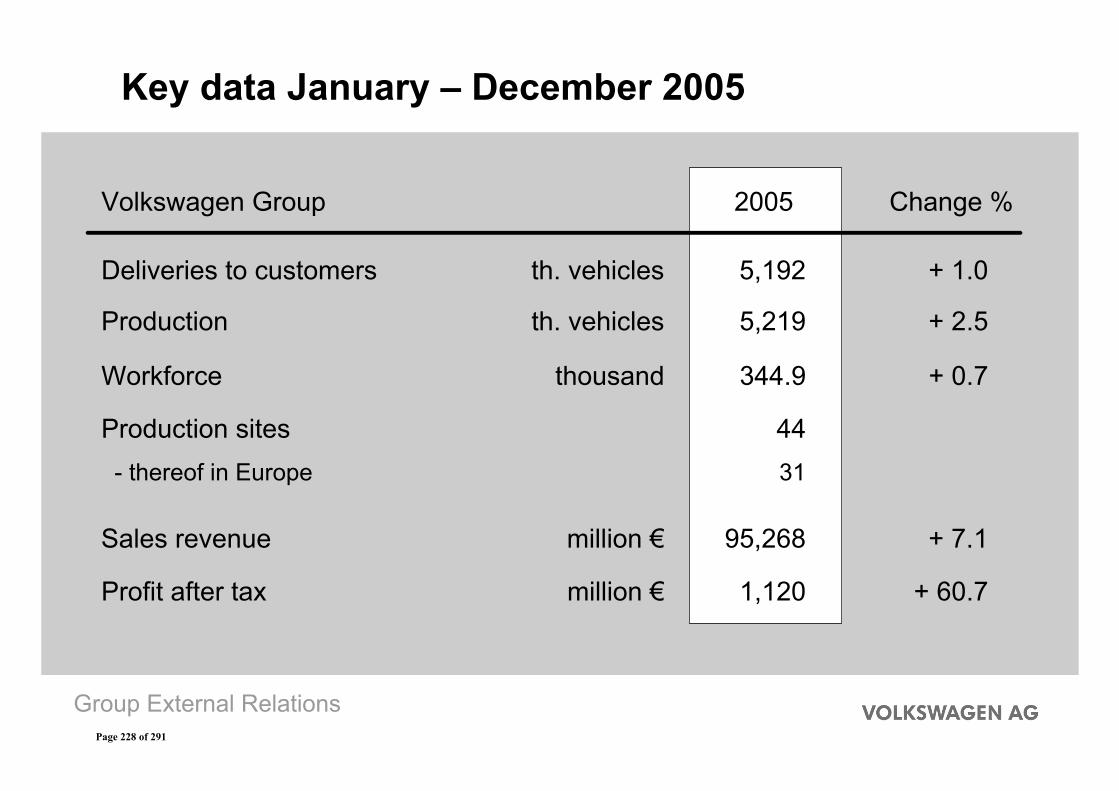
Group External Relations
Volkswagen Group 2005 Change %
Deliveries to customers th. vehicles 5,192 + 1.0
Production th. vehicles 5,219 + 2.5
Workforce thousand 344.9 + 0.7
Production sites 44
Profit after tax million € 1,120 + 60.7
Key data January – December 2005
Sales revenue million € 95,268 + 7.1
- thereof in Europe 31
Page 228 of 291
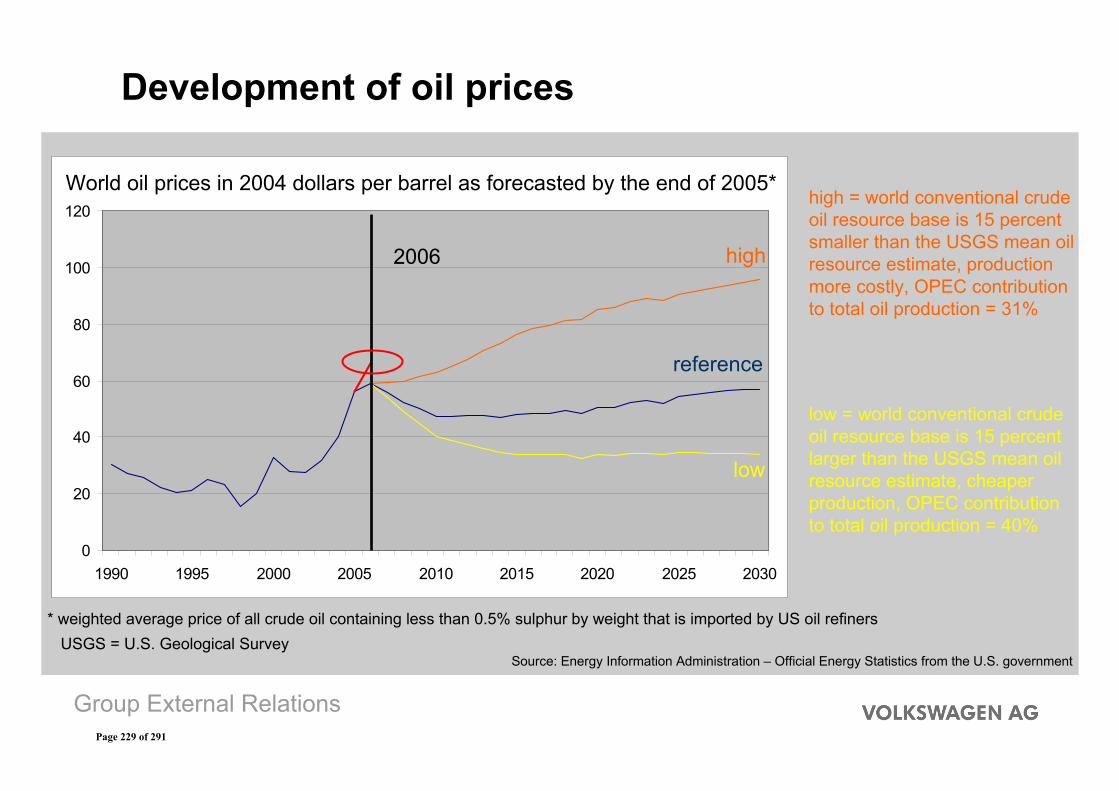
Group External Relations
Development of oil prices
0
20
40
60
80
100
120
1990 1995 2000 2005 2010 2015 2020 2025 2030
2006 high
reference
low
high = world conventional crude oil resource base is 15 percent smaller than the USGS mean oil resource estimate, production more costly, OPEC contribution to total oil production = 31%
low = world conventional crude oil resource base is 15 percent larger than the USGS mean oil resource estimate, cheaper production, OPEC contribution to total oil production = 40%
* weighted average price of all crude oil containing less than 0.5% sulphur by weight that is imported by US oil refinersUSGS = U.S. Geological Survey
Source: Energy Information Administration – Official Energy Statistics from the U.S. government
World oil prices in 2004 dollars per barrel as forecasted by the end of 2005*
Page 229 of 291
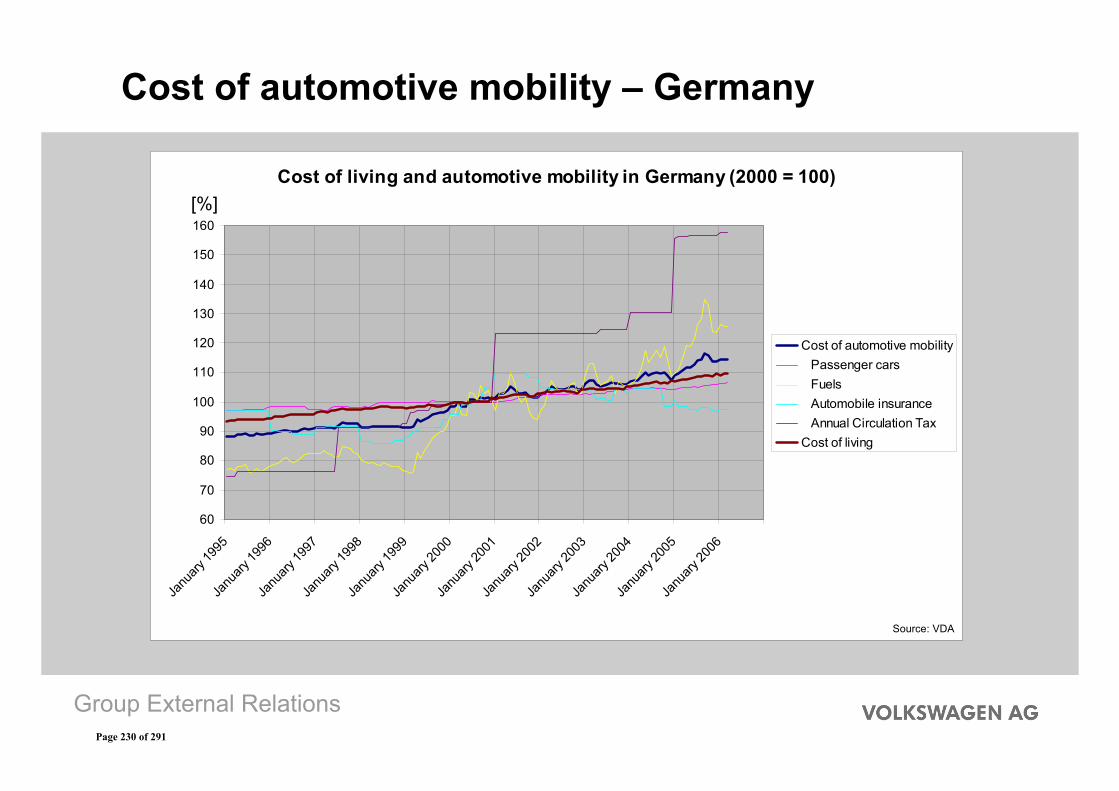
Group External Relations
Cost of automotive mobility – Germany
Cost of living and automotive mobility in Germany (2000 = 100)
60
70
80
90
100
110
120
130
140
150
160
Janu
ary 19
95Ja
nuary
1996
Janu
ary 19
97Ja
nuary
1998
Janu
ary 19
99Ja
nuary
2000
Janu
ary 20
01Ja
nuary
2002
Janu
ary 20
03Ja
nuary
2004
Janu
ary 20
05Ja
nuary
2006
Cost of automotive mobility Passenger cars Fuels Automobile insurance Annual Circulation TaxCost of living
[%]
Source: VDA
Page 230 of 291
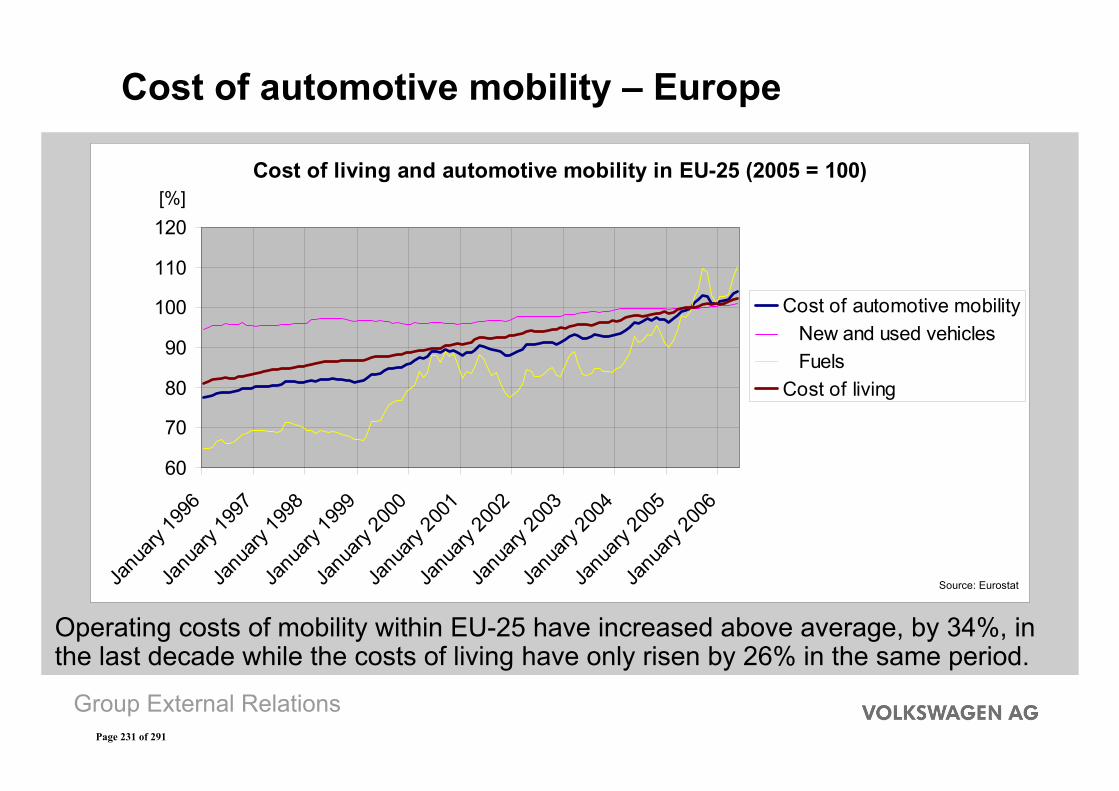
Group External Relations
Cost of automotive mobility – Europe
[%]
Cost of living and automotive mobility in EU-25 (2005 = 100)
60
70
80
90
100
110
120
Janua
ry 199
6Ja
nuary
1997
Janua
ry 199
8Ja
nuary
1999
Janu
ary 200
0Ja
nuary
2001
Janu
ary 20
02Ja
nuary
2003
Janu
ary 20
04Ja
nuary
2005
Janu
ary 20
06
Cost of automotive mobility New and used vehicles FuelsCost of living
Source: Eurostat
[%]
Operating costs of mobility within EU-25 have increased above average, by 34%, in the last decade while the costs of living have only risen by 26% in the same period.
Page 231 of 291
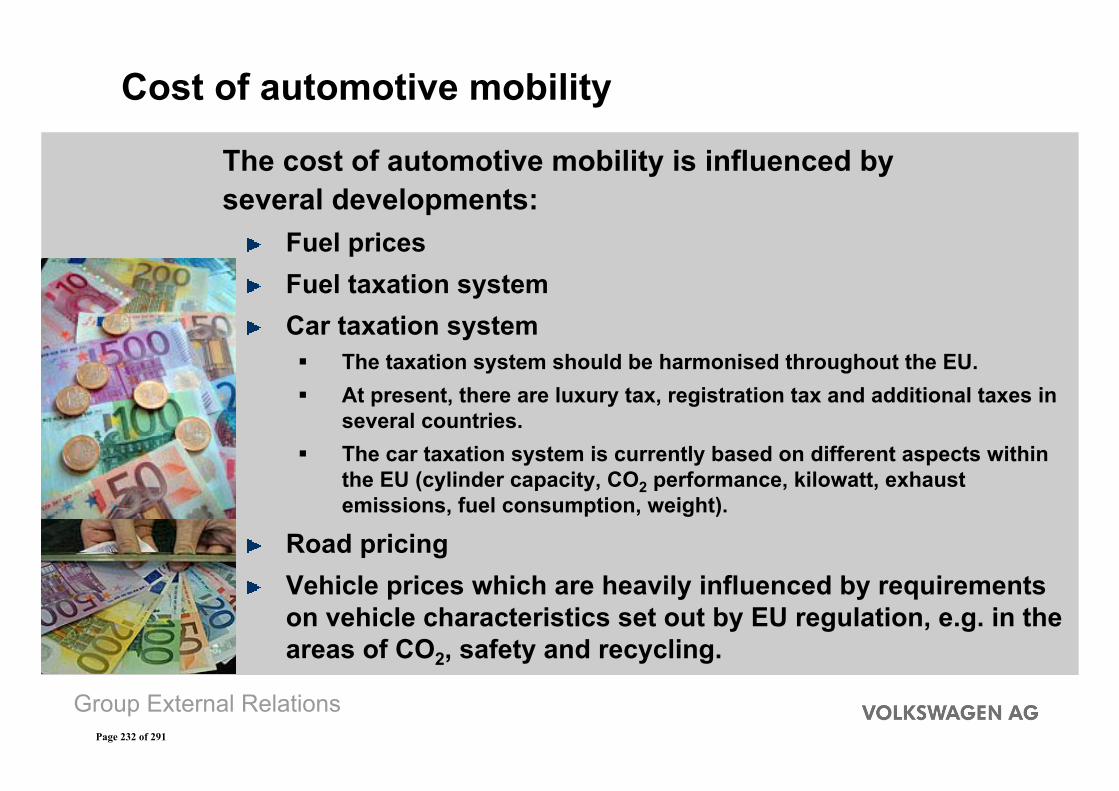
Group External Relations
Cost of automotive mobility
The cost of automotive mobility is influenced byseveral developments:
Fuel pricesFuel taxation systemCar taxation system
The taxation system should be harmonised throughout the EU.At present, there are luxury tax, registration tax and additional taxes in several countries.The car taxation system is currently based on different aspects within the EU (cylinder capacity, CO2 performance, kilowatt, exhaust emissions, fuel consumption, weight).
Road pricingVehicle prices which are heavily influenced by requirements on vehicle characteristics set out by EU regulation, e.g. in theareas of CO2, safety and recycling.
Page 232 of 291
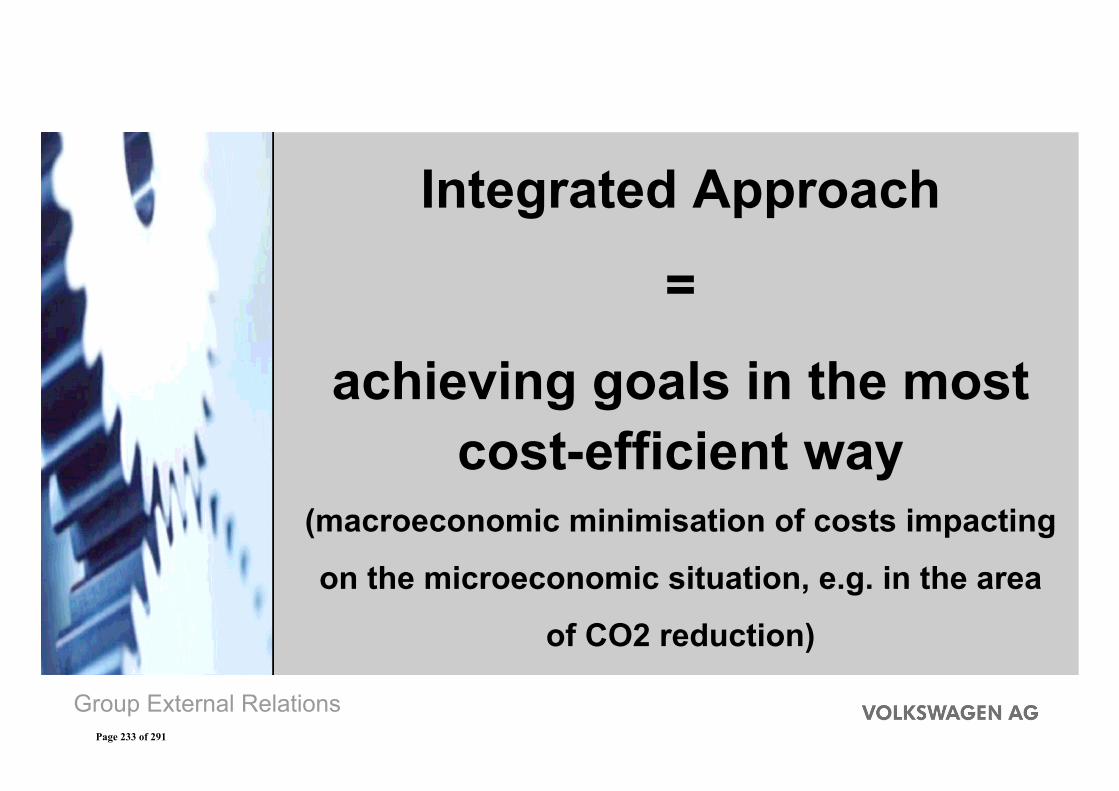
Group External Relations
Integrated Approach
=
achieving goals in the mostcost-efficient way
(macroeconomic minimisation of costs impacting
on the microeconomic situation, e.g. in the area
of CO2 reduction)
Page 233 of 291
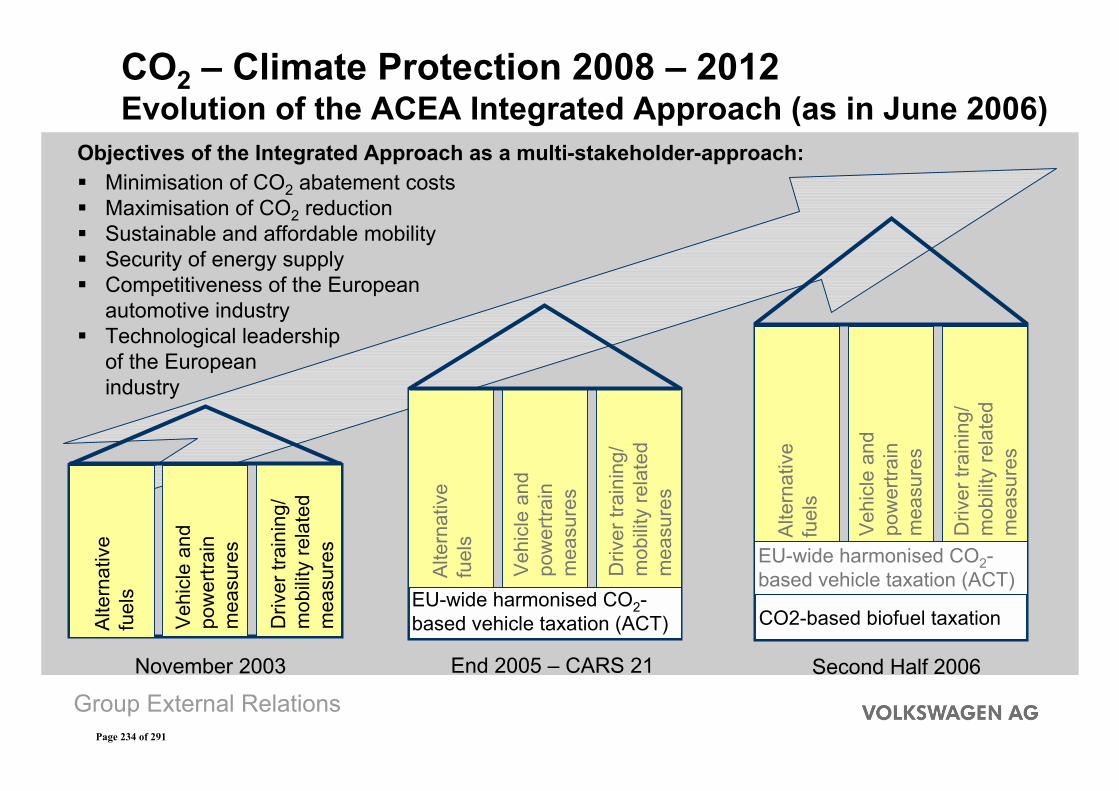
Group External RelationsNovember 2003 End 2005 – CARS 21 Second Half 2006
Objectives of the Integrated Approach as a multi-stakeholder-approach:Minimisation of CO2 abatement costsMaximisation of CO2 reductionSustainable and affordable mobilitySecurity of energy supplyCompetitiveness of the Europeanautomotive industryTechnological leadershipof the Europeanindustry
EU-wide harmonised CO2-based vehicle taxation (ACT) CO2-based biofuel taxationA
ltern
ativ
efu
els
Veh
icle
and
pow
ertra
inm
easu
res
CO2 – Climate Protection 2008 – 2012Evolution of the ACEA Integrated Approach (as in June 2006)
Driv
er tr
aini
ng/
mob
ility
rela
ted
mea
sure
s
Alte
rnat
ive
fuel
s
Veh
icle
and
pow
ertra
inm
easu
res
Driv
er tr
aini
ng/
mob
ility
rela
ted
mea
sure
s
EU-wide harmonised CO2-based vehicle taxation (ACT)
Alte
rnat
ive
fuel
s
Veh
icle
and
pow
ertra
inm
easu
res
Driv
er tr
aini
ng/
mob
ility
rela
ted
mea
sure
s
Page 234 of 291
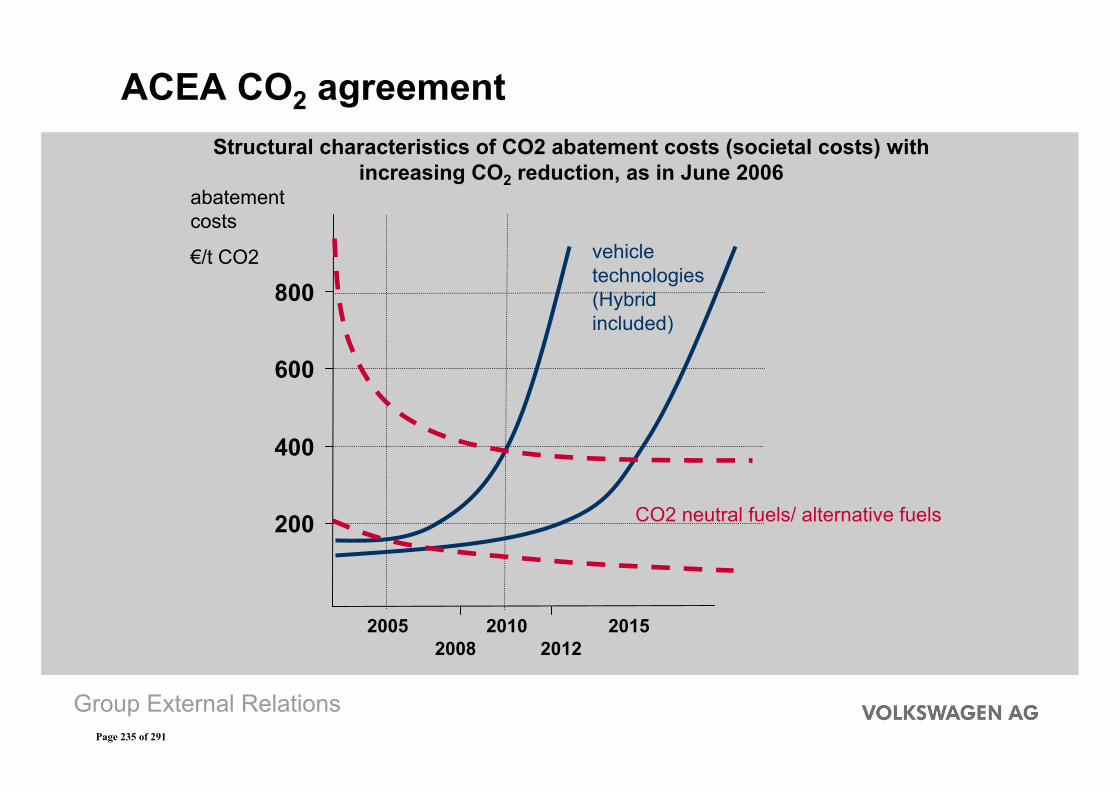
Group External Relations
ACEA CO2 agreementStructural characteristics of CO2 abatement costs (societal costs) with
increasing CO2 reduction, as in June 2006
200
400
600
800
20082005 2010
20122015
abatement costs
€/t CO2 vehicle technologies (Hybrid included)
CO2 neutral fuels/ alternative fuels
Page 235 of 291
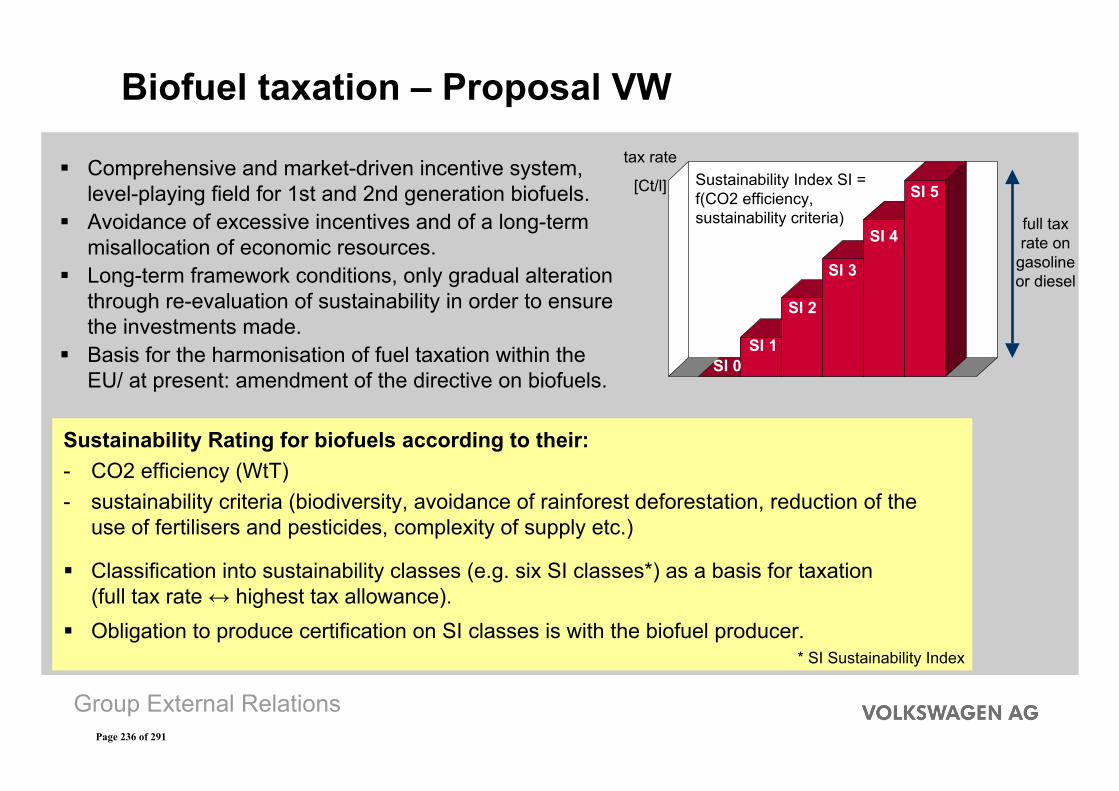
Group External Relations
Comprehensive and market-driven incentive system,level-playing field for 1st and 2nd generation biofuels.Avoidance of excessive incentives and of a long-termmisallocation of economic resources.Long-term framework conditions, only gradual alterationthrough re-evaluation of sustainability in order to ensurethe investments made.Basis for the harmonisation of fuel taxation within theEU/ at present: amendment of the directive on biofuels.
Sustainability Rating for biofuels according to their:- CO2 efficiency (WtT)- sustainability criteria (biodiversity, avoidance of rainforest deforestation, reduction of the
use of fertilisers and pesticides, complexity of supply etc.)
Classification into sustainability classes (e.g. six SI classes*) as a basis for taxation(full tax rate ↔ highest tax allowance).Obligation to produce certification on SI classes is with the biofuel producer.
* SI Sustainability Index
SI 0SI 1
SI 2
SI 3
SI 4
SI 5Sustainability Index SI = f(CO2 efficiency, sustainability criteria)
tax rate
[Ct/l]
full tax rate on
gasoline or diesel
Biofuel taxation – Proposal VW
Page 236 of 291
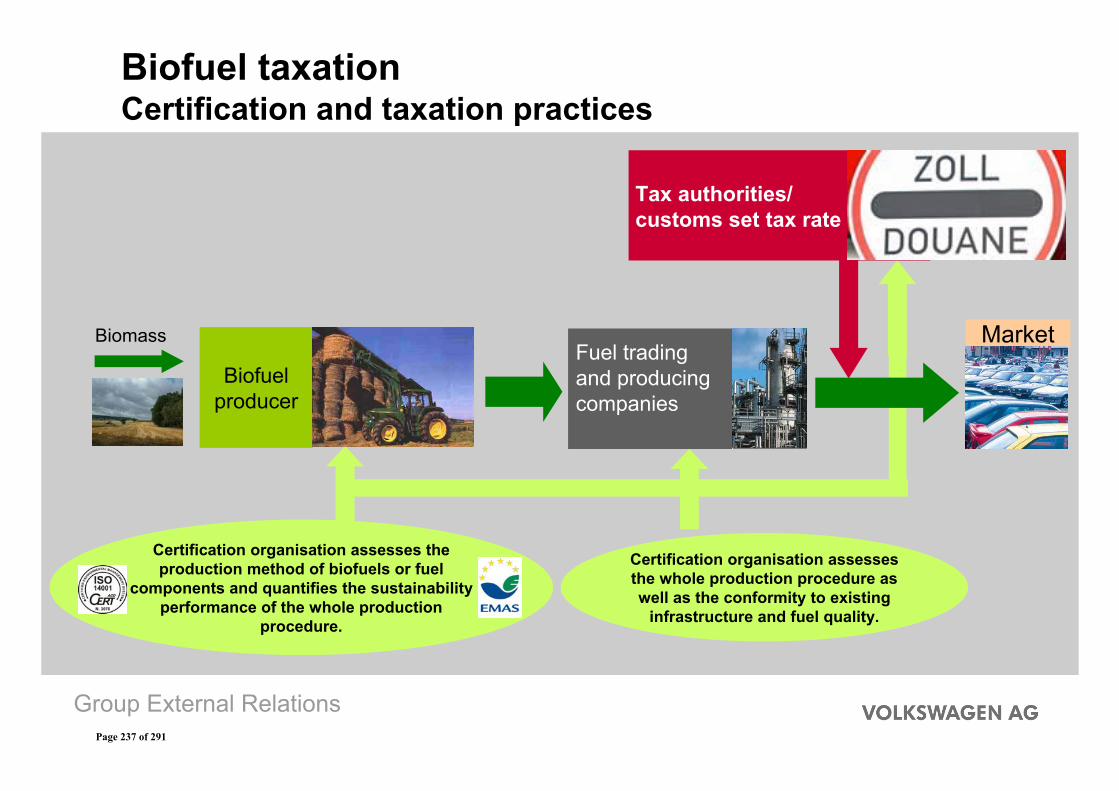
Group External Relations
Biomass
Biofuelproducer
Tax authorities/ customs set tax rate
Market
Certification organisation assesses the production method of biofuels or fuel
components and quantifies the sustainability performance of the whole production
procedure.
Certification organisation assesses the whole production procedure as well as the conformity to existing
infrastructure and fuel quality.
Fuel trading and producing companies
Biofuel taxationCertification and taxation practices
Page 237 of 291
Group External Relations
If the current development continues, the economic challenge for the consumer will be to earmark an increasing part of the budget for mobility.
Against the background of a constant purchasing power, the rise of automotive mobility costs leads to an increasing risk for the competitiveness of the European automotive industry and European growth and employment.
Lean and Better Regulation – Enforcement of CARS 21.Integrated approach in order to achieve objectives in the mostcost-efficient way.EU-wide harmonisation of passenger car taxation.Market introduction of and level-playing field for biofuels as an accompanying measure in order to contain the crude oil market’s speculative elements.
Request: No further increase of mobility costs.
Conclusion
Page 238 of 291
Session II Part 2: Geopolitics and Security of Supply
Page 239 of 291
Organization of the Petroleum Exporting Countries 1
Geopolitics and security of supply
Presented byDr. Hasan M. Qabazard
Director, Research Division, OPEC
European Parliament, BrusselsJune 28, 2006
Workshop on the economic impact of rising oil prices
Page 240 of 291
Organization of the Petroleum Exporting Countries 2
Global energy security
This is so fundamental to life in the 21st century that every effort should be made to:
Clarify its meaningGain a consensus on itEmbody its true principles in decision-making across the energy sector
Page 241 of 291
Organization of the Petroleum Exporting Countries 3
Qualities of energy security
This should …
• Be reciprocal – security of demand is as important as security of supply
• Apply to all energy sources free from prejudice
• Extend across the entire supply chain
• Cover all foreseeable time-horizons
• Focus on the most modern products, with the highest environmental standards and latest technology
• Apply to rich and poor nations alike
• Be openly receptive to dialogue and cooperation
Page 242 of 291
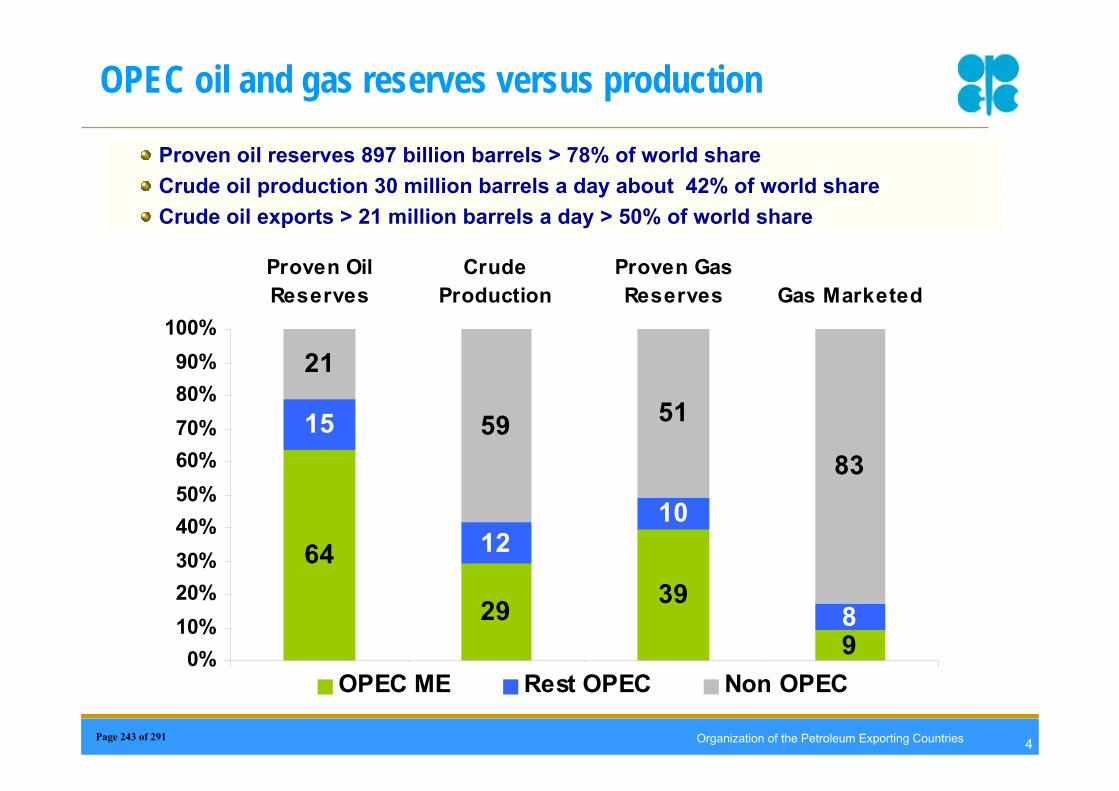
Organization of the Petroleum Exporting Countries 4
OPEC oil and gas reserves versus production
64
29 39
9
15
1210
8
21
59 51
83
0%10%20%30%40%50%60%70%80%90%
100%
Proven OilReserves
CrudeProduction
Proven GasReserves Gas Marketed
OPEC ME Rest OPEC Non OPEC
Proven oil reserves 897 billion barrels > 78% of world shareCrude oil production 30 million barrels a day about 42% of world shareCrude oil exports > 21 million barrels a day > 50% of world share
Page 243 of 291
Organization of the Petroleum Exporting Countries 5
There is considerable uncertainty overhow much oil OPEC will need to produce (mb/d)
Significant uncertainties with substantial downside risks.Considerable implications on the scale and timing of investments!“Road-map” for oil demand is called for!
Page 244 of 291
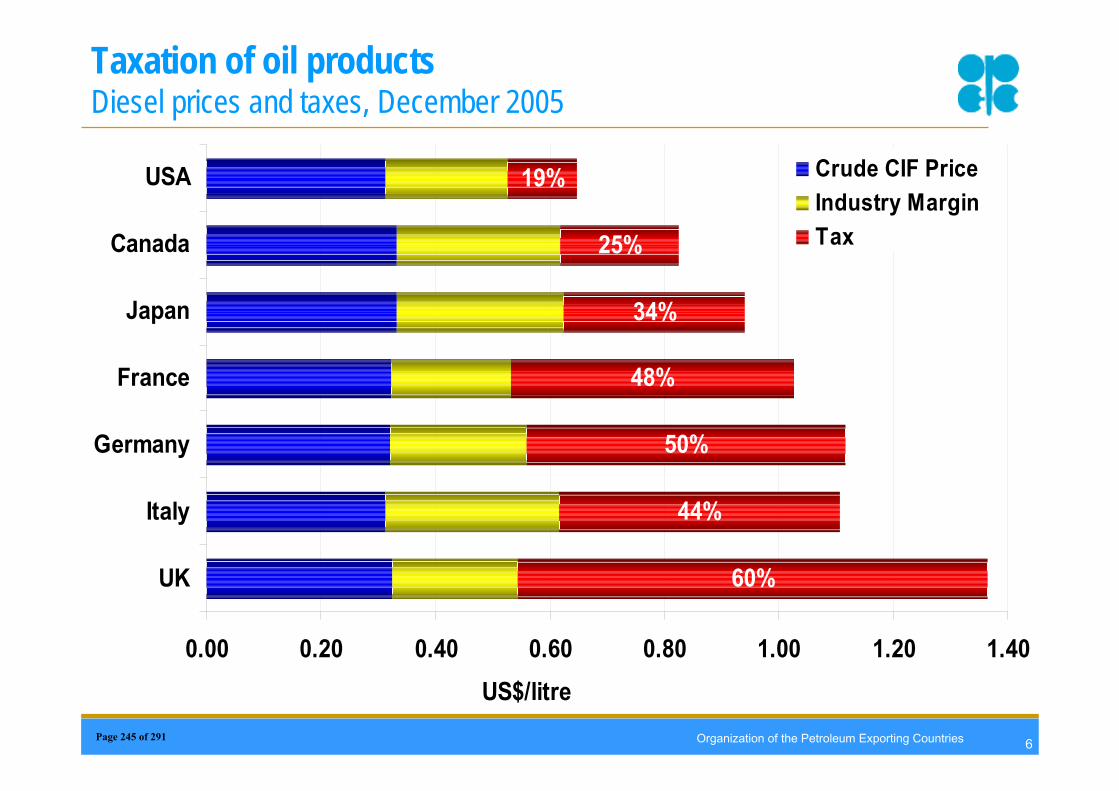
Organization of the Petroleum Exporting Countries 6
Taxation of oil productsDiesel prices and taxes, December 2005
60%
44%
50%
48%
34%
25%
19%
0.00 0.20 0.40 0.60 0.80 1.00 1.20 1.40
UK
Italy
Germany
France
Japan
Canada
USA
US$/litre
Crude CIF PriceIndustry MarginTax
Page 245 of 291
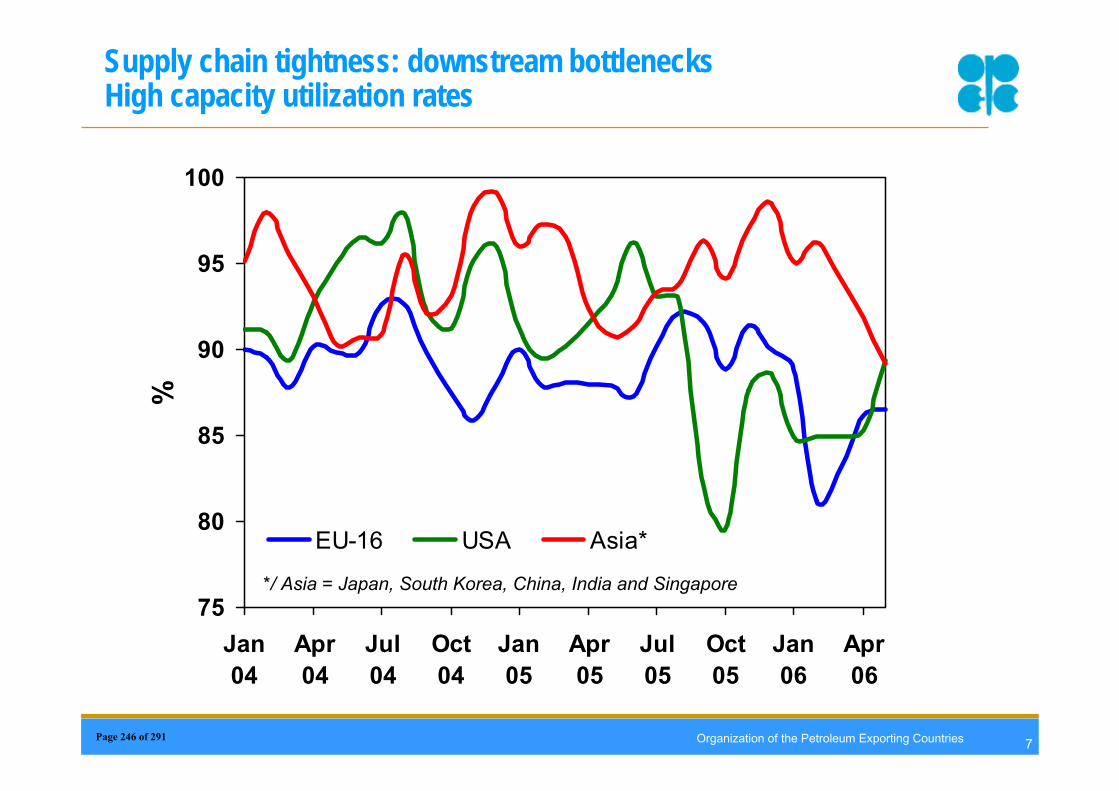
Organization of the Petroleum Exporting Countries 7
Supply chain tightness: downstream bottlenecksHigh capacity utilization rates
75
80
85
90
95
100
Jan04
Apr04
Jul04
Oct04
Jan05
Apr05
Jul05
Oct05
Jan06
Apr06
%
EU-16 USA Asia*
*/ Asia = Japan, South Korea, China, India and Singapore
Page 246 of 291
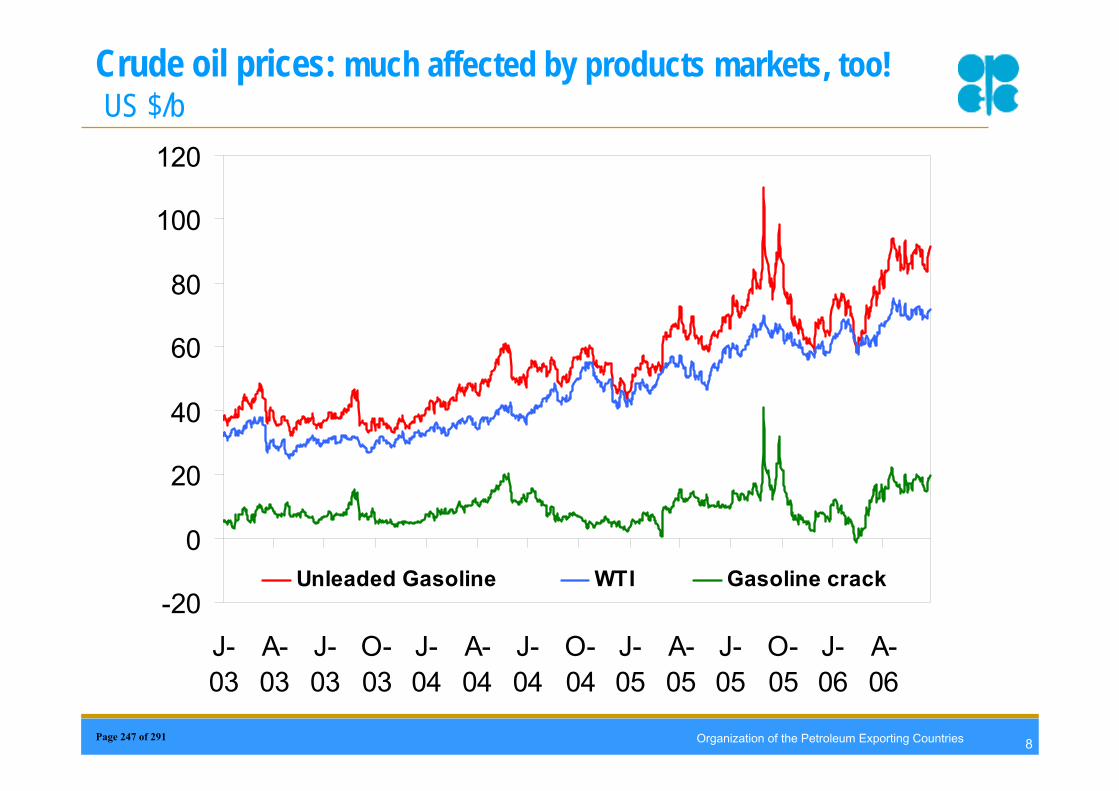
Organization of the Petroleum Exporting Countries 8
Crude oil prices: much affected by products markets, too!US $/b
-20
0
20
40
60
80
100
120
J-03
A-03
J-03
O-03
J-04
A-04
J-04
O-04
J-05
A-05
J-05
O-05
J-06
A-06
Unleaded Gasoline WTI Gasoline crack
Page 247 of 291
Organization of the Petroleum Exporting Countries 9
Dialogue and cooperation
The way forward for all playersOPEC continues to make big effortWidened and deepened in open and constructive manner
ExamplesNew OPEC energy dialogues with European Union, China and RussiaInternational Energy Forum, with Joint Oil Data InitiativeNon-OPEC at OPEC Conferences; OPEC and non-OPEC experts’ meetings …Joint annual workshops organised by OPEC and International Energy Agency
Page 248 of 291
Organization of the Petroleum Exporting Countries 10
Concluding statement
Follow the path of order and stability in the international oil market.
Adhere to a broader vision, embracing such issues as sustainable development and environmental
harmony.
In this way, it would be possible to imbue the industry with an enriched experience of energy
security.
Page 249 of 291
Organization of the Petroleum Exporting Countries 11
www.opec.org
Thank you
Page 250 of 291
DSER/DSPJune 28, 2006
Workshop on the impact of oil pricesSession on Geopolitics and Security of Supply
European ParliamentBruxelles 28 June 2006
Pierre Sigonney
Page 251 of 291
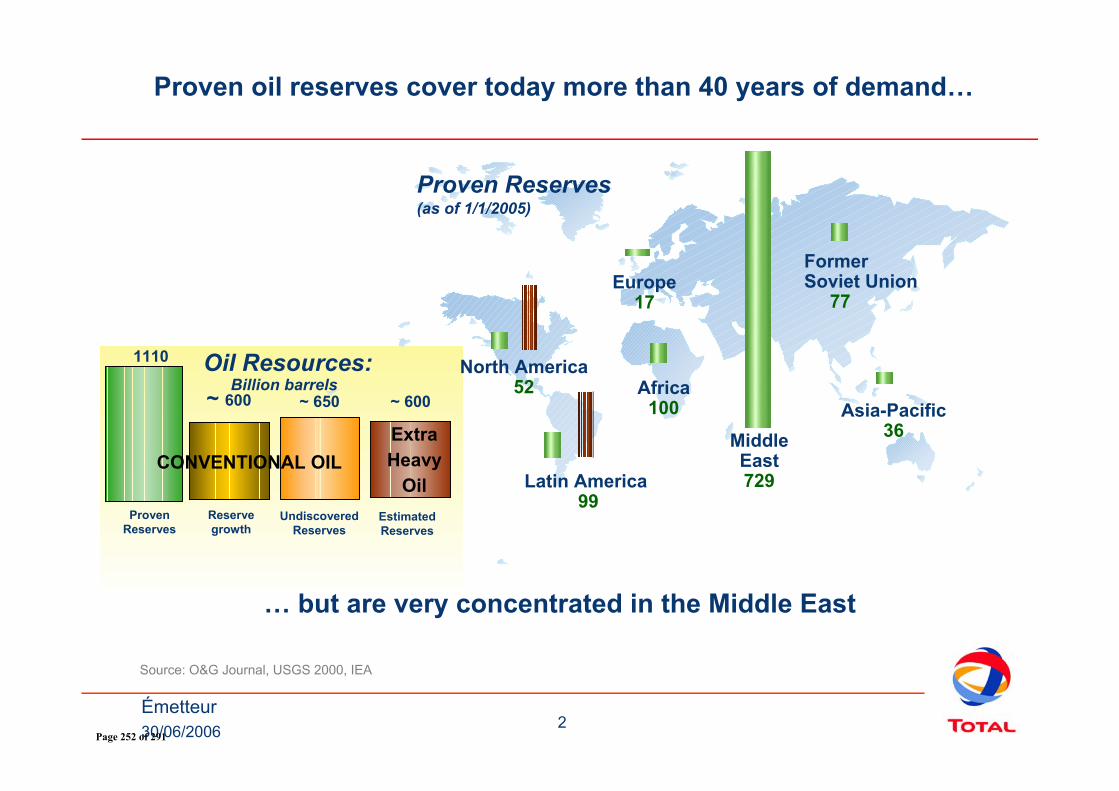
30/06/2006 2Émetteur
Source: O&G Journal, USGS 2000, IEA
Former Soviet Union
77
Latin America99
Asia-Pacific36
Africa100
Europe17
North America52
Middle East729
Proven Reserves(as of 1/1/2005)
Oil Resources:
Proven Reserves
Reserve growth
Undiscovered Reserves
Billion barrels
CONVENTIONAL OIL
1110
~ 600 ~ 650
Proven oil reserves cover today more than 40 years of demand…
Extra Heavy
Oil
~ 600
Estimated Reserves
… but are very concentrated in the Middle East
Page 252 of 291
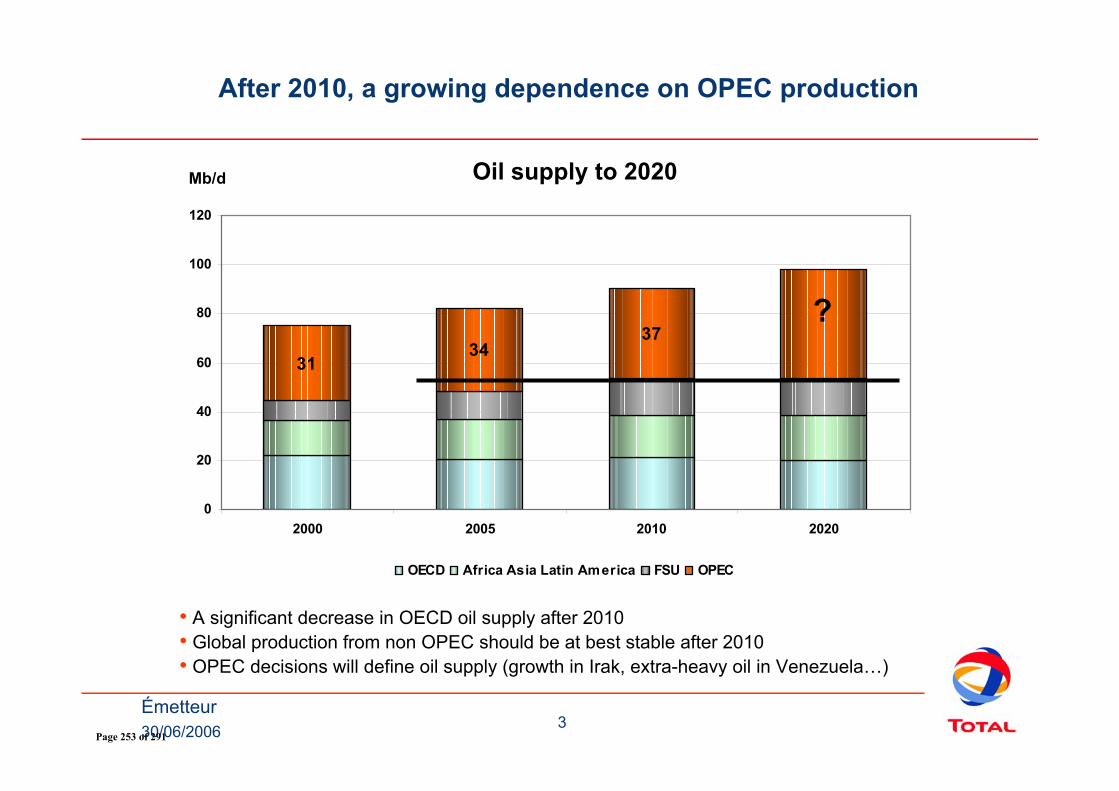
30/06/2006 3Émetteur
3134
37
0
20
40
60
80
100
120
2000 2005 2010 2020
OECD Africa Asia Latin America FSU OPEC
After 2010, a growing dependence on OPEC production
Mb/d Oil supply to 2020
?
• A significant decrease in OECD oil supply after 2010• Global production from non OPEC should be at best stable after 2010• OPEC decisions will define oil supply (growth in Irak, extra-heavy oil in Venezuela…)
Page 253 of 291
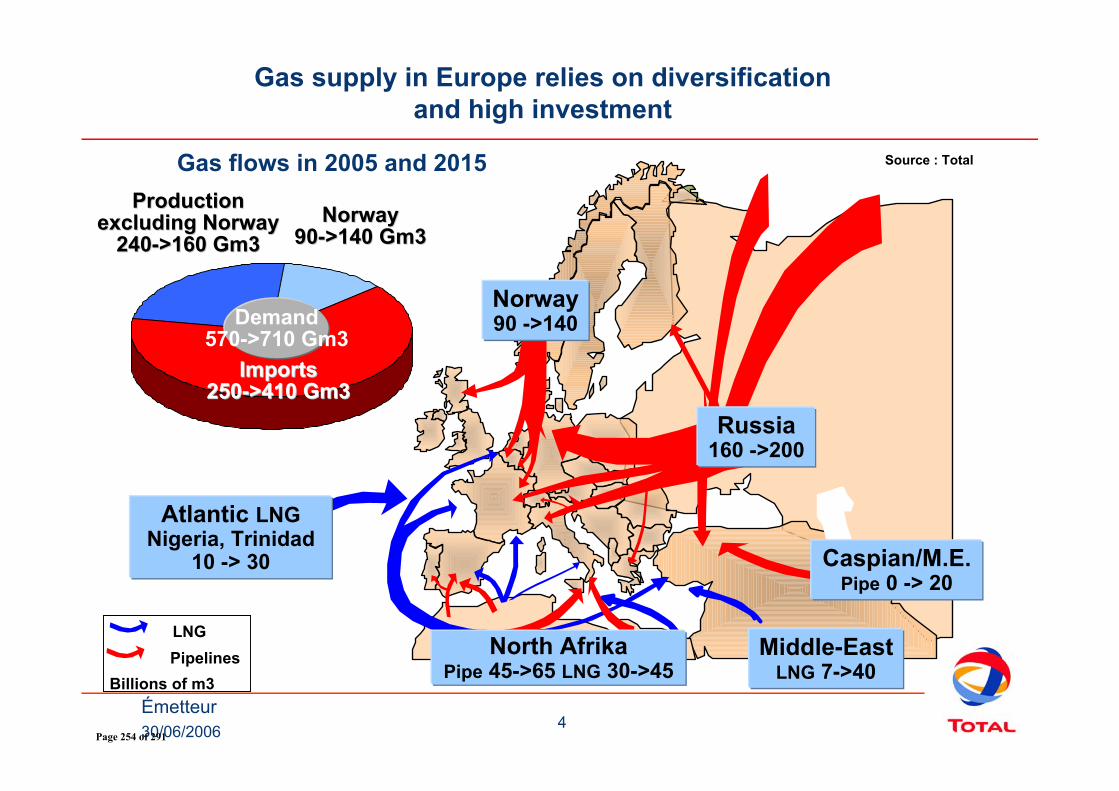
30/06/2006 4Émetteur
Gas supply in Europe relies on diversificationand high investment
LNG
Billions of m3Pipelines
Source : Total
Norway90 ->140
Atlantic LNGNigeria, Trinidad
10 -> 30
Middle-EastLNG 7->40
North AfrikaPipe 45->65 LNG 30->45
Caspian/M.E.Pipe 0 -> 20
Russia160 ->200
ImportsImports250250-->410 Gm3>410 Gm3
ProductionProductionexcludingexcluding NorwayNorway
240240-->160 Gm3>160 Gm3
Demand570->710 Gm3
NorwayNorway9090-->140 Gm3>140 Gm3
Gas flows in 2005 and 2015
Page 254 of 291
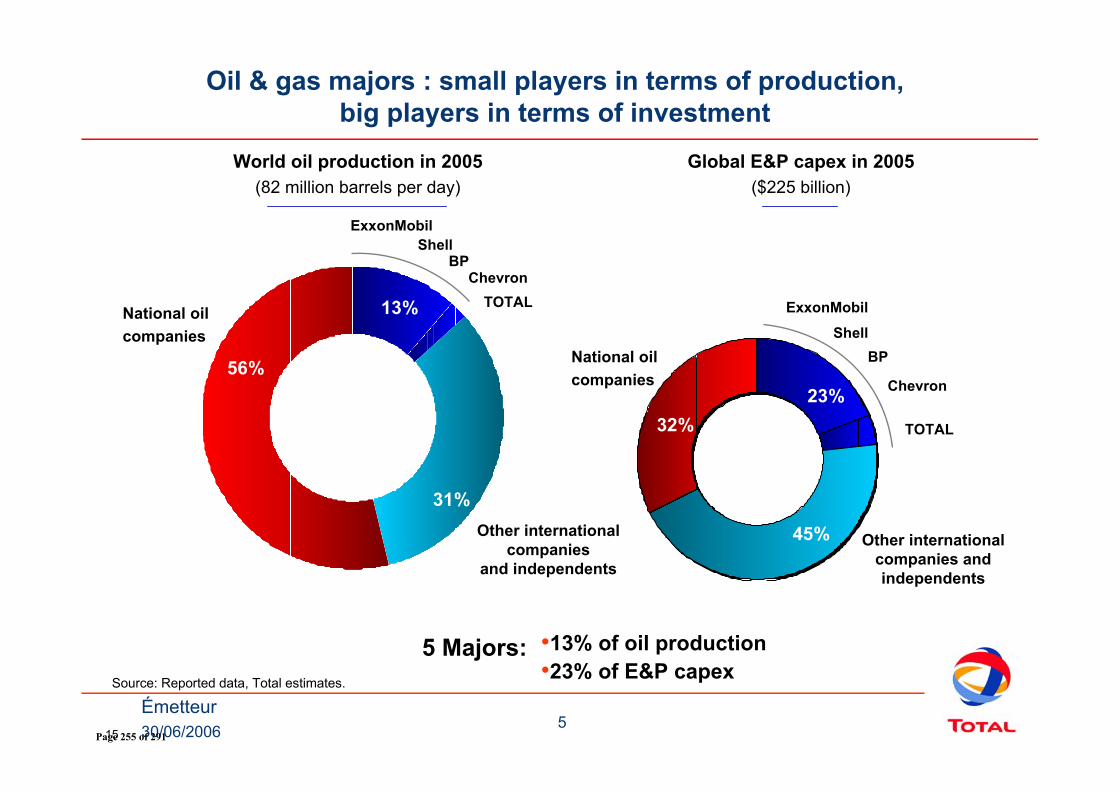
30/06/2006 5Émetteur
Oil & gas majors : small players in terms of production, big players in terms of investment
Other internationalcompanies
and independents
World oil production in 2005(82 million barrels per day)
5 Majors:
ExxonMobil
ChevronBP
Shell
TOTALNational oil companies
13%
56%
•13% of oil production•23% of E&P capex
Source: Reported data, Total estimates.
31%
Other internationalcompanies andindependents
ExxonMobil
Chevron
BPShell
TOTAL
National oil companies
23%32%
45%
Global E&P capex in 2005($225 billion)
15Page 255 of 291
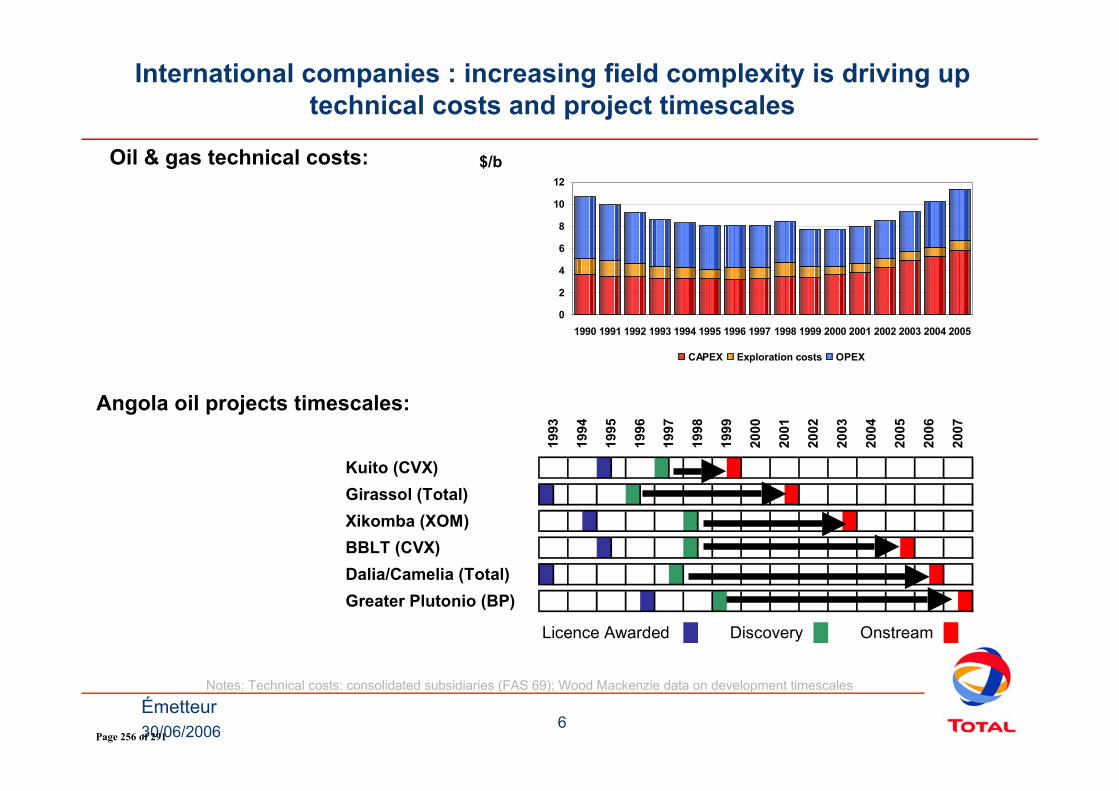
30/06/2006 6Émetteur
Kuito (CVX)Girassol (Total)Xikomba (XOM)BBLT (CVX)Dalia/Camelia (Total)Greater Plutonio (BP)
Licence Awarded Discovery Onstream
2005
2006
2007
2001
2002
2003
2004
1997
1998
1999
2000
1993
1994
1995
1996
International companies : increasing field complexity is driving up technical costs and project timescales
Oil & gas technical costs:
Notes: Technical costs: consolidated subsidiaries (FAS 69); Wood Mackenzie data on development timescales
Angola oil projects timescales:
$/b
0
2
4
6
8
10
12
1990 1991 1992 1993 1994 1995 1996 1997 1998 1999 2000 2001 2002 2003 2004 2005
CAPEX Exploration costs OPEX
Page 256 of 291
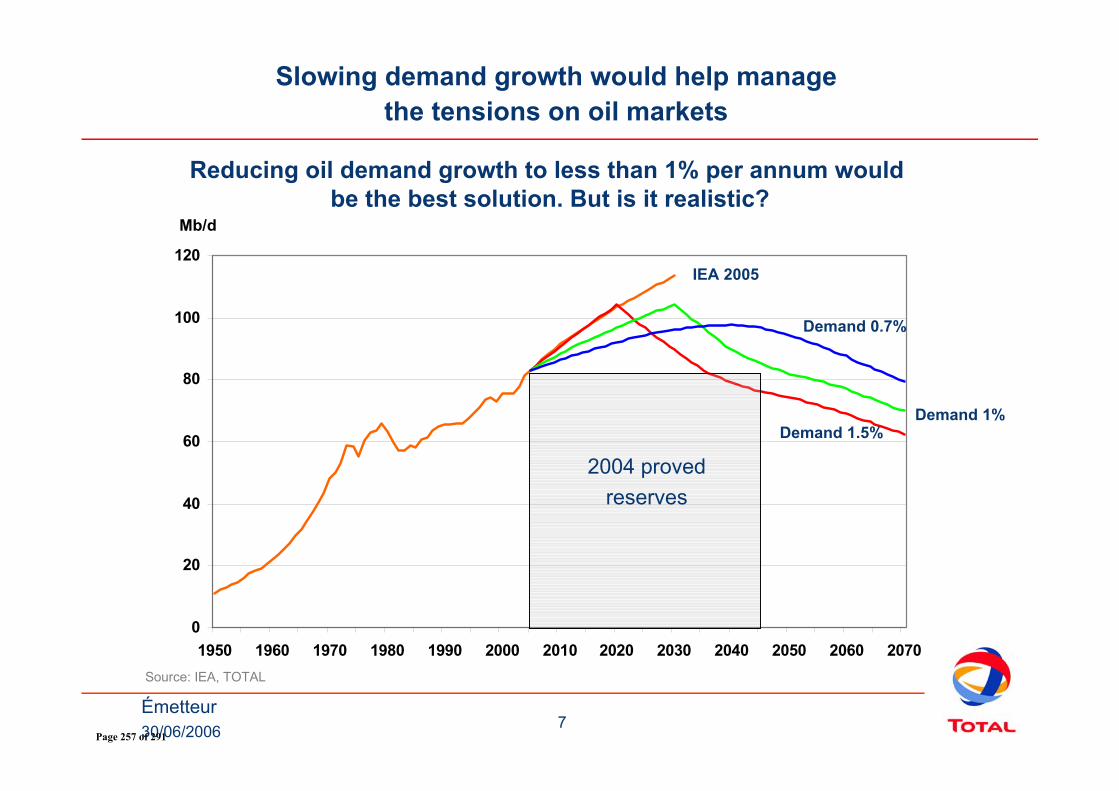
30/06/2006 7Émetteur
0
20
40
60
80
100
120
1950 1960 1970 1980 1990 2000 2010 2020 2030 2040 2050 2060 2070
Reducing oil demand growth to less than 1% per annum wouldbe the best solution. But is it realistic?
2004 provedreserves
Slowing demand growth would help manage the tensions on oil markets
Mb/d
IEA 2005
Demand 1.5%
Demand 0.7%
Demand 1%
Source: IEA, TOTAL
Page 257 of 291
DSER/DSPJune 28, 2006
Back up
Page 258 of 291
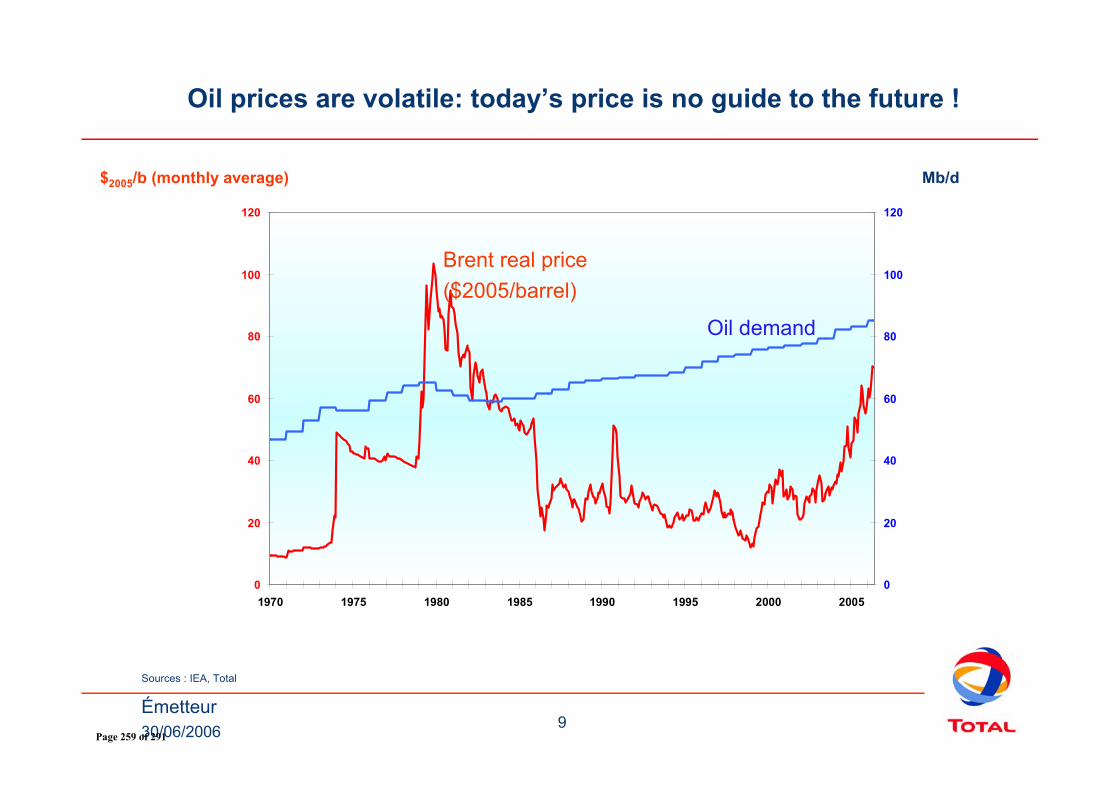
30/06/2006 9Émetteur
0
20
40
60
80
100
120
1970 1975 1980 1985 1990 1995 2000 20050
20
40
60
80
100
120
$2005/b (monthly average)
Oil prices are volatile: today’s price is no guide to the future !
Sources : IEA, Total
Mb/d
Brent real price($2005/barrel)
Oil demand
Page 259 of 291
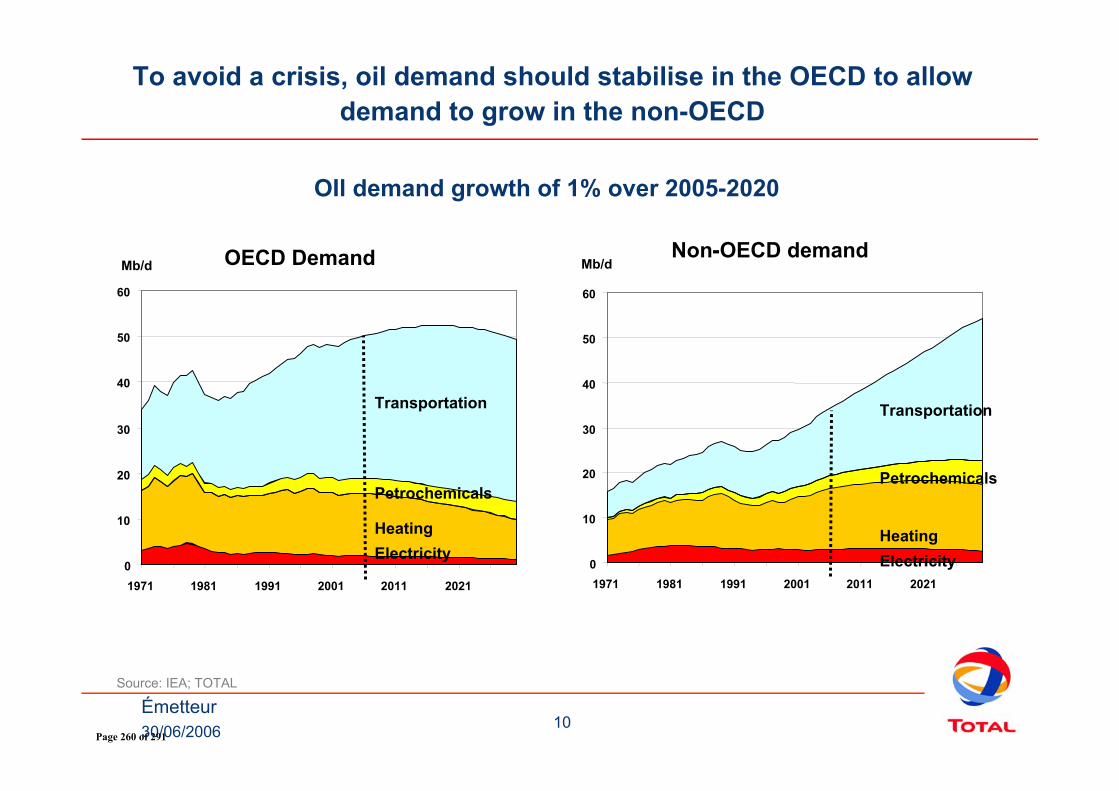
30/06/2006 10Émetteur
Non-OECD demand-OECD DemandMb/d Mb/d
0
10
20
30
40
50
60
1971 1981 1991 2001 2011 2021
0
10
20
30
40
50
60
1971 1981 1991 2001 2011 2021
Transportation
Petrochemicals
HeatingElectricity
Transportation
Petrochemicals
HeatingElectricity
To avoid a crisis, oil demand should stabilise in the OECD to allowdemand to grow in the non-OECD
OIl demand growth of 1% over 2005-2020
Source: IEA; TOTAL
Page 260 of 291
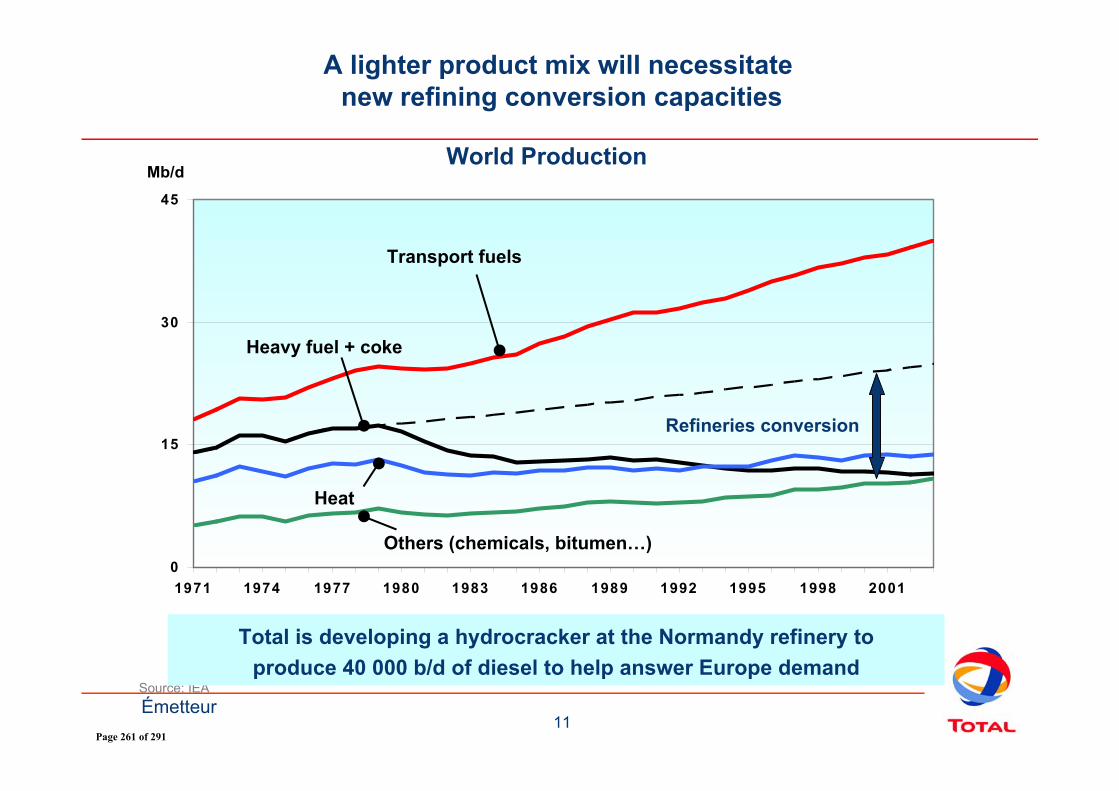
11Émetteur
0
15
30
45
1971 1974 1977 1980 1983 1986 1989 1992 1995 1998 2001
Source: IEA
Mb/d
Heavy fuel + coke
Heat
Transport fuels
Refineries conversion
World Production
Others (chemicals, bitumen…)
A lighter product mix will necessitatenew refining conversion capacities
Total is developing a hydrocracker at the Normandy refinery to produce 40 000 b/d of diesel to help answer Europe demand
Page 261 of 291
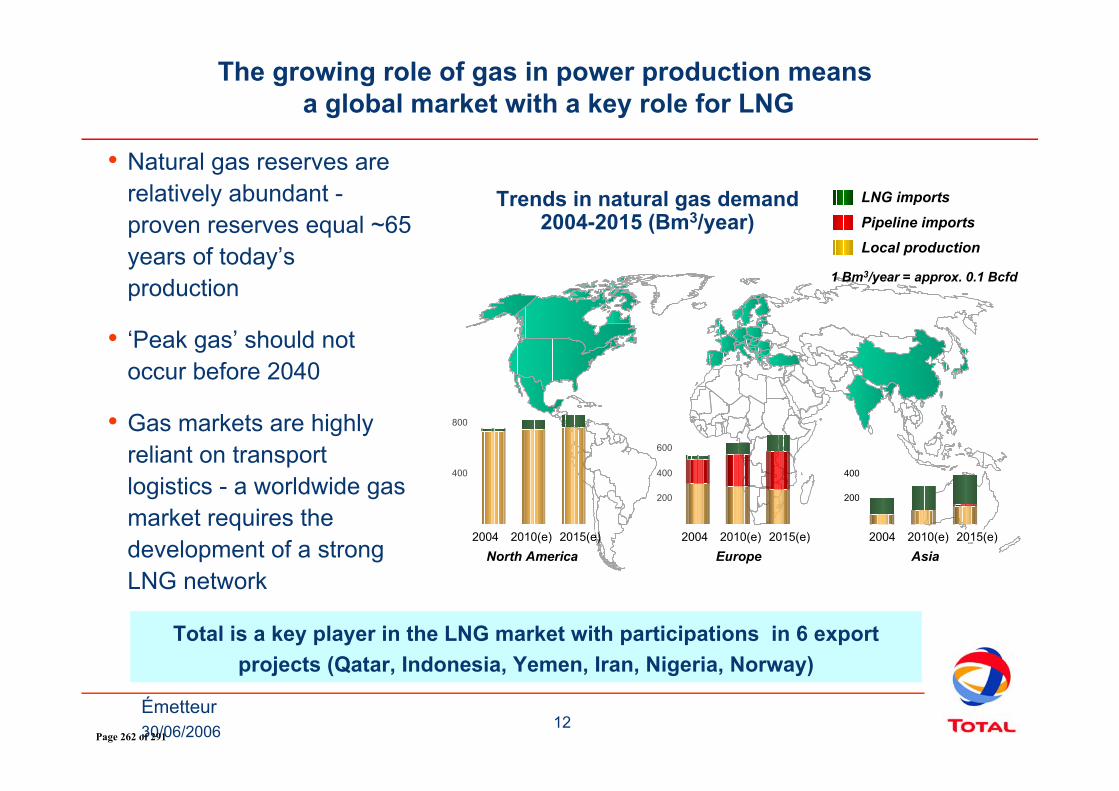
30/06/2006 12Émetteur
The growing role of gas in power production meansa global market with a key role for LNG
Trends in natural gas demand 2004-2015 (Bm3/year)
LNG importsPipeline importsLocal production
1 Bm3/year = approx. 0.1 Bcfd
2004 2010(e) 2015(e)
North America
400
800
Asia2004 2010(e) 2015(e)
200
400
Europe2004 2010(e) 2015(e)
200
400
600
• Natural gas reserves are relatively abundant -proven reserves equal ~65 years of today’sproduction
• ‘Peak gas’ should notoccur before 2040
• Gas markets are highlyreliant on transport logistics - a worldwide gasmarket requires thedevelopment of a strongLNG network
Total is a key player in the LNG market with participations in 6 export projects (Qatar, Indonesia, Yemen, Iran, Nigeria, Norway)
Page 262 of 291
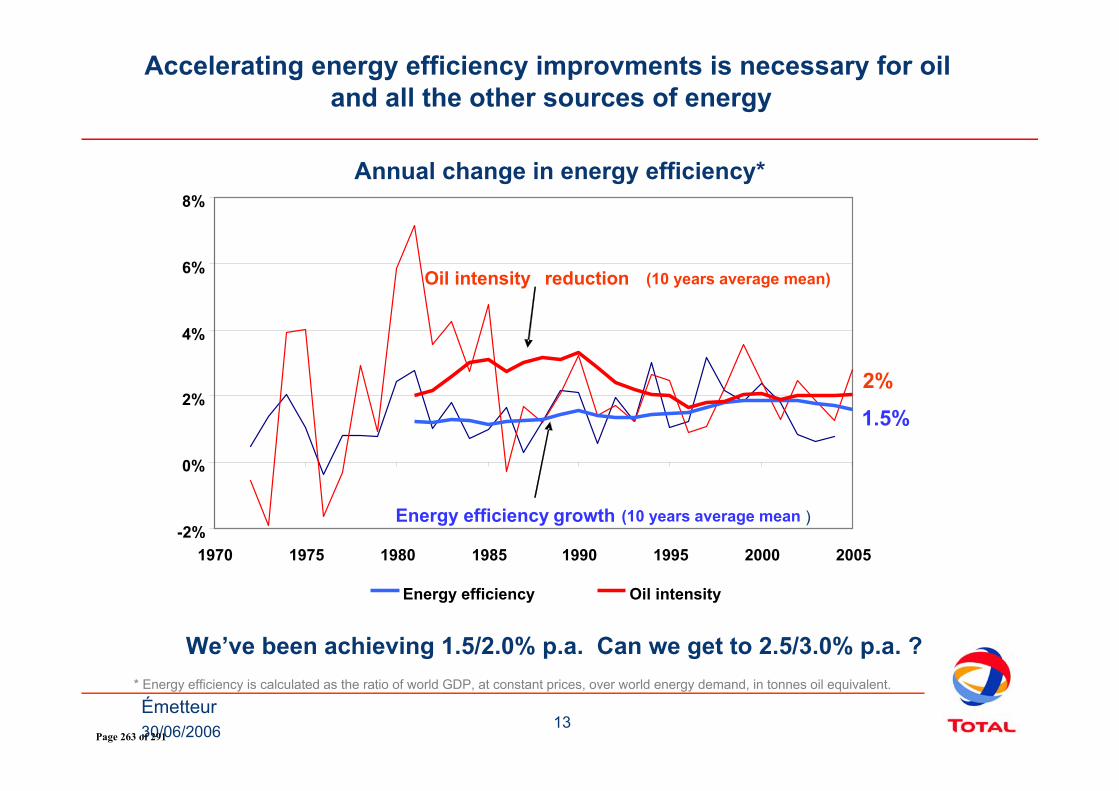
30/06/2006 13Émetteur
Accelerating energy efficiency improvments is necessary for oiland all the other sources of energy
We’ve been achieving 1.5/2.0% p.a. Can we get to 2.5/3.0% p.a. ?* Energy efficiency is calculated as the ratio of world GDP, at constant prices, over world energy demand, in tonnes oil equivalent.
-2%
0%
2%
4%
6%
8%
1970 1975 1980 1985 1990 1995 2000 2005
Energy efficiency Oil intensity
1.5%
Oil intensity reduction (10 years average mean)
Energy efficiency growth (10 years average mean )
2%
Annual change in energy efficiency*
Page 263 of 291
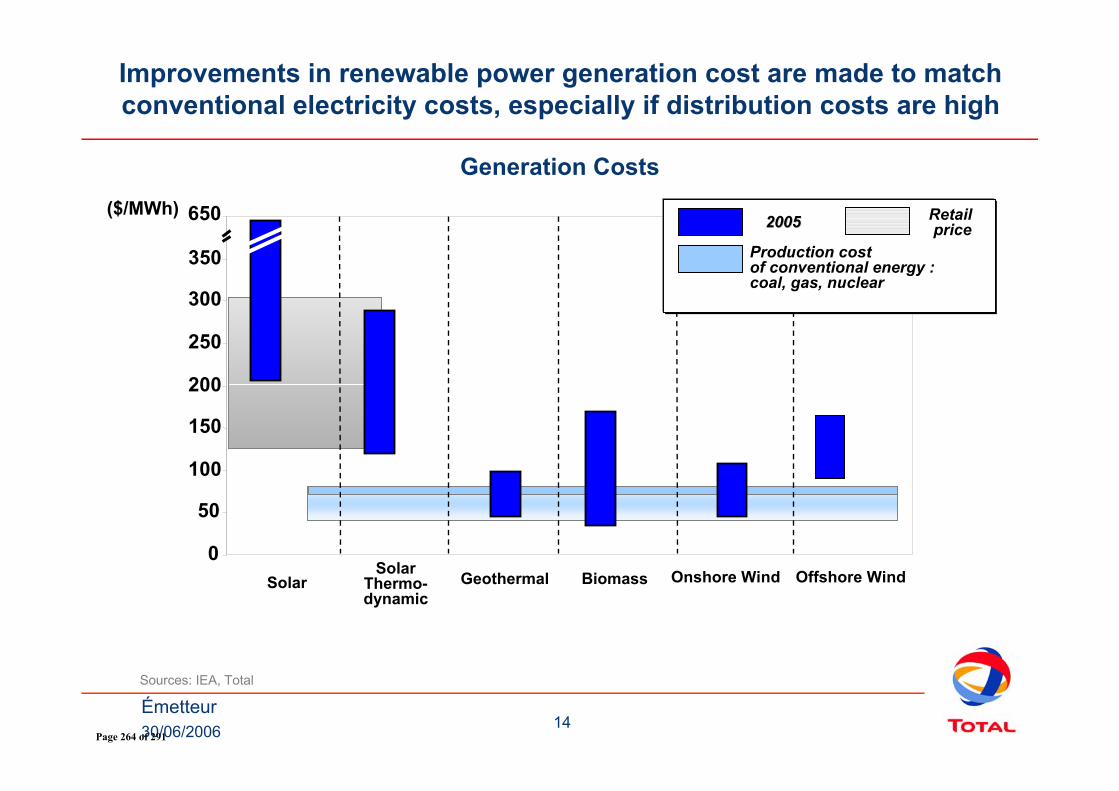
30/06/2006 14Émetteur
Improvements in renewable power generation cost are made to match conventional electricity costs, especially if distribution costs are high
Sources: IEA, Total
($/MWh)
SolarSolar
Thermo-dynamic
Geothermal Offshore WindOnshore Wind0
50
100
150
200
250
300
350
650
Biomass
20052005 Retailprice
Production costof conventional energy : coal, gas, nuclear
Generation Costs
Page 264 of 291
Sussex Energy GroupSPRU - Science and Technology Policy Research
The Oil-GDP effect and its implications for the deployment of renewable energies
and security of supply
Raphael Sauter and Shimon Awerbuch
SPRU, University of Sussex
Workshop on the economic impact of rising oil pricesEuropean Parliament, Brussels 28th June 2006
Page 265 of 291
Sussex Energy GroupSPRU - Science and Technology Policy Research
• The Oil-GDP effect
• Investment in renewable energy as a way to mitigate the fossil fuel price risk
• Avoided GDP losses
• Implications for security of supply
• Conclusions
Overview
Page 266 of 291
Sussex Energy GroupSPRU - Science and Technology Policy Research
The Oil-GDP effect
• Oil price increases and volatility dampen economic growth by raising inflation and unemployment
• Since the mid 1980s not only oil price levels but also volatility is an important factor
• Asymmetric relationship between oil price increases / decreases and GDP
• Despite changes in the oil-GDP effect, there is no doubt about the negative impact of oil price fluctuation on GDP
• Doubling in oil prices reduces GDP by around 5% - however very different for individual countries:
Page 267 of 291
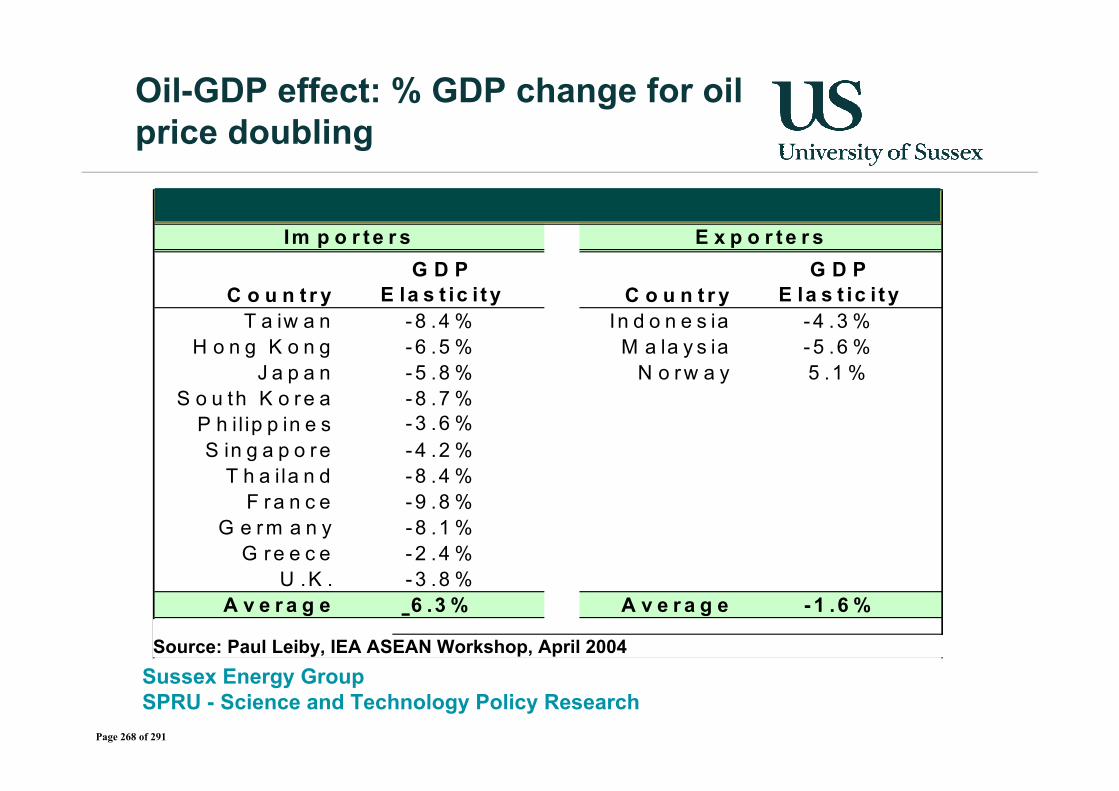
Sussex Energy GroupSPRU - Science and Technology Policy Research
Oil-GDP effect: % GDP change for oil price doubling
C o u n t r yG D P
E la s t ic i t y C o u n t r yG D P
E la s t ic i t yT a iw a n - 8 .4 % In d o n e s ia - 4 .3 %
H o n g K o n g - 6 .5 % M a la y s ia - 5 .6 %J a p a n - 5 .8 % N o r w a y 5 .1 %
S o u th K o r e a - 8 .7 %P h il ip p in e s - 3 .6 % a /
S in g a p o r e - 4 .2 %T h a ila n d - 8 .4 %
F r a n c e - 9 .8 %G e r m a n y - 8 .1 %
G r e e c e - 2 .4 %U .K . - 3 .8 %
A v e r a g e 6 .3 % A v e r a g e - 1 .6 %a . S ta t is t ic a lly In s ig n if ic a n t .S o u r c e : P a u l L e ib e y , IE A /A S E A N W o r k s h o p , A p r i l 2 0 0 4
% G D P C h a n g e fo r O i l - P r ic e D o u b l in g Im p o r t e r s E x p o r t e r s
-Source: Paul Leiby, IEA ASEAN Workshop, April 2004
Page 268 of 291
Sussex Energy GroupSPRU - Science and Technology Policy Research
Investments in renewable energy sources to mitigate oil-GDP effect
Investments in renewable energy sources create benefits in terms of avoided GDP loses:
• A higher share of renewables in the electricity supply reduces demand for natural gas which reduces natural gas prices
• Through the gas-oil substitution effect oil prices will come under pressure
• Avoided oil price increases and volatility produce avoided GDP losses
Page 269 of 291
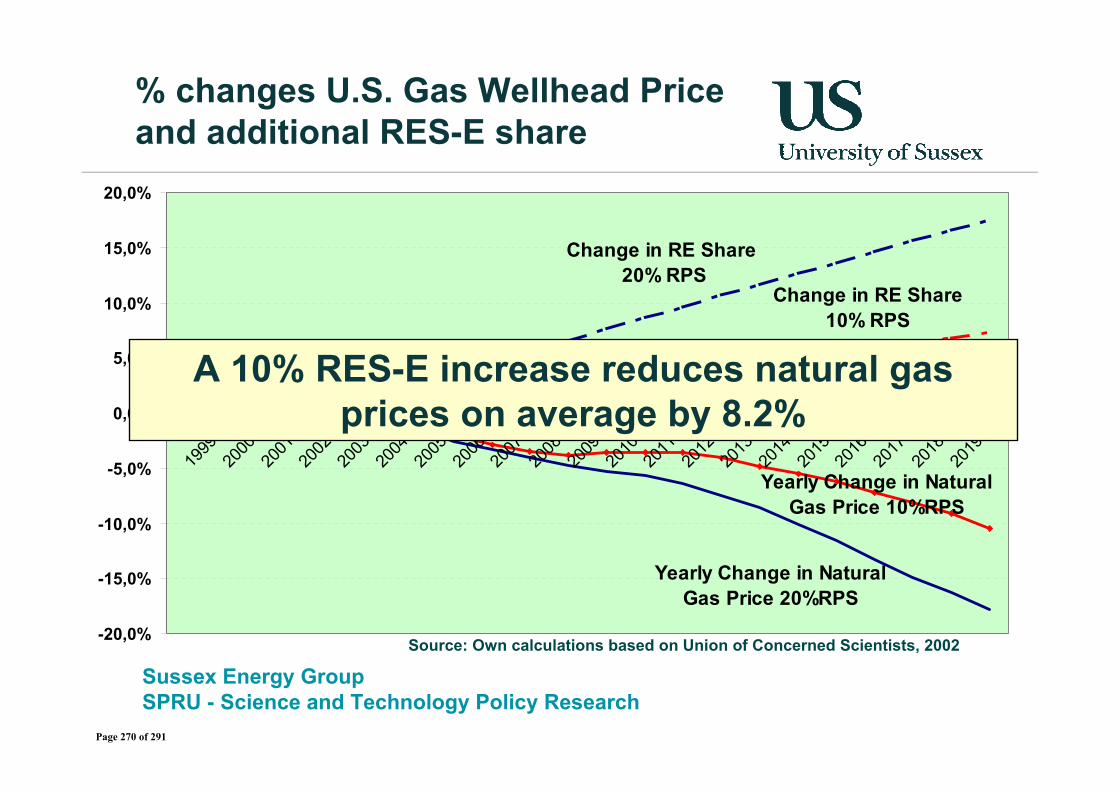
Sussex Energy GroupSPRU - Science and Technology Policy Research
-20,0%
-15,0%
-10,0%
-5,0%
0,0%
5,0%
10,0%
15,0%
20,0%
1999
2000
2001
2002
2003
2004
2005
2006
2007
2008
2009
2010
2011
2012
2013
2014
2015
2016
2017
2018
2019
Change in RE Share10% RPS
Change in RE Share 20% RPS
Yearly Change in Natural Gas Price 10%RPS
Yearly Change in Natural Gas Price 20%RPS
% changes U.S. Gas Wellhead Price and additional RES-E share
Source: Own calculations based on Union of Concerned Scientists, 2002
A 10% RES-E increase reduces natural gas prices on average by 8.2%
Page 270 of 291
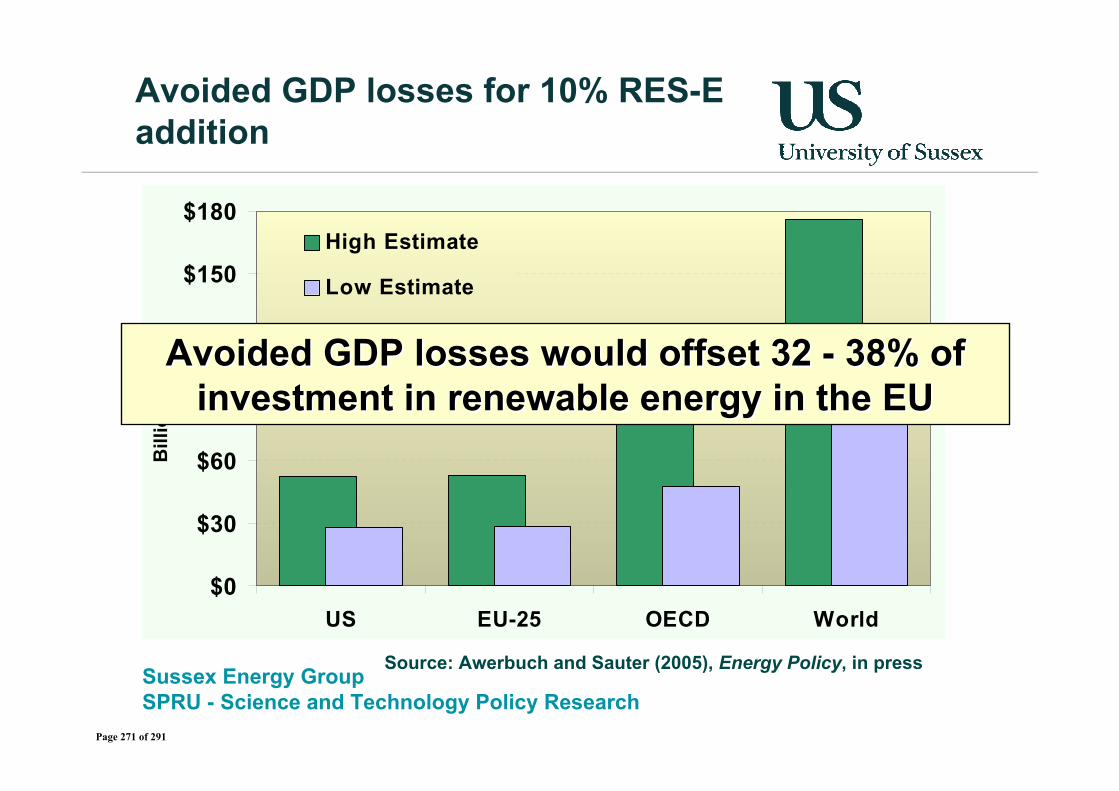
Sussex Energy GroupSPRU - Science and Technology Policy Research
Avoided GDP losses for 10% RES-E addition
$0
$30
$60
$90
$120
$150
$180
US EU-25 OECD World
Bill
ions
$U
SD
High Estimate
Low Estimate
Source: Awerbuch and Sauter (2005), Energy Policy, in press
Avoided GDP losses would offset 32 Avoided GDP losses would offset 32 -- 38% of 38% of investment in renewable energy in the EUinvestment in renewable energy in the EU
Page 271 of 291
Sussex Energy GroupSPRU - Science and Technology Policy Research
Implications for security of supply
Investments in renewable energy sources enhance energy security:
• by helping reduce exposure to oil-GDP losses• by contributing to an optimized generation portfolio and
therefore mitigating risk due to minimised exposure to fossil fuel price volatility
• by providing a form of ‘national insurance’ (Lind/Arrow) in that prices move against the value of other financial assets
Page 272 of 291
Sussex Energy GroupSPRU - Science and Technology Policy Research
Conclusions
• Investment costs in renewables can partially be offset by avoided GDP losses
• Currently fuel price risks in the electricity supply system are passed through to consumers and reduce their disposable income
• European oil and gas market structures will have to change to fully allow for the potential of avoided GDP losses
• An increased share of renewable energy sources in the supply portfolio constitutes a no regrets policy
• Similar conclusions apply to investments in energy efficiency measures
Page 273 of 291
Sussex Energy GroupSPRU - Science and Technology Policy Research
Contact details
Thank you for your attention!
Raphael SauterSPRU - Science & Technology Policy Research
University of SussexBrighton, UK
BN1 9QETel +44 (0)1273 873615Fax +44 (0)1273 685865
http://www.sussex.ac.uk/spru
Page 274 of 291
Geopolitics and supply securityGeopolitics and supply security
Alexandre ClauwaertJune 2006
Page 275 of 291
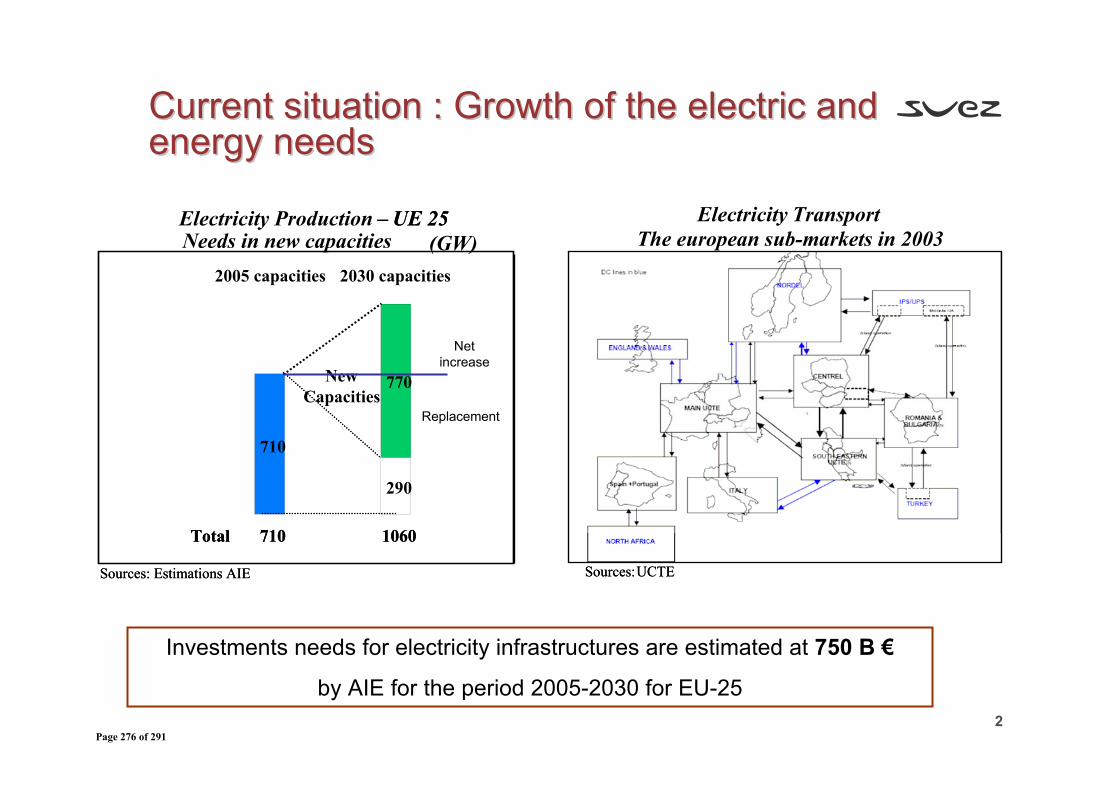
2
CurrentCurrent situation : situation : Growth Growth of of the electric and the electric and energy needsenergy needs
290
710
770New Capacities
2030 capacities2005 capacities
Total 710 1060
Sources: Estimations AIE
Electricity Production – UE 25Needs in new capacities (GW)
Total 710 1060
Sources: Estimations AIE
– UE 25
Sources:UCTE
Electricity Transport
Sources:UCTE
The european sub-markets in 2003
Investments needs for electricity infrastructures are estimated at 750 B €
by AIE for the period 2005-2030 for EU-25
Netincrease
Replacement
Page 276 of 291
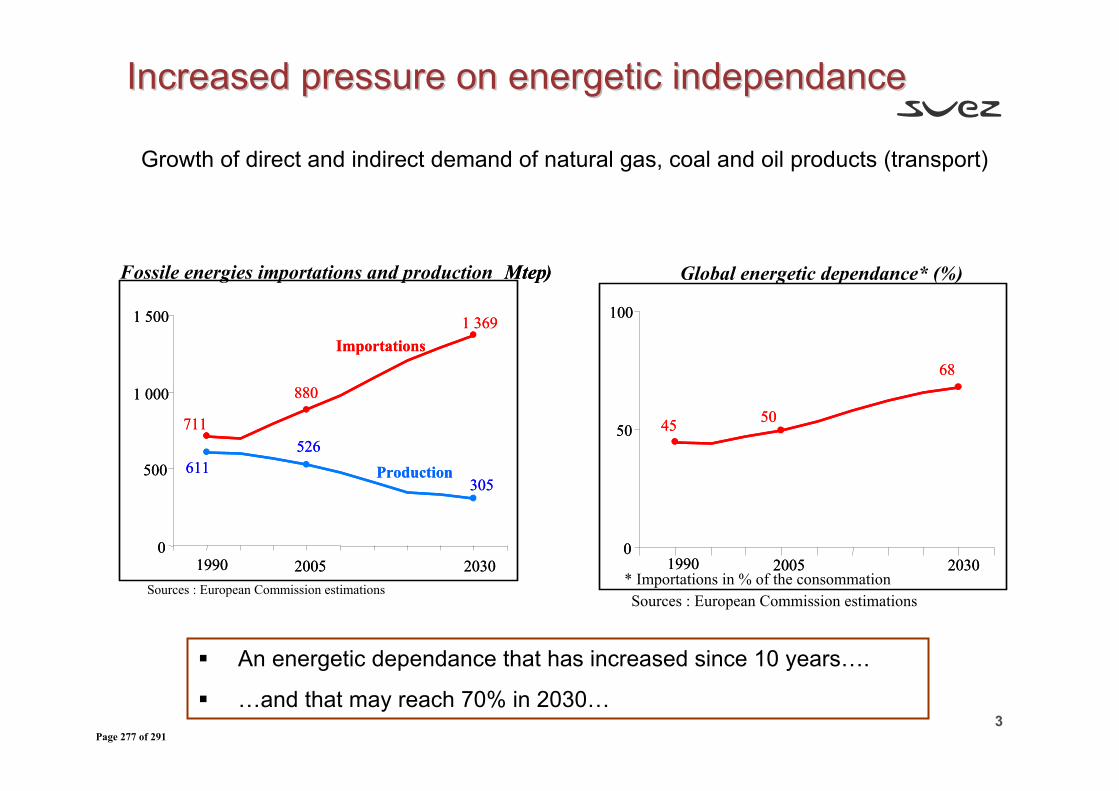
3
Increased Increased pressure on pressure on energetic independanceenergetic independance
68
5045
0
50
100
Global energetic dependance* (%)
* Importations in % of the consommationSources : European Commission estimations
1990 2005 2030
68
5045
0
50
100
1990 2005 2030
))
305
526611
1 369
880
711
0
500
1 000
1 500
Fossile energies importations and production Mtep
Sources : European Commission estimations
Importations
Production
1990 2005 2030
305
526611
1 369
880
711
0
500
1 000
1 500
Mtep
Importations
Production
1990 2005 2030
An energetic dependance that has increased since 10 years….
…and that may reach 70% in 2030…
Growth of direct and indirect demand of natural gas, coal and oil products (transport)
Page 277 of 291
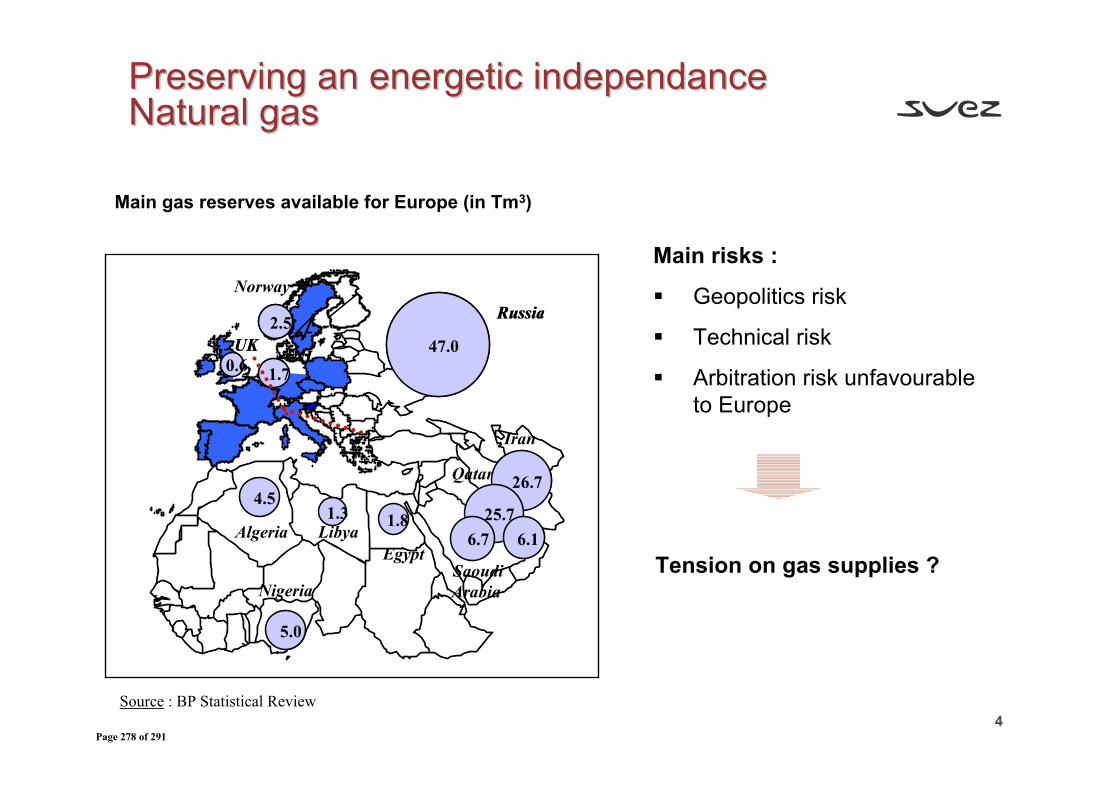
4
PreservingPreserving an an energeticenergetic independanceindependanceNatural gasNatural gas
Source : BP Statistical Review
Main risks :
Geopolitics risk
Technical risk
Arbitration risk unfavourable to Europe
Tension on gas supplies ?
Main gas reserves available for Europe (in Tm3)
0.6 1.7
2.547.0UK
NL
NorwayRussie
4.51.3 1.8
5.0
Algerie LibyeEgypte
Nigeria
26.7
25.76.7 6.1
Iran
Qatar
0.6 1.7
2.547.0UK
NL
Russia
4.51.3 1.8
5.0
Algeria LibyaEgypt
Nigeria
26.7
25.76.7 6.1
Iran
Qatar
SaoudiArabia
Page 278 of 291
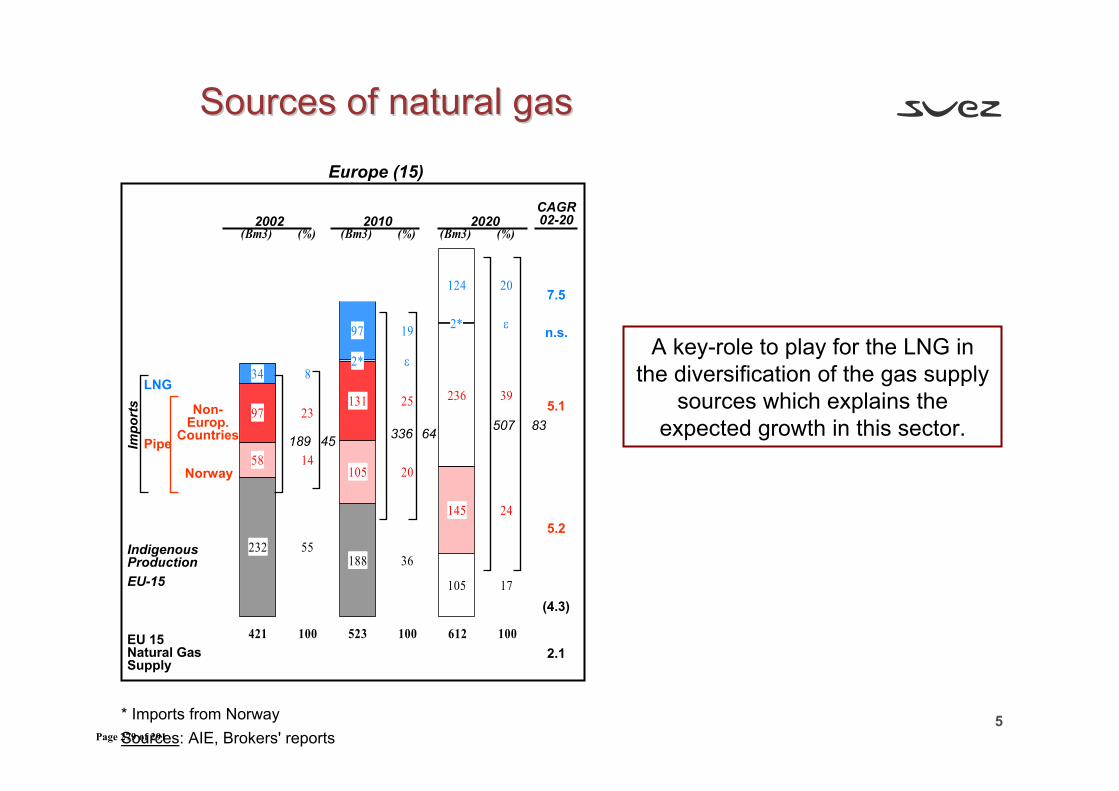
5
Sources of Sources of natural gasnatural gas
232188
105
97131 236
34
97
124
58105
145
2*
2*
17
3655
24
2014
392523
ε
ε8
19
20
(Bm3) (%) (Bm3) (Bm3)(%) (%)
421 100 523 100 612 100
* Imports from NorwaySources: AIE, Brokers' reports
LNG
2002
PipeImpo
rts
2010 2020
IndigenousProductionEU-15
EU 15Natural GasSupply
189 336 50764 8345
CAGR02-20
7.5
5.1
(4.3)
2.1
Europe (15)
Norway
Non-Europ.
Countries
5.2
n.s.A key-role to play for the LNG in
the diversification of the gas supply sources which explains the
expected growth in this sector.
Page 279 of 291
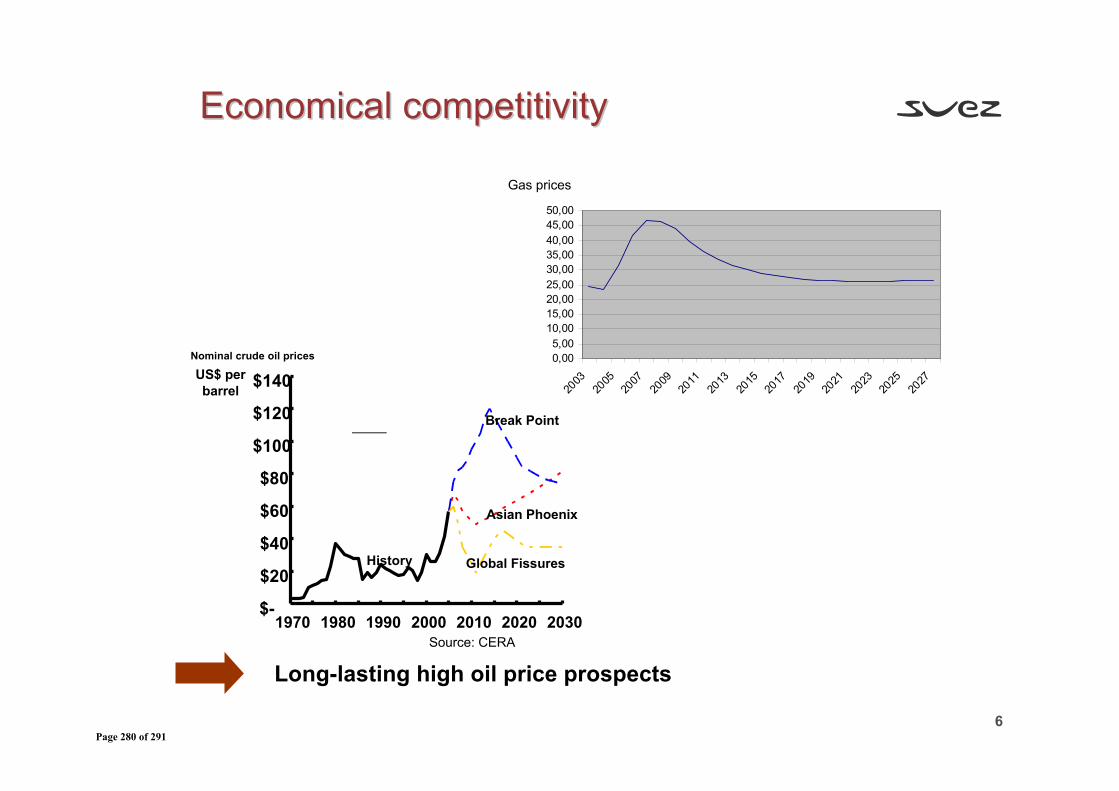
6
Economical competitivityEconomical competitivity
Long-lasting high oil price prospects
Nominal crude oil prices
US$ per barrel
$-
$20
$40
$60
$80
$100
$120
$140
1970 1980 1990 2000 2010 2020 2030
Break Point
Asian Phoenix
Global FissuresHistory
Source: CERA
0,005,00
10,0015,0020,0025,0030,0035,0040,0045,0050,00
2003
2005
2007
2009
2011
2013
2015
2017
2019
2021
2023
2025
2027
Gas prices
Page 280 of 291
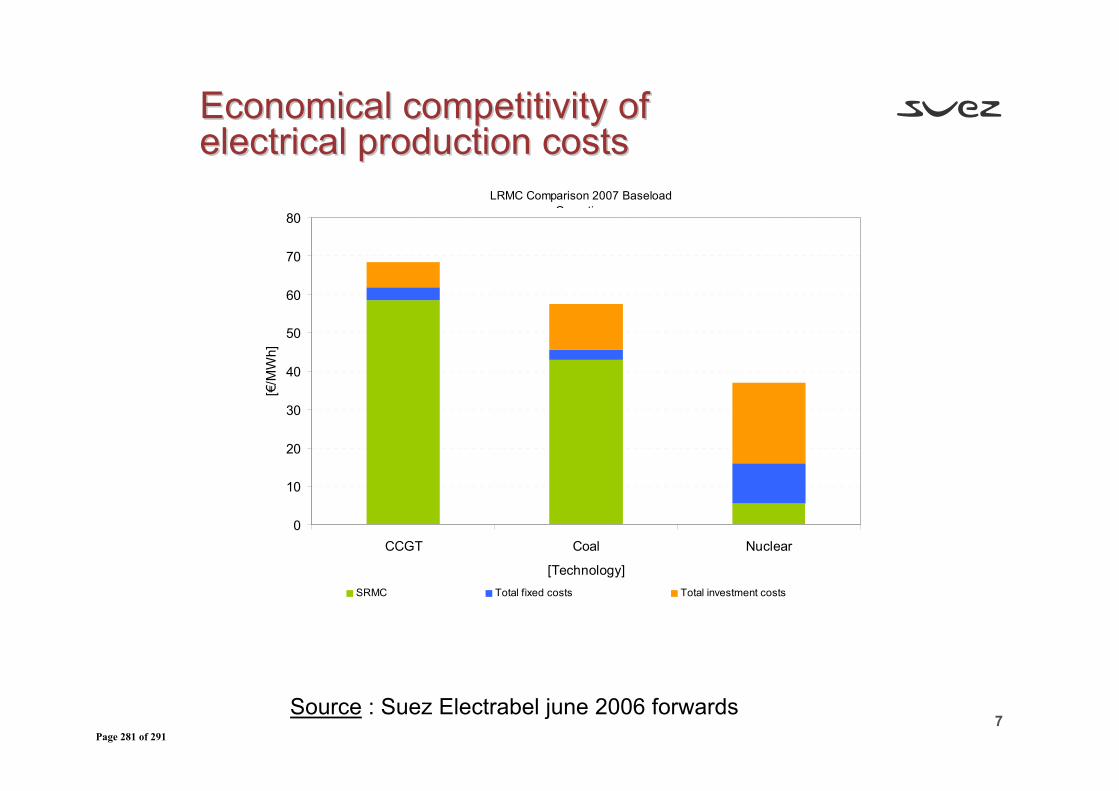
7
0
10
20
30
40
50
60
70
80
CCGT Coal Nuclear
[Technology]
[€/M
Wh]
SRMC Total fixed costs Total investment costs
LRMC Comparison 2007 Baseload O ti
Economical competitivity Economical competitivity of of electricalelectrical production production costscosts
Source : Suez Electrabel june 2006 forwardsPage 281 of 291
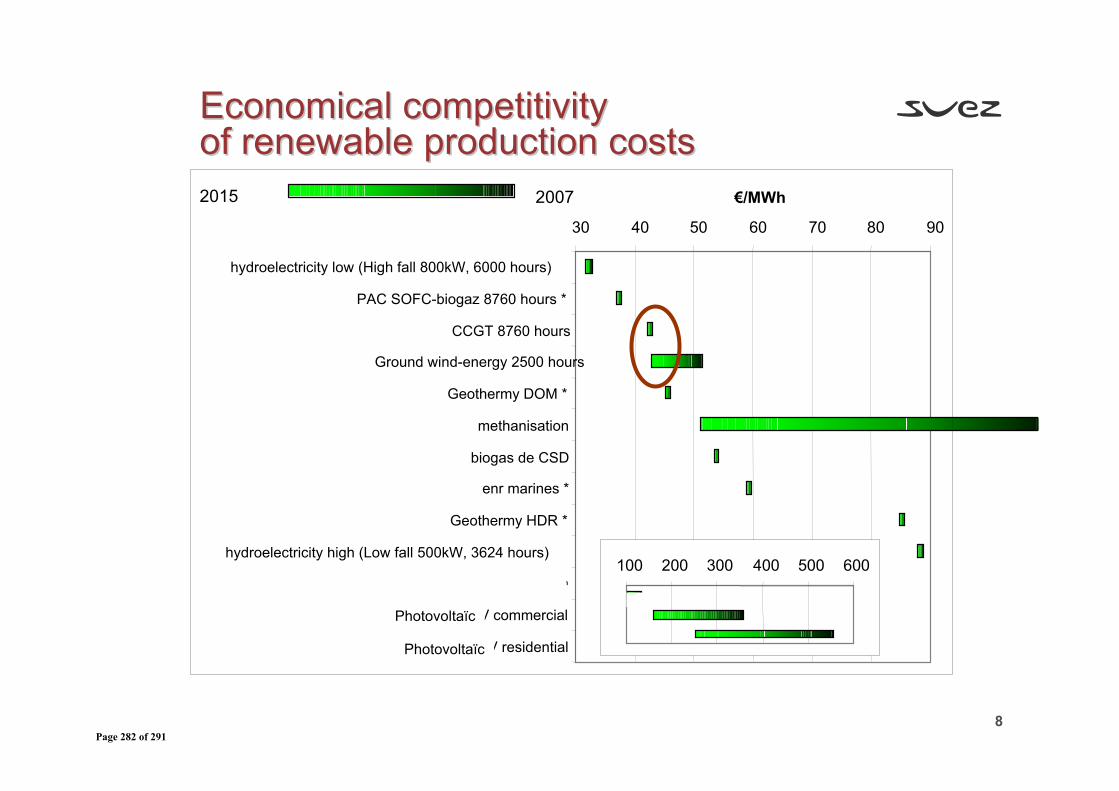
8
Economical competitivityEconomical competitivityof of renewable renewable production production costscosts
30 40 50 60 70 80 90
hydroelectricity low (High fall 800kW, 6000 hours)
PAC SOFC-biogaz 8760 hours *
CCGT 8760 hours
Ground wind-energy 2500 hours
Geothermy DOM *
methanisation
biogas de CSD
enr marines *
Geothermy HDR *
hydroelectricity high (Low fall 500kW, 3624 hours)
codigestion
PV commercial
PV residential
€/MWh2015 2007
100 200 300 400 500 600
Photovoltaïc
Photovoltaïc
Page 282 of 291
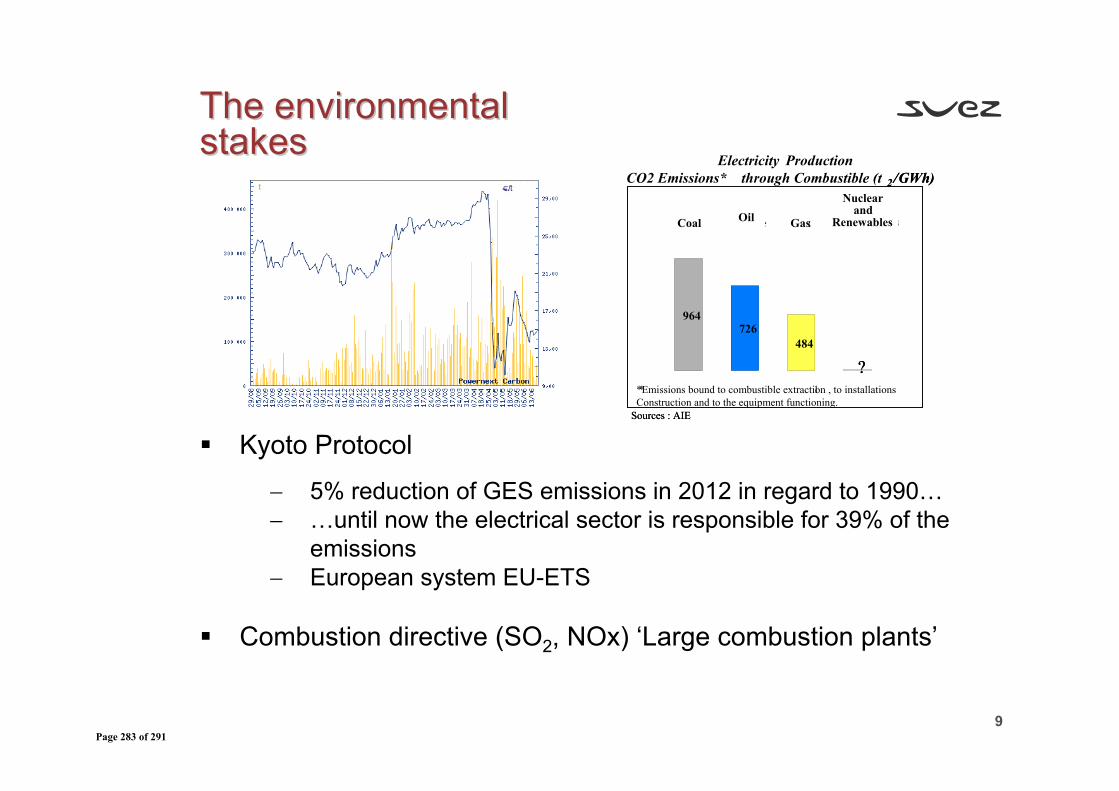
9
The environmental The environmental stakesstakes
Kyoto Protocol
− 5% reduction of GES emissions in 2012 in regard to 1990…− …until now the electrical sector is responsible for 39% of the
emissions − European system EU-ETS
Combustion directive (SO2, NOx) ‘Large combustion plants’
726484
964
?
726484
964
?
Sources : AIE
Electricity ProductionCO2 Emissions* through Combustible (t 2 /GWh)
Pétrole Gaz
Nucléaireet
Renouvelables
* l
Sources : AIE
2/GWh)
Coal Oil Gas
Nuclearand
Renewables
*Emissions bound to combustible extraction , to installationsConstruction and to the equipment functioning.
Page 283 of 291
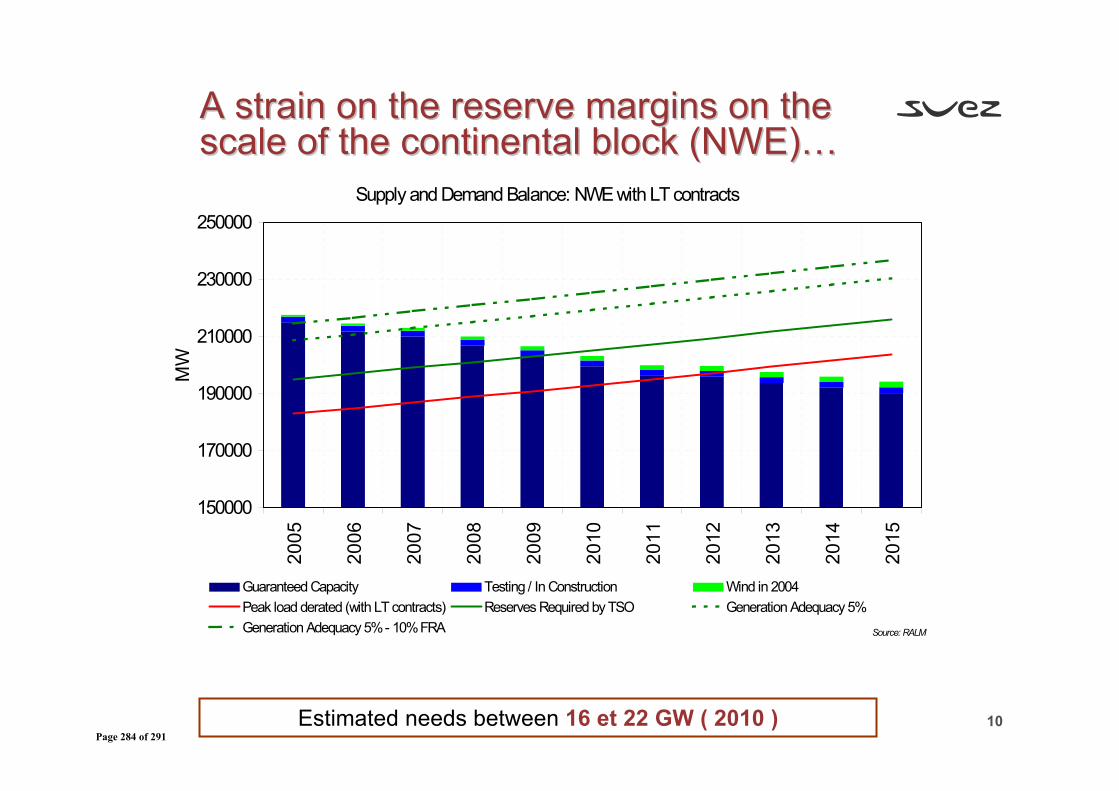
10
A A strain strain on on the reserve margins the reserve margins on on thethescale scale of of the the continental block (NWE)…continental block (NWE)…
Supply and Demand Balance: NWE with LT contracts
150000
170000
190000
210000
230000
250000
2005
2006
2007
2008
2009
2010
2011
2012
2013
2014
2015
MW
Guaranteed Capacity Testing / In Construction Wind in 2004Peak load derated (with LT contracts) Reserves Required by TSO Generation Adequacy 5%Generation Adequacy 5% - 10% FRA Source: RALM
Estimated needs between 16 et 22 GW ( 2010 )Page 284 of 291
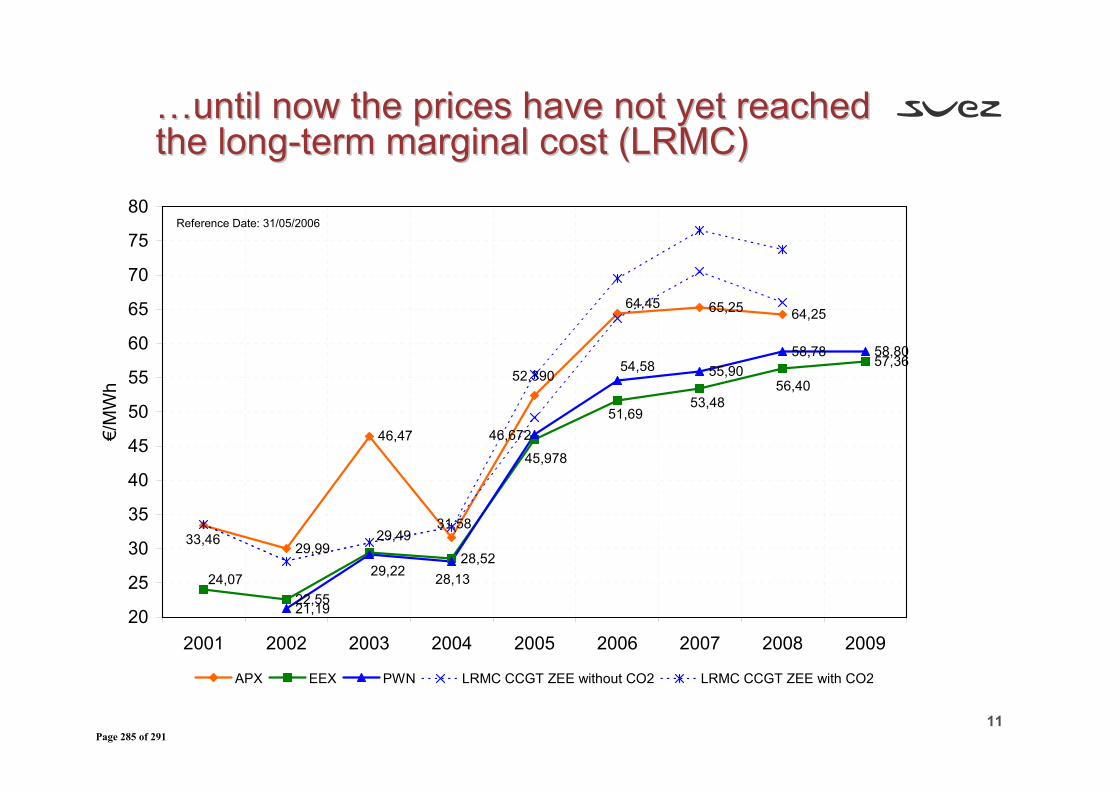
11
……until nowuntil now the prices the prices have not have not yet reached yet reached thethe longlong--term term marginal marginal costcost (LRMC)(LRMC)
29,99
46,47
65,25 64,25
22,55
28,52
57,36
21,19
55,9058,78 58,80
64,45
52,390
31,5833,46
45,978
51,6953,48
56,40
29,49
24,07
54,58
46,672
29,22 28,13
20
25
30
35
40
45
50
55
60
65
70
75
80
2001 2002 2003 2004 2005 2006 2007 2008 2009
€/M
Wh
APX EEX PWN LRMC CCGT ZEE without CO2 LRMC CCGT ZEE with CO2
Reference Date: 31/05/2006
Page 285 of 291
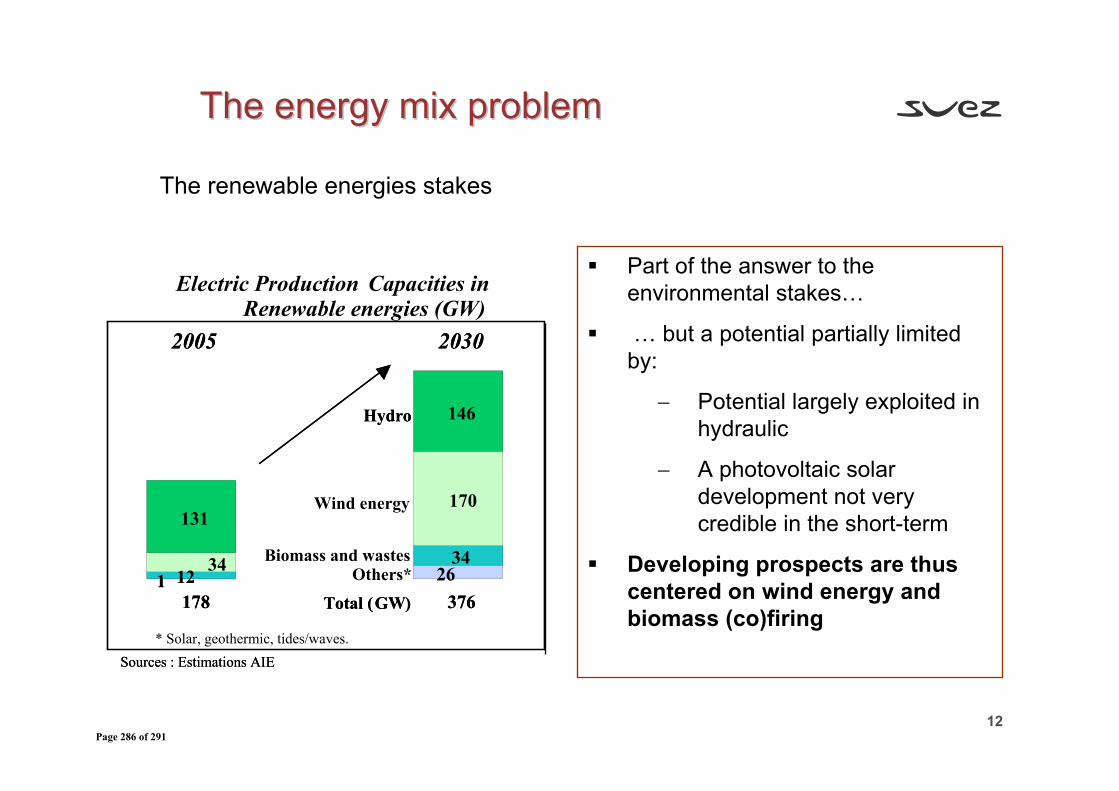
12
The energy mix problemThe energy mix problem
131
146
26134
12
170
34
2005 2030
178 376
Sources : Estimations AIE
Electric Production Capacities in Renewable energies (GW)
Total (GW)
Others*Biomass and wastes
Wind energy
Hydro
* Solar, geothermic, tides/waves.
131
146
26134
12
170
34
2005 2030
178 376
Sources : Estimations AIE
Total (GW)
Hydro
Part of the answer to theenvironmental stakes…
… but a potential partially limited by:
− Potential largely exploited in hydraulic
− A photovoltaic solar development not very credible in the short-term
Developing prospects are thus centered on wind energy and biomass (co)firing
The renewable energies stakes
Page 286 of 291
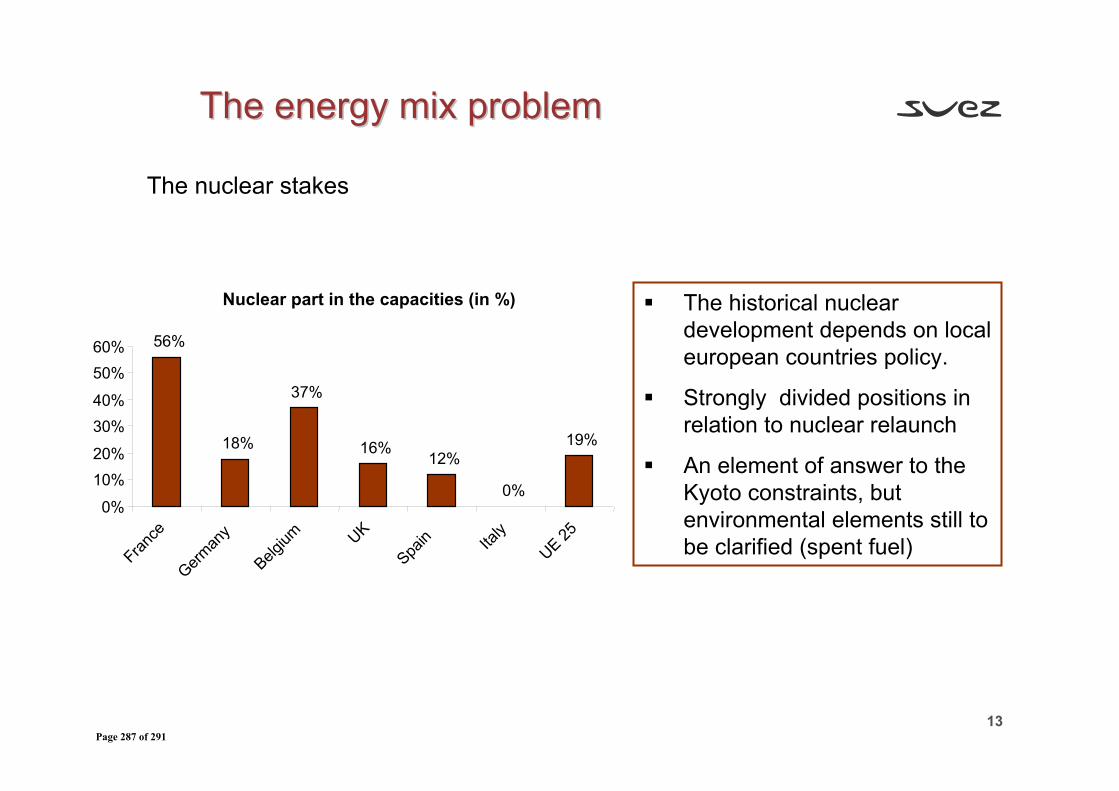
13
The energyThe energy mix problemmix problem
The historical nuclear development depends on localeuropean countries policy.
Strongly divided positions in relation to nuclear relaunch
An element of answer to the Kyoto constraints, but environmental elements still to be clarified (spent fuel)
The nuclear stakes
0%
10%20%
30%40%
50%60%
Nuclear part in the capacities (in %)
56%
18%
37%
16%12%
0%
19%
France
German
y
Belgium UK
Spain Ita
ly
UE 25
Page 287 of 291
14
The fossil energy stakes
A contribution that remains important for the countries who choose to abandon the nuclear…
Major stakes in terms of R&D needed to assure the competitivity of this technology → Zero Emission Technology problem
− Integration of the technologies in the working of the existingpower plants (i.e Tests-projects)
− Increase of the efficiency of the coal power plants
− Reduction of the costs of the captation/sequestration technologies
The energy mix problemThe energy mix problem
Page 288 of 291
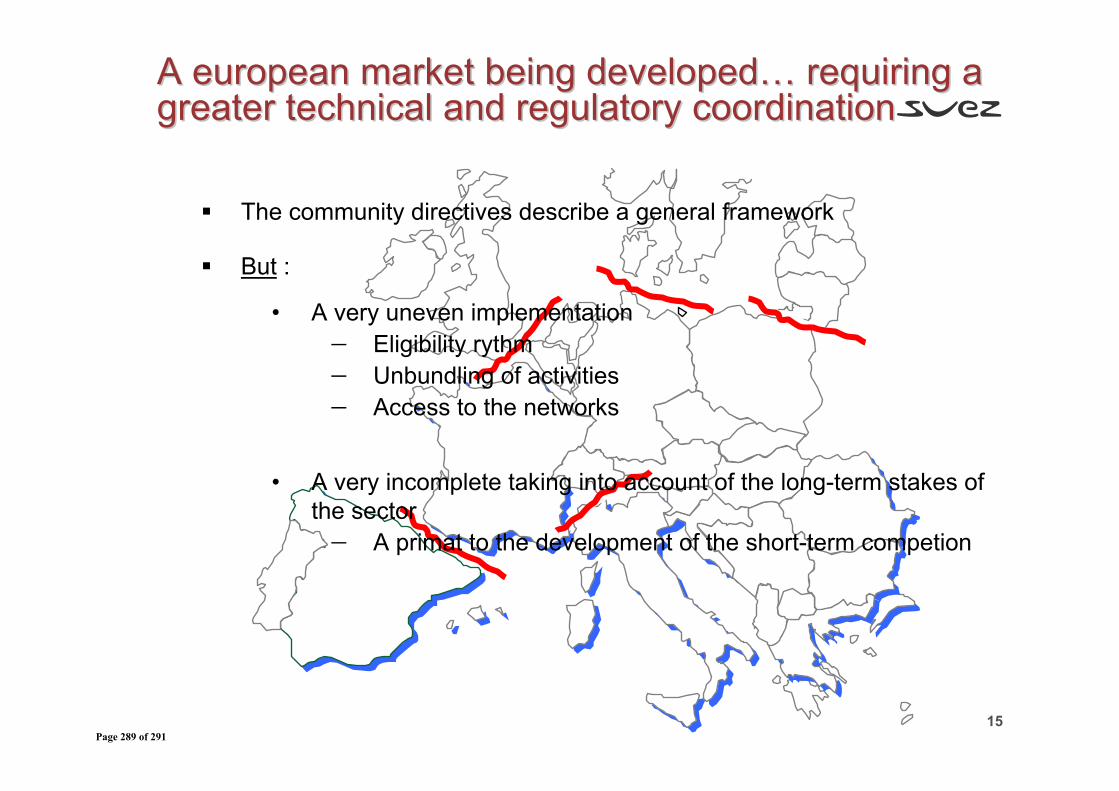
15
The community directives describe a general framework
But :
• A very uneven implementation− Eligibility rythm− Unbundling of activities− Access to the networks
• A very incomplete taking into account of the long-term stakes of the sector− A primat to the development of the short-term competion
A A european marketeuropean market beingbeing developeddeveloped… … requiring requiring a a greater technical and regulatory greater technical and regulatory coordinationcoordination
Page 289 of 291
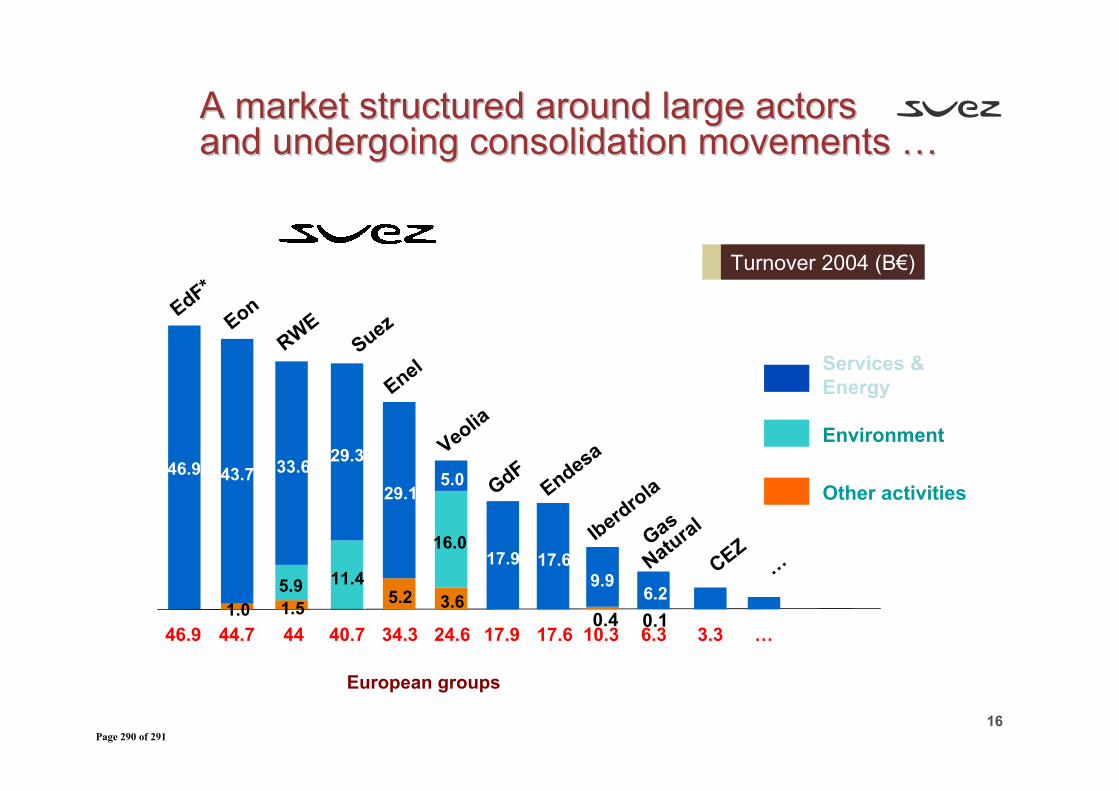
16
A A marketmarket structured around structured around large large actors actors andand undergoingundergoing consolidation consolidation movementsmovements ……
Turnover 2004 (B€)Turnover 2004 (B€)
40.746.9 4444.7 34.3 24.6 17.9 17.60.4
10.30.16.3
EdF*
RWEEon
Enel
Veolia
GdF
Iberdrola
Gas
NaturalEndesa
Services &Energy
Environment
Other activities
11.4
29.346.9
1.55.9
33.6
1.0
43.7
5.2
29.1
3.6
16.0
5.0
17.99.9
6.2
17.6
European groups
Suez
CEZ
3.3
…
…
Page 290 of 291
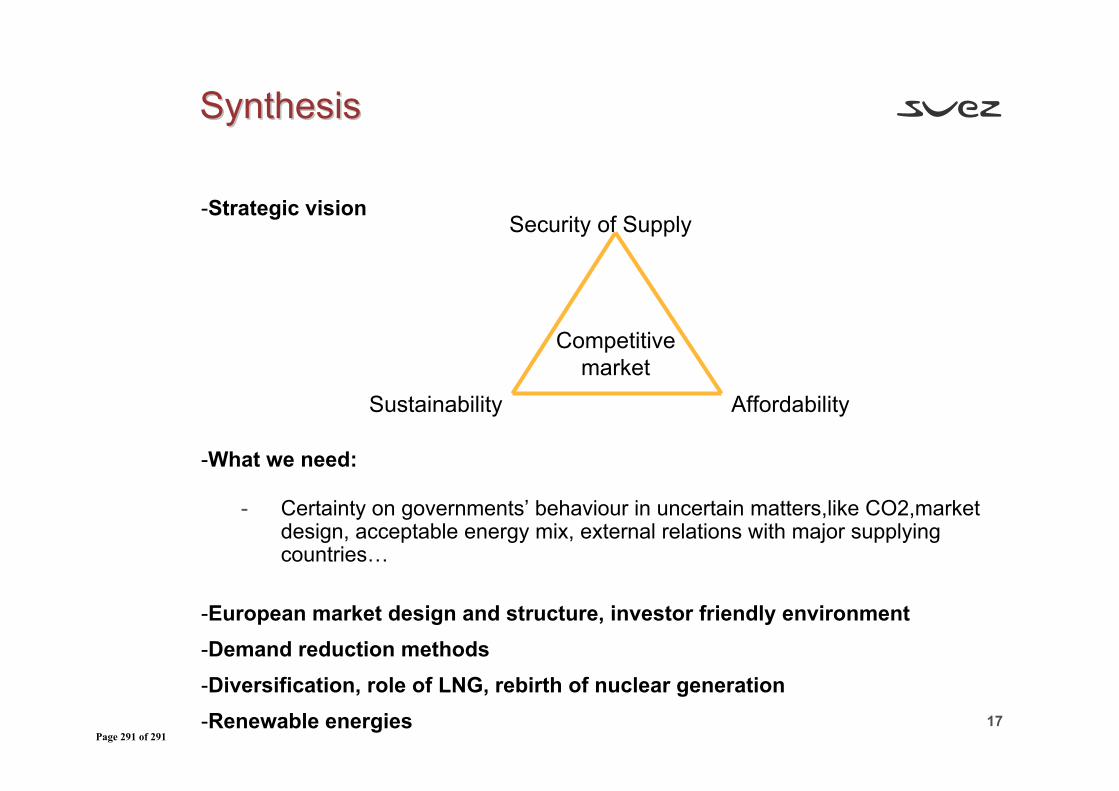
17
-Strategic vision
-What we need:
- Certainty on governments’ behaviour in uncertain matters,like CO2,market design, acceptable energy mix, external relations with major supplying countries…
-European market design and structure, investor friendly environment-Demand reduction methods-Diversification, role of LNG, rebirth of nuclear generation-Renewable energies
SynthesisSynthesis
Security of Supply
AffordabilitySustainability
Competitivemarket
Page 291 of 291