Embed Size (px)
Citation preview

Worksite nutrition and physical activity: assessing readiness for change among employees of a
large manufacturing facility
Sharon Sugerman, MS, RD, FADA, Public Health Institute
Cancer Prevention & Nutrition Section
October 23, 2001
Worksite - key channel for health promotion for adults
• On workdays, spend more non-sleeping hours at work than at any other single place
• Eat 1-2 meals/day in or near the worksite environment
• Co-worker relationships reinforce social norms

Opportunities Afforded
• Exposure to worksite environment• Provide a baseline
– fruit/vegetable consumption– fruit/vegetable attitudes, beliefs/barriers– physical activity
• Assess fruit/vegetable stage of change• Provide direction for possible future
intervention

The Survey (Q1)
• On average, how many servings of fruits and vegetables do you eat each day? That’s a combined total of both fruits and vegetables.
0 1 2 3 4 5 6 7 8 9 10+

The Survey (Q2)
• About how long have you been eating this number of fruits and vegetables?
– Less than 1 month– 1-3 months – 4-6 months– Longer than 6 months

Intake and Stages of Change
(Q3 and Q4)
• Are you seriously thinking about eating more servings of fruits and vegetables starting sometime in the next six months?
Yes No
• Are you planning to eat more servings of fruits and vegetables during the next month?
Yes No
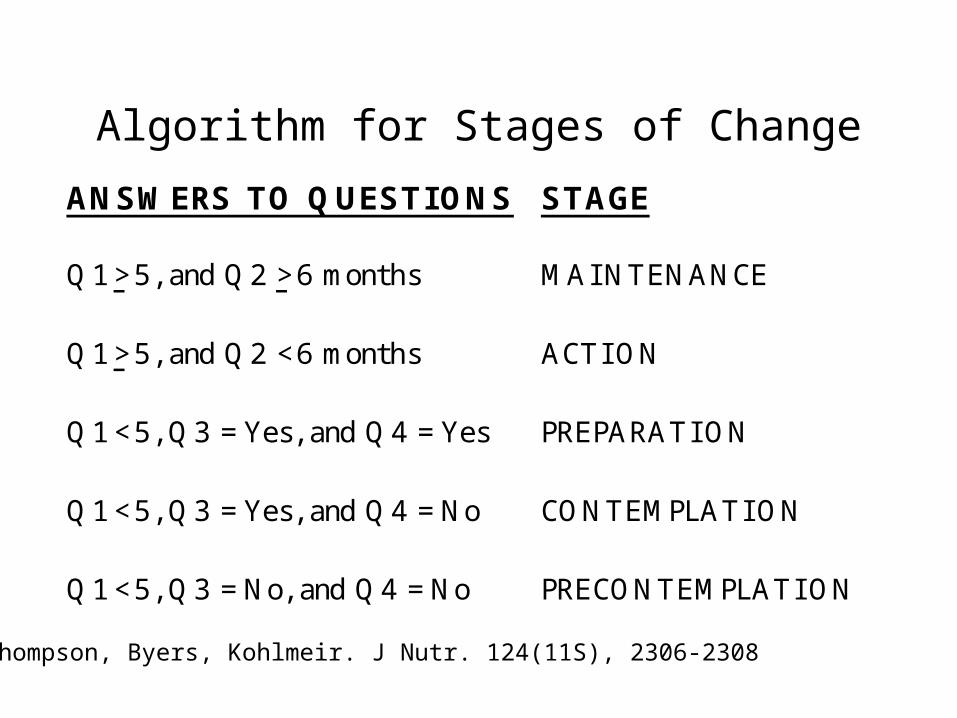
Algorithm for Stages of Change
ANSWERS TO QUESTIONS STAGE
Q1 > 5, and Q2 > 6 months MAI NTENANCE
Q1 > 5, and Q2 < 6 months ACTI ON
Q1 < 5, Q3 = Yes, and Q4 = Yes PREPARATI ON
Q1 < 5, Q3 = Yes, and Q4 = No CONTEMPLATI ON
Q1 < 5, Q3 = No, and Q4 = No PRECONTEMPLATI ON
Thompson, Byers, Kohlmeir. J Nutr. 124(11S), 2306-2308

Physical Activity
• On average, how many times per week do you exercise?
0 1 2 3 4 5 or more
• On average, how many minutes per session do you exercise?
0-9 10-19 20-2930-39 40-49 50 or more

Demographics (1)
• N = 733 (15% of workers)
• Race/ethnicity
– 43% White– 23% African-American– 16% Asian/Pacific Islander– 15% Hispanic– 3% Other

Demographics (2)
• Age/Age Group– Mean age 46– 60% 35-50– 30% 51-64
• Income Group– 18% < $50K– 50% $50K-$65K– 31% $65K+
• Gender– 34% Female– 66% Male
• Education Group– 26%
• High school or less
– 41% • Some college
– 33% • 4-year degree+
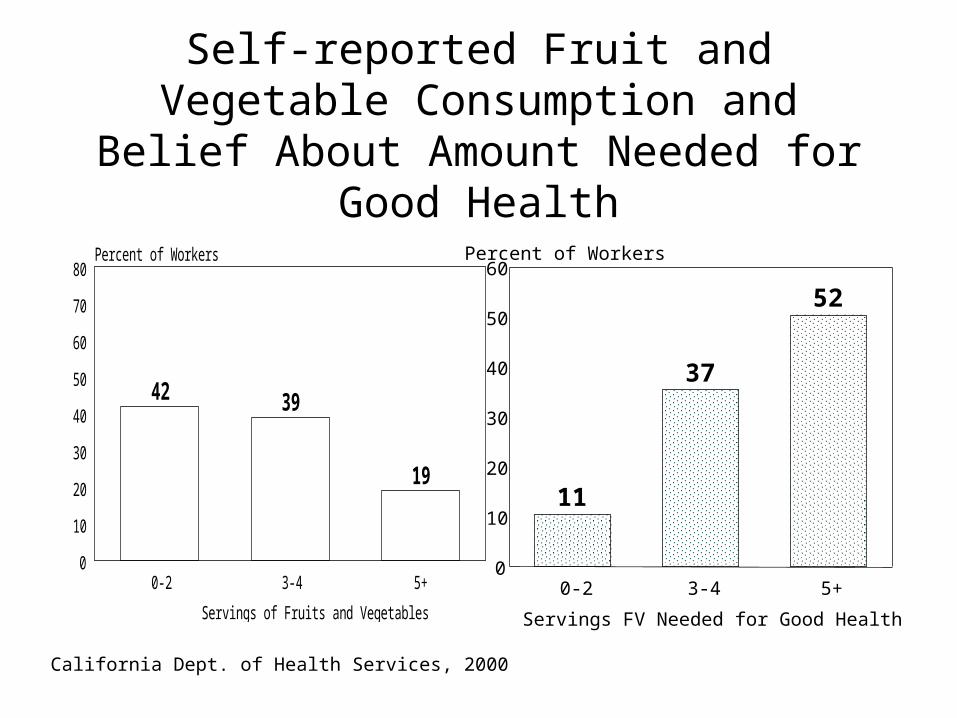
Self-reported Fruit and Vegetable Consumption and Belief About
Amount Needed for Good Health
11
37
52
0-2 3-4 5+
Servings FV Needed for Good Health
0
10
20
30
40
50
60Percent of Workers
California Dept. of Health Services, 2000
42 39
19
0-2 3-4 5+
Servings of Fruits and Vegetables
0
10
20
30
40
50
60
70
80Percent of Workers

Self-reported consumption of fruits and vegetables, by age group
3.1
4.1
3.1 3.1
TotalAge 25-34
Age 35-50Age 51-64
0
0.5
1
1.5
2
2.5
3
3.5
4
4.5
5
5.5Mean servings of fruits and vegetables
**
**p < .01
California Dept. of Health Services, 2000
5 a Day goal

Stages of Change
112
68
315
PrecontemplationContemplation
PreparationAction
Maintenance
Stage of Change
0
10
20
30
40
50
60
70
80
90
100Percent of Workers
California Dept. of Health Services, 2000

Belief in Number of Servings Needed Was Associated with Increased
Consumption of Fruits and Vegetables
Servings Reported,***
percent of workersServingsbelieved
Percent ofworkersbelieving
0-2 3-4 5+
0-2 11 82 16 3
3-4 37 55 38 7
5+***p < .001
53 25 44 30

Belief Was Highly Related to Stage of Change
Servings Believed,percent of workers
STAGE*** 0-2 3-4 5+
Precontemplation& Contemplation
19 11 12
Preparation 80 82 58Maintenance &Action***p < .01
1 6 30

Physical Activity
• “Adequate” - 8%• “Inadequate - 92%
AdequateInadequate
• Age 25-34- 20%** 80% • Age 35-50- 7% 93%• Age 51-64- 7% 93%
**p < .01

Relationship Between Adequate Exercise and Fruit/Vegetable
Consumption
***p < .001California Dept. of Health Services, 2000
***
29 31
4143 40
17
0-2 3-4 5+
Reported Servings F/V
0
10
20
30
40
50
60
70Percent of survey participants
Adequate Exercise Inadequate Exercise

Most Significant Factors Related to Total Fruit and Vegetable
Consumption
• After controlling for demographics, two factors contributed unique components in terms of predicting the dependent variable
– Belief in number of servings for good health– Adequate vs. inadequate exerciser
• The model accounts for 31.1% of the variance in fruit/vegetable intake

Leading Reasons for Not Eating More Fruits and Vegetables
34
29
18
118
Not used to eating themHard to get at work
Hard to get eating outToo expensive
Don't know how to fix0
5
10
15
20
25
30
35
40Percent of workers
California Dept. of Health Services, 2000

Leading Reasons for Not Eating More Fruits and Vegetables
by Amount Reported***
48
27
3
23
34
40
1418
30
811
17
710 10
Eats 0-2 FV/dayEats 3-4 FV/day
Eats 5+ FV/day0
10
20
30
40
50
60
70Percent of workers
Not used to eating Hard to get-work Hard to get-eating out
Too expensive Don't know how to fix
***p < .001California Dept. of Health Services, 2000

Preferred source for health information
• Electronic and Print Media 30%
• Doctor’s office 30%
• At work 20%
• Grocery store 10%

Using Stages of Change for Dietary Intervention: Preparation
• Key strategies– Resolve ambivalence– Develop firm commitment and specific
action plan
• Treatment “do’s”– Encourage clients to set specific, achievable
goals– Reinforce small changes client may have
already achieved Adapted from Kristal et al. JADA; 99 (6); 684
Using Stages of Change for Dietary Intervention: Preparation
• Treatment “don’ts”– Not using this as a time to recommend
general behavior change, i.e. “eat more fruits and vegetables”
– Not downgrading small changes that have already been made
Adapted from Kristal et al. JADA; 99 (6); 684

5 a Day Worksite Campaign:Next Steps (1)
• Formative research
• Literature search– successful programs – gaps– barriers– potential partners
• Roundtables & key informant interviews with gatekeepers/employers of large numbers of low and middle-income employees

5 a Day Worksite Campaign:Next Steps (2)
Developmental Research
• Funding an individualized, on-line screening, assessment and delivery of tailored messages for increasing F/V and decreasing fat intake in worksite setting

Sharon B. SugermanPublic Health Institute
PO Box 942732, MS-662Sacramento, CA 94234-7320
916-324-3059 (phone)916-322-1532 (fax)