Embed Size (px)
Citation preview
World Agricultural Outlook Board Interagency Commodity Estimates Committee Forecasts
Lockup Briefing
July 11, 2014
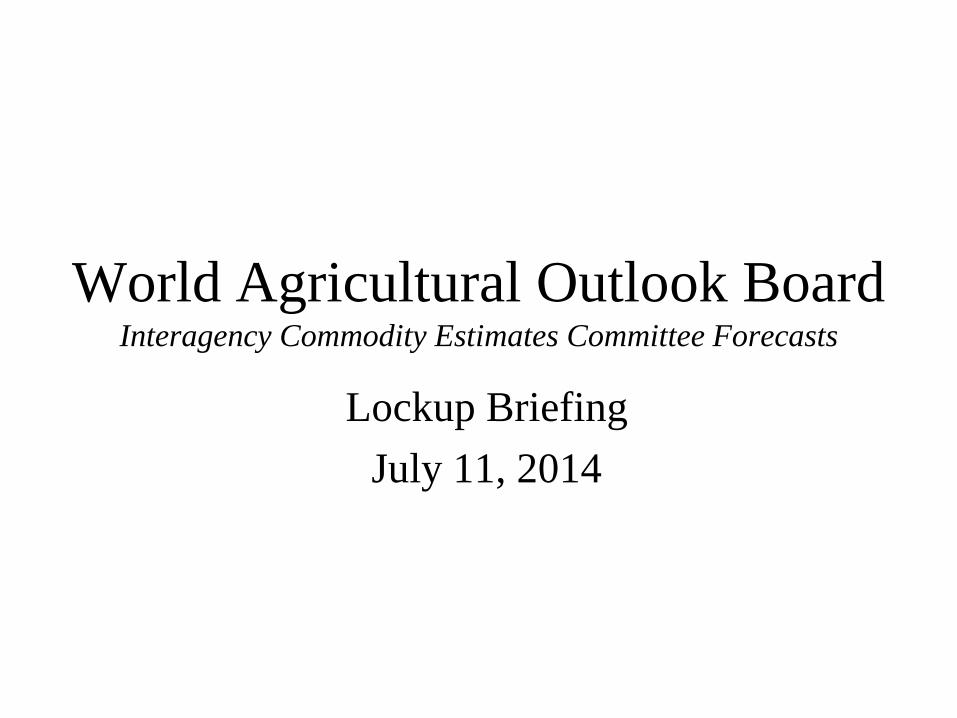
World Wheat Production
July 11, 2014
Country or Region
2013/14
estimate
2014/15
forecast
Change from
June 11
Change from
2013/14
Million Tons Percent Percent
World 714.2 705.2 0.5 -1.3
United States 58.0 54.2 2.6 -6.5
Foreign 656.2 651.0 0.3 -0.8
Argentina 10.5 12.5 0.0 19.0
Canada 37.5 28.0 -1.8 -25.3
Australia 27.0 26.0 2.0 -3.8
European Union 143.3 147.9 1.1 3.2
Russia 52.1 53.0 0.0 1.7
Ukraine 22.3 21.0 5.0 -5.7
Kazakhstan 13.9 13.5 -6.9 -3.2
China 121.9 124.0 0.0 1.7
India 93.5 95.9 0.0 2.5
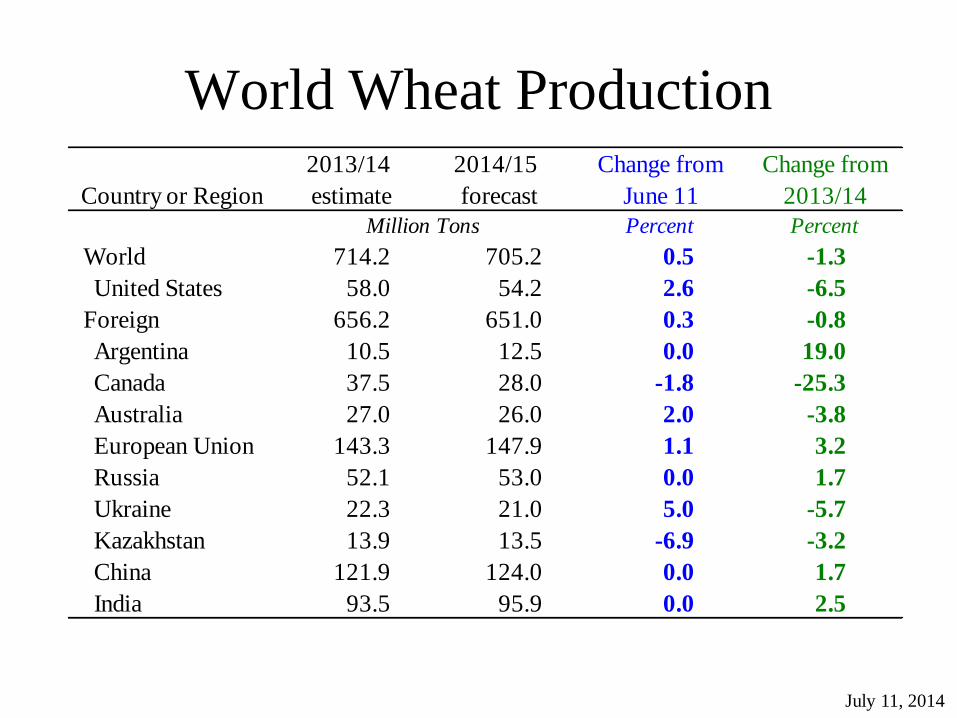
Wheat is grown across much of
Europe, with the big hitters being
France, U.K., Germany, and Poland.
The EU collectively is the globe’s
largest wheat producer.
July 11, 2014
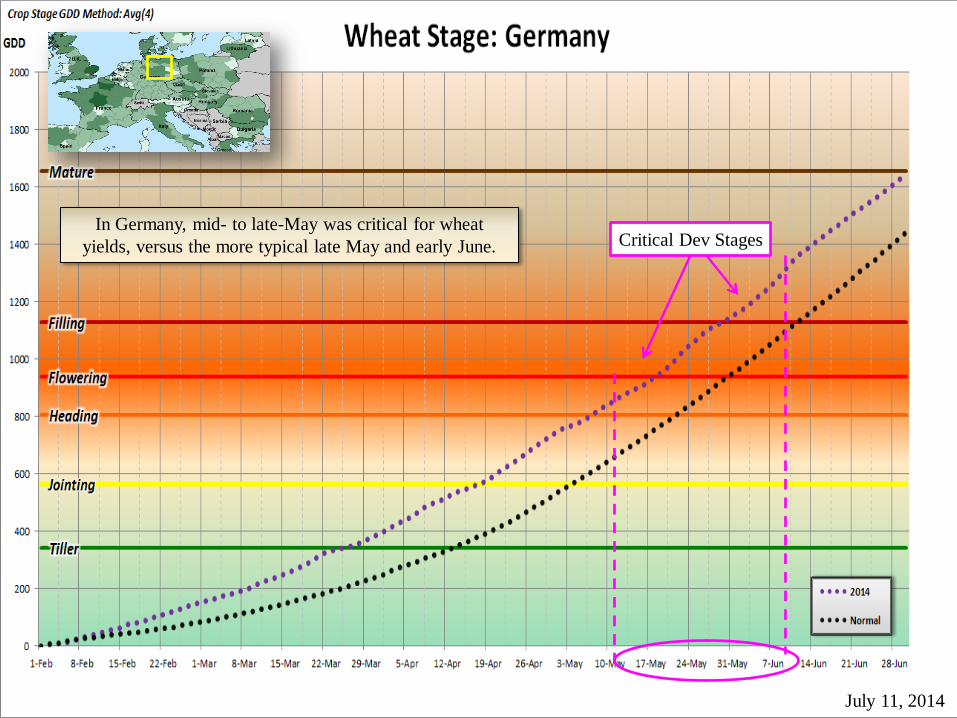
In Germany, mid- to late-May was critical for wheat
yields, versus the more typical late May and early June. Critical Dev Stages
July 11, 2014
France
U.K.
Germany
Poland
Hungary Romania
Spain
Italy
Czech
Slovakia
Austria Switz
Serbia
Neth.
Bel.
Port.
Greece
Ireland
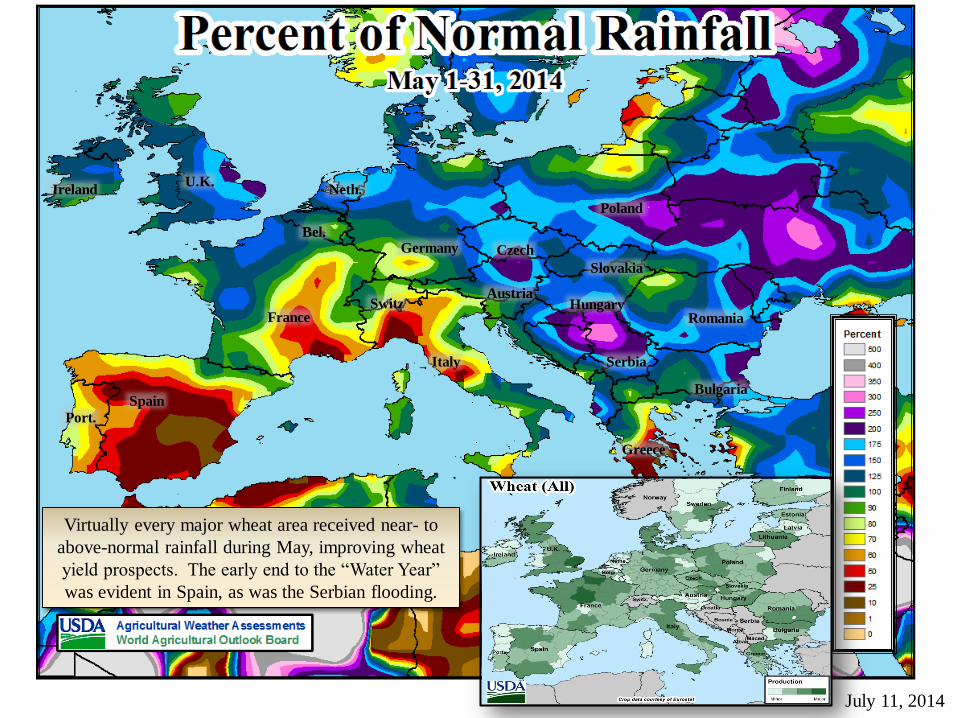
Virtually every major wheat area received near- to
above-normal rainfall during May, improving wheat
yield prospects. The early end to the “Water Year”
was evident in Spain, as was the Serbian flooding.
Bulgaria
July 11, 2014

6
June Crop Travel in Germany
Confirms a Large Wheat Crop
July 11, 2014

Wheat Production Changes
July 2014
July 11, 2014
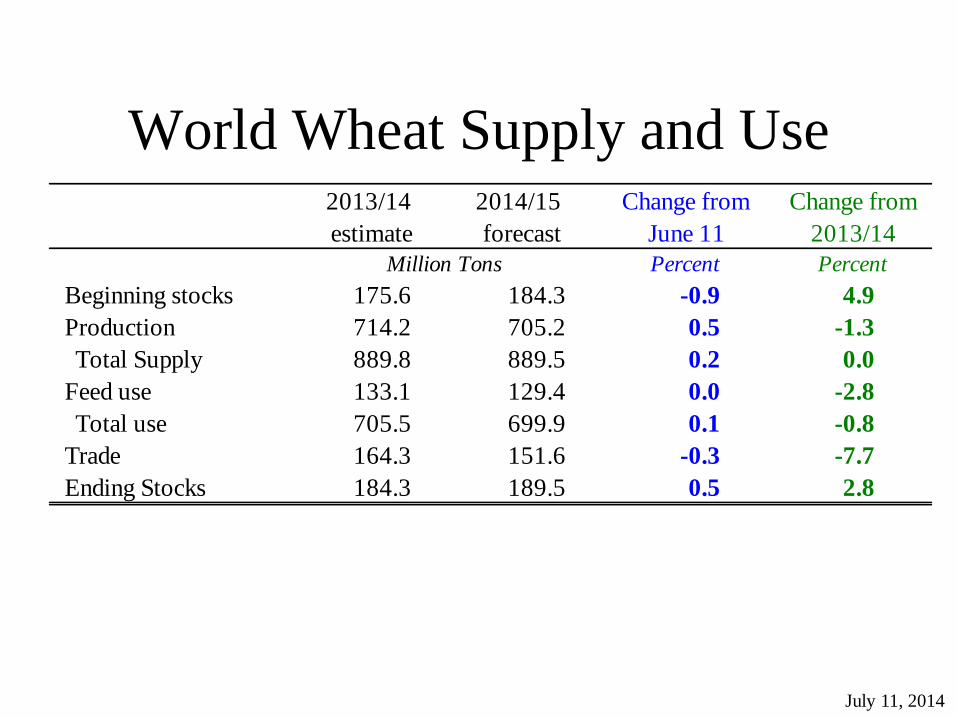
World Wheat Supply and Use
July 11, 2014
2013/14
estimate
2014/15
forecast
Change from
June 11
Change from
2013/14
Million Tons Percent Percent
Beginning stocks 175.6 184.3 -0.9 4.9
Production 714.2 705.2 0.5 -1.3
Total Supply 889.8 889.5 0.2 0.0
Feed use 133.1 129.4 0.0 -2.8
Total use 705.5 699.9 0.1 -0.8
Trade 164.3 151.6 -0.3 -7.7
Ending Stocks 184.3 189.5 0.5 2.8

U.S. Wheat Supply and Demand
July 11, 2014
2013/14
estimate
2014/15
forecast
Change from
June 11
Change from
2013/14
Percent Percent
Planted area (million acres) 56.2 56.5 1.2 0.6
Harvested area (million acres) 45.2 46.2 0.7 2.4
Yield (bushels per acre) 47.2 43.1 1.9 -8.7
Million bushels
Beginning stocks 718 590 -0.6 -17.9
Production 2,130 1,992 2.6 -6.5
Imports 168 160 0.0 -4.9
Total supply 3,016 2,741 1.7 -9.1
Food use 950 960 0.0 1.1
Seed 77 76 0.0 -1.0
Feed and residual 217 145 -9.4 -33.3
Domestic use 1,244 1,181 -1.3 -5.1
Exports 1,182 900 -2.7 -23.8
Total use 2,426 2,081 -1.9 -14.2
Ending stocks 590 660 15.1 12.0
Percent
Stocks to use ratio 24.3 31.7
Dollars per bushel
Average market price 6.87 6.00/7.20 -5.7 -3.9

World Corn Production
July 11, 2014
Country or Region
2013/14
estimate
2014/15
forecast
Change from
June 11
Change from
2013/14
Million Tons Percent Percent
World 984.4 981.0 0.0 -0.4
United States 353.7 352.1 -0.5 -0.5
Foreign 630.7 628.9 0.3 -0.3
Argentina 24.0 26.0 0.0 8.3
Brazil 78.0 74.0 0.0 -5.1
Mexico 21.9 22.5 0.0 2.7
Canada 14.2 11.6 -7.2 -18.3
European Union 64.6 65.6 0.6 1.7
FSU-12 47.0 44.2 -0.1 -6.0
Ukraine 30.9 27.0 0.0 -12.6
Russia 11.6 13.0 0.0 11.7
South Africa 14.5 13.5 0.0 -6.9
China 218.5 222.0 0.9 1.6
India 24.2 22.0 0.0 -9.1

Brazil 2013/14 Corn Production First-season compared to second-season
First-season Corn Planting began in September
2013.
Crop is harvested.
Some damage from heat and
drought.
Corn production used by
livestock industry.
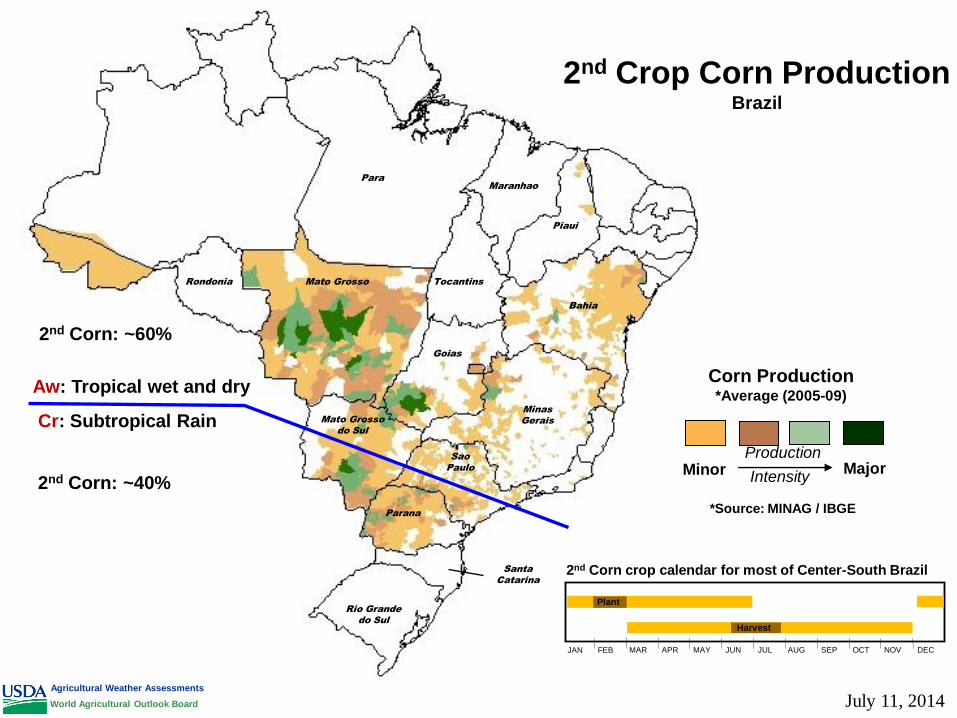
Second-season Corn Planting began in February
2014.
High cost of production and
low prices result in
unprofitability.
Rains in Parana, Mato Grosso
do Sul, Goias, and Mato
Grosso have increased yield
potential.
Corn production for export
market.
July 11, 2014
Major
Corn Production *Average (2005-09)
Intensity
Production Minor
*Source: MINAG / IBGE
2nd Crop Corn Production Brazil
Rio Grande
do Sul
Santa
Catarina
Mato Grosso
Bahia
Mato Grosso
do Sul
Parana
Sao
Paulo
Minas
Gerais
Goias
Tocantins
Maranhao
Piaui
Para
Rondonia
JAN FEB MAR APR MAY JUN JUL AUG SEP OCT NOV DEC
2nd Corn crop calendar for most of Center-South Brazil
Plant
Harvest
Cr: Subtropical Rain
Aw: Tropical wet and dry
2nd Corn: ~40%
2nd Corn: ~60%
Agricultural Weather Assessments
World Agricultural Outlook Board July 11, 2014

2.00
2.50
3.00
3.50
4.00
4.50
5.00
5.50
6.00
2003 2004 2005 2006 2007 2008 2009 2010 2011 2012 2013
Metr
ic T
on
s P
er
Hecta
re (
mT
/ha)
Mato Grosso *2nd Crop Corn Yields
Observed Predicted
2011: Above-normal rainfall, then
early end to season
Source: IBGE/CONAB
May 1 – June 10
Agricultural Weather Assessments
World Agricultural Outlook Board July 11, 2014

2.00
2.50
3.00
3.50
4.00
4.50
5.00
5.50
6.00
2003 2004 2005 2006 2007 2008 2009 2010 2011 2012 2013
Metr
ic T
on
s P
er
Hecta
re (
mT
/ha)
Mato Grosso *2nd Crop Corn Yields
Observed Predicted
2013: Above-normal rainfall, then
scattered showers in May
Source: IBGE/CONAB
May 1 – June 10
Agricultural Weather Assessments
World Agricultural Outlook Board July 11, 2014
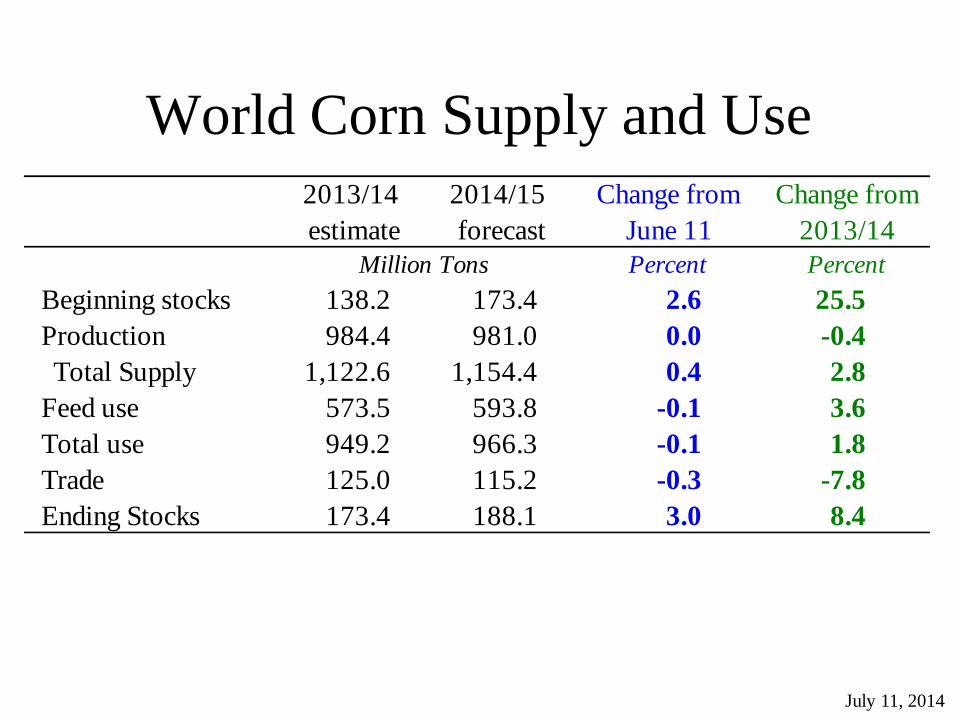
World Corn Supply and Use
July 11, 2014
2013/14
estimate
2014/15
forecast
Change from
June 11
Change from
2013/14
Million Tons Percent Percent
Beginning stocks 138.2 173.4 2.6 25.5
Production 984.4 981.0 0.0 -0.4
Total Supply 1,122.6 1,154.4 0.4 2.8
Feed use 573.5 593.8 -0.1 3.6
Total use 949.2 966.3 -0.1 1.8
Trade 125.0 115.2 -0.3 -7.8
Ending Stocks 173.4 188.1 3.0 8.4
July 11, 2014
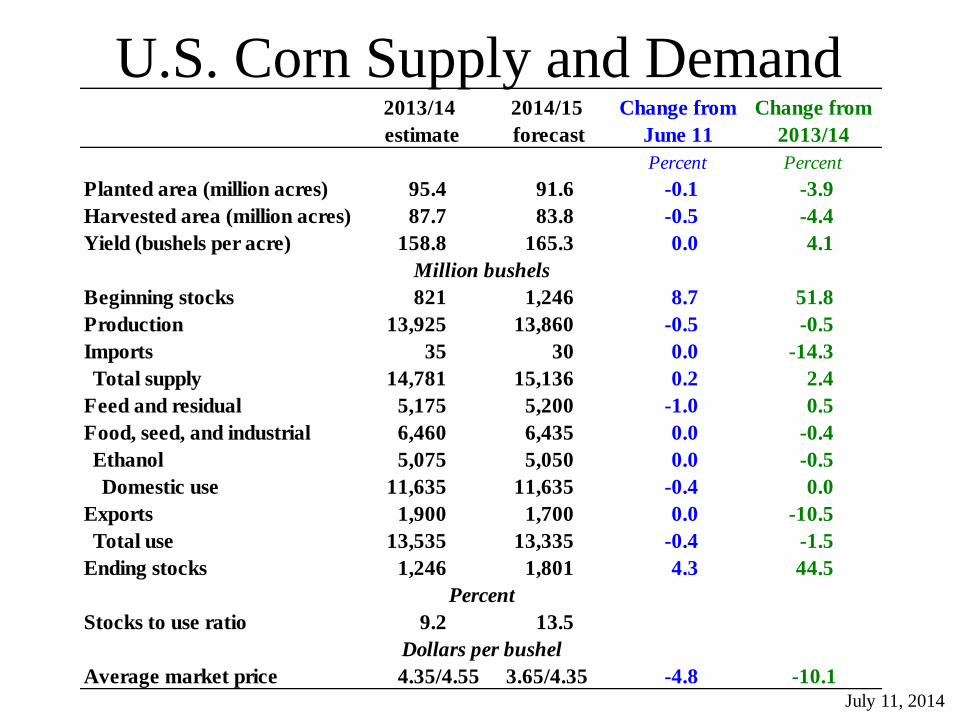
U.S. Corn Supply and Demand
July 11, 2014
2013/14
estimate
2014/15
forecast
Change from
June 11
Change from
2013/14
Percent Percent
Planted area (million acres) 95.4 91.6 -0.1 -3.9
Harvested area (million acres) 87.7 83.8 -0.5 -4.4
Yield (bushels per acre) 158.8 165.3 0.0 4.1
Million bushels
Beginning stocks 821 1,246 8.7 51.8
Production 13,925 13,860 -0.5 -0.5
Imports 35 30 0.0 -14.3
Total supply 14,781 15,136 0.2 2.4
Feed and residual 5,175 5,200 -1.0 0.5
Food, seed, and industrial 6,460 6,435 0.0 -0.4
Ethanol 5,075 5,050 0.0 -0.5
Domestic use 11,635 11,635 -0.4 0.0
Exports 1,900 1,700 0.0 -10.5
Total use 13,535 13,335 -0.4 -1.5
Ending stocks 1,246 1,801 4.3 44.5
Percent
Stocks to use ratio 9.2 13.5
Dollars per bushel
Average market price 4.35/4.55 3.65/4.35 -4.8 -10.1
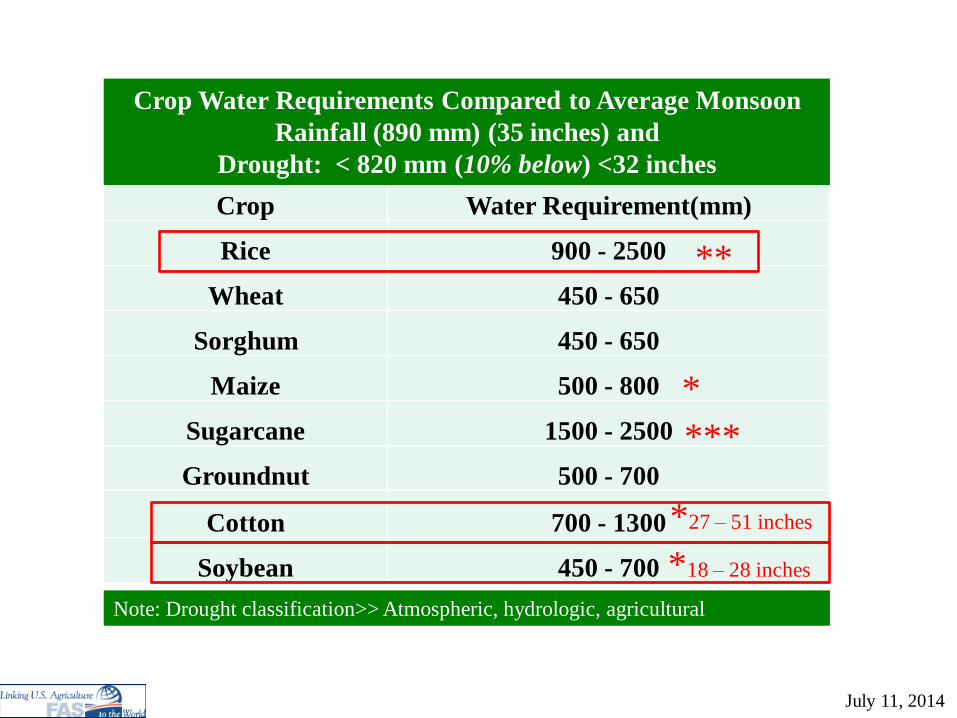
Crop Water Requirement(mm)
Rice 900 - 2500
Wheat 450 - 650
Sorghum 450 - 650
Maize 500 - 800
Sugarcane 1500 - 2500
Groundnut 500 - 700
Cotton 700 - 1300
Soybean 450 - 700
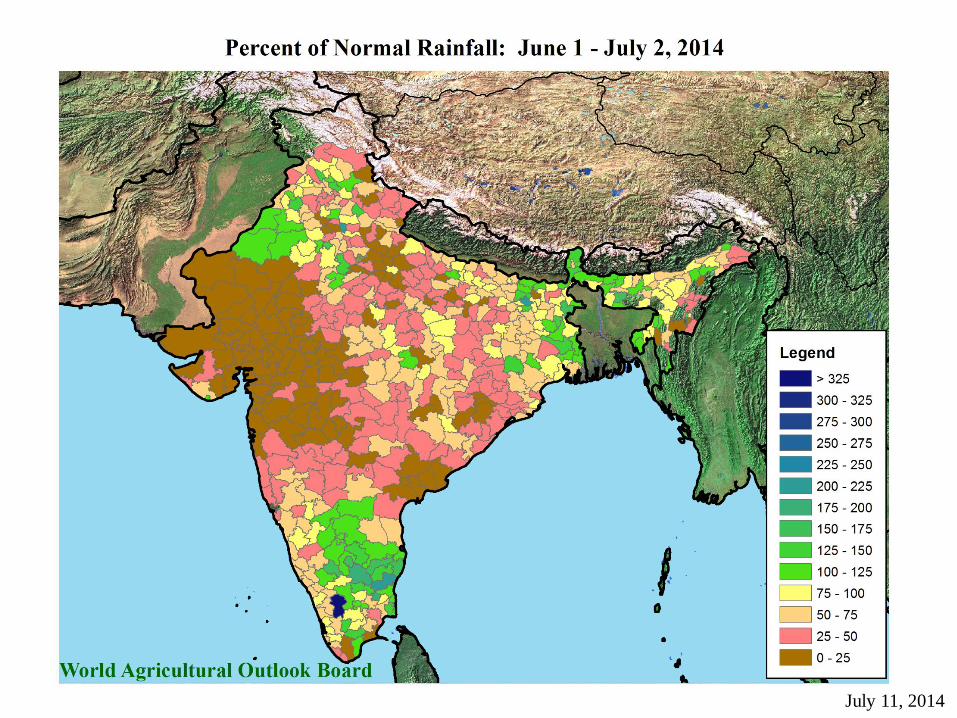
Crop Water Requirements Compared to Average Monsoon
Rainfall (890 mm) (35 inches) and
Drought: < 820 mm (10% below) <32 inches
**
***
*27 – 51 inches
*
Note: Drought classification>> Atmospheric, hydrologic, agricultural
*18 – 28 inches
July 11, 2014

July 11, 2014
July 11, 2014
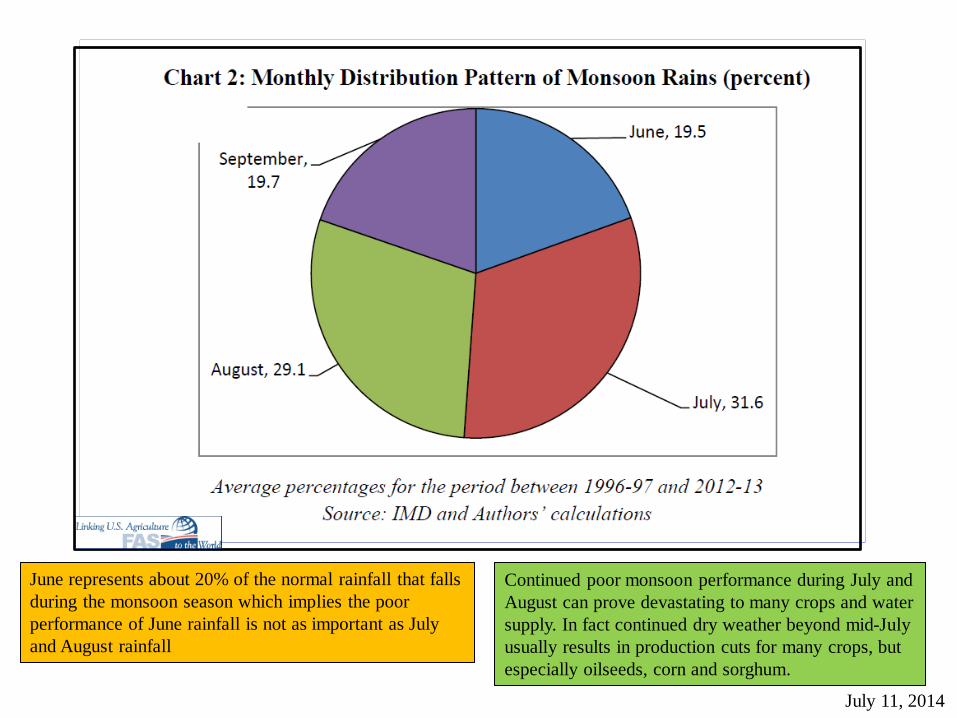
Continued poor monsoon performance during July and
August can prove devastating to many crops and water
supply. In fact continued dry weather beyond mid-July
usually results in production cuts for many crops, but
especially oilseeds, corn and sorghum.
June represents about 20% of the normal rainfall that falls
during the monsoon season which implies the poor
performance of June rainfall is not as important as July
and August rainfall
July 11, 2014
July 11, 2014

42% of rice crop is
experiencing below –normal
rainfall (<=75%).
July 11, 2014
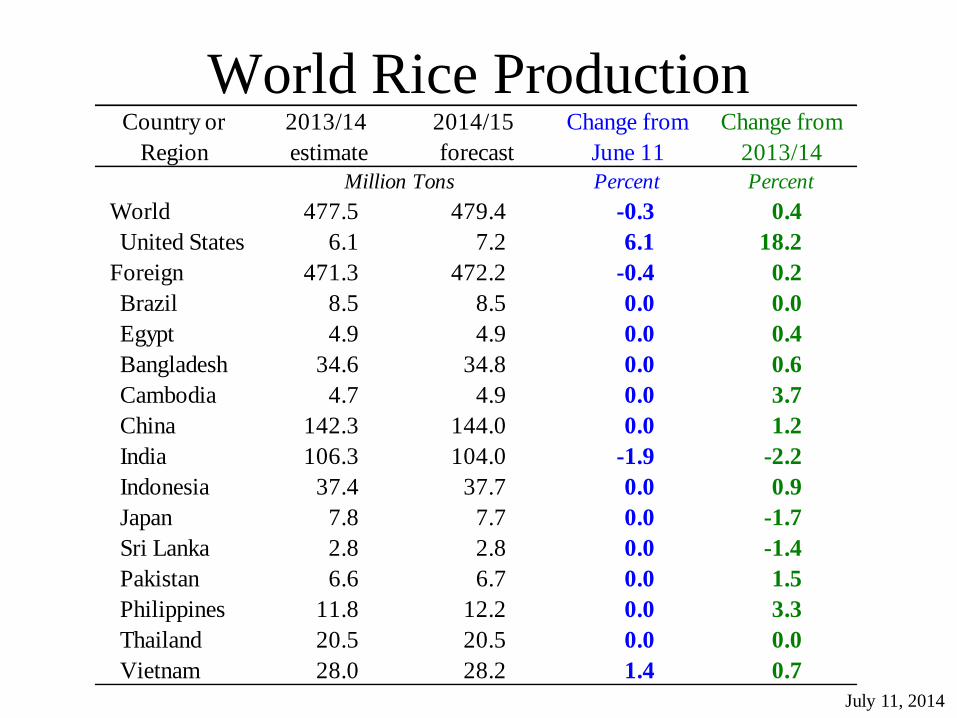
World Rice Production
July 11, 2014
Country or
Region
2013/14
estimate
2014/15
forecast
Change from
June 11
Change from
2013/14
Million Tons Percent Percent
World 477.5 479.4 -0.3 0.4
United States 6.1 7.2 6.1 18.2
Foreign 471.3 472.2 -0.4 0.2
Brazil 8.5 8.5 0.0 0.0
Egypt 4.9 4.9 0.0 0.4
Bangladesh 34.6 34.8 0.0 0.6
Cambodia 4.7 4.9 0.0 3.7
China 142.3 144.0 0.0 1.2
India 106.3 104.0 -1.9 -2.2
Indonesia 37.4 37.7 0.0 0.9
Japan 7.8 7.7 0.0 -1.7
Sri Lanka 2.8 2.8 0.0 -1.4
Pakistan 6.6 6.7 0.0 1.5
Philippines 11.8 12.2 0.0 3.3
Thailand 20.5 20.5 0.0 0.0
Vietnam 28.0 28.2 1.4 0.7

World Rice Supply and Use
July 11, 2014
2013/14
estimate
2014/15
forecast
Change from
June 11
Change from
2013/14
Million Tons, milled Percent Percent
Beginning stocks 109.9 111.5 -0.5 1.5
Production 477.5 479.4 -0.3 0.4
Total Supply 587.4 590.9 -0.3 0.6
Total use 475.8 482.4 0.0 1.4
Trade 40.7 41.6 0.4 2.1
Ending Stocks 111.5 108.5 -1.9 -2.7

U.S. Rice Supply and Demand Rough Equivalent of Rough and Milled Rice
July 11, 2014
2013/14
estimate
2014/15
forecast
Change from
June 11
Change from
2013/14
Percent Percent
Planted area (million acres) 2.49 3.05 5.9 22.4
Harvested area (million acres) 2.47 3.03 6.1 22.6
Yield (pounds per acre) 7,694 7,469 0.0 -2.9
Million cwt
Beginning stocks 36.4 32.8 1.5 -9.9
Production 189.9 226.0 6.1 19.0
Imports 23.0 21.0 -4.5 -8.7
Total supply 249.3 279.8 4.7 12.2
Domestic use 123.0 133.0 3.9 8.1
Exports 93.5 107.0 4.9 14.4
Total use 216.5 240.0 4.3 10.9
Ending stocks 32.8 39.8 6.7 21.3
Percent
Stocks to use ratio 15.2 16.6
Dollars per cwt
Average market price 16.10 13.50/14.50 -6.0 -13.0

98% of soybean crop is experiencing
below–normal rainfall (<=75%)
July 11, 2014

World Soybean Production
July 11, 2014
Country or
Region
2013/14
estimate
2014/15
forecast
Change from
June 11
Change from
2013/14
Million Tons Percent Percent
World 283.9 304.8 1.6 7.4
United States 89.5 103.4 4.5 15.5
Foreign 194.4 201.4 0.2 3.6
Argentina 54.0 54.0 0.0 0.0
Brazil 87.5 91.0 0.0 4.0
Paraguay 8.1 8.2 0.0 1.2
Ukraine 2.8 3.5 9.4 26.2
India 11.0 11.6 -3.3 5.5
China 12.2 12.0 0.0 -1.6
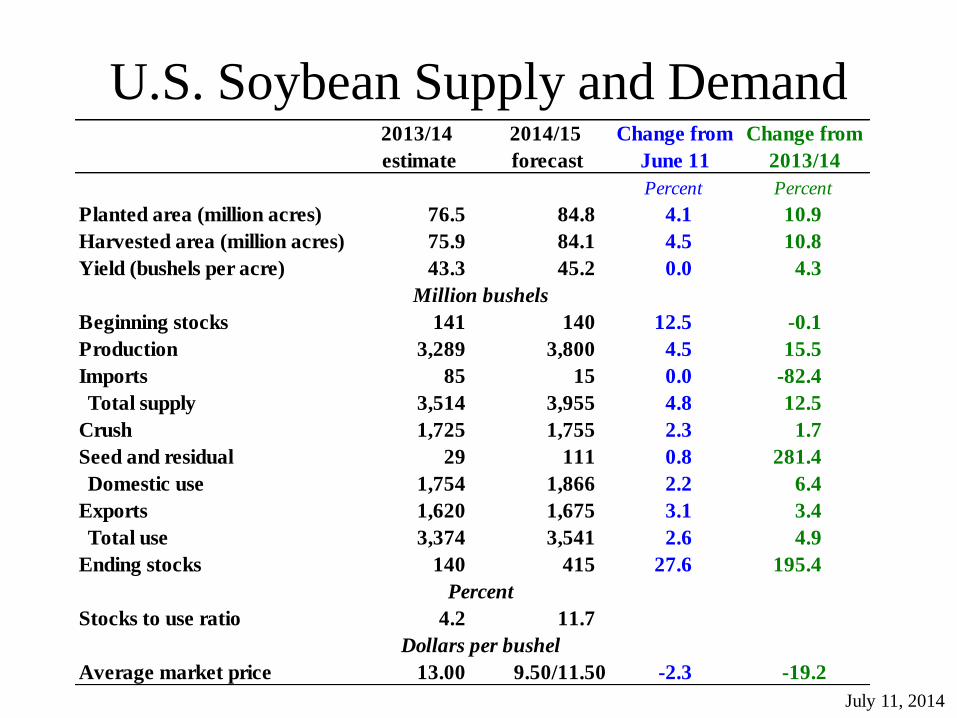
U.S. Soybean Supply and Demand
July 11, 2014
2013/14
estimate
2014/15
forecast
Change from
June 11
Change from
2013/14
Percent Percent
Planted area (million acres) 76.5 84.8 4.1 10.9
Harvested area (million acres) 75.9 84.1 4.5 10.8
Yield (bushels per acre) 43.3 45.2 0.0 4.3
Million bushels
Beginning stocks 141 140 12.5 -0.1
Production 3,289 3,800 4.5 15.5
Imports 85 15 0.0 -82.4
Total supply 3,514 3,955 4.8 12.5
Crush 1,725 1,755 2.3 1.7
Seed and residual 29 111 0.8 281.4
Domestic use 1,754 1,866 2.2 6.4
Exports 1,620 1,675 3.1 3.4
Total use 3,374 3,541 2.6 4.9
Ending stocks 140 415 27.6 195.4
Percent
Stocks to use ratio 4.2 11.7
Dollars per bushel
Average market price 13.00 9.50/11.50 -2.3 -19.2
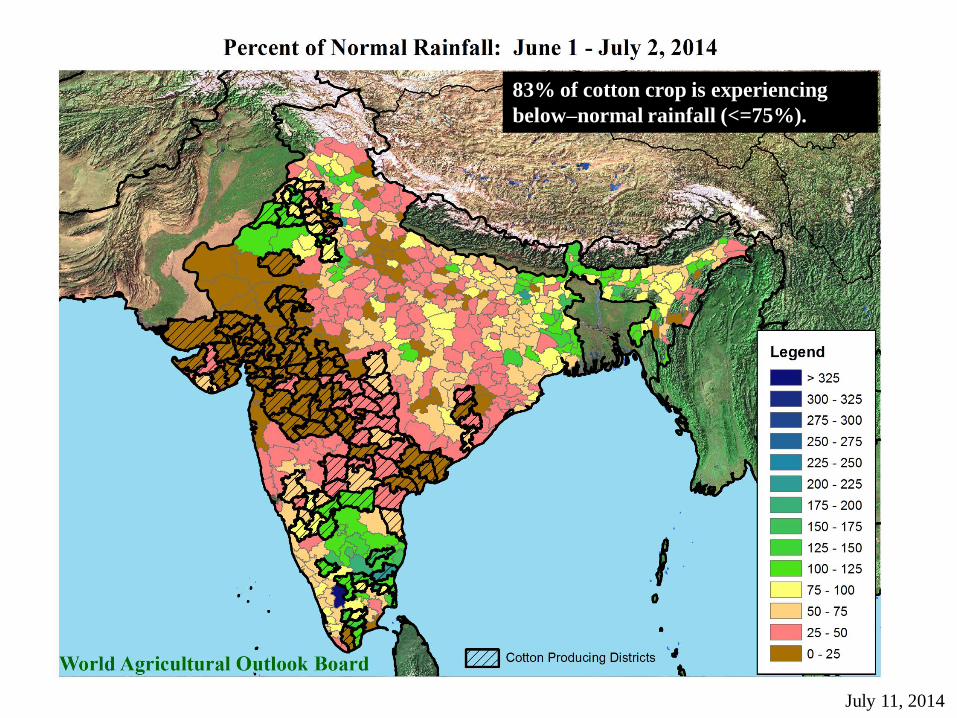
83% of cotton crop is experiencing
below–normal rainfall (<=75%).
July 11, 2014

World Cotton Production
July 11, 2014
Country or Region
2013/14
estimate
2014/15
forecast
Change from
June 11
Change from
2013/14
Million Bales Percent Percent
World 118.3 116.4 0.4 -1.6
United States 12.9 16.5 10.0 27.8
Foreign 105.4 99.9 -1.0 -5.2
Argentina 1.2 1.2 0.0 0.4
Brazil 7.8 8.0 -3.6 2.6
Turkey 2.3 2.9 0.0 26.1
Syria 0.6 0.3 0.0 -50.0
Australia 4.1 2.7 -12.9 -34.1
China 32.0 29.5 0.0 -7.8
India 30.5 28.0 -1.8 -8.2
Pakistan 9.5 9.5 0.0 0.0
Uzbekistan 4.2 4.2 0.0 1.2
African Franc Zone 4.2 4.1 0.0 -1.9
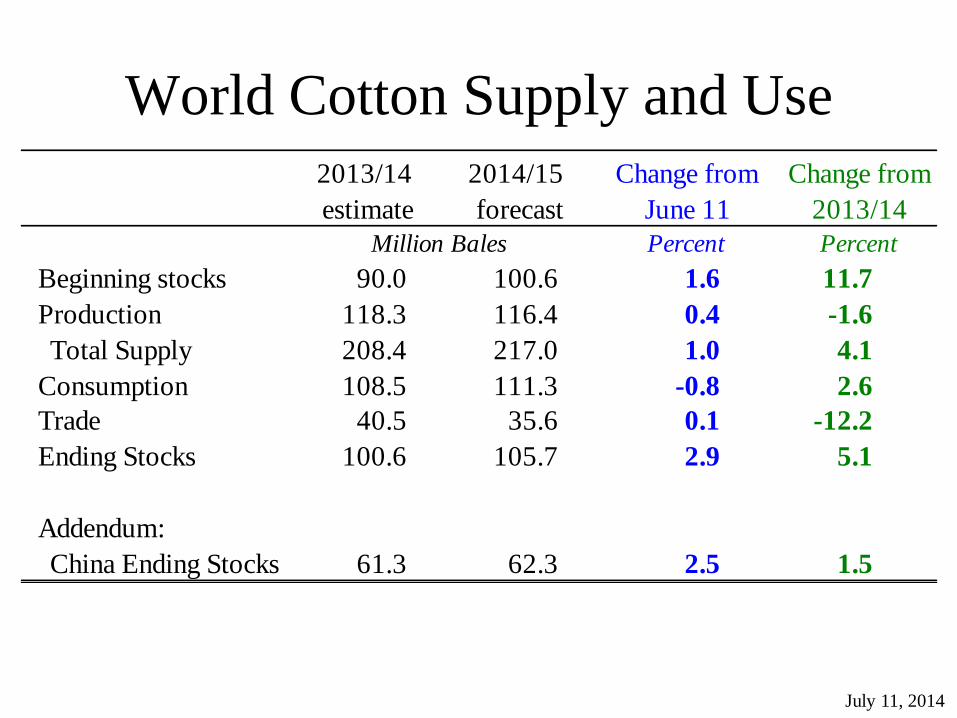
World Cotton Supply and Use
July 11, 2014
2013/14
estimate
2014/15
forecast
Change from
June 11
Change from
2013/14
Million Bales Percent Percent
Beginning stocks 90.0 100.6 1.6 11.7
Production 118.3 116.4 0.4 -1.6
Total Supply 208.4 217.0 1.0 4.1
Consumption 108.5 111.3 -0.8 2.6
Trade 40.5 35.6 0.1 -12.2
Ending Stocks 100.6 105.7 2.9 5.1
Addendum:
China Ending Stocks 61.3 62.3 2.5 1.5

U.S. Cotton Supply and Demand
July 11, 2014
2013/14
estimate
2014/15
forecast
Change from
June 11
Change from
2013/14
Percent Percent
Planted area (million acres) 10.41 11.37 2.4 9.2
Harvested area (million acres) 7.54 9.70 10.9 28.6
Yield (pounds per acre) 821 816 -0.9 -0.6
Million bales
Beginning stocks 3.90 2.70 0.0 -30.8
Imports 0.02 0.01 0.0 -33.3
Production 12.91 16.50 10.0 27.8
Total supply 16.82 19.21 8.5 14.2
Mill use 3.60 3.80 2.7 5.6
Exports 10.50 10.20 5.2 -2.9
Total use 14.10 14.00 4.5 -0.7
Unaccounted 0.02 0.01
Ending stocks 2.70 5.20 20.9 92.6
Percent
Stocks/use 19.1 37.1
Cents per pound
Average market price 77.5 60.0/76.0 -2.9 -12.3
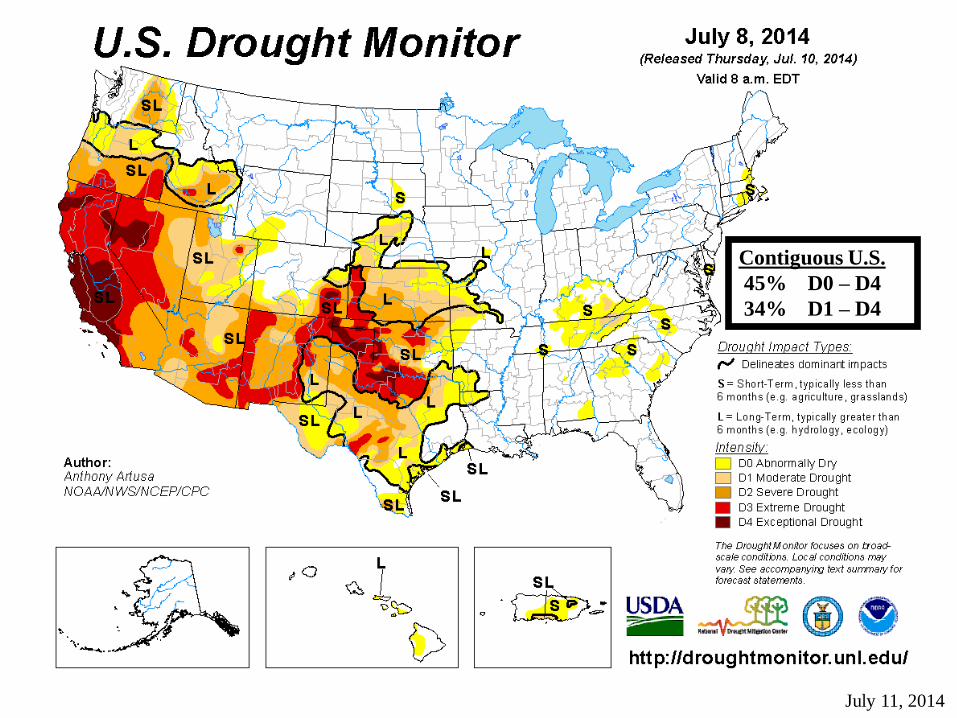
Contiguous U.S.
45% D0 – D4
34% D1 – D4
July 11, 2014

Subsoil Moisture for
Major Texas Cotton Districts as of July 6 - percent very short and short
0
10
20
30
40
50
1N 1S 2N 2S
% Very short
% Short
July 11, 2014 (Amarillo) (Lubbock) (Childress) (Abilene)

July 11, 2014
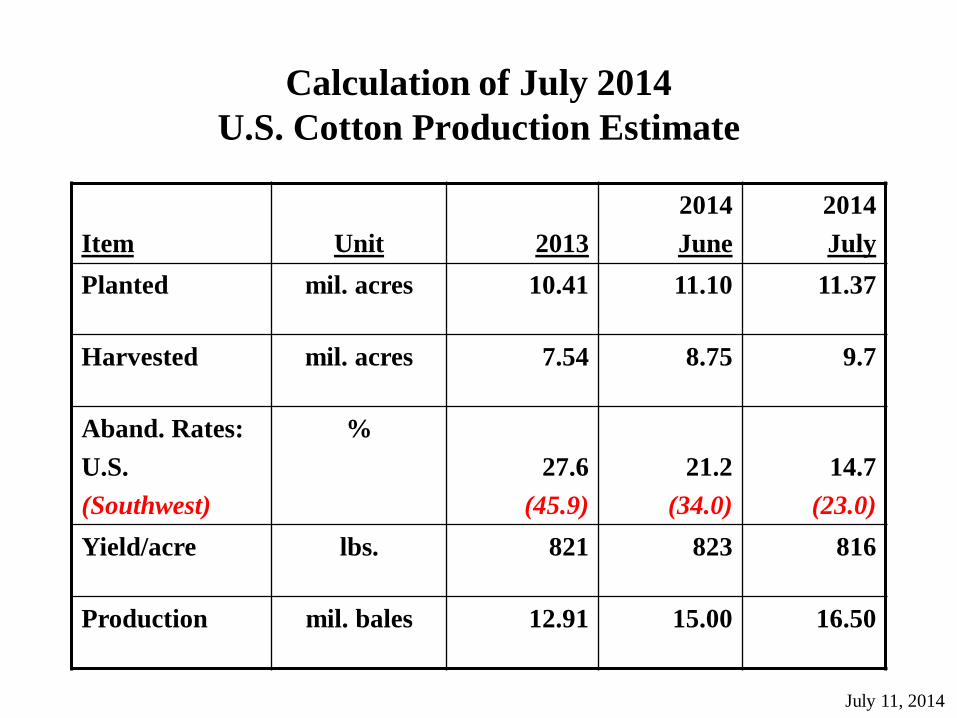
Calculation of July 2014
U.S. Cotton Production Estimate
Item
Unit
2013
2014
June
2014
July
Planted mil. acres 10.41 11.10 11.37
Harvested mil. acres 7.54 8.75 9.7
Aband. Rates:
U.S.
(Southwest)
%
27.6
(45.9)
21.2
(34.0)
14.7
(23.0)
Yield/acre lbs. 821 823 816
Production mil. bales 12.91 15.00 16.50
July 11, 2014

Mexico Sugar Supply and Demand
July 11, 2014
2013/14
estimate
2014/15
forecast
Change from
June 11
Change from
2013/14
Thousand MT Percent Percent
Beginning stocks 1,460 663 -18.9 -54.6
Production 6,025 6,140 -5.5 1.9
Imports 226 450 99.1 99.1
Total Supply 7,711 7,253 -3.9 -5.9
Domestic use 4,690 4,690 0.0 0.0
Exports 2,358 1,616 -15.3 -31.5
Total Use 7,048 6,306 -4.4 -10.5
Ending stocks 663 947 0.0 42.9

U.S. Sugar Supply and Demand
July 11, 2014
2013/14
estimate
2014/15
forecast
Change from
June 11
Change from
2013/14
1,000 short tons, raw value Percent Percent
Beginning Stocks 2,158 1,808 -2.6 -16.2
Production 8,442 8,225 -1.6 -2.6
Beets 4,750 4,750 0.0 0.0
Cane 3,692 3,475 -3.6 -5.9
Imports 3,674 3,549 -6.2 -3.4
TRQ 1,458 1,262 0.0 -13.4
Re-export 210 400 0.0 90.5
Mexico 1,996 1,877 -11.1 -6.0
High-tier 10 10 0.0 0.0
Total Supply 14,274 13,582 -2.9 -4.8
Exports 325 250 0.0 -23.1
Domestic deliveries 12,141 11,885 0.4 -2.1
Total use 12,466 12,135 0.4 -2.7
Ending stocks 1,808 1,447 -24.2 -20.0
Percent
Stocks/use ratio 14.5 11.9
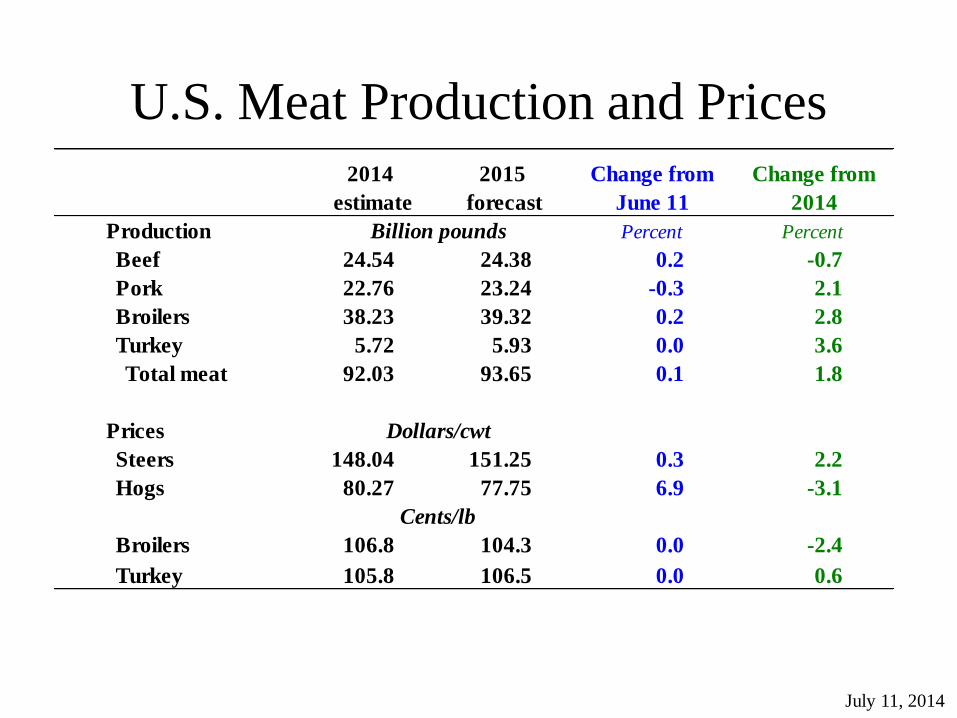
U.S. Meat Production and Prices
July 11, 2014
2014
estimate
2015
forecast
Change from
June 11
Change from
2014
Production Billion pounds Percent Percent
Beef 24.54 24.38 0.2 -0.7
Pork 22.76 23.24 -0.3 2.1
Broilers 38.23 39.32 0.2 2.8
Turkey 5.72 5.93 0.0 3.6
Total meat 92.03 93.65 0.1 1.8
Prices Dollars/cwt
Steers 148.04 151.25 0.3 2.2
Hogs 80.27 77.75 6.9 -3.1
Cents/lb
Broilers 106.8 104.3 0.0 -2.4
Turkey 105.8 106.5 0.0 0.6
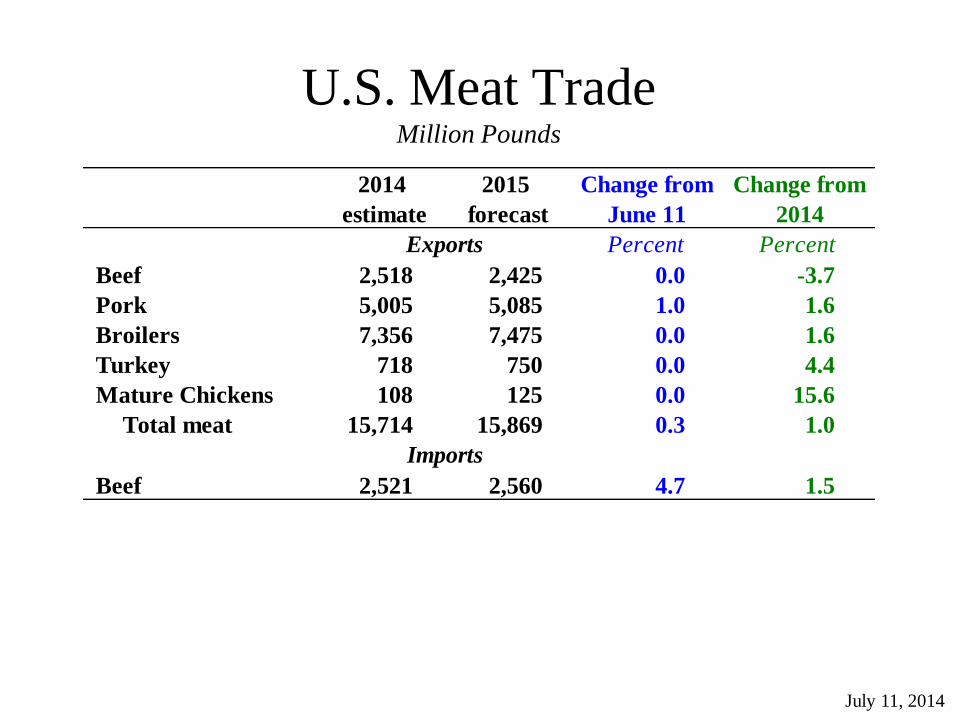
U.S. Meat Trade Million Pounds
July 11, 2014
2014
estimate
2015
forecast
Change from
June 11
Change from
2014
Exports Percent Percent
Beef 2,518 2,425 0.0 -3.7
Pork 5,005 5,085 1.0 1.6
Broilers 7,356 7,475 0.0 1.6
Turkey 718 750 0.0 4.4
Mature Chickens 108 125 0.0 15.6
Total meat 15,714 15,869 0.3 1.0
Imports
Beef 2,521 2,560 4.7 1.5
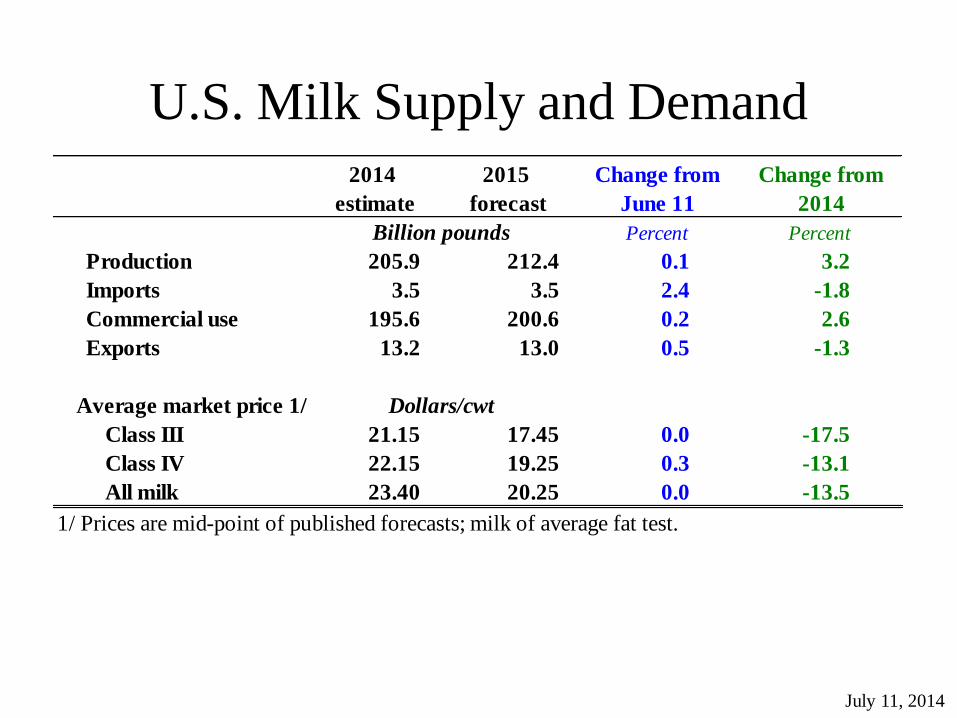
U.S. Milk Supply and Demand
July 11, 2014
2014
estimate
2015
forecast
Change from
June 11
Change from
2014
Billion pounds Percent Percent
Production 205.9 212.4 0.1 3.2
Imports 3.5 3.5 2.4 -1.8
Commercial use 195.6 200.6 0.2 2.6
Exports 13.2 13.0 0.5 -1.3
Average market price 1/ Dollars/cwt
Class III 21.15 17.45 0.0 -17.5
Class IV 22.15 19.25 0.3 -13.1
All milk 23.40 20.25 0.0 -13.5
1/ Prices are mid-point of published forecasts; milk of average fat test.
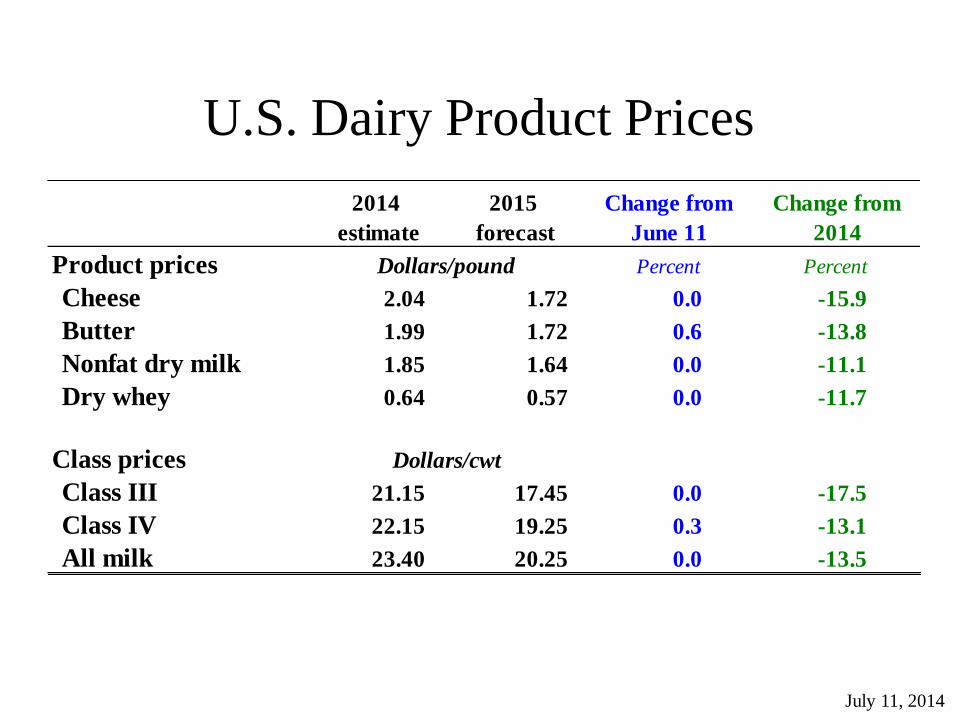
U.S. Dairy Product Prices
July 11, 2014
2014
estimate
2015
forecast
Change from
June 11
Change from
2014
Product prices Dollars/pound Percent Percent
Cheese 2.04 1.72 0.0 -15.9
Butter 1.99 1.72 0.6 -13.8
Nonfat dry milk 1.85 1.64 0.0 -11.1
Dry whey 0.64 0.57 0.0 -11.7
Class prices Dollars/cwt
Class III 21.15 17.45 0.0 -17.5
Class IV 22.15 19.25 0.3 -13.1
All milk 23.40 20.25 0.0 -13.5
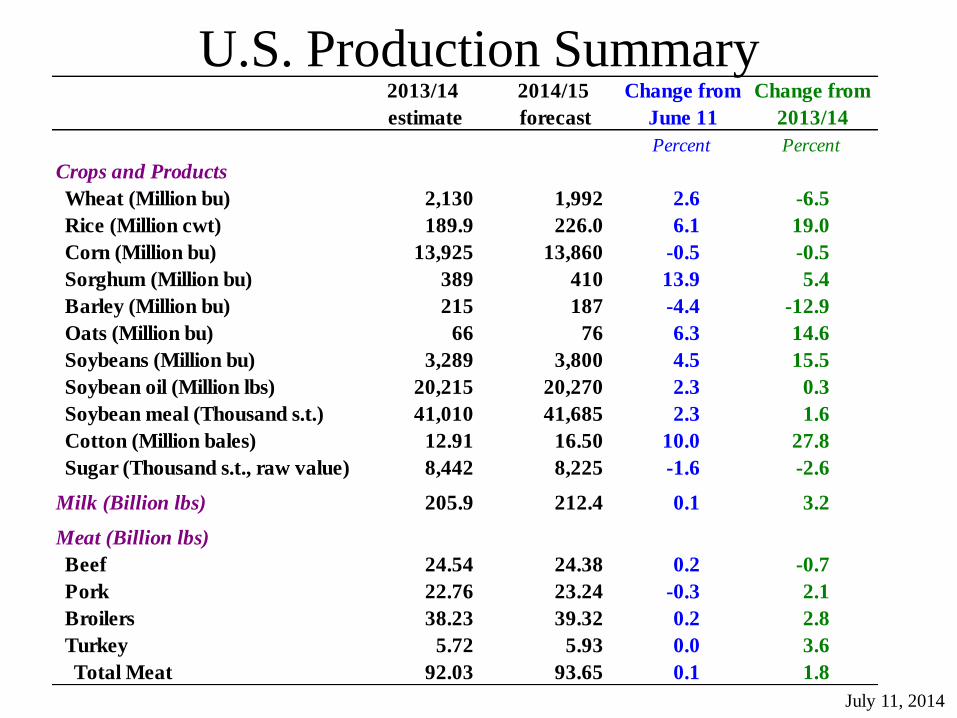
U.S. Production Summary
July 11, 2014
2013/14
estimate
2014/15
forecast
Change from
June 11
Change from
2013/14
Percent Percent
Crops and Products
Wheat (Million bu) 2,130 1,992 2.6 -6.5
Rice (Million cwt) 189.9 226.0 6.1 19.0
Corn (Million bu) 13,925 13,860 -0.5 -0.5
Sorghum (Million bu) 389 410 13.9 5.4
Barley (Million bu) 215 187 -4.4 -12.9
Oats (Million bu) 66 76 6.3 14.6
Soybeans (Million bu) 3,289 3,800 4.5 15.5
Soybean oil (Million lbs) 20,215 20,270 2.3 0.3
Soybean meal (Thousand s.t.) 41,010 41,685 2.3 1.6
Cotton (Million bales) 12.91 16.50 10.0 27.8
Sugar (Thousand s.t., raw value) 8,442 8,225 -1.6 -2.6
Milk (Billion lbs) 205.9 212.4 0.1 3.2
Meat (Billion lbs)
Beef 24.54 24.38 0.2 -0.7
Pork 22.76 23.24 -0.3 2.1
Broilers 38.23 39.32 0.2 2.8
Turkey 5.72 5.93 0.0 3.6
Total Meat 92.03 93.65 0.1 1.8

Domestic Demand Summary
July 11, 2014
2013/14
estimate
2014/15
forecast
Change from
June 11
Change from
2013/14
Percent Percent
Crops and Products
Wheat (Million bu) 1,244 1,181 -1.3 -5.1
Rice (Million cwt) 123.0 133.0 3.9 8.1
Corn (Million bu) 11,635 11,635 -0.4 0.0
Sorghum (Million bu) 174 225 15.4 29.3
Barley (Million bu) 218 204 -4.7 -6.3
Oats (Million bu) 173 167 6.4 -3.6
Soybeans (Million bu) 1,754 1,866 2.2 6.4
Soybean oil (Million lbs) 18,750 18,200 0.6 -2.9
Soybean meal (Thousand s.t.) 29,600 30,100 1.3 1.7
Cotton (Million bales) 3.60 3.80 2.7 5.6
Sugar (Thousand s.t., raw value) 12,141 11,885 0.4 -2.1
Milk (Billion lbs) 195.6 200.6 0.2 2.6
Meat (Billion lbs)
Beef 24.67 24.58 0.7 -0.4
Pork 18.79 19.00 -0.6 1.1
Broilers 30.65 31.50 0.3 2.8
Turkey 5.03 5.11 0.0 1.6
Total meat 79.99 81.03 0.2 1.3
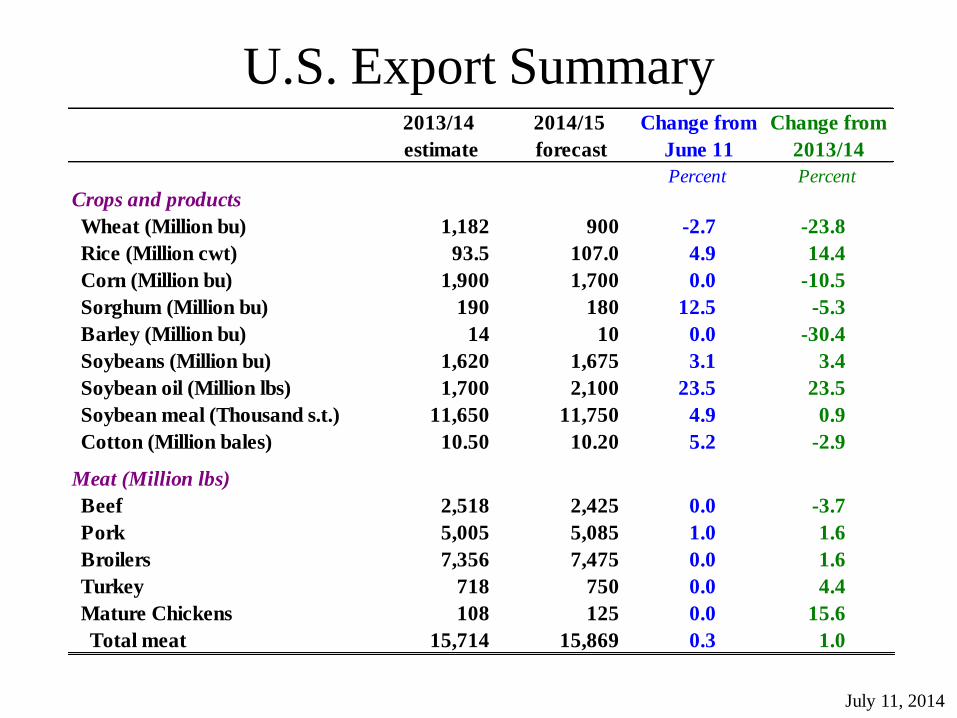
U.S. Export Summary
July 11, 2014
2013/14
estimate
2014/15
forecast
Change from
June 11
Change from
2013/14
Percent Percent
Crops and products
Wheat (Million bu) 1,182 900 -2.7 -23.8
Rice (Million cwt) 93.5 107.0 4.9 14.4
Corn (Million bu) 1,900 1,700 0.0 -10.5
Sorghum (Million bu) 190 180 12.5 -5.3
Barley (Million bu) 14 10 0.0 -30.4
Soybeans (Million bu) 1,620 1,675 3.1 3.4
Soybean oil (Million lbs) 1,700 2,100 23.5 23.5
Soybean meal (Thousand s.t.) 11,650 11,750 4.9 0.9
Cotton (Million bales) 10.50 10.20 5.2 -2.9
Meat (Million lbs)
Beef 2,518 2,425 0.0 -3.7
Pork 5,005 5,085 1.0 1.6
Broilers 7,356 7,475 0.0 1.6
Turkey 718 750 0.0 4.4
Mature Chickens 108 125 0.0 15.6
Total meat 15,714 15,869 0.3 1.0
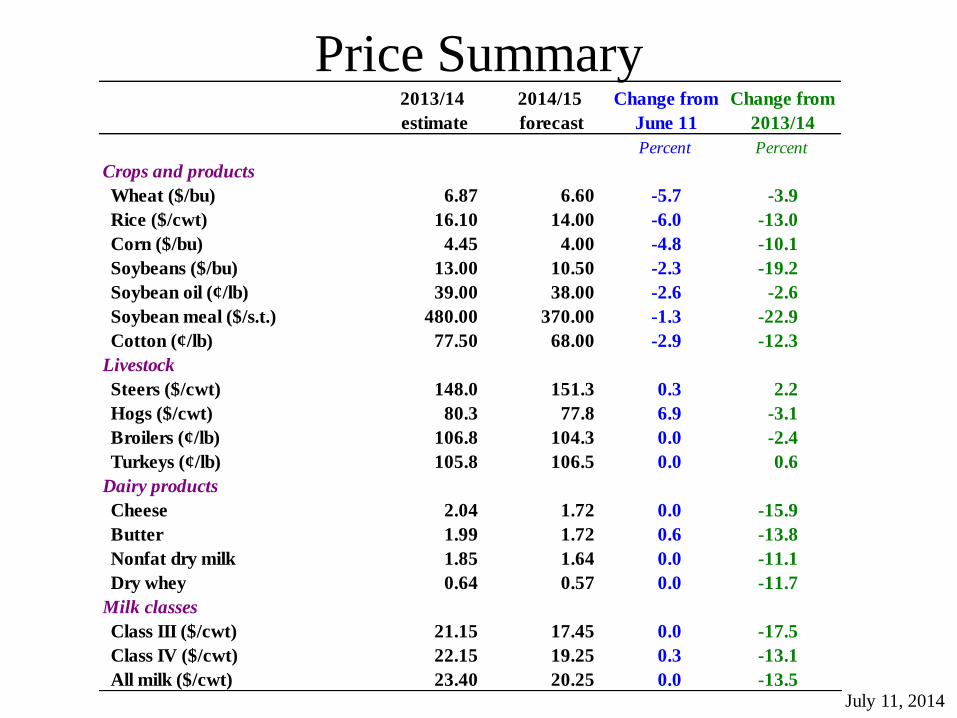
Price Summary
July 11, 2014
2013/14
estimate
2014/15
forecast
Change from
June 11
Change from
2013/14
Percent Percent
Crops and products
Wheat ($/bu) 6.87 6.60 -5.7 -3.9
Rice ($/cwt) 16.10 14.00 -6.0 -13.0
Corn ($/bu) 4.45 4.00 -4.8 -10.1
Soybeans ($/bu) 13.00 10.50 -2.3 -19.2
Soybean oil (¢/lb) 39.00 38.00 -2.6 -2.6
Soybean meal ($/s.t.) 480.00 370.00 -1.3 -22.9
Cotton (¢/lb) 77.50 68.00 -2.9 -12.3
Livestock
Steers ($/cwt) 148.0 151.3 0.3 2.2
Hogs ($/cwt) 80.3 77.8 6.9 -3.1
Broilers (¢/lb) 106.8 104.3 0.0 -2.4
Turkeys (¢/lb) 105.8 106.5 0.0 0.6
Dairy products
Cheese 2.04 1.72 0.0 -15.9
Butter 1.99 1.72 0.6 -13.8
Nonfat dry milk 1.85 1.64 0.0 -11.1
Dry whey 0.64 0.57 0.0 -11.7
Milk classes
Class III ($/cwt) 21.15 17.45 0.0 -17.5
Class IV ($/cwt) 22.15 19.25 0.3 -13.1
All milk ($/cwt) 23.40 20.25 0.0 -13.5