Embed Size (px)
Citation preview
Document of M CThe World Bank
FOR OMFCIAL USE ONLY
RpWt No. P-2849-IN
REPORT AND RECOMMENDATION
OF THE
PRESIDENT OF THE
INTERNATIONAL DEVELOPMENT ASSOCIATION
TO THE
EXECUTIVE DIRECTORS
ON A
PROPOSED CREDIT AND LOAN
TO INDIA
FOR THE
FARAKKA THERMAL POWER PROJECT
June 9, 1980
ITb docauent ha a restrited dlbos and may be ndb recbpients emily i he popfman Itheir official duoits comtents siy ot oterwtie he diod wiaot wor flsk autherlmtio.|
Pub
lic D
iscl
osur
e A
utho
rized
Pub
lic D
iscl
osur
e A
utho
rized
Pub
lic D
iscl
osur
e A
utho
rized
Pub
lic D
iscl
osur
e A
utho
rized
Pub
lic D
iscl
osur
e A
utho
rized
Pub
lic D
iscl
osur
e A
utho
rized
Pub
lic D
iscl
osur
e A
utho
rized
Pub
lic D
iscl
osur
e A
utho
rized
CURRENCY EQUIVALENT
Currency Unit - Rupee (Rs)Rs 1 - Paise 100US$1 - Rs 8.4Rs 1 US$0.1190Rs I million = US$116,047.62
(Since September 24, 1975, the Rupee has been officiallyvalued relative to a "basket" of currencies. As thesecurrencies are now floating, the U.S. Dollar/Rupee ex-change rate is subject to change. As of May 30, 1980,the exchange rate was Rs 7.9 to US$1.0).
FISCAL YEAR
April 1 - March 31
ABBREVIATIONS AND ACRONYMS USED IN THIS REPORT
ARDC - Agriculture Refinance and Development Corporation LimitedGOI - Government of IndiaCEA - Central Electricity AuthorityDVC - Damodar Valley CorporationNHPC - National Hydro Power Corporation, LimitedNTPC - National Thermal Power Corporation, LimitedREB - Regional Electricity BoardREC - Rural Electrification Corporation, LimitedSEB - State Electricity BoardUNDP - United Nations Development Program
kV - kilovolt - 1,000 voltskWh - kilowatt-hour - 1,000 watt-hoursMW - megawatt = 1,000 kilowattsGWh - gigawatt-hour - 1,000,000 kilowatt-hours
FOR OFFICIAL USE ONLY
INDIA
FARAKKA THERMAL POWER PROJECT
CREDIT/LOAN AND PROJECT SUMMARY
Borrower: India, acting by its President.
Beneficiary: National Thermal Power Corporation Limited.
Amount: US$250 million (US$225 million IDA,
US$25 million Bank).
Terms of IBRD Loan: a) Interest Rate: 8.25 percent per annum.b) Commitment Fee: Standard.c) Repayment Term: Over 20 years, including five
years' grace.
Terms of IDA Credit: Standard.
On-Lending Terms: From GOI to NTPC, with repayment over 20 years, includingfive years' grace, at an effective interest rate of10-1/4% per annum. The exchange risk will be borne by
GOI.
ProjectDescription: Installation of the first stage (three 200 MW coal-fired
generating units) of the Farakka thermal power station,in the State of West Bengal, together with ancillaryequipment and related works, about 410 km of associated400 kV transmission lines, and a training simulator.Potential risks associated with the timely implementationof the project will be minimized by NTPC's previous exper-
ience in installation of a number of similar 200 MW units
and by technical assistance from review consultants andmanagement and information system consultants who have
broad experience in major construction programs of this
nature.
This document has a restricted distribution and may be used by recipients only in the performanceof their official duties. Its contents may not otherwise be disclosed without World Bank authorization.
- 1.1 -
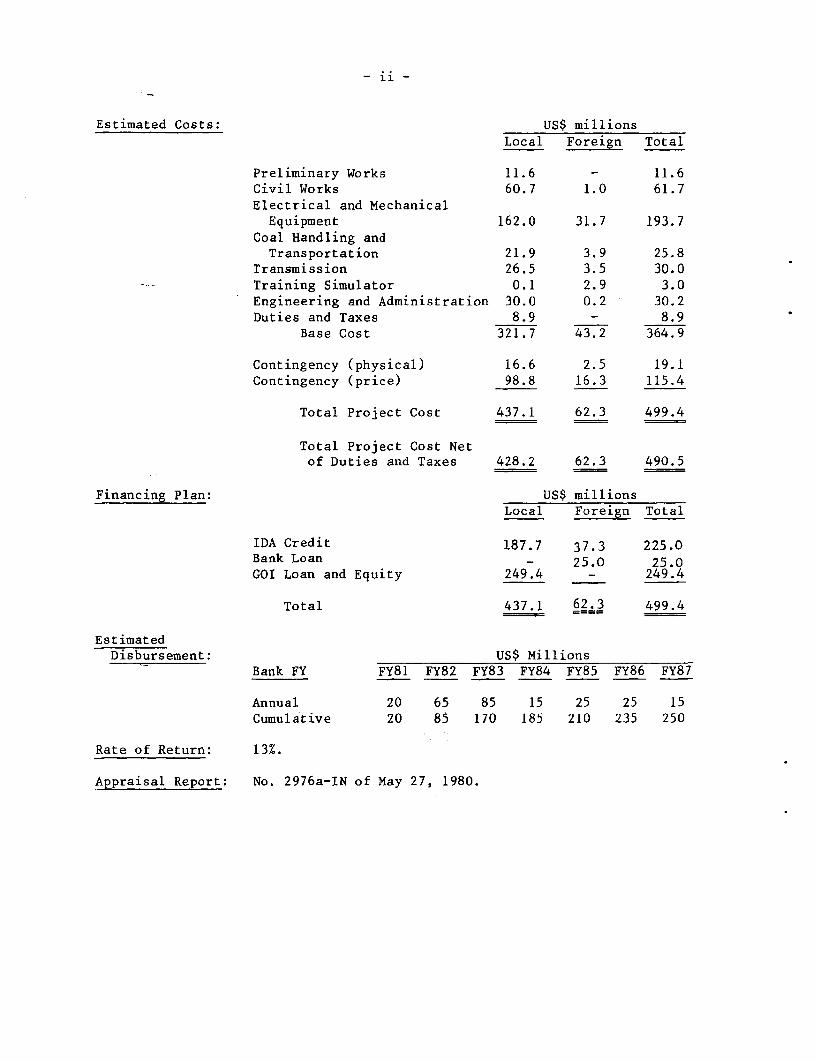
Estimated Costs: US$ millions
Local Foreign Total
Preliminary Works 11.6 - 11.6Civil Works 60.7 1.0 61.7Electrical and MechanicalEquipment 162.0 31.7 193.7
Coal Handling andTransportation 21.9 3.9 25.8
Transmission 26.5 3.5 30.0Training Simulator 0.1 2.9 3.0Engineering and Administration 30.0 0.2 30.2Duties and Taxes 8.9 - 8.9
Base Cost 321.7 43.2 364.9
Contingency (physical) 16.6 2.5 19.1Contingency (price) 98.8 16.3 115.4
Total Project Cost 437.1 62.3 499.4
Total Project Cost Netof Duties and Taxes 428.2 62.3 490.5
Financing Plan: US$ millionsLocal Foreign Total
IDA Credit 187.7 37.3 225.0Bank Loan - 25.0 25.0GOI Loan and Equity 249.4 - 249.4
Total 437.1 62.3 499.4
EstimatedDisbursement: US$ Millions
Bank FY FY81 FY82 FY83 FY84 FY85 FY86 FY87
Annual 20 65 85 15 25 25 15Cumulative 20 85 170 185 210 235 250
Rate of Return: 13%.
Appraisal Report: No. 2976a-IN of May 27, 1980.
INTERNATIONAL DEVELOPMENT ASSOCIATION
REPORT AND RECOMMENDATION OF THE PRESIDENTTO THE EXECUTIVE DIRECTORS ON A PROPOSED CREDIT
AND LOAN TO INDIA FOR THEFARAKKA THERMAL POWER PROJECT
1. I submit the following report and recommendation on a proposeddevelopment credit to India in an amount equivalent to US$225 million onstandard IDA terms, and a proposed loan to India in an amount equivalent toUS$25 million, to help finance a project for the construction of the firstphase of a proposed Farakka thermal power station. Amortization of the loanwould be over 20 years, including five years' grace, at the standard Bankinterest rate. The proceeds of the credit and loan would be onlent by theGovernment to the National Thermal Power Corporation Limited, for 20 years,including five years' grace, at an interest rate of 10-1/4% per annum.
PART I - THE ECONOMY 1/
2. An economic report, "Economic Situation and Prospects of India"(2933-IN, dated May 1, 1980), was distributed to the Executive Directorson May 12, 1980. Country data sheets are attached as Annex I.
Background
3. India is a large and diverse country with a population of 663 mil-lion (in mid-1980) and an annual per capita income of US$180. Agriculturecontinues to dominate India's economy, employing over two-thirds of thelabor force. However, the land base is not sufficient to provide an adequatelivelihood to all those engaged in agricultural activities, especially thelandless or nearly landless who have only an insecure grasp on the means ofexistence. The share of agriculture in GDP at factor cost (measured in 1970/71prices) has declined from 59.6% in 1950/51 to 40.7% in 1978/79. The shareof industry has increased over the same period from 14.5% to 22.7%. Butindustrialization has not been rapid enough to absorb the growing labor force,nor to bring about the substantial economic transformation that has led tohigher productivity and rapid urbanization in some other developing countries.The urban population was 18% of the total in 1960, and is 21% now.
4. Economic growth has been slow in the past. The trend growth rate ofGDP was 3.7% per annum from 1950/51 to 1978/79. Slow growth in agriculture --2.5% per annum over the same period -- has constrained overall growth, not onlybecause of the high share of agriculture in GDP but also because scarce foreignexchange has often been required to import food. Industrial valued-added hasgrown more rapidly, at 5.4% per annum between 1950/51 and 1978/79, but thisgrowth has not been as high as in many other countries, nor as high as requiredif the overall growth of the economy is to be accelerated. Slow growth has
1/ Parts I and II of this report are the same as Parts I and II of thePresident's Report for the Rajasthan Water Supply Project (Report No.P-2831-IN), dated June 2, 1980.
- 2 -
persisted despite a quite creditable domestic saving and investment performance.
Gross domestic saving more than doubled from 10% of GDP in 1950/51 to 24% in
1978/79. Similarly, gross domestic investment as a fraction of GDP rose from
10% in 1950/51 to just over 24% in 1978/79. Foreign savings have never financed
a large portion of domestic investment: a peak of about 20% was reached during
the early 1960s; by the end of the 1970s, the proportion had returned to much
lower levels. External assistance has been low both as a percentage of GDP and
in per capita terms. Net external assistance has never risen above 3% of GDP.
5. Except during periods of balance of payments crisis, exports have
received relatively little emphasis in India, which has primarily pursued a
strategy of import subsitution. As a result, India's share of world trade
has fallen consistently since 1950/51. The volume growth of exports between
1950/51 and 1978/79 averaged only 3.0 per annum. The volume of growth of
imports over the same period has slightly exceeded that of exports. During
the early 1970s, India's terms of trade, which had remained roughly constant
during the 1960s, deteriorated drastically, spurring a relatively rapid period
of export growth through the mid-1970s. For the five years ending in 1976/77
the volume of India's exports grew on average over 10% per annum, demonstrating
that sustained rapid growth was possible. While expanding world markets, par-
ticularly in the near-by Middle East, contributed to this process, adjustmentsin trade policies designed to improve the profitability of exports played a
major role.
Recent Trends
6. Over the period 1975/76 to 1978/79, growth in real GDP (at factor
cost), agricultural value-added and industrial value-added averaged 4.7%,
2.8% and 7.3% per annum, respectively. These trends represent a marginally
better growth performance than the long-term trends from 1950/51 to 1975/76.
However, GNP is expected to have declined by about 3% in 1979/80 as a result
of the drought-induced decrease in agricultural production and input con-
straints in other sectors, bringing recent trends back in line with the long-
term picture. Industrial production stagnated in 1979/80, largely due to
shortfalls in the production of major inputs such as coal, steel and cement,
as well as constraints in the provision of infrastructure, notably power and
transportation. As a consequence of these developments, the remarkable price
stability that characterized the Indian economy after 1975 came to an abrupt
end at the close of fiscal year 1978/79. During the Spring and Summer of
1979 the price index rose sharply, so that by September it stood at 18.4%
above that of the previous September. Foodgrain prices rose over the Summer
and Fall of 1979 but in most markets still prevailed close to the Government's
ration prices. Low income groups in urban areas were assured adequate sup-
plies of grain at stable prices through the public distribution system. The
substantial stocks of foodgrains also provided resources for a large-scale
drought relief employment program for low income groups in rural areas.
7. In agriculture the positive results of large investments and appro-
priate policies over the past few years are becoming increasingly evident and
have withstood the test of a severe drought. Agricultural production, which
had increased by 14.5% in 1977/78 and 3.4% in 1978/79 to record levels each
year, fell about 8-9% in 1979/80. Foodgrain production is estimated to have
- 3 -
declined from 131.4 million tons in 1978/79 to 118-120 million tons in 1979/80.
Considering that 1979/80 was a year of acute drought, coming after two succes-
sive years of record output, the foodgrain production achieved - still the
fourth highest in Indian history - provides a measure of the contribution that
expanded irrigation, extension and other inputs have made to Indian agriculture.
Furthermore, the capacity of India's irrigation potential to counteract drought
conditions was not adequately tested because of the diesel shortages which
inhibited the utilization of groundwater resources. Rapid growth in the use
* of basic inputs for agricultural production has continued. Additions to the
area under irrigation have almost doubled from 1.3 million hectares during the
five-year period ending in 1973/74 to about 2.5 million additional hectares a
year during the most recent three-year period. Fertilizer consumption in
1979/80 exceeded five million nutrient tons, a level almost 80% higher than
in 1975/76.
8. As the new decade begins, the Indian economy is shifting from a
situation of resource surplus, which had been a temporary phenomenon of the
late 1970s, to one of resource scarcity. Investment has again overtaken
domestic savings, and the scope for further increases in the latter appears
limited. Marginal savings rates have recently been well above 30% in the
household sector. Future increases in savings will depend largely on enhanced
profitability of public sector enterprises. Impeding resource scarcity is
even more apparent in the foreign sector. Between 1975/76 and 1978/79 India's
current account deficit had remained comfortably small in relation both to GDP
and to a growing pipeline of aid commitments. This was primarily due to
favorable terms of trade movements and rapidly growing net invisibles which
masked adverse underlying trends in the volume of exports, which has barely
grown since 1976/77. Particularly serious is the evident decline in the
quantum of manufactured non-traditional exports which had contributed much to
the export growth of the first half of the decade. A combination of strong
domestic, and slack international demand, exacerbated until recently by
apparent lessened interest in export promotion, have been the major casual
factors.
9. In constrast, imports have grown rapidly in volume terms and there
have been important changes in composition. As a result of the accumulation
and maintenance of foodgrain stocks, foodgrain imports - which had been a
traditional item in the balance of payments - have declined to insignificant
levels since 1977/78. Reflecting the impact of the liberalized import policy
adopted by the Government, non-foodgrain imports increased sharply, so that
their level in 1978/79 was over 80% higher than in 1975/76. In large part,
the liberalization in import policy and increase in imports were limited to
raw materials, basic commodities and intermediate goods; consumer goods
remained banned and capital goods imports were permitted only on a selective
basis. Strong new pressures on the balance of payments have developed during
1979/80. The terms of trade again deteriorated markedly as a consequence of
unexpectedly large increases in petroleum prices, which caused the oil import
bill to double in 1979/80, accounting for more than 80% of the total estimated
US$2.5 billion increase in imports, and bringing India's total import bill to
about US$11 billion. Petroleum imports as a proportion of exports now exceed
50%.
-4-
Development Prospects
10. The experience of recent years illustrates that India does have thecapacity to grow and develop at a more rapid pace. Although the industrialsector is small compared to the size of the economy, it nevertheless has ahighly diversified structure and is capable of manufacturing a wide varietyof consumer and capital goods. Basic infrastructure--irrigation, railways,telecommunications, roads and ports--is extensive compared to many countries,although there is considerable scope for expansion as well as improvement inthe utilization of existing capacity. India is also well-endowed with humanresources and with institutional infrastructure for development. Finally,India has an extensive natural resource base in terms of land, water, andminerals (primarily coal and ferrous ores, but also gas and oil). With goodeconomic policies and sufficient access to foreign savings, India has thecapability for managing these considerable resources to accelerate its long-term growth.
11. The new Indian Government installed in January 1980 is in the processof formulating its policies and programs. A new Plan for the period 1981-86 isbeing prepared to replace the Draft Five-Year Plan for 1978-83. At this stageit is not possible to comment on the new development strategy; however, it isunlikely that the priorities accorded to agriculture and power will be lessened.Furthermore, developments in India as well as in the world economy during1979/80 have brought to the surface urgent issues which will need the attentionof policy-makers, irrespective of the broader context of development strategythat the new Government may adopt. Among these issues are the following:(a) the bottlenecks in infrastructure and related constraints in productionof several basic industrial inputs; (b) the new policy options emerging inagriculture; (c) the need to substitute less costly energy sources for importedpetroleum; and (d) the anticipated deterioration of the balance of payments inthe near future.
12. The higher capital formation rates of the past few years augur wellfor future income growth. However, there are signs that, relative to existingdemands, the past investment program has led to disproportionally low growthin certain crucial sectors, namely power, coal, transport services, steel andcement. Potential output growth in sectors which have benefitted from largeinvestments in the recent past may not materialize unless these input bottle-necks are alleviated. In the case of coal, steel and cement, domestic produc-tion appears to be clearly justified on grounds of comparative advantage, andthe aim of policy is self-sufficiency. All these are tradeable commodities.Although in 1979/80 they were not imported in sufficient amounts to eliminatethe shortages, increased short-term reliance on imports may be necessary toalleviate slowdowns and dislocation in using industries. In the case ofsectors in which there is no option to import--power and transportation--the planning of capacity expansion becomes even more crucial. Although thereis scope for improvement in the shortrun performance of these sectors, majorinvestments in balancing and modernization programs as well as new capacityare needed in order to provide adequate and stable growth in the medium term.The presence of infrastructural constraints and shortages of basic industrialinputs demonstrates that the expansion of industrial outout leads to competingclaims on scarce resources which must be efficiently allocated among differentindustries.
- 5 -
13. The substantial increase in the world price of petroleum in 1979,together with the expectation that this pattern will not be reversed in thenear future, raises several issues concerning energy prospects for India.India imports the equivalent of about 50% of its petroleum consumption. Inorder to implement its policy of minimizing dependence on foreign oil, theGovernment intends to rapidly expand its oil exploration program, to increasethe utilization of its vast coal reserves and to increase the development ofIndia's considerable hydroelectric potential. However, recent shortages ofcoal and power are symptomatic of operational problems reflecting, in part,past planning and investment decisions which are inhibiting the timely imple-mentation of India's long-term conversion program. The interdependencies inthe economy currently make petroleum demand a residual which is contingenton the operation of many other sectors and which has significant implicationsfor the balance of payments.
14. In agriculture, despite the 1979 drought, economic policies, devel-opment programs and secular trends all seem favorable for sustaining a periodof high growth during the 1980s. India should end the 1979/80 rabi seasonwith grain stocks of about 15 million tons, without having imported foodgrainsduring the year. This is partly due to the bumper crop of 1978/79, but alsoreflects the trends of the last decade which point to a consistent improvementin foodgrain availability in the economy. In view of the acceleration in theuse of agricultural inputs and the projected fall in the population growth rate,the long-run prospects for foodgrain supply and demand balances look favorable.Persistent shortage seems unlikely, and it is probable that a wide range ofpolicy options will become much more practical as the overriding emphasis onfoodgrains can be somewhat relaxed. These options include a slowly fallingreal price of foodgrains to increase the affordability of foodgrains to low-income families, further rationalization of domestic markets and prices, anddiversification to the production of other higher value crops. This prospectwill involve only a gradual shift in emphasis rather than a dramatic breakwith past policies.
15. Foreign exchange reserves still provide some cushion that can helpthe Government of India in short-term supply management, but this situationis likely to be short-lived. Rising import prices and uncertainties in theprospects for exports and invisible receipts have led to a serious and rapiddeterioration in India's balance of payments prospects. Reserves were onlymarginally higher in March 1980 than the level of a year earlier and, in termsof import coverage, fell below the 8-month level for the first time since 1977.A sharp decline in the reserve level is expected in 1980/81. At best, India'sreserves may provide a cushion for two more years, and even that is conditionalon the maintenance of aid flows and workers' remittances and on moderation inoil price rises.
16. India's medium-term development prospects are mixed. Progress hasbeen made and continues to be made, particularly in agriculture, but theeconomy faces a period of difficult adjustments in the coming years. Invest-ments required to relieve short-term supply constraints must compete withlonger-term programs to accelerate growth and to develop India's considerable
physical and human resources. The balancing of these objectives will place adifficult burden on the framers of India's next Five-Year Plan. The primaryfocus must be on the implementation of appropriate domestic adjustment policies,although the aid community can and should play an important role in ensuringthat India's efforts do not fail due to inadequate foreign resources.
17. The annual population growth rate declined from 2.2% in the late1960s to below 2% at present and is expected to continue falling to around1.6% by the latter half of the 1980s. Despite the declining trend in the rateof population increase, a net reproduction rate of one (replacement level)will only be achieved around the year 2020. At that time, the population ofIndia is estimated to reach 1.2 billion persons, an increase of about 81% overthe mid 1980 level of 663 million. Family planning has played an importantrole in achieving the fertility decline in the past decade, and the extent ofa further decline will be greatly influenced by the continuation of a success-ful official family planning program. The family planning performance datafor 1978/79 and the first ten months of 1979/80 clearly indicate a come backfrom the sharp decline observed in virtually all major contraceptive methodsduring 1977/78. Except for male sterilizations, the number of acceptors forall contraceptive methods surpassed the 1974/75 levels in 1978/79. While theincrease in the total acceptors of IUD and conventional contraceptives wasmodest, female sterilizations increased by about 40% between 1977/78 and1978/79. Data for the first ten months of 1979/80 confirm a secular upwardtrend in overall performance. So far, policy makers have not made majorattempts to accelerate the male sterilization program. Instead, they haveopted for policies that would yield relatively modest but sustainable resultswith increased emphasis on non-terminal methods.
18. Beyond the effects of overall economic growth and constrained popula-tion growth, the reduction of poverty in India requires special attention toways of raising the income and productivity of low-income groups. More thanone-third of the world's poor live in India, and more than 80% of the Indianpoor belong to the rural households of landless laborers and small farmers.In addition to marginal holdings of physical assets, the poor are ill-endowedwith human resources, being disproportionately represented among the illiterate,the malnourished and those having otherwise poor health status. Improvementsin the living standards of the poor will depend to a large extent on the over-all growth of the economy, mainly on productivity increases in agricultureand non-farm rural employment, but also on the expansion of employment oppor-tunities in urban areas. These developments will have to stem largely frommarket forces which, however, can be greatly facilitated by appropriate gov-ernment policies and investment priorities. There is also a role for directgovernment actions in faster implementation of land reform (though the scopefor significant reduction in poverty through redistribution is quite limitedin India), in increasing the supply of credit available to small farmers andrural artisans and finally in broadening the provision of those serviceswhich enhance the human capital of the poor and improve living standards.Many of the latter are elements of the Minimum Needs Program which has beenan integral part of Indian planning for the past decade. Progress has beenslow but steady in the expansion of primary education, the extension of rural
- 7 -
health facilities and the provision of secure village water supplies. Recent
innovations, including the community health volunteer program and the national
adult literacy campaign, are encouraging evidence that well-targetted, rela-
tively low-cost programs can lead to enhanced prospects for India's poor.
PART II - BANK GROUP OPERATIONS IN INDIA
19. Since 1949, the Bank Group has made 57 loans and 118 development
credits to India totalling US$2,529 million and US$7,255 million (both net
of cancellation), respectively. Of these amounts, US$1,055 million had
been repaid, and US$3,226 million was still undisbursed as of March 31, 1980.
Bank Group disbursements to India in the current fiscal year through March 31,
1980, totalled US$517 million, representing an increase of about 44% over the
same period last year. Annex II contains a summary statement of disbursements
as of March 31, 1980, and notes on the execution of ongoing projects.
20. Since 1959, IFC has made 18 commitments in India totalling US$72.5
million, of which US$17.4 million has been repaid, US$7.6 million sold and
US$6.9 million cancelled. Of the balance of US$40.6 million, US$31.5 mil-
lion represents loans and US$9.1 million equity. A summary statement of
IFC operations as of March 31, 1980, is also included in Annex II (page 5).
21. In recent years, the emphasis of Bank Group lending has been on
agriculture. The Bank Group has been particularly active in supporting minor
irrigation and other on-farm investments through agricultural credit operations
and in providing direct support to major and medium irrigation. Marketing,
seed development, agricultural extension, and dairying are other agricultural
activities supported by the Bank Group. Also, the Bank Group has been active
in financing the expansion of output in the fertilizer sector and, through its
sizeable assistance to development finance institutions, in a wide range of
geographically scattered medium- and small-scale industrial enterprises. IDA
financing of industrial raw materials and components for selected priority
sectors has been instrumental in facilitating better capacity utilization in
industry. The Bank Group has also been active in supporting infrastructure
development for power, telecommunications, and railways. Family planning,
water supply development, and urban investments have also received Bank
Group support in recent years.
22. The direction of assistance under the Bank/IDA program has been
consistent with India's needs and the Government's priorities. The emphasis
of the program on agriculture, power, water supply and other infrastructure
sectors remains highly relevant. Projects designed to foster agricultural
production through the provision of essential inputs, particularly water and
credit for on-farm investments, will continue to receive emphasis. Improved
water management and intensification and streamlining of extension systems
form an important institution-building aspect of the Bank Group's program for
the next several years. Special emphasis will be given to projects benefit-
ting small farmers. The Bank Group's continuing role in the fertilizer sector
also assists India in the more efficient provision of another key input in
the agricultural growth process. Projects supporting water supply, sewerage,
- 8 -
and urban development also form an integral part of the Bank's lending
strategy to India for the next several years. Lending in support of infra-
structure and industrial investments will focus on those subsectors which
have recently emerged as key constraints on India's overall growth, primarily
power and transportation.
23. The need for a substantial net transfer of external resources in
support of the development of India's economy has been a recurrent theme of
Bank economic reports and of the discussions within the India Consortium.
Thanks in part to the response of the aid community, India successfully
adjusted to the changed world price situation of the mid 1970s. However,
the need for increased foreign assistance to adjust to an even greater deter-
ioration in balance of payments prospects during the 1980s by augmenting
domestic resources and stimulating investment, remains. As in the past, Bank
Group assistance for projects in India should include, as appropriate, the
financing of local expenditures. India imports relatively few capital goods
because of the capacity and competitiveness of the domestic capital goods
industry. Consequently, the foreign exchange component tends to be small in
most projects. This is particularly the case in such high-priority sectors
as agriculture, irrigation, and water supply.
24. India's poverty and needs are such that as much as possible ofIndia's external capital requirements should be provided on concessionary
terms. Accordingly, the bulk of the Bank Group assistance to India has been,
and should continue to be, provided from IDA. However, the amount of IDAfunds that can reasonably be allocated to India remains small in relation
to India's needs for external support, and India should be regarded as credit-
worthy for some supplemental Bank lending. The ratio of India's debt service
to the level of exports was 12% in 1978/79 and is projected to remain below
20% through 1995/96. As of March 31, 1980, outstanding loans to India held
by the Bank totaled US$1,516 million, of which US$556 million remained to be
disbursed, leaving a net amount outstanding of US$960 million.
25. Of the external assistance received by India, the proportion con-
tributed by the Bank Group has grown significantly. In 1969/70, the Bank
Group accounted for 34% of total commitments, 13% of gross disbursements,
and 12% of net disbursements as compared with an estimated 62%, 27% and 38%,
respectively, in 1978/79. On March 31, 1979, India's outstanding and dis-
bursed external public debt was US$15.3 billion, of which the Bank Group's
share was US$4.6 billion or 30% (IDA's US$4.0 billion and IBRD's US$0.6 bil-
lion). Because Bank Group assistance to India is predominantly in the form
of IDA credits, debt service to the Bank Group will rise slowly. In 1978/79,
about 17.5% of India's total debt service payments were to the Bank Group.
PART III - THE POWER SECTOR
Background
26. The performance of the Indian power supply industry and the economy
as a whole are closely linked, and economic growth and improvement of the
- 9 -
standard of living depend critically on the development of the power sector.
Since alternative sources of energy are not readily available in the amounts
needed, shortage of power has an immediate impact on activities of the economy.
In recent years, energy matters have been receiving top priority consideration
in policy planning of Central and State Governments, on a par with food pro-
duction and distribution. Resources allocated to the power sector have signi-
ficantly increased during this period. 1/ While per capita consumption of
electricity has been rising in India, it remains among the lowest in the world
at about 130 kWh per annum. Although investment in the development of the
power sector has been emphasized, demand for power has been outstripping sup-
ply. The direct loss of value added due to power shortages is estimated at
about 3% of GDP.
Development of the Power Sector
27. In the past, investments in power generation, transmission and dis-
tribution were made largely by the States and, while transfer of power between
States took place as the power system expanded and demand grew, there was
limited attempt at the development of power on a broad Regional or national
basis. Promising hydro power sites were identified throughout India, but
budget constraints, water rights problems between States, and other consider-
ations prevented any large-scale development, leaving hydro power potential
largely untapped except for relatively few developments.
28. Overall Power Supply and Demand of Power. In the 1950s and 1960s,
installed capacity and power generation managed to keep pace with the nation's
demand for power, both growing at an average annual rate of about 12%. Since
1970, the situation has deteriorated. Delays in commissioning new power proj-
ects, operation and maintenance problems and insufficient investment under
severe budget constraints have led to a critical situation in which demand for
power outstrips supply. This was exacerbated by monsoons and an unstable coal
supply caused by disruptions in coal mining and transport. Between 1970/71 and
1974/ 75, growth in power generation averaged only 5% annually. In the follow-
ing years, 1975/76 and 1976/77, the situation improved as the result of two
successive good monsoons, improved coal supply, and a concerted effort to
improve project implementation, thermal capacity utilization and overall power
system management. Capacity grew by 10% in 1975/76 and 8% in 1976/77, while
generation increased by 13% and 11.5%, respectively, reflecting improved
capacity utilization. In 1977/78, however, generation increased by less than
4% in spite of a 9% increase in capacity, due mainly to longer outage periods
than normal and longer periods required for commissioning new plants than
expected. The higher growth trend resumed in 1978/79, with an increase of
about 12% in installed capacity and 7% in power generation. Even so, power
shortages persisted in many parts of the country, particularly in the Eastern
Region, and India's economic activity, particularly in the industrial sector,
was adversely affected. Total installed generating capacity as of March 1979
was about 29,000 MW, including non-utility plant. Of this total generating
capacity, about 60% was conventional thermal, 38% hydro and the balance nuclear.
1/ From 16% of public sector outlays during the Fourth Plan to 19% in the
Fifth Plan and an estimated 23% earmarked in the draft Sixth Plan.
- 10 -
Although additional new generation capacity of about 10% (3,000 MW) is expected
to have been commissioned in 1979/80, power shortages will continue to prevail.
Industry consumes about 66% of all electricity sold, while agriculture (mainly
irrigation) accounts for another 14-15%. As a result of accelerated agricul-
tural development programs, there has been a marked growth of power consumption
in the rural areas where more than 80% of India's population live. The number
of electrified villages, for example, grew from just over 3,000 in 1950/51 to
some 230,000, or over one-third of all the villages in India, by March 1979.
During the five-year period 1979/80-1983/84, new generating capacity is ex-
pected to grow at an annual rate of about 11% to total some 18,900 MW, of
which about 13,000 would be thermal and 4,700 MW hydro and 900 MW nuclear.
The construction of some 15,000 km of 400 kV transmission is planned to dis-
tribute the power output through the integrated Regional systems.
29. Power Supply and Demand in the Eastern Region. In the Eastern
Region, installed capacity as of March 1979 was 4,700 MW, consisting of
3,800 MW thermal and 900 MW hydro. During 1979/80-1983/84 new capacity of
about 3,000 MW is expected to be commissioned, which would bring the installed
capacity to about 7,700 MW. In 1980/81, the Eastern Region is likely to have
a capacity deficit of some 8%, and the anticipated shortfall is still likely
to be 8% (or about 400 MW) in 1983/84. Power shortages will, therefore,
continue to persist until well beyond 1984.
30. Recent Development. With the rapid growth of the power sector
accompanied by the increasing complexity of its operation, the need to under-
take an integrated national approach to sectoral development is recognizel by
GOI. Some encouraging developments have been initiated. For example, the
unified operation of power systems on a Regional basis has commenced. The
Southern Regional grid has been in operation since 1972 with interconnected
220 kV transmission, and progressive integration of power systems in other
Regions is intended to pave the way for a national grid. GOI undertook under
the Fourth Power Transmission project (Credit 604-IN) to carry out, with
assistance of consultants, a 400 kV system study designed to establish primary
grid configurations to be adopted in developing the national power grid. The
400 kV system study was commenced by CEA and the first phase of the study has
been completed. The study provides essential inputs for formulating sound
policies for future development of the sector; GOI intends to continue it as
part of ongoing long-term national power planning. The operation of Regional
systems, which will be ultimately integrated into a national grid, requires
large numbers of technical personnel trained to use sophisticated load dispatch
equipment to control interconnected systems operation. A UNDP project designed
to assist CEA in developing programs for staff training for operation of the
future load dispatch centers is expected to be implemented shortly upon sub-
mission of a project proposal by GOI.
Sector Institutions
31. The institutional structure of the Indian power sector is complex.
One of the main reasons is that electricity supply is a concurrent subject,
within the jurisdiction of both the Central Government and the State Govern-
ments under the Indian Constitution and the Electricity (Supply) Act, 1948.
- 11 -
This means that the responsibility for supplying power is shared between the
Central Government and the State Governments, and full agreement between the
Center and the States is required for the implementation of most actions.
With the rapid expansion of the power sector, there has been the increasing
need to coordinate the activities in the power industry beyond State bound-
aries, and various agencies have been established with a view to promoting
integrated power development in the country. The principal agencies in the
sector are: (i) the State Electricity Boards (SEBs); (ii) Regional Electricity
Boards (REBs); (iii) the Central Electricity Authority (CEA); (iv) the two
Central power corporations--the National Thermal Power Corporation (NTPC) and
the National Hydro Power Corporation (NHPC); and (v) the Rural Electrification
Corporation (REC).
32. State and Regional Electricity Boards. The SEBs were established
by the State Governments under the Electricity (Supply) Act, 1948. Their major
task at the time of establishment was to bring together the small individual,
often independent privately owned power plants and facilities within their
respective States. The SEBs continue to promote the coordinated development
of the generation, supply and distribution of power within their respective
States and to control and regulate private sector power supply undertakings.
At the present time, the States own or control about 90% of India's power
generation facilities. While the SEBs are corporate entities in their own
right and enjoy some autonomy in the management of their day-to-day operations,
they are under the effective control of their State Governments in such policy
matters as capital investment, finance, tariff changes and personnel. As a
means of improving collaboration between the SEBs and establishing power
systems on a broader Regional basis, four Regional Electricity Boards (REBs)
were established between 1964 and 1966 by common resolution of the State
and Central Governments, to help develop integrated power systems in their
respective Regions, and thus prepare for the transition from separate power
systems at State level to Regional systems and finally to an interconnected
national grid. The chairmanship of each REB is assumed in rotation by the
Chairmen of the SEBs in the Region, and engineers of constituent SEBs are
seconded to the REBs. At present, the REBs function in an advisory capacity
for coordination of maintenance programs, generation schedules, interstate
power transfer and pricing. The potential role of the REBs in the light of
the progressive integration of Indian power sector operations is being reviewed
by the Government of India (GOI). The SEBs of Orissa, West Bengal and Bihar
and the Damodar Valley Corporation (DVC) are the major power supply authorities
in the Eastern Region, and will be the recipients of power from the Farakka
station.
33. Central Electricity Authority. The CEA was set up in 1950 to be
responsible for developing a national policy for power development, and to
coordinate the activities of the various planning agencies involved in elec-
tricity supply. As a result of the amendments to the general provisions of
the Electricity (Supply) Act, 1948, which became effective in October 1976,
the scope of the CEA's functions was expanded. In addition to its general
responsibility outlined above, CEA was made responsible for the formulation
of power development plans, optimization of investments in the power sector,
training of personnel, interconnected system operations, and research and
development. The SEBs are required to submit their investment proposals to
the CEA for technical and economic appraisal in a national context.
- 12 -
34. NTPC and NHPC. In order to cope with the persistent inadequacy ofpower supply to meet the growing demand--a situation which has increasinglyprevailed since 1970--GOI made a policy shift and has undertaken to supplementthe efforts of the States by constructing large-scale Centrally-owned thermalpower stations at coal fields and hydro stations in the four Regions, as wellas associated high voltage transmission lines--a step to interconnect thesystems beyond conventional State boundaries. This would lead ultimately toan integrated national power grid. Accordingly, the National Thermal PowerCorporation (NTPC) and the National Hydro Power Corporation (NHPC) were estab-lished in November 1975 under the Companies Act, 1956, as public corporations,wholly owned by GOI, with authority to design, construct, own and operategenerating and associated transmission facilities and supply power in bulkdirectly to the States. The Centrally owned generating stations, includingthe Farakka plant, are designed to supplement the States' activities and addon new power generation capacity effectively within the shortest period oftime. They will be integrated in the future national power system and willsupplement power supply under bulk supply contracts to the States each in theRegion in which it is located.
35. Rural Electrification Corporation. To help SEBs undertake the taskof rural electrification, the REC was established in 1969 under the CompaniesAct, 1956 as a public corporation, wholly owned by the Government. Its maininstitutional objective is to finance rural electrification schemes preparedby SEBs throughout India, functioning as a financial intermediary with tech-nical expertise, and ensuring the efficient on-lending of funds drawn primarilyfrom GOI. In undertaking the task, REC is directed to coordinate its lendingoperations with the activities of other agencies, such as the AgriculturalRefinance and Development Corporation (ARDC), which provide financing forrural development. Although the amount of REC financial support is small inrelation to total SEB operations in the power sector, REC supports today morethan half of total rural electrification expenditures.
Bank Group Operations and Strategy in the Power Sector
36. Since 1954, the Bank has made nine loans to India for power projectsamounting to US$334.5 million and IDA thirteen credits totalling US$1,471 mil-lion. Of this amount, US$1,170.5 million is for financing of generating plant;US$23 million for the purchase of construction equipment for the Beas hydro-electric project; US$380 million for the provision of high voltage trans-mission; and US$232 million for the support of rural electrification schemes.Nine loans and credits for generating plant, the Beas project (Credit 89-IN)and the first three transmission projects (Loan 416-IN and Credits 242-IN and377-IN), have been completed. The Fourth Transmission project (Credit 604-IN)is proceeding satisfactorily notwithstanding initial delays in preparation ofspecifications and in contract awards for highly sophisticated load dispatchequipment; the credit proceeds of US$150 million were fully committed by theend of 1979. The loan to the Tata Electric Companies under the Third TrombayThermal Power project (Loan 1549-IN), which was approved in April 1978, isprogressing satisfactorily. The First Singrauli (Credit 685-IN of April 1977)and Korba (Credit 793-IN of May 1978) projects are also on schedule. The FirstRural Electrification project (Credit 572-IN of July 1975) has been fullycommitted. The Ramagundam project (Credit 874-IN and Loan 1648-IN of February
- 13 -
1979) and the Second Rural Electrification project (Credit 911-IN of June1979) are in the early stages of implementation. The Second Singrauli project(Credit 1027-IN) was approved recently.
37. The Bank Group has had a continuing dialogue with the Government inseeking solutions to a number of complex and politically sensitive problemswhich have confronted the Indian electricity supply industry since Indepen-dence. The sensitivity of Center-State relations and the political constraintsarising from the fact that electricity supply is within the concurrent juris-diction of the Central and State Governments, have dictated a policy of seek-
ing progress through cooperation. More specifically, the Bank Group's mainobjectives of lending operations to the Indian power sector are: (a) accel-erating the installation of generating capacity and promoting measures toimprove the technical levels of operation and maintenance of existing plant;(b) fostering development of comprehensive long-range Regional and nationalsystem plans which would assure implementation of a least-cost power devel-opment program; (c) strengthening of the sector organization; and (d)strengthening of the finances of the institutions involved in the sector,particularly of the SEBs.
38. Some noteworthy results have been achieved, which include: (i)amendment of the general provisions of the Electricity (Supply) Act in 1976,to strengthen the role of the CEA and to authorize the establishment of NTPCand NHPC; (ii) the establishment of the Regional Electricity Boards and laterof the Centrally-owned power companies, which mark the first important stepstowards nationwide power operation; (iii) the recent amendments to the finan-cial provisions of the Electricity (Supply) Act, which provide for the dev-elopment of SEBs on a more commercial basis through financing from internalsources a reasonable proportion of their investments; (iv) tariff studies bya number of SEBs with a view to reassessing tariff policies; (v) preparationof action plans by a number of SEBs, which are designed to restore the 9-1/2%rate of return through tariff increases, rationalization of manpower require-ments and other cost-effective schemes; and (vi) progress of NTPC's generation/transmission construction program with Bank Group assistance. Implementationof the program will make a significant contribution to the gradual eliminationof the shortfall of power; further improvements are anticipated.
39. Going beyond these achievements, Indian authorities have recognizedthat all aspects of the sector need to be reviewed in depth and that satisfac-tory solutions have to be found for outstanding sector development problems.Consequently, GOI established a high-level Committee on Power under the chair-manship of V.G. Rajadhyaksha, former Member of the Planning Commission, withseven working panels of leading experts in both public and private sectors toreview: (a) power planning; (b) project formulation and implementation; (c)operation and maintenance; (d) organization and management; (e) finance,financial management and tariffs; (f) rural electrification; and (g) researchand development. Draft reports by the seven expert panels assembled for thispurpose have been completed and have been reviewed by the Committee whichis expected to submit its findings and recommendations to GOI during 1980.The Bank Group will take a continuing interest in the Committee's findings andGOI's follow-up actions.
- 14 -
40. There remain a number of areas which have been a particular cause ofcontinuing concern to the Bank Group and also have been the subject of contin-uing dialogue with the Government. These include: (i) nationwide long-rangeplanning for power development; and (ii) the financial position of some SEBs.In the continued effort of the Bank Group in helping GOI deal with the long-range problems of the power sector in India, it was decided to concentrate onthe above two areas. During appraisal and negotiations for the SecondSingrauli Thermal Power project as well as this project, discussions were heldwith GOI, CEA, NTPC and NHPC on the content of a long-range national powerdevelopment study designed to prepare a least-cost power development programand CEA's capability to undertake such study with its own staff. The govern-ment agreed with the terms of reference for long term development suggested bythe Bank Group and stated that the study which has been commenced would becompleted by April 1982. From a commercial point of view, the financialperformance of several SEBs has been marginal and even in years where 9-1/2%rates of return were achieved, a number of SEBs were not able to meet theirdebt service requirements. There are several reasons for such performance--e.g., insufficient generating capacity which does not permit utilization ofthe market potential to the fullest extent, maintenance problems, lack ofmonsoon rains leading to severe load shedding and blackouts, disruptions intransport and coal mining resulting in insufficient coal supply, and lowtariff levels. There is scope for improvement in the finances of the agenciesconcerned through increased generation and sales, reduced auxiliary consumptionand lower transmission losses. There is also scope for more stringent costcontrols and more effective management, particularly in Bihar. Recognizingthe need to enhance financial performance of the Eastern Region SEBs, GOIthrough CEA held discussions with the State Governments concerned in late 1979and agreement was reached about enhanced monitoring and improved accountabilityto achieve improved operational and financial management of the SEBs. In thecontext of this project, special attention was directed to the Eastern States,the beneficiaries of Farakka power (paras 53-55).
PART IV - THE PROJECT
41. The project was appraised by a mission which visited India in May/June 1979. A report entitled "India - Farakka Thermal Power Project StaffAppraisal Report" (No. 2976a-IN, dated May 27, 1980) is being distributedseparately to the Executive Directors. Negotiations were held in Washingtonin May 1980. GOI and NTPC were represented by a delegation coordinated byMr. S.C. Jain of the Department of Economic Affairs, Ministry of Finance. Asupplementary Project Data Sheet is attached as Annex III.
Project Description
42. The proposed project represents the first stage of the fourth large-scale thermal power development in India, comprising three 200 MW coal-firedgenerating units, together with ancillary equipment and related works, about410 km of associated 400 kV transmission lines, and a training simulator. Thesite of the power station is in the Murshidabad District in the State of West
- 15 -
Bengal, on the west bank of the Farakka feeder canal. The total project is
expected to be commissioned by the end of 1985.
Project Cost and Financing
43. The project cost, including contingencies but excluding duties and
taxes, is estimated at about US$491 million equivalent, of which about US$62
million represents the estimated foreign exchange costs. Duties and taxes
add about US$9 million to the financing required. Physical contingencies of
10% on civil works, and of 5% on plant and transmission have been included.
Costs for equipment and erection have been escalated at 6% for 1979, 10% for
1980, 7% for the years 1981-1983 and 5% for the years after 1983.
44. The proposed credit and loan of US$250 million would provide about
51% of the cost of the project, excluding interest during construction and
duties and taxes. The balance of the funds required, aggregating about US$249
million equivalent, would be provided by the Government in the form of loan
and equity capital.
Procurement and Disbursement
45. The major items financed under the proposed credit and loan are
three 200 MW generating units; electrical and other power station equipment;
coal handling and transportation equipment, transmission facilities; a training
simulator and consultants' services for plant engineering work. All equipment
financed under the proposed credit and loan, would be procured by NTPC through
international competitive bidding in accordance with the Bank/IDA guidelines.
The proceeds of the credit would be disbursed against 100% of: (a) the c.i.f.
cost of imported items; (b) the ex-factory cost, net of duties and taxes, of
items procured from Indian suppliers; and (c) the cost of technical advisory
services by consultants. Indian manufacturers competing under international
competitive bidding would be granted a preference margin of 15% or the current
rate of import duty, whichever is less. It is expected that local manufac-
turers of equipment and machinery would submit the lowest conforming bids for
most of the items financed under the credit and loan. Documents for indivi-
dual contracts estimated to cost US$1,500,000 or more will be subject to prior
review by the Bank Group. All work not financed from the proposed credit and
loan will be subject to NTPC's procurement procedures, which are satisfactory.
Project Implementation
46. NTPC will implement the proposed project as part of its ongoing power
development program. NTPC has a Board of Directors, which presently consists
of seven members, two of whom are part time. A competent and experienced
Chairman and Managing Director was appointed in early 1976 and NTPC is making
good progress in building up its organization and manpower since then. As
a growing organization, NTPC places special importance on the training of
engineers, supervisors and operating staff as well as managerial and adminis-
trative staff, and is implementing an acceptable training program covering
spheres of activity such as planning, design, constuction and start-up
operation.
- 16 -
47. A master plan for project implementation has been prepared by NTPC.Preparatory civil works have commenced at the plant site. The detailedengineering and design work carried out for the ongoing Bank Group-assistedthermal power development is largely applicable to the proposed project.NTPC has developed a comprehensive project management and information system,including program coordination and supervision of construction of the powerstations. However, in view of the magnitude of its construction program,NTPC agreed to appoint, by October 15, 1980, consultants with broad exper-ience in major construction programs of this nature to review its projectmanagement and information system and their initial implementation (Section2.02 of Project Agreement).
48. Large reserves of coal are available at the Rajmahal coal field,some 50 km from the Farakka plant and coal will be transported by a "merry-go-round" rail transport system which will be installed for this purpose. TheGovernment has agreed to take all necessary steps to ensure adequate coalsupplies for the final installed capacity of the Farakka plant (Section 3.04of Development Credit Agreement). No problem is foreseen with regard to theavailability of adequate quantities for the proposed thermal power station.Cooling water arrangements are adequate.
49. Adequate measures will be taken to minimize potential adverse eco-logical effects of the project. The measures include stack emission controlby electrostatic precipitators and appropriate ash disposal facilities. Theapproval of the National Committee on Environmental Planning and Coordinationhas been obtained, and appropriate occupational safety standards will bestrictly enforced (Section 2.10 of Project Agreement).
NTPC Finances
50. NTPC would begin to earn revenues in 1981/82 when commissioning ofthe first 200 MW generating unit under the First Singrauli project (Credit685-IN) is scheduled. As the generating capacity increases, NTPC's annualrevenue is expected to increase at a faster rate than its operating expensesand produce rates of return on the capital base rising gradually to reach 9.5%by 1988/89 and about 11% by 1990/91. NTPC has agreed to achieve in 1988/89,and maintain thereafter, a rate of return of not less than 9.5% on the costof the average net fixed assets in service, and to set tariffs from the timeof commissioning of its first 200 MW generating unit at the Singrauli thermalpower station at levels not lower than those estimated to be required to meetthis target (Section 4.03 of Project Agreement). This would result in lowerreturns in the earlier years, but in view of the high initial capital invest-ment in the early stages of NTPC's power development and the time involvedin commissioning generating capacity, this approach to setting the tariffand reaching the target rate of return by 1988/89 is appropriate.
51. In accordance with the provisions of the Companies Act, the Govern-ment would provide funds so that NTPC's debt/equity ratio would not exceed 1:1.NTPC's initial authorized share capital of Rs 1,250 million (US$149 million)was increased in May 1979 to Rs 3,000 million (US$357 million). Furtherprogressive increases of share capital are planned during the constructionperiod, reaching about Rs 22,000 million (US$2,620 million) by 1983/84. NTPCwould inform the Association of any proposal for modification of existing
- 17 -
limitations on NTPC's borrowing powers prior to submission to its annual
shareholders' meeting (Section 3.03 of Project Agreement). The proceeds of
the proposed credit and loan would be onlent to NTPC, and conclusion of a
subsidiary loan agreement satisfactory to the Association is a condition of
effectiveness (Section 5.01 (a) of Development Credit Agreement and Section
6.01 of Loan Agreement). The GOI loan would be for a term of 20 years,
including five years grace, with interest at the rate of 10-1/4% per annum.
This is the standard rate at which GOI currently lends to public sector
enterprises. The exchange risk will be borne by the Government. Inflation
in India between 1974/75 and 1978/79 averaged only 1.5% per annum. With the
sharp increase in oil prices during 1979 coinciding with a severe drought,
prices spurted by almost 15% between April and December 1979 and are anti-
cipated to increase another 10% during 1980/81. Given past GOI determination
and success in containing inflation, and the likelihood of a strong agricul-
tural recovery and improved supply of industrial inputs, the rate of price
increase over the project period is expected to average somewhat below 7%
per annum.
52. As in the case of the previous Bank Group-assisted projects,
Farakka's power output will be supplied in bulk to the Eastern Region SEBs
through 400 kV transmission lines. GOI has undertaken to obtain, not later
than October 10, 1980, undertakings from the recipient SEBs and Damodar Valley
Corporation (DVC) in the Eastern Region that they purchase at least 85% of
the power generated by the project units (three 200 MW units) of the Farakka
station (Section 3.05 of Development Credit Agreement). The remaining 15%
would be sold in accordance with priorities to be determined by GOI to the
States with the greatest need. NTPC has agreed to sell the output of power
under bulk supply contracts satisfactory to the Association (Section 2.09 of
Project Agreement). NTPC has prepared a draft bulk supply contract which is
presently being examined in the context of a proposal to study the feasibility
of an agency selling power from all central projects in a Region at a common
rate and to ensure that the tariff is consistent with overall economic consid-
erations and the financial viability aspects of NTPC. GOI has indicated that
agreement on the bulk supply of Farakka power would be reached at least six
months before the start of commercial operation of the first 200 MW unit of
the Farakka station scheduled for December 1984. The Bank Group will review
the commercial arrangements before they are finalized.
Operational and Financial Performance of SEBs
53. The operational and financial performance of SEBs has been the
subject of a continuous dialogue between GOI and the Bank Group. The Bank
Group has sought, under the previous lending operations, to improve their
performance and work toward a rate of return target of 9.5%. While actual
performance has varied among SEBs, the overall trend showed an improvement
through 1976/77, when seven out of the sixteen major SEBs reached the target
rate of return, compared with only four in the previous year, 1975/76. A
further two reached their targets in 1977/78 with the help of rural electri-
fication subsidies from their State Governments. Another SEB is expected
to achieve the agreed rate of return in 1979/80. Returns generally contracted
in 1977/78 and 1978/79 due to the adverse financial impact of forced plant
outages caused by the natural disasters of flooding and drought, increased

- 18 -
purchases of relatively expensive thermal power and disruptions in the coalmining industry and in the transport sector, leaving ten out of the sixteenSEBs, including two Eastern Region SEBs--Orissa and Bihar--unable to reachthe agreed rate of return. 1/ The situation faced by some hard-hit SEBs didnot constitute "normal circumstances", and it can be justifiably argued thatthe achievement of the 9.5% could not be realistically expected.
54. There are special problems associated with the power industry in
the Eastern Region which require special treatment. This Region is the mostvulnerable area in India as regards power availability. Installation ofadditional generating capacity has been constrained primarily because of alack of financial resources. The financial performance of the Eastern RegionSEBs and DVC was discussed in detail with GOI and CEA officials during appraisaland negotiations for the Second Singrauli Thermal Power project as well as thisproject; the performance of the DVC, a statutory body which was set up underGOI Act in 1948 and operates about 40% of the installed capacity in the EasternRegion, was satisfactory during recent years with a rate of return exceeding20%. This creditable performance is likely to be maintained for the immediatefuture. On the other hand, the financial records of the Eastern Region SEBs,particularly that of Bihar indicate their weak position partly because generat-ing stations have had operational problems which have curtailed electricity
output. The Bihar SEB has undertaken a thorough investigation of these prob-lems, and CEA was made responsible for monitoring this program of studies witha view to the introduction of an action plan for overall improvement. In thecircumstances, the immediate restoration of a rate of return of 9.5% cannotrealistically be expected. During negotiations, the GOI representativesundertook to send a report on the position of the Bihar SEB to the Bank Group
within the next six months. In the case of the Orissa SEB, the rate of Stateelectricity duty recovered from consumers is as high as 5% of capital base, asagainst a target of 1.5%. Consequently, if the gross return is compared withthe target of 11% (9.5% plus 1.5% for duties) the annual projections throughFY1983 show that the target rate of return will be achieved in FY1982. Thisperformance is acceptable, considering the periodic low availability of hydropower in recent years in what is a predominantly hydro system, coupled withlow output of some thermal plant. The West Bengal SEB exceeded its 9.5% rateof return in FY1979. However, because of the doubling of installed capacityprojected during the three years to March 1983 and the phased build up tostabilized generation by the new plant, additional revenues will not bereceived in proportion to increases in capital base. While efforts are beingmade to complete modifications and improvements in existing installed capacityin order to improve availability factors and boost revenues, rates of returnprojected for the four years ending March 1983 of 7% rising to 9.3% must beregarded as reasonable.
1/ Duties are levied on electricity sales in all States, except one.Inclusion of such taxes as a benefit to the States/SEBs would increasethe returns by up to 5 percentage points. Furthermore, a recentlyenacted GOI tax on kWh generated is equivalent to a return of additional
2-3 percentage points.
- 19 -
55. In November 1979, GOI through CEA held discussions with the StateGovernments and their SEBs. There was general consensus that concerted effortswere necessary to improve the operational performance of the Boards. Whileimprovements in operational efficiency and financial performance can be broughtabout over time, GOI and the State Governments and their SEBs have agreed tointroduce various monitoring measures, including a system of accountability,a monthly reporting system on project implementation and capacity utilization,and setting of targets for reducing transmission and distribution losses.Measures are in hand to accelerate the stabilization of newly installed thermalpower units, to better monitor breakdowns, to ensure adequate supplies ofspares and to initiate rehabilitation programs for units which require it.Training programs at all levels are being strengthened. The introduction ofthe above measures would bring greater surveillance over the operations andfinances of the SEBs. The Bank Group will receive comprehensive periodicinformation on the power sector which will enable it to monitor progress inthe implementation of these improvement measures. The financial provisionsof the Electricity (Supply) Act, 1948, have been amended to put the operationsof the SEBs on a more commercial basis by enabling them to finance from internalsources a reasonable portion of their investment program. The manner in whichthis will be achieved is a subject which has been under evaluation by both theState Governments in conjunction with their SEBs, and by the RajadhyakshaCommittee.
Project Justification and Risks
56. The proposed project is the least-cost solution to ease the acutepower shortages in the Eastern Region within reasonable time. Compared tothe practical alternative of smaller coal-based stations that would be in-stalled by individual SEBs in the absence of the project, the present valueof the cost stream of the proposed project is the least-cost alternative atdiscount rate up to 35%. The economic rate of return of the project, usingtariff revenues together with observed willingness to pay for continuous powersupply as a proxy for economic benefits, is 13%. This must be regarded aswell below the true economic rate of return on the proposed expansion of powergenerating capacity, since additional benefits which are expected from proj-ect implementation but whose quantification is difficult--e.g., industrial,agricultural and commercial output maintained by the reduction of shortages--are not included.
57. Project risks are no greater than can normally be expected withoperations of this type. The principal risk would be the possibility of delayin the scheduled commissioning of plant. The progress of project implementa-tion will be closely monitored during engineering and construction, and theuse of experienced review consultants and management and information systemconsultants would help minimize delays in project implementation. The factthat a number of 200 MW units will have been in operation in India beforethe project is commissioned will reduce the possibility of operational dif-ficulties during start-up and the early stages of operation.
- 20 -
PART V - LEGAL INSTRUMENTS AND AUTHORITY
58. The draft Development Credit and Loan Agreements between India, andthe Association and the Bank, respectively, the draft Project Agreementbetween the Association, the Bank and NTPC, the Recommendation of the Committeeprovided for in Article V, Section l(d) of the Articles of Agreement of theAssociation and the Report of the Committee provided for in Article III,Section 4 (iii) of the Articles of Agreement of the Bank are being distributedto the Executive Directors separately.
59. Special conditions of the project are listed in Section III ofAnnex III. Execution of a Subsidiary Loan Agreement between India and NTPChas been made an additional condition of effectiveness of the credit and loan(Sections 5.01 of Development Credit Agreement and Loan Agreement).
60. I am satisfied that the proposed credit and loan would comply withthe Articles of Agreement of the Association and the Bank.
PART VI - RECOMMENDATION
61. I recommend that the Executive Directors approve the proposedcredit and loan.
Robert S. McNamaraPresident
June 9, 1980
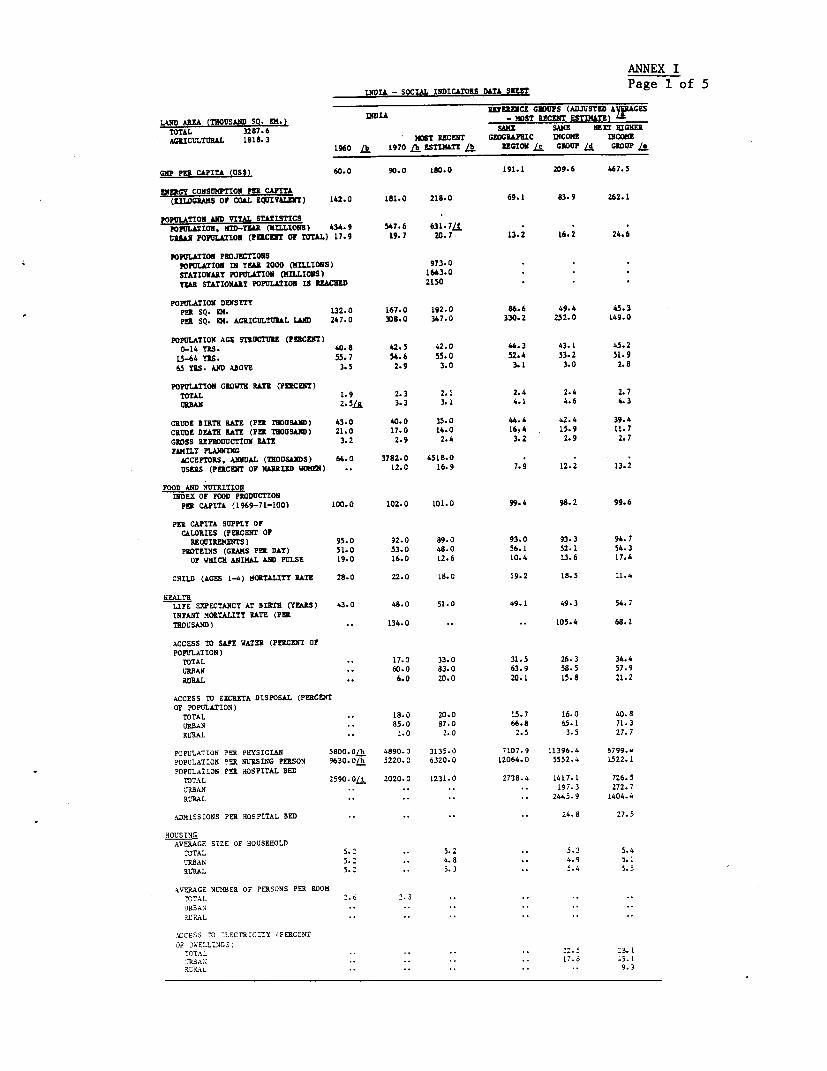
ANNEX I
INDIA - SOCIAL INDICATORS DATA SOM Page 1 of 5
REIENCE GRDUPS (ADJUSTED AyU&GES
LAND AMEA (THOUSAND SQ. m3.) nmDL - NOST RRCERT ESTIMTE)TOTAL 3287.6 SAME SAME IZXT HIGHEAGRECULTURAL 1818. 3 MOST RECmaT GEOGRAC INcoME INCOME
1960 Lb 1970 A ESTUITE /b REGION I CROVP ld GROUP S
GNP PeR CAPITA (US) 60.0 90.0 180.0 191.1 209.6 467.5
ENEaGY CONSUMVPTION P CAPITA(KiLoGRS or COAL EQV4LEII) 142.0 181.0 218.0 69.1 83.9 262.1
POPULATION AND VITAL STATISTICSPOPULATION, ID-TEA (DLIONS) 434.9 547.6 631. .L,.
IUSII POPULATION (PERCENT Or TOTML) 17.9 19.7 20.7J 13.2 16.2 24.6
POPULATION PROJECTIONSPOPULATION IN YEAR 2000 (MILLIONS) 973.0STATIONARY POPULATION (MILLIONS) 1643.0TEAR STATIONARY POPULATION IS REACHED 2150
POPULATION DENSIYPeR SQ. IN. 132.0 167.0 192.0 86.6 49.4 45.3PER SQ. DI. AGRICULTURL LAND 247.0 308.0 347.0 330.2 252.0 149.0
POPULATION AGE STRUCTUR (PUCMcT)0-14 TES. 40.8 62.5 42.0 44.3 43.1 45.2
15-64 TRS. 55.7 54.6 55.0 52.4 53.2 51.965 YES. AND ABOVE 3.5 2.9 3.0 3.1 3.0 2.8
POPULATION GROWTH RAE (PERCENT)TOTAL 1.9 2.3 2.1 2.4 2.4 2.7
UBAN 2
. 5L 3.3 3.1 4.1 4.6 4.3
CRUDE 3IRTR RATe (PUa THOUSAND) 43.0 40.0 35.0 44.4 42.4 39.4CRUDE DEATE RATE (PEu TSOUSAND) 21.0 17.0 14.0 16.4 15.9 11.7GROSS REPRODUCTION RATe 3.2 2.9 2.4 3.2 2.9 2.7FAMILY PLANNING
ACCEPTORS. ANNUAL (THOUSANDS) 64.0 3782.0 45LB.0USERS (PERCENT OF MARRIED WOHEN) .. 12.0 16.9 7.9 12.2 13.2
FOOD AND NUTRITION
INDEX OF FOWD PRODUCTIONPER CAPITA (1969-71-100) 100.0 102.0 101.0 99.4 98.2 99.6
PER CAPITA SUPPLY OFCALORIES (PERCENT OP
REQUIREMENTS) 95.0 92.0 89.0 93.0 93.3 94.7PROTEINS (GRAMS Pra DAY) 51.0 53.0 48.0 56.1 52.1 54.3
OP WHICH ANIMAL ND PULSE 19.0 16.0 12.6 10.4 13.6 17.4
CHILD (AGES 1-4) HORTALTY RATE 28.0 22.0 18.0 19.2 18.5 11.4
HEALTHLIFE EXPECTANCT AT 3IRTH (YEARS) 43.0 48.0 51.0 49.1 49.3 54.7
INFANT MORTALITY RATE (PERTHOUSAND) .. 134.0 .. .. 105.4 68.1
ACCESS TO SAFE WATZR (PERCENT OFPOPULATION)
TOTAL .. 17.0 33. 0 31.5 26.3 34.4URBAN .. 60.0 83.0 63.9 58.5 57.9RURAL .. 6.0 20.0 20.1 15.8 21.2
ACCESS TO EXCRETA DISPOSAL (PERCENT
OF POPULATION)TOTAL .. 18.0 20.0 15.7 16.0 40.8URBAN .. 85.0 87.0 66.8 65.1 71.3RVRAL .. 1.0 2.0 2.5 3.5 27.7
POPULATION PER PHYSICLN 58oo.0oh 4890.0 3135.0 7107.9 11396.4 6799..
POPULATION PER NURSING PERSON 9630.O/h 5220.0 6320.0 12064.0 5552.4 1522.1POPULATION PER HOSPITAL BED
TOTAL 259.0-Li Z020.0 1231.0 2738.4 1417.1 726.5
'R,AN .. .. .. .. 197.3 272.7
RLRAL .. .. .. .. 2445.9 1404.4
ADMISSIONS PER HOSPITAL BED . . 24.8 27.5
HOUSING
AVERAGE SIZE OF HOUSEHOLD
7OTAL 5.2 .. 5.2 . 5.3 5.4
URBAN 5.2 4. . .8 .. 4.9 5.1
RURAL 5.2 .. 5.3 5. .4 5.5
AVERAGE NUMBER OF PERSONS PER ROOM
-TAOL 2.6 2.3 ..
JRSAN ... .. ..
VIRAL .. .. ..
ACCESS 0 -L ECTRICITY PERCENT
OF 3WE'L.NGS,7CTAL .... .. .. .22. 5 .I
R3AN .. .. .. .. . .5.1RKRAL .. .. .. .. .. 9.3
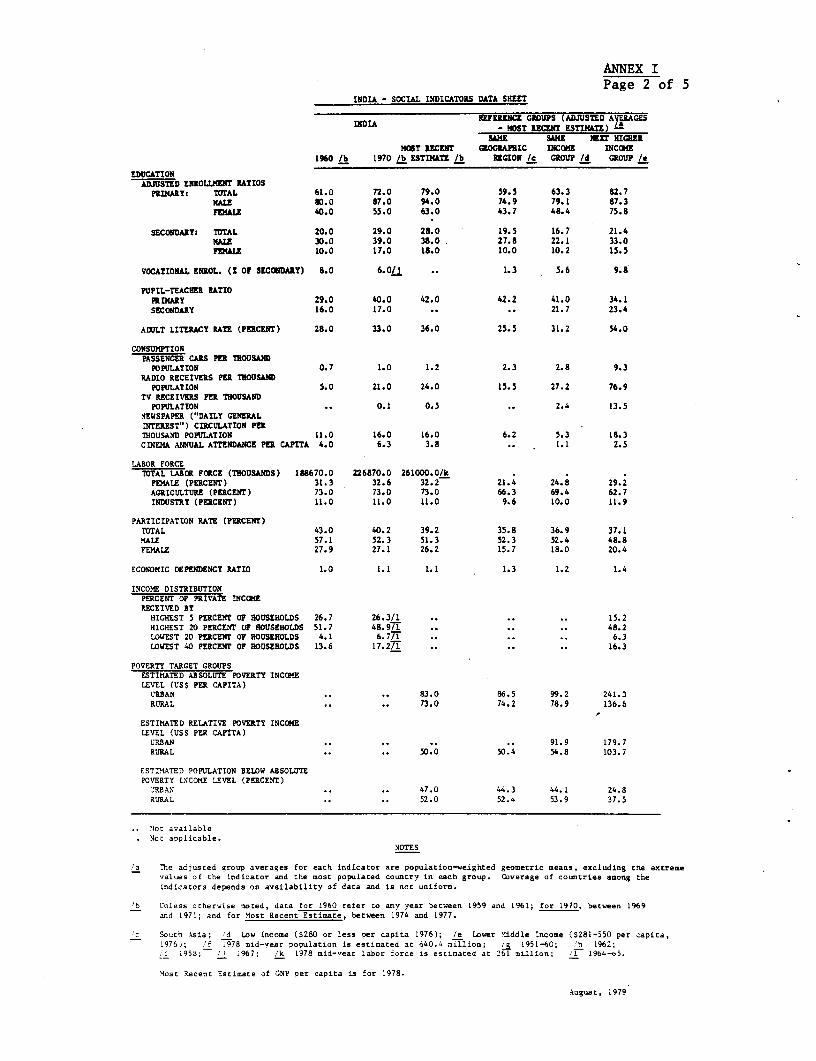
ANNEX IPage 2 of 5
INDIA - SOCIAL INDICATORS DATA SHEET
INDIA REFERENCE GROUPS (ADJUSTED AEAGES- HOST RECENT ESTIN&SE) -
SAME SAKE NCST HIGHERMOST RECENT GROGRAPHIC INCOME INCOME
1f0 lb 1970 /b ESTIMATE lb REGION /c GROUP /d GROUP /e
EDUCATIONADJUSTED ENROLLMSNT RATIOS
PRIDARY: TOTAL 61.0 72.0 79.0 59.5 63.3 82.7MALE 80.0 87.0 94.0 74.9 79.1 87.3FaALE 40.0 55.0 63.0 43.7 48.4 75.8
SECONDARY: TOTAL 20.0 29.0 28.0 19.5 16.7 21.4MALE 30.0 39.0 38.0 27.8 22.1 33.0FEMALZ 10.0 17.0 18.0 10.0 10.2 15.5
VOCATIONAL ENROL. (Z OF SECONDARY) 8.0 6.01 .. 1.3 5.6 9.8
PUPIL-TEACHER RATIOPIMIARY 29.0 40.0 42.0 42.2 41.0 34.1SECONDARY 16.0 17.0 .. .. 21.7 23.4
ADULT LITERACY RATE (PERCENT) 28.0 33.0 36.0 25.5 31.2 54.0
CONSUmPTIONPASSENGER CARS PER THOUSAND
POPULATION 0.7 1.0 1.2 2.3 2.8 9.3RADIO RECEIVERS PER TOUSAND
POPULATION 5.0 21.0 24.0 15.5 27.2 76.9TV RECEIVERS PCR THOUSAND
POPULATION .. 0.1 0.5 .. 2.4 13.5NEWSPAPER ("DAILY GENERALINTEREST") CIRCULATION PERTHOUSAND POPULATION 11.0 16.0 16.0 6.2 5.3 18.3CINEMA ANNUAL ATTENDANCE PER CAPITA 4.0 6.3 3.8 .. 1.1 2.5
LABOR FORCETDTAL LABOR FORCE (THOUSANDS) 188670.0 226870.0 261000.0/k
FEMALE (PERCENT) 31.3 32.6 32.2 21.4 24.8 29.2AGRICULTURE (PERCENT) 73.0 73.0 73.0 66.3 69.4 62. 7INDUSTRY (PERCENT) 11.0 11.0 11.0 9.6 10.0 11.9
PARTICIPATION RATE (PERCENT)TOTAL 43.0 40.2 39.2 35.8 36.9 37.1MALE 57.1 52.3 51.3 52.3 52.4 48.8FEMALE 27.9 27.1 26.2 15.7 18.0 20.4
ECONOMIC DEPENDENCY RATIO 1.0 1.1 1.1 1.3 1.2 1.4
INCOME DISTRIBUTIONPERCENT OF PRIVATE INCOMERECEIVED BY
HIGHEST 5 PERCENT OP HOUSEHOLDS 26.7 26.3/1 .. .. 15.2HIGHEST 20 PERCENT OF HOUSEHOLDS 51.7 48.971 48.2LOWEST 20 PERCENT OF HOUSEHOLDS 4.1 6.771 .. .. .. 6.3LOWEST 40 PERCENT Or HOUSEHOLDS 13.6 17.27i .. .. .. 16.3
POVERTY TARGET GROUPSESTIMATED ABSOLUTE POVERTY INCOMELEVEL (USS PER CAPITA)
L'RBAN .. .. 83.0 86.5 99.2 241.3RURAL .. .. 73.0 74.2 78.9 136.6
ESTIMATED RELATIVE POVERTY INCOMELEVEL (USS PER CAPITA)URBAN .. .. .. .. 91.9 179.7RURAL .. .. 50.0 50.4 54.8 103.7
ESTIIMATED POPULATION BELOW ABSOLUTEPOVERTY INCOME LEVEL (PERCENT)
'RBAN .. .. 47.0 46.3 44.1 24.8RURAL .. .. 52.0 52.4 53.9 37.5
Not availableNoc applicable.
NOTES
ia The adjusred group averages for each indicator are population-weighted geometric means, excluding the extremevalues of the indicator and the most populaced country in each group. Coverage of countries among theindicators depends on availability of data and is not uniform.
lb Unless ocherwise noted, data for 1960 refer to any year between 1959 and 1961; for 1970, between 1969and 1971; and for Most Recent Estimate, between 1974 and 1977.
Ic Souch Asia; /d Low Income (S280 or less per capita 1976); /e Lower Middle income (S281-550 per capita,1976); 1' i978 mid-year population is estimated ac 640.4 nillion; /j 1951-60; 'h 1962;
- 1958; / i i967; /k 1978 mid-year labor force is estimated at 261 million; _ 1964-65.
Most Recenc Escitmate of GNP per capita is for 1978.
August. 1979
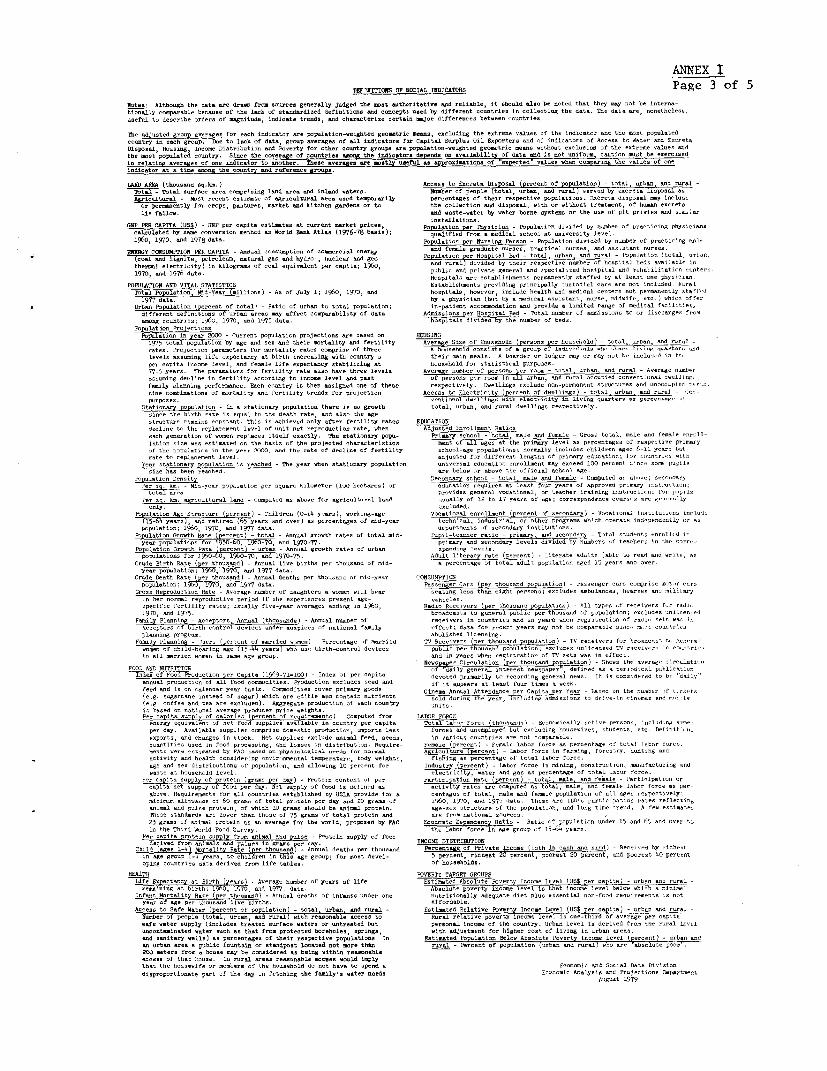
ANNEX IPEP5ITTIONS OF SOCIALIinDICATORS Page 3 of 5
No-tes: Although the data ar d-an fern soucegnealy Judged the sat a.thoebtmtie and reliable, it should an be noted that they sp not be inten--tIona lly o-p-rble be-.sa of the laos of standardisd defbnltioa and I.sa.ePt, used by differet coutries In colleting the data. The data are,nnteeou_eful to Idecorbe orders of Magitde, idicate treda, andoaaneis etain. major differer- beao outIs
The aldJusted group aceage if orIch indio-torar -pepuattic-nighted geemtrir aean, eioluoisg the -tre- -ai fte noao mn i on osaeconr i ah group W.s to lain of data, grop averges of all idio-t.ra for Capital urplun Oil op-ter an ofidictr ofArot oWter cd orEt.
Disposal1, Husig, Inton iintrinotion and Paverty for other coutry rops ar pepslatis-ueigbted neo-tric aca- onthut etc-on of thc otrene oaloe andthe nun populated conr..be herrrga of o-utrbes s-` th det-r depeds Id ealbiabliby of dta and Is sot unif.-, o-tie suit bees-rc-ndIs relting arrgr fon nbTtr oaote,maeasens r nal seu a prodatbatfhepend eAr ae iasis h odeio nindicator at I tins smng the oc-tony and referenc grosss.
LANDb ARM (thousad nibs,I.)Acs to teists Diepossl (peroet of population) - 'tI, urban end ruri Ttl-Total sufac_ae _npi ad are and Inndote-. Mushe of people (total, urban, en ual eod by -orrta dipIua Iapgrio,1tursl - Stint recet osnn-n of agrIcltra ara sd temprarLy Peroetenes of thrie rospetioc pniilti.ao. docrets dooponab mo inolauor peranetly for oroP, paut-e, aarlct and kiteban garde or to the oollsction end disposal1, ebtb sir thbst treataet, of h tuna rrts
lIeI falle. adwseanrby aster-hos Wyatea or the sac of pitprivisad -uGNP PER CAPITA (Ui$) - GNP Per espita estieatesaeu. n maktptrn Ppid.toncrPhsoa -Pplainuonety ubrOfpnt--n hyson
-aolae y ss oceniantbnd en WInd B-as Atlat (1976-t bais); qaiidfo ein tols nerot eei96o, 1970, end 1978 daafpplaltdr BunubeI Person Ptiai tydvIe bynnero-ratcngm
ENERGY CONSUMPTION PEc CAPITA -Annual onsspIoof Itm-c-n enrg end feasle g-nduate nurse, p-ati-mI nre,nd n-otet torte -.(..Ia and lignite, petroleu, natural gas end hynro-, cuoler end gro- Popoilhoe osital hodi- to.tni~, bcn n ror.i- I.oition (total, ubcthee-s eletricity) In kibioram of oal equivalent per capta; 1960, and rura) dved by tihe repoio-tne ofb-ooibdsas tlo ini9I0. end 1976 data. public end pr-onte generl and s,prioi-c bontpotni und r-btilntsto- voc,t-rHoopitalo ar- cnltmcopee-oetly otnffcd bp at teI o oyicn
PhUi,ATIOiM AND VITAL STATISTICS tnalsoospoiIgpicply'sollor r otocluded bursTttal Population Mud-tear (miio.s) A- Inf duly i; i9dyo, 197), end hocpitnic, bouot, include h-ltb and mcdios1 -rter sot p-ranotlp ots I`d-
UrbanPopultion peroet of tonsl) - st-o of u-ben to tots1 population; .it-pa ipt atamdatios and proide s limitedrnoolein aiioodifrn efntoso urha neen sap affect ... spaability of dais Adnobn e optlhd oa ue fs sitt to o douct9rge fecoamon Icut-ie; 196t, 1970, end 1975 data. bocpitalo dionded bp tieh ube fes
Populat-tits briJdetOiiINi979 totalppd intb by age and onen tbei"r jnrtalu1ty and fertility Peraelie fhonotd (pes-noperono-hod - otl,ub`t end -Irurates_ r.toto saeesfrnranyrtscarco be tuhi ossso oroP of Ieduvioal nbcib Rs Idigqatr e-ci anomig life eopeotany at bthihiebitenn u -iuteYo their uni ms A hoarder or 10cr nay or cup cot ho itliord on to-
pe onpita inom been, and fecial life enpeteny stbhilining at bo 'eb ,i or,tninti-nl popue.-71.5 year.- The paranter fo fertility rate alut bh.e three leeds ceA-ge -1,-e of peen-- per rontotal,_ra,edrrl-A..eage t-bo
-ousngdeoIice In fertility croodo-g to inem bred end past of per..no pe roI a in all urban, and -or.l copiod -- oet~on ... i oo 1femil clning perforane Ench ountry In tben asine neo these respeticly. hoellicnp e-lude ou-.persoet ott-oue end -- ocp-o p-rnice cohinntbo of motality aso fertility trends foe projetio Pofea to Kleotriot (preto2 utao otl,re!idrri-Co
OSt InyPopoIntocs - in I o.taio..ary populatii. there II so g9ath tctsl, urban, end rrlde ig ePetonioce tho birth rate In equsl to the death rate, end also tie ageItruo tirert-i-soontat. Thit an shietd only sfter fertility -atou fLiDATION
dcicto tbe replaceert level of en-nt reiproduction rate, abet Adjunted &lne1luset Patl-ob ucoeabo of unma replaces itself e-atly. The sattionar y PoIP- Prss-y cbhnb- totlIst en Iesl - drono tonsl, asIc n denoIle oointi 01c ant co Ime on the Iac of thepojce ehrotr_so et ofaiae.ttepiasyltls eonaeIo cpote rmr
otcppatiosi hbc , pea 00,-en 0t5
-sta of de-Is- of fertility u-b-l-ag oltitI omal i IIodI ohlro ged f-li poar Octrate torPlaemntI ociIdidoted foe differct 1etgt of p-io-Y edustion; i-eoloccouthea ttoaypIpaisti.. in r hobd - The yea hen stationar.y population --ncrol tdu..aoio ecr.... nic- asp -- ted 100 p-ret 0c mae p.,pl
fte hen bee race. arel,Il Ielom or o the officil notol age.Popula.tion Tent ty e_idoryool-total, male end femle - 0 eputed no oli, unooIsuern.i.-Mio-peac PP,tilti.c Per qaarc kilomter (100 be-taren if eductionreuie nletforyeant aprvdpr-"enro iotPd_i0
Per to. ia Ugi-ulturn lano - Ctsputrd an shone for agriruI1furi land usIlly of 12 to 17 yearn of' ho;orepondenoo-sr... III gio-rulponly. valudr.d
(1376 yeanI yrtired year end oe)aopeceag If mid-year trehoi-aI, ird-ntebI, or other p-ogr- ohio oh rt idpndi"pnpolatboe; 1160,t1970, end 1977 data. depar_tent of neco.ndary tistottions.
PouaiciroaRn (percent) - tata-Annual -rotb rates of toti mid- Psotec eratio-piay ~end -eo -y -Total ooudltnt e-rlio yer ioulnirnfo ISihO 190-0,I ad17 .pri_ne and necndr-y le-ei diobded by n.-rI I f heaoernsoi,eorroPonalation iroth hate Itret ra nulaot ae f urbanncoo rno
Iuuaba foe1506, 090-0 end 1970 -75. dl ieayrt pret irncaut sn vra aainnCrude hieth Rate or- thoucad )- Annua Ili-o bletho per thtoand of mid- ap--oetage of total dolt populoi-o aged 11 py- end doer.year popuisti_n; 1960, 1970, mad i977 data.frudl ManRte(r thooomd) - Aonos1 dantho Ile thousand usts -pear- CONBOPgPTIbN
poplaion; 1950, 1970, and 1977 data. Pnesrfr sr boedPoltso aono uororl ioecrntl eProdd-tiot Rte - hvAge cubec of dnightr- -1na 1 il bc- tenting lest than light Pe-.c.; -ldolode IIalenceI haeoaneItioo-
in bee o,-e -urp-od-ti- periods f tb h p cte prest ISr- -ciioie-opetifoc f_tablty _uten; ...oolly fir-year neergr -ndoog Ic 1960, Radio poori-rr (per thounad -- Rultsn .. ill tYP-, of eoI"I ro for -d-,1970, and 1975. braocnto genera plIc erohosdo ppiato;- oldnubcne
Panipy Plannig - Aceeton. A.noal(thco-ads~) - AnnoIl -ui- of reie-cr onnt-e and inyee abe h eio-.si of; -euis tioI atoineet rso birtb-o....... de-ie uder auPIcs of nationalI fami ly ,ffect. dats f-r -- et pyre an nut be ,oap-eole tier- a. so o-ociriplaning p-ngr- s`olinbed licenin.PaiilyPlsnog -Ilnro paven ofecie sours) -Pretage of marrid T0ptevrV(t thoonnd opuanit-) - TOIroeloert fc brondotot t oeceonset ofchild-hering age(iT~4 yses) rhoour olet-citrI droice ulcoc huad osai etrid _oitveed TVrecoe
to all married sonen I san ag getup. end in year ' cuerreitraioc of TV ceta si onffet.aNsesper C-rluition(oetpq
8ltion) -Stb_ tih. i--ergoe--lati-FOOD ANI) NUTRIT__ of dail genera1 l I_ca nu pape ,dfed aa n- perodca puIetcIles- of Pnnd ren_-d-ot- per fInts (1196971=100) - ideo of Pee -spita devted ~ crs ly toedoing ge-rlo1s-- It i~ e--nod-e oot. 'dii
-nua production of all ftId _osdine.-oieoludes necd end if it nIiear- at least f.o tbmacauIe.-fedad is on o-l-d-e Yea laIaI. CoasditoeItotr piasep gonde Cinem AsuiAttendaoc Per Captaat ea d thm l O -ib-o f t-k-ci(eg.suaratitetead of og,, shio are edhi s ..on utiniIod d-r.e the year, ioii- totssiocor nO eni_ t n)(g.offeean tenar riobde). iggregat producti- of mobh toefy ot
in Inn..d on aetioa aveag 1 producer Price ..ighto.Per capita _ulIp cfIalo . (percet of trouemen) - Computed from tAPIR FiObCene 1-e 1-vlet of net food naPPIec. avilable ic on-ony par tsPbtn ns.ao borneL(b ouas ..c.n...lynoie oio ... loing,. neec
pe ay vilbl nPple tuIprise do-et1i production, inp-et.la forcs ad Inenlopedl lo to-ladi ooein, n t Io hItfiobt e Iot', and ohug In 'tIlk, Bet nuppIIn ealode ei-sl feed, needs, ocvron dc.ot ar nt odyarblequnIto se i foo PeoeIng, and lite dindtteib.toos. teqaie easyfot - ni ai f- Irr a perteage o P tomb. .nbo-fre
sc,-tr, eteso by AOl bsond on pylyssnionica -nd, fcc ocioa Igpoyy,jreti lbor fo-o cc nIsIog, fo-oatrY, bunting arcneniy adbe1th to-ider- ag.....i..nte1a teapert-r, body -eighto, fichicg anpereetage of totall1 c forte.
age end -e dosteictitc ofpopaatioc, and allosig lb peroect for ondasty (pret-lbor ifloo in mining, Io.n.t-uti.t, enufatocito and-ate no hbou..boin leteI. eleot-ilt ao an P_na -erectgt of total InIo borer.
(-or epita spply f protin urao prtday) - -rnicit-t .5 pe-attiI..Pae(ecet otl ae andfen -irils ioespits et coplp of ood pe day. et cuply of fnnd Iis em oacivt rates ar e%tmptd as t.Ita, male, un .fase Ic fore terabot Req.uietmet foe~1 all .nutrie- eatblished by blo pred a sngo fttl aead female ptpulti-n of all agSn -cpelreisolsin a.looeno 605A gr-, of ntalt` oei pe 2m o 0 g _as of iS LI ,' and 17 aa Thes arc, thin parti-patoi cns elec
anma end polar protein o oho 10 gr-s should bEl anml-rnic -ootoouef te PoPulation, end long nos tred. P feesiocThec atanda-d see Iare nth those of 75 gram of total Protein and sef... ..atiosa.sIur.e.I-25 grass of animal poto,, as an averag for the sneld, p-npo-d by PAO Inninml _lependean.y Ratio - On-io of ppulno- order 15 end t~,Idon o1,tnI.orteTidWorld Food sroe.. the labo for_ In age grop of 15-61 yearn
Pmro"Pit, nrtebc suply ro nnma and pulse - Protein supply of finddsveedfro anmaltad pulaes. It gran roe day.iCinfI0B3I0
Ci'ld sn -a tentybn I tI(per thousand) - isA-1 deathb poe thoosand PIrcetge of Peltat Pnn (boon In o-.b end hood) R- ee-od by -ite-Is ag grop 1-1fear, to chTlee It thIa agr grop; for e _t er 5 .poten, richest PT peroot, poores t 20 percent, and pon-en4ubper-enoping -- tn-re dutn derived from I if. tables of households.
HELTHiC POVERTY fAPGITI GROtUPSjlife letancy at P11-th (OraI- -_ea-ge -eb-r of year oflift Estimateld Abobute Poverty .inis level (00$ Per capo'ta - urban aid rurlremaInng atbirth 1950,1975,and 177 dan.t iAlt pnvet inot lVet i that (sco I...e lee -eo hith a rin,leInfant F-tetltA,t,pe husn) -lsna drtb ofifnsudroe ntritionlly adeqonte dirt pIIc -ssetiaI tofoo .eq...e_eto is eon
Attens to Safe dater (pe-oennof pc taton - tnl. urban and rurl Ectimated Pelatee Pocety Incim I-el (00$ Per -pIta) - urban and corl Bomba of people )tntal,uba, ndrua uith~... reaonbl uI_es to Rural relatVle poesty iteone leorl Is os-third of -erag pe 05-Pitalcaester supply I insi.de treted surface astss ir entreated hueP-- pe a Incis of nth country. Ueban Ieeli deeoosd feco the cora ir_e
un.toaainaned o-t- suh a, that Cra protected .hosn-e, sPrings, aith siJotment f-r higher .totfli Ingbeubanaeand sanItary slle) as Pereentage_of their -p-etioe populations. be Estimated opltIo- belt AbnuePtet rar Ire erct' - ubnad
200 antee fremaIbo... s.apb be seierd sne, sithln r55-bl5a Ies f tbstlue nrrlaeseanml sasud-ieplythat Itlhe boseIfe or neabar of the houshod do nt hae n ped Rsni and SInoa bans bIobs_dla1pe-trin...te part of the dsp on fetching the fanlly's .t sa .e neds bec_oi iAOlyci and Projeetno- bepartoent
August 1979
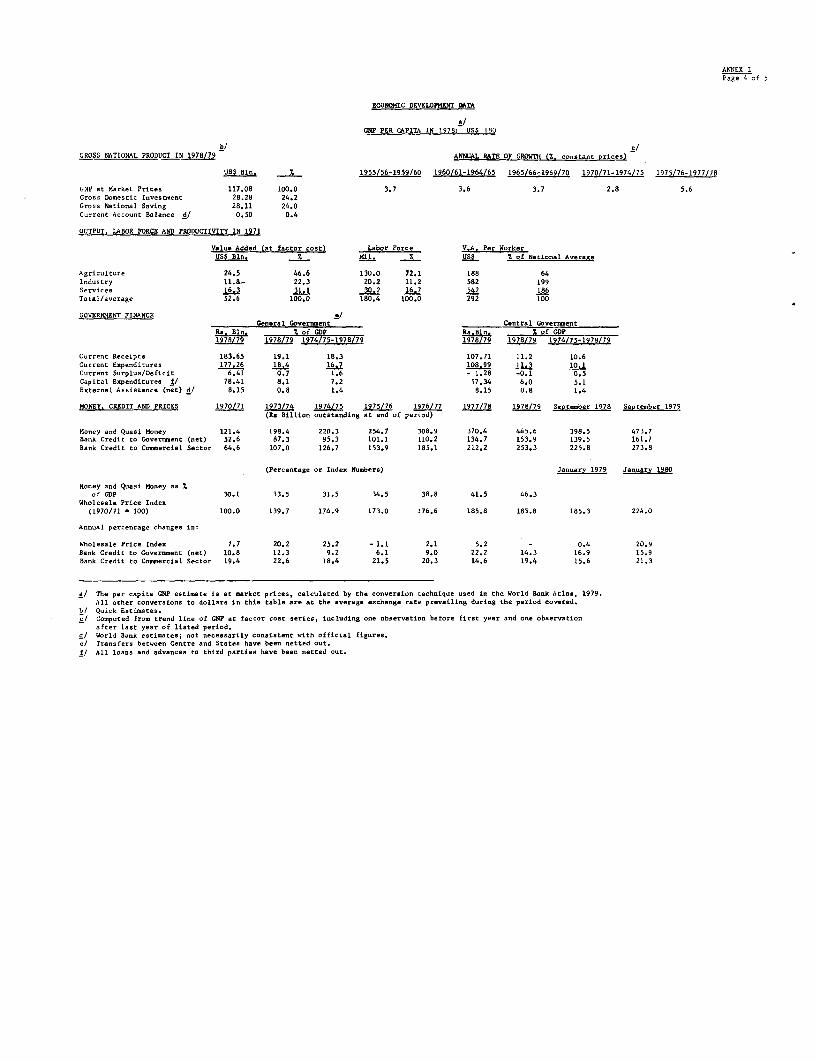
ANNEX IPage 4 of 5
ECONOMIC DEVELOPMENT DATA
a/GNP PER CAPITA IN 1978: USS 180
b/ c/GROSS NATIONAL PRODUCT IN 1978/79 ANNUAL RATE OF GROWTH (M. constant prices)
US5 Bln. % 1955/56-1959/60 1960/61-1964/65 1965/66-1969/70 1970/71-1974/75 1975/76-1977/78
GNP at Market Prices 117.08 100.0 3.7 3.6 3.7 2.8 5.6Grass Do.estic Investeent 28.28 24.2Crass National Saving 28.11 24.0C-rrent Account Balance d/ 0.50 0.4
OUTPUT. LABOR FORCE AND PRODUCTIVITY IN 1971
Value Added (at factor cost) Labor Force V.A. Per WorkerUS$ Bln. % Mil. % US0$ of National Averaee
Agriculture 24.5 46.6 130.0 72.1 188 64Indastry 11.8- 22.3 20.2 11.2 582 199Services 16.3 31.1 30.2 16.7 542 186Total/average 52.6 100.0 180.4 100.0 292 100
GOVERNMENT FINANCEGenoral Goverment Central Government
R.. Bc. of GDP Rs'Brs %o GiOPRs9 79 _97 1974/75-1978/79 1978179 1974/75-1978/79
Corrent Receipts 183.65 19.1 18.3 107.71 11.2 10.6Current Expenditures 177.26 18.4 16.7 108.99 11.3 10,1Current Surplun/Deficit 6.41 0.7 1.6 - 1.28 -0.1 0.5Capital Expenditures f/ 78.41 8.1 7.2 57.34 6.0 5.1External Assistan-e (net) d/ 8.15 0.8 1.4 8.15 0.8 1.4
MONEY. CREDIT AND PRICES 1970171 1973/74 1974/75 1975/76 1976/77 1977/78 1978/79 Sente-ber 1978 September 1979(Rs Billion outstanding at end of period)
Money aod Quasi Money 121.4 198.4 220.3 254.7 308.9 370.4 445.6 398.5 473.7Back Credit to Governaent (net) 52.6 87.3 95.3 101.1 110.2 134.7 153.9 139.5 161.7Bank Credit to Cornercial Sector 64.6 107.0 126.7 153.9 185.1 212.2 253.3 225.8 273.8
(Percentage or Index Numbers) January 1979 January 1980
Money and Quasi Money as %of GDP 30.1 33.5 31.5 34.5 38.8 41.5 46.3
Wholesale Price Index(1970/71 - 100) 100.0 139.7 174.9 173.0 176.6 185.8 185.8 185.3 224.0
Annaul percentage changes in:
Wholesale Price Index 7.7 20.2 25.2 - 1.1 2.1 5.2 - 0.4 20.9Bank Credit to Government (net) 10.8 12.3 9.2 6.1 9.0 22.2 14.3 16.9 15.9Bank Credit to Coesercial Sector 19.4 22.6 18.4 21.5 20.3 14.6 19.4 15.6 21.3
I/ The per capita GNP estimate is at market prices, calculated by the conversion technique used in the World Bank Atlas, 1979.All other co-versions to dollars in this table are at the average exchange rate prevailing during the period covered.
b/ Quick Estimates.c/ Computed from trend line of GNP at factor cost series, including one observation before first year and one observation
after last year of listed period.d/ World Bomk estimates; not necessarily consistent with official figures.e/ Transfers between Centre and States have been netted out.f/ All leans and advances to third parties have been netted out.
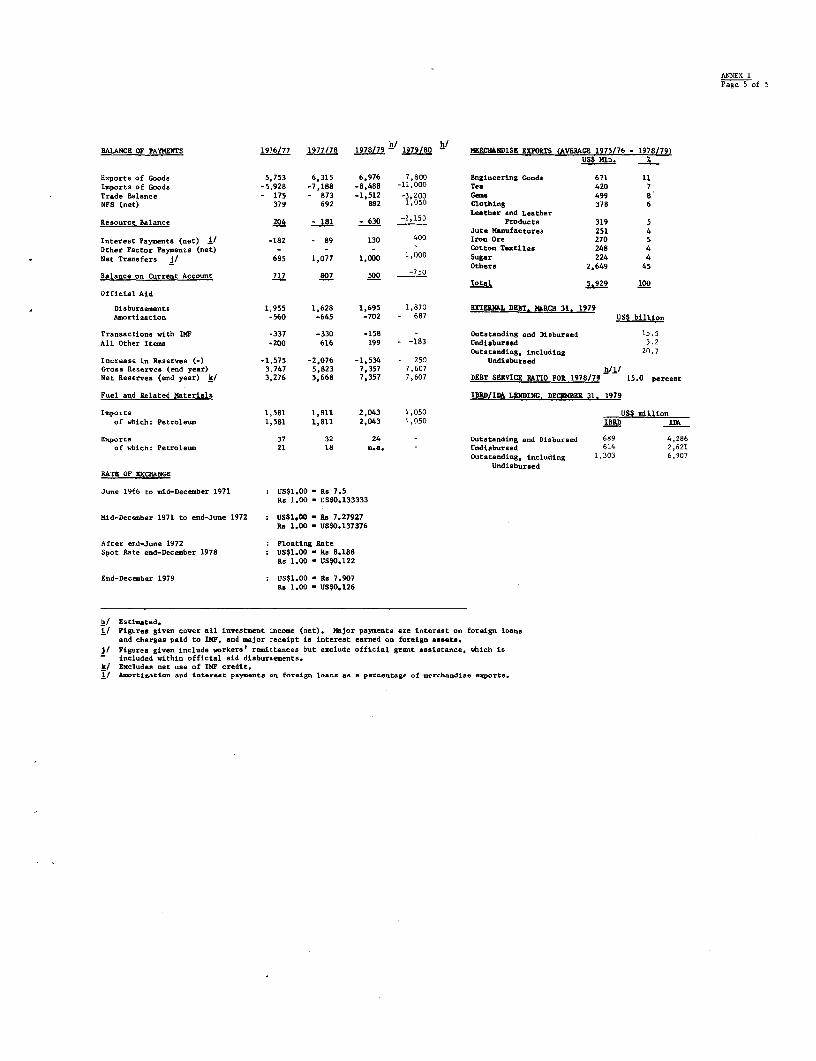
ANNEX IPage 5 of 5
BALANCE OF PAYMENTS 1976/77 1977/78 1978/79 h 1979/80 h MERCH4NDISE EXPORTS (AVERAGE 1975/76 - 1978/79)US$ Mlni, !E
Exports of Goods 5,753 6,315 6,976 7,800 Engineering Goods 671 11Imports of Goods -5,928 -7,188 -8,488 -11,000 Tea 420 7Trade Balance - 175 - 873 -1,512 -3,200 Gems 499 8NFS (net) 379 692 882 1,050 Clothing 378 6
Leather and LeatherResource Balance 204 - 181 - 630 -2,15D Products 319 5
Jute Manufactures 251 4Interest Payments (net) i/ -182 - 89 130 400 Iron Ore 270 5Other Factor Payments (net) - - - - Cotton Textiles 248 4Net Transfers j/ 695 1,077 1,000 1,000 Sugar 224 4
-750 Others 2,649 45Balance on Current Account 717 807 500 -750
Iotal 5.929 100OOfficial Aid
Disbursements 1,955 1,628 1,695 1,870 EXTERNiAL DEBT, M4RCH 31. 1979Amortization -560 -645 -702 - 687 US$ billion
Transactions with IMF -337 -330 -158 - Outstanding and Disbursed 15.5All Other Items -200 616 199 -183 Undisbursed 5.2
Outstanding, including 20.7Increase in Reserves (-) -1,575 -2,076 -1,534 - 250 UndisbursedGross Reserves (end year) 3,747 5,823 7,357 7,607 h/l/Net Reserves (end year) k/ 3,276 5,668 7,357 7,607 DEBT SERVICE RATIO FOR 1978/79 15.0 percent
Fuel and Related Materials IBRD/IDA LENDING, DECEMBER 31. 1979
Imports 1,581 1,811 2,043 4,050 US millionof which: Petroleum 1,581 1,811 2,043 1,050 IBRD IDA
exports 37 32 24 _ Outstanding and Disbursed 689 4,286of which: Petroleum 21 18 n.a. - Undisbursed 614 2,621
Outstanding, including 1,303 6,907Undisbursed
RATE OF EXCHANGE
June 1966 to mid-December 1971 US$1.00 - Rs 7.5Rs 1.00 - US$0.133333
Mid-December 1971 to end-June 1972 US$1.00 - Rs 7.27927Rs 1.00 - US$0.137376
After ned-June 1972 Floating RateSpot Rate end-December 1978 : US$1.00 - Rs 8.188
Rs 1.00 - U050.122
End-Decmber 1979 : US$1.00 - R 7.907Rs 1.00 - U5S0.126
hi Estimated.i/ Figures given cover all investment income (net). Major payments are interest on foreign loans
and charges paid to IMF, and major receipt ta interest earned on foreign assets.J/ Figures given include workers' remittances but exclude official grant assistance, which is
included within official aid disbursements,h1i Excludes net use of Itl credit.1/ A-otisation and interest payments on foreign leans as a percentage of merchandise exports.
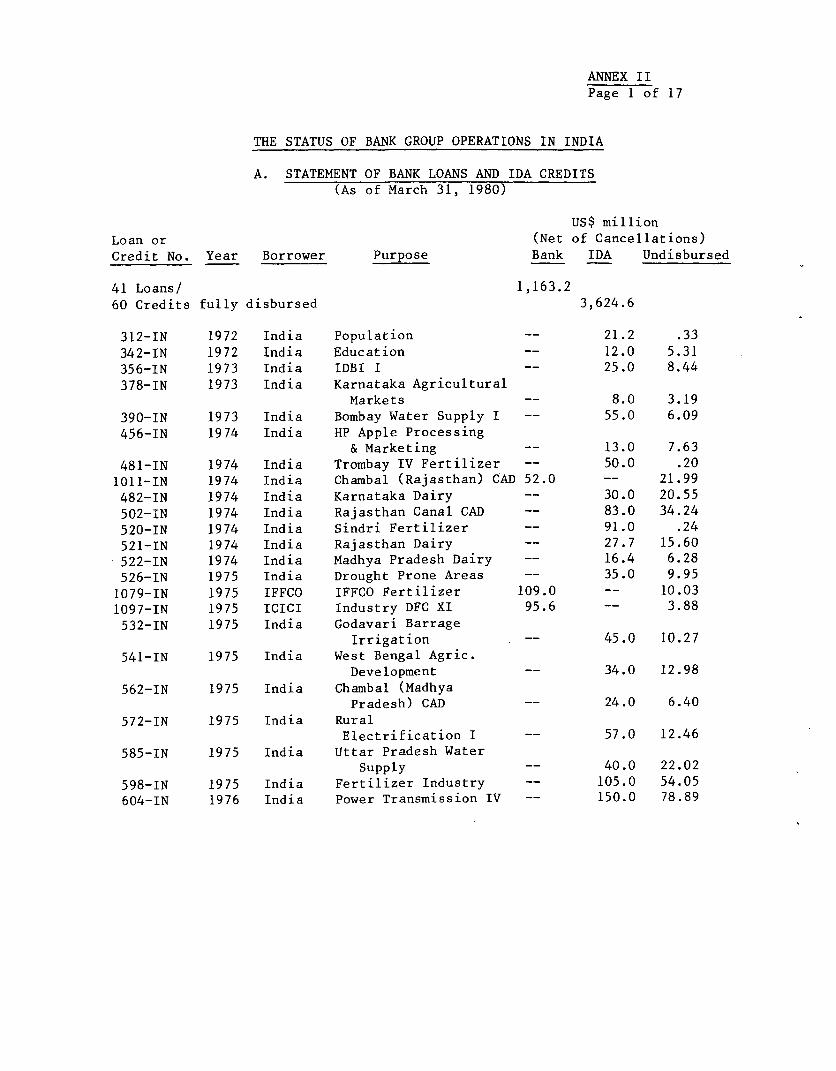
ANNEX IIPage 1 of 17
THE STATUS OF BANK GROUP OPERATIONS IN INDIA
A. STATEMENT OF BANK LOANS AND IDA CREDITS(As of March 31, 1980)
US$ millionLoan or (Net of Cancellations)Credit No. Year Borrower Purpose Bank IDA Undisbursed
41 Loans/ 1,163.260 Credits fully disbursed 3,624.6
312-IN 1972 India Population -- 21.2 .33342-IN 1972 India Education -- 12.0 5.31356-IN 1973 India IDBI I -- 25.0 8.44378-IN 1973 India Karnataka Agricultural
Markets -- 8.0 3.19390-IN 1973 India Bombay Water Supply I -- 55.0 6.09456-IN 1974 India HP Apple Processing
& Marketing -- 13.0 7.63481-IN 1974 India Trombay IV Fertilizer -- 50.0 .201011-IN 1974 India Chambal (Rajasthan) CAD 52.0 -- 21.99482-IN 1974 India Karnataka Dairy -- 30.0 20.55502-TN 1974 India Rajasthan Canal CAD -- 83.0 34.24520-IN 1974 India Sindri Fertilizer -- 91.0 .24521-IN 1974 India Rajasthan Dairy -- 27.7 15.60522-IN 1974 India Madhya Pradesh Dairy -- 16.4 6.28526-IN 1975 India Drought Prone Areas -- 35.0 9.951079-IN 1975 IFFCO IFFCO Fertilizer 109.0 -- 10.031097-IN 1975 ICICI Industry DFC XI 95.6 -- 3.88532-IN 1975 India Godavari Barrage
Irrigation -- 45.0 10.27541-IN 1975 India West Bengal Agric.
Development -- 34.0 12.98562-IN 1975 India Chambal (Madhya
Pradesh) CAD -- 24.0 6.40572-IN 1975 India Rural
Electrification I -- 57.0 12.46585-IN 1975 India Uttar Pradesh Water
Supply -- 40.0 22.02598-IN 1975 India Fertilizer Industry -- 105.0 54.05604-IN 1976 India Power Transmission IV -- 150.0 78.89
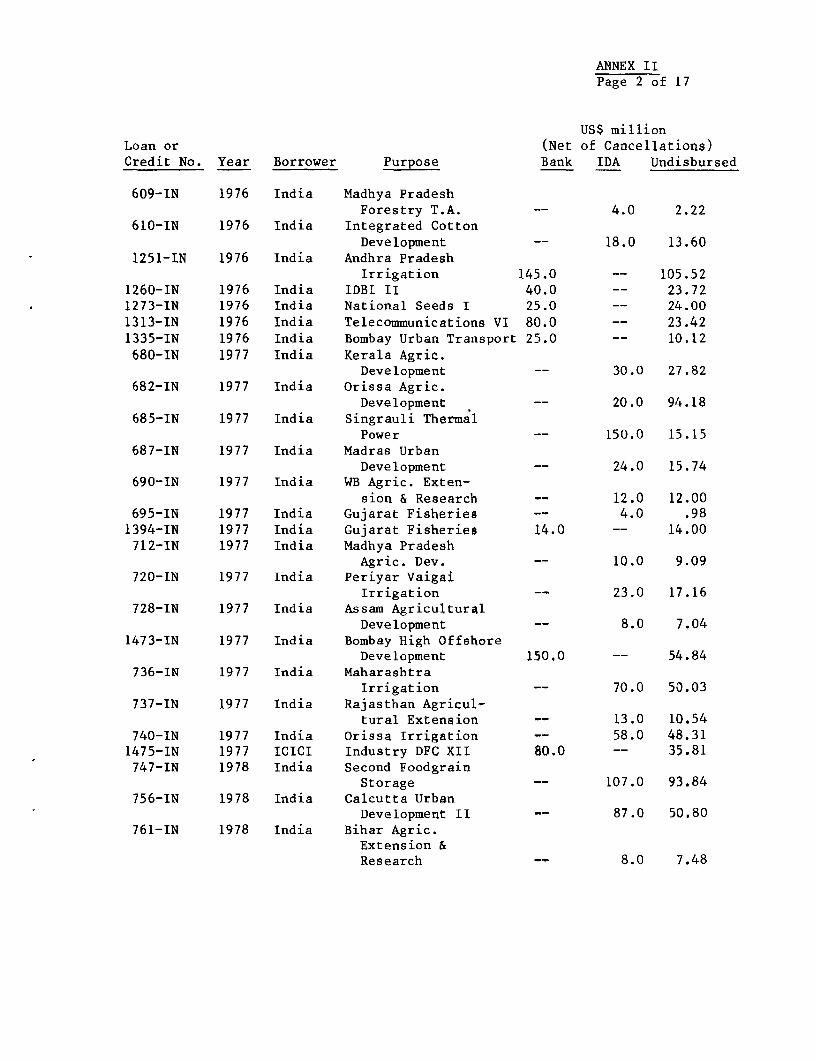
ANNEX IIPage 2 of 17
US$ millionLoan or (Net of Cancellations)Credit No. Year Borrower Purpose Bank IDA Undisbursed
609-IN 1976 India Madhya PradeshForestry T.A. -- 4.0 2.22
610-IN 1976 India Integrated CottonDevelopment -- 18.0 13.60
1251-IN 1976 India Andhra PradeshIrrigation 145.0 -- 105.52
1260-IN 1976 India IDBI II 40.0 -- 23.72
1273-IN 1976 India National Seeds I 25.0 -- 24.001313-IN 1976 India Telecommunications VI 80.0 -- 23.421335-IN 1976 India Bombay Urban Transport 25.0 -- 10.12680-IN 1977 India Kerala Agric.
Development -- 30.0 27.82
682-IN 1977 India Orissa Agric.Development -- 20.0 94.18
685-IN 1977 India Singrauli ThermalPower -- 150.0 15.15
687-IN 1977 India Madras UrbanDevelopment -- 24.0 15.74
690-IN 1977 India WB Agric. Exten-sion & Research -- 12.0 12.00
695-IN 1977 India Gujarat Fisheries -- 4.0 .981394-IN 1977 India Gujarat Fisheries 14.0 -- 14.00712-IN 1977 India Madhya Pradesh
Agric. Dev. -- 10.0 9.09720-IN 1977 India Periyar Vaigai
Irrigation -- 23.0 17.16
728-IN 1977 India Assam AgriculturalDevelopment -- 8.0 7.04
1473-IN 1977 India Bombay High OffshoreDevelopment 150.0 -- 54.84
736-IN 1977 India MaharasbtraIrrigation -- 70.0 50.03
737-IN 1977 India Rajasthan Agricul-tural Extension -- 13.0 10.54
740-IN 1977 India Orissa Irrigation -- 58.0 48.311475-IN 1977 ICICI Industry DFC XII 80.0 -- 35.81747-IN 1978 India Second Foodgrain
Storage -- 107.0 93.84
756-IN 1978 India Calcutta UrbanDevelopment II -- 87.0 50.80
761-IN 1978 India Bihar Agric.Extension &Research -- 8.0 7.48
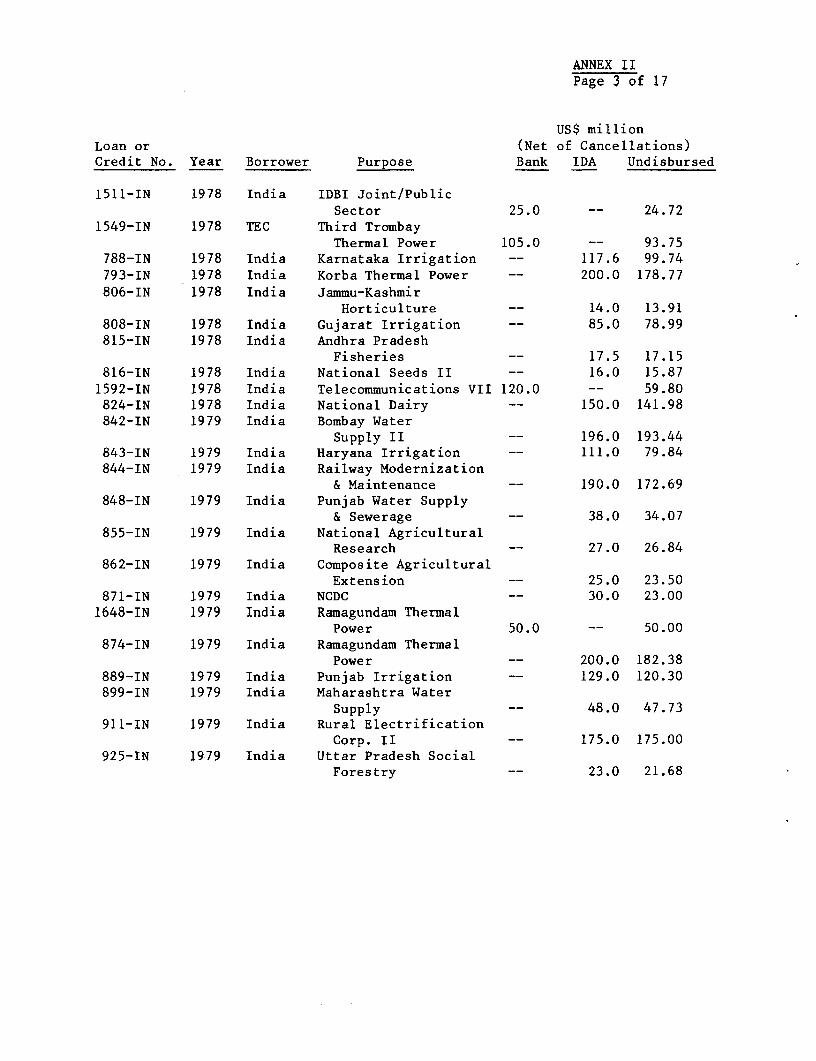
ANNEX IIPage 3 of 17
US$ millionLoan or (Net of Cancellations)Credit No. Year Borrower Purpose Bank IDA Undisbursed
1511-IN 1978 India IDBI Joint/PublicSector 25.0 -- 24.72
1549-IN 1978 TEC Third TrombayThermal Power 105.0 -- 93.75
788-IN 1978 India Karnataka Irrigation -- 117.6 99.74793-IN 1978 India Korba Thermal Power -- 200.0 178.77806-IN 1978 India Jammu-Kashmir
Horticulture -- 14.0 13.91808-IN 1978 India Gujarat Irrigation -- 85.0 78.99815-IN 1978 India Andhra Pradesh
Fisheries -- 17.5 17.15816-IN 1978 India National Seeds II -- 16.0 15.871592-IN 1978 India Telecommunications VII 120.0 -- 59.80824-IN 1978 India National Dairy -- 150.0 141.98842-IN 1979 India Bombay Water
Supply II -- 196.0 193.44843-IN 1979 India Haryana Irrigation -- 111.0 79.84844-IN 1979 India Railway Modernization
& Maintenance -- 190.0 172.69848-IN 1979 India Punjab Water Supply
& Sewerage -- 38.0 34.07855-IN 1979 India National Agricultural
Research -- 27.0 26.84862-IN 1979 India Composite Agricultural
Extension -- 25.0 23.50871-IN 1979 India NCDC -- 30.0 23.001648-IN 1979 India Ramagundam Thermal
Power 50.0 -- 50.00874-IN 1979 India Ramagundam Thermal
Power -- 200.0 182.38889-IN 1979 India Punjab Irrigation -- 129.0 120.30899-IN 1979 India Maharashtra Water
Supply -- 48.0 47.73911-IN 1979 India Rural Electrification
Corp. II -- 175.0 175.00925-IN 19-79 India Uttar Pradesh Social
Forestry -- 23.0 21.68
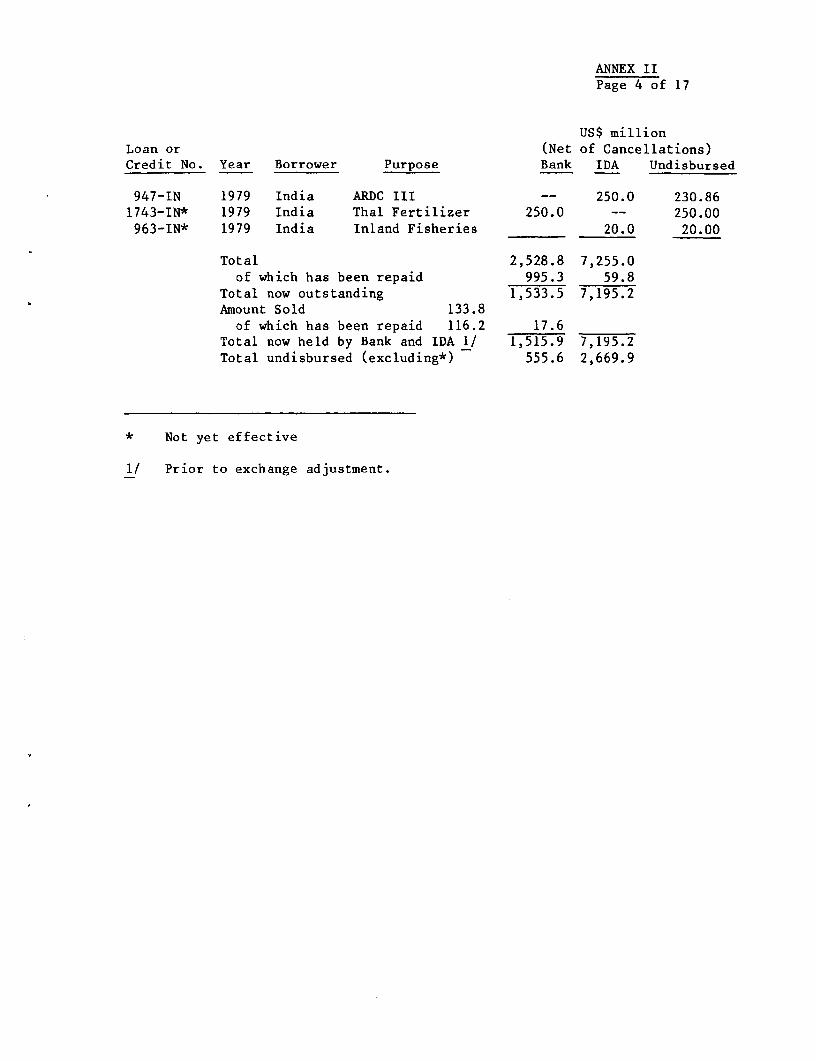
ANNEX IIPage 4 of 17
US$ millionLoan or (Net of Cancellations)Credit No. Year Borrower Purpose Bank IDA Undisbursed
947-IN 1979 India ARDC III -- 250.0 230.861743-IN* 1979 India Thal Fertilizer 250.0 -- 250.00963-IN* 1979 India Inland Fisheries 20.0 20.00
Total 2,528.8 7,255.0of which has been repaid 995.3 59.8
Total now outstanding 1,533.5 7,195.2Amount Sold 133.8
of which has been repaid 116.2 17.6
Total now held by Bank and IDA 1/ 1,515.9 7,195.2Total undisbursed (excluding*) 555.6 2,669.9
* Not yet effective
1/ Prior to exchange adjustment.
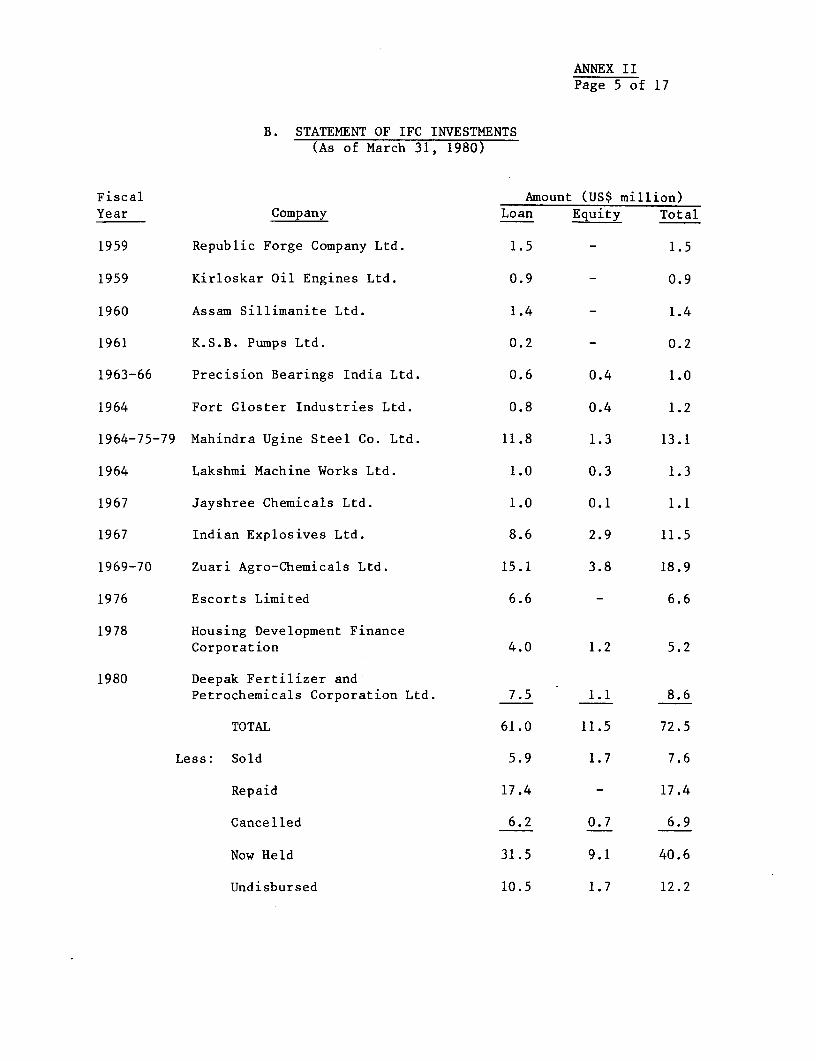
ANNEX IIPage 5 of 17
B. STATEMENT OF IFC INVESTMENTS(As of March 31, 1980)
Fiscal Amount (US$ million)Year Company Loan Equity Total
1959 Republic Forge Company Ltd. 1.5 - 1.5
1959 Kirloskar Oil Engines Ltd. 0.9 - 0.9
1960 Assam Sillimanite Ltd. 1.4 - 1.4
1961 K.S.B. Pumps Ltd. 0.2 - 0.2
1963-66 Precision Bearings India Ltd. 0.6 0.4 1.0
1964 Fort Gloster Industries Ltd. 0.8 0.4 1.2
1964-75-79 Mahindra Ugine Steel Co. Ltd. 11.8 1.3 13.1
1964 Lakshmi Machine Works Ltd. 1.0 0.3 1.3
1967 Jayshree Chemicals Ltd. 1.0 0.1 1.1
1967 Indian Explosives Ltd. 8.6 2.9 11.5
1969-70 Zuari Agro-Chemicals Ltd. 15.1 3.8 18.9
1976 Escorts Limited 6.6 - 6.6
1978 Housing Development FinanceCorporation 4.0 1.2 5.2
1980 Deepak Fertilizer andPetrochemicals Corporation Ltd. 7.5 1.1 8.6
TOTAL 61.0 11.5 72.5
Less: Sold 5.9 1.7 7.6
Repaid 17.4 - 17.4
Cancelled 6.2 0.7 6.9
Now Held 31.5 9.1 40.6
Undisbursed 10.5 1.7 12.2
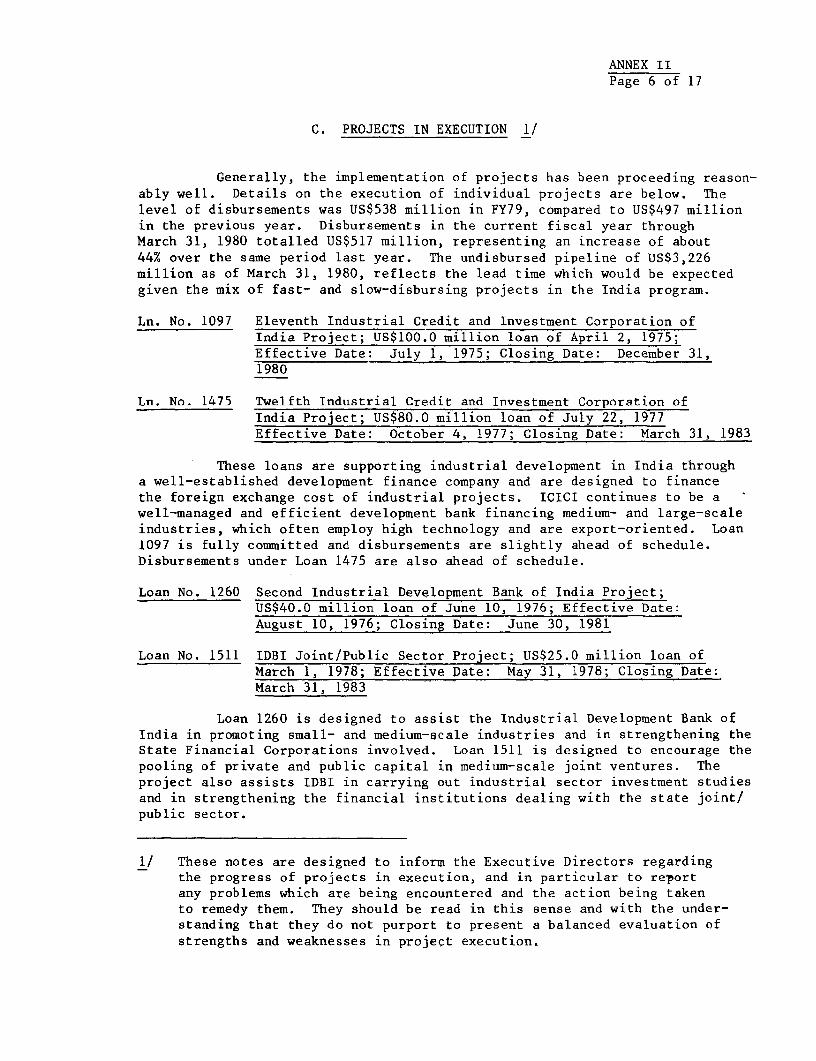
ANNEX IIPage 6 of 17
C. PROJECTS IN EXECUTION 1/
Generally, the implementation of projects has been proceeding reason-ably well. Details on the execution of individual projects are below. Thelevel of disbursements was US$538 million in FY79, compared to US$497 millionin the previous year. Disbursements in the current fiscal year throughMarch 31, 1980 totalled US$517 million, representing an increase of about44% over the same period last year. The undisbursed pipeline of US$3,226million as of March 31, 1980, reflects the lead time which would be expectedgiven the mix of fast- and slow-disbursing projects in the India program.
Ln. No. 1097 Eleventh Industrial Credit and Investment Corporation ofIndia Project; US$100.0 million loan of April 2, 1975;Effective Date: July 1, 1975; Closing Date: December 31,1980
Ln. No. 1475 Twelfth Industrial Credit and Investment Corporation ofIndia Project; US$80.0 million loan of July 22, 1977Effective Date: October 4, 1977; Closing Date: March 31, 1983
These loans are supporting industrial development in India througha well-established development finance company and are designed to financethe foreign exchange cost of industrial projects. ICICI continues to be a -well-managed and efficient development bank financing medium- and large-scaleindustries, which often employ high technology and are export-oriented. Loan1097 is fully committed and disbursements are slightly ahead of schedule.Disbursements under Loan 1475 are also ahead of schedule.
Loan No. 1260 Second Industrial Development Bank of India Project;US$40.0 million loan of June 10, 1976; Effective Date:August 10, 1976; Closing Date: June 30, 1981
Loan No. 1511 IDBI Joint/Public Sector Project; US$25.0 million loan ofMarch 1, 1978; Effective Date: May 31, 1978; Closing Date:March 31, 1983
Loan 1260 is designed to assist the Industrial Development Bank ofIndia in promoting small- and medium-scale industries and in strengthening theState Financial Corporations involved. Loan 1511 is designed to encourage thepooling of private and public capital in medium-scale joint ventures. Theproject also assists IDBI in carrying out industrial sector investment studiesand in strengthening the financial institutions dealing with the state joint/public sector.
1/ These notes are designed to inform the Executive Directors regardingthe progress of projects in execution, and in particular to retortany problems which are being encountered and the action being takento remedy them. They should be read in this sense and with the under-standing that they do not purport to present a balanced evaluation ofstrengths and weaknesses in project execution.

ANNEX II _Page 7 of 17
Cr. No. 947 Third Agricultural Refinance and Development Corporation(ARDC) Project; US$250.0 million credit of August 20, 1979;Effective Date: January 2, 1980; Closing Date: June 30,1982
Refinancing of lending to farmers has been started under this projectafter the completion of the Second ARDC Project towards the end of 1979.
Cr. No. 747 Second Foodgrain Storage Project; US$107.0 million credit ofJanuary 6, 1978; Effective Date: May 17, 1978; Closing Date:June 30, 1982
As of September 1979, satisfactory progress was being made inthe construction of bag storage warehouses, despite problems of land acqui-sition at some sites. However, construction of flat bulk warehouses andport silos is not expected to be completed until 1985, as a result of delaysin the employment of consultants and the longer time required for the prepa-ration of technical specifications and tenders and the construction itself.
Cr. No. 456 Himachal Pradesh Apple Processing and Marketing Project;US$13.0 million credit of January 22, 1974; Effective Date:September 26, 1974; Closing Date: December 31, 1980
The project encountered prolonged initial delays due to managerialand technical problems. These problems have been largely resolved, but con-struction progress remains slow due to material shortages and severe winterconditions. Initial packing house operations were undertaken in the lasttwo seasons with favorable response from farmers. The project is scheduledfor completion by December 1980.
Cr. No. 806 Jammu-Kashmir Horticulture Project; US$US$14.0 million creditof July 17, 1978; Effective Date: January 16, 1979;Closing Date: June 30, 1984
The principal executing agency, J&K Horticulture Produce Marketingand Processing Corporation, is under strong management and rapid progress hasbeen made in start-up operations with only minor slippage. The project'sresearch activities, however, are behind the original schedule due to poororganization.
Ln. No. 1313 Telecommunications VI Project; US$80.0 million loanof July 22, 1976; Effective Date: September 14, 1976Closing Date: March 31, 1982
Ln. No. 1592 Telecommunications VII Project; US$US$120.0 million loanof June 19, 1978; Effective Date: October 30, 1978;Closing Date: March 31, 1982
Both projects are progressing satisfactorily, although as ofNovember 1979, when they were last reviewed, imports of electronic switchingequipment and local production of electro-mechanical switching equipment
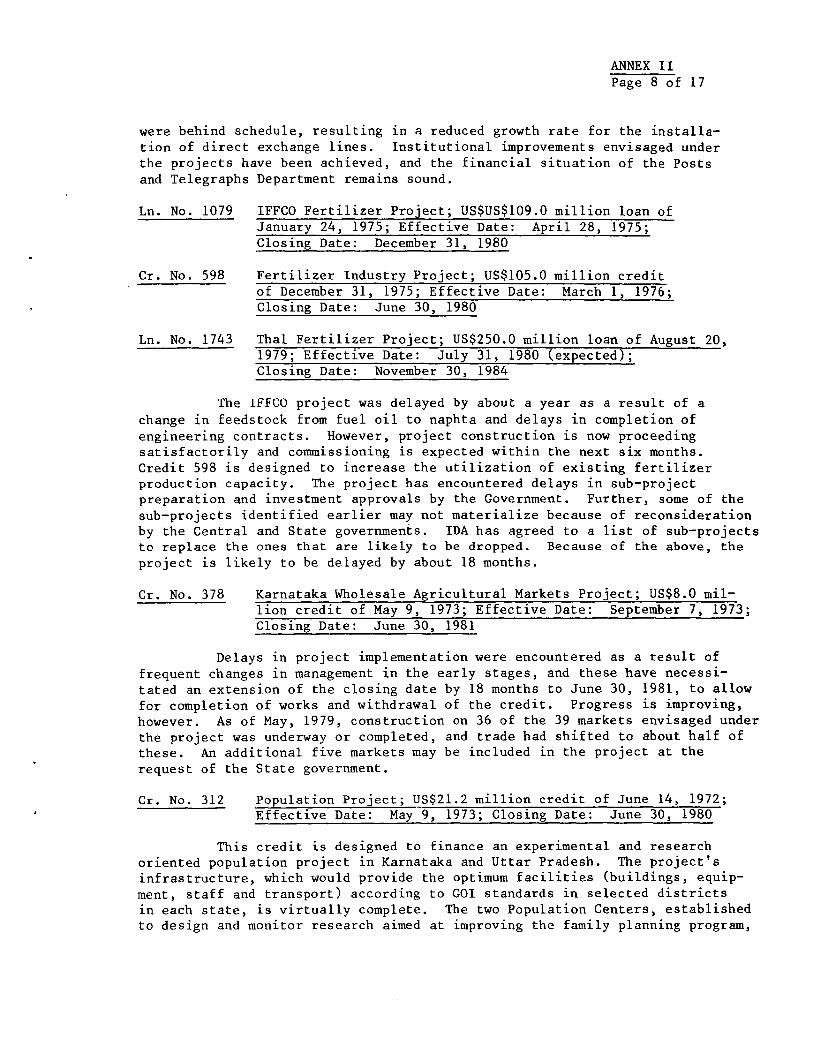
ANNEX IIPage 8 of 17
were behind schedule, resulting in a reduced growth rate for the installa-tion of direct exchange lines. Institutional improvements envisaged underthe projects have been achieved, and the financial situation of the Postsand Telegraphs Department remains sound.
Ln. No. 1079 IFFCO Fertilizer Project; US$US$109.0 million loan ofJanuary 24, 1975; Effective Date: April 28, 1975;Closing Date: December 31, 1980
Cr. No. 598 Fertilizer Industry Project; US$105.0 million creditof December 31, 1975; Effective Date: March 1, 1976;Closing Date: June 30, 1980
Ln. No. 1743 Thai Fertilizer Project; US$250.0 million loan of August 20,1979; Effective Date: July 31, 1980 (expected);Closing Date: November 30, 1984
The IFFCO project was delayed by about a year as a result of achange in feedstock from fuel oil to naphta and delays in completion ofengineering contracts. However, project construction is now proceedingsatisfactorily and commissioning is expected within the next six months.Credit 598 is designed to increase the utilization of existing fertilizerproduction capacity. The project has encountered delays in sub-projectpreparation and investment approvals by the Government. Further, some of thesub-projects identified earlier may not materialize because of reconsiderationby the Central and State governments. IDA has agreed to a list of sub-projectsto replace the ones that are likely to be dropped. Because of the above, theproject is likely to be delayed by about 18 months.
Cr. No. 378 Karnataka Wholesale Agricultural Markets Project; US$8.0 mil-lion credit of May 9, 1973; Effective Date: September 7, 1973;Closing Date: June 30, 1981
Delays in project implementation were encountered as a result offrequent changes in management in the early stages, and these have necessi-
tated an extension of the closing date by 18 months to June 30, 1981, to allowfor completion of works and withdrawal of the credit. Progress is improving,however. As of May, 1979, construction on 36 of the 39 markets envisaged underthe project was underway or completed, and trade had shifted to about half ofthese. An additional five markets may be included in the project at therequest of the State government.
Cr. No. 312 Population Project; US$21.2 million credit of June 14, 1972;Effective Date: May 9, 1973; Closing Date: June 30, 1980
This credit is designed to finance an experimental and researchoriented population project in Karnataka and Uttar Pradesh. The project'sinfrastructure, which would provide the optimum facilities (buildings, equip-ment, staff and transport) according to GOI standards in selected districtsin each state, is virtually complete. The two Population Centers, establishedto design and monitor research aimed at improving the family planning program,
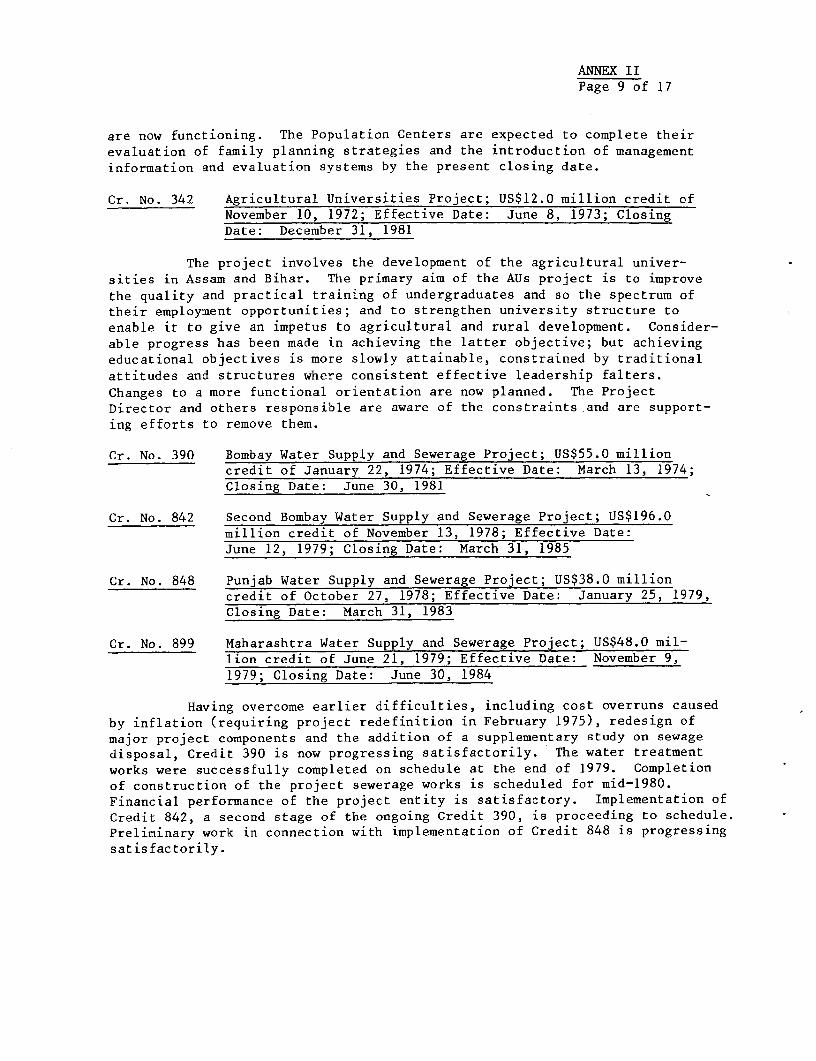
ANNEX IIPage 9 of 17
are now functioning. The Population Centers are expected to complete theirevaluation of family planning strategies and the introduction of management
information and evaluation systems by the present closing date.
Cr. No. 342 Agricultural Universities Project; US$12.0 million credit ofNovember 10, 1972; Effective Date: June 8, 1973; ClosingDate: December 31, 1981
The project involves the development of the agricultural univer-
sities in Assam and Bihar. The primary aim of the AUs project is to improve
the quality and practical training of undergraduates and so the spectrum oftheir employment opportunities; and to strengthen university structure to
enable it to give an impetus to agricultural and rural development. Consider-
able progress has been made in achieving the latter objective; but achieving
educational objectives is more slowly attainable, constrained by traditional
attitudes and structures where consistent effective leadership falters.
Changes to a more functional orientation are now planned. The Project
Director and others responsible are aware of the constraints and are support-ing efforts to remove them.
Cr. No. 390 Bombay Water Supply and Sewerage Project; US$55.0 millioncredit of January 22, 1974; Effective Date: March 13, 1974;Closing Date: June 30, 1981
Cr. No. 842 Second Bombay Water Supply and Sewerage Project; US$196.0million credit of November 13, 1978; Effective Date:June 12, 1979; Closing Date: March 31, 1985
Cr. No. 848 Punjab Water Supply and Sewerage Project; US$38.0 millioncredit of October 27, 1978; Effective Date: January 25, 1979,Closing Date: March 31, 1983
Cr. No. 899 Maharashtra Water Supply and Sewerage Project; US$48.0 mil-lion credit of June 21, 1979; Effective Date: November 9,1979; Closing Date: June 30, 1984
Having overcome earlier difficulties, including cost overruns caused
by inflation (requiring project redefinition in February 1975), redesign of
major project components and the addition of a supplementary study on sewagedisposal, Credit 390 is now progressing satisfactorily. The water treatment
works were successfully completed on schedule at the end of 1979. Completionof construction of the project sewerage works is scheduled for mid-1980.Financial performance of the project entity is satisfactory. Implementation ofCredit 842, a second stage of the ongoing Credit 390, is proceeding to schedule.Preliminary work in connection with implementation of Credit 848 is progressing
satisfactorily.
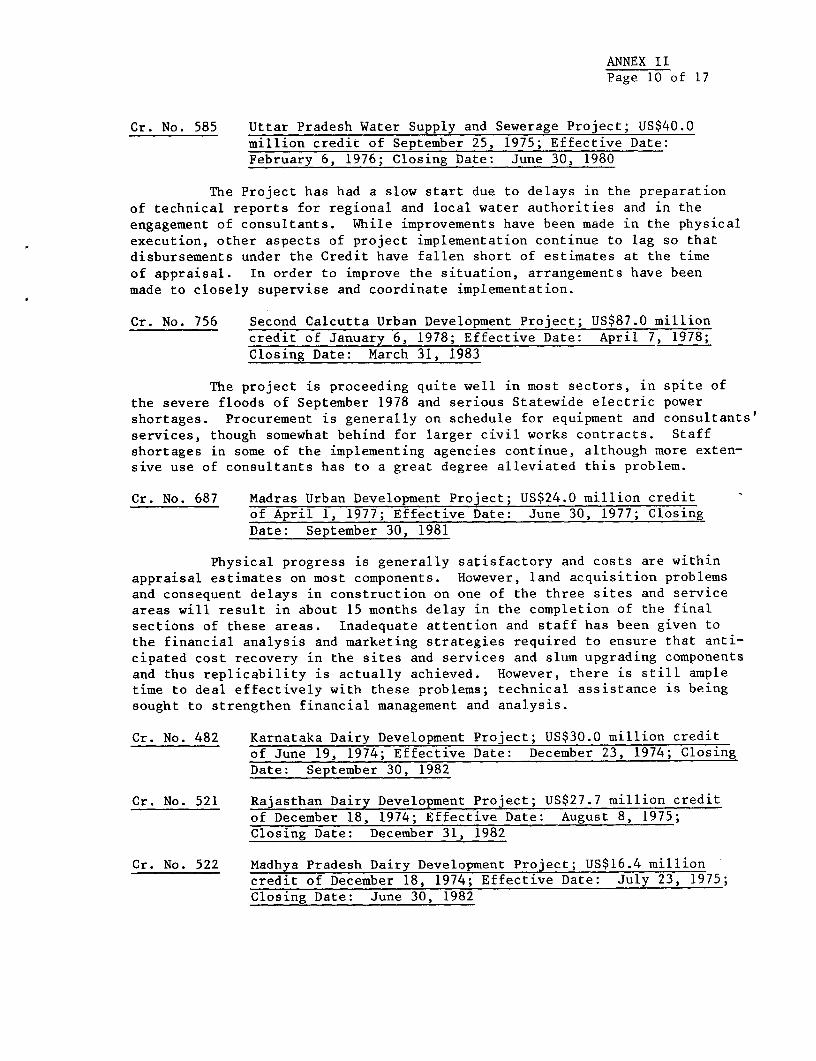
ANNEX IIPage 10 of 17
Cr. No. 585 Uttar Pradesh Water Supply and Sewerage Project; US$40.0million credit of September 25, 1975; Effective Date:February 6, 1976; Closing Date: June 30, 1980
The Project has had a slow start due to delays in the preparation
of technical reports for regional and local water authorities and in theengagement of consultants. While improvements have been made in the physicalexecution, other aspects of project implementation continue to lag so thatdisbursements under the Credit have fallen short of estimates at the time
of appraisal. In order to improve the situation, arrangements have beenmade to closely supervise and coordinate implementation.
Cr. No. 756 Second Calcutta Urban Development Project; US$87.0 millioncredit of January 6, 1978; Effective Date: April 7, 1978;
Closing Date: March 31, 1983
The project is proceeding quite well in most sectors, in spite of
the severe floods of September 1978 and serious Statewide electric powershortages. Procurement is generally on schedule for equipment and consultants'
services, though somewhat behind for larger civil works contracts. Staffshortages in some of the implementing agencies continue, although more exten-sive use of consultants has to a great degree alleviated this problem.
Cr. No. 687 Madras Urban Development Project; US$24.0 million creditof April 1, 1977; Effective Date: June 30, 1977; ClosingDate: September 30, 1981
Physical progress is generally satisfactory and costs are withinappraisal estimates on most components. However, land acquisition problemsand consequent delays in construction on one of the three sites and serviceareas will result in about 15 months delay in the completion of the finalsections of these areas. Inadequate attention and staff has been given tothe financial analysis and marketing strategies required to ensure that anti-cipated cost recovery in the sites and services and slum upgrading componentsand thus replicability is actually achieved. However, there is still ampletime to deal effectively with these problems; technical assistance is beingsought to strengthen financial management and analysis.
Cr. No. 482 Karnataka Dairy Development Project; US$30.0 million creditof June 19, 1974; Effective Date: December 23, 1974; ClosingDate: September 30, 1982
Cr. No. 521 Rajasthan Dairy Development Project; US$27.7 million creditof December 18, 1974; Effective Date: August 8, 1975;Closing Date: December 31, 1982
Cr. No. 522 Madhya Pradesh Dairy Development Project; US$16.4 millioncredit of December 18, 1974; Effective Date: July 23, 1975;Closing Date: June 30, 1982
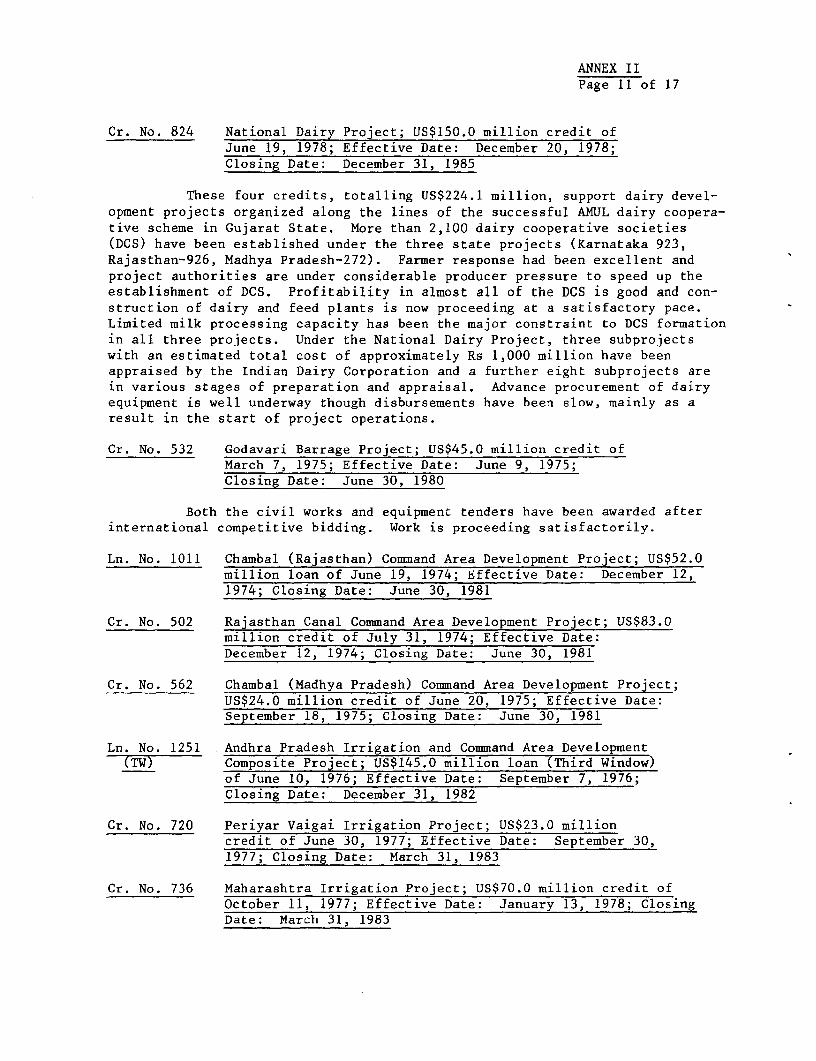
ANNEX IIPage 11 of 17
Cr. No. 824 National Dairy Project; US$150.0 million credit ofJune 19, 1978; Effective Date: December 20, 1978;Closing Date: December 31, 1985
These four credits, totalling US$224.1 million, support dairy devel-opment projects organized along the lines of the successful AMUL dairy coopera-tive scheme in Gujarat State. More than 2,100 dairy cooperative societies(DCS) have been established under the three state projects (Karnataka 923,Rajasthan-926, Madhya Pradesh-272). Farmer response had been excellent andproject authorities are under considerable producer pressure to speed up theestablishment of DCS. Profitability in almost all of the DCS is good and con-struction of dairy and feed plants is now proceeding at a satisfactory pace.Limited milk processing capacity has been the major constraint to DCS formationin all three projects. Under the National Dairy Project, three subprojectswith an estimated total cost of approximately Rs 1,000 million have beenappraised by the Indian Dairy Corporation and a further eight subprojects arein various stages of preparation and appraisal. Advance procurement of dairyequipment is well underway though disbursements have been slow, mainly as aresult in the start of project operations.
Cr. No. 532 Godavari Barrage Project; US$45.0 million credit ofMarch 7, 1975; Effective Date: June 9, 1975;Closing Date: June 30, 1980
Both the civil works and equipment tenders have been awarded afterinternational competitive bidding. Work is proceeding satisfactorily.
Ln. No. 1011 Chambal (Rajasthan) Command Area Development Project; US$52.0million loan of June 19, 1974; Effective Date: December 12,1974; Closing Date: June 30, 1981
Cr. No. 502 Rajasthan Canal Command Area Development Project; US$83.0million credit of July 31, 1974; Effective Date:December 12, 1974; Closing Date: June 30, 1981
Cr. No. 562 Chambal (Madhya Pradesh) Command Area Development Project;US$24.0 million credit of June 20, 1975; Effective Date:September 18, 1975; Closing Date: June 30, 1981
Ln. No. 1251 Andhra Pradesh Irrigation and Command Area DevelopmentTW) Composite Project; US$145.0 million loan (Third Window)
of June 10, 1976; Effective Date: September 7, 1976;Closing Date: December 31, 1982
Cr. No. 720 Periyar Vaigai Irrigation Project; US$23.0 millioncredit of June 30, 1977; Effective Date: September 30,1977; Closing Date: March 31, 1983
Cr. No. 736 Maharashtra Irrigation Project; US$70.0 million credit ofOctober 11, 1977; Effective Date: January 13, 1978; ClosingDate: March 31, 1983
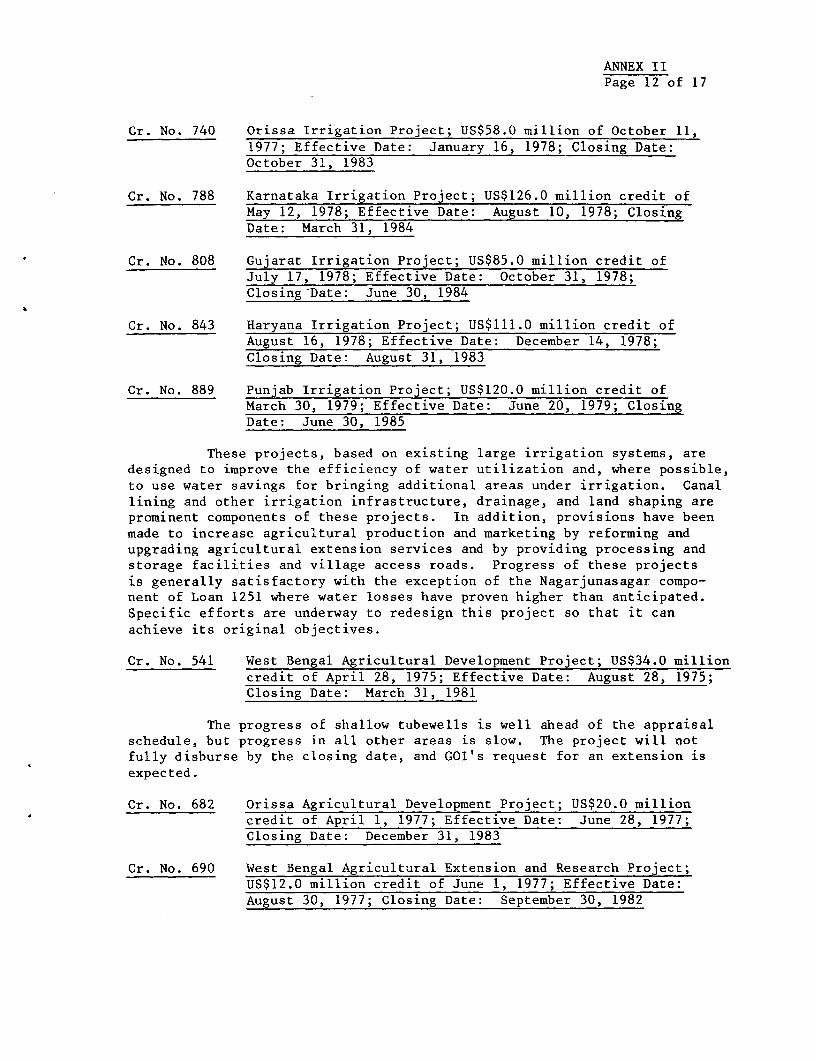
ANNEX IIPage 12 of 17
Cr. No. 740 Orissa Irrigation Project; US$58.0 million of October 11,1977; Effective Date: January 16, 1978; Closing Date:October 31, 1983
Cr. No. 788 Karnataka Irrigation Project; US$126.0 million credit ofMay 12, 1978; Effective Date: August 10, 1978; ClosingDate: March 31, 1984
Cr. No. 808 Gujarat Irrigation Project; US$85.0 million credit ofJuly 17, 1978; Effective Date: October 31, 1978;Closing-Date: June 30, 1984
Cr. No. 843 Haryana Irrigation Project; US$111.0 million credit ofAugust 16, 1978; Effective Date: December 14, 1978;Closing Date: August 31, 1983
Cr. No. 889 Punjab Irrigation Project; US$120.0 million credit ofMarch 30, 1979; Effective Date: June 20, 1979; ClosingDate: June 30, 1985
These projects, based on existing large irrigation systems, aredesigned to improve the efficiency of water utilization and, where possible,to use water savings for bringing additional areas under irrigation. Canallining and other irrigation infrastructure, drainage, and land shaping areprominent components of these projects. In addition, provisions have beenmade to increase agricultural production and marketing by reforming andupgrading agricultural extension services and by providing processing andstorage facilities and village access roads. Progress of these projectsis generally satisfactory with the exception of the Nagarjunasagar compo-nent of Loan 1251 where water losses have proven higher than anticipated.Specific efforts are underway to redesign this project so that it canachieve its original objectives.
Cr. No. 541 West Bengal Agricultural Development Project; US$34.0 millioncredit of April 28, 1975; Effective Date: August 28, 1975;Closing Date: March 31, 1981
The progress of shallow tubewells is well ahead of the appraisalschedule, but progress in all other areas is slow. The project will notfully disburse by the closing date, and GOI's request for an extension isexpected.
Cr. No. 682 Orissa Agricultural Development Project; US$20.0 millioncredit of April 1, 1977; Effective Date: June 28, 1977;Closing Date: December 31, 1983
Cr. No. 690 West Bengal Agricultural Extension and Research Project;US$12.0 million credit of June 1, 1977; Effective Date:August 30, 1977; Closing Date: September 30, 1982

ANNEX IIPage 13 of 17
Cr. No. 712 Madhya Pradesh Agricultural Extension and Research Project;US$10.0 million credit of June 1, 1977; Effective Date:September 2, 1977; Closing Date: September 30, 1983
Cr. No. 728 Assam Agricultural Development Project; US$8.0 million creditof June 30, 1977; Effective Date: September 30, 1977;Closing Date: March 31, 1983
Cr. No. 737 Rajasthan Agricultural Extension and Research Project;US$13.0 million credit of November 14, 1977; Effective
Date: February 6, 1978; Closing Date: June 30, 1983
Cr. No. 761 Bihar Agricultural Extension and Research Project; US$8.0million credit of January 6, 1978; Effective Date: May 2,1978; Closing Date: October 31, 1983
Cr. No. 862 Composite Agricultural Extension Project, US$25.0 millioncredit of February 16, 1979; Effective Date (expected):December 14, 1979; Closing Date: December 31, 1984
These seven credits finance the reorganization and strengthening
of agricultural extension services and the development of adaptive research
capabilities in nine States in India. In areas where the reformed extension
system is in full operation, field results have been very good, both in terms
of adoption of new agricultural techniques and of increased crop yields. In
Rajasthan, Assam, and Orissa, in particular, significant gains have been madeunder the projects. In West Bengal, where a change in government brought a
review of the organizational principles underlying the new extension system
and an accompanying hiatus in project implementation, a recent Cabinet deci-
sion has reaffirmed the State Government's commitment to the project and
revised implementation plans are under preparation. In Bihar and MadhyaPradesh, staff shortages, particularly in supervisory and managerial posts,
have hampered project implementation, although progress in areas whereregular extension visits are being made attests to the efficacy of the
system itself. Finally, in Gujarat, Haryana and Karnataka, all coveredunder the Composite Agricultural Extension Project (which is not yet effec-tive), project implementation is still in the very early stages, althoughimportant early administrative and financial steps have been taken which
should pave the way for effective operation of the reorganized extensionsystem.
Cr. No. 855 National Agriculture Research Project; US$27.0 million
credit of December 7, 1978; Effective Date: January 22,1979; Closing Date: September 30, 1983
While the initial sanctioning of research subprojects under this
project was somewhat slower than expected, due to staff shortages in the
Project Unit, the pace has picked up considerably in recent months. Commit-ment of funds to research subprojects in FY80 is expected to meet or evenexceed appraisal estimates, although corresponding disbursements may lagsomewhat behind the original estimates. Additions to the staff of theProject Unit are being recommended to expedite further progress under the
project.
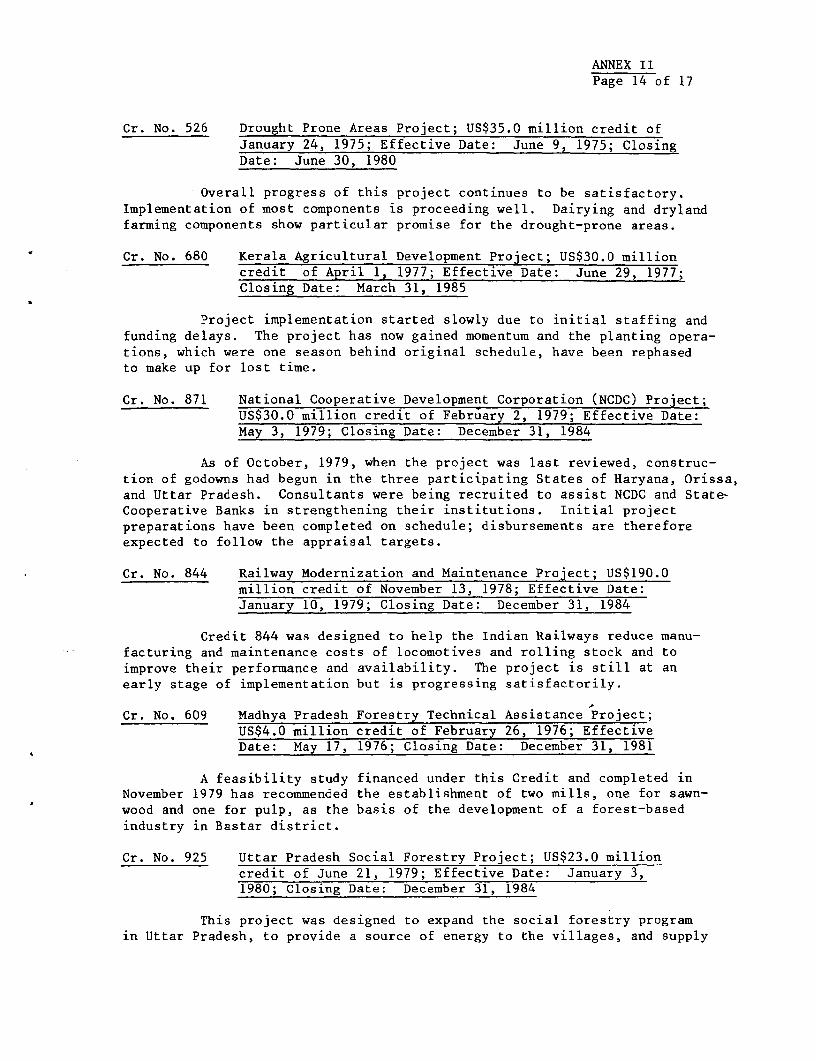
ANNEX IIPage 14 of 17
Cr. No. 526 Drought Prone Areas Project; US$35.0 million credit ofJanuary 24, 1975; Effective Date: June 9, 1975; ClosingDate: June 30, 1980
Overall progress of this project continues to be satisfactory.Implementation of most components is proceeding well. Dairying and drylandfarming components show particular promise for the drought-prone areas.
Cr. No. 680 Kerala Agricultural Development Project; US$30.0 millioncredit of April 1, 1977; Effective Date: June 29, 1977;Closing Date: March 31, 1985
Project implementation started slowly due to initial staffing andfunding delays. The project has now gained momentum and the planting opera-tions, which were one season behind original schedule, have been rephasedto make up for lost time.
Cr. No. 871 National Cooperative Development Corporation (NCDC) Project;US$30.0 million credit of Februtary 2, 1979; Effective Date:May 3, 1979; Closing Date: December 31, 1984
As of October, 1979, when the project was last reviewed, construc-tion of godowns had begun in the three participating States of Haryana, Orissa,and Uttar Pradesh. Consultants were being recruited to assist NCDC and State-Cooperative Banks in strengthening their institutions. Initial projectpreparations have been completed on schedule; disbursements are thereforeexpected to follow the appraisal targets.
Cr. No. 844 Railway Modernization and Maintenance Project; US$190.0million credit of November 13, 1978; Effective Date:January 10, 1979; Closing Date: December 31, 1984
Credit 844 was designed to help the Indian Railways reduce manu-facturing and maintenance costs of locomotives and rolling stock and toimprove their performance and availability. The project is still at anearly stage of implementation but is progressing satisfactorily.
Cr. No. 609 Madhya Pradesh Forestry Technical Assistance Project;US$4.0 million credit of February 26, 1976; EffectiveDate: May 17, 1976; Closing Date: December 31, 1981
A feasibility study financed under this Credit and completed inNovember 1979 has recommended the establishment of two mills, one for sawn-wood and one for pulp, as the basis of the development of a forest-basedindustry in Bastar district.
Cr. No. 925 Uttar Pradesh Social Forestry Project; US$23.0 millioncredit of June 21, 1979; Effective Date: January 3,1980; Closing Date: December 31, 1984
This project was designed to expand the social forestry programin Uttar Pradesh, to provide a source of energy to the villages, and supply
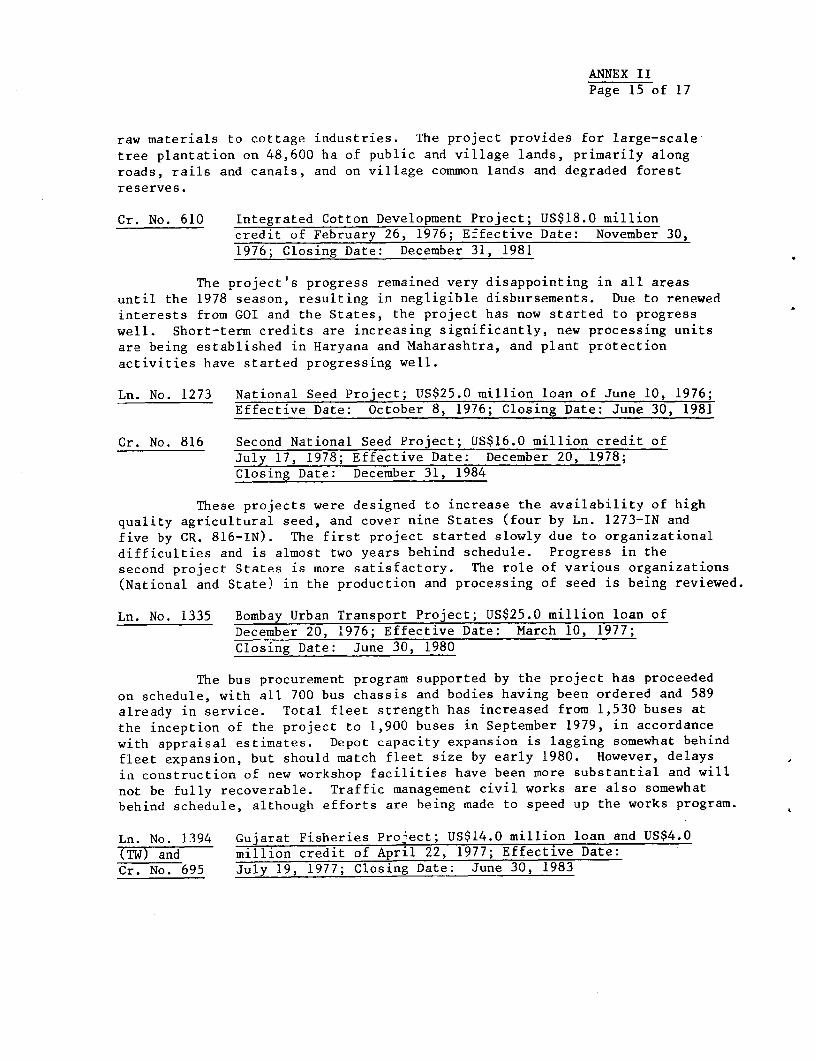
ANNEX IIPage 15 of 17
raw materials to cottage industries. The project provides for large-scale
tree plantation on 48,600 ha of public and village lands, primarily along
roads, rails and canals, and on village common lands and degraded forest
reserves.
Cr. No. 610 Integrated Cotton Development Project; US$18.0 millioncredit of February 26, 1976; Effective Date: November 30,1976; Closing Date: December 31, 1981
The project's progress remained very disappointing in all areas
until the 1978 season, resulting in negligible disbursements. Due to renewed
interests from GOI and the States, the project has now started to progress
well. Short-term credits are increasing significantly, new processing unitsare being established in Haryana and Maharashtra, and plant protection
activities have started progressing well.
Ln. No. 1273 National Seed Project; US$25.0 million loan of June 10, 1976;Effective Date: October 8, 1976; Closing Date: June 30, 1981
Cr. No. 816 Second National Seed Project; US$16.0 million credit ofJuly 17, 1978; Effective Date: December 20, 1978;Closing Date: December 31, 1984
These projects were designed to increase the availability of high
quality agricultural seed, and cover nine States (four by Ln. 1273-IN and
five by CR. 816-IN). The first project started slowly due to organizational
difficulties and is almost two years behind schedule. Progress in thesecond project States is more satisfactory. The role of various organizations
(National and State) in the production and processing of seed is being reviewed.
Ln. No. 1335 Bombay Urban Transport Project; US$25.0 million loan ofDecember 20, 1976; Effective Date: March 10, 1977;Closing Date: June 30, 1980
The bus procurement program supported by the project has proceeded
on schedule, with all 700 bus chassis and bodies having been ordered and 589
already in service. Total fleet strength has increased from 1,530 buses at
the inception of the project to 1,900 buses in September 1979, in accordancewith appraisal estimates. Depot capacity expansion is lagging somewhat behind
fleet expansion, but should match fleet size by early 1980. However, delaysin construction of new workshop facilities have been more substantial and will
not be fully recoverable. Traffic management civil works are also somewhatbehind schedule, although efforts are being made to speed up the works program.
Ln. No. 1394 Gujarat Fisheries Project; US$14.0 million loan and US$4.0
(TW) and million credit of April 22, 1977; Effective Date:Cr. No. 695 July 19, 1977; Closing Date: June 30, 1983
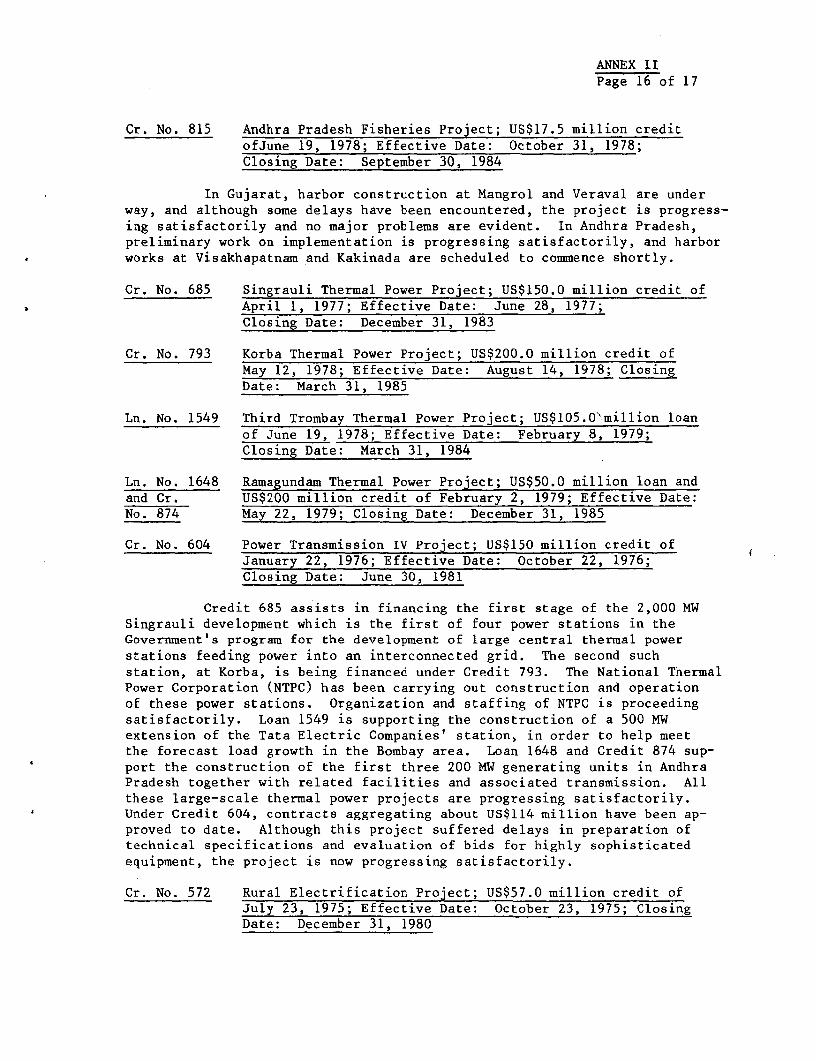
ANNEX IIPage 16 of 17
Cr. No. 815 Andhra Pradesh Fisheries Project; US$17.5 million creditofJune 19, 1978; Effective Date: October 31, 1978;Closing Date: September 30, 1984
In Gujarat, harbor construction at Mangrol and Veraval are underway, and although some delays have been encountered, the project is progress-ing satisfactorily and no major problems are evident. In Andhra Pradesh,preliminary work on implementation is progressing satisfactorily, and harborworks at Visakhapatnam and Kakinada are scheduled to commence shortly.
Cr. No. 685 Singrauli Thermal Power Project; US$150.0 million credit ofApril 1, 1977; Effective Date: June 28, 1977;Closing Date: December 31, 1983
Cr. No. 793 Korba Thermal Power Project; US$200.0 million credit ofMay 12, 1978; Effective Date: August 14, 1978; ClosingDate: March 31, 1985
Ln. No. 1549 Third Trombay Thermal Power Project; US$105.0'million loanof June 19, 1978; Effective Date: February 8, 1979;Closing Date: March 31, 1984
Ln. No. 1648 Ramagundam Thermal Power Project; US$50.0 million loan andand Cr. US$200 million credit of February 2, 1979; Effective Date:No. 874 May 22, 1979; Closing Date: December 31, 1985
Cr. No. 604 Power Transmission IV Project; US$150 million credit ofJanuary 22, 1976; Effective Date: October 22, 1976;Closing Date: June 30, 1981
Credit 685 assists in financing the first stage of the 2,000 MWSingrauli development which is the first of four power stations in theGovernment's program for the development of large central thermal powerstations feeding power into an interconnected grid. The second suchstation, at Korba, is being financed under Credit 793. The National ThermalPower Corporation (NTPC) has been carrying out construction and operationof these power stations. Organization and staffing of NTPC is proceedingsatisfactorily. Loan 1549 is supporting the construction of a 500 MWextension of the Tata Electric Companies' station, in order to help meetthe forecast load growth in the Bombay area. Loan 1648 and Credit 874 sup-port the construction of the first three 200 MW generating units in AndhraPradesh together with related facilities and associated transmission. Allthese large-scale thermal power projects are progressing satisfactorily.Under Credit 604, contracts aggregating about US$114 million have been ap-proved to date. Although this project suffered delays in preparation oftechnical specifications and evaluation of bids for highly sophisticatedequipment, the project is now progressing satisfactorily.
Cr. No. 572 Rural Electrification Project; US$57.0 million credit ofJuly 23, 1975; Effective Date: October 23, 1975; ClosingDate: December 31, 1980
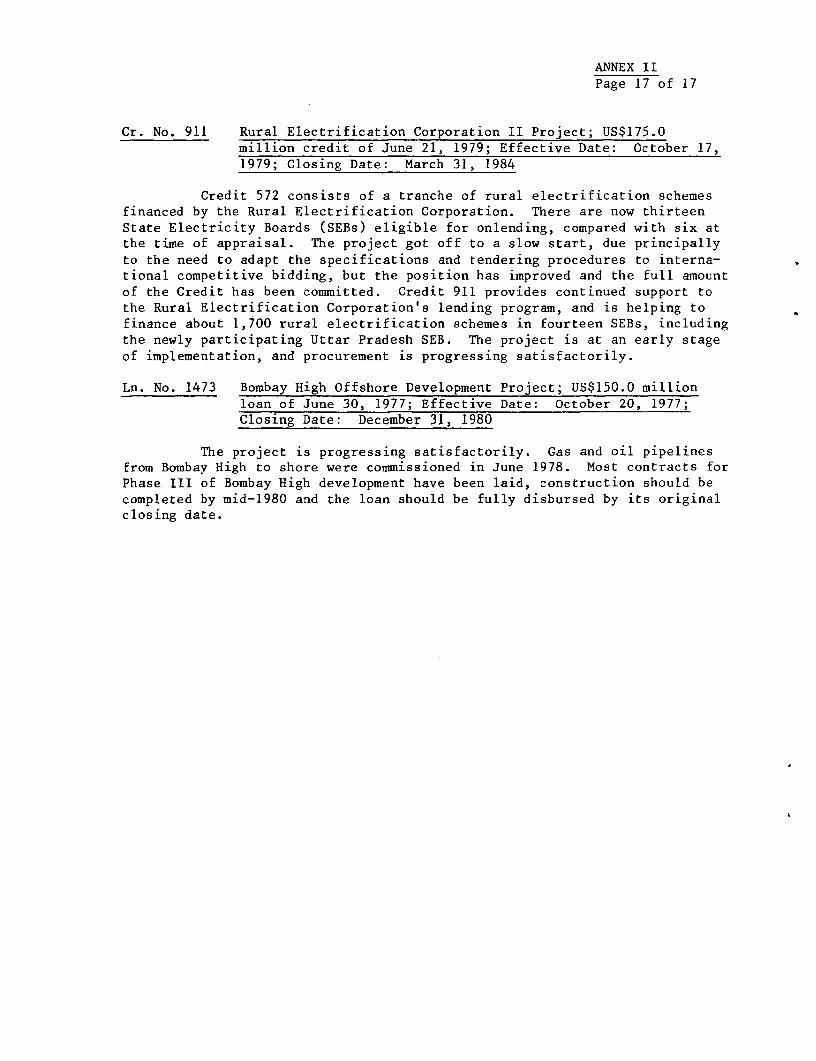
ANNEX IIPage 17 of 17
Cr. No. 911 Rural Electrification Corporation II Project; US$175.0million credit of June 21, 1979; Effective Date: October 17,1979; Closing Date: March 31, 1984
Credit 572 consists of a tranche of rural electrification schemesfinanced by the Rural Electrification Corporation. There are now thirteenState Electricity Boards (SEBs) eligible for onlending, compared with six atthe time of appraisal. The project got off to a slow start, due principallyto the need to adapt the specifications and tendering procedures to interna-tional competitive bidding, but the position has improved and the full amountof the Credit has been committed. Credit 911 provides continued support tothe Rural Electrification Corporation's lending program, and is helping tofinance about 1,700 rural electrification schemes in fourteen SEBs, includingthe newly participating Uttar Pradesh SEB. The project is at an early stageof implementation, and procurement is progressing satisfactorily.
Ln. No. 1473 Bombay High Offshore Development Project; US$150.0 millionloan of June 30, 1977; Effective Date: October 20, 1977;Closing Date: December 31, 1980
The project is progressing satisfactorily. Gas and oil pipelinesfrom Bombay High to shore were commissioned in June 1978. Most contracts forPhase III of Bombay High development have been laid, construction should becompleted by mid-1980 and the loan should be fully disbursed by its originalclosing date.
ANNEX IIIPage 1
INDIA
FARAKKA THERMAL POWER PROJECT
SUPPLEMENTARY PROJECT DATA SHEET
Section I: (a) Timetable of Key Events
This project is the first stage of the fourthCentrally owned large power station in India.A report on the project site was published inDecember 1974 and a supplemental feasibilityreport was prepared in May 1979.
(b) The agencies which have prepared the project
Ministry of Energy/Central Electricity Authority/National Thermal Power Corporation Limited.
(c) Date of first presentation to the Bank, and dateof the first mission to consider the project
Preliminary report was submitted to the Bank inearly 1975. The scope of this project was dis-cussed at the time of appraisal of the first stageof the Singrauli development in April 1976.
(d) Date of departure of appraisal mission
May 25, 1979.
(e) Date of completion of negotiations
May 22, 1980.
(f) Planned date of effectiveness
October 10, 1980.
Section II: Special Conditions
(a) NTPC to appoint project management and informationsystem consultants by October 15, 1980 (para 47).
(b) GOI to ensure adequate coal supplies (para 48);
ANNEX IIIPage 2
(c) NTPC to have due regard for ecological and environ-mental factors (para 49);
(d) NTPC to achieve and maintain 9.5% rate of return(para 50);
(e) NTPC to inform the Association of any proposal tomodify existing limitation on its borrowing powers(para 51);
(f) GOI to conclude a subsidiary loan agreement with NTPCsatisfactory to the Association as a condition ofeffectiveness (para 51);
(g) NTPC to sell power under satisfactory bulk supplycontracts (para 52); and
(h) GOI to obtain, by October 10, 1980 undertakingsfrom the recipient SEBs in the Eastern Region andDVC to purchase power (para 52).
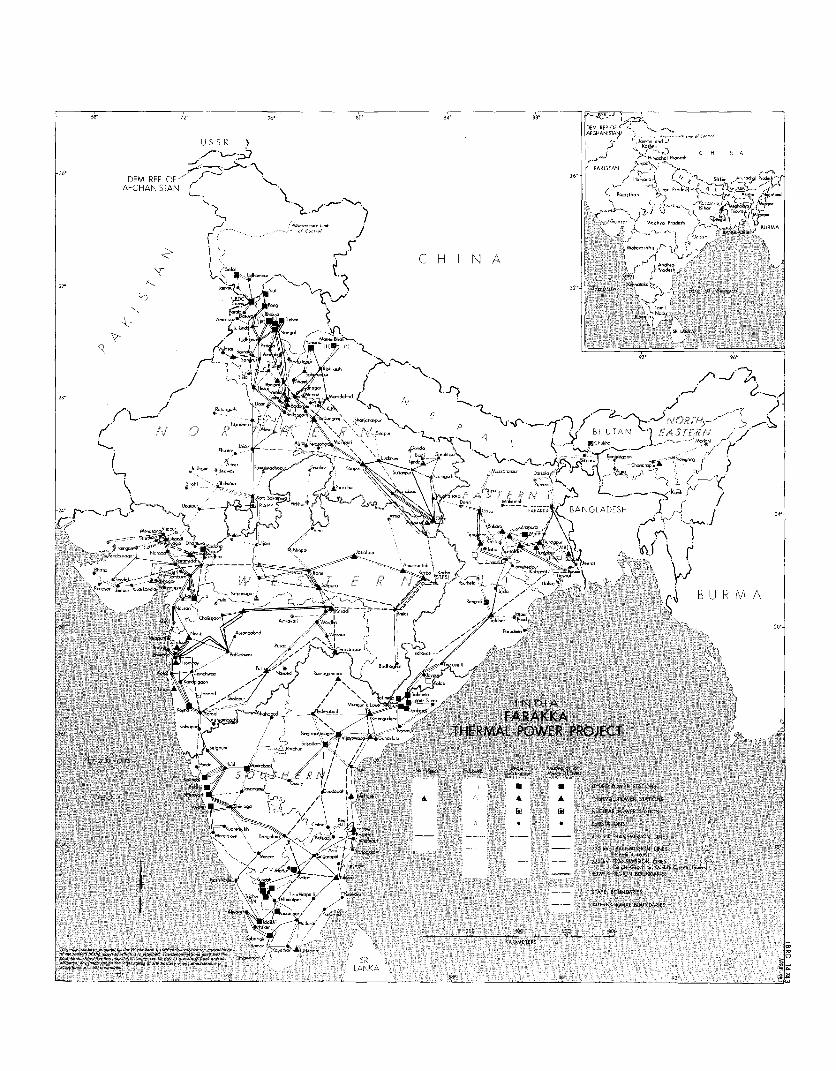
11- 12- 1. 80- 84
DE� REP OFAF�ANI-
IJ S S R J- -d 11
C H N A
DEM REP OFAFGHANISTAN
pl.�
-l- N.d� MA
N A
4-b-
U
M
�2-
B H U T A 'N'
"T.
S�k Z4
BANGLADESH 21-
d
Ih-I
W.
B U R M A
A-Soz
6 2C'
N-i Z "h
h-
L
("- I.d Ki
I:61, 0r
Ar a 41 H
00,�Ep STATToos
TEW"t, fQW8k'S7ATR5W
0 0 SLOSTAIA M
- - I �00 kV IkANSW551014 JINES
42� 2204, I-VSM'SSON 'NES
220 kV 14A
%WNDA?JSS
;K STATE BOWDOIES
Ah-
600
KILOMETERS
Id -11
LANKA12-

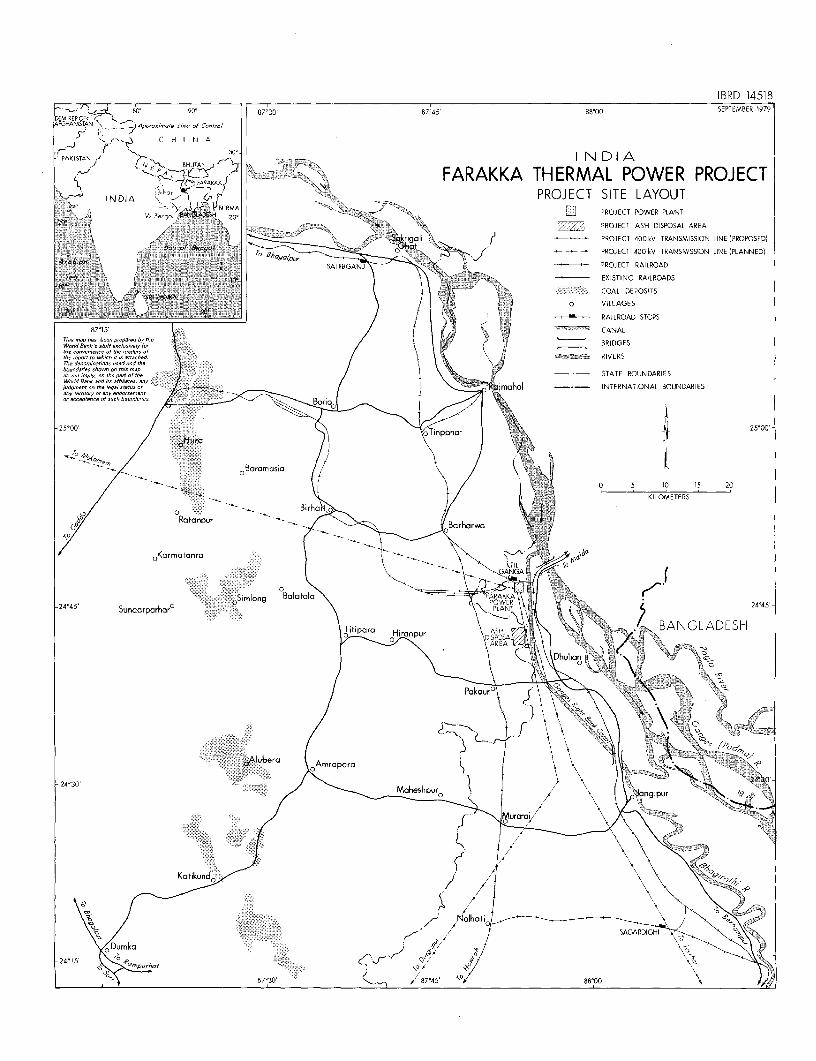
IBRD 14518DEMREP S0' 90' l 87'30' 87°45' aa0oo SEPTEMBER 1979
DERM REPO F 8AFGHANIST,AN ' CsApprrrSrrlft 1mf %,t,&
J t T? ~~~~C H I N A
PAKISTAN/ AN N D I A
'-\t </<<>KKA/' 9<> FARAKKA THERMAL POWER PROJECTINDIA Ero ' PROJECT SITE LAYOUT
-2J" X 1 V/ EeL]ol )SX1 8.tA,RXoAs ~ <t, sue 2 PROJECT POWER PLANT2. V .; : :, \
7 _ * C r, PROJECT ASH DISPOSAL AREA
GaRriga\ f r;OY faf *efw! 0 </ g ,./ \nli :E, ,rl - PROJECT 400 kV TRANSMISSION LINE (PROPOSED)
fA<piwparU :\ z :: h '0 C 'I ir : _ ~ < PROJECT 400V TRANSMISSION LINE (PLANNED)
PROJECT RAILROAD
-itr 0 \ j : 0 0 ;;,; E L 40 -, -To ) . ': E EX ISTING RAILROADSCOAL DEPOSITS
0 VILLAGES
___________________________________________________ /-r------j-, RAILROAD STOPS
87'15' ~~~~~~~~~~~~~~~~~~~~~~~~~~CANALW.rldBankS. -ff-sclasi-ly for . -'. / 4 I l // } BRIDGES
rhedenom maritmsusedanttshe .I . - , &d\ >/1 -=: RIVERS
do _,t /mply, on_IhD p~, tt oj the .: . / h \ f _ _ STATE BOUNDARIES
judgm - onth. e/.g9/stftus j / | w¢ Simaha l . INTERNATIONAL BOUNDARIES
r - nce Bor|
25/00' r>Hur: )inpa or J 25°00 -
/ - O~~~~~~Baramasia 1/a iXt
0 5 10 15 20KI LOMETERS
g ~~~~~Ratanpur Baraw C
oKarmatanra t\ TL9
- --simlong BrJlatola6 t 24'45'24°45' Sundarparharr -00\zo v52-5
Liicra \Dronpur SAPON BANGLADESH
a ' \ <\^t~~~~~hulio1\J <0-
Pokaur0
(
24D30 - l~~~~~~~ubera ara ' <iespur n
; / /> \ \ E
\&IhoEi / :: - g SAGARDIGHI-
-24'15 _'- o
3 7°30' V*_ 87'45' 80' s5