Embed Size (px)
Citation preview

'I C ~~~~~~~~~~~~~~~~-
cv 11||=_,> ;t XV.
-E I Y_
Aa~~~~~~' tS
; E i ~~~~~~~a l'1>_ a) _ ' _x 3~~~~~~~~~~~
r .> -1 l s . 0 tt. § ,5~~~~~~~~~~~~~~~~~~~~~~~~~~~~~
S-4~~~~ ~~~~~~~~~~~~~~~~~~~~~~~~~ *1 .-1¢'
w
Pub
lic D
iscl
osur
e A
utho
rized
Pub
lic D
iscl
osur
e A
utho
rized
Pub
lic D
iscl
osur
e A
utho
rized
Pub
lic D
iscl
osur
e A
utho
rized
Pub
lic D
iscl
osur
e A
utho
rized
Pub
lic D
iscl
osur
e A
utho
rized
Pub
lic D
iscl
osur
e A
utho
rized
Pub
lic D
iscl
osur
e A
utho
rized


JORDAN
POVERTY ASSESSMENT
EXECUTIVE SUMMARY
VOLUME 1DECEMBER 2004
|M LD DANK
The Hashemite The \ orld BankKingdom Of Jordan

LD DaNK
-I ,..
All rights reserved for the Hashemite Kingdom of Jordan and the World BankCv 2004
Cover Photo: ©D Bill Lyons

Thw V (WorI Banlki 'frP,r'.? \9e,, sml t nl< ...
This volume is a product of collaboration between the Hashemite Kingdom of Jordan andThe World Bank. The findings, interpretations, and conclusions expressed in this paperdo not necessarily reflect the views of the Executive Directors of The World Bank or thegovernments they represent.
The World Bank does not guarantee the accuracy of the data included in this work. Theboundaries, colors, denominations, and other information shown on any map in this workdo not imply any judgment on the part of The World Bank concerning the legal status ofany territory or the endorsement or acceptance of such boundaries.

iv 1 t| LDHANK
CURRENCY AND EQUIVALENTS
US$1 = 0.709JD
ABBREVIATIONS AND ACRONYMS
BA Bachelor Of ArtECE Early Childhood EducationEUS Employment And Unemployment SurveysFHH Female-Headed HouseholdFIS Family Income Supplement ProgramGDP Gross Domestic ProductHDI Human Development IndexHEIS Household Expenditure Income SurveyHNP Health, Nutrition & PopulationIFAD International Fund For Agricultural DevelopmentIFPRI International Food Policy Research InstituteILO International Labor OrganizationJD Jordanian DinarMENA Middle East And North AfricaMHH Male-Headed HouseholdNAF National Aid FundPRSPs Poverty Reduction Strategy PapersTIMSS Trends In International Mathematics And Science StudyUN United NationsUNDP United Nations Development Programme

Ifhe (>irld BankJdin P flvemr A,ses\.mcen V
THE HASHEMITE KINGDOM OF JORDANPOVERTY ASSESSMENT
TABLE OF CONTENT
FoREwoRD: Mustapha K. Nabli, Chief Economist and Director, Middle East andNorth Africa Region, The World Bank ....... ..................... vii
FOREWORD: Bassem Awadallah, Minister of Planning and International Cooperation,Hashemite Kingdom of Jordan ........................... ix
PREFACE ............................ xi
JORDAN POVERTY ASSESSMENT - MAIN FINDINGSD.. 1
BACKGROUND. 2
A. Poverty In Jordan: Incidence And Trends. 5Coping Strategies Of The Poor. 9Women In Poverty. 9Children In Poverty .10
B. Why Has Poverty Declined In Jordan, And Will The Decline Continue? . 13The Rise In Consumption .13Future Poverty Reduction Targets .15
C. The New Social Protection System Is Leaky And Needs Improvement .16
D. How Well Are The Poor Able To Use The Labor Market? . 20
E. The Poor Are Lagging Behind In Education .24
F. The Poor Have Weaker Health Outcomes But Bear A Higher Burden OfExpenditure .27

V<FI~MLD ffK
vi 1 - ,,
BOXES:
Box 1. Consumption Gains - International Experience ........................................... 14Box 2. Social Safety Nets In Jordan And Mexico ................................................... 19
FIGURES:
Figure 1. Real GDP Growth Rates In Jordan, 1988-2003 ............................................. 4Figure 2. All Poverty Measures Show Unambiguous Decline Between 1997
And 2002 ............................................... 8Figure 3. Change In Headcount Ratio, 1997-2002 ............................................... 11Figure 4. Poverty Severity, 2002-2003 ............................................... 12Figure 5. Annual Growth In Per Capita Private Consumption And Income ............... 13Figure 6. Welfare (Consumption) Gain Accruing To All Income Groups In
Jordan .13Figure 7. Income Supplement Program (Recurring Cash Assistance): Families
Assisted And Assistance Per Family, 1996-2002 ...................................... 17Figure 8. The Leaky Social Safety Net ...................................... 20Figure 9. The Poor Have More Young Dependents To Support ................................. 21Figure 10. Youth Unemployment Among The Poor And Non-Poor By Governorate,
2002 .................................................... 23Figure 11. Working Poor Ratio Is Low In Jordan .................................................... 23Figure 12. The Poor Lag Behind In Every Stage Of Education .................................... 24Figure 13. Infant And Child Mortality Rates By Income Quintile ................................ 27
TABLES:
Table 1. Average Total Poverty Line, By Governorate (JD Per Capita Per Year) ...... 8Table 2. Poverty Projections To 2006 .................................................... 16Table 3. Poverty Rates Of The Population, By Economic Activity Status, 1997 And
2002 ........................ 22
ANNEX:
Annex 1. Poverty Indicators By Sub-District ........................ 30
The \W orld BdlnlkJiodan Pm crb AcsmlcnlI Vil
Foreword
Our central mission at the Bank is to fight poverty and improve the living standards ofpeople in the developing world. Successful poverty alleviation is contingent on sound andcontextual analysis of the nature of poverty and the impact of public choices madeglobally, nationally and locally. With great pleasure I present this report entitled JordanPoverty Assessment accomplished as a collaborative, analytical report written with theGovernment of Jordan.
Jordan's recent growth performance has been noteworthy. Since 1999, GDP growth hasconsistently stayed above population growth, despite repeated negative shocks emanatingfrom the region. This resilience is a hard-won achievement of conscious policy choices.Jordan is better in human development than comparators worldwide at similar levels ofGDP. In 2003, Jordan was second best in the Human Development Index (HDI) amongnon-oil Arab countries.
Jordanians are keen that the fruits of development and reform reach the poor. Concernedabout the perceived slow pace of poverty reduction, authorities announced the newstrategy for poverty alleviation in 2002. Key policy initiatives were to increase andextend the National Aid Fund, support sustainable micro financing, and increaseemployment opportunities in rural areas and small towns through Cluster VillageDevelopment. In addition, social safety net policy changes under the new strategy havebeen rapidly implemented. The new program, now rechristened the Family IncomeSupplement program, which began in May 2002, was designed to bridge the gap betweena family's real income and the poverty line. Jordan's National Social and Economic Plan(2004-06) reflects the continued concern of national planners, and puts "relatively highlevels of poverty and unemployment" at the top of the list of current challenges facingJordan.
This report fills the knowledge gaps identified in the new strategy for poverty alleviationby utilizing the newly available results of the Household Expenditure and IncomeSurvey. This report assesses poverty in Jordan in 2002-03, and examines the changes thathave occurred since 1997 as a result of economic growth and the income distributionpolicies of the Government of Jordan. By assessing the social protection policyimplemented under the National Strategy for Poverty Alleviation (2002), and drawingimplications for poverty alleviation outcomes in the areas of social protection, health, andeducation, the study aims to aid the efforts of government, civil society, and developmentpartners to address the needs of the poor in a more effective manner, and accelerate thepace of poverty reduction.
The main conclusion of the study is that poverty declined in Jordan unambiguouslybetween 1997 and 2002-03. The study estimates that the percentage of poor in Jordan fellby a third from 21.3 percent in 1997 to 14.2 percent in 2002. This remarkable reductionin poverty has been made possible with an equally remarkable growth in per-capitaprivate consumption, in which the poor participated, at about 3.5 percent a year. This
viii Wjl .
growth in consumption outpaced per-capita income growth at about 0.8 percent a year.This fast rise in private consumption appears to be due to a recovery in consumptiontrends that is mainly policy driven. Private consumption is rising in response tosupportive macroeconomic environment and greater confidence in economic prospects.The poor gained in non-income dimensions as well. Illiteracy among the poor hasdeclined by 41% on the strength of government's literacy campaigns targeting the poorand Education for All strategy. In the health dimension, the infant and child mortality forthe poor may have declined nearly by a third.
However, there are some important concerns about the sustainability of the current paceof poverty reduction efforts in Jordan that have some important policy implications. First,sustainability of the current pace of reduction in poverty would require acceleration inGDP growth to at least 6 percent. Second, long-term policy needs to focus more onregional imbalances in development, improve the access of the poor in education, healthand jobs for sustained reduction in poverty. Third, in the transition, there is an urgentneed to plug the leakage in government's cash transfer program two-thirds of which iscollected by the non-poor and institute poverty monitoring systems for timely remedialaction instead of waiting for results from surveys at five-yearly intervals as at present.
The process through which it was initiated, prepared, and discussed is a key strength ofthis collaborative work between the World Bank and the Government of Jordan. I believethe report will enable a constructive debate and further the cause of poverty alleviationefforts in Jordan.
r L >
Mustapha K. NabliChief Economist and Director
Social and Economic Development GroupMiddle East and North Africa Region

1IhI k\ orld [ank
Foreword
Poverty alleviation and combating unemployment are central pillars in Jordan'sdevelopment process. During the past five years, the government has focused on devisingand implementing measures to propel economic growth to higher and sustainable levels,while laying the foundation for building a new Jordanian model that is resilient toexternal factors and is commensurate with the evolving global trends.
This new model is based on the premise of transforming Jordan into a knowledge-based economy, built on the vast potential of its people and enabled by a competitive andexport-oriented business environment. We have adopted an aggressive andcomprehensive approach to development that relies on the active participation of theprivate sector. Our commitment to attract private investments to facilitate the transfer ofcapital and know-how is also demonstrated through focusing on improving the keyparameters that derive the selection of an investment environment.
Creating this environment also necessitates an investment in our young people. Tothis end, our investment in human capital has begun to take a new course in recent years,with the focus being not only on the size of the investment, but also on its quality. Theultimate goal is to equip graduates with the quality education and skills that are requiredby today's highly competitive global labor market. Additional steps are also being takento enhance research and development as a stepping stone in raising Jordan's competitivecapacity, as a means of accelerating its development.
Moreover, Jordan has adopted a sweeping fiscal, legislative, judicial, andadministrative reform agenda. For one, fiscal reforms focus on creating a self-sustainingbudget and reducing dependence on foreign aid in the medium- and long-term. A rigorouspublic sector reform process aimed at producing an efficient government with minimalbureaucracy was also introduced to achieve greater government efficiency, transparency,and accountability. The process also seeks to improve the quality of civil servants throughtraining and education as well as the introduction of ICT into every facet of governmentwork.
The translation of the primary prize of all developmental efforts - a sustainableimprovement in the welfare of citizens - has as its most basic manifestation alleviatingpoverty through providing opportunity. All along, these efforts must be vetted throughmonitoring and evaluation. And it is, therefore, that this report constitutes an integral partof the current efforts. This report is the result of a comprehensive analysis conducted inclose cooperation between the World Bank and national institutions including theMinistry of Planning and International Cooperation, the Ministry of Social Development,and the Department of Statistics.
This report's findings are inline with those presented by other national reports,including the Millennium Development Goals Report, and the Jordan National HumanDevelopment Report, all of which demonstrate that Jordan is on the right path towardsbuilding a strong and robust economy and delivering the benefits of development to itscitizens. In addition to pointing to the fact that poverty incidence has been reduced from21.3% in 1997 to 14.2% in 2002-2003, the report indicates that illiteracy has alsodeclined by 41% to reach 13% in 2002-2003 compared to 22% in 1997, while infant and

1 X | ,~L D 13ANI
child mortality rates among the poor have been reduced by one third within the sameperiod.
Despite the positive indications reflected in the report, the government is astutelyaware of the challenge still facing Jordan, including still high budget deficit (beforegrants) and public debt levels, dependence on foreign aid, as well as the high levels ofpoverty and unemployment. The government, therefore, will continue to aggressivelypursue reform efforts aimed, first and foremost, at ensuring a better future for all.
Sincerely,
Bassem I. Awadallah
Minister of Planning andInternational Cooperation

'Ith i d Bdrnkordatn Pove:rl\ Blesmcn1 xi
PREFACE
This report reflects the results of close collaborative work between the Government ofJordan (Department of Statistics, Ministry of Planning and International Cooperation,Ministry of Social Development) and the World Bank. The main audience consists ofpolicymakers, researchers, development partners, and civil society. The study is adiagnostic that aims to establish, on a sound methodological basis, a set of new povertylines for Jordan, drawing mainly on the newly completed Household Expenditure andIncome Survey 2002-03. This report estimates the incidence of poverty acrossadministrative units (sub-districts at the lowest level) and calculates the changes inpoverty between 1997 and 2002-03. Combined with a new Statistics Law that allowsdissemination of detailed survey data, this report will also serve as a knowledge base forfuture poverty studies and the country's large operational agenda. Recommended follow-up measures include setting up a poverty impact monitoring system; improving povertyalleviation schemes, particularly the social safety net; and better targeting of education,health, and other interventions.
The Jordanian counterpart team was led by Dr. Hmoud Olimat, Secretary General,Ministry of Social Development; and comprised Dr. Hussein Shakatreh, DirectorGeneral, Department of Statistics; Hala Bsiso, Secretary General, Ministry ofAdministrative Reforms; Dr. Mohammad Refai, Adnan Badran, and Hind Diab, from theDepartment of Statistics; Mohammad Khasawneh and Dr. Ibrahim Hejoj, from theMinistry of Planning and International Cooperation; Omar Hamzeh, from the Ministry ofSocial Development; and Abd Al-Rahman Khawaldeh and Hassan al-Rousan, from theNational Aid Fund. Other Jordanian contributions came from Dr. Mohammed Tarawneh,development anthropologist, Yarmouk University; and Abdel Salam Al-Naimat, RoyalScientific Society.
The World Bank team comprised Srinivasan Thirumalai (team leader) and the followingspecialists: Ayesha Vawda (education); Firas Raad (health); Jennifer Keller (labormarket), Iqbal Kaur (vulnerable and disadvantaged children); G.V. Rao (researchassistance, STATA statistical software); Isabelle Chaal-Dabi and Angela Hawkins (teamassistance).
The team benefited from external consultants. Professor Nanak Kakwani, currently theDirector and Chief Economist of International Poverty Center of UNDP in Brasilia,prepared, participated in, and guided the process of constructing new poverty lines andpoverty estimates. Dr. K. Subbarao, contributed his expert analysis of social safety nets.
The team wishes to thank peer-reviews by Arup Banerji and Linda Van Gelder. Whilein progress, the work was discussed at several workshops and meetings in the fall of 2003and winter of 2003-2004. On February 18, 2004, the National Development Committeeapproved the methodology of the study in a special session, under the guidance of HisExcellency Dr. Bassem Awadallah, the Minister of Planning and InternationalCooperation. At the World Bank, the report was written under the general guidance of

xii
Mustapha Kamel Nabli, Chief Economist and Director, Middle East and North AfricaRegion; Joseph Saba, Country Director; and Dipak Dasgupta, Sector Manager.Comments on gender issues from Randa Akeel and Waafas Ofosu-Amaah are gratefullyacknowledged.
There are many in Jordan whom the team cannot thank enough. Tayseer Al-Smadi,Secretary General, Ministry of Planning and International Cooperation, facilitated andguided the process, despite his many other responsibilities. Mohammad Khasawneh, apoverty researcher at Ministry of Planning and International Cooperation, coordinated thework of the Jordan team. Khadija Yousef at the Department of Statistics tirelesslyprepared several data sets that the team requested. Tayseer Anees at the Department ofStatistics and Cem Alkan at the World Bank prepared the geographic poverty maps.Khamees Raddad at Department of Statistics clarified key aspects of the sample design.
A special thank you to Bill Lyons for providing the cover picture.

TK '-rid< V lt .i3ik.1 Wdr I) 1ie\ >1i A '.e>'ircn
JORDAN POVERTY ASSESSMENT - MAIN FINDINGS
"No one knows exactly how many Jordanians are poor today, where they live, or whattheir demographic characteristics are.... Current estimates indicate that up to one thirdof the Jordanian population live beneath the poverty line. "
Poverty Alleviation for a Stronger Jordan - A Comprehensive National Strategy, May20021
1. This report assesses poverty in Jordan in 2002-03, and examines the changes thathave occurred since 1997 as a result of economic growth and the income distributionpolicies of the Government of Jordan. By assessing the social protection policyimplemented under the National Strategy for Poverty Alleviation (2002), and drawingimplications for poverty alleviation outcomes in the areas of social protection, health, andeducation, the study aims to aid the efforts of government, civil society, and developmentpartners to address the needs of the poor in a more effective manner, and accelerate thepace of poverty reduction.
2. The main conclusion of the study is that poverty declined in Jordan between 1997and 2002-03 no matter which poverty line one chooses to use. Using the most appropriatepoverty line discussed later in the report, the study estimates that the percentage of poorin Jordan fell by a third from 21.3 percent in 1997 to 14.2 percent in 2002. Thisremarkable reduction in poverty has been made possible with an equally remarkablegrowth in per-capita private consumption, in which the poor participated, at about 3.5percent a year. This growth in consumption outpaced per-capita income growth at about0.8 percent a year. This fast rise in private consumption appears to be due to a recovery inconsumption trends that is mainly policy driven. Private consumption is rising inresponse to supportive macroeconomic environment (low real interest rates, appreciatingreal exchange rates, for example) and better confidence in economic prospects fromstructural reforms. The poor gained in non-income dimensions as well. Illiteracy amongthe poor has declined by 41% on the strength of government's literacy campaignstargeting the poor and Education for All strategy. In the health dimension, the infant andchild mortality for the poor may have declined nearly by a third2.
3. However, there are some important concerns about the sustainability of thecurrent pace of poverty and poverty reduction efforts in Jordan that have some importantpolicy implications. First, the current pace of poverty reduction will require thateconomic growth (and ensuing income gains) improve significantly in order to provide amore sustained pace of future consumption growth and poverty reduction. Sustainability
1 Published by Jordan Poverty Alleviation Program, Ministry of Social Development, Jordan.2 Based on Demographic and Health Surveys, 1997 and 2002. Indicators for mothers with no education areassumed to be a proxy for the poor in the absence of cross-tabulation of DHS data by income class.

R~~LD DWK21~
of the current pace of reduction in poverty would require acceleration in GDP growth toat least 6 percent (and per capita growth to levels of about 3.5 percent per annum) orhigher that benefits the poor, substantially larger than the 3.8 percent growth averageduring 1997-2002. Recent economic growth has picked up despite large economicshocks and needs to be sustained and/or accelerated. Second, the uneven geographicspread of poverty reduction has left three governorates (Balqa, Karak and Aqaba) with nochange in poverty and Zarqa governorate with an actual increase, besides leaving one-sixth of the sub-districts desperately poor where three-fourths or more of the populationis presently poor. Third, the leakages in government's recently implemented socialassistance program (Family Income Supplement) for combating poverty are high with thenon-poor collecting two-thirds of the assistance. Fourth, the persistence in unemploymentrate for the poor are worrying because a lasting impact on poverty reduction will requirejobs for the poor and improvement of their incomes. Puzzlingly, families headed byunemployed persons have reduced poverty even though their employment and incomeshave not increased, primarily because of greater share of transfers and more spending3 .Fifth, the persistent disparity of the poor and non-poor in non-income dimensions ofpoverty such as education and health will hamper efforts by the poor to improve theirearning potential, especially for the next generation or cohorts.
4. Overall, therefore, long-term policy needs to focus more on regional imbalancesin development, improve the access of the poor in education, health and jobs forsustained reduction in poverty. In the transition, there is an urgent need to plug theleakage in government's cash transfer program two-thirds of which is collected by thenon-poor and institute poverty monitoring systems for timely remedial action instead ofwaiting for results from surveys at five-yearly intervals as at present.
BACKGROUND
5. Jordan's recent growth performance has been noteworthy. Since 1999, GDPgrowth has consistently stayed above population growth, despite repeated negativeshocks emanating from the region. This resilience is a hard-won achievement ofconscious policy choices. Upon ascending the throne in 1999, His Majesty KingAbdullah II consciously promoted an accelerated pace of structural reforms, which,among other things, had the net effect of bringing down weighted average import tariffsto 10 percent, and achieving an overall privatization record amounting to 11 percent ofGDP. This has enabled Jordan to emerge as a leader in structural reforms among Arabcountries.
6. Jordan's achievement in human development, which goes beyond GDP growth,has also been remarkable. Jordan is better in human development than comparatorsworldwide at similar levels of GDP. In the two non-income dimension of humandevelopment - health and education - Jordan has significant leads. In 2003, Jordan was
3It is difficult to ascertain how far families understate their incomes.

3
second best in the Human Development Index (HDI)4 among non-oil Arab countries.Jordan's life expectancy has improved from 67 years in 1990 to 70.6 in 2003. The adultliteracy rate has jumped from 75 to 90.3 percent; and nearly 70 percent of the populationhas basic education or higher. Seven percent are university graduates.
4 The UNDP's Human Development Index (HDI) is a composite indicator of welfare that combines aweighted sum of three indices related to life expectancy at birth, educational attainment, and per capitaincome.

4 fdL
Figure 1. Real GDP growth rates in Jordan, 1988-2003
Post Gulf War Boom
20
7L rKing Abdullah IIaccession
0- r -
Economic
-10 _ _ collapse
-20- 7ll
1984 1988 1992 1996 2000 2004
Souirce: Jordan Live Data Base, World Bank, 2004.
7. Yet, despite the gains in economic growth and human development for thepopulation in general, Jordanians are unsure whether the fruits of development andreform are reaching the poor. This concern is rooted in Jordan's history. Jordan had littlepoverty or unemployment prior to the economic collapse in 19895. The economiccollapse pushed 17 percent of the population into poverty, and rendered 20 percent of thelabor force unemployed. Successful macroeconomic stabilization in the early 1990sreversed the decline in GDP growth and helped to moderate the twin problems of povertyand unemployment. GDP growth rebounded to nearly 19 percent in 1992, helped in partby the housing boom fed by the savings of Gulf returnees. However, growth proved to betransient, as the housing boom ran its course and the expectation of peace dividends fromthe 1994 peace accord did not fully materialize. Though per capita consumption declinedby 1.5 percent a year between 1992 and 1997, active redistribution policies reduced
5 The root causes of the collapse were the unsustainable expansion of the public sector and the collapse ofoil prices in the mid-1980s. Though Jordan does not produce oil, it is vulnerable to the price of oilindirectly through worker remittance inflows from Jordanian workers in oil-rich countries.

The World BankJordat Poverly.Assessmcnt 5
consumption inequality, and reduced the proportion of poor by some 2.6 percentagepoints. However, with weak economic growth, the unemployment rate persisted at around15 percent through much of the 1990s.
8. In response to the continuing concerns about the slow pace of poverty reduction,authorities announced the new strategy for poverty alleviation in 2002. Key policyinitiatives are to increase and extend the National Aid Fund, support sustainablemicrofinancing, and increase employment opportunities in rural areas and small townsthrough Cluster Village Development. In addition, social safety net policy changes underthe new strategy have been rapidly implemented. The new program, now rechristenedFIS (the Family Income Supplement program; formerly the Recurring AssistanceProgram), which began in May 2002, is designed to bridge the gap between a family'sreal income and the poverty line, defined as JD 26 per person per month and JD 156(compared to JD 82 previously) for a typical six-member household per month. As aresult, the number of beneficiaries and the assistance per beneficiary rose sharply in2002, by 22 and 43 percent, respectively. Jordan's National Social and Economic Plan(2004-06)6 reflects the continued concern of national planners, and puts "relatively highlevels of poverty and unemployment" at the top of the list of current challenges facingJordan.
9. This report fills the knowledge gaps identified in the new strategy for povertyalleviation7 by utilizing the newly available results of the Household Expenditure andIncome Survey. The following six key areas are studied in-depth to facilitate theimplementation of the government's poverty alleviation program:
* Poverty in Jordan. Incidence and Trends. Including the construction of newpoverty lines to more accurately estimate the incidence of poverty, and examine(i) whether poverty changed since 1997; (ii) whether people are vulnerable topoverty even if not currently defined as poor; and (iii) what are the specialproblems faced by poor women and children? (Section A);
* Why has poverty declined in Jordan and will the decline continue (Section B);* The effectiveness of the social protection program in alleviating poverty (Section
C);* How well the poor7 are able to use the labor market to improve their living
conditions (Section D);* Gaps in education and health outcomes between the poor and non-poor (sections
E and F, respectively).
A. POVERTY IN JORDAN: INCIDENCE AND TRENDS
10. Building a consensus on a new poverty line is important to measure and monitorpoverty in Jordan. Since the last official poverty line was established in 1987, povertystudies have used a diverse set of methodologies to arrive at poverty lines ranging fromJD 252 to JD 478 per capita per year for 1997 (in 1997 prices). As a consequence, there
6 Draft by Ministry of Planning and International Cooperation, Jordan.7 Refer to the quote at the beginning of this volume.

6 t
has been little agreement about the magnitude of poverty, as reflected in the quote at thebeginning of this volume. The new Household Expenditure and Income Survey providesan excellent opportunity to construct new poverty lines for Jordan that satisfies well-established criteria8 set by poverty researchers. Table 1 presents new poverty lines atgovernorate level for 1997 and 2002-03. The new poverty lines are specific to familycomposition (age and sex of family members) and where the family lives. The nationalaverage poverty line for 2002-03, at JD 392 is about JD 60 higher than what would havebeen obtained by merely updating the 1987 poverty line to reflect a change in consumerprices. The new line, rather, reflects the new calorie requirements9 for Jordanians andallows for actual expenditure on non-food items, as observed in the household survey. ' 0
11. Based on these new poverty lines, a main finding is that poverty in Jordan hasdeclined significantly between 1997 and 2002. This conclusion about the direction ofchange in poverty is robust to the choice of poverty lines and alternative povertymeasures that use consumption as a measure of welfare. Figure 2 shows that theincidence of poverty (Y axis) is lower for every possible poverty line (X axis). Theproportion of poor, for example, declined from 21 percent in 1997 to 14 percent in 2002,using the same poverty line. The depth of poverty - the proportionate deficit of actualconsumption of the poor from the poverty line - declined from 5 to 3 percent.
12. A positive feature of poverty in Jordan is that the chronically poor - defined asthose whose poverty is expected to persist - comprise only 29 percent of all the poor.'"The remainder have such shallow income deficits that they move in and out of poverty astheir incomes fluctuate' 2 .
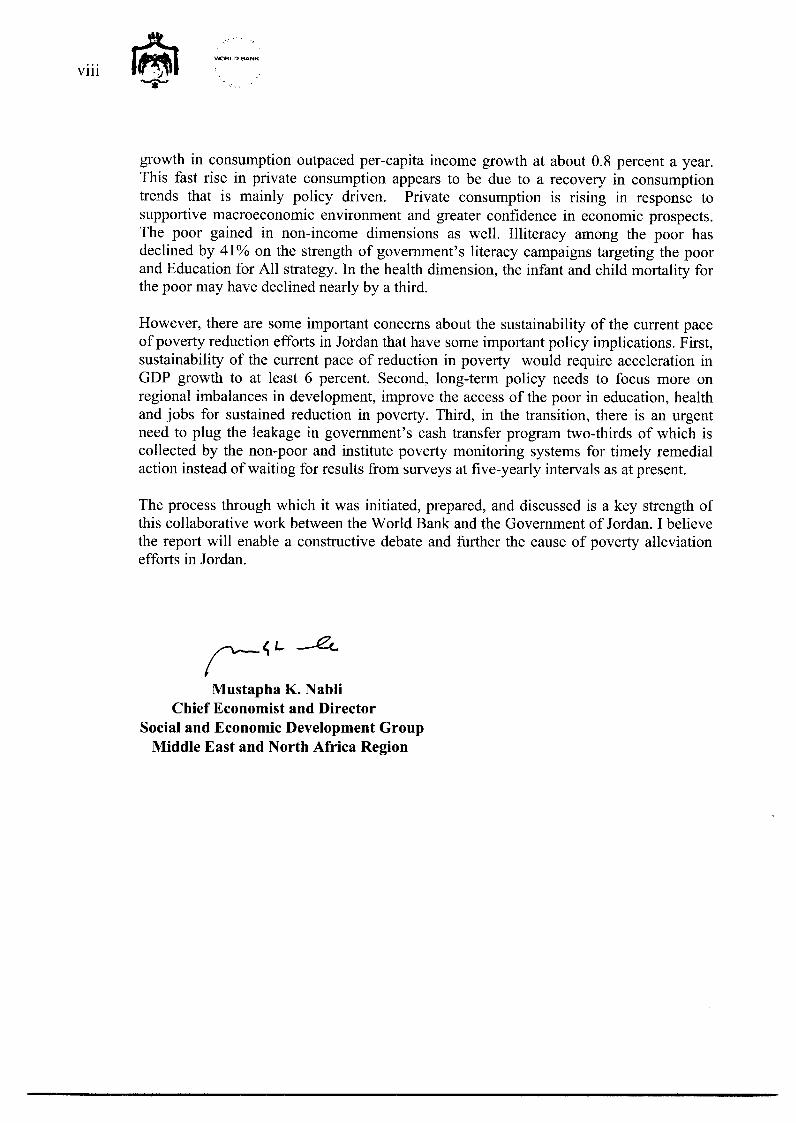
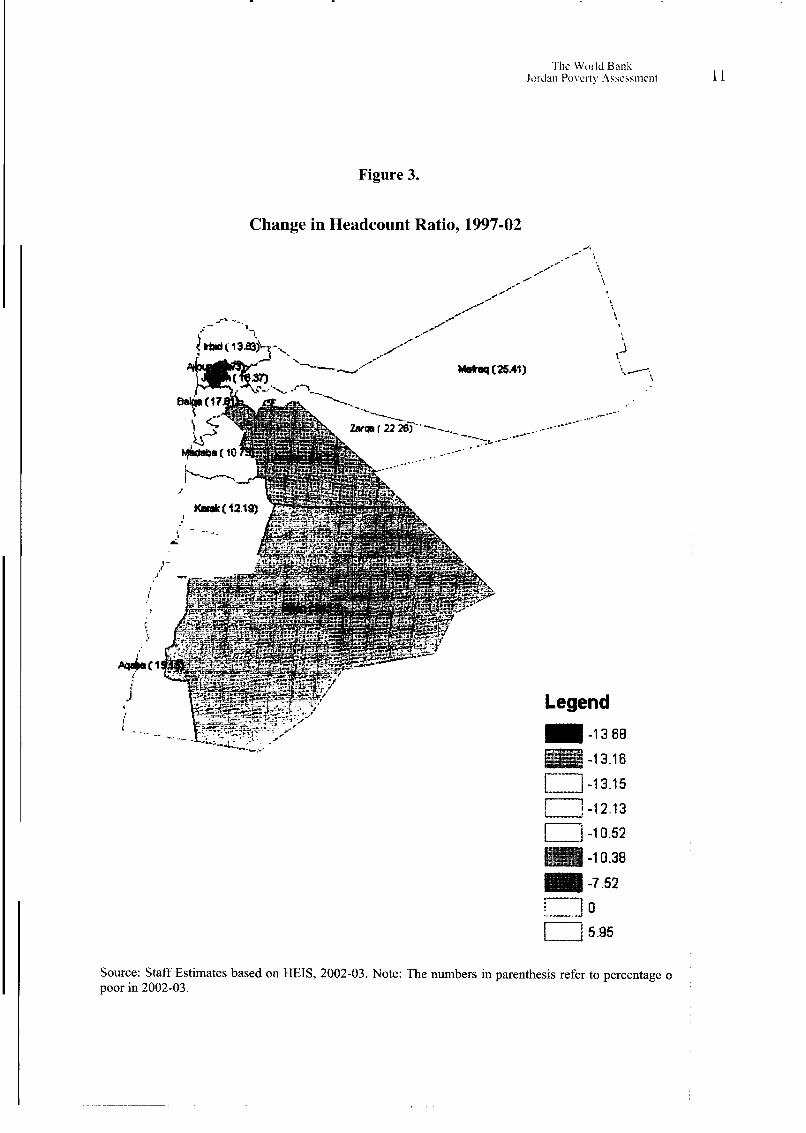
13. Progress in poverty reduction in Jordan has been geographically (governorates,sub-governorates and rural-urban) uneven. At the governorate level, Figure 3 charts thestatistically significant changes in levels of poverty in a geographic map for 1997 and2002. In three governorates (Balqa, Karak, and Aqaba) there is no strong evidence tosuggest that poverty either increased or decreased. In all other governorates, exceptZarqa, poverty declined significantly, particularly in Maan and Mafraq, where the 1997poverty levels exceeded 30 percent. In Zarqa, however, poverty significantly increasedfrom 16 percent to 22 percent. The increase in unemployment registered in Zarqa (from
8 Key criteria are that poverty lines should: (i) be specific to household demographic characteristics such asage and sex; (ii) allow for spatial price differences; (iii) allow for economies of scale; and (iv) be based onobserved household expenditure patterns.9 Based on "Behavioral Risk" module added to Employment, Unemployment Survey, May 2002.10 The 1987 official poverty line allowed for 2224 Kcalories for an adult, as opposed to the populationaverage of 2309 Kcals used in this report. Another difference is that the official poverty line has a built innormative basket of non-food items, whereas the current report uses actual non-food expenditure incurredby families at the food poverty line threshold.
In some countries, such as Indonesia, nearly 80 percent of the poor are deemed to be chronically poor.12 Some of the non-poor are also vulnerable to fall into poverty. If we count the non-poor who couldbecome poor because of income fluctuations, population vulnerable to poverty is slightly higher at 16percent in 2002-03. Of the three regions of the country, the central region has a total vulnerable populationof 15 percent, while the percentage of vulnerable in the other regions is higher at 19 percent.

J c d ml r 7d tnk
11 to 14 percent), and the steep rise in National Aid Fund (NAF) claimants, 13 indicatethat living conditions must have worsened in Zarqa, possibly due to some factors such asthe relocation of military establishments.
14. Geographic distribution of poverty in Jordan at sub-governorate level exposesselect areas of extreme poverty. Jordan has some pockets (13 out of 73 sub-districts) ofsevere poverty, where more than 34 percent of the population is poor (Figure 4). Mostare located in remote desert areas, where the chronic poverty, low literacy rate (20percent), and nomadic nature of the poor pose special challenges for development.
15. Rural Jordan is lagging behind in poverty reduction. Jordanians residing in ruralareas and living off agricultural incomes tend to be poorer. Currently 19 percent of therural population is poor, compared to 13 percent in urban areas. Poverty in rural areas isdeclining more slowly than in urban areas, resulting in a widening rural-urban gapbetween 1997 and 2002.
16. Though poverty declined significantly and per capita consumption grew across allincome groups, growth in per-capita consumption during 1997-2002 was not equallyshared across all income groups. While half the governorates registered pro-poor growth,the other half did not; and overall, non-poor groups enjoyed a marginally faster rise intheir consumption than the poor. Improving the strategy to create pro-poor growth shouldremain an important imperative for Jordanian authorities.
17. Faster development of the private sector - which employs most of the poor - isessential for poverty alleviation in Jordan. Though working for public sector lowers therisk of poverty for every skill level, increasing jobs in the public sector is incompatiblewith the need to rein in fiscal expenditures.
18. Yet, public interventions will continue to be relevant for poverty alleviation.Where the private sector is unlikely to reach such as in the remote areas of Jordan, theauthorities have options to use social assistance for the poor unable to work andcommunity based development programs for all others. Also, the uneven pace of povertyalleviation across govemorates may call for appropriate correction mechanisms in theincentive framework if benefits clearly outweigh costs.
13 The National Aid Fund was established in 1986 with the main objective of enhancing andinstitutionalizing the social safety net. NAF originally provided untargeted, generalized subsidieson foodstuffs. Changes in the program since its inception are discussed in Section C.

8t ~LD BANK
8
Table 1. Average total poverty line, by governorate(JD per capita per year)
1997 2002-03
Ainman ___ 393 4 19Balqa 336 365Zarqa--36-3 ------ 388Ntadaba 47 377
_rbid 348 L - 7NMafraq - 330 3h0
Jerash _34 1 373Ajlotin 330 360Karakl - 349 364
Tafeela __-___ _ 346 Ih _ 363
Maan 35_ 364
Aqaba 366 5_---------- --- - --
Jordan 366 392
Source: Staff estimates, based on Household Expenditure and Income Surveys, 1997and 2002-03, Department of Statistics, Jordan.
Figure 2. All poverty measures show unambiguous declinebetween 1997 and 2002
120
100
80 t - --- -- 7
60
40
20
00 0 0 0 0 o o o o o o o o
-) C L CD LO ) Y L 0 L C LO 10
-2002 - 1997
Note: WellOO refers to the welfare index set to 100, at the new poverty line of JD392.Source: Staff estimates based on the Household Expenditure and Income Survey (2002-2003).

'I'le 'L1fId 1Wodd k.i'rlitil Psvcerty Ascs.snaict 9
Coping Strategies of the Poor
19. The rural and urban poor use different methods to cope with poverty. The poorseek many ways to augment their incomes, save on expenditures, or borrow either overtlyor implicitly. An anthropological study14 of the poor in a deep pocket of poverty - WadiRum - finds two characteristics shared by the urban and rural poor in coping withpoverty. First, the poor base their decisions on short-term considerations ignoring socialdisadvantages later. Sending children to work than keeping them in school is an exampleof the preference of the poor for short-term benefits to the neglect of the earning potentialof the children when they grow up. Second, both in rural and urban areas alike, tribal orfamily customs govern the potential range of coping methods. Exchanging gifts on socialoccasions provides one such opportunity for the poor to receive valuable gifts eventhough they may not be able to reciprocate on equal terms. There are also ways in whichthe coping strategies of the urban and rural poor differ. Urban areas offer more marketopportunities for selling labor and buying inexpensive goods, while the poor in ruralareas can augment their own account production, and female family members can findemployment on farms.
Women in Poverty
20. Addressing poverty of women headed families calls for a nuanced approach tosocial assistance. Women head about 10 percent of households in Jordan. Are thesehouseholds poorer? Results of the new household survey confirm is in conformity withstudies'5 in other countries that there is little difference in poverty measures betweenfemale-headed households (FHH) and male-headed households (MHH). However, someselect sub-groups of FHH have a higher incidence of poverty than corresponding male-headed households. Among other groups of FHH, divorced women have higher incidenceof poverty than widowed or married women. Separated women have a poverty ratio of37 percent, making them the most vulnerable of all FHH and MHH groups. Therefore,social protection programs need to be target households headed by separated or divorcedwomen.
21. Vulnerability of women to poverty is a key issue. Reliance on social protectionprograms and other types of transfers is sources of vulnerability for FHH. Female-headedhouseholds rely less on participation in production activities (wages or own accountproduction) than MHH, as a consequence of lower labor force participation and greaterunemployment. The high dependence on transfers has a significant impact on women'sempowerment and their ability to influence external factors that could improve theirlives. Their low level of participation in economic activity makes them dependent on
14 Coping Strategies of the Poor, Mohammed Tarawneh, 2004. Unpublished study commissioned for thisreport.15 IFAD, 1999. "Human Enterprise Ecology: Supporting the Livelihoods of the Rural Poor in East andSouthem Africa", Main Report and Working Paper No.2, Rome ; see also IFPRI, 1995. "Gender and Poverty:New Evidence from 10 Developing Countries", Food Consumption and Nutrition Division DiscussionPaper No.9, Washington DC.

public transfer and private generosity. Female-headed households are particularlyvulnerable to worker remittance inflows. The percentage of poor female-headedhouseholds could increase by 50 percent in the absence of remittances.
Children in Poverty
22. Poverty among children is marginally higher than in the general population.Children (under 18 years of age) constitute half the population in Jordan. Poverty amongthem is 16 percent, nearly two percentage points higher than the general population,because poorer households have a larger number of children. Two-thirds of poor childrenlive in the three mostly urban governorates of Amman, Irbid, and Zarqa.
23. Poverty pushes children to work while they should be in school, particularly theboys. Based on the new household survey, it is estimated that about 3 percent of childrenbetween the ages of 10-18 years were employed. However, the prevalence of child laboris probably underestimated, as households are typically reluctant to acknowledge thatthey have underage children working. By age and gender, the survey found that malechildren start working earlier. About 5 percent of male children in the age group 10 to 18are reported to be working, which suggests that more male than female children drop outof school to work. Even though the annual dropout rate from the basic education level isless than 1 percent, more than 12 percent of children either do not enroll in or do notcomplete secondary education. The total percentage of those graduating from 12th gradeis only 76 percent of all children who begin first grade.
24. Children in school who work part-time under-perform academically. Among thechildren who stay in school in lower grades, it was observed from analysis of the Trendsin International Mathematics and Science Study (TIMSS, 1999)16 that 10 percent of themalso work for pay (the number who work without pay is much more difficult to measure).These children are likely to come from poor families, and their under-performance in thesystem further limits their chances for social mobility. Controlling for demographicvariables and family conditions, working for pay is associated with a decline of 40 and 24points, on average, in mathematics and science.
25. Current policies to protect children from child labor, and to rehabilitate those whofall behind in education, may need to be improved to minimize the suffering of poorchildren.
16 http://nces.ed.gov/timss/
The World BankJordan Poverty Assessment
Figure 3.
Change in Headcount Ratio, 1997-02
-~ ~ ~ ~ .
WMbd 1 3.83~
ts 7) - 1~~~~~~~~Mhq (2A1) E
222 2--
Legend
-13 68-1 3.16
Liii] -1 3.15
071-12.13rzzi -1 0.52
-1 0.38
-7.52
5.95
Source: Staff Estimates based on HEIS, 2002-03. Note: The numbers in parenthesis refer to percentage o
poor in 2002-03.

14
accounts. The growth in private consumption reflects the reversion to more long-termequilibrium levels, again consistent with greater confidence in the economic situation.
29. There are several reasons to believe that the shift to higher consumption isprobably benign, and that consumers across all income groups are reacting to structuraland macroeconomic policy changes. Consumption as a share of income has registeredincrease across all income groups between 1997 and 2002. However, the rise inconsumption of the poor, given the absence of employment and income gains and theirlimited access to credit markets, is puzzling and needs further research. Though the poorcould potentially benefit from decline in interest rates indirectly, the current income ofthe poor has not risen, the poor do not seek work as much as before and those who seekface slightly higher unemployment rates.
30. It appears that structural policy changes in Jordan, particularly since 1999, havegenerated optimism about the growth potential of the economy and may have led to theboost in consumption. In fact, the realized GDP growth since 1999 shows remarkableresilience to negative regional shocks such as the Intifada in the neighboring West Bankand Gaza, and the global shock of September 11, 2001. The commitment to containingpublic sector debt in the medium term,18 and the reduction in publicly guaranteed externaldebt from 89 to 82 percent of GDP, may also have generated expectations of highergrowth in the future. The cumulative effect of these structural policy changes could havemade individuals feel wealthier and helped to raise their level of consumption. This is inline with international experience of consumption gains as noted in Boxl.
Box 1. Consumption gains - international experience
Consumption booms can be caused by the percei%ed wealth effects of favorable terms of tradechanges. optimilistic expectalions attributed to economic refonns. including a reduction in budgetdeficits, financial liberalization: and relatike price changec ansing fromn exchange rate policies.Nlontiel i 20(0l1 uses e% idence of consumption hooms from a cross-section of 91 countries o er1960-95. to assess the relative importance of %arioLns drivers of booims. His keN finding is that
i fa%orable movements in terms of trade, structural retorms and anticipated improxemenii ini macroeconomic perfo;miance seem to be inore important. Howe%er. explanationss ftr individual
booms can %ar-. and the possible explanations for Jordan'-s recent pri%ate consumption booinaccord %%ith Nliontiel's framework. as real interest rates fell. the real cxchange rate appreciated.and economic reforms %'ere accelerated
So,uv;- P&tc, J. Alonu,el r2 jil1i U4 1 d I JI I 1 11tin p,oi, hwat,i ' T/& T;r l1d Bevik EL-.,,u,tiuLt Re-'t.
31. The rise in consumption has been supported by macroeconomic policymanagement. First, Jordan's exchange rate policy has maintained the nominal exchangerate of the Jordanian Dinar to US dollar over the entire period, and with it, anappreciation of real exchange rates that have supported real income gains larger than
18 Law number 26 of 2001 on Public Debt Management stipulates that (by 2006) external debt may notexceed 60 % of GDP (article 22) and total public debt (external and internal) may not exceed 80 % of GDP.

'I'hfe W.n ,, BainkJ.rdnJI i[oNvrtm Av c&snefnl 15
simply the real GDP growth. Second, with its financial openness to international marketsand the decline in global interest rates, Jordan has been able to cut interest rates by a largemagnitude. Third, with low and steady inflation, the real interest rate dropped in 2002 toone third the level of 1997, which could have encouraged the rise in consumption.Fourth, for poorer households, the reduction in nominal interest rates over the periodreduced the opportunity cost of holding money for transactions - another factor thatstimulates present consumption. Fifth, the appreciation of the US dollar against the euro,and the consequent real appreciation of the Jordanian dinar from 1997 through 2001 byabout 15 percent (which has since been reversed), may also have helped to reduce therelative price of imports from Europe, which is Jordan's main source of imports.
32. Despite the steady increase in consumption and financial liberalization, theabsence of a noticeable boom in private sector credit discounts the possibility of aconsumption binge or overshooting. In addition, stabilization of the dollarization trend at38 percent of all deposits since 2002 points to continued confidence in the Dinar.
33. Nevertheless, sustaining private consumption growth at current record pace willbe difficult, as the initial effects of structural reform-induced relative price adjustmentsare exhausted and real appreciation of the currency reverses; and as UN compensationpayments come to an end. The anticipated gains from structural reforms need to berealized in terms of faster job growth and rise in wages for the poor for a lasting impacton poverty. Otherwise, the rise in consumption of the poor observed in the householdsurveys could reverse.
Future Poverty Reduction Targets
34. Meeting poverty reduction goals of Jordan's new national plan will requireresolute efforts. Jordan's National Social and Economic Plan (2004-06) aims to reducepoverty by one third. Given the new poverty line and assuming unchanged incomedistribution, Table 2 projects standard poverty measures to 2006 under alternativeassumptions of growth in per capita real consumption. A growth rate of about 1.1 percentin real per capita consumption is required to cap the number of poor at the 2002 level;while achieving a one-third reduction would require about 4 percent real per capitaconsumption growth. Reaching the absolute target would require an even larger growthof 5.5 percent showing the challenging task ahead.

16 let~jV
Table 2. Poverty projections to 2006
Baselne Projections of poverty In 2006
2002 Elastiities Assumptions about annual growth of per capita real consumption
~~ 't 4W_~~~~~~~~~~~~~~~~~~~~~~~~~~~~~~~~~~~~~~~~7
Headeountratio 14.' -1.9 13. ; 131 12.6 1'.1 II1. 11.0 10.4 9
Poxert) gap 3.3 -2.3 3.1 3.0 2.8 2.7 2.5 2.4 2.2 ISeverix 1.1 -2.5 1.1 1.( 1.0 0.9 0.9 0 8 0.7 i 0.7M\!Eemo llcm}1s
Nunmber of'poor ('000) 73.2 7778.1: 748.5 71 I.5 688.1 6.7.2 625 9 594.' 562.0
Source: Staff estimates.Note: Headcount ratio refers to the percentage of people living below the poverty line. Poverty gap is ameasure of the depth of poverty - the average gap expenditure of the poor from the poverty line. Severity isalso a measure of depth of poverty but with greater weight on the income gaps of those further below thepovertv line.
C. THE NEW SOCIAL PROTECTION SYSTEM IS LEAKY AND NEEDS IMPROVEMENT
35. Driven by concerns for the poor, the Government of Jordan has been directlyintervening to improve the income of poor families through social protectionmechanisms. How effective have these programs been? The Household Expenditure andIncome Survey 2002-03 provides a good opportunity to evaluate the impact ofgovernment transfers on the poor, because it includes a direct question on the receipt ofNAF transfers. The general conclusion from the analysis is that though NAF transfershelp the poorest of the poor, roughly two-thirds of all transfers leak to the non-poor,implying a significant room for improvement.
36. Since its establishment in 1986, NAF has undergone changes in its outreach,budget, and program composition. The untargeted, generalized subsidies on foodstuffswere eliminated in 1999, and the recurring cash assistance program was strengthenedpartly to make up for the resulting welfare loss sustained by the poor. The next majorpolicy change came in 2002. Reacting to criticism that the Recurrent Cash Assistanceprogram was helping only about 30 percent of the poor, the Government's new PovertyAlleviation Strategy19 recommended expanding coverage to all eligible individuals andfamilies, and increasing assistance to all families falling beneath the World Bank povertyline (JD 26 per person and JD 156 - up from JD 82 - for a modal six-memberhousehold). Renamed the Family Income Supplement Program, this cash assistance was
19 Poverty Alleviation for a Stronger Jordan, A Comprehensive National Strategy, Jordan PovertyAlleviation Program, Ministry of Social Development, Jordan, May, 2002.

I'li,' Wo;rldll$1lJ.*r&ill 1'\bt X>+>l^i 7
expanded to reach not only the poor who cannot work (the disabled, widowed women,etc) but also the working poor. In addition, the overall NAF budget was expanded nearlythree-fold from 1996 to 2002 (Figure 7). However, relative to government spending onpublic pensions for civil servants, which amounts to 4 percent of GDP, total NAFexpenditures on vulnerable groups is modest.
Figure 7. Income supplement program (recurring cash assistance):Families assisted and assistance per family, 1996-2002
70000 T 600
60000 - 550500
50000-- 45040000-- 400
30000- 3501996 1997 1998 1999 2000 2001 2002
Year
-- Number of families + Assistance per family
Source: National Aid Fund, Jordan, 2003.
37. NAF transfers are by far the most important unearned income for the poorest20decile of the population, surpassing private transfers from domestic and foreign sources
In both rural and urban areas, the average transfer per beneficiary decreases almostmonotonically with expenditure decile, strongly suggesting that NAF transfers are pro-poor. The average transfer to the poorest decile is about twice as large as for the richest inurban areas, and three times as large in rural areas - showing a decline in leakage since1997, when the poorest decile received only 70 percent more than the richest. There isalso a significant positive correlation between NAF transfers and the incidence of povertyacross governorates.
38. However, the impact of NAF transfers on poverty is modest because a largeproportion of the benefits accrue to the non-poor. Except in a few governorates such asAjloun and Karak, its poverty-alleviating role - whether considered in terms of changesin the head count ratio or the poverty gap ratio - appears to be marginal in comparisonwith the level of spending. Without NAF transfers, the percentage of poor would behigher by 0.8 percent and the poverty gap by 0.7 percent, but with improved targeting,the benefits could be much higher.21 As it stands, two-thirds of NAF benefits leak to the
20 Private worker remittance inflows produce little benefit for the poorest groups, which is not surprisinggiven the human capital and fixed costs of migration. Nevertheless, the poverty gap could double and thepercentage of the poor could increase by two points if remittances were to dry up completely.
21 An evaluation of 1997 NAF cash transfers by World Bank in 1999 attributed a far higher (3 percent)reduction in the percentage of poor. One obvious reason for the reduced impact of NAF now is that the newpoverty threshold has moved higher by nearly JD 53 (for 1997) over the 1997 threshold).

18 V .D BANK
non-poor; and the absolute amount of transfer remains about the same for decile groupsfour to ten in urban, and four to nine in rural areas (Figure 8). By comparison, thePROGRESA program in Mexico - which uses a two-tier targeting system to first selectcommunities and then select eligible beneficiaries within communities - delivers 58percent of benefits to the bottom two deciles (Box 2).
39. Moreover, inequalities in NAF expenditures persist at the govemorate level evenwithin the three poor decile groups. For example, the poorest deciles in rural Jerash and'Tafeela are at opposite extremes in receiving NAF transfers as a share of the poverty line.While the poorest in rural Jerash get nearly 60 percent of their poverty line, the poorest inTafeela get very little. There appears to be scope for NAF transfers to contribute to amuch larger reduction in the poverty gap, not only between rich and poor, but also acrossregions.

ii ndan11 13 ¾ ut'1l .AsS6's81itni 19
Box 2. Social safet) nets in Jordan and Mexico
According to NAF guidelines. the FIS program is a' ailable to several categories of beneficiaries:orphans under IS years of age and their [exiended] famiiilies; %xido\%s: divorced and abandonied"omen. unsupported Lyirl tnder 18 ;ears of age: the physically handicapped and their families:families of detained convicts; foster faniilies for ewerv minor child in their custod\y Jordanian"vom%en miarried to non-Jordanians;: the elderlk handicapped: the elderlk and their families and
an! other categor\ appro% ed by the NAF Board o(f Diectors " Poor families "xith able-bodiedbut Unemiiployed or unniarried adiult chlildren, and familliei milli "\orking uninarried adult children.are eligible ftor a reduced amount of assistance. The amount of a fanil 's stead) income from anysource is deducted from the assistanc.e allocated to the fainil. There is some tapering of per-member monthl\ assistance: JD 35 for a one-member famnilx, JD 60 for a r"o-nieneber fainil,and JD 26 for ex er memlber of a taml 1 of three or abo\ e.
In Mlexico. by contrast, the PROGRES.A safety net fund combines geographic taraetine andmeans testing. The poorest and niost inarginalized communities are selected usimw infornation oncommunirM characteristics mdemograph\. housing, infrastrucwure. eduication characteristics, etc.)from the national census. %%hich locates theml on a "marginalirM index." Then socioeconomic dataare collected on each household in the selecied coiminities, and the households identified (Lusinla prox) means score) as poor and %ulnerable are selected fo'r the progran. B1 20'iH). '2. miillionhouseholds. equivalent to 40 percent of rural households and 10 percent of all hoiseholds inMlexic. " ere erolled in the program The annual program budgei is abouit O 2 percenit of GDP.
Linlike prograiis else" here in the "orld. PROGRESA has been the subject of rigoroLIs e31uation(Skoufias and NlaClafferry 2i-0 1). Analysis of targeting efficienc) lias shom n that 58 percent ofprogranm beietfits go to hotiseholds in the bottom 20 percent of the incomiie distributionAdininistratike cost, account for less than 10 percent of total program costs. E'alualion resultha%e sho%% n a substantial decrease in the incidence ot' sickness aniong young children. significantimpro%ements in child height and "keight. a dramatic reductioni in anenmia anonr2 childrell, andsimnimlicant impro'ement in the health starus of adults In addition. the program cxas directlyresponsible for a 7 to 9 percent increase in secondary school enrollments for girls. and a 4 to 6percent increase for boss.
SoIlln et n ' I QY - S i tal S \ t Pogra and PoLl e Rt df t i,;non Lr ini 11 ' 0 -l oo'Fin2r/~cic dLl K. Sid'hbara JL! //I,: P",w *ik1mlll ,Ii 110L' Recc:w.ll?/tl V'I1 pWi rlltilm
-rI L'IL t and Lc i i'r a 4l ) i llt t rj; k'" L ii/Ji,tbIMi,t'c//ia/ii, b enw p ,, . .t let p/iN h l / /I.

20
* - - -.. . --------
Figure 8. The leaky social safety net
1000 l
900 800_L] Urban RuralC 800
1 700600
E 500400
CL. ~ ~ ~ ~ ~ ~ ~ ~ ~ ~ ~ ~ .
.- 3001
200100
0I1 2 3 4 5 6 7 8 9 10
Expenditure Deciles
Source: Staff estimates based on Household Expenditure and Income Survey 2002-03.
40. Given all of these findings, it seems clear that adopting poverty as the overarchingcriterion for receiving NAF benefits, rather than using the myriad of categories as atpresent could improve targeting.
D. How WELL ARE THE POOR ABLE TO USE THE LABOR MARKET?
41. The poor seek to improve their living conditions by using the one asset they havein abundance - labor. Whether they are able to use this asset to escape poverty ultimatelydepends on how successful they are in finding work, and how much they are able to earn.
42. Finding work in Jordan remains a major challenge for the poor, as unemploymenthas persisted in the 14 to 15 percent range since the mid 1990s, and is showing a slightlyworsening trend. Based on projections of labor force growth, significant reductions inunemployment over the next decade will require economic growth averaging 6 to 7percent a year, which is substantially higher than the 3.8 growth that occurred over the1997-2002 period. A few sectors of the economy (hotels and restaurants, real estate,personal services) have shown dynamic job growth, with the rate of growth ofemployment substantially exceeding that of the national labor force. However,employment growth has been weak or negative in many high-employment sectors (publicadministration, defense, education), and actual job shedding has occurred in the twosectors (agriculture and mining) that together account for almost a third of allemployment in Jordan.
43. Based on participation rates recorded in the Employment and UnemploymentSurveys (EUS),22 the average annual growth of the Jordanian labor force over the last
22 Quarterly reports published by Department of Statistics, Jordan.

Tlhc WX orld BankJor&m PIov cr t\ Asc\,,;mcnt 21
three years was 1.7 percent.2 3 This figure is well below forecasts of labor force growthfrom other sources, such as the International Labour Organization, 24 and stands in sharpcontrast to the growth of Jordan's working-age population, which averaged 3.4 percentper year over the same period. This significant decline in labor force participationaffected both genders, but particularly males. According to the EUS 2000, 66 percent ofJordanian males over age 15 participated in the labor force. By 2003, that figure haddropped to 63.2 percent. For females, the decline was smaller, from 12.3 percent in 2000to 11.2 percent in 2003.
44. The recent slowdown in labor force growth could also be a forewarning of workerdiscouragement. The poor are not looking for jobs as much as the non-poor. Labor forceparticipation rates for the poor, at 37 percent, are lower than for the non-poor, at 40percent. This is mainly because of the lower educational attainment of poor women, andthe need to look after a larger population of children below age 15 in poor households(Figure 9). Participation rates for the poor are consistently lower than for the non-poor atevery age, particularly for females. With education, however, female participation ratesrise steadily and remain higher than that of males.
Figure 9. The poor have more young dependents to support
Population Structure for the Non-Poor Population Structure for the Poor
65+ 65+
25 to 64 25 to 64
15 to 24 15 to 24
10 to 14 l<< 1 o1
5 to 9 5 to 9
0 to 4 0 to 4
40 20 0 20 40 60 40 20 0 20 40
% in Age Group % in Age Group
L % Males * % Females ] % Males a % Females
Source: Staff estimates, based on Household Expenditure and Income Survey, 2002-03,
45. Unemployment increases the risk of poverty in Jordan. Families of theunemployed are significantly more likely to be poor - 21.5 percent of the population withan unemployed household head lives below the poverty line, compared with only 12.8
23 See Volume 2 of this report for a description of how growth rates of labor force/employment wereconstructed.24 According to the ILO Labor Statistics Database, the estimated average annual growth of the labor forcein Jordan over the 2000-2010 period is 3.9 percent.

WILD KANK
22 t
percent of the population where the household head is employed, and 15.9 percent of thepopulation where the household head is not economically active.
46. Poverty rates for households headed by unemployed, puzzlingly, have realized thegreatest relative declines since 1997 (Table 3). All groups experienced significantdeclines in poverty between 1997 and 2002; but while the poverty rate for those with anemployed or economically inactive household head - as measured by increasedconsumption - declined over the period by 34 and 30 percent, respectively, the povertyrate for those with an unemployed head of household declined by almost 39 percent.Increased transfers may have played an important role in this decline, since theproportion of household income from transfers increased from about 25 percent in 1997to more than 40 percent in 2002. But this cannot be a sustainable basis for continuedpoverty reduction.
Table 3. Poverty rates of the population, by economic activity status,1997 and 2002
Economic activity Change in povertystatus IPovertv rate, 1997 Povert rate, 2002(Pre)
Total population 2 1114.2 - -32.8-al t1 '---51-l---t-- - ---------
lineipPo\e4 35.0 -1.5 3_.6Employed 19.3 12.8 33.6Not economicall- ---- --;--
active 22'.7 15.9 29.8
Source: Household Expenditure and Income Survey, 1997 and 2002.
47. Though poverty has declined for the unemployed, at least in this period, certainsegments of the unemployed have also increased their absolute and relative risk forpoverty. Poverty rates for the least educated unemployed have increased over the 1997-2002 period, contrary to the trend for the better educated. Seen in the context of decliningreturns to education for those with low education, this group may become increasinglyvulnerable in the future.
48. The unemployment rate is high among youth, women, and particularly educatedwomen. Youth from poor families have a higher unemployment rate than the non-poor(42 as opposed to 36 percent). In 6 of the 12 governorates, the youth unemployment rateexceeds 50 percent (Figure 10).

' I'li .A x , NC\ [ ,It l2
Figure 10. Youth unemployment among the poor and non-poorby governorate, 2002
80
60 -
40 --- I
40
20 I
E] Non-Poor * Poor
Source: Staff estimates, based on Household Expenditure and Income Survey, 2002-03.
49. Poverty has also declined for employed workers since 1997, with the proportionof households headed by the working poor falling from almost 10 percent in 1997 to only6 percent in 2002-03. Yet, there were about 100,000 working adults living in poorfamilies in 2002-03, in part because labor-intensive segments of the economy - landtransport; agriculture; commercial gardening; horticulture; construction; manufacture andrepair of motor vehicles; manufacture of wearing apparel; and retail sale of food,beverages, and tobacco - hire more workers from poor families. In relative terms, Jordanhas the lowest proportion (three-quarters) of the poor participating in the labor forceamong select MENA comparators (Figure 11).
Figure 11. Working poor ratio is low in Jordan
120.0 -
100.0 -
80.0
40.0-
20.0
0.0-
Jordan Tunisia Egypt Yemen
Note: The working poor ratio is the ratio of the employed to labor force among the poor.Source: Staff estimates, based on Household Expenditure and Income Survey, 2002-03.
50. The unemployment rate for the poor, at 27 percent, was significantly higher in2002 than that of the non-poor, at 17 percent - an eight point increase in the gap betweenpoor and non-poor since 1992. Though youth generally face higher unemployment rates,Jordan's poor youth suffer from 42 percent unemployment, as compared to 36 percent fornon-poor youth.

24 ItD 8DNI
E. THE POOR ARE LAGGING BEHIND IN EDUCATION
51. Despite significant gains in education, the poor, especially in rural areas, lagbehind the rest of the population in terms of educational achievements. In 2002, whilethe proportion of illiterates was between 8 percent and 9 percent in the upper four wealthquintiles, 12 percent of the poorest quintile are reported to be illiterate - a statisticallysignificant difference. Overall, illiteracy was much higher in rural areas (14.1 percent) ascompared to urban areas (7.9 percent), and was more than twice as high for the rural pooras for the urban poor (20.4 versus 9.6 percent). While all children have equal physicalaccess to education facilities secondary and higher education enrollments are skewedtoward the wealthier segments of society. The difference in enrollments is mostpronounced for higher education, with the poorest quintile representing less than one-third the proportion of the richest 20 percent in public and private higher educationinstitutes (Figure 12).
Figure 12. The poor lag behind in every stage of education
100%
75%
50%
25%
0%
Poorest 20% 2 3 4 Richest 20%|U BASIC [ SECONDARY U HIGHER
Source: Household Expenditure and Income Survey, 2002-03.
52. Overall in Jordan, poverty is inversely related to educational attainment, and thedifferences in educational attainment between urban and rural areas are significant.Illiteracy is a strong driver of poverty for people in both rural and urban areas, but theincidence of poverty is much lower for people who attain higher than secondaryeducation, regardless of whether they are from urban or rural areas. Moreover, theacquisition of education is significantly related to a reduced incidence of poverty. Forexample, a head of household who is illiterate is 19 times more likely to be poor as onewho has attained more than two years of college education. Between 1997 and 2002, thestrength of the negative effect of higher education on the likelihood of being poorincreased 50 percent. While this is a troubling statistic, given the proportionally lowerrepresentation of lower income groups in higher education, it is likely to have a positiveimpact on encouraging higher educational attainments among Jordanian youth.
The Wo1rkl B;3.nkloidan Povcrm AXoee>>oit-M 25
53. Even though education of the poor is valued in the labor market, the returns tohigher levels of education are much higher for the non-poor than for the poor. Attaining aminimum level of literacy (reading and writing ability) increases the lifetime earnings ofthe poor by 20 percent, as compared to being illiterate; and completing six years ofschooling adds 10 percent more to their earnings. However, the large gains observed forhigher levels of education for the non-poor were not seen for the poor. For example, aBA graduate from a non-poor family can expect to earn 86 percent over one who isilliterate, but a BA graduate from a poor family can expect to earn only slightly morethan 50 percent over one who is illiterate, possibly because the poor have feweropportunities to take advantage of their higher education than the non-poor. Nevertheless,the value of higher education remains high for both the poor and the non-poor.
54. Why do inequalities remain in the education system? Evidence from other studiesand analysis of the 1997 and 2002 Household Expenditure and Income Surveys shed lighton possible factors. For example, it is common to find, in countries at similar levels ofdevelopment as Jordan, that rural residents have relatively limited opportunities forgenerating income, resulting in the higher incidence of poverty in rural areas. It is alsosuggested that the relative mobility of the non-poor versus the poor may be a factorlimiting the income earning potential of the poor. Also, the lack of information oneducational opportunities, as well as the lack of access to credit markets and other meansof student financial aid, may be constraining factors sustaining inequalities in theeducation system.
55. The relative costs and returns of acquiring education may provide a strongerincentive to the non-poor to stay in school and attain higher education. It may be quiteplausible that the higher proportion of family income devoted to direct (school related)and indirect costs (in terms of lost earnings), together with the lower relevance andquality of education, and the lower relative value generated by education among the poor,lead to a vicious cycle of perpetuating poverty among the lowest income group. Familypoverty and parental education are also significant factors in school dropout and schoolperformance. Once children have dropped out, there is a high likelihood that boys willwork in the labor market to augment family income. The analysis in this report has shownthat these individuals are disadvantaged throughout their lifetimes by low earnings.While education is a very important factor in earning income and has a significant effecton reducing the likelihood of poverty, there are many factors that are limiting theacquisition of higher levels of education for a student from a poor family background;and the relatively lower returns imply that poor families have less incentive to keep theirchildren in school. Lower education leads to lower returns, which leads to lowereducational attainments. Thus, the cycle continues.
56. Private and household finances play an important role in the financing ofeducation, especially at the higher education level. The average Jordanian householdspends 4 percent of total household expenditures on education. Educational expendituresare equitably distributed across wealth quintiles: the poorest wealth quintile spends 2

26
percent while the richest quintile spends 6.5 percent of total household expenditures oneducation.
57. The Government of Jordan spends a considerable sum on education, and per-pupilspending has increased in the 1 990s. In basic and secondary education, per-pupilspending has increased by almost 30 percent (from JD 141 in 1990 to JD180 in 2000),and the proportion of recurrent expenditures going to personnel costs has increased from83 to 90 percent. The high share of personnel expenditures in basic and secondaryeducation may also reflect low internal efficiency, as measured by low student-teacherratios in remote and rented schools, and by high teacher salaries.
58. Public spending is more equitably distributed at the lower levels of education, butthere needs to be greater equity in higher education. In general, children from poorerfamilies form a high proportion of the enrollments at public basic and secondary schools,while the reverse is true for higher education. Analysis of the per-student subsidy at thedifferent levels of education reveals that basic education subsidies are pro-poor, whilehigher education subsidies are pro-rich. Thus, there is a strong case for enhancing thetargeting of higher education financing toward lower-income groups, through, forexample, targeted scholarships and subsidized loans.
59. The fact that some inequalities remain in the system indicates that there is arationale for public intervention in the education sector. As a next step, it would beimportant to focus on improving the quality of education, which would lead to higheroutcomes and thus provide incentives for the poor to get more education. Interventionscould include:
* Extending basic education coverage to the remaining 4 to 5 percent of thepopulation that is still out of school;
* Focusing on improving the quality of basic education, so as to enhance promotionto the secondary level;
* Improving the quality and relevance of education at the secondary level, so as toenhance outcomes, especially for the poor;
* Targeting incentives specifically to address the low enrollment of the poor inhigher education (perhaps through scholarships and/or subsidized access to creditmarkets);
* Lifelong learning opportunities, to increase the skills and knowledge of the laborforce as a complement to their formal education, in order to meet the changingneeds of the labor market. Lifelong learning would also create awareness ofemployment opportunities for the poor, so they could generate returns comparablewith their education level;

11hvc \Aorld BankAwdan PovetN Assessmcnt 27
* Since early childhood education (ECE) has been proven by intemationalexperience to be the strongest factor countering the disadvantages of childhood,the government could facilitate access to ECE for poor and disadvantagedstudents.
F. THE POOR HAVE WEAKER HEALTH OUTCOMES BUT BEAR A HIGHER BURDEN OF
EXPENDITURE
60. Recent household surveys25 reveal important inequalities in the health indicatorsof the poorest 20 percent of Jordanian society. The poor are exposed to greater healthrisks and have significantly lower access to health services than the rich - leading tohigher infant and child mortality rates, greater childhood malnutrition, a higher incidenceof disability, and higher fertility rates. Infant and child mortality rates for the poor are 1.5to 1.7 times higher than for the richest quintile (Figure 13). For poor children who dosurvive, the effects of malnutrition are severe. Stunting (height for age) and wasting(weight for age) are nearly 7 times greater than for children of the richest quintile.Moreover, the process indicators show lower numbers of physician-assisted deliveries,fewer deliveries at home, and a lower rate of contraceptive use. Some underlying riskfactors for these lower health outcomes include lower school completion rates(particularly for women), higher rates of smoking, and poorer methods of waste disposal.Other factors, such as health financing methods, suggest a substantial degree ofregressivity, with the poor paying proportionately more out of pocket for outpatient care(9 percent of household income), as opposed to the richest (7 percent).
Figure 13. Infant and child mortality rates by income quintile
45-
40 <135
30
2 5 -e 20 t>2
u 15I
10
Lowest Second Middle Fourth Highest
Income Quintile
25 Demographic and Health Survey, 1997, Departmnent of Statistics, Jordan.

28
Source: Demographic and Health Survey, 1997, Department of Statistics, Jordan.
61. There are a wide number of possible reasons for the higher infant and childmortality rates among the poor in Jordan. While the demographic and health survey datareveal no significant difference in overall vaccination rates or prevalence of childhooddisease across income quintiles, they do show substantial differences in the prevalence ofchildhood malnutrition, as evidenced by stunting and wasting. The higher levels ofmalnutrition among the poor work to lower the immune defenses of children and makethem more susceptible to childhood illnesses. Other direct and indirect factors couldinclude the effects of high fertility and less access to prenatal care and medicallysupervised deliveries - which together could contribute to higher infant and childmortality rates among the poor. Understanding the causes, both distal and proximal, ofchild mortality in Jordan, especially among the poor, deserves much deeper analysis andattention. One important intervention could be the immediate improvement of mortalitycoding and death registration data in hospitals and health centers around the country.
62. Preliminary analysis of public sector spending on health suggests that it is pro-poor, as the poor tend to make more use of both the outpatient and inpatient servicesoffered by hospitals under Ministry of Health. The services provided by the RoyalMedical Services (another publicly funded organization), on the other hand, are utilizedmore by higher income groups for both types of care.
63. Other health-related inequalities, such as the prevalence of disability, also deservegreater study and investigation. The incidence of disability is nearly twice as high amongthe poor as in the richest quintile. Are these inequalities due to greater degrees of co-sanguinity among the poor, or to poorer access to effective health care services? Whyshould congenital hearing loss or poor vision be more prevalent among the poorersegments of Jordanian society? Why do the poorest 20 percent of Jordanian society notuse modem methods of contraception? How could greater utilization of these methods beencouraged? Why do the poor smoke more? Is there any way to promote greater riskpooling across different income groups to minimize the impact of out-of-pocketexpenditure on unexpected health care services required by the poor?
64. There are many layers of interventions that could improve the health outcomes ofthe poor in Jordan. In a recently elaborated "Pathways" framework26 developed by theWorld Bank, three distinct layers of interventions are identified and developed. The firstlayer concerns household and communal practices (hand washing, not smoking, use ofiodized salt, exclusive breastfeeding, safe sanitation, consumption of clean water) that areessential to good health outcomes. The second layer involves the programs and servicesof the health sector and other concerned sectors, which could include preventive andcurative care at all levels, health insurance schemes, female education policies, water andsanitation infrastructure, housing, and food safety. The third layer could concern general
26 Soucat, Agnes L.B., Yazbeck, Abdo S. "IHNP and the Poor: Inputs into PRSPs and World BankOperations," Distance Education Courses on Poverty and Health, World Bank, Washington DC. Availableat: http://www.worldbank.org/poverty/health/learning/index.htm

'Ihe World BankJordan Po\enrty Assesnmcnl 29
government policies to redress social and economic inequities (e.g., promoting publiceducation or establishing a more progressive taxation system).27
65. Following from our analysis, we have identified several interventions that couldhelp to promote greater health outcomes among the poor. These interventions could beintegrated horizontally into the current public health programs in the country, or beinitiated via a direct vertical approach.
* Improve data collection systems to generate reliable data, at regular intervals, onmortality, fertility, chronic morbidity, nutrition, and disability; and improve themortality coding and death registration systems;
* Promote childhood nutrition interventions among pre-schoolers and school agechildren, to address malnutrition among poor children; and establish effectiveprograms for the integrated management of childhood diseases;
* Strengthen current reproductive health services to increase the utilization ofmodern contraception and prenatal services among the poor; and enhance thecapacity of the health care system to effectively handle high-risk pregnancies inpoorer rural areas.
* Undertake national screening programs (e.g., early detection of hearing lossamong newborns) and injury prevention campaigns (e.g., road safety) to reducethe incidence of disability among the poorer income groups;
* Continue to narrow the gender gap in female education via effective outreachservices to support higher school enrollment and attendance by girls from poorerbackgrounds. Closing this gap in education can have significant crossover effectson health;
* Initiate significant health finance reforms to better mitigate the effects of high out-of-pocket expenditures on health care by poorer income groups. Greater riskpooling arrangements, through general taxation or special social insuranceschemes, could help protect households from the financial risks associated withunexpected illnesses and accidents.
27 There is a growing and important literature on the "social determinants" of health inequalities. SeeMarmot (1999), Social Causes of Social Inequalities in Health, Harvard Center for Population andDevelopment Studies, Working Paper Series 99.01 (January).

] | ~~~A~LD BANK
30 §LO IAt
ANNEX 1: POVERTY INDICATORS BY SUB-DISTRICT
11011 Amman 9.848674 1.941445 0.59376211021 Marka 7.589943 1.503224 0.45805511031 Qwaismeh 15.03713 3.581711 1.18791111041 Jami'ah 2.548568 0.41796 0.1065811051 Wadi Essier 3.64311 0.704693 0.21800411061 Sahab 9.973665 1.591759 0.38457311071 Mowaqqar 24.9617 7.02783 2.7442811081 Jizeh 32.00961 7.385699 2.52918411082 Um Rsas 26.57101 6.77575 2.49681611091 Na'oor 10.39261 2.077409 0.65755611092 Um El-Basateen 5.736701 0.642363 0.10118712011 Salt 4.425448 0.605341 0.13838712012 Ardhah 11.29431 2.761779 0.85380112013 Zayy 10.10945 3.29279 1.58447912014 Mahes & Fohais 3.661971 0.558023 0.20689512015 Ira & Yarqa 4.221557 1.037696 0.3164512021 Dair AlIa 27.57996 6.161618 2.01337612031 Shooneh Janoobiyeh 27.12072 8.055319 3.29628312041 Ain El-Basha 23.9749 4.974059 1.57813613011 Zarqa 18.07677 4.34885 1.62642713012 Azraq 40.29726 9.057645 2.85094613013 Bierain 42.25848 8.846846 2.71551213014 Hashemiyeh 29.03899 7.679083 2.84687913015 Dhiail 52.18637 12.73075 4.76305713021 Ruseifa 22.58134 5.444397 1.94437614011 Madaba 10.82008 2.374303 0.78872914021 Dieban 9.254498 2.374187 0.84170814022 Ariedh 17.75282 3.011338 0.77652321011 Irbid 10.58426 2.280818 0.72017121012 Wastiyeh 10.31389 1.941495 0.55405721021 Bani Obeid 11.87321 2.55178 0.85688921031 Mazar Shamali 25.37095 7.041301 2.58513421041 Koora 18.55918 4.288643 1.39194621051 Bani Kinanah 9.598923 1.861451 0.5928721061 Ramtha 14.78802 3.169789 1.1173121071 Shooneh Shamaliyeh 23.94367 5.720672 2.04488821081 Tayybeh 12.64614 2.156784 0.63319722011 Mafraq 18.74759 4.475606 1.530922012 Bal'ama 25.007 4.937179 1.56446522013 Erhab 22.73089 5.066479 1.576127

The Wol lI i3;inkJoErdan I P" V rt\ Asse.,\ tflcf1 3 1
22014 Sama Serhan 28.09882 8.36537 3.45496122015 Hoasha 31.6129 8.561953 3.21163122021 Salhiyeh 48.22717 15.85496 6.86744722022 Sabha 18.9862 5.017563 1.79289922023 Rwaished 73.34158 29.11105 14.3284622024 Umn Ejjimal 34.60888 9.239153 3.792722025 Dair El-Kahf 35.19899 10.72565 4.33722523011 Jerash 19.41407 5.008557 1.91953223012 Borma 13.22029 3.838587 1.57037123013 Mastabah 10.23189 2.281955 0.63313224011 Ajlun 9.948308 2.06514 0.65512224012 Kofranjah 8.900071 1.31654 0.27389831011 Karak 5.169596 1.346367 0.51092531012 Ayy 9.142333 2.658769 0.97394331013 Qatraneh 22.33921 5.444687 1.79182531021 Ghor Safi 34.26739 6.806135 1.97538431022 Mazra'ah 26.3734 7.171039 2.9418631031 Mazar 4.937318 1.305449 0.49482731041 Qasr 17.62978 5.671611 2.67066831042 Faqoo' 12.44699 3.859892 1.61108132011 Tafiela 9.37706 1.799605 0.5732732012 Hesa 10.82033 2.044107 0.47914132013 Bsaira 14.1444 2.176402 0.57752133011 Ma'an 19.51546 4.676199 1.83192633012 Huseiniyeh 46.86503 14.53418 5.80933013 lel 16.7959 4.951336 2.15869233014 Jafer 46.01683 11.60771 3.37623533015 Mraighah 41.34554 11.67998 4.44479833021 Shoabak 7.930922 0.87511 0.19247433031 Wadi Moosa 9.687165 2.380088 0.94160434011 Aqaba 7.688832 1.721789 0.58944834012 Wadi Arabah 53.46989 18.69824 8.69572134021 Qwairah 36.04762 10.36566 4.231825

- a