Embed Size (px)
Citation preview

Policy Research Working Paper 5885
Mozambique’s Infrastructure
A Continental Perspective
Carolina Domínguez-TorresCecilia Briceño-Garmendia
The World BankAfrica RegionSustainable Development UnitSeptember 2011
WPS5885P
ublic
Dis
clos
ure
Aut
horiz
edP
ublic
Dis
clos
ure
Aut
horiz
edP
ublic
Dis
clos
ure
Aut
horiz
edP
ublic
Dis
clos
ure
Aut
horiz
edP
ublic
Dis
clos
ure
Aut
horiz
edP
ublic
Dis
clos
ure
Aut
horiz
edP
ublic
Dis
clos
ure
Aut
horiz
edP
ublic
Dis
clos
ure
Aut
horiz
ed

Produced by the Research Support Team
Abstract
The Policy Research Working Paper Series disseminates the findings of work in progress to encourage the exchange of ideas about development issues. An objective of the series is to get the findings out quickly, even if the presentations are less than fully polished. The papers carry the names of the authors and should be cited accordingly. The findings, interpretations, and conclusions expressed in this paper are entirely those of the authors. They do not necessarily represent the views of the International Bank for Reconstruction and Development/World Bank and its affiliated organizations, or those of the Executive Directors of the World Bank or the governments they represent.
Policy Research Working Paper 5885
In the last 10 years, Mozambique’s economy has grown steadily at an impressive rate of 7.7 percent per year, driven by the service sector, light industry, and agriculture. This pace is expected to continue or even increase with the massive influx of already-planned investment on the order of $15–20 billion. Mozambique’s infrastructure is well developed in some sectors, including its east–west transport infrastructure, power grid, and water and sanitation networks. But the nation still faces critical challenges in these and other areas, including developing north–south transport connections, properly managing the water system, and expanding hydroelectric generation to meet potential.
This paper is a product of the Sustainable Development Unit, the Africa Region. It is part of a larger effort by the World Bank to provide open access to its research and make a contribution to development policy discussions around the world. Policy Research Working Papers are also posted on the Web at http://econ.worldbank.org. The author may be contacted at [email protected].
Mozambique spent about $664 million per year on infrastructure during the late 2000s, with as much as $204 million lost annually to inefficiencies. Comparing spending needs with existing spending and potential efficiency gains leaves an annual funding gap of $822 million per year. Mozambique could reduce inefficiency losses by positioning itself as a key power exporter. The country could reach infrastructure targets in 20 years through a combination of increased finance, improved efficiency, and cost-reducing innovations.

Mozambique’s Infrastructure: A Continental Perspective
Carolina Dominguez-Torres and Cecilia Briceño-Garmendia

Acknowledgments
This paper draws on contributions from sector specialists from the Africa Infrastructure Country
Diagnostic team—notably, Dick Bullock on railways, Mike Mundy on ports, Heinrich Bofinger on air
transport, Rupa Ranganathan on power, Carolina Dominguez on water and sanitation, Michael Minges
and Rebecca Meyer on information and communication technologies, Alberto Nogales on roads, Nataliya
Pushak on public expenditure, and Alvaro Federico Barra on spatial analysis.
The paper is based on data collected by local consultants and benefited greatly from feedback
provided by colleagues in World Bank country teams—notably Luiz Claudio Tavares (acting country
manager, water and sanitation), Boris Utria (sector leader and power), Luiz Claudio Tavares (water and
sanitation), Jose Chembeze (roads and railways), Isabel Neto (ICT), Antonio Nucifora (macro), Rafael
Saute (media and communications), and local consultants Manuel Ruas, Afua Sarkodie, and Naimo Jala.
Arlete Comissario provided invaluable administrative and logistic support.
Preliminary results and emerging messages of this paper were discussed in a workshop in Maputo in
November 2009. The workshop was hosted by Minister of Energy H.E. Salvador Namburete, Minister of
Transport and Communications H.E. Paulo Zucula, and Minister of Public Works H.E. Felício Zacarias.
The team is grateful for the insightful comments and recommendations of the workshop participants.

iii
Contents
List of figures iii
List of tables iv
Synopsis 1
The continental perspective 2
Why infrastructure matters 3
The state of Mozambique’s infrastructure 4
Transport 8 Roads 10 Railways 13 Ports 16 Air transport 19 Water resources 22 Irrigation 23 Water supply and sanitation 26 Power 31 Information and communication technologies 36
Financing Mozambique’s infrastructure 41
How much more can be done within the existing resource envelope? 44 Annual funding gap 47 What else can be done? 47
Bibliography 50
General 50 Financing 50 Growth 50 Information and communication technologies 51 Irrigation 51 Power 52 Transport 52 Water supply and sanitation 53
List of figures
Figure 1. Infrastructure’s contribution to economic growth: Benchmarking Mozambique against other Sub-Saharan nations 4 Figure 2. Mozambique’s population, income, and mineral resources are concentrated in the center and south 6 Figure 3. Mozambique’s infrastructure networks align with population density and natural resource concentrations 7 Figure 4. Fuel levies compared in select Sub-Saharan African countries (U.S. cents per liter) 11 Figure 5. Main road network conditions in southern Sub-Saharan Africa 12 Figure 6. Preservation spending as a percentage of requirements in southern Sub-Saharan Africa (based on annual
average, 2003–07) 13 Figure 7. Evolution of seats and city pairs in Mozambique 21 Figure 8. Mozambique irrigation sector 23 Figure 9. Irrigation potential 25 Figure 10. Evolution of hidden costs in Mozambique’s water sector 29 Figure 11. Expansion of lowest-cost technologies in water and sanitation technologies at the national, urban, and rural
levels have kept pace with population growth 30

iv
Figure 12. Hidden costs of selected water utilities, as percentage of revenue 30 Figure 13. Hidden costs of Mozambique’s electrical utility in comparative perspective 33 Figure 14. Mozambique’s power potential under trade expansion and stagnation scenarios 34 Figure 15. Power tariffs and costs in Mozambique are among the lowest in Africa 35 Figure 16. Average revenue is below historical total power costs but above incremental costs 36 Figure 17. Around 13 percent of Mozambique’s population could be reached by a GSM signal only under
a subsidy scheme 38 Figure 18. Telecommunications coverage in Mozambique 39 Figure 19. Mozambique’s Internet market, despite improvement, lags behind southern African peers 40 Figure 20. Mozambique’s infrastructure spending needs are substantial relative to GDP 42 Figure 21. Mozambique’s existing infrastructure spending is particularly high 43 Figure 22. Mozambique’s pattern of capital investment in infrastructure differs from that of comparator countries 44 Figure 23. Underpricing of power and water in Mozambique is relatively less burdensome 45 Figure 24. Consumption of infrastructure services in Mozambique varies by income quintile 46 Figure 25. Mozambique’s power and water utilities: The burden of inefficiency 46 Figure 26. Mozambique is capturing a significant amount of PPI but there is still room for improvement 49
List of tables
Table 1. The achievements and challenges of Mozambique’s infrastructure sectors 8 Table 2. Trading across borders in southern African countries 9 Table 3. Mozambique’s road indicators benchmarked against Sub-Saharan African low- and middle-income countries 10 Table 4. Railway indicators for Mozambique and select other countries, 2000–05 15 Table 5. Cargo and passengers transported along Mozambique’s railways 16 Table 6. Traffic in Mozambique’s ports 17 Table 7. Cargo and containers handled in Mozambique’s ports 17 Table 8. Benchmarking of ports in Southern Africa 18 Table 9. Benchmarking air transport indicators for Mozambique and select other countries 20 Table 10. Mozambique’s irrigation potential 25 Table 11. Benchmarking water and sanitation indicators 27 Table 12. Evolution of operational indicators associated with Mozambique utilities 28 Table 13. Benchmarking Mozambique’s power indicators 31 Table 14. Performance of the electricity sector in southern African countries 32 Table 15. Evolution of hidden costs associated with EDM 32 Table 16. Benchmarking ICT indicators 37 Table 17. Mozambique’s mobile teledensity is among the lowest in southern Africa 38 Table 18. High international call charges driven both by technology and market power 40 Table 19. Illustrative investment targets for infrastructure in Mozambique 41 Table 20. Indicative infrastructure spending needs in Mozambique for 2006–15 42 Table 21. Financial flows to Mozambique’s infrastructure, average, 2001–06 43 Table 22. Potential gains from greater operational efficiency 45 Table 23. Funding gaps by sector 47 Table 24. Potential savings from adopting alternatives technologies in power, water, sanitation, and roads sectors 49

Synopsis
In the last 15 years Mozambique’s economy has grown steadily at an impressive 7.7 percent per year,
driven by the service sector, light industry, and agriculture. This growth rhythm of the economy is
expected to be maintained or even increase with a massive influx of investment, already identified, on the
order of $15 billion–$20 billion. These projects, presently under implementation or consideration, will be
mostly undertaken by the private sector, and mostly associated with the exploitation of valuable natural
resources, particularly coal. Mozambique is well endowed in natural resources.
In terms of geography, Mozambique enjoys a privileged and strategic location as the natural exit to
most of its landlocked neighbors, in particular Zimbabwe, Zambia, and Malawi. The central transport
infrastructure extends from the Port of Beira to Zimbabwe, and marginally to Malawi and Zambia. The
southern transport network links the Port of Maputo to the northeastern part of South Africa, Swaziland,
and Zimbabwe. These two ―transport clusters‖ are multimodal, mostly functional, and already attracting
interest among private investors. Moreover, Mozambique is well endowed with hydropower potential; it
is already a net exporter of electricity, and can expect to play a critical role in the power trade of the
region through the development of its hydropower potential in the near future.
Transport infrastructure is developed transversally, west–east, connecting mining and agricultural
clusters inside Mozambique and in neighboring countries to exit ports. The connectivity among
population concentrations, as well as the quality of roads, along these transport corridors is relatively
good. The railway system is functional and has been attracting private interest in recent years. The road
network has seen a revamp in investment and rehabilitation, and a second-generation road fund has been
set in place.
In terms of nontransport infrastructure, the provision of power supply is reliable and the national
utility has a good—and improving—performance record. Access to improved water supply, reduction in
the use of surface water, and reduction of open defecation has put Mozambique close to reaching the
Millennium Development Goals (MDGs) in water and sanitation.
But Mozambique still faces critical infrastructure challenges. Perhaps the starkest lies in the transport
sector. While some of the transport corridors are mostly functional in providing regional connectivity and
connecting mining and key production centers to ports, Mozambique’s connectivity among urban and
economic clusters is quite limited, lacking linkages that connect parallel corridors to each other. With the
exception of the recently finalized north-south National Road N1, the country has no (or has very limited)
connection among the several west-east corridors, and developing full connectivity would require
sustained and enormous investments over decades, with the likely participation of the private sector and
nontraditional financiers. Additionally, rural population accessibility to domestic (and eventually
international) markets is an enormous challenge, and lags behind what is observed in the region. Finally,
maintaining the rapidly expanding road and rail network is an enormous hurdle to overcome,
institutionally and financially, as the size of the network seems to overshadow the capacity of the country
to provide funds for its maintenance.

MOZAMBIQUE’S INFRASTRUCTURE: A CONTINENTAL PERSPECTIVE
2
As for water resources, the country’s enormous potential has been only partially tapped. The main
challenge is how to handle the wide range of conflicting water uses within an environmentally conscious
framework. The current irrigation area can be expanded significantly with good economic returns.
Management of national water resources should be done so as to increase the yield from existing and
planned dams to augment water supply. Finally, Mozambique’s hydropower potential is substantial and
can be expanded up to 13,000 megawatts (MW), mainly and mostly around the Zambezi watershed.
Addressing Mozambique’s public infrastructure needs will require sustained spending of more than
$1.7 billion per year within the next decade, or the equivalent of 26 percent of the gross domestic product
(GDP); this is among the highest in the southern region. This is based on achieving an illustrative set of
infrastructure targets, and considers only public infrastructure needs without taking into account the
private infrastructure needs of the concessions associated with coal, iron ore, and aluminum. Close to 70
percent of these needs are derived from capital needs, and the highest annual price tag is associated with
the power sector.
When all sources of spending are taken into account, Mozambique spent an annual average of about
$664 million on infrastructure during the late 2000s. That is equivalent to about 10 percent of its GDP, a
relatively high share compared with other African countries, though still only about half of the share that
the estimated needs would require. Around two-thirds of total infrastructure spending is investment.
Transport absorbs the largest share of that spending and water, information and communication
technology (ICT) and power represents similar level of spending. The public sector (through taxes and
user fees) and official development assistance are the largest source of investment, followed distantly by
private funds.
A total of $204 million is lost annually to inefficiencies, mainly because of the misalignment between
tariffs and costs in the power and water-supply sectors. Only by pursuing an investment agenda that takes
into account regional dynamics and positions Mozambique as a key power exporter is there potential for
reducing marginal costs of power below the existing tariff and therefore eliminating this inefficiency.
Assessing spending needs against existing spending and potential efficiency gains leaves an annual
funding gap of $822 million per year, or 12.5 percent of GDP, most of it associated with water and
sanitation and power. Mozambique will likely need more than a decade to reach the illustrative
infrastructure targets outlined in this report. Under business-as-usual assumptions for spending and
efficiency, it would take over 50 years for the country to reach these goals. Yet with a combination of
increased financing, improved efficiency, and cost-reducing innovations, it should be possible to reduce
that time to 20 years.
The continental perspective
The Africa Infrastructure Country Diagnostic (AICD) has gathered and analyzed extensive data on
infrastructure in more than 40 Sub-Saharan countries, including Mozambique. The results have been
presented in reports covering different areas of infrastructure—ICT, irrigation, power, transport, water
and sanitation—and different policy areas, including investment needs, fiscal costs, and sector
performance.

MOZAMBIQUE’S INFRASTRUCTURE: A CONTINENTAL PERSPECTIVE
3
This report presents the key AICD findings for Mozambique, allowing the country’s infrastructure
situation to be benchmarked against that of its African peers. Given that Mozambique a is poor but stable
country, two sets of African benchmarks will be used to evaluate its situation: those for nonfragile low-
income countries (LICs) and those for middle-income countries (MICs). Detailed comparisons will also
be made with immediate regional neighbors in the Economic Community of West African States
(ECOWAS).
Several methodological issues should be borne in mind. First, because of the cross-country nature of
data collection, a time lag is inevitable. The period covered by the AICD runs from 2001 to 2006. Most
technical data presented are for 2006 (or the most recent year available), while financial data are typically
averaged over the available period to smooth out the effect of short-term fluctuations. Second, to make
comparisons across countries, we had to standardize the indicators and analysis so that everything was
done on a consistent basis. This means that some of the indicators presented here may be slightly different
from those that are routinely reported and discussed at the country level.
Why infrastructure matters
During the past 15 years, Mozambique’s economic performance has been strong, at 7.7 percent annually.
The country has also managed to make impressive strides in terms of poverty reduction. Between 1996–
97 and 2002–03, the poverty headcount index fell by 15 percentage points, the infant-and-under-five
mortality rate decreased by 7 percentage points, and primary-school enrollment increased by 33
percentage points. These achievements have set Mozambique on track to attain 13 of the 21 MDG targets,
including those linked to poverty, under-five mortality, maternal mortality, malaria, and an open trading
and financial system (Government of Mozambique 2010).
Despite its impressive progress in both economic growth and poverty reduction, Mozambique
remains one of the poorest countries in the world. Fifty-four percent of Mozambicans live below the
poverty line, and access to basic infrastructure services—power, transport, water and sanitation, and
telecom—are below regional averages. To maintain high rates of economic growth, reduce poverty, and
make development sustainable, Mozambique needs to continue improving the provision of infrastructure
services and conspicuously increasing the connectivity of people and markets.
Empirical studies linking infrastructure to economic growth underscore the importance of improving
Mozambique’s infrastructure. Continentwide, during the period 2003–07, overall improvements in per
capita growth rates in Africa have been estimated at 1.9 percentage points, of which about 1 point is
attributable to better structural policies and 0.9 points to improved infrastructure. This contribution comes
mainly from the ICT revolution, while deficient power infrastructure has held growth back (figure 1).
Looking ahead, if Mozambique could improve its infrastructure to the level of the MICs in the region,
growth performance could be enhanced by as much as 2.6 percentage points per capita.

MOZAMBIQUE’S INFRASTRUCTURE: A CONTINENTAL PERSPECTIVE
4
Figure 1. Infrastructure’s contribution to economic growth: Benchmarking Mozambique against other Sub-Saharan nations
Infrastructure’s contribution to annual per capita economic growth in African regions, 2003–07, in percentage points
Source: Calderón 2009.
The state of Mozambique’s infrastructure
Mozambique is a relatively large country, with an area of approximately 800,000 km2. Its population
of 21.3 million people is concentrated in major cities (figure 2a). The country is characterized by sharp
contrasts between the north and the south, defined by the geographic division posed by the Zambezi
River. To the north, topography is characterized by hills, low plateaus, and rugged highlands, while the
south is mainly composed of lowlands (figure 2c). Demographically, the north has a very spatially
dispersed population, whereas the south is characterized by population clusters around major urban areas
and transportation networks (figure 2b). Economically, the northern region is predominantly agricultural
and hosts the production of the majority of export crops, while the southern region (including the Moatize
area) is characterized by manufacturing activities and mining.
Mozambique is well endowed with natural resources. It is part of the Zambezi and the Limpopo river
basins, both of which offer enormous potential for water-resource development and for hydropower
production. The country is also well endowed with minerals (figure 2d). Currently, aluminum represents
one-third of its exports, and private sector investments worth between $15 and $20 billion have been
identified. Massive developments in coal are already under way in the area of Moatize, with the potential
to bring coal exports to 5 million tonnes in the coming two years and up to 20 million tonnes within two
decades. There is also considerable potential in iron ore, phosphates, bauxite, and heavy mineral sands
(Government of Mozambique 2011).
Transport infrastructure is primarily developed transversally, west–east, connecting mining and
agricultural clusters in Mozambique and in neighboring countries to exit ports. There are four clear
railroad corridors: (i) Maputo to Gauteng in South Africa (also connecting with Zimbabwe and Swaziland
through the railways branches), (ii) the Machipanda line connecting Beira to Zimbabwe, (iii) the Beira to
Tete (Moatize) , and (iv) the Nacala to Malawi line (figure 3a).

MOZAMBIQUE’S INFRASTRUCTURE: A CONTINENTAL PERSPECTIVE
5
Power and ICT infrastructure networks follow population and concentrates at the nodes of the
transport corridors. Greater density of power and ICT provision is thus found in the south-central and
southern areas of the country (figure 3b, c).
The relevance of Mozambique in the regional context should not be overlooked. In terms of transport,
the areas around Beira, Zambezi Valley, Nacala, and Limpopo—all covered by the railroad corridors—
see their economic potential powered by complementarities with the economies of landlocked neighbors
(Zimbabwe, Zambia, and Malawi) whose closest and natural ports are Beira, Maputo, and to a lesser
extent Nacala. Over the past years, Mozambique has made a big effort to capitalize on these geographic
advantages, integrating different transport modes within the country and with neighboring countries. The
central and south railway lines depart from the Beira and Maputo ports, respectively, and connect with a
network of primary and secondary roads that extend to Malawi, Zimbabwe, and South Africa. And the
recent construction of a new terminal building in the Maputo Airport expended its passenger and cargo
capacity.
The regional importance of Mozambique also extends to the power and ICT sectors. The country,
already a net exporter of electricity and a member of the Southern Africa Power Pool (SAPP), still has
huge untapped hydropower potential and the possibility of becoming a key player in the regional power
market. In the realm of the ICT, Mozambique has developed a network of fiber optics connecting the
country and its neighbors to the nearby South Atlantic 3 (SAT-3) submarine cable.

MOZAMBIQUE’S INFRASTRUCTURE: A CONTINENTAL PERSPECTIVE
6
Figure 2. Mozambique’s population, income, and mineral resources are concentrated in the center and south
a. Population b. Poverty
c. Topography d. Natural resources
Source: AICD Interactive Infrastructure Atlas for Mozambique (www.infrastructureafrica.org).

MOZAMBIQUE’S INFRASTRUCTURE: A CONTINENTAL PERSPECTIVE
7
Figure 3. Mozambique’s infrastructure networks align with population density and natural resource concentrations
a. Roads, railways, and airports b. Power
c. ICT d. Water resources
Source: AICD Interactive Infrastructure Atlas for Mozambique (www.infrastructureafrica.org).

MOZAMBIQUE’S INFRASTRUCTURE: A CONTINENTAL PERSPECTIVE
8
This report begins by reviewing the main achievements and challenges in each of Mozambique’s
major infrastructure sectors, with the key findings summarized below (table 1). Thereafter, attention will
turn to the problem of how to finance Mozambique’s outstanding infrastructure needs.
Table 1. The achievements and challenges of Mozambique’s infrastructure sectors
Achievements Challenges
Roads High percentage of roads in good or fair condition.
Second-generation road fund in place.
Aligning resource availability and funding options for road maintenance with the extension of the network and the existing traffic.
Improving rural connectivity and the quality of rural roads.
Railways Attraction of the private sector into the operation of major rail lines.
Recovering the operability of the Sena line.
Meeting increasing demand due to growing trade with neighboring countries and significant increase in domestic coal production.
Systematically maintaining the existing infrastructure.
Recovering the Machipanda line, taking care of the enormous rehabilitation backlog.
Completing the Moatize-Nacala corridor, now missing 200 km.
Ports Performance improved through public-private partnerships (PPPs).
Guaranteeing that Beira port works at its fullest capacity. Implementing a routine dredging practice.
Developing the Nacala port in a competitive fashion to be able not only to handle the increased mineral production but also to attract traffic now going to neighboring countries.
Air transport Important growth of all market segments and increase number of city pairs served.
Construction of new terminals in Maputo and Nacala.
Getting safety regulations aligned with international practices and standards.
Getting LAM (the Mozambican airline) out the EU blacklist.
Water and sanitation Reduce reliance on surface water and practice of open defection via expansion of wells, boreholes, and traditional latrines.
Increasing the efficiency of water utilities.
Irrigation Extending the equipped and managed irrigation area.
Extending the storage and flood infrastructure to diminish the impacts of hydrological variability.
Power Relatively good utility performance and service quality.
Increasing access to energy and improving the financial sustainability of the sector.
Taking advantage of the opportunities that power trade offers to the country.
ICT Liberalization of the mobile market.
Connection to the submarine cable.
Furthering development of the Internet-access market.
Source: Author’s own elaboration based on findings of this report. Note: ICT = information and communication technology; EU = European Union.
Transport
With an extremely privileged and strategic location, Mozambique is the natural exit to most of its
landlocked neighbors, in particular Zimbabwe, Zambia, and Malawi. The central transport infrastructure
extends from the Port of Beira to Zimbabwe, and marginally to Malawi and Zambia. The southern
transport network links the Port of Maputo to the northeastern part of South Africa, Swaziland, and
Zimbabwe. These two ―transport clusters‖ are multimodal, mostly functional, and already attract private
investors for their management and expansion. Yet these corridors run essentially in parallel, without
connections between them.

MOZAMBIQUE’S INFRASTRUCTURE: A CONTINENTAL PERSPECTIVE
9
One of the corridors in the southern cluster is the Maputo Development Corridor. The Maputo
Corridor connects Maputo with the South Africa’s Gauteng province, running through one of the most
highly industrialized and productive regions of the Republic of South Africa. The corridor is considered
by African policy makers one of the the most successful stories in Africa in terms of improved cross-
country trading. At the western end of the corridor are Johannesburg and Pretoria, and moving east
toward Mozambique, the corridor passes through the areas of aluminum production close to Maputo and
the industrial development of Motzal.
One of the most promising emerging corridors is that running from Moatize to Nacala via Malawi.
Currently the railway part of the corridor is not complete. There are 200 km of rail missing just outside
the Malawi border. Because Malawi enters as an indentation into the Mozambican territory, it imposes a
disconnect between areas rich in natural resources and export points and internal markets (figure 3d). The
implications for transport infrastructure are direct. By way of example, one of the main economic drivers
for the development of the Moatize–Nacala railway is the potential for coal export from the Tete area.
The port of Beira is insufficient to manage the 20–25 million tonnes of coal that can be produced,
necessitating the completion and upgrading of this railway to connect to the other natural exit port at
Nacala. The railway must pass through Malawi, as other routes, such as staying within the Mozambican
border to circumvent Malawi, do not make economic sense. This creates the challenge of defining and
relying on regional agreements and building regional infrastructure in coordination with Malawi.
On average, the combination of multimodal transport infrastructure and recently improved trade
logistics is increasingly positioning Mozambique as one of the countries with the lowest costs of trading
across borders. The cost of export and import in Mozambique are about 60 percent of the average costs in
Sub-Saharan Africa, and the time required to export and import is around 70 percent of the Sub-Saharan
average (table 2).
Table 2. Trading across borders in southern African countries
Country Documents to
export (number) Time to export
(days) Cost to export ($
per container) Documents to
import (number) Time to import
(days)
Cost to import ($ per
container)
Angola 11 65 2,250 8 59 3,240
Botswana 6 30 2,810 9 41 3,264
Lesotho 6 44 1,549 8 49 1,715
Madagascar 4 21 1,279 9 26 1,660
Malawi 11 41 1,713 10 51 2,570
Mauritius 5 14 737 6 14 689
Mozambique 7 23 1,100 10 30 1,475
Namibia 11 29 1,686 9 24 1,813
Swaziland 9 21 2,184 11 33 2,249
Zambia 6 53 2,664 9 64 3,335
Zimbabwe 7 53 3,280 9 73 5,101
Sub-Saharan Africa 8 34 1,942 9 39 2,365
Source: Doing Business 2009.

MOZAMBIQUE’S INFRASTRUCTURE: A CONTINENTAL PERSPECTIVE
10
Roads
Mozambique’s total road network length is 32,500 km as of 2008. The classified network, with about
22,500 km, consists of primary and secondary networks with less than 5,000 km each, and a tertiary
network of about 12,700 km. The unclassified network is estimated to be around 6,700 km and the urban
network 3,300 km. After failing attempts to rehabilitate the rapidly deteriorating parastatal vehicle fleet in
the ’80s and following policy changes in the ’90s to shift from public to private provision of road-
transport services, the total vehicle fleet in 2007 is estimated to be 260,000 with a large share of older and
poor-condition vehicles that generate high vehicle operating costs.
Table 3. Mozambique’s road indicators benchmarked against Sub-Saharan African low- and middle-income countries
Indicator Unit Low-income,
nonfragile countries
Mozambique Middle-income
countries
Classified road network density km/1,000 km2 of land area 88 29 278
Total road network density [a] km/1,000 km2 of land area 132 37 318
GIS rural accessibility % of rural population within 2 km of all-season road 25 24 31
Main road network condition [b] % in good or fair condition 72 83 86
Rural road network condition [c] % in good or fair condition 53 56 65
Classified paved road traffic AADT 1,131 1,033 2,451
Classified unpaved road traffic AADT 57 60 107
Primary network overengineering % of primary network paved with 300 AADT or less 30 34 18
Primary network underengineering % of primary network unpaved with 300 AADT or more
13 7 20
Perceived transport quality [d] % firms identifying transport as major business constraint
28 23 18
Source: AICD Road Sector Database of 40 Sub-Saharan African countries. a. Total network includes the classified and estimates of unclassified and urban networks. b. Main network for most countries is defined as a result of adding the primary and secondary networks. c. Rural network is generally defined as the tertiary network and does not include the unclassified roads. d. Source: World Bank—IFC Enterprise Surveys on 32 Sub-Saharan African countries. GIS = geographic information system; AADT = average annual daily traffic.
Achievements
During the ’90s the government initiated several institutional reforms and projects to rehabilitate and
maintain road infrastructure in selected priority districts and corridors, easing transportation bottlenecks.
After overcoming major hurdles—such as insufficient investment in rehabilitation and maintenance, and
lack of local human resources sufficient to properly carry out road projects—and reforming the
institutional and policy environments, Mozambique managed to establish a large road-infrastructure base.
Mozambique passed several institutional reforms in the early 2000s. The reforms included the
implementation institutional and financial regulations, the creation of an interministerial road commission
to coordinate government efforts, the establishment of an autonomous, dedicated ―road fund‖, the
simplification of the organizational structure of the national road agency (Administracao National de
Estradas, or ANE), and the development of a policy to commercialize road-network management.

MOZAMBIQUE’S INFRASTRUCTURE: A CONTINENTAL PERSPECTIVE
11
The road fund was established with the mandate of providing centralized funding for routine road
maintenance. The institution has its own management and board of directors, with representation from the
private sector, and is subjected to independent financial and technical audits. The fund has all the key
attributes to succeed and receives adequate levels of financing to perform its mandate. Its funding is
largely based on revenues coming from a fuel levy estimated at about 10.6 US cents per liter in 2007,
among the highest in southern Africa (figure 4). The total government allocation to the road fund—
including road-user charges and counterpart funding—in 2006 was $87.6 million. Road fund revenues
from road users’ charges increased from $35 million in 2002 to $61.3 million by mid-2007, and the
revenues collected between 2004 and 2006 exceeded the initial objectives.
Figure 4. Fuel levies compared in select Sub-Saharan African countries (U.S. cents per liter)
Source: SSATP 2007.
The efficiency of Mozambique’s highway network has significantly improved over the past years. In
the early 1990s the percentage of roads in good or fair condition was merely 30 percent. As of 2007,
however, 83 percent of the main network was in good or fair condition, close to the average for MICs (86
percent, table 3) and above the average for other Sub-Saharan low-income, nonfragile countries (72
percent, figure 5).

MOZAMBIQUE’S INFRASTRUCTURE: A CONTINENTAL PERSPECTIVE
12
Figure 5. Main road network conditions in southern Sub-Saharan Africa
Source: AICD road sector database on southern Sub-Saharan African countries.
Challenges
Mozambique’s classified network density per land area (29 km/1,000 km2) is one of the lowest in the
southern African subregion (table 3), similar only to Zambia (25 km/1,000 km2) and Angola
(29 km/1,000 km2), and very low compared with the average for low-income, nonfragile countries
(88 km/1,000 km2) and MICs (288 km/1,000 km
2). These numbers need to be interpreted with care,
however, as Mozambique has such a vast and diverse territory. Perhaps more telling than road density in
terms of the challenge of road access is the fact that connectivity among urban and economic clusters is
quite limited—corridors link urban and economic centers to ports but not to each other. With the
exception of the recently finalized north-south National Road N1, the country has no (or very limited)
connection among the several parallel west-east corridors, and developing full connectivity would
required sustained and enormous investment over decades, with the likely participation of the private
sector and nontraditional financiers.
Beyond connectivity, securing access to domestic (and eventually international) markets is an
enormous challenge. Take, as an example, the rural accessibility that would support agricultural
development. Based on GIS analysis that estimates the physical distance between population
concentrations and existing roads, only about one-fourth of rural Mozambicans live within 2 km of any
road in the classified network. This statistic is very telling in a country with 70 percent of its population
living in rural areas and 22 percent of its GDP coming from the agricultural sector. Its rural accessibility
level, at 24 percent, is comparable to that of other LICs in Africa, but is far below the 31 percent access
rate of the rural population in middle-income Sub-Saharan countries.
The rural accessibility index does not show the quality of rural roads, over 40 percent of which are in
poor condition in Mozambique. But the poor condition of the rural network is in sharp contrast to the
good condition of Mozambique’s primary and secondary network. The high quality of the main network
comes from a recent revamping program of rehabilitation and construction of roads. In a few cases,

MOZAMBIQUE’S INFRASTRUCTURE: A CONTINENTAL PERSPECTIVE
13
however, this revamping might have led to the overengineering of roads with annual average daily traffic
(AADT) levels below 300 (table 3). This raises questions about the efficiency of spending. Despite the
resources allocated to the road sector in the past, the level of spending runs short of the estimated needs.
The government reports that the road sector expenditure between 2001 and 2006 was $140 million on
average per year, while recent needs estimates presented at the end of this report point to an annual
average need of $190 million, leaving a gap not only in capital investments but in maintenance funds.
The cost of preservation—that is, the maintenance and rehabilitation of the existing network only—is
estimated at 1 percent of the GDP or an average of $100 million per year during the next 20 years, of
which $43 million is identified for rehabilitation, $33 million for periodic maintenance, and $25 million
for recurrent maintenance. Compared with recorded levels of spending in recent years, Mozambique now
spends 80–88 percent less than what is needed based on the size and condition of the road network. This
record is worse than in neighboring countries (figure 6).
Figure 6. Preservation spending as a percentage of requirements in southern Sub-Saharan Africa (based on annual average, 2003–07)
Source: AICD road sector database on southern Sub-Saharan African countries.
But Mozambique has made important strides in procuring and protecting funds for maintenance
through the road fund, as well as increasing spending on roads in general with the recent investment
program. This raises the question of whether Mozambique should reassess the balance of its spending
between investment and maintenance, or find additional sources of funding to make maintenance
affordable. According to the most recent data available, only 19 percent of the needed preservation
spending is covered by the road fund and an additional 13 percent from government transfers. Therefore,
about 70 percent of known preservation needs require securing funds from private or multilateral sources.
Railways
Mozambique’s 3,130 km railway system comprises three disconnected networks located in the north,
central, and south parts of the country, structured and managed around the three major Mozambican
corridors:

MOZAMBIQUE’S INFRASTRUCTURE: A CONTINENTAL PERSPECTIVE
14
Nacala corridor. Comprises the Nacala port and the Nacala railroad, which connects the Nacala
port to Malawi’s Central East African Railway (CEAR). In January 2005 this corridor was
conceded to Corridor do Desenvolvimento do Norte (CDN), a partnership between Caminos de
Ferro de Moçambique and Sociedade de Desenvolvimento do Corredor do Nacala holding, for 15
years.
Beira corridor. Includes Beira Port, the Machipanda from Beira to Harare, Zimbabwe, and the
Sena Line connecting the port with the coal fields of Moatize. These two lines make up the Beira
Railroad. The entire corridor was given in concession to the consortium formed by Rail India
Technical and Economic Services (RITES) Ltd. and IRCON International in December 2004.
Maputo corridor. Comprises the Port of Maputo, the Ressano Garcia line connecting Maputo to
South Africa, the Limpopo line going from Maputo Port to Zimbabwe, and the Goba line
connecting Maputo to Swazi Rail. These three lines are currently managed by Caminos de Ferro
de Moçambique (CFM), a public holding, after the Ressano Garcia Railway concession signed
with Sporneet and New Limpopo Bridge Project Investments was terminated in 2006 after three
years of operation.
Over the period 2005–08, these railways were responsible for around two-thirds of cargo and one-third of
passengers transported on Mozambican railways (table 5).
Achievements
Productivity and efficiency of the rail lines in Mozambique are on par with its southern African peers,
aside from South Africa. Mozambique’s locomotive, carriage, and wagon productivity are low, With the
exception of the carriage productivity of the Nacala line. Mozambique’s rail freight tariffs are regionally
competitive at an average of 5 cents/tonne-km (table 4).
The Mozambican railway system has rail lines of strategic importance for the region. The Maputo
line is part of one of the most successful Spatial Development Initiatives (SDI) in Africa, the Maputo
corridor. The Machipanda line is crucial for mobilizing cotton from Malawi and agricultural and mineral
products from Zimbabwe. More recently, the rehabilitation of the Sena line connecting Moatize with the
Beira port is providing capacity to mobilize 3 million tonnes per year in coal and general cargo—
unlocking, at least for the coming couple of years, the possibility of Mozambique’s coal exports.

MOZAMBIQUE’S INFRASTRUCTURE: A CONTINENTAL PERSPECTIVE
15
Table 4. Railway indicators for Mozambique and select other countries, 2000–05
CF
M (
Ang
ola)
BR
(B
otsw
ana)
CE
AR
(M
alaw
i)
Nac
ala
Rai
lro
ad
(Mo
zam
biq
ue)
Bei
ra R
ailr
oad
(Mo
zam
biq
ue)
Res
san
o G
arci
a L
ine
(Mo
zam
biq
ue)
Tra
nsna
mib
(N
amib
ia)
Spo
orne
t (S
outh
Afr
ica)
RS
Z (
Zam
bia)
NR
Z (
Zim
babw
e)
Concessioned (1)/ state run (0) 0 0 0 1 1 0 0 0 1 0
Freight density (1,000 tonne-km/km)
469 827 90 270 663 364 475 2,427 406 902
Passenger density (1,000 passenger-km/km)
— — 38 103 44 44 33 60 92 166
Labor productivity (1,000 traffic units per employee)
580 722 131 710 281 — 484 3,308 502 390
Locomotive productivity (million traffic units per locomotive)
30 41 3 25 13 — 25 33 25 8
Carriage productivity (1,000 passenger-km per carriage)
4,046 2,391 1,176 3,333 750 — — — 3,286 —
Wagon productivity (1,000 net tonne-km per wagon)
950 987 82 260 476 — 805 913 377 195
Freight yield (US cents/tonne-km)
— — 6 5 3 3 — — 4 —
Passenger yield (US cents/passenger-km) — — 1 0.9 0.5 1 — — 1 —
Source: Bullock 2009. Derived from AICD rail operator database (www.infrastructureafrica.org/aicd/tools/data).
Note: * With 2.5 passenger-km equivalent to 1 traffic unit, 1 tonne-km equivalent to 1 traffic unit. — = Not available.
Challenges
Even though railways in Mozambique are an important means of transport, on average the cargo and
passengers transported decreased between 2005 and 2008. Total passenger-kilometers decreased by 60
percent from 305 million passenger-kmin 2005 to 113 million passenger-km in 2008 (table 5). The cargo
transported in the Mozambican railways declined by 10 percent, from 763 million tonne-kilometers in
2005 to 694 million in 2008.
But these aggregates mask important differences in trends among cargo operators. Whereas cargo
traffic on railways under CFM management increased around 10 percent between 2005 and 2008, the
lines under concession experienced important declines. A substantial decline of 60 percent of cargo traffic
was registered in the Beira Railway and a 10 percent drop in the Nacala Railway (table 5).

MOZAMBIQUE’S INFRASTRUCTURE: A CONTINENTAL PERSPECTIVE
16
Table 5. Cargo and passengers transported along Mozambique’s railways
Type Year CFM
Beira Railway Nacala Railway
Total Goba R. Garcia Limpopo Subtotal
Cargo transport (million tonne-
km)
2005 50 180 230 460 175 128 763
2006 45 170 240 455 205 120 780
2007 40 177 237 454 157 127 738
2008 52 226 220 498 81 115 694
Passenger transport (million passenger-km)
2005 n.a. 60 60 120 5 180 305
2006 n.a. 40 75 115 3 210 328
2007 n.a. 16 21 37 3 66 106
2008 n.a. 24 23 47 2 64 113
Source: CFM 2006; 2008.
n.a. = Not applicable.
These trends might reflect the deterioration of rolling stock, which does not allow for the system to
respond to increasing demand. This is particularly the case on the Machipanda line, which suffered years
of neglect during which profits were seen at the expense of deferred maintenance, putting the line in need
of a massive and urgent track rehabilitation as well as refurbishment and renovation of the stock.
Mozambican railways also need to improve wagon capacity to be able to respond to growing traffic
demand from the hinterland. In the case of the lines managed by CFM, out of the 2,000 existing wagons
only 600 are operating. But in 2009 CFM rolled out an ambitious plan to rehabilitate locomotives and 670
wagons. New wagons will add capacity to transport minerals and other cargo to and from the countries of
the hinterland (Zimbabwe and Zambia predominantly). Meanwhile, ongoing investments on the Ressano
Garcia Line, in particular the rehabilitation of the most critical sections, reduced the number of
derailments per week from seven in 2006 to two in 2008.
The lines under concession have been only partially successful. The concessions were granted to
promote the modernization of the systems and increase their performance; to attract the resources needed
to finance investments in infrastructure, equipment, information technology, and maintenance; and to
generate an additional source of returns for CFM and the government. But CFM has had to finance the
rehabilitation of assets under concession, such as the Sena Line in 2008. Also, like in most African
countries, the passenger services are highly unprofitable in Mozambique, with 85 percent of the costs
being subsidized by CFM (CFM 2006). The development of passenger traffic along the Sena line is also
seriously limited by the very small number of stations; additional stations that were to be added under the
concession agreement have not been built.
Ports
Six of Mozambique’s seven seaports are operating with the involvement of the private sector, which
positions Mozambique as a country with a relatively high level of private sector involvement in the port
system. In 1998 the management and operation of the general cargo and terminals of the Beira port was

MOZAMBIQUE’S INFRASTRUCTURE: A CONTINENTAL PERSPECTIVE
17
conceded to the Dutch company Cornelder. In 2003 the ports of Maputo and Matola were conceded to a
consortium that included the consortium Maputo Port Development Company (MPDC), formed by the
UK’s Mersey Docks and Harbour Company, which secured a 15-year concession with a right to a 10-year
extension. Then in 2005, the operation of the Nacala port was conceded to the RITES Ltd. and IRCON
International consortium for a 15-year period as part of the concession of the Beira Corridor. The same
year, Cornelder was awarded the concession for the Port of Quelimane. In all three of the latter projects,
CFM has an equity stake of 49 percent, of which 16 percent is reserved for offloading government
projects.
Achievements
Between 1999 and 2008 Mozambique increased the use of its ports capacity. The amount of 20-foot
equivalent units (TEUs) shipped daily grew 43 percent over this period, from 207 to 297 TEUs. From
1999 to 2008 the number of ships calling at the ports increased by around 16 percent, from 1,353 to
1,574. Similar growth was registered in the number of tonnes shipped per day, which increased from
2,280 in 1998 to 3,658 in 2008 (table 6).
In particular, Mozambique’s port
demand rose strongly in the period
2005–08. In 2008, 11.64 million
metric tonnes were handled compared
to 9.98 in 2005, with the Port of
Maputo representing around 65
percent of the market (table 7). The
number of containers handled grew
by 40 percent from 158,287 TEU in
2005 to 225,419 in 2008. The market share of the Beira port over this period of time went up from 20
percent in 2005 to 38 in 2008, making it the port that handled the highest number of containers.
Table 7. Cargo and containers handled in Mozambique’s ports
Total Maputo Beira Nacala Quelimane Pemba M.da Praia
Cargo handled (1,000 metric tonnes)
2005 9,982 6,360 2,428 878 244 63 10
2006 10,683 6,666 2,746 952 219 85 14
2007 11,079 6,858 2,915 1,108 86 97 16
2008 11,637 7,406 2,991 1,054 66 100 20
Containers handled (TEUs)
2005 159,287 57,511 35,000 32,310 9,704 5,244 215
2006 171,216 65,390 34,965 34,184 8,753 7,976 645
2007 194,247 63,764 71,167 44,870 4,870 8,244 1,332
2008 225,419 74,792 85,716 49,770 4,172 9,295 1,674
Source: CFM 2006; 2009.
Note: TEU = 20-foot equivalent unit.
Table 6. Traffic in Mozambique’s ports
Ships calling
on ports Tonnes/ship/
day TEUs/ship/
day
1999 1,353 2,280 207
2008 1,574 3,658 297
Percent increase (%) 16 16 43
Source: CFM annual reports. Note: TEU = 20-foot equivalent unit.

MOZAMBIQUE’S INFRASTRUCTURE: A CONTINENTAL PERSPECTIVE
18
In terms of performance indicators, Maputo, Beira, and Nacala’s truck-processing time—between 4
and 6.8 days—compare well with other southern African ports (table 8). These ports also have average
crane productivity of 10–11 containers or 7.5 to 11 tonnes per crane hour. Generally, for crane
productivity, the most important factors are the presence of private operators, the usage of specialized
container-handling equipment, and the overall size of terminal operations. The ports of Maputo, Beira,
and Nacala have two of the three productivity factors: their concessionaires have adopted modern
container gantries but the size of their operations is the lowest in the region. These ports handled only
164,000 TEUs in container in 2006, falling substantially short of their 200,000 TEU capacity. Container
dwell time—between 20 and 22 days—is the highest in the region.
Table 8. Benchmarking of ports in Southern Africa
Country and port
Mozambique Angola Madagascar Namibia South Africa
Maputo Beira Nacala Luanda Toamasina Walvis
Bay Durban
Cape Town
Cap
acit
y
Containers handled (TEU/year)
44,000 50,000 70,000 377,208 92,529 71,456 690,895 1,899,065
Container capacity (TEU/year)
100,000 100, 000
100,000 400,000 500,000 100,000 950,000 1,450,000
General-cargo capacity (tonnes/year)
1,200,000 500,000 1,000,000 4,000,000 2,750,000 2,000,000 1,100,000 —
Liquid-bulk-cargo capacity (tonnes/year)
410,000 — — — 1,500,000 1,000,000 7,500,000 —
Eff
icie
ncy
Container dwell time (days) 22 20 20 12 8 8 6 4
Truck-processing time (hours)
4 6.8 6.5 14 3.5 3 4.8 5
Crane productivity (containers/hour)
11 10 — 6.5 — — 18 15
Crane productivity (tonnes/hour)
11 7.5 — 16 9 — 15 25
Han
dlin
g c
har
ge Container cargo (ship to
gate, $/TEU) 155 125 138 320 — 110 258 258
General cargo ($/tonne) 6 6.5 6-7 8.5 6 15 — 8.4
Dry bulk ($/tonne) 2-3 2.5 — 5 3 5 6.3 1.4
Liquid bulk ($/tonne) 0.5- 1.0 0.8 1 — — 2 0.4 —
Source: AICD ports database (www.infrastructureafrica.org/aicd/tools/data.
Note: TEU = 20-foot equivalent unit.
— = Not available.
Handling fees in Mozambique are relatively low. As of 2006, the container cargo fare was in the
range of $125–$155 per TEU, second lowest after the Walvis Bay port (Namibia). After the Cape Town
port (South Africa), dry bulk handling charges in the Maputo and Beira ports are the lowest in the region
(table 8).
There is widespread compliance with International Ship and Port Facility Security (ISPS) regulations
in Mozambique. Generally, the ports run by private companies promote good security, as is demonstrated
by the measures now in place at the Port of Maputo, which include increased electric fencing and gates,
an increase in the number of land- and water-based security patrols, and the requirement for all
international vessels to provide 96 hours’ notice of their arrival and to submit a pre-arrival data sheet.

MOZAMBIQUE’S INFRASTRUCTURE: A CONTINENTAL PERSPECTIVE
19
Restructuring within CFM has led to improved performance. Starting in the mid-1990s the main
reforms that have taken place are the separation of strategic, corporate, and regulatory functions from
day-to-day commercial and operating functions; making the headquarters and the zonal units lean and
thin; replacing traditional port and railway operation skills in the headquarters with specialized legal,
financial, institutional, and corporate functions and skills; and increasing accountability through
performance contracts between the government and CFM. The retrenchment of surplus staff from close to
20,000 employees in 1996 to 1,500 in 2008 and the increase in tonnes handled has led to impressive
growth in staff productivity. By 2008 the staff productivity was 7 tonnes per employee, whereas in 1999 it
was merely 1 tonne per employee. Since 2007 CFM has increased its net income and been able to pay
dividends to the government.
Challenges
Beira port’s restricted sea access significantly constrains its ability to capture more traffic. The port,
which handled the most TEUs among Mozambican ports as of 2008 (table 7), faces permanent and high
dredging and operating restrictions that in some cases limit access to only partially loaded ships.
Despite important progress in the modernization of Mozambique’s port systems, there is still a time
lag between an increase in demand and the development of infrastructure projects to meet that demand.
For instance, the facilities and equipment of Nacala port are in poor condition, but the port is in demand
for cargo shipments from neighboring countries, in particular carbon exports from South Africa. Only
once the port overcomes its infrastructure challenges can the country begin to attract more cargo transit
from its neighbors, meeting demand.
Some aspects of performance also appear to be deficient. Compared to other ports in the region,
container dwell time in Mozambican ports is the highest, at 20 to 22 days.
Air transport
Achievements
Air travel in Mozambique registered strong growth between 2001 and 2007. Over this period, the
estimated seat capacity grew at an annual rate of 10 percent (figure 7a). International seat capacity almost
doubled from 305,214 in 2001 to 582,836 seats in 2007, whereas availability of domestic seats increased
by 70 percent—from 660,417 to 1,144,644—for the same years.
With about 1.8 million seats in 2007, the market is comparable to others in the region, except for
South Africa. In particular, the size of the domestic market in Mozambique is at the level of Angola and
ahead of Zambia and Zimbabwe (table 9). But the number of seats per capita is the lowest among
southern African countries.

MOZAMBIQUE’S INFRASTRUCTURE: A CONTINENTAL PERSPECTIVE
20
Table 9. Benchmarking air transport indicators for Mozambique and select other countries
Country Mozambique Tanzania Zambia South Africa Zimbabwe Angola
Total seats (per year) 1,819,117 3,694,171 2,010,641 45,789,157 1,533,406 2,272,173
Domestic 1,144,644 1,871,255 437,658 31,767,537 237,835 1,199,016
International travel within Africa 582,836 1,237,153 1,459,766 6,314,557 1,109,986 484,179
Intercontinental travel 91,637 585,763 113,217 7,707,063 185,585 588,978
Per capita seats 0.087 0.093 0.168 0.954 0.118 0.134
Herfindahl-Hirschmann Index—air transport market (%)
31.5 9.8 17.5 16.7 30.2 33.3
Percent of seat-km in newer aircraft 57 79.3 63.8 83.8 71.4 59.7
Percent of seat-km in medium or smaller aircraft
56.7 48.6 62.8 32.8 42.7 13.9
Percent of carriers passing IATA/IOSA audit
100 33 0 33.3 0 0
FAA/IASA audit status No Audit No Audit No Audit Passed Failed No audit
Source: Bofinger 2009. Derived from AICD national database (www.infrastructureafrica.org/aicd/tools/data). Note: All data as of 2007 are based on estimations and computations of scheduled advertised seats, as published by the Diio SRS Analyzer. This captures 98 percent of worldwide traffic, but a percentage of African traffic is not captured by the data. The Herfindhal-Hirschmann Index (HHI) is a commonly accepted measure of market concentration. It is calculated by squaring the market share of each firm competing in the market and then summing the resulting numbers. A HHI of 100 indicates the market is a monopoly; the lower the HHI, the more diluted the market power exerted by one company/agent. FAA = U.S. Federal Aviation Administration; IASA = International Aviation Safety Assessment; IATA = International Air Transport Association; IOSA = IATA International Safety Audit.
The number of city pairs served by airlines in Mozambique, both domestically and internationally,
increased between 2001 and 2007, against the declining African trend. The greatest increase was reported
in international city pairs, which increased from 10 in 2001 to 31 in 2007. Domestic city pairs rose from
22 to 30 over the same period (figure 7b).
In terms of airport facilities, nontraditional financiers are increasingly playing a role. The construction
of a new terminal building in Maputo has been recently finalized, involving Chinese investment of around
$75 million, as well as the expansion of an existing military airport in Nacala into a commercial airport,
financed by Brazil.
Challenges
Despite the growth in the sector, Mozambique’s air industry still faces major challenges, including a
decline in competition following the death of a private carrier, the national flag carrier’s financial
troubles, performance at the Maputo airport, and compliance with safety standards.
Competition in the Mozambican air market declined after the exit of Air Corridor. The overall
Herfindahl-Hirschmann Index, at 31.5, is the highest in the region after Angola (table 9). Between 2005
and 2007, Air Corridor, a privately held operator, provided a high percentage of domestic capacity despite
the fact that aircraft were grounded due to repairs and maintenance. In 2008 the airline went out of
business, removing around 40 percent of the domestic seat capacity. After Air Corridor’s collapse the

MOZAMBIQUE’S INFRASTRUCTURE: A CONTINENTAL PERSPECTIVE
21
overall growth in capacity was forced into the negative, by an 8.6 percent decline, despite augmenting
international and intercontinental travel traffic handled by international carriers.
Figure 7. Evolution of seats and city pairs in Mozambique
a. Seats b. City pairs
Source: Bofinger 2009. Derived from AICD national database (www.infrastructureafrica.org/aicd/tools/data). Note: As reported to international reservation systems.
NA = North Africa; SSA = Sub-Saharan Africa.
The financial recovery of Mozambique’s flag carrier, Linhas Aéreas de Moçambique (LAM), is still
in its earliest stages. After ceasing service to Portugal and the UAE,, the airline is concentrating on
domestic and regional international traffic with a fleet of smaller aircraft. LAM’s fleet is relatively old, in
some cases over 20 years old. Airline restructuring in the early part of the last decade involved a drastic
reduction in larger-sized aircraft, finally abandoning wide-body aircraft altogether in 2004. The lower
reliability of aging, smaller aircraft might create a bottleneck for traffic within Mozambique. Despite
these difficulties the airline passed International Air Transport Association’s (IATA’s) safety audit,
receiving the recertification it needed by October 2011.
Nonetheless, LAM’s compliance with safety standards remains below global averages to the point
that has been recently blacklisted by the EU. The airline’s International Civil Aviation Organization
(ICAO) Universal Safety Oversight Audit Programme (USOAP) safety audits for 2004 showed an overall
nonimplementation rate of 41.8 percent, much above the 31.7 global averages. Follow-up work in 2004
showed the level to have gone down to a more reasonable 37.1 percent. Particular deficiencies were found
in surveillance obligations and in operating regulations.
Attempts to privatize the international airport in Maputo, Lourenço Marques Airport, have failed, due
to unfavorable terms offered by ACSA, the South African airport operator.

MOZAMBIQUE’S INFRASTRUCTURE: A CONTINENTAL PERSPECTIVE
22
Water resources
Mozambique is relatively well endowed with water compared to countries occupying similar climatic
zones. Mozambique has 104 main river basins, the Zambezi and Rovuma rivers being some of the most
important given that their catchment areas are more than 100,000 km2. The renewable water resource per
capita is estimated at about 12,000 cubic meters per year (including the cross border flows), well above
the Sub-Saharan African average of 7,000 cubic meters per year.
Mozambique’s water vulnerability is defined by its high dependence on hydrological resources shared
with other countries and by its high hydrological variability. The total runoff is estimated at 216 km3/year,
of which 116 km3/year (or 53 percent) is generated outside the country, leaving Mozambique affected by
upstream abstraction. The Zambezi River Basin represents around 40 km3/year and is shared by eight
countries. The major rivers in the south of the country (Maputo, Umbeluzi, Inkomati, Limpopo, and Save)
originate in neighboring countries. Cyclical droughts and floods, compounded by events such as the Niño
and Niña phenomena, lead to variable river floods. The limited storage capacity and the lack of flood
control infrastructure add to the problem.
The high water vulnerability has important impact on economic performance and the poor. It is
estimated that around 1.1 percent of the GDP is lost in Mozambique because of droughts and floods.
Around 70 percent of the population relies upon subsistence agriculture, and one-third of the population is
estimated to be chronically food-insecure.
The increasing water demand for different uses puts more pressure on the country’s water resources.
By 2015 domestic water demand is expected to increase 35–45 percent from 2003 consumption levels.
Large industry demand will increase 60 and 70 percent in the central and southern sections of the
countries, respectively. Planned irrigation expansion will increase water withdrawals. Any likely
additional hydropower production will require more water. Addressing these concerns will require both
further investments in water storage and a suitable institutional and policy framework for handling
conflicting water demands.
Mozambique needs to invest in its water-resources infrastructure. In the southern part of the country,
further development of the Incomati and Umbeluzi basins is required to face the increasing water demand
from the greater Maputo area. The country will benefit greatly from tapping the irrigation potential of the
Zambezi basin. Small-scale community-based irrigation projects to support smallholder irrigation are
central, in particular in northern Mozambique.
Given the wide range of conflicting uses (hydropower, water supply, irrigation, environment), it is
essential to have a clearly defined basis for allocating water rights among sectors so as to maximize their
development impact. In order to move ahead with important investments in water storage, Mozambique
also needs to make further progress with integrated river basin planning and investment. Beyond large-
scale storage investments, the development of small-scale irrigation projects would do much to alleviate
rural poverty and enhance the resilience of rural livelihoods.

MOZAMBIQUE’S INFRASTRUCTURE: A CONTINENTAL PERSPECTIVE
23
Irrigation
Mozambique’s irrigation potential is largely underdeveloped. Though 45 percent of the country is suitable
for agriculture, only about 4 percent of arable land was cultivated as of 2007 (figure 8a).1 The small
portion of cultivated area (by comparison to potential) can be attributed, among other reasons, to a lack of
irrigation systems and inadequate access to the rural infrastructure network.
Figure 8. Mozambique irrigation sector
a. Current irrigation area b. Potential (baseline scenario)
Source: You 2008. Map on current area: AICD Interactive Infrastructure Atlas for Mozambique (www.infrastructureafrica.org).
Map on irrigation potential.
Note: Baseline scenario was calculated assuming investment cost of $3,000 per hectare, a canal maintenance and water-delivery cost of 1 cent per cubic meter, and on-farm annual operation and maintenance costs of $30 per hectare, and a discount rate of 12 percent.
Irrigation infrastructure in Mozambique is less developed than in the average Sub-Saharan African
country. As of 2007, 2.7 percent of the country’s cultivated area was equipped for irrigation, below the
Sub-Saharan average of 3.5 percent. The equipped irrigation area contributes merely 4.8 percent to the
total agriculture output, a level far below the contribution of the irrigated area to the total agriculture
1 As of 2007, 118,120 hectares were equipped for irrigation but only 40,063 were actually irrigated (40 percent).

MOZAMBIQUE’S INFRASTRUCTURE: A CONTINENTAL PERSPECTIVE
24
output of Sub-Saharan Africa (at 24.5 percent). An additional 2.4 percent of the cultivated area was water
managed. Between 1973 and 2003 the irrigated area grew 4.4 percent annually.
Most of the current irrigation is done by the family sector (95 percent of the total) and it is estimated
that around 80 percent of the Mozambican labor force is involved in agriculture. The agricultural value
added per worker, at $157, is well below the Sub-Saharan African average of $575.
But Mozambique’s agriculture sector is growing 9 percent per year on average, three times the annual
growth registered in Sub-Saharan Africa. The country’s current irrigated area could be increased
substantially with good economic returns. Simulations suggest that with a threshold internal rate of return
(IRR) of 6 percent it would already be economically viable to develop a further 502,184 hectares (ha) of
land for irrigation, from which around 70 percent would be developed through large-scale projects
(table 10). If the threshold IRR were raised to 12 percent, the economically viable area for new irrigation
projects shrinks to 96,399 hectares for a total irrigated area of 136,462 irrigated hectares, mostly
developed through small-scale irrigation projects (87 percent). The required investment for attaining this
expansion is $459 million. This area with irrigation potential is concentrated around the Limpopo River in
the south, the mining belt area of the Zambezi River in the center, and the Lurio River in the north
(figure 8b).
Water for irrigation can be collected in two ways: through large, dam-based schemes, or through
small projects based on the collection of run-off from rainfall. The investment costs of large-scale
irrigation development reflect only irrigation-specific infrastructure, such as distribution canals and on-
farm system development. The potential for small-scale irrigation is assessed not only on the basis of
agroecological conditions, but also in terms of market access, since irrigation is typically viable only if
the increased yields can be readily marketed. The unit cost for large-scale projects is set at $3,000/hectare
and for small-scale projects at $2,000/hectare.
At the regional level and without taking into account the potential benefits coming from the Beira
Agricultural Growth Corridor (box 1), Mozambique stands as the country with the largest potential area
increase for small-scale projects and an attractive rate of return comparable with its regional peers
(figure 9a), using an IRR cutoff of 12 percent. But Mozambique’s ability to extend its potential irrigated
area using large-scale schemes is low compared to the potential for Botswana, South Africa, and
Zimbabwe (figure 9b).
The absence of adequate irrigation infrastructure, combined with poor grid-connected electricity and
low accessibility in rural areas to all-weather feeder roads, has been identified as one of the constraints
that prevent successful development of commercial agriculture in the Beira corridor (box 1).

MOZAMBIQUE’S INFRASTRUCTURE: A CONTINENTAL PERSPECTIVE
25
Table 10. Mozambique’s irrigation potential
Large scale Small scale Total
Investment IRR Area
increase Investment IRR Area
increase Investment IRR Area
increase
Cutoff (%) $ million % ha $ million % ha $million % ha
0 2,016 5.4 1,033,069 983 11.0 190,229 2,999 6.2 1,223,298
6 694 9.0 355,590 757 16.0 146,594 1,451 11.0 502,184
12 24 13.9 12,304 435 24.0 84,095 459 22.7 96,399
24 0 0.0 0 88 44.0 17,028 88 44.0 17,028
Source: Derived from You others (2009).
Figure 9. Irrigation potential
a. Small scale b. Large scale
Source: Derived from You and others (2009). Based on 12 percent cut-off estimates, at which the estimated area increase for southern African countries not included in the figures is zero.

MOZAMBIQUE’S INFRASTRUCTURE: A CONTINENTAL PERSPECTIVE
26
Box 1. Beira Agricultural Growth Corridor
The Beira Agricultural Growth Corridor (BAGC) initiative, regional in scope, is a partnership between the
Government of Mozambique, the private sector, and the international community that aims to stimulate a major
increase in agricultural production in the Beira corridor and improve the productivity and incomes of smallholders.
A focus on ―agricultural growth corridors‖ offers an opportunity for countries to fast-track the development of their
agricultural sectors by building on existing infrastructure networks and encouraging beneficial clusters of
agricultural businesses to develop.
The Beira corridor has the potential to become a major new agricultural producing and processing region over the
next twenty years. Not less than 190,000 hectares of land could be put under irrigation and produce world-class
yields, with crops sold profitably in domestic, regional and international markets. Investments in commercial
agriculture would generate major direct and indirect benefits for smallholder farmers and the rural community
generally.
Source: Adapted from InfraCo (2010).
Water supply and sanitation
Achievements
Mozambique has made important progress in reducing its population’s reliance on surface water and open
defecation. Reliance on surface water declined from 27 percent in 1997 to 16 percent in 2008, a level
comparable to that of an average MIC in Sub-Saharan Africa. In 2008, 40 percent of the population
practiced open defecation compared to 62 percent in 1997. Even though the improvement has been
significant, the percentage of population practicing open defecation is still high, at almost three times the
level of MICs (table 11).
Mozambique has managed to move its population up the water and sanitation ladder by means of
extending low-cost technologies such as wells, boreholes, and traditional latrines. Access to wells and
boreholes increased from 47 percent in 1997 to 59 percent in 2008. But only about 40 percent of these
wells can be characterized as safe by the Joint Monitoring Program (JMP). The use of traditional latrines
increased from 23 percent to 43 percent between 1997 and 2008 (table 11). These results imply that
Mozambique has managed to provide improved water and made progress in access to improved
sanitation, albeit slowly. Access to improved water increased from around 30 percent in 1997 to 50
percent in 2008. At this pace, the MDG of 70 percent sustainable coverage in urban areas will likely be
met. Access to improved sanitation was raised from a 14 percent share to 21 percent of the population,
which represents a 45 percent increase, but the country is off-track for meeting the sanitation MDG.
Mozambique introduced a policy of delegated management frameworks for its water utilities,
whereby assets are owned by the government and operations are managed by independent operators. In
1999 the government awarded a contract to manage the water supply systems of the cities of Maputo,
Matola, Beira, Dondo, Quelimane, Nampula, and Pemba to a then-consortium comprising SAUR, Aguas
de Portugal, and the Mozambican Government. Later on, operations in Maputo became managed by
Aguas de Portugal and in Beira, Quelimane, Nampula, and Pemba by FIPAG (Fundo de Investimentos e
Patriônio de Abastecimento de Água, Water Assets and Investment Fund).

MOZAMBIQUE’S INFRASTRUCTURE: A CONTINENTAL PERSPECTIVE
27
Box 2. Understanding the differences between JMP and government data
The AICD uses the Joint Monitoring Program (JMP) coverage statistics as the main source of access data on water
supply and sanitation, and proceeds under a standardized methodology to allow cross-country comparisons. These
data might differ from those reported by governments. Whereas the JMP data are based on household surveys and
therefore reported by users of the services, the government data are based on utility reports. This implies that there is
a time lag between output data (provider) and outcome data (users). Other underlying factors explaining potential
differences are the definition of what technologies constitute improved access to water supply and sanitation, and the
JMP’s use of several household surveys vis-à-vis the use of a single data point by several governments. Therefore,
the conclusion on progress toward the MDGs might differ according to the data source used.
Source: Adapted from AMCOW (2010).
Table 11. Benchmarking water and sanitation indicators
Unit Low-income
countries Mozambique
Middle-income
countries
Mid-2000s 1997 2003 2008 Mid-2000s
Access to piped water % pop 10.5 7.0 8.0 8.7 52.1
Access to standposts % pop 16.2 19.0 20.6 16.7 18.9
Access to wells/boreholes % pop 38.3 47.0 54.7 59.0 6.0
Access to septic tanks % pop 4.9 4.4 2.6 5.5 40.8
Access to improved latrines % pop 9.9 10.0 14.2 15.5 1.4
Access to traditional latrines % pop 50.1 23.4 31.5 38.3 30.4
Open defecation % pop 40.3 61.5 51.7 40.1 14.3
2002 2006 2009
Domestic water consumption liter/capita/day 72.4 33.3 37.0 — 165.9
Revenue collection % sales 92.7 61 71 90 100.0
Distribution losses % production 34.3 55 56 45 26.8
Cost recovery % total costs 56 35 32 57 81
Operating cost recovery % operating costs 65 65 51 88 145
Labor costs connections per employee
159 104 137 — 369
Total hidden costs as % of revenue % 163 294 225 113 140
Mozambique Countries with scarce water
resources
Other developing
regions Mid-2000s Late 2000s
Residential tariff U.S. cents per m3 32 64 60.26 3.0–60.0
Source: Demographic and Health Survey and AICD water and sanitation utilities database (www.infrastructureafrica.org/aicd/tools/data).
Access figures from DHS surveys (1997 and 2003) and MICS Survey (2008).
Utilities figures are the weighted average by water production of the following utilities: Beira, Maputo, Nampula, Pemba, and Quilimane.
— = Not available.
Mozambique’s reforms of the water and sanitation sector attracted about $350 million in investments
between 2007 and 2008. This has allowed for enhancing the level of service in cities served by the
holding company. Hours of supply increased from 11 to 16 on average between 2002 and 2006, which
has led to an increase in the domestic water consumption from 33.3 to 37 liters per capita in the same

MOZAMBIQUE’S INFRASTRUCTURE: A CONTINENTAL PERSPECTIVE
28
period (table 11). The increase in the total number of connections compounded with the reductions of
staff allowed for an increase in the number of connections per employee from 104 in 2002 to 137 in 2006.
The creation of the water authority (CRA) in 1998 and subsequent delegation of the management and
operation of water utilities to private investors resulted in performance improvements. Collection ratios
increased from 61 percent of the bills in 2002 to 90 percent in 2009. The government set a cost-recovery
policy requiring urban utilities to achieve full cost recovery. Systematic adjustments have been carried out
since, so that between 2002 and 2009 the overall gap between the average effective tariff and the average
total costs declined (table 12). An important difference still remains, however: in 2009 the average total
cost was reported at 1.13 per m3 and the average effective tariff at 0.64 per m
3. The absence of cost-
recovery tariffs has led to underinvestment and delays on asset maintenance, which in turn translate into
high system losses. Despite the decline in the level of nonrevenue water, as of 2009 it still represented 45
percent of production, more than twice the level of a well-performing utility.
Table 12. Evolution of operational indicators associated with Mozambique utilities
Water delivered
System losses Collection ratio Average total
cost Average
effective tariff Total hidden
costs* Total hidden
costs
(million m3/year)
(%) (%) ($/m3) ($/m3) ($ million/year) (% revenues )
2002 68 55 61 0.86 0.30 32 294
2003 75 59 68 1.04 0.31 39 306
2004 81 53 45 0.94 0.32 45 203
2005 85 60 78 1.08 0.33 45 232
2006 85 56 71 1.08 0.35 49 225
2007 84 54 81 1.14 0.39 49 185
2008 87 49 90 1.14 0.52 47 144
2009 91 45 90 1.13 0.64 44 113
Source: Derived from Briceño-Garmendia, Smits, and Foster (2009). Note: Water delivered (million m3/year) and total hidden costs ($/year) are reported as the sum of the Beira, Maputo, Nampula, Pemba, and Quilimane utilities. The other indicators reported in the table are weighted averages.
Progress on performance and the adjustment of tariffs have resulted in drastically decreasing hidden
costs due to inefficiencies (box 3). In 2002 the mispricing of water services, distributional losses, and—to
a lesser extent—collection inefficiencies accounted for almost 300 percent of the revenues on average
(figure 10). In 2009 hidden costs represented about 110 percent of the revenues. Underpricing continues
to be the main driver of hidden costs, with a contribution of around 50 percent, which is reflected in low
operating and total cost-recovery ratios (see table 11).
Challenges
Despite the reforms in the urban water and sanitation sector, progress on increasing access to the safest
forms of water supply and sanitation has been slow. In 2008 only 9 percent of the population used piped
water, just above 1997 levels of 7 percent. On average, only 0.55 percent of the population gained access
each year between 2003 and 2006 (figure 11a). Access to standposts decreased from 19 percent in 1997 to
17 percent in 2008. . Between 1997 and 2008 access to septic tanks increased just 1.1 points, from 4.4

MOZAMBIQUE’S INFRASTRUCTURE: A CONTINENTAL PERSPECTIVE
29
percent to 5.5 percent of the population, roughly the level of LIC peers but around eight times lower than
an average MIC in Sub-Saharan Africa. Similarly, access to improved latrines increased from 10 percent
in 1997 to 15.5 percent in 2008.
Figure 10. Evolution of hidden costs in Mozambique’s water sector
Source: Derived from Banerjee and others (2008).
Note: Weighted average of five utilities.
Box 3. Hidden costs in utilities
A monetary value can be attributed to observable operational inefficiencies—mispricing, unaccounted-for losses,
and undercollection of bills, to mention three of the most conspicuous operational inefficiencies—by using the
opportunity costs of operational inefficiencies: tariffs for uncollected bills and production costs for mispricing and
unaccounted for losses. These costs are considered hidden as they are not explicitly captured by the financial flows
of the operator. Hidden costs are calculated by comparing a specific inefficiency against the value of that operational
parameter in a well-functioning utility (or the respective engineering norm) and multiplying the difference by the
opportunity costs of the operational inefficiency.
Source: Adapted from Briceño-Garmendia, Smits, and Foster (2009).
At the national level, Mozambique’s progress in water and sanitation access rates grew by around 2.4
percentage points between 1997 and 2008 (figure 11a and 11b). On the sanitation side, Mozambique has
not been able to keep pace with population growth. But it is noteworthy that in rural areas the rate of
expansion of wells and boreholes combined with the sharp decline in surface water was higher than the
rural population growth rate.
There are important differences in the performance of water utilities in Mozambique. Among the
utilities managed by FIPAG, hidden costs ranged between 45 percent to 290 percent of revenues in 2009
(figure 12). For the same year the Maputo utility registered hidden costs above 100 percent of revenues,
and except for Pemba it is performing worse than all other utilities in Mozambique. Comparing the
aggregate average hidden costs of Mozambican utilities with those of other southern African water
utilities indicates that, as of 2006–07, their hidden costs, averaging over 100 percent of revenues, were
among the worst in the region (figure 12).

MOZAMBIQUE’S INFRASTRUCTURE: A CONTINENTAL PERSPECTIVE
30
Figure 11. Expansion of lowest-cost technologies in water and sanitation technologies at the national, urban, and rural levels have kept pace with population growth
Population gaining access per year between 2003–08
a. Water b. Sanitation
Source: WHO Joint Monitoring Program 2010, from Demographic and Health Surveys for 1997, 2003, and 2008.
Figure 12. Hidden costs of selected water utilities, as percentage of revenue
Source: Derived from Briceño-Garmendia and others (2009).
Note: * Average of hidden costs of water utilities; figures for Mozambique utilities are as of 2009.

MOZAMBIQUE’S INFRASTRUCTURE: A CONTINENTAL PERSPECTIVE
31
Power
Achievements
Mozambique’s energy supply is relatively reliable compared to its African peers. According to the
Enterprise Survey for 2007, firms’ value lost due to power outages in Mozambique was 2.4 percent of
sales, less than half the value lost in other LICs and close to the level of MICs. In Mozambique there were
37 days when power outages occurred, vis-à-vis 70 and 124 days in middle- and low-income countries
respectively, but the duration of power outages in Mozambique (4.2 hours) was above the level of most of
neighboring countries. Around 11 percent of the energy consumed by firms in Mozambique was
generated in-house, a level comparable to that of MICs and half that of other LICs (table 13). The delay in
obtaining an electric connection (13 days) was one-third of the regional average (42 days). Due to the
relativity good quality of energy supply, the percentage of firms identifying energy as a major constraint
in Mozambique was below the Sub-Saharan average (table 14).
Table 13. Benchmarking Mozambique’s power indicators
Unit Low-income,
nonfragile country
Mozambique Middle-income country
1997 2003 2006–07
National access to electricity % population 32.8 6.6 8.1 9.4 49.5
Urban access to electricity % population 72.8 25.8 25 26 74.4
Rural access to electricity % population 12.7 2.1 1.1 1.7 26.3
Installed power generation capacity MW/million people 20 98 — 799
Power consumption (residential) kWh/capita 107 26 29 [1] 4,479
Power outages Day/year 124.5 — 37.2 70.6
Firms’ reliance on own generator % consumption 21 — 10.8 11
Firms’ value lost due to power outages % sales 6 — 2.4 2
Delay in obtaining an electrical connection Days 41 — 12.7 12
Collection ratio % billings 93 100 100 100
System losses % production 24 25 26 20
Cost-recovery ratio % total cost 89 71.3 85.8 85
Total hidden costs as % of revenue % 88.4 — 38 140.6
Effective power tariffs (US cents/kWh) Mozambique Predominantly
hydrogeneration
Predominantly thermal generation
Other developing
regions
Residential at 100 kWh/month 6.8 10.7 15.7
5.0 – 10.0 Commercial at 900 kWh/month 8.0 12.9 19.0
Industrial at 100 kVA 6.5 9.3 13.0
Source: Eberhard and others 2009; derived from AICD electricity database (www.infrastructureafrica.org/aicd/tools/data). Other sources include: access data coming from Demographic and Health Surveys 1997 and 2003; utility data from AICD electricity database (www.infrastructureafrica.org/aicd/tools/data). Data referring to outages is coming from the 2007 Enterprise Survey.
Note: [1] The total consumption was 474 kWh: 29 kWh domestic, 396 industry, and 48 other.
— = Not available.
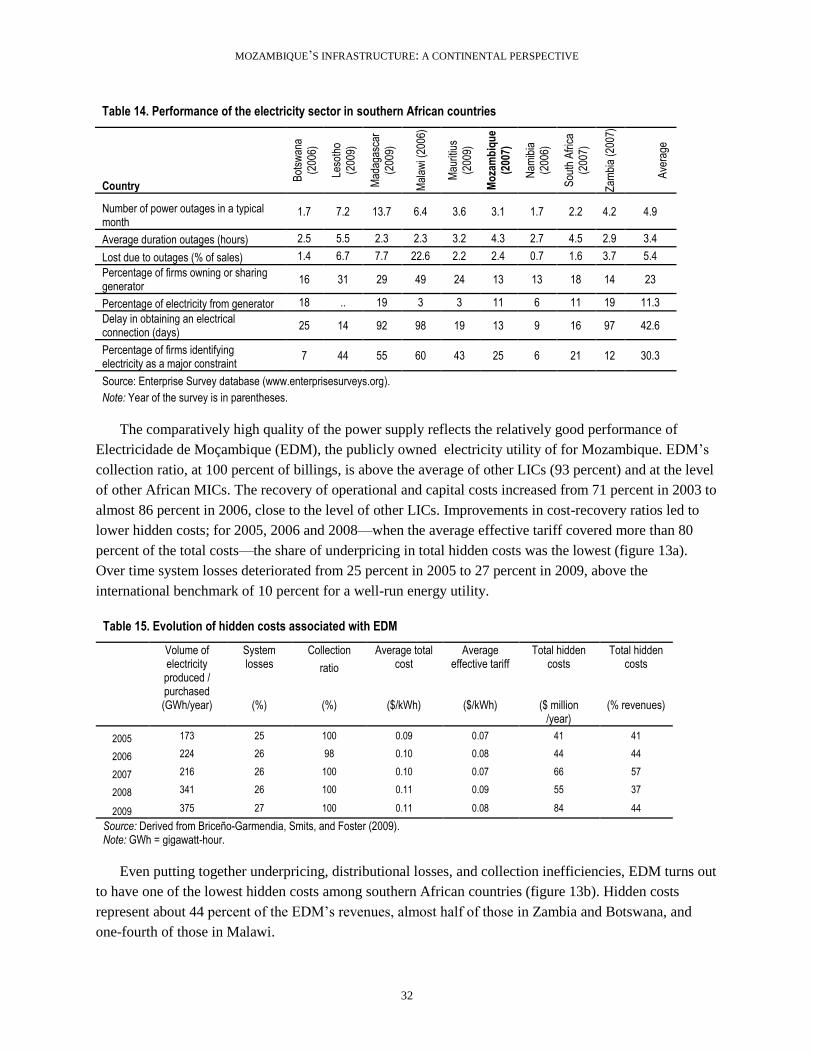
MOZAMBIQUE’S INFRASTRUCTURE: A CONTINENTAL PERSPECTIVE
32
Table 14. Performance of the electricity sector in southern African countries
Country
Bot
swan
a
(200
6)
Leso
tho
(200
9)
Mad
agas
car
(200
9)
Mal
awi (
2006
)
Mau
ritiu
s
(200
9)
Mo
zam
biq
ue
(200
7)
Nam
ibia
(200
6)
Sou
th A
fric
a
(200
7)
Zam
bia
(200
7)
Ave
rage
Number of power outages in a typical month
1.7 7.2 13.7 6.4 3.6 3.1 1.7 2.2 4.2 4.9
Average duration outages (hours) 2.5 5.5 2.3 2.3 3.2 4.3 2.7 4.5 2.9 3.4
Lost due to outages (% of sales) 1.4 6.7 7.7 22.6 2.2 2.4 0.7 1.6 3.7 5.4
Percentage of firms owning or sharing generator
16 31 29 49 24 13 13 18 14 23
Percentage of electricity from generator 18 .. 19 3 3 11 6 11 19 11.3
Delay in obtaining an electrical connection (days)
25 14 92 98 19 13 9 16 97 42.6
Percentage of firms identifying electricity as a major constraint
7 44 55 60 43 25 6 21 12 30.3
Source: Enterprise Survey database (www.enterprisesurveys.org).
Note: Year of the survey is in parentheses.
The comparatively high quality of the power supply reflects the relatively good performance of
Electricidade de Moçambique (EDM), the publicly owned electricity utility of for Mozambique. EDM’s
collection ratio, at 100 percent of billings, is above the average of other LICs (93 percent) and at the level
of other African MICs. The recovery of operational and capital costs increased from 71 percent in 2003 to
almost 86 percent in 2006, close to the level of other LICs. Improvements in cost-recovery ratios led to
lower hidden costs; for 2005, 2006 and 2008—when the average effective tariff covered more than 80
percent of the total costs—the share of underpricing in total hidden costs was the lowest (figure 13a).
Over time system losses deteriorated from 25 percent in 2005 to 27 percent in 2009, above the
international benchmark of 10 percent for a well-run energy utility.
Table 15. Evolution of hidden costs associated with EDM
Volume of electricity produced / purchased
System losses
Collection Average total cost
Average effective tariff
Total hidden costs
Total hidden costs ratio
(GWh/year) (%) (%) ($/kWh) ($/kWh) ($ million /year)
(% revenues)
2005 173 25 100 0.09 0.07 41 41
2006 224 26 98 0.10 0.08 44 44
2007 216 26 100 0.10 0.07 66 57
2008 341 26 100 0.11 0.09 55 37
2009 375 27 100 0.11 0.08 84 44
Source: Derived from Briceño-Garmendia, Smits, and Foster (2009). Note: GWh = gigawatt-hour.
Even putting together underpricing, distributional losses, and collection inefficiencies, EDM turns out
to have one of the lowest hidden costs among southern African countries (figure 13b). Hidden costs
represent about 44 percent of the EDM’s revenues, almost half of those in Zambia and Botswana, and
one-fourth of those in Malawi.

MOZAMBIQUE’S INFRASTRUCTURE: A CONTINENTAL PERSPECTIVE
33
Figure 13. Hidden costs of Mozambique’s electrical utility in comparative perspective
As percentage of the revenues a. EDM’S hidden costs over time, mainly driven by underpricing
b. Hidden costs in selected energy utilities in southern Africa
Source: Derived from Briceño-Garmendia, Smits, and Foster (2009) and Briceno-Garmendia and Shkratan (2010).
Note: [*] Projection.
Mozambique’s hydropower potential will add to the already relatively high installed power-
generation capacity. At 98 MW per million people, Mozambique’s installed generation capacity is five
times the average capacity of LICs, but still below the level of MICs (table 13) and not enough to meet
the 6 to 7 percent annual growth in electricity demand. Mozambique has an installed capacity of 2,184
MW, distributed by five hydropower plants that make up 97 percent of the country’s production.2
Mozambique’s hydropower potential is substantial: about 13,000 MW producing 65,000 GWh per year
can be developed in the country, mainly in the Zambezi watershed (around 70 percent).
2 Cahora Bassa with 2.075 MW; Chicamba Real with 38.4 MW; Mavuzi with 52 MW; Corumana with 16.6 MW;
Cuamba with 1.1 MW; Lichinga with 0.75 MW.

MOZAMBIQUE’S INFRASTRUCTURE: A CONTINENTAL PERSPECTIVE
34
Additionally, there are plans to expand the generation and transmission infrastructure, which will
involve the participation of the private sector. Investments will add 1,500 km of transmission lines from
Tete to Maputo, costing around $4 billion and becoming the backbone of Mozambique’s power grid.
Transmission interconnections with neighboring countries, including between Malawi and northwest
Mozambique and with Tanzania, will compound with these investments. The volume traded has potential
to increase, at least, from 45 to 146 terawatt-hours (TWh) per year (figure 14).
Figure 14. Mozambique’s power potential under trade expansion and stagnation scenarios
a. Trade expansion b. Trade stagnation
Source: Eberhard and others 2008.
Challenges
Despite the comparative robustness of its grid, Mozambican access to electricity is very low, in both
urban and rural areas. At 10 percent of the population, access to electricity is less than one-third of the
access reported in low-income peers and one-fifth of the access to electricity in MICs. Whereas around 72
percent of the urban population in LICs has access to electricity, in Mozambique only 26 percent of the
urban population is connected to the power grid. The average rural access to electricity in Mozambique, at
only 1.1 percent, was only one-tenth of rural access in LICs at 12.7 percent (table 13). The ratio of urban
to rural access is 20 to 1.
Low access to energy is accompanied by low annual per capita power consumption, which at 26 kWh
lags behind other LICs and is less than 1 percent of an average MIC. Given the very low electrification
rate, Mozambique has much to benefit from expanding transmission and distribution beyond main
economic centers to better reach other population pockets, in particular in the northern part of the country.
The financial health of EDM is undermined by tariffs that don’t allow for cost recovery. At 7.5 cents
per kilowatt-hour (kWh), Mozambique has some of the lowest power tariffs in Africa (figure 15), though
above the levels of other southern African countries such as South Africa, Zimbabwe, and Zambia. While
Mozambique’s power production costs are low, they are above power prices. Historic costs—including
both operations and maintenance and capital—amount to 8 cents per kWh. Thus, tariffs allow for

MOZAMBIQUE’S INFRASTRUCTURE: A CONTINENTAL PERSPECTIVE
35
recovery of routine expenses but impose an implicit subsidy to capital. Long-run marginal costs, however,
are close to the mark of 6 cents per kWh (figure 16). Thus, tariffs are capturing only about 80 percent of
historic costs, and the power sector today is living on myopic tariffs that free-ride on the investments of
the past without making provision for the investments of the future. South Africa’s recent experience of
power shortages demonstrates the dangers of putting off this reality for too long. Given the relatively low
costs of power in absolute terms, it should be feasible for Mozambican consumers to pay full cost-
recovery tariffs. Moreover, a stronger cash flow for EDM would help to finance the needed expansions in
generation capacity to keep pace with growing demand, as well as to accelerate the pace of electrification,
particularly if optimal investments that factor in regional gains and increase power trade are set in place,
lowering the long-run marginal cost to 6 cents per kWh, below the prevailing tariffs.
The implementation of the approved Electrification Master Plan for 2001–19 has the potential to
bring about important increases in access and power consumption per capita. Between 2005 and 2008,
300,000 new energy customers were connected, above the target of 80,000 connections included in the
master plan. The inclusion of performance indicators as part of the contract between the government and
EDM will further reduce inefficiencies and the need for subsidies to finance the operation of the utility.
Figure 15. Power tariffs and costs in Mozambique are among the lowest in Africa
a. Power tariffs

MOZAMBIQUE’S INFRASTRUCTURE: A CONTINENTAL PERSPECTIVE
36
b. Power costs
Source: Power price: Briceño-Garmendia and Shkaratan 2010; Power costs: Eberhard and others 2009.
Figure 16. Average revenue is below historical total power costs but above incremental costs
Source: Rosines and others 2009.
Note: LMRC = long-run marginal cost.
Information and communication technologies
Achievements
Mozambique is one of the clear cases where telecommunications leapfrogging has found a fertile ground,
leading to achievements in the ICT sector. Introduction of competition in the mobile segment in 2003 has
also brought benefits. Population covered by a global system for mobile communications (GSM) signal

MOZAMBIQUE’S INFRASTRUCTURE: A CONTINENTAL PERSPECTIVE
37
grew from 14 percent in 2000 to over 80 percent in 2008,3 taking Mozambique above the level of
countries in the same income group. Mobile telephone penetration has gone up from less than 1 percent in
2000 to over 20 percent in 2008 compared to just 0.4 percent for fixed-telephone penetration in 2008.
Mobile growth between 2005 and 2008 was around 40 percent a year, about the same as the Sub-Saharan
average (table 16).
Table 16. Benchmarking ICT indicators
Low-income country Mozambique Sub-Saharan Africa
Unit 2008 2000 2005 2008 2008
GSM coverage % population under signal
56 14 70 83 56
International bandwidth bits/person 24 0.2 1.9 14 34
Internet users/100 people 4.6 0.1 0.5 3.6 6.5
Landline subscribers/100 people 4.6 0.5 0.4 0.4 1.5
Mobile phone subscribers/100 people 28.5 0.3 8.4 22.1 33.3
Low-income country Mozambique Middle-income country
US dollars 2008 2005 2008 2010 2008
Price of monthly mobile basket 10 10.7 10.9 9.8 11.8
Price of monthly fixed-line basket 9 15.4 14.7 13.2 11.6
Price of 20-hour Internet package — 32.9 26.7 24 —
Price of monthly fixed broadband 102.4 99 63 100.1
Price of a call to the United States per minute — 0.4 0.4 0.3 0.8
Price of an inter-Africa call per minute — 0.5 0.5 1
Source: AICD 2006. GSM = global system for mobile communications. — = Not available.
The development of the mobile market has been part of the Mozambican government’s institutional
reforms that include the inception of a sector policy, the establishment of a regulatory body (the National
Communications Institute of Mozambique, or INCM), the creation of a universal service fund, and the
progressive liberalization of the telecommunications market, including the ending of exclusivity for the
incumbent Telecomunicações de Moçambique.
Challenges
Despite improvements in the mobile market, in 2008 Mozambique’s penetration was the third-lowest in
southern Africa (table 17). The expected launch of a third mobile operator (three companies were
shortlisted in July 2010 following a tender) should help to extend coverage, lower prices, and increase
penetration. Remaining coverage gaps could be met through the universal service fund.
In the case of mobile telephony, much of the population—up to 87 percent—could be reached on a
commercially viable basis, according to AICD estimates (figure 17). This result is based on the
assumption that 4 percent of local income in each area could be captured as revenue for voice telephony
3 At the end of 2008, the network of the incumbent mobile operator covered 83 percent of the population and 60
percent of the national territory (see Mcel 2009; Relatório Anual 2008).
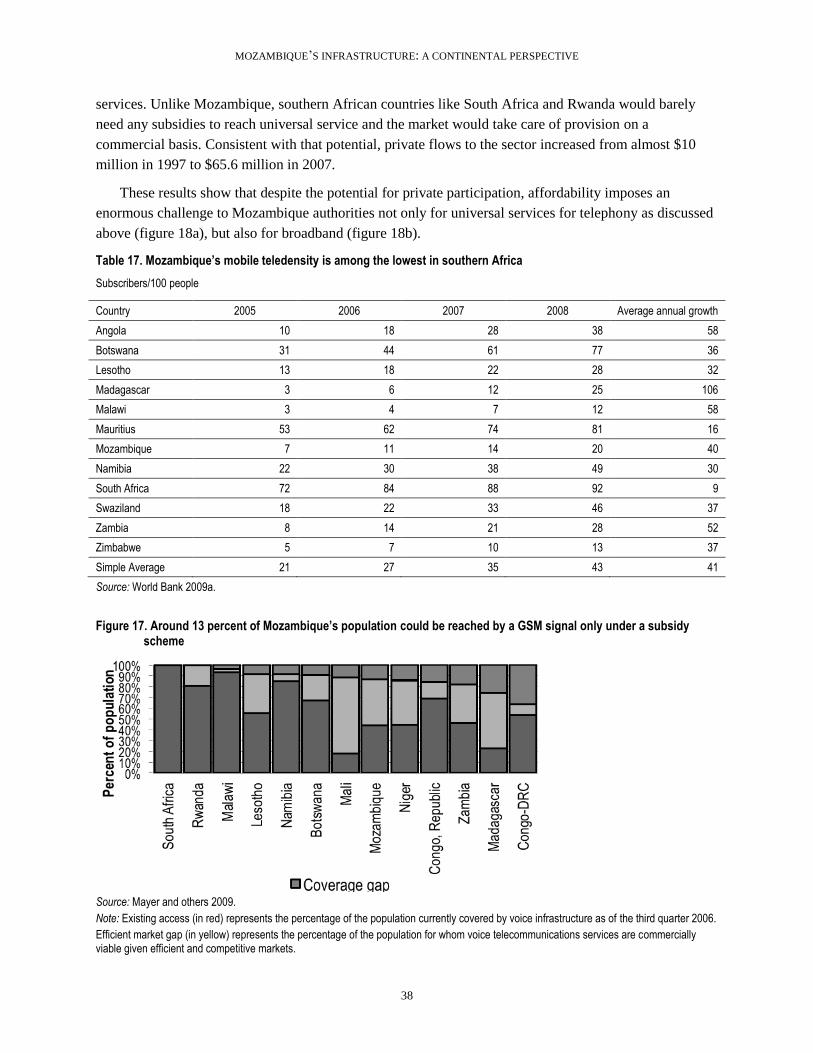
MOZAMBIQUE’S INFRASTRUCTURE: A CONTINENTAL PERSPECTIVE
38
services. Unlike Mozambique, southern African countries like South Africa and Rwanda would barely
need any subsidies to reach universal service and the market would take care of provision on a
commercial basis. Consistent with that potential, private flows to the sector increased from almost $10
million in 1997 to $65.6 million in 2007.
These results show that despite the potential for private participation, affordability imposes an
enormous challenge to Mozambique authorities not only for universal services for telephony as discussed
above (figure 18a), but also for broadband (figure 18b).
Table 17. Mozambique’s mobile teledensity is among the lowest in southern Africa
Subscribers/100 people
Country 2005 2006 2007 2008 Average annual growth
Angola 10 18 28 38 58
Botswana 31 44 61 77 36
Lesotho 13 18 22 28 32
Madagascar 3 6 12 25 106
Malawi 3 4 7 12 58
Mauritius 53 62 74 81 16
Mozambique 7 11 14 20 40
Namibia 22 30 38 49 30
South Africa 72 84 88 92 9
Swaziland 18 22 33 46 37
Zambia 8 14 21 28 52
Zimbabwe 5 7 10 13 37
Simple Average 21 27 35 43 41
Source: World Bank 2009a.
Figure 17. Around 13 percent of Mozambique’s population could be reached by a GSM signal only under a subsidy scheme
Source: Mayer and others 2009.
Note: Existing access (in red) represents the percentage of the population currently covered by voice infrastructure as of the third quarter 2006.
Efficient market gap (in yellow) represents the percentage of the population for whom voice telecommunications services are commercially viable given efficient and competitive markets.

MOZAMBIQUE’S INFRASTRUCTURE: A CONTINENTAL PERSPECTIVE
39
Coverage gap (light gray) represents the coverage gap—the percentage of the population for whom services are not viable without a subsidy.
Figure 18. Telecommunications coverage in Mozambique
a. Telephony b. Broadband
Source: Mayer and others 2009.
Development of the Internet market also remains a major challenge for Mozambique. Although
Mozambique was the fourth country in Africa to connect to the Internet in 1994, according to the most
recent survey of the national statistical office, Internet penetration as of 2007 was only 2.1 users per 100
people, reaching 3.6 in 2008.4 International Internet bandwidth has increased steadily to some 15 bits per
person in 2008 but still lags in comparison to other countries. Mozambique falls behind other southern
African countries in both Internet penetration and international Internet bandwidth (figure 19).
As of today, a domestic fiber-optic backbone extends to all provincial capitals in the country. The
lack of fiber-based international connectivity, however, has been the main difficulty for advancing
Internet development in Mozambique due to the high price of satellite connections. Fixed broadband
prices are high at around $100 per month in 2008, especially considering the country’s status as a low-
income economy. This is expected to change with the commissioning of two fiber-optic submarine cables
which will add significantly to Mozambique’s international Internet capacity. The arrival of the first
submarine cable connecting Mozambique to the rest of the world in 2009 has the potential to reduce
international prices by 90 percent (allafrica.com, July 26, 2009); access to submarine cables generally
reduces costs, particularly if there is gateway competition (table 18).
The parallel fiber-optic infrastructure Mozambique has set in place not only provides redundancy in
access to an international gateway but implicitly creates competitive conditions between landing points.
4 According to the national statistical institute (Instituto Nacional de Estatística, INE) from data compiled for the
2007 census. See Apresentação Dos Resultados definitivos do censo 2007 (www.ine.gov.mz/censo2007).

MOZAMBIQUE’S INFRASTRUCTURE: A CONTINENTAL PERSPECTIVE
40
The government is keen to explore additional connections through neighbors with access to other fiber-
optic cables to create more competition for international capacity. This should further reduce the prices of
international calls and the cost of Internet services.
Figure 19. Mozambique’s Internet market, despite improvement, lags behind southern African peers
a. Internet service trends, 2000–08 b. Mozambique’s Internet vs. southern African peers, 2008
Source: World Bank, including Information and Communications for Development database.
Table 18. High international call charges driven both by technology and market power
$, 2008 Peak 1-minute call within region
Peak 1-minute call to the United States
Monthly Internet ADSL (256 kbps)
Without submarine cable 0.97 0.96 266
With submarine cable 1.07 0.63 89
-- Monopoly on international gateway 1.65 1.11 109
-- Competitive international gateway 0.45 0.28 65
Source: AICD database.
Note: ADSL =Asymmetric digital subscriber line.
Another factor that should help boost the Internet market is the launch of relatively high-speed 3G
mobile networks by both of the existing mobile operators. These networks offer theoretical speeds that are
faster than what is currently available with fixed broadband in Mozambique. Broadband Internet access
prices are also lower with the 3G network, about one-third that of the fixed network.5
5 Mcel, one of the country’s mobile operators, was advertising download speeds of up to 14.4 megabits per second
(Mbps) over its 3G mobile network compared to 2.048 Mbps, the fastest speed available with TDM’s fixed ADSL

MOZAMBIQUE’S INFRASTRUCTURE: A CONTINENTAL PERSPECTIVE
41
While Mozambique has made progress in its reform of the ICT sector, there is still unfinished
business. Although the incumbent’s exclusivity has ended, so far no additional fixed-line operators have
been licensed. Furthermore, both the incumbent fixed and mobile operator remain fully state-owned,
inhibiting private sector investment in the sector. Administration of the universal service fund could be
enhanced, particularly to target the remaining areas of the country without mobile coverage.
Financing Mozambique’s infrastructure
To meet its most pressing infrastructure needs and catch up with developing countries in other parts of the
world, Mozambique needs to expand its infrastructure assets in key areas (table 19). The targets outlined
below are purely illustrative, but they represent a level of aspiration that is not unreasonable. Developed
in a standardized way across African countries, they allow for cross-country comparisons of the
affordability of meeting the targets, which can be modified or delayed as needed to achieve financial
balance.
Table 19. Illustrative investment targets for infrastructure in Mozambique
Economic target Social target
ICT Fiber-optic links to neighboring capitals. Universal access to GSM signal and public broadband facilities.
Irrigation Increase irrigated area by 96,399 hectares [1].
Power 1,400 MW interconnectors.
3,248 MW in hydrogeneration capacity [2]. Electricity coverage of 19.3% (41% urban and 5.2% rural).
Transport Regional connectivity by good-quality 2-lane paved road.
National connectivity by good-quality 1-lane paved road.
Provide rural road access to 26.5 percent of the highest-value agricultural land, and urban road access within 500 meters.
WSS Achieve Millennium Development Goals and clear the sectors’ rehabilitation backlog
Source: Mayer and others 2009 ; Rosnes and Vennemo 2009; Carruthers, Krishnamani, and Murray 2009; You and others 2009.
Note: WSS = water supply and sanitation; ICT = information and communication technology; GSM = global system for mobile communications. [1] Assuming trade stagnation scenario. Therefore, the power needs considered in this chapter are expected to be higher under a power trade scenario.
[2] Assuming an internal rate of return of 12 percent.
n.a. = Not applicable.
Meeting these illustrative infrastructure targets for Mozambique would cost $1.7 billion per year
through 2015. Capital expenditure would account for around 69 percent of this requirement. The highest
annual price tag is associated with the power sectors, requiring on the order of $685 million. Transport
and water supply and sanitation sectors are also in need of significant funding of around $395 and $370
million per year, respectively. Around $156 million is needed for the ICT sector. The irrigation sector
would require about $84 million annually over the next decade. Water sector spending is associated with
sustaining MDG targets for water and sanitation, while power sector spending is associated with
broadband network. See: www.mcel.co.mz/content/view/13/633/lang,pt_PT/. The monthly price of an unlimited 3G
broadband subscription is MT 2,400 compared to MT 3,650 for a 2 Mbps (capped at 21 GB of use) ADSL
subscription. See: www.mcel.co.mz/content/view/13/633/lang,pt_PT/ and
www.tdm.mz/portdm/tarifas/b_larga/b_larga.htm [Accessed 20 August 2010]

MOZAMBIQUE’S INFRASTRUCTURE: A CONTINENTAL PERSPECTIVE
42
providing 3,248 MW of new generation capacity and 1,400 MW of interconnection capacity to meet
demands over the next decade, as well as boosting electrification from current overall access rate of 12
percent to 19 percent (table 20).
Table 20. Indicative infrastructure spending needs in Mozambique for 2006–15
$ million per year
Sector Capital expenditure Operations and maintenance Total needs
ICT 77 79 156
Irrigation [1] 73 11 84
Power (nontrade) 495 190 685
Transport (basic) 226 169 395
WSS 300 70 370
Total 1,171 520 1,690
Source: Mayer and others 2009; Rosnes and Vennemo 2009; Carruthers, Krishnamani, and Murray 2009; You and others, AICD 2009. Derived from models that are available online at www.infrastructureafrica.org/aicd/tools/models. Note: WSS = water supply and sanitation; ICT = information and communication technology. [1] The total spending needs for the irrigation sector were calculated assuming an internal rate of return cutoff of 12 percent and taking the investment required for additional land increased as in table 10, plus the requirements for the rehabilitation and maintenance of the existing irrigation infrastructure.
Mozambique’s infrastructure spending needs look particularly high relative to the country’s GDP,
since they would absorb 26 percent of GDP annually for a decade. Infrastructure investment alone would
absorb 20 percent of GDP, roughly 1.5 times of what China invested in infrastructure during the mid-
2000s. These high numbers are above the average GDP share that other low-income, nonfragile African
countries would need to spend, which amounts to 22 percent of GDP.
Figure 20. Mozambique’s infrastructure spending needs are substantial relative to GDP
Estimated infrastructure spending needed to meet targets, as percentage of GDP
Source: Foster and Briceño-Garmendia 2009.
Note: LIC = low-income country; MIC = middle-income country; ECOWAS = Economic Community of West African States; SSA = Sub-Saharan Africa; GDP = gross domestic product; O&M = operations and maintenance; CAPEX = capital expenditure.

MOZAMBIQUE’S INFRASTRUCTURE: A CONTINENTAL PERSPECTIVE
43
At present, Mozambique spends only $664 million on meeting its infrastructure needs (table 21).
Around two-thirds of the total is allocated to capital expenditure and one-third to operating expenditures.
Operating expenditures are entirely covered by budgetary resources and payments from infrastructure
users. The two largest sources of funding for infrastructure investment are the public sector and the
donors, each providing about $230 million per year on average. The private sector has been investing at
less than one-half of this level. Existing spending is predominantly channeled to the transport, power, and
ICT sectors. This level of spending absorbs about 10.1 percent of Mozambique’s GDP, a comparable
level of effort to that found in other resource-rich African states, which have on average been spending
around 10.6 percent of GDP on infrastructure in recent years (figure 21).
Table 21. Financial flows to Mozambique’s infrastructure, average, 2001–06
$ million per year
O&M Capital expenditure
Total spending Public sector Public sector ODA
Non-OECD financiers PPI Total CAPEX
ICT 82 0 8 0 34 43 124
Irrigation 11 3 0 0 0 3 14
Power 63 — 58 5 1 64 127
Transport 70 48 106 16 56 226 296
WSS 4 9 55 0 35 99 103
Total 230 60 227 21 126 434 664
Source: Derived from Foster and Briceño-Garmendia (2009).
Note: O&M = operations and maintenance; ODA = official development assistance; PPI = private participation in infrastructure; CAPEX = capital expenditure; OECD = Organisation for Economic Co-operation and Development; WSS = water supply and sanitation; ICT = information and communication technology.
Figure 21. Mozambique’s existing infrastructure spending is particularly high
Source: Derived from Foster and Briceño-Garmendia (2009).
Note: LIC = low-income country; MIC = middle-income country; ECOWAS = Economic Community of West African States; SSA = Sub-Saharan Africa; GDP = gross domestic product; O&M= operations and maintenance; CAPEX = capital expenditure.

MOZAMBIQUE’S INFRASTRUCTURE: A CONTINENTAL PERSPECTIVE
44
The sources of infrastructure investment finance in Mozambique differ somewhat from the peer group
(figure 22). Noticeable are the pronounced role of official development assistance (ODA) and the
importance of public investment in the transport sector. Most of the power sector capital investment has
been financed by development assistance. Mozambique has benefited from non-OECD finance in
transport, water and sanitation, and ICT sectors.
Figure 22. Mozambique’s pattern of capital investment in infrastructure differs from that of comparator countries
Investment in infrastructure sectors as percentage of GDP, by source
Source: Derived from Briceño-Garmendia, Smits, and Foster (2009).
Note: Private investment includes self-financing by households. ODA = official development assistance; OECD = Organisation for Economic Co-operation and Development; ICT = information and communication technology; GDP = gross domestic product; WSS = water supply and sanitation; LIC = low-income countries.
How much more can be done within the existing resource envelope?
About $204 million of additional resources could be recovered each year by improving efficiency (table
22). Increasing cost-recovery could save Mozambique $61 million annually. Potential gains of about $45
per year are possible from optimizing staffing levels. Reducing distribution losses to a reasonable
benchmark in power and water could save around $47 million each year. Increasing collection efficiency
could expand the budget envelope by $35 million annually. Budget underexecution (that is, the share of
budgeted funds that is actually spent) could add an additional $16 million. The two sectors that present
the largest potential efficiency dividends are power and transport.

MOZAMBIQUE’S INFRASTRUCTURE: A CONTINENTAL PERSPECTIVE
45
Table 22. Potential gains from greater operational efficiency
ICT Irrigation
Power (nontrade)
Transport (basic)
WSS Total
Underrecovery of costs n.a. — 25 13 23 61
Overstaffing 26 n.a. 18 n.a. 2 45
Distribution losses n.a. n.a. 30 n.a. 17 47
Undercollection n.a. — 0 31 4 35
Low budget execution 0 1 0 13 2 16
Total 26 1 72 56 48 204
Source: Derived from Foster and Briceño-Garmendia (2009).
Note: WSS = water supply and sanitation; ICT = information and communication technology.
— = Not applicable.
n.a. = Not available.
Undercharging for power and water services is costing Mozambique about 2 percent of its GDP
annually. In the power sector, as of 2008, it is estimated that the average total cost of producing electricity
has historically been $0.11 per kWh, while the average effective tariff is only $0.09, which is sufficient to
cover operating and maintenance costs, but falls short of covering investments. The associated financial
burden is close to 0.25 percent of GDP, about five times lower than that of comparator countries (figure
23). In the water sector, average tariffs, as of 2009, stand at $0.64 per cubic meter versus an estimated
average cost-recovery tariff of $1.13 per cubic meter. The macroeconomic burden at 0.23 percent of GDP
is broadly on par with that for power, and it is comparable to other low-income, nonfragile countries.
Figure 23. Underpricing of power and water in Mozambique is relatively less burdensome
Financial burden of underpricing in 2007-2008, as percentage of GDP
Source: Derived from Briceño-Garmendia, Smits, and Foster (2009).
Note: GDP = gross domestic product; LIC = low-income countries.
Because of inequitable access to power and water services in Mozambique, subsidized tariffs are
highly regressive. More than 90 percent of those that have electricity or piped water connections belong
to the top 20 percent of the expenditure distribution; such connections are nonexistent for poorer
households (figure 24). Only the richest quintile has access to piped water. Most of the poorest quintile

MOZAMBIQUE’S INFRASTRUCTURE: A CONTINENTAL PERSPECTIVE
46
still relies on surface water. This highly inequitable distribution of connections virtually guarantees that
any price subsidy to these services will be extremely regressive.
Figure 24. Consumption of infrastructure services in Mozambique varies by income quintile
a. Mode of water supply, by income quintile b. Prevalence of connection to power grid among Mozambican population, by income quintile
Source: Banerjee and others 2009.
Note: Q1—first budget quintile, Q2—second budget quintile, and so on.
Operational inefficiencies of power and water utilities are costing Mozambique $128 million each
year, which amounts to 1.68 percent of GDP overall. Mozambique’s power utility faces distribution
losses of 26 percent (more than double best-practice levels). As a result, Mozambique’s power utility
generates major hidden costs for the economy. The collection rate is comparatively high at around 96
percent of its revenue. In the case of water, revenue-collection inefficiencies are comparatively slightly
lower than in low-income, nonfragile countries on average, but distribution losses stand at a high 45
percent as compared to the best-practice benchmark of 20 percent. In spite of the smaller financial
turnover of the water sector, its hidden costs weigh more heavily on GDP than those in the power sector
(figure 25).
Figure 25. Mozambique’s power and water utilities: The burden of inefficiency
a. Uncollected bills and unaccounted losses in the power sector, as a percentage of GDP
b. Uncollected bills and unaccounted losses in the water sector, as a percentage of GDP
Source: Derived from Briceño-Garmendia, Smits, and Foster (2009).

MOZAMBIQUE’S INFRASTRUCTURE: A CONTINENTAL PERSPECTIVE
47
Annual funding gap
Mozambique’s infrastructure funding gap amounts to $822 million per year, or about 12.5 percent of
GDP. About 60 percent of the gap is found in the power sector, where the annual shortfall of 19 percent
of the population without access is $486 million (table 23). Another significant part of the gap is found in
the water and sanitation sector, where an additional $219 million is needed to meet the MDGs. Additional
funds are also required in the irrigation, transport, and ICT sectors.
Table 23. Funding gaps by sector
$ million per year
ICT Irrigation Power Transport WSS Total
Needs (156) (84) (685) (395) (370) (1,690)
Spending traced to needs 122 14 127 296 103 662
Within sector reallocation 2 0 0 0 0 2
Potential efficiency gains 26 1 72 56 48 204
(GAP) or surplus (6) (69) (486) (42) (219) (822)
Source: Derived from Foster and Briceño-Garmendia (2009).
Note: Potential overspending across sectors is not included in the calculation of the funding gap, because it cannot be assumed that it would be applied toward other infrastructure sectors. * traced to needs. — = Not available.
What else can be done?
The most obvious way to address the funding gap is by raising additional financing. In the case of
Mozambique, there may be realistic prospects for increasing the flow of resources to infrastructure, both
from the public and private sectors.
Private participation in infrastructure (PPI) commitments to Mozambique varied a lot over time; the
country attracted more private financing into infrastructure then most other African countries on average,
but there is significant room for improvement (figures 26a and 26b). On average over 2002–07,
Mozambique has captured private investment commitments worth around 1.4 percent of GDP. Notably,
transport absorbed more than half of this, unlike in most other Sub-Saharan African countries in the same
period, where the bulk of PPI went to the telecommunications sector. Only a few other African countries
have done better capturing PPI resources for infrastructure (if PPI flows to the natural gas sector are
excluded). Countries such as the Democratic Republic of Congo, Liberia, Nigeria, Uganda, Kenya, and
Senegal have all captured between 1.8 and 2.5 percent of GDP, while the most successful country in this
regard—Guinea-Bissau—has captured in excess of 3.0 percent of GDP.
But even if additional finance is hard to secure, there is still much that Mozambique can do to reduce
the infrastructure funding gap based on its own policy choices, and in particular the technology choices it
makes to meet its infrastructure targets. The single-largest measure that Mozambique could take to reduce
its infrastructure spending needs would be to improve its transport infrastructure. Adopting appropriate
technologies for the surfacing of paved roads could produce savings of $124 million in annual investment
requirements. Another $58 million a year could be saved by adopting lower-cost technologies to meet the
MDGs, placing greater emphasis on stand posts, boreholes, and improved latrines. If all these policy

MOZAMBIQUE’S INFRASTRUCTURE: A CONTINENTAL PERSPECTIVE
48
measures were adopted, Mozambique could save $184 million a year, thereby bringing its infrastructure
funding gap down to $640 million a year (table 24).
Finally, if all else fails, it may be necessary to extend the time horizon for meeting the infrastructure
targets beyond the illustrative 10-year period considered here. Simulations suggest that even if
Mozambique were unable to raise additional financing, if inefficiencies can be addressed, the identified
infrastructure targets could be achieved within a 20-year horizon. Without stemming inefficiencies,
however the existing resource envelope would not suffice to meet infrastructure targets in the medium
term.
Within the overall funding envelope, it will be very important to carefully prioritize infrastructure
investments. Given the magnitude of the country’s funding gap, it will not be feasible to resolve all
pending infrastructure issues at once—hence the need to identify priorities. The foregoing analysis of
achievements and challenges suggests the importance of prioritizing key infrastructure interventions for
the economy, such as improving water supply and access to improved water and sanitation, and
expanding power-generation capacity.

MOZAMBIQUE’S INFRASTRUCTURE: A CONTINENTAL PERSPECTIVE
49
Figure 26. Mozambique is capturing a significant amount of PPI but there is still room for improvement
a. PPI commitments to Mozambique
b. Average of PPI disbursements to African countries, 2002–07 *
Source: World Bank and PPIAF, PPI Project Database (http://ppi.worldbank.org) in current $ millions.
Note: Energy sector as reported by the PPI database, combines electricity and natural gas commitments. These figures exclude natural gas sector. According to the PPI database, Mozambique has seen $1,200 million commitments to the natural gas sector in 2003.
* Calculated as PPI commitments smoothed out over 3 years.
Table 24. Potential savings from adopting alternatives technologies in power, water, sanitation, and roads sectors
Before
innovation After innovation Savings
Savings as % of sector funding
gap
Savings as % of total funding gap
Power trade 685 771 0 0 0
WSS appropriate technology 370 312 58 27 7
Roads appropriate technology 395 271 124 292 15
Total 1,450 1,354 182 22 22
Source: AICD calculations.
Note: WSS = water supply and sanitation.

MOZAMBIQUE’S INFRASTRUCTURE: A CONTINENTAL PERSPECTIVE
50
Bibliography
This country report draws upon a wide range of papers, databases, models, and maps that were created as
part of the Africa Infrastructure Country Diagnostic. All of these can be downloaded from the project
Web site: www.infrastructureafrica.org. For papers go to the document page
(www.infrastructureafrica.org/aicd/documents), for databases to the data page
(www.infrastructureafrica.org/aicd/tools/data), for models go to the models page
(www.infrastructureafrica.org/aicd/tools/models), and for maps to the map page
(www.infrastructureafrica.org/aicd/tools/maps ). The references for the papers that were used to compile
this country report are provided in the table below.
General
AICD (Africa Infrastructure Country Diagnostic). Africa’s Infrastructure: A Time for Transformation
(AICD Web site). www.infrastructureafrica.org.
Foster, Vivien, and Cecilia Briceño-Garmendia, eds. 2009. Africa’s Infrastructure: A Time for
Transformation. Paris and Washington, DC: Agence Française de Développement and World
Bank.
World Bank. 2007. Mozambique: Country Partnership Strategy 2008-2011. Washington, DC: World
Bank.
—–—. 2009. IDA at Work. Mozambique: From Post-Conflict Recovery to High Growth. Washington,
DC: World Bank.
Government of Mozambique. 2010. Report on the Millennium Development Goals. Maputo
UNDP (United Nations Development Programme). 2010. Human Development Index Report for
Mozambique. http://hdrstats.undp.org/en/countries/.
World Bank. 2009. Doing Business. Washington, DC: World Bank.
Financing
Briceño-Garmendia, Cecilia, Karlis Smits, and Vivien Foster. 2009. ―Financing Public Infrastructure in
Sub-Saharan Africa: Patterns and Emerging Issues.‖ AICD Background Paper 15, Africa Region,
World Bank, Washington, DC.
Growth
Calderón, César. 2009. ―Infrastructure and Growth in Africa.‖ Policy Research Working Paper 4914,
World Bank, Washington, DC.

MOZAMBIQUE’S INFRASTRUCTURE: A CONTINENTAL PERSPECTIVE
51
Escribano, Alvaro, J. Luis Guasch, and Jorge Pena. 2010. ―Assessing the Impact of Infrastructure Quality
on Firm Productivity in Africa.‖ Policy Research Working Paper 5191, World Bank, Washington,
DC.
Yepes, Tito, Justin Pierce, and Vivien Foster. 2009. ―Making Sense of Africa’s Infrastructure
Endowment: A Benchmarking Approach.‖ Policy Research Working Paper 4912, World Bank,
Washington, DC.
Information and communication technologies
Allafrica.com. 2009. ―Mozambique: Country Linked to Seacom Fibre-Optic Cable.‖ July 26.
http://allafrica.com/stories/printable/200907270972.html.
Ampah, Mavis, Daniel Camos, Cecilia Briceño-Garmendia, Michael Minges, Maria Shkratan, and Mark
Williams. 2009. ―Information and Communications Technology in Sub-Saharan Africa: A Sector
Review.‖ AICD Background Paper 10, Africa Region, World Bank, Washington, DC.
INE (Instituto Nacional de Estatística). 2007. ―2007 census. Apresentação dos resultados definitivos do
censo 2007.‖ www.ine.gov.mz/censo2007/.
Mayer, Rebecca, Ken Figueredo, Mike Jensen, Tim Kelly, Richard Green, and Alvaro Federico Barra.
2009. ―Connecting the Continent: Costing the Needs for Spending on ICT Infrastructure in
Africa.‖ AICD Background Paper 3, Africa Region, World Bank, Washington, DC.
Mcel. 2009, Annual Report. http://www.mcel.co.mz/content/view/36/670/lang,pt_PT/
—–—.2008. Annual Report. http://www.mcel.co.mz/content/view/36/670/lang,pt_PT/
World Bank. 2001. Report No. PID9839. Mozambique Communication Sector Reform Project.
Washington, DC: World Bank.
—–—.2009a. Information and Communication for Development. Washington, DC: World Bank
Irrigation
InfraCo. 2010. Beira Agricultural Growth Corridor: Delivering the Potential.
http://www.infracoafrica.com/projects-mozambique-bagc.asp
Svendsen, Mark, Mandy Ewing, and Siwa Msangi. 2008. ―Watermarks: Indicators of Irrigation Sector
Performance in Africa.‖ AICD Background Paper 4, Africa Region, World Bank, Washington,
DC.
You, L. 2008. ―Irrigation Investment Needs in Sub-Saharan Africa.‖ Appendix 2 Country Results, World
Bank, Washington, DC.
You, L., C. Ringler, G. Nelson, U. Wood-Sichra, R. Robertson, S. Wood, G. Zhe, T. Zhu, and Y. Sun.
2009. ―Torrents and Trickles: Irrigation Spending Needs in Africa.‖ AICD Background Paper 9,
Africa Region, World Bank, Washington, DC.

MOZAMBIQUE’S INFRASTRUCTURE: A CONTINENTAL PERSPECTIVE
52
World Bank. 2007. Mozambique Country Water Resources Assistance Strategy 2008–2011: Making
Water Work for Sustainable Growth and Poverty Reduction. Washington, DC: World Bank.
Power
Briceño-Garmendia, Cecilia, and Maria Shkratan, 2010. ―Power Tariffs: Caught between Cost Recovery
and Affordability.‖ First draft, February 2010.
Eberhard, Anton, Vivien Foster, Cecilia Briceño-Garmendia, Fatimata Ouedraogo, Daniel Camos, and
Maria Shkaratan. 2008. ―Underpowered: The State of the Power Sector in Sub-Saharan Africa.‖
AICD Background Paper 6, Africa Region, World Bank, Washington, DC.
Foster, Vivien, and Jevgenijs Steinbuks. 2009. ―Paying the Price for Unreliable Power Supplies: In-House
Generation of Electricity by Firms in Africa.‖ Policy Research Working Paper 4913, World Bank,
Washington, DC.
Mozambique’s Ministry of Energy. 2007. Energy Statistics 2006. www.me.gov.mz/prt/downloads/estats.
—–—. 2009. Realizacoes do Sector de Energia. 2005-2008. Maputo.
Rosnes, Orvika, and Haakon Vennemo. 2009. ―Powering Up: Costing Power Infrastructure Spending
Needs in Sub-Saharan Africa.‖ AICD Background Paper 5, Africa Region, World Bank,
Washington, DC.
Transport
Bofinger, Heinrich C. 2009. ―An Unsteady Course: Growth and Challenges in Africa’s Air Transport
Industry.‖ AICD Background Paper 16, Africa Region, World Bank, Washington, DC.
Bullock, Richard. 2009. ―Off Track: Sub-Saharan African Railways.‖ AICD Background Paper 17, Africa
Region, World Bank, Washington, DC.
Carruthers, Robin, Ranga Rajan Krishnamani, and Siobhan Murray. 2009. ―Improving Connectivity:
Investing in Transport Infrastructure in Sub-Saharan Africa.‖ AICD Background Paper 7, Africa
Region, World Bank, Washington, DC.
CFM (Caminos de Ferro de Moçambique). 2006. Annual Report. www.cfmnet.co.mz/.
—–—. 2008. Annual Report. www.cfmnet.co.mz.
—–—. 2009. Annual Report. www.cfmnet.co.mz.
Government of Mozambique. 2011. ―Mozambique SDI Programme.‖ Business Plan, Ministry of
Transport and Communications, Maputo, April 2011
Gwilliam, Ken, Vivien Foster, Rodrigo Archondo-Callao, Cecilia Briceño-Garmendia, Alberto Nogales,
and Kavita Sethi. 2008. ―The Burden of Maintenance: Roads in Sub-Saharan Africa.‖ AICD
Background Paper 14, Africa Region, World Bank, Washington, DC.
International Road Federation. 2007. World Road Statistics 2007. Data 2000–2005. Geneva.

MOZAMBIQUE’S INFRASTRUCTURE: A CONTINENTAL PERSPECTIVE
53
Kumar, Ajay, and Fanny Barrett. 2008. ―Stuck in Traffic: Urban Transport in Africa.‖ AICD Background
Paper 1, Africa Region, World Bank, Washington, DC.
Ocean Shipping Consultants, Inc. 2009. ―Beyond the Bottlenecks: Ports in Africa.‖ AICD Background
Paper 8, Africa Region, World Bank, Washington, DC.
SSATP (Sub-Saharan Africa Transport Policy Program). 2007. RMI Matrix
http://www.worldbank.org/afr/ssatp
World Bank. 1992. Staff Appraisal Report. The Republic of Mozambique. First Roads and Coastal
Shipping Project. Report No. 10336-MOZ, Infrastructure Operations Division, Southern Africa
Department, World Bank, Washington, DC, May 6.
—–—. 2000. Implementation Completion Report. The Republic of Mozambique. First Roads and Coastal
Shipping Project. Report No. 20682, Transport 1, Eastern and Southern Africa Region, World
Bank, Washington, DC, June 29.
—–—. 2007. Implementation Completion and Results Report. Republic of Mozambique. Phase I of the
Roads and Bridges Management and Maintenance Project. Report No: ICR0000586, Transport
Sector, Southern Africa 2, Africa Region, World Bank, Washington, DC, December 30.
—–—. 2007. Project Appraisal Document. Republic of Mozambique. Phase II of the Roads and Bridges
Management and Maintenance Project. Report No: 39679-MZ, Transport Sector, Southern
Africa Country Department 2 (AFCS2), Africa Region Office, World Bank, Washington, DC,
May 1.
—–—. 2009. Implementation Completion and Results Report on a Credit in the Amount of SDR 73.8
Million (US$100 Million Equivalent at Appraisal) to the Republic of Mozambique for a Railways
and Ports Restructuring Project. December 28.
Water supply and sanitation
AMCOW (African Ministers’ Council on Water). 2010. Regional Synthesis Report, Country Status
Overviews on Water Supply and Sanitation 2010. Addis Abbaba, Ethiopia
Banerjee, Sudeshna, Vivien Foster, Yvonne Ying, Heather Skilling, and Quentin Wodon. 2008.―Cost
Recovery, Equity, and Efficiency in Water Tariffs: Evidence from African Utilities.‖ AICD
Working Paper 7, World Bank, Washington, DC.
Banerjee, Sudeshna, Heather Skilling, Vivien Foster, Cecilia Briceño-Garmendia, Elvira Morella, and
Tarik Chfadi. 2008. ―Ebbing Water, Surging Deficits: Urban Water Supply in Sub-Saharan
Africa.‖ AICD Background Paper 12, Africa Region, World Bank, Washington, DC.
Gulyani, Sumila, Debabrata Talukdar, and Darby Jack. 2009. ―Poverty, Living Conditions, and
Infrastructure Access: A Comparison of Slums in Dakar, Johannesburg, and Nairobi.‖ AICD
Working Paper 10, World Bank, Washington, DC.
IBNET (The International Benchmarking Network for Water and Sanitation Utilities). 2009. www.ib-
net.org/.

MOZAMBIQUE’S INFRASTRUCTURE: A CONTINENTAL PERSPECTIVE
54
Keener, Sarah, Manuel Luengo, and Sudeshna Banerjee. 2009. ―Provision of Water to the Poor in Africa:
Experience with Water Stand post s and the Informal Water Sector.‖ AICD Working Paper 13,
African Region, World Bank, Washington, DC.
Morella, Elvira, Vivien Foster, and Sudeshna Ghosh Banerjee. 2008. ―Climbing the Ladder: The State of
Sanitation in Sub-Saharan Africa.‖ AICD Background Paper 13, Africa Region, World Bank,
Washington, DC.
WHO (World Health Organization) Joint Monitoring Program (JMP). 2010. ―Mozambique Estimates for
the Use of Improved Drinking-Water Sources.‖ www.wssinfo.org/resources/documents.html.

About AICD and its country reports
This study is a product of the Africa Infrastructure Country Diagnostic (AICD), a project designed to
expand the world’s knowledge of physical infrastructure in Africa. The AICD provides a baseline against
which future improvements in infrastructure services can be measured, making it possible to monitor the
results achieved from donor support. It also offers a solid empirical foundation for prioritizing
investments and designing policy reforms in Africa’s infrastructure sectors.
The AICD is based on an unprecedented effort to collect detailed economic and technical data on African
infrastructure. The project has produced a series of original reports on public expenditure, spending
needs, and sector performance in each of the main infrastructure sectors, including energy, information
and communication technologies, irrigation, transport, and water and sanitation. Africa’s Infrastructure—
A Time for Transformation, published by the World Bank and the Agence Française de Développement
(AFD) in November 2009, synthesized the most significant findings of those reports.
The focus of the AICD country reports is on benchmarking sector performance and quantifying the main
financing and efficiency gaps at the country level. These reports are particularly relevant to national
policy makers and development partners working on specific countries.
The AICD was commissioned by the Infrastructure Consortium for Africa following the 2005 G8 (Group
of Eight) summit at Gleneagles, Scotland, which flagged the importance of scaling up donor finance for
infrastructure in support of Africa’s development.
The first phase of the AICD focused on 24 countries that together account for 85 percent of the gross
domestic product, population, and infrastructure aid flows of Sub-Saharan Africa. The countries are:
Benin, Burkina Faso, Cape Verde, Cameroon, Chad, Côte d’Ivoire, the Democratic Republic of Congo,
Ethiopia, Ghana, Kenya, Lesotho, Madagascar, Malawi, Mozambique, Namibia, Niger, Nigeria, Rwanda,
Senegal, South Africa, Sudan, Tanzania, Uganda, and Zambia. Under a second phase of the project,
coverage was expanded to include as many of the remaining African countries as possible.
Consistent with the genesis of the project, the main focus is on the 48 countries south of the Sahara that
face the most severe infrastructure challenges. Some components of the study also cover North African
countries so as to provide a broader point of reference. Unless otherwise stated, therefore, the term Africa
is used throughout this report as a shorthand for Sub-Saharan Africa.
The World Bank has implemented the AICD with the guidance of a steering committee that represents the
African Union (AU), the New Partnership for Africa’s Development (NEPAD), Africa’s regional

economic communities, the African Development Bank (AfDB), the Development Bank of Southern
Africa (DBSA), and major infrastructure donors.
Financing for the AICD is provided by a multidonor trust fund to which the main contributors are the
United Kingdom’s Department for International Development (DFID), the Public-Private Infrastructure
Advisory Facility (PPIAF), Agence Française de Développement (AFD), the European Commission, and
Germany’s Entwicklungsbank (KfW). A group of distinguished peer reviewers from policy-making and
academic circles in Africa and beyond reviewed all of the major outputs of the study to ensure the
technical quality of the work. The Sub-Saharan Africa Transport Policy Program and the Water and
Sanitation Program provided technical support on data collection and analysis pertaining to their
respective sectors.
The data underlying AICD’s reports, as well as the reports themselves, are available to the public through
an interactive Web site, www.infrastructureafrica.org, that allows users to download customized data
reports and perform various simulations. Many AICD outputs will appear in the World Bank’s Policy
Research Working Papers series.
Inquiries concerning the availability of data sets should be directed to the volume editors at the World
Bank in Washington, DC.