Embed Size (px)
Citation preview

The World Bank
Agriculture & Rural Development Discussion Paper 2
From Challenge to Opportunity Transforming Kenya’s Fresh Vegetable Trade in the Context of Emerging Food Safety and Other Standards in Europe
Steven Jaffee
Pub
lic D
iscl
osur
e A
utho
rized
Pub
lic D
iscl
osur
e A
utho
rized
Pub
lic D
iscl
osur
e A
utho
rized
Pub
lic D
iscl
osur
e A
utho
rized
Pub
lic D
iscl
osur
e A
utho
rized
Pub
lic D
iscl
osur
e A
utho
rized
Pub
lic D
iscl
osur
e A
utho
rized
Pub
lic D
iscl
osur
e A
utho
rized

First printing or web posting: December 2003 ©The International Bank for Reconstruction and Development Agriculture & Rural Development Department 1818 H Street, N.W. Washington, DC 20433 Agriculture & Rural Development Discussion Papers is an informal series produced by the Agriculture & Rural Development Department of the World Bank. These papers raise concepts and issues for discussion in the broader development community and describe ongoing research and/or implementation experiences from the Bank. The findings, interpretations, and conclusions are the author’s own and should not be attributed to the World Bank, its management, its Board of Executive Directors, or the countries they represent. Some of the numbers quoted are estimates or approximations and may be revised at a later stage. About the authors Steven Jaffee is a senior economist in the International Trade Department of the World Bank.

iii
Contents
Abstract...........................................................................................................................................v
Preface...........................................................................................................................................vii
Acknowledgments .........................................................................................................................ix
Acronyms and Abbreviations ......................................................................................................xi
1. Introduction................................................................................................................................1
2. The Market Context: European Union Fresh Vegetable Imports and Distribution ...........4
3. Regulatory and Governance Context: EU, Member State, and Private Measures .............9
Broad Food Safety Governance Measures ............................................................................................9 Pesticide-Related Legislation and Oversight ....................................................................................... 12 Phytosanitary Measures .................................................................................................................... 17 Conformity to Quality Standards ....................................................................................................... 19 ‘Good Agricultural Practices’ ............................................................................................................ 20 The Comparative “Regimes” Facing Kenyan Fresh Produce Exporters................................................. 21
4. Development of Kenyan Horticultural and Fresh Vegetable Exports ................................27
5. Strategies and Costs of Compliance with Standards ............................................................36
Raw Material Sourcing, Production and Traceability........................................................................... 38 Packhouse Facilities, Quality Assurance, and Food Safety Management............................................... 46 Other Measures Taken...................................................................................................................... 55 Toward a ‘National Standard’ ............................................................................................................ 56
6. Conclusions ...............................................................................................................................59
References.....................................................................................................................................62
List of Tables
Table 1 Average annual rates of growth in EU import volumes of selected fresh vegetables, 1990 –2000 .5 Figure 1 EU green bean import volumes (Tons)....................................................................................6 Table 2 Private label market share of retail grocery sales 2001...............................................................8 Table 3 Market destinations of Kenyan fresh vegetables and compliance requirements.......................... 24 Table 4 Competitors and comparative freight costs ............................................................................. 32

iv
Table 5 Illustrative net profit margins for medium/larger Kenyan exporters.......................................... 33 Table 6 Export volumes of selected fresh vegetables from Kenya (tons)............................................... 33 Table 7 External developments and their time lag pressures in Kenya .................................................. 37 Table 8 Estimated shares of production from different supply sources 2001/2002 ................................. 42 Table 9 Illustrative changes in pesticide usage for vegetable export commodities.................................. 48 Table 10 Fresh produce exporter types, assets, and needed investments................................................ 53 Table 11 Concentration in the Kenyan fresh fruit and vegetable export................................................. 54
List of Figures
Figure 2 Proportion of surveyed consumers indicating that 'price' is a primary factor in grocery store selection.............................................................................................................................................7 Figure 3 Diverse standards in the “single market” ............................................................................... 25 Figure 4 Growth of Kenyan horticultural/floricultural product exports ................................................. 27 Figure 5 Kenya horticultural/floricultural exports by product category................................................. 28 Figure 6 Recent growth in Kenyan fresh vegetable exports.................................................................. 30 Figure 7 Average unit values for green bean imports........................................................................... 31 Figure 8 Illustrative exporter site management structure...................................................................... 49
List of Boxes
Box 1 Pesticide residue testing results ................................................................................................ 17 Box 2 Smallholder oversight costs in the context of the broader supply chain ....................................... 41 Box 3 Upgrading for BRC: the challenge for a smaller company ......................................................... 51 Box 4 Perceived advantages of servicing supermarket clients .............................................................. 53

v
Abstract
Over the past two decades, developing countries have experienced comparatively very rapid growth in their exports of fresh fruit and vegetables. This trade has spread from an initial base of traditional tropical fruits—for example, bananas, and pineapples—to include a broader array of fruits and vegetables.
While there are a number of success stories from developing countries in this field, the market and regulatory context for this trade is changing in ways that appear to be raising the bar for new entrants while throwing new challenges in the path of existing developing country suppliers. Consumers in industrialized countries are becoming increasingly concerned about food safety and about the environmental and/or social dimensions of their food supply chain. In several regions, especially within the European Union, the response to these consumer concerns—and to certain prevailing weaknesses in systems to manage food safety—has been a wave of legislative and regulatory activity, and the emergence of numerous private sector ‘codes of practice’ or other technical protocols.
The changing regulatory environment within Europe has raised concerns that developing countries—such as Kenya—will be unable to maintain let alone continue to expand their trade in high-value, horticultural products. The fear is that increasingly stringent food safety, phytosanitary, and other regulations within Europe will overwhelm the capacities of developing country suppliers and official agencies to comply or will result in such high compliance costs as to restrict continued participation in this trade to relatively few growers and exporters. The growing concentration of fresh produce distribution channels—under the coordination of major supermarket companies—is seen as exacerbating this challenge and further increasing the barriers to market participation.
The recent experience of the Kenyan fresh produce industry offers a bright ray of hope. As highlighted in this study, the Kenyan fresh produce industry—with the assistance of the Government of Kenya and others—is effectively meeting the challenge of rising standards. Indeed, the industry is using it as an opportunity to redefine the industry’s competitive advantage. Significant elements of the industry have been transforming their production, packing, and broader supply chain operations for the past five to seven years both in response to and in anticipation of changes in official regulations and private standards or protocols. This continuing transformation is enabling the leaders of the industry to reposition themselves into relatively more profitable and faster growing value-added segments of the European fresh vegetable market.
Important challenges remain, especially:
1. Ensuring the application of good agricultural practices and being able to more fully demonstrate and document the safety of fresh produce sourced from smallholder farmers;
2. Enabling the industry’s small and medium enterprises (SMEs) to overcome the financial and technical barriers to upgrading their product lines and management systems; and
3. Further strengthening the capacity of the Kenya Plant Health Inspectorate Service and have the European Union (EU) recognize it as a ‘competent authority’ for phytosanitary and quality inspection services.


vii
Preface
This study is the first in a series of case studies that will examine the challenges, strategies, and costs of developing country compliance with international agro-food standards. This case study series is part of a joint program between the World Bank’s Agriculture and Rural Development Department and International Trade Department to better understand the needs and opportunities for developing countries for strengthening their sanitary and phytosanitary (SPS) management capacities. This work will highlight a range of successful and less successful experiences in anticipating, adapting to, or otherwise responding to emerging changes in official and private standards in such markets as those for fresh fruit and vegetables, fish, animal products, spices, and nuts.


ix
Acknowledgments
The author would like to thank a broad array of Kenyan private entrepreneurs, technical specialists, and public officials for their time, insights, and candor in discussing the range of issues covered in this study. Particular thanks are extended to James Cartwright, Dr. Chagema Kedera, Rod Evans, Dr. Vasey Mwaja, Jotham Ouko, Thaddeus Mutiso, and Lucy Mundia. Thanks also to Kevin Swoffer (BRC) and Guy Stinglhamber (PIP) for sharing insights on related initiatives. The author would like to thank colleagues Spencer Henson, Cees de Haan, Kees van der Meer, Mirvat Sewadeh, Patric k Labaste, Mubarik Ali, and Winnie Mutullah for continued support and challenging questions. For helpful exchanges and commentary, the author acknowledges Michael Friis Jensen, Peter Gibbon, Catherine Dolan, and Neil McCulloch. Thanks to Lili Tabada for improving the study’s presentation.


xi
Acronyms and Abbreviations
AAK Agro-Chemical Association of Kenya ACP Africa, Caribbean, and the Pacific BRC British Retail Consortium EU European Union FOB free on board FPEAK Fresh Produce Exporters Association of Kenya HACCP Hazard Analysis and Critical Control Point HCDA Horticultural Crops Development Authority KEPHIS Kenya Plant Health Inspectorate Service MRL maximum residue levels PCPB Pest Control Product Board PIP Pesticide Initiative Programme PRA pest risk analysis SPS Sanitary and Phytosanitary


1
1. Introduction
Over the past two decades, developing countries have experienced very rapid growth in their exports of fresh fruit and vegetables. This trade has spread from an initial base of traditional tropical fruits—i.e., bananas and pineapples—to include a broader array of fruits and vegetables. The trade has been stimulated by growing consumer interest in healthy living and demand for a variety of fresh produce throughout the year. Improvements in post-harvest care and international cold chain logistics have facilitated this trade as have improvements in market access to industrial country markets.
Developing countries’ competitive edge regarding fresh vegetables has generally stemmed from a combination of agroclimatic and cost-of-labor advantages, with their production either complementing that of the Northern Hemisphere on a seasonal basis or providing more cost effective supply of traditional or more exotic vegetables throughout the year. Logistical, historical, and cultural factors have strongly influenced the geography of South–North trade in fresh vegetables, with Latin America primarily supplying the United States, Asia supplying Japan, and the Mediterranean Basin and sub-Saharan Africa supplying Western Europe. With concerns about adverse international price trends and uncertain market prospects for many traditional primary commodity exports—such as, coffee, cocoa, cotton, and tobacco—entrepreneurs and policymakers in many developing countries are looking to further advances in horticultural exports as a means of fostering economic growth and diversification.
While there a number of success stories from developing country in this field, the market and regulatory context for this trade is changing in ways that appear to be raising the bar for new entrants while throwing new challenges in the path of existing developing country suppliers. Consumers in industrialized countries are becoming increasingly concerned about food safety and about the environmental and/or social dimensions of their food supply chain. In a number of countries, these concerns have deepened over the past decade in the wake of a series of food safety crises, scandals, mass product recalls, and other adverse events and miscommunications. These events have shaken consumer confidence in the safety of their food and the credibility of the pertinent regulatory systems governing food safety.
In several regions, especially within the European Union, the response to these consumer concerns—and to the real prevailing weaknesses in systems to manage food safety—has been a wave of legislative and regulatory activity, and the emergence of numerous private sector ‘codes of practice’ or other technical protocols. How will this growing array of governance measures affect the terms and conditions for continued market access by developing country fresh produce exporters? Will these measures raise the technical, financial, and/or administrative bar for market entry to unattainable levels, or, otherwise impose requirements that essentially erase the cost-of-labor and other advantages that developing country suppliers have held until recently? Are governance measures sufficiently transparent—in their formation, content, and implementation—to enable suppliers in developing countries to understand the necessary benchmarks and time frame for compliance?
In the European market particularly, there is considerable concern that the ongoing efforts of the European Union to reevaluate the safety of crop protection products and to harmonize the acceptable levels of pesticide residues on fresh produce will create huge problems for producers and exporters in African and other developing countries. The standards could present new constraints in dealing with crop

From Challenge to Opportunity 2
production or post-harvest problems and/or a higher risk of having products detained and rejected upon entry into Europe.1 That such measures are being taken in parallel with measures to strengthen phytosanitary controls among Community members, and measures to ensure improved food safety management and the traceability of food products from farm to table has led to concerns that Africa’s recent progress in the European fresh produce trade is endangered.
A second and related concern stems from the growing concentration of fresh fruit and vegetable distribution systems in many West European countries where the traditional role of urban wholesale markets is changing or contracting while a limited number of national or multinational supermarket chains account for a large and growing proportion of fresh produce sales.2 To correspond to emerging legislation and in response to both consumer and competitive pressures, some supermarket chains have intensified their screening and monitoring of suppliers and have imposed stricter and more costly process and product standards—related to food safety, environmental protection, social welfare, etc.—on such suppliers. A number of analysts have raised the possibility that the more stringent governance systems being put in place by major supermarket chains, or the industry groups with whom they are affiliated, will effectively crowd out the participation of smallholder farmers, smallscale exporters, and even small countries from the fresh produce trade.
This case study examines this evolving dynamic. It focuses on the fresh vegetable trade from Kenya to Western Europe, a trade that has a fifty-year history. Kenya has been one of the developing world’s most successful exporters of fresh vegetables. In 2000, Kenya ranked second among non-member ‘Third Countries’ in the value of its fresh vegetables imported into the European Union. In 2002, Kenya’s fresh vegetable trade exceeded $100 million free on board (FOB) for the first time ever. The Kenyan experience offers a particularly interesting window into the challenges and opportunities posed by emerging SPS and other standards.
For many years, the Kenyan industry functioned using very simple supply chains with relatively little investment in infrastructure, product development, and management systems, including those for food safety. Over the past five to ten years, however, major elements of the industry have been reshaped and transformed, both in response to and in anticipation of regulatory and private governance changes within its core external markets. Understanding the nature of and facilitating factors for this transformation is instructive. Still, the Kenyan experience also highlights the fact that market and regulatory standards remain diverse—even in the face of EU harmonization efforts—in large part due to the continued dominant role of private standards and consumer preferences. This has provided for a transition period for standards compliance as well as continued opportunities for smaller scale players to participate in the trade.
The bigger picture, however, is of an industry repositioning itself successfully to profit and compete in precisely those segments of the European market that are the most demanding in terms of food safety and quality management. Ironically, this segment of the market has provided something of a lifeline to a Kenyan industry that has otherwise been facing increased competitive pressures in the main segments of the European market where price—rather than added value-addition—is the dominant competitive
1 See, for example, Chan and King (2000), PIP (2001), Lambert (2002), and Noor (n.d.). 2 See, for example, Dolan and Humphrey (2000), Stevens and Kennan (2000), and Harris et al. (2001)

Introduction
3
criteria.3 Attaining a strong market position has not come cheaply. Significant private investments have been required, supplemented by facilitative measures by both the Government of Kenya and a number of private industry associations. The transition is not yet complete either. Important challenges remain, perhaps the most significant of which is further developing governance systems that enable smallholder farmers to continue to participate in export supply channels.
The balance of the paper is structured as follows. Section two provides an overview of the market context for the Kenyan fresh vegetable trade, highlighting selected trends in EU vegetable imports and in the restructuring of the fresh produce distribution system within the Community. Section three examines the regulatory and governance context for this trade, reviewing significant changes in EU (or Member State) legislation or regulatory systems and the emergence of various private sector protocols or other requirements. The prevailing regimes in the different markets, where the Kenyan trade is directed, are compared and contrasted. Section four provides an overview of the major developments in Kenya’s horticultural (and particularly its fresh vegetable) trade over the past decade, illustrating and explaining significant changes in the product mix and market destinations. Section five examines the range of strategies adopted by Kenyan exporters to comply with the changing market and regulatory requirements, together with the measures taken by the Government of Kenya and others to facilitate this process. The analysis also provides illustrations of the investments that have been made and other compliance costs that have or are being incurred in this process.
This paper is based on field interviews and follow-up correspondence with Kenyan exporters, public officials, and other industry representatives between October 2002 and January 2003. 4 It also draws on industry data provided by the Horticultural Crops Development Authority and others, recent academic research on the Kenyan industry and the European fresh produce market, documentation from the European Commission and from Member State regulatory agencies, and interviews with selected importers and distributors within the United Kingdom. 5
3 As will be illustrated below, these competitive pressures stem from (i) Kenya’s relatively high freight costs, (ii) improved productive capacities in several other countries, and (iii) downward movements in market prices for certain vegetables. 4 Interviews and correspondence was conducted with thirteen Kenyan exporters, which collectively account for about 90% of the country’s fresh vegetable exports. Seven of these companies are relatively large, three medium in scale and three are smaller traders. 5 The underlying conceptual framework for this case study is provided in Henson et al. (2002)

4
2. The Market Context: European Union Fresh Vegetable Imports and Distribution
All but a very small proportion of Kenya’s fresh vegetable trade is and has historically been directed to the EU market. Total EU fresh vegetable consumption in 2000, including potatoes, was estimated at 41 million tons. While overall consumption has been stagnant in recent years—due in large part to declining consumption of potatoes, cabbage, and several other starchy or filler vegetables—consumption has continued to increase for an array of green vegetables.6 Most countries within the EU have extensive vegetable production, with Spain and Italy being the largest producers. The bulk of regional consumption comes from local or regional production. In 2000, fresh vegetable imports totaled 16.93 million tons, of which 1.22 million tons were from non-member countries.
In recent years, the rate of growth in overall European imports of fresh vegetables has slowed as a result of slow economic and per capita income growth and the saturation of the markets for some of the larger traditional products in European consumption and trade—especially tomatoes, onions, and potatoes. In US dollar terms, the value of EU fresh vegetable imports actually peaked in 1995/1996 and was some 12 percent lower by 2000. The relative strength of the dollar against major European currencies was a contributing factor, yet there were absolute declines in the volume of trade in important products.
In contrast with the broader trend, EU imports of nonstaple and normally higher value fresh vegetables have continued to grow relatively rapidly. ‘Third country’ suppliers have accounted for a significant and growing share of this trade in nontraditional or specialty vegetables. Table 1 below contrasts growth rates in EU imports for selected staple and non-staple fresh vegetables and also separates out the growth in trade from non-EU sources for these commodities. Based on FAO data with values calculated in US dollars, the average annual growth in total EU vegetable imports was only 1.2 percent over the period from 1990 to 2000. The growth rate in the value of EU vegetable imports from Third Countries was higher at 2.3 percent.
In 2000, the value of total EU imports of fresh vegetables were approximately $7.06 billion, of which intra-EU trade amounted to $6.11 billion and imports from Third Countries about $950 million. The share of Third Countries in EU fresh vegetable imports had increased slightly from 12.8 percent in 1990 to 13.4 percent in 2000.7 Of the nearly 1.22 million tons of fresh vegetables imported into the EU from Third Countries in 2000, nearly two-thirds was accounted for by three commodities—potatoes, onions, and tomatoes, most shipped by sea.8 Green beans, peas, chilies/peppers, mushrooms, a range of vege tables now consumed by immigrant communities and the wider population in Europe account for most of the balance of this trade.
6 These divergent trends are especially apparent in the U.K. See the National Food Survey 2000 results, published by DEFRA. 7 Based on FAO data. 8 Or transported overland from Morocco.

The Market Context: European Union Fresh Vegetable Imports and Distribution
5
Countries bordering the Mediterranean account for some 57 percent of the volume and 47 percent of the value of EU imports from Third Countries.9 Morocco is the single largest supplier with a 20 percent share because it is the dominant external source of tomatoes and plays a significant role in the trade of potatoes, green beans, and peas.10 In 2000, the lower income Africa, Caribbean, and the Pacific (ACP) countries accounted for only eight percent of the volume of EU Third Country imports, but 20 percent of its value. Kenya, alone, accounts for more than one-half of this trade from ACP countries. Kenya was the ninth largest Third Country vegetable supplier (with four percent of the total), yet ranked second among these countries in terms of the value of EU imports (12 percent of the total). This contrast is due to the relatively high unit value of Kenya’s air freighted fresh produce supplies.11
As will be elaborated below, green beans have been a core component of Kenya’s fresh produce trade for many years. This involves a number of distinct types and varieties. So-called fillet type beans are traditionally classified as being extra-fine, fine, or bobby with differences among them in their length, diameter, and other features. There are substantial market price differentials among these with typical C+F values being $4.00/kg for extra fine, $3.50/kg for fine, and $2.25 or less for bobby beans. Consumer preferences vary across countries. The UK, France, and Belgium preferring fine and extra-fine beans, while Germany and Holland prefer the less expensive bobby beans.
As figure 1 illustrates, EU imports of green beans from Third Countries have increased relatively rapidly in recent years following slower growth in the late 1980s and early 1990s. France, the UK, and Holland are the leading importers, accounting for 34 percent, 28 percent, and 16 percent of the total volume of imports in 2000, respectively. 12 Three countries—Kenya, Morocco, and Egypt—are the leading
9 See the analysis provided in COLEACP (2001). 10 Egypt is the second largest supplier in volume terms and fifth largest in value. It has long been an important supplier of potatoes and onion, yet in recent years has expanded its trade in green beans. Israel is the third largest supplier in volume and value terms with potatoes and peppers featuring prominently in its trade. 11 In 2000, the average unit value of imports into the United Kingdom was $330/ton for onions, $430/ton for potatoes, and $1300/ton for tomatoes. In contrast, the average import value for green beans and green peas was $2370/ton and $2760/ton, respectively, while imports specifically from Kenya normally involved C&F values of $3500-4000/ton. 12 A significant proportion of Dutch imports are re-exported to Scandinavia and elsewhere.
Table 1 Average annual rates of growth in EU import volumes of selected fresh vegetables, 1990 –2000 (percent)
Import Item Total EU Imports
EU Imports from Third Countries
Tomato 3.0 1.4 Carrots 2.4 0.2 Potatoes 1.0 -1.9 Onions -0.4 0.3 Green Peas 9.8 11.1 Green Chillies/Peppers 5.4 7.2 Green Beans 5.2 8.6 ‘Minor’ Vegetables* 2.5 4.8
*Classified by FAO as ‘fresh vegetables nes’ and includes a broad array of vegetables not individually classified in the trade statistics of many countries. Source: FAO TRADESTAT

From Challenge to Opportunity 6
suppliers—with a combined share of 76 percent. These three countries have accounted for virtually all of the growth that has been recorded in the green bean trade since the early 1990s.13
Figure 1 EU green bean import volumes (Tons)
0
20,000
40,000
60,000
80,000
100,000
120,000
0
20,000
40,000
60,000
80,000
100,000
120,000
1986
1987
1988
1989
1990
1991
1992
1993
1994
1995
1996
1997
1998
1999
2000
Intra-EU Trade Imports From 3rd Countries
Source: FAO Tradestat
Over the last ten to fifteen years, a number of important structural changes have taken place in the distribution of fresh produce within the EU. During the 1970s and much of the 1980s, the vast proportion of vegetables imported into the Community were handled by firms that operated in or around major wholesale markets. These firms tended to supply a range of small, medium, and larger retail outlets as well as the catering trade. From the late 1980s and increasingly during the 1990s, multiple chain supermarkets gained ascendancy in much of northern Europe. For many of these companies, the fresh produce section became their signature feature, defining their image in terms of quality, variety, and/or price competitiveness.
A growing proportion of fresh produce—including imported fresh produce—came to be channeled through the multiple chain supermarkets, either bypassing the traditional wholesale markets (e.g., in the UK) or involving vertical integration between retail and wholesale operators (e.g., in Germany and Scandinavia). In the UK, a handful of supermarket chains now account for some 80 percent of the retail sales of fresh produce in that country, up from approximately 40 percent in the early 1990s. The major supermarket chains also dominate fresh produce distribution within Scandinavia. Their share is somewhat lower in France, Germany, and Holland (i.e., 50-65 percent) and substantially lower in Southern Europe. A wave of mergers and acquisitions throughout the Community—but most prominently in Northern Europe and the UK—is resulting in a widespread pattern of increased retail concentration.
13 The only other countries to record any growth in their green bean trade were Senegal, Ethiopia, Zambia, and Zimbabwe, yet these their combined increment accounted for only 20% of the total gain for all Third Countries between 1994 and 2000 (COLEACP 2001). 13 Kenya is primarily a supplier of fine, extra and runner beans. The UK is its dominant market, followed by France. Morocco produces fine and bobby with most sales made to France, followed by Spain. Egypt mostly produces bobby beans yet also some fine beans with major sales to the Netherlands but also to the UK, Italy, Germany, and Belgium.

The Market Context: European Union Fresh Vegetable Imports and Distribution
7
Despite the overall trend toward concentration, there are wide variations in the formats, competitive strategies, and product/produce sourcing arrangements of European supermarkets. As Covini and Mariani (1999) note “one great peculiarity of the European food distribution world is the marked lack of homogeneity in the characte ristics of the sector in the various regions; indeed, the most meaningful word to describe the European food distribution sector is diversity.” For example, the UK has a predominance of superstores and a small presence of discount retailers. In Germany, discount retailers have a prominent role with a limited spread of hypermarkets. In France, hypermarkets predominate, while in Italy traditional stores remain the dominant retail outlet.
Some major (multi-store) retailers are pursuing a growth strategy based on competitive prices and driving down their operating and procurement costs. This is the primary form of competition in France, Germany, and much of Southern Europe, reflecting consumer preferences in these areas (see figure 2 below). Other firms are centering their strategy around differentiation—of their products and associated services. This is the major driver of competition among most of the UK’s leading supermarket chains.14
Figure 2 Proportion of surveyed consumers indicating that 'price' is a primary factor in grocery store selection
0
15
30
45
60
75
UK
Netherl
ands Ita
ly
Belgiu
m
German
ySp
ain
France
0
15
30
45
60
75
UK
Netherl
ands Ita
ly
Belgiu
m
German
ySp
ain
France
Source: Nielsen (1997) referenced in Covini and Mariani (1999)
Marks & Spencer (M&S) of the UK was one of the first companies to focus on product differentiation, making major investments to carry a broad range of chilled, prepared food products and carrying a wide range of so-called exotic fruits and vegetables. While other companies had used privately labeled products in order to offer price discounts (on acceptable quality products), M&S used private labels to signal especially high quality. Several other UK supermarket companies have mimicked this approach (note the relative prominence of private label shares in the UK in table 2). This has resulted in a situation where the fresh produce and chilled food sections of a major UK supermarket typically include dozens of exotic, semi-prepared, and/or ready-to-eat salads, vegetables, and vegetable combination products. As will be discussed below, this market segment has been an important recent focus of the Kenyan export trade.
14 See the excellent discussion by Garcia et al. (2002).

From Challenge to Opportunity 8
Even among countries where a handful of multi chain companies have come to account for the majority of fresh produce and broader grocery sales, there remain differences in their systems for procuring produce. In the UK, efforts to centralize produce procurement and consolidate supply chains through so-called category management have accompanied retail consolidation. 15 The major retail chains now essentially bypass the wholesale markets and appoint a limited number of agents to source and even promote a certain range of produce (i.e., citrus fruit and legumes). For any one category of produce, the firms might appoint a single category manager who will organize and oversee production and delivery from both domestic and foreign sources. These category managers have become the gatekeepers to the supermarkets.
While the UK wholesale markets initially experienced a huge decline in their turnover, they have since recovered somewhat by providing specialized services to the catering trade and to the smaller scale retail trade that still serves parts of the UK immigrant and ethnic minority population. From the 1980s through to the early 1990s, the business conducted through the UK’s major wholesale markets contracted. They essentially became dumping grounds for produce that was outside of supermarket specifications or was surplus to the latter’s requirements. Many of the larger wholesale companies exited the business during this period. Since then, however, wholesale market turnover has leveled off.
A large increase in the consumption of food outside the home (i.e., 30 percent of expenditure on food and beverages in 2000) has given rise to increased demand for produce sourcing and distribution services from many small restaurants. Catering outlets are increasingly looking to reduce unnecessary preparation in the kitchen by sourcing vegetables that are already peeled and washed. This is providing new business opportunities for both domestic and foreign suppliers. Many new catering distributors are ethnic specialists—Chinese, Asian, Afro-Caribbean, Turkish, etc.—supplying their own ethnic groups’ shops and restaurants. So-called exotics take some 41 percent of the trading space in the London Spitalfields. Western International is home to many Asian merchants who continue to undertake import and distribution businesses.16
A different pattern exists in France. There, many supermarket companies have retained a more decentralized system for procuring produce with individual or clusters of stores having more regional and local approaches—including continued purchases from wholesale markets. The Rungis wholesale market outside of Paris remains a major force in the French fresh produce market, especially in the handling of fruit and vegetable imports. In Germany, wholesale markets have experienced a relative decline, but they still play a major role in servicing the retail trade and overall fresh produce market.
15 This is discussed in some detail by Dolan and Humphrey (2000), and Humphrey (forthcoming) 16 DEFRA (2002).
Table 2 Private label market share of retail grocery sales 2001 percent
Country Share United Kingdom 43.1 Belgium 26.6 Germany 22.5 France 20.1 Netherlands 18.6 Spain 15.7 Italy 10.9
Source: Tassinari (2001)

9
3. Regulatory and Governance Context: EU, Member State, and Private Measures
Consumer awareness and concern for food safety is growing throughout Western Europe. While European consumers have long been concerned about the presence of chemicals and various additives in their food, a series of food safety scandals over the past decade has fundamentally shaken the confidence of some consumers regarding the safety and integrity of some food products and undermined their confidence in national and Community systems of regulation and safety enforcement.
A number of factors amplified the real hazards to the public, including:17
q a perceived ‘loss of control’ over food in the context of rapid globalization and structural and technical change;
q a perception that information about potentially significant food safety hazards had systematically been withheld (by governments);
q a perception that the regulatory apparatus was biased toward protecting the interests of farmers and downstream food producers rather than consumers;
q public disagreements about assessing risk among food safety scientists from different countries;
q evidence of widespread Member State violation of EU Directives/Regulations and a seeming lack of accountability and responsibility for enforcing existing rules;
q lack of consumer trust in food safety information provided by most segments of the private sector; and
q media coverage that emphasized health threats and the presence of vested interests deemed to be incompatible with consumer protection.
The consumer backlash has been severe, bringing down one national government (in Belgium), undermining the careers of several senior health and agricultural officials, and, at least in certain product groups, threatening to undermine ongoing efforts to integrate the European market. A broad set of institutional and regulatory changes at EU and Member State levels and major initiatives within the private sector to restore consumer confidence have arisen in response to these consumer concerns.
Broad Food Safety Governance Measures
Within the public sector, there has been a substantial shift of responsibilities for governance of food safety systems from ministries of agriculture and/or commerce to ministries of health and consumer affairs. Several countries have created specialized food safety agencies to conduct scientific assessments,
17 This is reflected in the results of several Eurobarometer surveys of European consumers and is illustrated by the content of newsletters and websites of various consumer-oriented associations.

From Challenge to Opportunity 10
to advise policymakers, and to communicate with the public. Examples include the UK Food Standards Agency and the French Food Safety Agency. A similar institutional shift has taken place at the Community level. Oversight for an array of food safety matters has been shifted to a greatly empowered Health and Consumer Protection Directorate General (DG SANCO). In 2002, a European Food Safety Authority was created whose core functions are to provide independent scientific advice, undertake risk assessments, and provide information to the public.
Ultimately, however, the restoration of consumer confidence requires greater clarity about who is accountable for food safety and who is responsible for breakdowns within the food chain. An earlier precedent in addressing this central matter came with the passage of the Food Safety Act in 1990 in the United Kingdom. The Act reaffirmed earlier UK legislation requiring that food be of the nature, substance, or quality demanded by the purchaser and specifying that it was an offense to sell food that did not meet these requirements. Under the Act, any supplier of a branded product would be liable for the safety of their product. For purposes of the Act, all fresh produce sold in unpackaged form was considered the own brand of the retailer.
Hence, under the Act, enforcement action could be taken against a wholesaler or retailer even if the offense was the fault of other parties in the food chain (i.e., local growers, food importers, overseas exporters). All parties in the food chain would need to ensure that they practiced due diligence—carrying out all reasonable precautions and checks on the food and on the process and conditions of its supply. One would have to establish evidence of such due diligence—in the form of systems and documentation—to avoid the imposition of fines or other penalties for food safety problems or violations. The responsibility for the safety and legality of product (including fresh produce) was thus to be shared between the suppliers and the retailers.
The Food Safety Act provided a strong stimulus for private, self-governing actions. Its passage and the subsequent elaboration of codes of practice in various subsectors occurred when multiple outlet supermarkets were growing rapidly and establishing a dominant position in the retail distribution of fresh produce within the country. The major retailers, working with the UK National Farmers Union and other producer associations, established an ‘ICM Partnership’ in 1994 to increase the safety and environmental sustainability of locally-produced fruits and vegetables. Integrated Crop Management Protocols were developed for some forty-seven crops. Within several years, a system of self assessment and independent assessment of farmer practices was developed and formalized into an Assured Produce Scheme.
However, the Food Safety Act fostered a wider set of private actions. During the early 1990s, the major UK supermarkets built up substantial in-house technical teams and they began to audit primary producers, food manufacturers, and selected overseas suppliers. Each company developed its own code of practice containing an array of food safety actions and documentation requirements. These codes underwent periodic revision, in part reflecting new or enhanced consumer concerns. Companies employed third party auditors to carry out some assessments. To many stakeholders, the evolving arrangements were becoming increasingly confusing and problematic, with different standards, multiple audits, and significant oversight costs for supermarkets.
These concerns among the private players led to the formation of a set of working groups under the auspices of the British Retail Consortium in 1996. The consortium sought to develop a common protocol or set of food safety standards that would govern retailer branded food products and inspection systems. Over the subsequent three years, these groups drafted a standard that was designed to allow an assessment of a food supplier’s premises and operational systems and procedures by a competent third party, thus

Regulatory and Governance Context: EU, Member State, and Private Measures
11
standardizing food safety criteria and monitoring procedures, and, potentially, lowering oversight costs for the retailers.
The British Retail Consortium (BRC) Food Technical Standard was created in 1998 and has since undergone two revisions. The standard entails specific requirements for company Hazard and Critical Control Point (HACCP) systems, quality management systems, factory environment systems, and product and process controls. Specific protocols have also been developed for inspection and the accreditation of inspectors, in line with a European standard for inspection (i.e. EN45004). All suppliers to BRC member supermarkets are now being required to obtain the necessary certification. This affects local producers, manufacturers, and importer/distributors, and increasingly, overseas exporters. The BRC food safety standard has now been adopted by selected supermarkets outside of the UK.18
At the broader EU level, there is an ongoing process to define food safety responsibilities more clearly. Council Directive 93/43/EEC laid down general rules for food hygiene as well as procedures to verify compliance with these rules. Subsequent to this, a series of regulations were put in place to govern the inspection of particular types of food products, most of which were foods of animal origin. In 2002, a general Food Law (Regulation EC 178/2002) was adopted, an important provision of which introduced traceability as a requirement for all food marketed within the EU, from January 1, 2005 onwards.
Over the last couple of years, the Commission has been working on legislation to consolidate the existing different food hygiene regulations into one regulation that would ostensibly provide for a total ‘farm to table’ system of oversight and accountability. Significantly, the regulation would make it obligatory for all nonprimary food operators to implement a HACCP system.19 Companies would be obliged to keep records of safety checks covered under HACCP for external surveillance purposes. The regulation would also strengthen the traceability of foods by having compulsory registration of all food businesses and having registration numbers accompany food products throughout the distribution chain. The first reading of the draft Directive by the European Parliament occurred in May 2002 and implementation is expected in 2004 or soon thereafter.
The impact of such a regulation would be felt beyond the EU, as exporters from Third Countries would presumably have to demonstrate that they are implementing a HACCP system and some form of traceability system. Those exporters who have yet to adopt such systems—either to conform with private buyer requirements or simply as part of their evolving management systems—would need to strengthen their food safety systems to retain market access. Full implementation of this regulation would be difficult, however. A large number of smallscale food enterprises within the Community do not presently have such systems in place and they themselves would face major challenges in complying with the Regulation. Therefore, official enforcement would likely be phased in over the medium-term. Developing country fresh produce exporters are more likely to face compliance challenges more quickly in relation to private food hygiene standards—such as those of the British Retail Consortium and any equivalent protocols adopted by supermarkets on the continent.
18 For example, Migros of Switzerland. The BRC standard is one of several standards recognized by the fifty-five companies comprising the Global Food Safety Initiative. See http://www.ciesnet.com/global_food/main.html 19 This is currently obligatory for fisheries and dairy products.

From Challenge to Opportunity 12
Pesticide -Related Legislation and Oversight
In most consumer surveys in Europe, a high level of concern is expressed about the presence of even trace elements of pesticide residues in food as well as the possible negative environmental effects of pesticide use.20 The regulation of pesticide use and the monitoring of pesticide residues in food has long been the responsibility of individual Member States, although international standards and codes of practice have been put in place under the auspices of the International Plant Protection Convention and the Codex Alimentarius. Within the EU itself, significant changes in the regulation of pesticides have been unfolding over the past decade, and they are beginning to alter production practices and options among developing country producer/exporters. There are two dimensions to this regulatory shift: (i) changes in the process of pesticide assessment and registration, and (ii) changes in the setting of EU acceptable maximum residue levels in food and in programs to monitor such residues.
In 1991, Directive 91/414/EEC was issued, setting out a Community harmonized framework for the authorization, use, and control of plant protection products. The Directive, which did not enter into force until July 1993, represented a significant change in the procedures and the focus of pesticide regulation. Under this system, the Commission evaluated the active substances while Member States evaluated and authorized the products/formulations contain ing such active substances. Unlike in the past, a common set of decision criteria and procedures for registering active substances and product formulations was used. The focus of the program was to develop a positive list (referred to as Annex 1) of active substances. Substances not on this positive list were not allowed in plant protection products within the Community.
The program provided for a rigorous set of environmental and human safety criteria, with data requirements matching or exceeding those needed for regulatory approval of pharmaceuticals and commodity chemicals. Agricultural chemical companies needed to undertake or commission a broad array of tests on their patented or otherwise owned active substances and submit extensive dossiers to have these substances be reviewed for re-registration. 21 The Directive provided for a twelve-year program of evaluation for the 834 ‘existing’ active substances. The review process was split into four phases—with different classes of active substances being the focal point of each stage.22 All substances presented for regulatory approval after July 1993 were considered ‘new substances’ and had to be evaluated in parallel.
The actual review process has been extremely slow. At the time the Directive was issued, no detailed guidance was provided on data requirements or assessment criteria. These were developed over an extended period, largely spanning 1993 to 1996, although in practice there continued to be wide variations in the review practices and criteria employed by different Member States for several additional
20 See, for example, Euromonitor (1997). 21 Comprehensive data were required to determine the hazard of the active substance and the hazard/risk associated with the formulated products. Data are required on the toxicological properties, on ecotoxicology, environmental persistence and stability, manufacturing safe handling processes, etc. The typical dossier for an active substance being reviewed is some 30,000 to 50,000 pages. 22 Phase one had 90 substances which were considered most widely used in the market as well as those of considerable safety concern. Phase 2 had 149 substances, essentially all organophosphates and carbamates which were not on the first list plus substances which the agro-chemical industry indicated it would be able to provide dossiers for within a relatively short period of time. The third list included some additional 402 pesticides while the fourth list includes 193 additional substances (including natural products) which are considered to have comparatively fewer safety concerns.

Regulatory and Governance Context: EU, Member State, and Private Measures
13
years.23 The review of Phase 1 was anticipated to be completed in 2003, with the Phase 2 review being completed by 2005. For Phase 3 there are indications that a majority of these active substances will be withdrawn from the market as the pertinent agrochemical companies have not submitted dossiers to re-register them. For those substances that companies are ‘defending’, the review may not be completed before 2008. The same applies for the substances on the Phase 4 list. Even this time frame seems to be quite optimistic given the pace of work and decision-making thus far.
Facing enormous costs for preparing dossiers and financing the review process itself, the major agro-chemical companies have been forced to re-examine their existing and prospective product portfolios and to only selectively defend existing active substances in accordance with commercial criteria. They have therefore focused their efforts on defending active substances with large markets and used for major crops. These commercial (and financial) decisions, when combined with the recognition of safety concerns with certain classes of pesticides, is leading to the withdrawal of large numbers of active substances from the list of improved uses within the Community. By July 2003, some 380 of the 834 active substances were to have been withdrawn from approved use and an additional 150 active substances may be withdrawn from Community-wide approval shortly thereafter. The enormous workload of these review process has simultaneously slowed down the process of reviewing and approving new active substances, many of which have improved efficacy and health/environmental safety properties.24
These developments have raised concerns among various groups of farmers within the EU that they will no longer have the capability to effectively combat pests and diseases for an array of so-called minor crops. This is especially the case among farmers producing more specialized fruits and vegetables in Southern Europe, although there are also apparent gaps in the pesticide armory for certain temperate climate farmers.25 However, Directive 91/414/EEC does provide for Member States to individually extend their authorizations of pesticides for minor uses and to seek voluntary mutual recognitions of these minor use authorizations. This can be done in cases where there are no apparent safety risks associated with the active substance and where there are no efficient alternative remedies. According to Commission Regulation 2076/2002, such authorizations may remain in place until mid-2007, although by the end of 2003 all products from these active substances must be relabeled to indicate their restricted use conditions. By late 2002, such continued use authorizations had been made for some forty-two active substances, typically for several countries. The vast majority of these authorizations are for use on selected fruits, vegetables, or ornamental crops.
The actual or pending withdrawal of large numbers of active substances and pesticide products from the EU market has also caused concern among officials and farmer/exporters from developing countries as well as among agencies which have been actively promoting developing country fresh produce exports.26
23 Some Member States have had limited capacity to fulfill their review functions, causing further delays. At the Commission there have been several changes in the structure and organizational responsibilities of several Directorates General involved in the pesticide review process. 24 This process is not typically taking more than three years from the time a dossier is submitted until final approval. 25 The majority of active substances being withdrawn are insecticides while only a small proportion of new active substances coming onto the market are insecticides. 26 See Chan and King (2000) and PIP (2001).

From Challenge to Opportunity 14
Some of the chemicals used in developing countries are out-of-patent, lower cost pesticides for which the major agro-chemical companies have no interest in generating data for regulatory re-approval. In addition, few of the fruits and vegetables exported by lower income countries are ‘major crops’ representing large markets for the leading agro-chemical companies.27 Hence, unless special measures are taken, there is a concern that developing country growers (and exporters) will face a greatly reduced and probably more costly range of options for managing pests and diseases, contributing to increased levels of crop wastage, higher rates of crop failure, and a reduced ability to meet market requirements for visual and other quality standards.
Concern is also being expressed about the possible adverse effects of EU efforts to harmonize the levels of permitted pesticide residue levels in food products—including fresh fruits and vegetables—sold in Europe. Both nationally and internationally (i.e. CODEX), maximum residue levels (MRLs) have been established for many foodstuffs in order to foster the correct use of pesticides, facilitate the trade of food commodities that have been treated with approved pesticides, and minimize the exposure of consumers to harmful or unnecessary intake of pesticide residues.28 MRLs are typically determined by the results of supervised agricultural residue trials in which ‘good agricultural practices’ are used to generate commercial yields yet also take into account farmer worker and environmental safety. Adjustments to these results may, however, be made in light of food safety concerns.29
Legislation at the EU level dates back to 1976 when Council Directive 76/895/EEC fixed MRLs for forty-three active substances for a range of fruits and vegetables. There have been subsequent revisions in these particular MRLs plus the introduction of Directives to establish community-wide MRLs for a broader array of products including cereals, products of animal origin, foods consumed primarily by infants and small children, and a wide range of processed foods. Still, for many fruits and vegetables, there have remained differences between member states for individual crop/pesticide MRLs, reflecting local production conditions and the extent to which MRLs set at CODEX have been adopted.30
As part of the same process of harmonizing the re-registration of pesticides, efforts are being made to more fully harmonize MRLs for all approved active substances. As with the overall pesticide approval process, test data must be generated in order to determine the residue results from GAP as well as possible adjustments based on consumer safety criteria. In circumstances where there is insufficient data
27 Bananas and citrus fruits are prominent exceptions. 28 Chan and King (2000) provide a good discussion of the issues and concerns. 29 Consumer risk assessment is carried out as a second step. Various consumer food consumption models are used to estimate the daily intake of pesticide residues under normal and worst case conditions. This, together with toxicological tests on the pesticide allow for the fixing of an acceptable daily intake (ADI). This involves finding the highest dose that would produce no adverse effect over through long-term exposure and then applying some additional safety factor. In circumstances where the estimated daily intake is lower than the ADI, the acceptable residue level is normally set at the MRL. When the estimated daily intake exceeds the ADI, the approved uses of the pesticide may be modified or even barred from the particular commodity. In the latter cases, the MRL is set at the limit of determination. The limits of determination are set as low as can routinely be attained within current analytical capabilities. These may range from 0.01 mg/kg. up to 1 mg/kg, depending upon the crop and pesticide. 30 There are some 200 MRLs for active substances used for fruits and vegetables set by CODEX. These have been based on GAP trials from around the world. Buurma et al (2001) compared EU and CODEX MRLs for 45 combinations of pesticides and fruits/vegetables. For nine of these there are no CODEX MRLs, for fourteen the EU MRLs are lower, for fourteen they are the same, and for four the EU levels are higher. This is not a recent phenomenon. They found that in circumstances where the EU MRLs were lower than those of CODEX these differences have been in place for many years.

Regulatory and Governance Context: EU, Member State, and Private Measures
15
to establish an MRL, EU regulations allow this to remain ‘open’ for a limited period of time—during which data can be generated—yet otherwise the MRL will be set at the limit of determination—effectively close to zero.
If actually enforced, the implications of these measures could be significant for developing countries. Relatively few developing countries have undertaken agricultural residue trials under good agricultural practice scenarios. Hence, many crop/pesticide combinations have no international MRL standards. This is especially the case for tropical fruits. In the absence of an established MRL, a setting of the limit of determination may be made. Where actual residues are detected—even of very low magnitudes and even for approved uses—this residue would constitute a violation of existing standards and, potentially lead to the detention and withdrawal of the consignment from the market. For temperate products grown and exported by developing countries, the results of GAP residue trials in Europe or other temperate countries may not be appropriate or achievable by farmers growing under tropical or sub-tropical conditions where pest or disease pressures may be higher. Again, even applying ‘good agricultural practices’ there is a possibility that developing country grower/exporters would send consignments with pesticide residues in excess of official allowances. The detection of residues of chemicals for which there is no longer approved use (for specific crops or generally) would also represent a breach of the official MRL standards, with the prospects of product withdrawal or other penalties.
According to some analysts, the harmonization of MRLs and more stringent monitoring of such MRLs could endanger developing country exports by exposing them to high or higher levels of rejection or product (due to violative MRLs) or forcing them to cut back on needed pesticide uses to an extent that weakens the commercial viability of production. There is seen to be a risk that smaller and less well organized export industries would fail as they might be unable to put in place effective pest management programs and/or unable to set up the necessary systems for product traceability required by their EU buyers and, perhaps in the near future, by EU regulations. In addition, there is an expectation that smallholder growers would be marginalized because of the actual and perceived costs for exporters to provide the necessary training and to effectively oversee the production practices of large numbers of small growers. The fact that some lower cost, generic pesticides (frequently used by smallholders) are being withdrawn from approved use, further magnifies this concern.
The potential near- and longer-term effects of these pesticide regulatory measures will partly depend upon the actual patterns of enforcement of the regulations by Member State authorities and, through the ir own control systems, by private companies. In circumstances where the MRL is presently ‘open’ there is an expectation that these will not revert to limit of determination until 2005 or later (or be changed if an actual MRL is established). Still, some indication of the intensity and seriousness of MRL tolerance enforcement—at least by official agencies—can be gleamed from current practices.
Actual residue testing and enforcement
Directive 90/642/EEC stipulates that each EU Member State must implement a program to monitor pesticide residues in fresh produce and other foodstuffs. The actual procedures used and the scope of residue monitoring vary significantly from country to country. Some countries implement their residue monitor programs through a central governmental agency—for example, the Pesticide Safety Directorate (PSD) in the UK—while others have decentralized this function to state or regional authorities (i.e. in Germany). Some countries follow EU prescribed guidelines for product sampling, others use guidelines

From Challenge to Opportunity 16
established by CODEX and still others employ their own distinct approach.31 The pesticide residue programs of most EU countries involve the testing of several thousand samples of product, including selected fruits and vegetables, cereal products, livestock products, and processed foods. Most countries have a rolling program that involves annual changes in product foci yet giving special attention to products/pesticides identified as problematic in previous monitoring programs. Over time, enhanced analytical methods have enabled the detection of a wider range and lower levels of residues. On average, laboratories can now test for some 150 different pesticides.
Since 1996, the Commission has sought to bring convergence among the varied pesticide residue monitoring programs of Member States. Each year it issues instructions for the conduct of a Community-wide monitoring of important pesticide/crop combinations. For example, in 1999 the Community-wide program focused on cauliflower, peppers, wheat grains, and melons while in 2000 the program focused on rice, cucumbers, cabbage, and peas. Green beans were among the commodities included in the 2002-coordinated program. The results of these Community-wide tests are published. In addition, the EU’s Food and Veterinary Office has carried out missions to each Member State in order to gauge their compliance with EU guidelines, evaluate the effectiveness of their residue monitoring program and issue recommendations for improvement.
The Food and Veterinary Office reviews present a picture of widely varying practices. Interestingly, in most EU countries the monitoring of pesticide residues is for surveillance purposes only and not linked to direct actions to ensure enforcement. For example, in France, there is no procedure in place to evaluate the health risks caused by products whose MRLs have exceeded legal tolerances. Breaches of the law are typically followed up with communications to manufacturers or packers, simply to make them aware of their responsibilities. In Germany, the results of MRL monitoring tests are sent to the Commission but are not locally published. There are no standard procedures in place to assess health risks based on toxicological criteria. In most German states, pesticide residues are not considered a serious health hazard and no actions will be taken by authorities unless the legal MRL is exceeded by a huge amount. If the violative sample originated in another country a letter might be written to the pertinent embassy, requesting that action be taken in that country to avoid further infringement.
In the UK, the pesticide monitoring program is also not used for direct enforcement action (no seizures; no follow-up samples). Instead, the results of the program are published quarterly on the Pesticide Safety Directorate of the UK (PSD)’s website providing a powerful incentive for firms to take their own precautionary measures. The published results include a detailed analysis, explicitly mentioning the names of the brands, retail outlets, packers, country sources, etc. of individual samples. If there are apparent violations of MRL tolerances the affected companies are notified and they typically issue their comments (explanations; statements of actions taken) on the PSD website. In cases where an infringement concerns a product from another country, the official outcome is simply a letter issued by the PSD to the embassy of that country requesting action. The private action taken may be more severe, depending upon the supplier, the reason for the problem, and whether or not that supplier has been in violation of MRL tolerances before. Essentially, the UK policy of naming names provides a relatively powerful deterrent by affecting the reputations of individual retailers and thus leading the latter to carefully monitor their suppliers and crackdown on those suppliers who cannot meet their standards. This process has led several
31 Some countries extend their sampling throughout the entire year while others focus their efforts during periods of the year when pesticide use is greatest in Europe.
Regulatory and Governance Context: EU, Member State, and Private Measures
17
of the UK’s major supermarkets to put in place strict requirements for their suppliers—whether local growers or importer/distributors—to carry and document MRL tests, plus to carry out MRL tests of their own.32
A few EU countries appear to have built at least some element of enforcement into their pesticide monitoring programs. For example, Dutch authorities may issue a fine when the measured pesticide residue is twice or more the tolerated level. In special cases, it may seize produce consignments although this is exceedingly rare given that it typically takes two weeks to obtain the results of sample tests and the violative product has already been sold or consumed. In Denmark, importers of a violative product are issued a written warning and, in rare circumstances, subjected to a fine.33 Sweden’s enforcement program appears to exercise a bit more leverage. When an imported product is deemed to have exceeded the MRL, the specific exporting company is placed on a probationary ‘black list’. Its subsequent shipment will be stopped and analyzed with the importer paying for the costs of the test. That exporter must pass residue tests on five consecutive consignments in order to be removed from the black list. Violative consignments may be returned to the exporting country, although there are no procedures in place to prevent the marketing of that product elsewhere within the Community.
Hence, based on current regulatory arrangements, the circumstances where produce that is imported into the EU and is either detained, withdrawn from the market, or subjected to a fine because of violative MRLs would appear to be exceedingly rare. According to FVO mission analyses, products with excessive MRLs or detected residues for non-approved pesticide uses are rarely subjected to any formal enforcement mechanism. Except in very rare circumstances—such as a repeated violation of MRL tolerances by a particular country/supplier, where there are also concerns about possible consumer health implications—does it appear that third country suppliers presently run the risk of product detention and restricted or withdrawn market access. For Kenya’s major markets, the primary concern would not appear to be the risk and cost of official product detention or rejection but the cost associated with a failure to comply with private company requirements for testing and for results (see box 1 on pesticide residue test results).
Phytosanitary Measures
Other pertinent EU regulatory changes are taking place that may also influence the operating environment for third country fresh produce suppliers. One area relates to phytosanitary inspection. Over the years, each member state has developed its own arrangements for phytosanitary inspection and imposed different requirements for certificates, plant quarantine, etc. At the Community level, some convergence has occurred with the determination of a number of ‘notifiable’ pests and diseases and a system for rapid alert communications among member state agencies.
Box 1 Pesticide residue testing results
For the year 2000, the Community tested about 45,000 samples of fruit, vegetables, and cereals. Some 61 percent of samples found no pesticide residues at all, 35 percent found residues at or below the national or EU MRL, and
32 For example, Marks and Spencer carries out its own MRL tests and posts the results on a monthly basis on its website. Consumer advocacy groups closely monitor the efforts of UK supermarkets with regard to their pesticide policies. See, for example, the 2002 report by Friends of the Earth. 33 The FVO surmises that a fine is issued only once every two years.

From Challenge to Opportunity 18
just over 4 percent found residues above permitted levels or residues of chemicals for non-approved uses. The latter figure is up from about three percent for the 1996 round of programs, although since 1996, sampling has become more targeted and analytical capabilities have been enhanced. In the special Community-wide coordinated program some 3700 samples were taken of rice, cucumbers, cabbage, and peas. About 80 percent of the samples had no residues. Seventeen percent had residues below national or EU MRLs. Violative MRLs were found in 2.7 percent of samples.
Other analysis of pesticide residue results is more pertinent to developing countries. For example, Buurma et al (2001) examined Dutch monitoring results for 1997 and 2000, giving special attention to produce from low and middle-income countries. They found that issues. § Overall, pesticide residue levels in fruit and vegetables imported into the Netherlands had increased over the
previous five years. § Among samples of all imported fruits and nuts, those that equaled or exceeded MRL tolerances rose from 5
percent in 1997 to 10 percent in 2000. Among developing countries, these shares were higher at 11 percent and 16 percent, respectively.
§ Among developing countries, roughly the same countries have the same problems in the two different sample years—i.e., Egypt (strawberries), India (grapes), Indonesia (other fruit), and South Africa (grapes, pears, and oranges ).
§ Comparatively fewer problems were found in relation to vegetables, although a relatively high proportion of samples taken in 2000 of vegetables from Thailand (peppers, cabbage, okra), Turkey (peppers), and Egypt had MRLs exceeding legislated levels. The small samples did not identify any specific problems from sub-Saharan African vegetable exporters.
Very importantly, most of the problems identified could not be attributed to adjustments that have been made in European or Dutch MRL tolerances since 1997. Rather they hypothesize that the main developments are happening on the supply side. Possible changes have been increases in spray frequency or non-compliance with pre-harvest intervals or the results may be a symptom of increasing pressures of diseases and pests or reduced effectiveness of certain pesticides
As noted earlier, the UK government publishes the results of this pesticide residue surveillance program. This program is looking for samples exceeding EC, UK, or CODEX MRLs; evidence of a UK non-approved use; or other selected cases where there may be a consumer intake concern. Important components of Kenya’s trade have received relatively little attention over the years. For example, before 2002, French beans were last sampled in 1993 and runner beans in 1994. As these tests revealed minimal concerns, especially health concerns, these crops were not included in subsequent annual programs. Aubergines were sampled every few years; they were included in the 1998 sample and again in 2002.
Published reports summarize the results for the January-June 2002 tests for green beans, where thirty-six samples taken and tested for 100 pesticide residues. Of those samples, three cases violated established MRLs (two from Egypt and one from Spain), each involving very low residues of chemicals deemed not to be of concern to human health, yet still in excess of EU MRL tolerances. No problems were detected in samples from Kenya. The January-June 2002 testing of aubergines found no traces of any residues in twenty-two samples. The UK testing program for 2003 will again include aubergine but no other product of importance to Kenya’s trade.
Source: Annual EU-wide Pesticide Residues Monitoring Reports, various years and UK Pesticide Residues Committee quarterly Pesticide Residues Monitoring Reports, various issues.
In an effort to harmonize and strengthen protective measures against the introduction of organisms harmful to plants or plant products, Council Directive 2000/29/EC was issued and subsequently amended in 2001. It lays out responsibilities of member states to ensure that harmful pests/diseases are not introduced into or spread within the Community. It sets out the Community plant health regime,

Regulatory and Governance Context: EU, Member State, and Private Measures
19
specifying the phytosanitary conditions, procedures, and formalities to which plants and plant products will be subjected. It requires that product consignments from third country suppliers have phytosanitary certificates. The directive implies that all or most consignments of plants and plant products, including fruits and vegetables, would be inspected at or about the port of entry. The primary exemption would be from ‘approved sources’ whose phytosanitary inspectorates have been accredited or otherwise approved by EU authorities.34
Given the volumes of product and multiple points of entry into the Community such (nearly) full phytosanitary inspection does not appear to be feasible or would entail significant delays in the clearance of imported produce. The latter would result in high rates of produce wastage and reduced consumer satisfaction. The directive provides for additional funding to increase phytosanitary inspectorate capacities, yet, in practice, it still seems unlikely that more than a limited sampling inspection could take place, perhaps with different risks assigned to different types of imported plants and produce. This directive is of concern to developing countries as is not clear how it will be implemented by individual member states given capacity limitations and other priorities. After some delay, the directive entered into force on January 1, 2003.
Conformity to Quality Standards
A parallel regulatory measure makes changes in the scope and procedures for inspection of fruits and vegetables to ensure that they conform to established marketing standards. At present, the EU has formal quality standards for some forty fruits and vegetables.35 These provide for different grades or classes of produce and relate to the size, shape, color and other features or dimensions of the produce. Commission Regulation 1148/2001 (amended by 2379/2001) serves to repeal a 1992 quality inspection regulation. The new regulation requires the designation of ‘competent bodies’ for produce inspection and lays down requirements for inspection for the internal market, for exports, and for imported produce. With regard to the latter, the regulation specifies that official inspection bodies will ‘carry out a conformity check for each imported lot’ and issue a certificate of conformity. At the request of a Third Country, the Commission may approve conformity checking operations of an official agency there. Even where the conformity check would be performed in the exporting country, the regulation calls for Member State inspection agencies to still carry out checks ‘on a significant proportion of the consignments and quantities imported’.36 The Regulation seeks to harmonize quality inspection arrangements.
This regulation went into affect in 2002, although the particular article dealing with Third Country inspections and certification was derogated to March 31, 2003. It is desirable to harmonize the quality inspection arrangements. However, as with the phytosanitary measure, the capacity for its full implementation is doubtful. It is not clear how the Regulation—and presumably the enhanced inspection capacities that may emerge at the Member State level—will affect exports from developing countries.
34 At present, only two countries—Hungary and Switzerland—have such status. 35 Several of these are prominent in Kenya’s fresh produce trade, including beans, peas, aubergines, and avocado. There are not formal EU quality standards for most speciality and so-called ‘exotic’ vegetables that also feature significantly in Kenya’s trade. 36 Thus far, official agencies in the following countries have been recognized as ‘competent authorities’—Switzerland, Hungary, South Africa, Slovakia, Czech Republic, Cyprus and Morocco. An application needs to be submitted to gain such recognition with the Commission having an internal checklist of criteria.

From Challenge to Opportunity 20
Third Country suppliers are unlikely to knowingly send sub-grade produce to the EU given the transport cost involved and the likelihood of price/payment reductions by their buyers. 37 The private sector is usually a better judge regarding the marketability of fresh produce in different segments of the market.
‘Good Agricultural Practices’
Several Council Regulations (i.e. 2078/92, 2200/96, and 1257/1999) refer to the need for farmers (or fruit and vegetable growers) to take better account of environmental concerns. However, the adoption of ‘good agricultural practices’ is yet to become part of any compulsory requirement in EU law or that of any individual Member State.
Nevertheless, within the private sector there is a growing recognition that consumers have become increasingly concerned about the ‘sustainability’ of the food supply system and especially the technologies used in primary agricultural production. This has manifested itself in a burgeoning organics movement within the Community as well as private sector efforts to develop, implement and enforce various ‘codes of practice’ for proper management of natural resources and environmental risks.38
Previous mention was made of the development of the Assured Produce Scheme in the UK, an increasing component of which has been environmental management practices. While this scheme was raising the profile for ‘good agricultural practices’ within the UK, the UK supermarkets were cognizant of the fact that a comparatively large proportion of their produce offerings consist of imported fruits and vegetables. As a result, several UK supermarkets were among the leading proponents for developing a ‘European standard’ for ‘good agricultural practices’ and promoting integrated crop management. In 1997, a Euro-Retailer Working Group on Fresh Produce Group was formed and by 1999, they had established a set of protocols for the application of GAP. The EUREPGAP includes requirements in relation to site management, varieties and rootstocks, soil management, fertilizer usage, irrigation, crop protection and waste and pollution management. The protocol also includes stipulations with regard to worker health and welfare39 and wildlife conservation.
Inspections for this collective industry standard began in 2000, with inspections and certifications being done by independent EUREP-approved agencies. Of the twenty-six certification bodies accredited against the EUREPGAP standard for fruits and vegetables, all but two are based in developed countries. The pace of grower certification has been uneven. Some supermarkets have indicated that they are requiring all their suppliers to be EUREPGAP certified by the end of 2003. Others have specified a longer time horizon, spanning into 2004 or 2005.
37 Some consignments may experience quality deterioration in transit, yet this is normally managed by the private sector by destroying the produce, donating supplies to hospitals/charities, and/or issuing quality claims against the supplier. 38 We do not deal specifically in this paper with the evolving EU regulations for organic foods as this remains an extremely small dimension of Kenya’s fresh produce trade. Organic standards have been set at the EU level (Regulation 2092/91 supplemented by 1804/99) yet are implemented and enforced at the Member State level. Regulation 1788/2001 lays down detailed rules for the inspection of organic food imports from Third Countries. As with the phytosanitary and conformity check regulations, there are apparent advantages of having a national agency approved as a ‘competent authority’ to certify compliance with the standards for organic foods. 39 A parallel effort has been undertaken to promote ‘ethical trading’ practices, with particular emphasis on the welfare of farm and packhouse workers in developing countries. Religious groups, NGOs, and supermarket companies have been involved in the drafting of ethical trade ‘codes of practice’.
Regulatory and Governance Context: EU, Member State, and Private Measures
21
The Comparative “Regimes” Facing Kenyan Fresh Produce Exporters
Kenya channels virtually all of its fresh vegetable exports to Western Europe, with very small quantities also sent to Australia/New Zealand, South Africa, and Dubai. While the EU is the dominant market for Kenyan exporters, it—despite on-going trends—is most certainly not a single monolithic market, in terms of either consumer tastes or the regulatory and wider governance systems in place for fresh produce. In fact, there is rather wide variation in the intensity and specificity of the food safety, environmental, quality, and other standards required of Kenyan supplier/exporters across different countries in Europe and even among different segments of the same national markets. This is a reflection of different market structures, national laws, business cultures, and the preferences of consumers.
This variability is summarized in table 3 below. It is based primarily on information provided by Kenyan exporters and attempts to portray the current actual situation—as being implemented by public and private practice—rather than being dictated by formal rules and regulations. Of the array of governing standards, the only official standards that presently affect the trade relate to the requirement for a phytosanitary certificate and the compliance with MRL tolerances (and hence the use of only approved pesticides). No exporter expressed concern about the EU conformity checks for quality standards, essentially because it would be unadvisable for any Kenyan exporter to knowingly send a consignment of low quality produce to Europe given the high out of pocket costs for air-freight and the likelihood of incurring the indignation of (or quality claims from) their buyers. Breakdowns in logistics and the cold chain do periodically occur and are costly to exporters but that is primarily because of private price discounts or private disposals and only very rarely due to official detentions.
Phytosanitary certificates are needed for most vegetables and most countries to which Kenya exports, the main exception being supplies of certain Asian vegetables into the UK. Exporters report that phytosanitary papers are generally checked at European ports of entry. With the large volumes of commodities being imported from around the world, only very small sample checks can be made, perhaps with inspectors focusing attention on products and sources for which there have been previous problems or for which there is a Community-wide alert.
In recent years, the actual detentions/rejections of Kenyan produce—by official inspection agencies—because of phytosanitary problems has been very rare. For example, in 2000 official inspectors intercepted only ten consignments, setting aside and eventually destroying generally small quantities of produce. The total quantity of product destroyed was 5.3 tons, which had a total C&F value of about $15,000. In all of 2001, only two Kenyan consignments were intercepted, both with small amounts of product destroyed, with a C&F value of only $1000. These limited detentions occurred on a Kenyan trade to Europe which involves thousands of consignments and a C&F value of nearly $100 million per year.40
In the first half of 2002, some more recurrent problems arose, most especially in relation to the emergence of caterpillar in snow peas, which is dormant when the product is held at a low temperature (i.e. in cold storage). This problem was identified by both British and Dutch authorities, who presumably intensified their inspections. In the first six months of 2002, some 34 Kenyan consignments were detained, of which 29 were for snow peas and five were for French beans. Many of the individual detentions were of small quantities although eleven were for one ton or more of produce. The aggregated C&F value was $87,000.
40 The data on official detentions/rejections was provided by KEPHIS.

From Challenge to Opportunity 22
While this is not inconsequential, one must consider that the total quantity of produce detained and destroyed was less than 27 tons during a period in which Kenya exported just under 20,000 tons of vegetables, implying an official rejection rate of 0.13 percent.41 In contrast, exporters indicate that in the course of an export season private customers identify quality-related problems on perhaps 0.5–0.75 percent of the volume of supply, requiring either diverting the product to less quality stringent customers or doing substantial grading out of saleable produce. The financial cost to exporters is many times greater for these private deductions (for quality-related problems) than for official detentions of product due to phytosanitary or any other problems.
Interestingly, between January 2000 and June 2002, the only official detentions of Kenyan products—46 consignments in total—occurred at entry points into the UK or Dutch markets.42 Not a single detention—on phytosanitary grounds—was made on produce directly entering the French, German, Belgian, or Scandinavian markets. This was especially unusual during the early part of 2002 when Dutch and British authorities were detaining snow pea consignments on a weekly if not daily basis. Snow peas—from many of the same production locations and exporters—was simultaneously entering the other continental European markets without any detentions occurring.43 Australian authorities detained consignments, yet it was determined that the caterpillar problem could be resolved through fumigation (the costs for which were charged to the importer), which did not necessitate the rejection and destruction of the product.
With regard to meeting established MRLs tole rances, we indicated earlier that official testing of Kenyan products is very rare due to an absence of any significant problems in the past and the fact that the types of vegetables which Kenya supplies are only infrequently included in the residue testing sampling programs of Member States or of the Community-wide program. In discussions with Kenyan exporters, very few instances of official detection of violative MRLs were noted and none of these were for vegetables. It is safe to say that most of the MRL testing on Kenyan produce is being done in the private sector, primarily by importers and retailers in the UK. One category manager indicated that in the course of a year they will send six to eight samples of produce from their Kenyan suppliers to accredited private labs in the UK for testing. When problems have been identified these have been traced to their source and rectified. Exporters report that while a growing number of their customers on the European continent have begun to ask questions about pesticides, these exporters are not aware of these clients subjecting their consignments to MRL tests.
An array of other measures that relate to food safety, environmental safety, or social concerns are also of greater or lesser importance in different markets. With regard to food safety, the main issues are the adoption of HACCP systems by supplier/exporters, the implementation of arrangements for product traceability, and the conduct of microbiological tests on products. To supply the UK’s leading
41 Most of the loss was incurred by larger exporters, for which the damage is rather small. Yet a few smaller companies were also affected. For very small exporters rejection of a 1.5 ton consignment with an C&F value of $5000-6000 would be a considerable loss, perhaps representing three to six months of (lost) profit. 42 This, according to KEPHIS data. 43 This implies that either little or no phytosanitary inspection of (at least) Kenyan produce is or was taking place in these continental markets (other than officials ensuring that the Kenyan phytosanitary certificate accompanied a consignment) or that officials in these countries have not regarded the snow pea caterpillar to be harmful to consumers (or local plants) and therefore did not detain the product even when the problem is detected. One exporter implies that the former is the case, suggesting that “on much of the continent, the authorities are interested in paperwork rather than results.”

Regulatory and Governance Context: EU, Member State, and Private Measures
23
supermarkets a supplier must have a HACCP program in place and must be able to demonstrate product traceability. These are essential elements of the BRC standard. Microbiological testing is part of the due diligence defense and supermarkets generally require importer/distributors to periodically have such tests done. For semi-processed prepared vegetable products microbiological tests must be done on samples from each and every consignment, with this usually being done both in Kenya and at private labs in the U.K. Firms supplying UK wholesale markets report that there is some market recognition of the value of HACCP and traceability, yet this is not essential to supplying these markets. None of these three (sets of) measures are currently recognized or required within the Asian vegetable supply network.
Exporters report that few if any of their continental European buyers require them to adopt formal HACCP programs, show clear evidence of traceability or, most especially, have their product subjected to microbiological testing. In the view of most exporters, having such systems in place has not and does not currently open additional doors for market access. One exception reported was the initial recognition of traceability by one or more important Dutch buyers. Exporters indicate that among their buyers in Germany it is considered necessary that they are working toward complying with EU quality and safety standards, but there is little or no attempt to go beyond this. In the experience of Kenyan exporters, buyers in New Zealand and Australia have been requesting that the exporter demonstrate a capacity for traceability and be moving toward an effective HACCP system.
Similar contrasting patterns are reported with regard to buyer requirements for measures related to environmental management and social welfare measures. While EUREPGAP is ostensibly a pan-European retailer initiative, only a few continental buyers are currently pressing their Kenyan suppliers to be certified soon while this is already an area of growing focus by the UK supermarkets.44 Relatively few growers are in fact certified yet one major UK supermarket wants all of its suppliers EUREPGAP certified by the end of 2003. Several Dutch and Scandinavian supermarket clients have indicated a time frame over which they would like to see their Kenyan suppliers EUREPGAP certified. There is a perception that French wholesalers and retailers are increasing their oversight of domestic producers—to ensure traceability and sustainable production practices, yet price remains the predominant consideration on imported produce. Some exceptions are emerging, however.45
44 Of the twenty-two retailer members of EUREP, nearly half are British or Dutch. Surprisingly, none of the French or German supermarket chains are members. 45 For example, Carrefour is the first French company to adopt EUREPGAP, although it is not formally a member of EUREP. Carrefour has a much more centralized system of produce procurement than do other French supermarket chains.

Table 3 Market destinations of Kenyan fresh vegetables and compliance requirements
Compliance Requirement
UK Supermarket
UK Wholesale for Euro Veg
UK Asian Veg France Holland
Germany/ Belgium/ Switz Scandinavia
New Zealand + Australia
Phytosanitary certificate
A A D1 A A A A A
MRL Tolerances B4 C1 C1 C1 B1 C1 B1 A4 HACCP Program D4 D2 D1 D1 D1 D1 D1 D3 Traceability D4 D2 D1 D1 D2 D1 D1 D3 Microbial Contamination Test
D2 D4 (HighCare) D1 D1 D1 D1 D1 D1 D2
GAP/Environmental Plan for Farms D2 (Soon D4?) D1 D1 D1 D2 D1 D2 D2
Social Welfare Upgrade Measures
D2 (Soon D4?) D1 D1 D1 D1 D1 D1 D2
Packaging specificity D4 D3 D2 D3 D3 D3 D3 D4 Supply continuity D4 D3 D3 D3 D3 D3 D3 D3 Product conformity D4 D3 D2 D3 D3 D3 D3 D3
SPS Restrictiveness Very High Medium Low Low Low Low Low High
Social/Envir. Value Medium Low Low Low Low Low Low Medium Share of Kenya’s Veg.Trade Volume
40% 13% 17% 14% 7% 8% <1% <1%
A: Legally mandated and strict enforcement (of paper trail) B: Legally mandated and spot/sample enforcement C: Legally mandated yet minimal enforcement D: Not legally mandated 4: Fully required for commercial purposes 3: Mostly required for commercial purposes (although relaxed at certain times) 2: Not required yet (somewhat) beneficial for commercial purposes 1: Not required and seemingly unnecessary for commercial purposes
24

Regulatory and Governance Context: EU, Member State, and Private Measures
25
Most exporters anticipate that there will be more demand for this from a wider range of supermarket clients in the near future, although such demand is not expected from clients who are servicing wholesale markets or the catering trade. This dimension is also not presently nor prospectively a factor in the UK ethnic vegetable market. Social welfare concerns have recently found their way onto the radar screens of UK supermarkets, due to pressures from social and religious groups. Some of these firms may soon require their major suppliers to formally attest to certain measures and/or be audited according to the criteria of the Ethical Trading Initiative. Exporters have seen no indication that similar requests will come soon from other European market customers.
In comparison with the above dimensions, there is much less variation among the different market channels in terms of their product quality and packaging standards and their demands for continuity of supply. The UK supermarkets (together with some up-market catering clients in that market) are again the strictest on their requirements, with there being greater flexibility shown by other buyers, both within the UK and on the European continent. There is substantially more flexibility on product quality when servicing some continental wholesale markets, especially under circumstances when supply is relatively short.
The last row in the table subdivides Kenya’s current trade by country or market segment. The UK supermarkets—with their very strict SPS requirements and increasingly stringent environmental and/or social welfare requirements—presently account for 40 percent of the volume and just under half of the total value of the fresh produce trade. This share has been increasing in recent years. Another 13 percent of current trade is channeled through the UK wholesale markets—mostly for the catering trade—where there is some recognition of HACCP and traceability systems. Most of the remainder of Kenya’s fresh vegetable trade is governed by considerably less stringent regimes for both SPS management and environmental/social welfare measures. There are, of course, some exceptions to this pattern with particular buyers on the continent being more stringent on SPS and/or environmental management matters than their competitors.
The picture that emerges is one of increasingly tight EU (and member state) regulations on paper, yet much greater flexibility in (or a lag in capacity for) official implementation and enforcement of these SPS and other standards. There is an on-going process to put in place harmonized requirements and codes, yet the application is occurring at different speeds and depths. The evolving changes in legislation are stimulating changes in private standards and governance structures, although additional factors—including changing consumer perceptions and demand and competitive pressures for differentiation—may be of equal or greater importance (see figure 3 below which illustrates the
Figure 3 Diverse standards in the “single market”
Local Customs and Consumer
Preferences
Laws and Regulations
Private Sector
Competitive Strategies
Enforcement Capacity
Standards as applied
Source: Author

From Challenge to Opportunity 26
interaction of these various factors). In fact, variations in private standards currently dominate the landscape for Kenyan fresh produce exporters as illustrated by the varied ‘rules of the game’ among different market segments even in the same country (i.e., UK).
Because many of the prevailing standards are ‘demand driven’, this regulatory landscape is fluid and subject to potentially short-term changes. There is some expectation that demands among continental clients will become more stringent in the coming years, although price-based competition should still remain paramount in some of these markets.
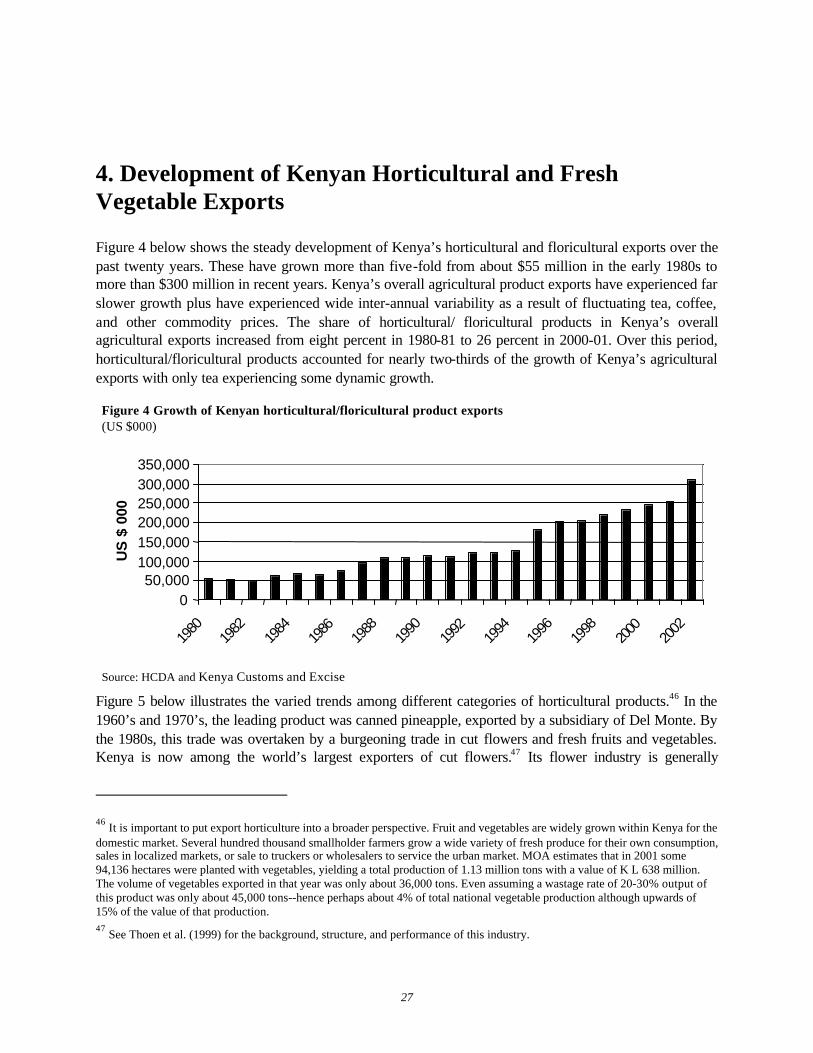
27
4. Development of Kenyan Horticultural and Fresh Vegetable Exports
Figure 4 below shows the steady development of Kenya’s horticultural and floricultural exports over the past twenty years. These have grown more than five-fold from about $55 million in the early 1980s to more than $300 million in recent years. Kenya’s overall agricultural product exports have experienced far slower growth plus have experienced wide inter-annual variability as a result of fluctuating tea, coffee, and other commodity prices. The share of horticultural/ floricultural products in Kenya’s overall agricultural exports increased from eight percent in 1980-81 to 26 percent in 2000-01. Over this period, horticultural/floricultural products accounted for nearly two-thirds of the growth of Kenya’s agricultural exports with only tea experiencing some dynamic growth.
Figure 4 Growth of Kenyan horticultural/floricultural product exports (US $000)
050,000
100,000150,000200,000250,000300,000350,000
1980
1982
1984
1986
1988
1990
1992
1994
1996
1998
2000
2002
US
$ 0
00
Source: HCDA and Kenya Customs and Excise
Figure 5 below illustrates the varied trends among different categories of horticultural products.46 In the 1960’s and 1970’s, the leading product was canned pineapple, exported by a subsidiary of Del Monte. By the 1980s, this trade was overtaken by a burgeoning trade in cut flowers and fresh fruits and vegetables. Kenya is now among the world’s largest exporters of cut flowers.47 Its flower industry is generally
46 It is important to put export horticulture into a broader perspective. Fruit and vegetables are widely grown within Kenya for the domestic market. Several hundred thousand smallholder farmers grow a wide variety of fresh produce for their own consumption, sales in localized markets, or sale to truckers or wholesalers to service the urban market. MOA estimates that in 2001 some 94,136 hectares were planted with vegetables, yielding a total production of 1.13 million tons with a value of K L 638 million. The volume of vegetables exported in that year was only about 36,000 tons. Even assuming a wastage rate of 20-30% output of this product was only about 45,000 tons--hence perhaps about 4% of total national vegetable production although upwards of 15% of the value of that production. 47 See Thoen et al. (1999) for the background, structure, and performance of this industry.

From Challenge to Opportunity 28
regarded as being very competitive, quick to adopt new products, and operating on the ‘cutting edge’ through its implementation of a relatively strict environmental and social code of practice. This code was adopted in response to parallel movements within European cut flower industries and increased scrutiny from domestic and international NGOs. Developments in flowers are relevant to our particular focus since several of the leading fresh produce exporters have also invested in flowers and the code of practice developed by the Kenya Flower Council has had an important bearing on the development of similar guidelines for the fresh produce industry.
Figure 5 Kenya horticultural/floricultural exports by product category
0
20,000
40,000
60,000
80,000
100,000
120,000
140,000
1980 1981 1982 1983 1984 1985 1986 1987 1988 1989 1990 1991 1992 1993 1994 1995 1996 1997 1998 1999 2000 2001 2002
($00
0)
Cut Flowers
Fresh Fruit & Vegetables
Processed Pineapple Products
Source: HCDA and Kenya Customs and Excise
The other category in the graph consists of a broad range of fresh fruits and vegetables, although fresh vegetables dominate export sales from this category. Kenya has generally failed to take advantage of the expanding market for tropical and sub-tropical fruits in the European and Middle Eastern markets. Kenya was a very early entrant into the European avocado and mango market plus developed a small trade in passion fruit and in large top-grade pineapples. However, the Kenyan industry took many years to develop logistical arrangements for sea freighting of the fruit, was unable to match demand for particular varieties of fruit (i.e., in the case of mango) and generally did not build up a volume of reliable supply to challenge the market leaders. For fresh fruit, Kenya essentially has remained a secondary supplier, filling seasonal gaps from more preferred international suppliers.48 The volume and value of trade of Kenya’s fresh fruit trade has fluctuated over time, although in the past two years a few exporters have developed a larger trade in sea-freighted avocadoes shipped to Marseille s for distribution in France and neighboring countries. For pineapples, Kenya has been at a large competitive disadvantage for logistical reasons with
48 For purposes of this paper it is important to note that the uneven yet generally unsatisfactory performance of Kenya’s fresh fruit trade has had little or nothing to do with difficulties in complying with international SPS standards. Instead, there has been inadequate investment in commercial and smallholder production and problems in developing adequate logistical arrangements for cost-effective sea shipments. The quality of Kenya’s mango and avocado have been considered to be inferior in their main market outlets, with Kenyan avocado generally receiving discounted prices from the other leading suppliers and with most Kenyan mangoes—which are exported to Dubai—being primarily squeezed for juice rather than being sold and consumed as a fresh fruit.

Development of Kenyan Horticultural and Fresh Vegetable Exports
29
its sea shipments to Europe taking three weeks compared with shipments from Cote d’Ivoire taking only a few days.
Kenya’s fresh vegetable trade dates to the mid-to-late 1950s when small quantities of temperate vegetables were supplied in the European winter ‘off-season’ to up-market department stores in London.49 This off-season trade continued and was later joined by year-round supplies of high-quality green beans and by a broad array of vegetables that comprised part of the traditional diets of the UK immigrant population from South Asia.50 The off season trade in peppers, courgettes, and similar produce subsided in the face of competition from Mediterranean countries—whose transport costs were considerably lower—and from glasshouse production in Holland and elsewhere. Green beans and Asian vegetables then formed the core of the trade. The French bean trade primarily focused on the UK and France, although large quantities were also regularly sent to Belgium, Holland, Germany, and elsewhere. The large majority of product was shipped (‘loose’) in two-kilogram boxes for sale through wholesale markets or to distributor/caterers. A very small proportion of bean sales—perhaps no more than 10 percent—were being made directly to major supermarket chains in the late 1980s.
The Asian vegetable trade was predominantly to the UK. Kenya was the primary supplier to this specialized market because of its ability to provide the required wide range of vegetables on a year-round basis and established business connections within the trade, including through family-run businesses in both Kenya and the UK. The Asian vegetable trade involved the shipment of cartons of produce and its subsequent movement from wholesale markets to small shopkeepers with the produce sold at retail essentially in the same carton in which it was packed on Kenyan (smallholder) farms. Most of Kenya’s fresh vegetable trade was carried out on a consignment rather than fixed price basis with the importer/wholesaler obtaining a commission on sales.
Figure 6 highlights the recent growth trends for Kenya’s fresh vegetable export trade. During the first half of the 1990s there occurred only very limited growth in export volumes, although the value of exports climbed with the introduction of several new products and with a growing proportion of product being pre-packed for supermarket sales.51 These new products (especially runner beans and snow and snap peas) drove growth in the trade in the mid-1990s, yet this growth was interrupted by two years of drought or other adverse climatic conditions.52 The volume of trade subsequently increased sharply, although adverse price movements for some commodities (see below) and adverse currency movements (especially the decline of major European currencies against the US dollar) undercut profitability.53
49 The early and subsequent history of this trade is summarized in Jaffee (1995). 50 This trade involved okra, karella, curry leaves, special varieties of aubergines, a wide variety of chillies and some two dozen other types of vegetables. Reliable statistical information for European imports for many of these vegetables is not available as often these products are not individually classified and labeled under ‘other’ categories. For years, market analysts would use Kenyan exports as a proxy for this market given that countries dominant share of this trade. 51 Basic economic factors are driving the geography of vegetable handling and packing operations. Previously, produce entered the UK in cartons and was then selected out and put into consumer punnets by UK firms. The rising demand for these products and the rising cost of labor within the UK has rendered this uneconomical. While the typical packhouse worker in the UK is earning $6-8 per hour those in Kenya earn $2 to 2.50 per day. 52 Runner beans are a traditional vegetable in the UK but were locally available only on a seasonal basis. Guatemala and Zimbabwe pioneered the trade of mangetout peas into the UK. 53 For the most part, air-freight charges are denominated and paid in US dollars.

From Challenge to Opportunity 30
Although 2001 brought a temporary reversal of the volume expansion, in both 2002 and 2003 the industry recorded its highest volumes of trade ever. Even more dramatic has been the increase in the FOB value of the trade over the past few years. Driving this accelerated value growth has been the emergence of semi-processed ‘high-care’ products as a major component of Kenya’s trade. This consists of a broad range of products, including mixed salads, assortments of cut vegetables for dips, vegetable kabobs, stir-fry, and other mixes, all produced under very severe hygienic conditions.54 With the significant shifts in the product mix of Kenya’s trade and the growing extent of value-adding processing and packaging, the average FOB unit value for this trade has more than tripled from just under $1000 per ton in the early 1990s to over $3000 per ton in recent years.55
Figure 6 Recent growth in Kenyan fresh vegetable exports
20
25
30
35
40
45
50
1991
1992
1993
1994
1995
1996
1997
1998
1999
2000
2001
2002
2003
(000
Ton
s)
0
25
50
75
100
125
150
(US
$ M
illio
ns,
FO
B)
Volume Value
Source: HCDA modified by Author
It should be emphasized that the accelerated growth in Kenya’s trade—especially in the value of exports—has occurred precisely during a period—since the mid-1990s—when external market and regulatory requirements have been becoming more demanding. Significant elements of the Kenyan industry have transformed themselves to meet the standards-related challenges (see section five for the details on this) and indeed, to use such standards as an opportunity to re-position themselves in the market. One could even argue that the high standards required by the UK supermarkets—together with
54 One Kenyan firm entered this business as early as 1995, yet there are now at least six companies which have the proper packhouse and other operating conditions to effectively compete in this high-end market. 55 It is important to note that there are some apparent problems in the quality of trade data being released by the Horticultural Crops Development Authority (HCDA). This has especially applied to the past couple of years when a burst of new product development has overtaken the HCDA’s (hand-recorded) classification and tabulation system. In some years, processed vegetables were included in the published fresh produce data as was the mild narcotic miraa. Some serious problems are apparent in recorded export values for certain crops. The graphs and tables presented here reflect certain modifications made by the author based upon available data and (export price) information provided by exporters.

Development of Kenyan Horticultural and Fresh Vegetable Exports
31
the product innovations that such firms have spurred in recent years—has provided a life-line to Kenya’s leading exporters.
In recent years, the sale of loose produce (packed in cartons) has become increasingly unprofitable—at least for the larger companies with higher overhead costs—in the face of increased competition and movements in general (including wholesale) market prices within Europe. Increased supply from Egypt and Morocco ate into Kenya’s market share for beans on the continent and generally put downward pressures on prices (see figure 7 below). Trade in many varieties of Asian vegetables—in loose form—has likewise become marginally profitable in recent years due to increased competition from an array of international sources, some of which facing substantially lower air-freight costs.56 Hence, the competitive threats to the Kenyan industry have not come due to higher standards in the market, but primarily due to greater competition in the bulk produce trade and in those segments of the market which place greater emphasis on prices and comparatively less on product innovation, value-added or compliance with strict SPS or other standards.57
Figure 7 Average unit values for green bean imports (US$/Kg)
0.75
1
1.25
1.5
1.75
2
2.25
2.5
2.75
1990 1991 1992 1993 1994 1995 1996 1997 1998 1999 2000 20010.75
1
1.25
1.5
1.75
2
2.25
2.5
2.75
1990 1991 1992 1993 1994 1995 1996 1997 1998 1999 2000 2001
UK France HollandUK France Holland
Source: FAO Tradestat
While the profitability of trade in bulk produce has sharply declined, firms which have been able to add value, via consumer packing of cut, sliced and otherwise modified vegetables or vegetable combinations have been able to maintain profitability even in the face of overall compressed margins within the wider fresh produce distribution chain. Hence, despite growing competition in the wider green bean market, Kenyan firms have still been able to maintain some margin of profit on the sale of ‘topped and tailed’ pre-packed fine, extra-fine, and bobby beans, especially to the U.K. supermarket segment. The trade in sliced
56 Certain ethnic specialty vegetables, including okra and chillies have become maintain products, available in many UK supermarkets. There is thus a possibility for increased demand for pre-packed forms of these products in the future. 57 According to Eurostat data, Kenya’s share of France’s green bean imports fell from 17.3% in 1992 to 6.7% in 2002. Virtually all of the growth of these imports was accounted for by Morocco whose market share rose from 11.5% to 43.9%.

From Challenge to Opportunity 32
and prepared runner beans has also remained profitable. Kenya’s trade in peas has also expanded—even with some competitive pressures—and a significant new trade in podded garden peas—has emerged. Some of the runner bean and podded pea consumer product is now being prepared under ‘high care’ packing and supply chain conditions within Kenya.
Table 4 Competitors and comparative freight costs Kenya Freight Costs = $1.50-1.60/kg
Product Category Main International Competition Comparative Freight Costs
Green Beans Morocco, Egypt, Senegal, Zambia
Morocco $0.15-0.30/kg Egypt $0.75/kg (air) $0.20/kg (sea) Senegal $0.60-0.75/kg. Zambia $1.60/kg.
Asian Vegetables Ghana, Dominican Republic, India, Uganda Ghana $0.60/kg. Dom. Republic $0.60-$1.00/kg. India $1.50/kg.
Source: Kenya Exporter Interviews
The trade in ‘high care’ products more generally is now a major driver in the business plans of most of the leading exporters. This trade involves relatively high value-added and a means to by-pass the wider price and margin pressures within the industry. For some firms this is the primary source of profit yet they need to continue the volume trade in beans and other legumes in order to cover their overheads and best manage their airfreight arrangements.
The retail prices for some semi-processed and high care products are remarkably high, reflecting the value that some consumers put on convenience. Many of these products are sold in small bags containing between 190 and 300 grams of product. In one central London supermarket visited in November 2002, the cost of Kenyan products converted into US$ per kg. were shelled garden peas ($15.58), sliced runner beans ($12.55), and premium vegetable stir fry ($11.47). Supermarket gross margins for such products are on the order of 30-45 percent. By comparison, unsliced runner beans were selling for the equivalent of $7.07/kg, and imported bobby beans were selling for the equivalent of $5.38/kg. Supermarket gross margins on such products are in the order of 20-25%.
Table 6 below provides an overview of the varied trends in exports of different fresh vegetable products and categories over the past decade. Note especially, the rapid development of the trade in (podded) garden peas and in high-care prepared vegetable products over the past four years. This trade did not exist in 1997, but in 2002, exports of these products accounted for about 15 percent of the volume and approximately one-third of the total fresh vegetable export trade. As will be highlighted further below, these products are associated with the most demanding food safety management standards within the trade. In sharp contrast, Kenya’s trade in ‘Asian’ and other ethnic specialty vegetables leveled off in the 1990s and was lower (in volume terms) in 2001 and 2002 than it has been for more than fifteen years.

Development of Kenyan Horticultural and Fresh Vegetable Exports
33
With its shift in product mix and market segment focus, Kenya’s fresh vegetable trade is now more oriented to the UK market than it was ten or fifteen years ago.58 For example, during the 1998-90 period, the UK was the destination for about 55 percent of Kenya’s vegetable trade. In recent years, this share has increased to over 70 percent. The UK has accounted for virtually all of the expansion of Kenya’s vegetable trade over the past decade.59 Kenya’s trade is essentially gravitating in the direction of markets where clients and consumers are prepared to pay a premium for increased value-added and consumer convenience. In markets (or market segments) where price is the primary focus and competitive criteria, the Kenyan trade is dissipating.
Table 6 Export volumes of selected fresh vegetables from Kenya (tons)
Green Beans Peas ‘Asian’ and Other Ethnic
Specialty Vegetables
Year French Beans
Runner Beans
Snow Peas
Snap Peas
Garden Peas
High Care Prepared Okra Chilies
All Other Specialty
1991 15,306 0 0 0 0 1688 2905 4636 1992 16,097 0 0 0 0 1573 2399 5534 1993 15,507 0 284 0 0 0 2076 2182 4810 1994 14,446 429 1723 0 0 0 2287 2019 4317 1995 14,931 1819 2074 556 0 0 1898 1536 4281 1996 16,431 2179 3000 904 0 0 2048 1881 4904 1997 14,319 1519 3707 571 0 0 2641 1605 5094 1998 14,476 2215 2636 725 9 90 2146 1718 4605 1999 19,097 2952 2357 1237 828 337 2757 1372 4913 2000 18,980* 3849 2334 1230 1780 836 2603 1242 4221 2001 15,407 4018 1876 1253 1123 2716 2281 817 3651 2002 19,055 4328 2425 1275 1916 4709 2382 938 4027
Source: HCDA
Kenya’s historical source of comparative advantage has been its capacity to produce high quality produce on a year-round basis. Its main competitors had more seasonally restricted supply patterns and/or were not providing a product with consistent quality. A range of competitors has recently closed the seasonality advantage and there is a perception in the market that some competitors have come to match or even exceed Kenyan quality for several products. Nevertheless, the Kenyan industry continues to adjust and to grow. It is somewhat ironic that a relatively low income and low wage country such as Kenya now finds
58 In contrast, most of Kenya’s trade in fresh fruit is not directed to the UK market. Most avocadoes are shipped to Marsailles for sale in France or Germany. Most mangoes are sent to Dubai for distribution there and in other Persian Gulf countries. 59 Official statistics are not yet available for market destinations in 2002, yet based on recent trends it is likely that the volume of vegetable exports to countries other than the UK was somewhat lower in 2002 then it was a decade ago.
Table 5 Illustrative net profit margins for medium/larger Kenyan exporters
Product Typical Net
Profit Fine Beans, loose in carton 0-2% Okra, loose in carton 2-4% Mangetout in 300 gm bag 4-6% Extra Fine Beans, top/tail in 200 gm tray 4-6% Garden Peas, podded in 200 gm bag 6-8% Runner Beans, sliced in 335 gm bag 10-12% Stir Fry Mix, High Care, 300 gm tray 12-14%
Source: Kenya Exporter Interviews

From Challenge to Opportunity 34
its competitive advantage in the most sophisticated segments of the European fresh vegetable market. Kenya’s trade is increasingly gravitating precisely to those segments in the market that are most demanding in terms of SPS and other standards. Its future growth will depend upon its ability to maintain those standards, the pace of growth in this market segment within the UK and the extent to which demand for value-added and, indeed, ‘high-care’ chilled vegetable consumer products can be fostered in other European markets.
Rather than posing an imminent threat to the maintenance of Kenya’s fresh vegetable trade, the ratcheting up of standards—led by private sector approaches among European firms—has actually provided a life-line to the Kenyan industry at a time of increased competition and relatively flat demand for the earlier generation of specialty vegetables for which Kenya was one of the leading suppliers. Several of Kenya’s main competitors seem, in recent years, to have scaled the logistical and quality control barriers to become reliable suppliers of specialty vegetables. Yet, elements of the Kenyan industry have moved to the next phase of business development—one that entails seemingly significant financial and technical barriers to entry.


36
5. Strategies and Costs of Compliance with Standards
As illustrated above, Kenyan fresh produce exporters and producers face a complex and evolving market place with changing demand, competitive and economic pressures, and regulatory or other requirements. Simply within Western Europe, they face a diverse set of prospective markets and market segments with widening differing requirements, in practice if not in law. The challenges faced by Kenyan firms and farmers in complying with external SPS and other standards have varied with the markets/market segments to which they have seen opportunities and focused their trade. Their strategie s have likewise varied. This section seeks to illustrate the array of ‘compliance strategies’ employed by Kenyan industry participants, with particular focus on the measures taken by those exporters, which have maintained or expanded their trade in recent years. Particular attention will be given to developments and investments that have taken place since the mid-1990s.
The ‘baseline’ situation for the industry can be set at about 1990. At that time, there were some seventy-five fresh produce exporters, although only a half dozen accounted for about two-thirds of the trade. Most exporters had developed effective trading skills. The typical business involved coordinating a number of small and larger outgrowers supplemented by cash purchases from an array of growers in order to fulfill current market orders. Raw material record keeping was mostly concerned with quantities and payments rather than anything agronomic. Produce was collected in cardboard cartons on farms or along roadsides, brought to a central, typically dingy warehouse, sifted through and re-graded if necessary, cooled down a bit and trucked over to the airport for shipment that evening. Ministry of Agriculture officials would take some samples at the airport, ostensibly to ensure that low quality produce was not being exported. This was the basic ‘model’. A few firms had established their own farm and were obtaining a small proportion of their supplies from this farm. A couple of firms had made investments in reasonably spacious and modern packhouses, although for the most part there was no maintenance of a produce cold chain. More or less, this is how the industry had operated for a quarter century or more.
While a number of legislative changes took place in Europe in the early 1990s, the immediate effects of these measures on the Kenyan trade were very modest, in part because there was very little actual change in standards or their regulatory enforcement on the ground. Only the few exporters who were supplying the major UK supermarkets at that time experienced any pronounced change. This was essentially in the form of more frequent and more wide-ranging technical ‘audits’ from staff or representatives of the supermarket chains and the initial formation of supermarket ‘codes of practice’, which began to formalize many of the quality control and other management requirements that the supermarkets demanding of suppliers. Most other exporters, whose trade was conducted either on the continent or via the UK wholesale markets, were yet to experience any notable pressures for change.
Table 7 below illustrates the continued time lag between broad legislative or regulatory measures being taken at the EU level and their apparent influence on the real environment in which Kenyan exporters operate. Such a time lag has also been apparent in relation to some private sector protocols, including that of EUREP and the Ethical Trading Initiative. Tangible demands for compliance with these—from an array of customers—have just ‘kicked in’ only in the past year or so even though the protocols or codes of practices were developed earlier. The only major market segment where there seems to have been a very

Strategies and Costs of Compliance with Standards
37
quick transition from protocol development and enforced implementation has been in relation to supplying to the UK supermarkets.
These firms seem to have been early providers of clear specifications regarding permitted and non-permitted pesticides and have moved relatively swiftly in demanding that all their suppliers comply with the BRC Technical Standard. With a few exceptions, one sees a pattern where the timing and depth of investment and change in SPS management among firms has been closely associated with the proportion of their business with the UK supermarkets or with the importers who serve as category managers for these supermarkets. In the past year or two there have also been significant investments and shifts in practices among a few firms which have re-directed their business strategies toward providing premium or high care products to the UK supermarkets.
Table 7 External developments and their time lag pressures in Kenya
1990-1995 1996-1998 1999-2001 2002-2003
Significant Events in External Regulatory Environment
Food Safety Act UK (1990) EU Directive on pesticide residues (1990) EU Directive on food hygiene (1990) EU Harmonized Framework of Pesticides initiated (1993)
Community-wide MRL monitoring program launched (1996) EUREP Formed (1997) BRC Food Technical Standard created (1998)
BRC Standard revised EUREPGAP developed (1999) and initial implementation Momentum on implementing EU pesticide re -evaluation Harmonized Phytosanitary Regulation developed (2000) Ethical Trading Initiative devised
Many active substances to be removed from approved list (mid-2003) EU Harmonized Quality Inspection Regulation developed (2002)
Actual Pressures on Kenyan Grower/Exporters
Visits by UK supermarket technical teams asking many questions. Initial development of supermarket ‘codes of practice’.
Supermarket ‘codes’ and periodic audits; growing demand for traceability from selected clients Environmental issues raised by local NGOs/authorities in and around Lake Naiveté
Selected clients provide pesticide black lists/guidance documents UK supermarket pressures for HACCP and BRC certification Discussions with COLEACP on possible MRL problems
Requests for EUREPGAP certification by selected clients. Selected clients require ‘ethical’ audits. Broader range of clients raises questions about pesticide use.
Source: Author.
Here we review some of the major strategies employed and types of investments made by Kenya’s leading and second tier of fresh produce companies. We also note important measures taken by other parties, including government agencies and industry associations. One note of caution: Investments are taken and business strategies are altered for a variety of reasons. Compliance with SPS standards is one of those reasons, yet many actions have and continue to be taken to fulfill broader quality and/or other market requirements and essentially form part of a wider strategy to modernize and improve existing facilities and management practices. It would be an exaggeration to ascribe the full extent of these measures as ‘costs of compliance’. Further complicating the picture is the fact that for most firms, the

From Challenge to Opportunity 38
observed changes have not been limited to single events or investments, but have involved an array of changes, implemented over a number of years.
While our discussion below centers on the investments and other measures taken by Kenya’s vegetable exporters, the fuller range of players involved in the standards compliance challenge have included the following:
q Individual exporters, including integrated grower-exporters;
q Outgrowers, ranging from the very small (i.e. < 1 ha.) to the very large (i.e. >100 hectares under vegetables);
q Industry associations, including the Fresh Produce Exporters Association of Kenya (FPEAK), the Kenya Flower Council, and the Agro-Chemical Association of Kenya;
q Regulatory and service organizations, including the Kenya Plant Health Inspectorate Service (KEPHIS), the Pest Control Products Board (PCPB), the Horticultural Crops Development Authority (HCDA), the Kenya Bureau of Standards, and the Ministry of Agriculture
q Local and international service providers including technical consultants, trainers, auditors, certified laboratories, etc.; and
q Overseas market customers including supermarket chains, importer-distributors, and others
Compliance with SPS and other standards requires investments and management systems spanning the entire supply chain. Nevertheless, for purposes of understanding the strategies and steps taken by Kenyan exporters and others, we first examine changes in the realm of produce sourcing, production, and traceability and subsequently examine changes in packhouse facilities and operations.
Raw Material Sourcing, Production and Traceability
In revising and redeveloping their raw material sourcing systems exporters have had multiple objectives, including meeting market requirements for quality and shelf-life, ensuring a continuity of supply to meet volume requirements, enabling traceability of products, ensuring that only approved inputs are used and that pesticide residues remain below permitted levels, containing costs, and developing new products. Depending upon the firm and its focal markets, the relative weight of these different objectives has varied. Four main approaches have been pursued, namely, (i) backward integration, (ii) product separation, (iii) intensified extension, and (iii) close outgrower governance. We briefly discuss each of these, in turn. Normally, firms have undertaken a combination of these approaches to meet their requirements.
Backward Integration . Since the mid-1990s, many of the leading exporters have undertaken vertical integration for a substantial part of their raw material needs. Those firms that previously had a farm have since acquired or leased others. Most others have gone into medium or large-scale production for the first during the past few years. Gaining more control over supplies and ensuring traceability were the leading motivating factors as supermarket buyers and/or their category managers have insisted on these elements. Some firms found that having their own farms was a good ‘showpiece’ for potential, new customers. Having their own, professionally managed farm also enabled firms to experiment with new crops or to produce highly specialized crops in the small quantities needed for mixed vegetable products. Having one’s own farm was deemed by some exporters to be an absolute necessity for entering the premium and ‘high-care’ segments of the market. With professional agronomists employed, the firms have been able to apply and even move beyond the pesticide use regimes of their major clients, with some

Strategies and Costs of Compliance with Standards
39
applying IPM principles and achieving significant reductions in pesticide usage and costs. The larger exporters with their own farms are generally moving to obtain EUREPGAP certification. Four firms have already done so for one or more of their farms.
The investments made in modern, world class vegetable farms have been considerable. To acquire and fully develop a 100-hectare horticultural farm would cost $1.0 –1.35 million, including the cost of the land, irrigation facilities, field equipment buildings, cold stores, and necessary fencing and road improvements.60 Several of the larger exporters have developed two or more such farms. A medium-scale exporter (perhaps handling 500 to 1000 tons a year) might undertake to develop a 50-hectare farm that, with all the bells and whistles, would require an investment of some $750,000.
Compared with such investment costs the costs incurred to obtain EUREPGAP certification by several companies seem rather small, although that process has required a considerable amount of time from senior farm managers. One firm estimated that the certification process, including the cost of the audit itself, cost $6000 to $8000 with an additional cost of approximately $200 per month for continued documentation. The ‘compliance costs’ associated with the ‘ethical trading’ init iative are also quite modest for the larger, more progressive companies. Collinson (2001) found that such companies already included most of the protocol’s measures within their normal operational practices, although some additional management time was needed to ensure proper oversight and documentation.
Product Separation. A second strategy being employed by (some) exporters is that of product separation. This is essentially a defensive strategy. Firms may consider that for only part of their supplies they are in full control or can fully ensure the traceability of the product. Clients which demand full traceability and the due diligence record-keeping which this implies will obtain produce from certain sources; those clients who have considerably less requirements for traceability will be channeled produce from the less controlled sources. In practice, what this has meant for several firms is to utilize only produce from their own farms and/or that of larger outgrowers for their more discerning clients (i.e. UK supermarkets), while maintaining a separate product flow for produce from smallholder farmers and selling that product to other markets or market segments. The direct incremental ‘costs’ of such an approach are small, merely those associated with maintaining distinct product flows and accompanying records at the packhouse. There may be opportunity costs, however, if produce from the controlled source(s) is not adequate to meet current supermarket orders and the firm maintains its policy not to utilize the less controlled produce for topping up.
Intensified Extension. The third strategy being employed can be referred to as intensified extension. For the larger firms which have not backward integrated it has been recognized that a ‘business as usual’ approach could not be maintained in their relationship with smallholder and other suppliers with whom they may have held contractual or looser ties. The primary issue has been pesticide usage and minimizing pesticide residues. Drawing upon information being made available by their overseas buyers and/or from industry associations within Kenya, the firms have provided their growers with a significantly increased amount of information. This has included lists of approved and banned pesticides, information on appropriate dosages, pre-harvest intervals, etc. Several firms have provided their regular growers with detailed fertilization and spraying programs for major crops, indicating remedies for common problems.
60 Professional management costs are also considerable. A team consisting of an experienced general manager, a farm manager, a handful of senior supervisors, a security officer and a handful of accounts staff could cost upwards of $100,000 per annum.

From Challenge to Opportunity 40
The firms have tended to supplement their existing field staff to better monitor production and post-harvest practices. They have also sought to ensure that their regular growers participate in field days being organized by the Agro Chemical Association of Kenya and others. While this approach has likely reduced the risks that such firms face—in terms of having their exports be found to be in violation of MRL limits—this does not constitute an arrangement that would be recognized by a discerning buyer as a traceability system. Firms which have been operating in this mode are thus under pressure to change.
Close Outgrower Governance. Some firms have gone further and have begun to develop much more intensive oversight programs, which will enable them to continue to source smallholder produce and to include this produce in the consignments to even their more discriminating clients. This is the fourth strategy of close outgrower governance. One of the leading exporters has been developing and refining its outgrower system over several years. It has developed its own outgrower code of practice, which contains detailed provisions for farmer conduct and company supervision with relation to site and soil management, planting materials and production schedules, fertilizer use, irrigation, crop protection, pesticide safety, waste management, and worker hygiene and safety.
Before joining the scheme the farmer’s land and water supply is checked and the farmer needs to invest in a storage facility for chemicals, in washing facilities and toilets, and in a chemical disposal bin. Total investment costs for the farmer approximate $85. Each of the area schemes features intensive oversight. For example, in one area there are 180 farmers divided into fifteen groups. These are supported by a ‘field supervisor’ and six ‘technical assistants’, creating a very low farmer to extension agent ratio. Participating farmers are given training in pest scouting, safe chemical use, health/hygiene and AIDs awareness in collaboration with local officials. Farmers are required to obtain appropriate chemical spray equipment and protective clothing. Calibration tests are regularly done on spray equipment. Each farmer is visited several times per month. A technical assistant does pest scouting and advises farmers on the need and timing of spraying. Each farmer has a file with many forms related to chemicals and broader crop management. Each farmer is affiliated with a collection station to where the produce is brought, checked for quality and cooled (with charcoal coolers) before being collected.
In this type of system, traceability is assured through a variety of means, including (i) planting schedule records, (ii) seed procurement records, (iii) production records for individual sub-plots (or blocks) of land, (iv) pesticide use, storage, and disposal records, (vi) harvest and produce delivery records, (vii) product flow records, (viii) the numerical tagging/labeling of product throughout the supply chain, and (ix) periodic outgrower audits.
The development and implementation of this type of outgrower governance program is an expensive undertaking that, until quite recently, was only being considered let alone implemented by a few companies. Data provided by one of the leading firms suggests that the management costs incurred by the firm—combining staff time and associated vehicle use in and around the schemes—were the equivalent of $0.09 to $0.11 per kilogram. To put this into perspective, the firm was paying farmers the equivalent of $0.53 per kilogram for green beans, a price that is generally above the norm in the market. The company’s oversight and traceability system were thus adding about 20 percent to the costs of its raw material procurement from smallholder farmers. With the firm buying some 1750 tons a year from its smallholder outgrowers, its incremental cost for full traceability has been in the order of $175,000 per year. (see box 2)
The net result of the above investments and strategies has been a rather significant shift in the structure of production in export-oriented vegetables. Prior research by the author (Jaffee 1990) found that in the mid-1980s upwards of 14,500 smallholder farmers were participating in the fresh produce export trade, of

Strategies and Costs of Compliance with Standards
41
which about 7,000 grew beans, Asian vegetables or other vegetables for export, while the remaining 7,500 grew mangoes, avocadoes or other fruit which was exported. At that time, it was estimated that smallholders accounted for 45 percent of the volume of export vegetables and about 50 percent of the combined export volume for fruit and vegetables.
Box 2 Smallholder oversight costs in the context of the broader supply chain
The table below places the lead company’s costs for smallholder oversight and product traceability into a broader context. In February 2003, a 200-gram tray of green beans (with their ‘top’ and ‘tail’ cut off) sold in a major UK supermarket at 99 pence. The C&F value of this product was 50 pence with the difference being local freight clearing, transport, importer overheads and profit, wastage, and retailer overheads and profit. The FOB export price was 30 pence.
Within Kenya, there is an array of cost items including the cost of the green bean raw material, transport, packaging materials, packhouse labor, etc. The costs incurred by the lead company in administering its smallholder outgrower system are indicated as the line item “transaction costs for smallholder oversight and traceability”. Even if there were no food safety or quality standards, the firm would still incur some transaction costs (over and above transport costs) to communicate with smallholder producers and to make sure that the quantities being produced or made available by these farmers would match the company’s requirements. However, for those quantity requirements the company’s presence in the production areas would only have to be periodic and its level of record-keeping would be much more modest. Probably at least two-thirds of the transaction costs incurred in the company’s smallholder oversight can be considered costs associated with assuring compliance with food safety and other standards.
While the transaction costs of smallholder oversight represent only 1.75 percent of the final retail price for this semi -prepared fresh product, they represent some 5.8 percent of the FOB price, are equal to the exporter’s net profit on this product and are equivalent to about 60 percent of the estimated smallholder farmer’s profit (i.e. 3 pence) for the supply of beans needed for this final consumer product. If our estimate is correct (that about 2/3 of these costs are related to assuring food safety), then these raw material sourcing compliance costs represent about 4 percent of the FOB value and are equivalent to about 25 percent of the combined profit of the farmer and exporter of this product (i.e. 1.155 pence compared with 4.75 pence). If these transaction costs could be reduced—say through a combination of improved rural infrastructure, various forms of collective action, and use of third party certification, then there is the prospect for improving the profitability of both farmers and exporters.
Cost-Price Structure for Top and Tail Green Beans
(Per 200 grams sold at UK Supermarket; Figures in UK Pence, February 2003) Retail Price 99.00 C+F Value 50.00 International Freight 20.00 FOB Price 30.00 Exporter Net Profit 1.75 Fuel Surcharge 1.00 Post- Pack house Transport/Handling 1.00 Exporter Overhead (Utilities; salaries) 6.00 Packaging Material Costs 4.00 Pack house Labor Costs 2.00 Transport + Wastage of Raw Materials 3.50 Transaction Costs for Smallholder Oversight and Traceability 1.75 Price to Farmer for Raw Material 9.00

From Challenge to Opportunity 42
Farmer Production Costs 6.00
Source: Kenya Exporter Interviews
Regarding the present structure of production there are no official data. The Ministry of Agriculture suggests that smallholders account for 55 percent of the combined export volume of vegetables, fruit, and flowers. This is probably a large over-estimate, especially because of the minimal role that smallholders play in the floricultural trade. Based on interviews with several leading exporters, Dolan et al. (1999) estimated that the smallholder share of the vegetable export trade had fallen to 18 percent in 1998.61 However, company interviews in late 2002, together with data on relative export sales and information on procurement systems from other firms, point to a somewhat higher share for smallholders in 2001/2002, although a number of firms are currently implementing changes in their production/procurement systems which may lead to further changes—either with an increased or decreased role for smallholders.62
Table 8 Estimated shares of production from different supply sources 2001/2002 (percent)
Product Smallholders Medium-Scale
Outgrowers Large-Scale Outgrowers
Export Company-Owned or
Leased Farms Export Vegetables 27 10 19 44 Export Fruit 85 7 7 1 Combined 47 9 14 30
Source: Exporter Interviews
While our focus is on vegetables, one should note that smallholders have come to account for a dominant share of the production of exported fruit, in large part due to the inability of larger commercial growers of avocado and mango to maintain profitability. With regard to vegetables, the share of smallholder farmers (and medium-scale growers) is certainly lower today than it was a decade or more ago, although the absolute volume of smallholder produced vegetables for export is approximately the same. 63 The number of smallholder outgrowers of export-oriented vegetables is probably somewhat lower than it was a decade ago64, although the numbers of smallholders growing avocadoes for export has probably increased by a
61 Dolan and Sutherland (2002) estimated that this share had fallen to 11% in 2001. However, their findings may only have reflected the procurement arrangements for a few selected firms whose overseas market outlet is predominantly UK supermarket chains. 62 Our findings are more consistent with those of Jensen (2003) who estimated that smallholders accounted for some 50% of exported fruits and vegetables in the late 1990s. 63 Estimated at 11,250 tons in 1989 (45% of 25,000 tons) versus 11,600 tons in 2002 (i.e. 27% of 43,000 tons). 64 Yields have almost certainly improved over time with the introduction of new vegetable varieties and improved crop protection practices.

Strategies and Costs of Compliance with Standards
43
larger amount. Overall, participation in the sector continues to grow, most especially with the steadily increased demand for labor on exporter farms and in packhouses.65
The biggest change in the industry has been the increased importance of farms owned or leased by the major exporters themselves. Compliance with standards—especially for traceability of product—was a significant motivating factor for some of this backward integration by the larger exporters in the mid-to-late-90s and continues to be a motivating force for emergent exporters whose marketing strategy increasingly centers on sales to the UK supermarkets. However, several other factors, perhaps of equal importance have contributed to the observed investments and structural shifts.
One has been the long-standing problem faced by exporters in effectively matching their immediate and seasonal market requirements with the supplies made available by smallholders under formal or less formal contractual arrangements. While climatic or agronomic factors may intervene, the mismatch is often created by the availability of alternative market outlets for the smallholders, sometimes with cash offerings from other exporters at above the contracted prices. This ‘side selling’ by growers led exporters to place orders among farmers in quantities actually exceeding their market needs.66 In circumstances where exporters were selling or consigning their produce to wholesale markets, the costs of over- or under-supply from outgrowers was often in the form of scrambling to adjust ones air-freight allotments. However, as some exporters became increasingly focused on sales to supermarket chains—with fixed weekly requirements—a premium was put on increased certainty of supply—control over which may be greatest with the operation of one’s own farm(s).67
Another very important factor has been the drive for innovation within the industry and the introduction of an array of new crops and products for the trade. In the early to mid-1990s, exporters began to experiment with the production and sale of various types of peas. They initially sought to grow these crops themselves or monitor trials on farms that were readily accessible. There was uncertainly about appropriate crop protection measures for these crops under Kenyan conditions. Other technical factors came into play as well. For example, garden peas are extremely temperature sensitive and need to enter and remain in a cold chain very soon after harvest in order to maintain their desired sugar level. This logistical factor took precedence over other considerations, which might render garden peas a more suitable smallholder crop.68 Runner beans cannot realistically be grown by smallholders in Kenya because there require artificial lighting (given the daylight patterns in Kenya) to ensure proper flowering and this necessitates a significant investment and the availability of electricity. This is the crop whose trade volume has increased the most since the mid-1990s. Among the ‘high care’ products in Kenya’s trade there is the need for relatively small quantities of herbs and specialty vegetables that go into certain salads
65 No reliable data is currently available on the total number of people employed in packhouse operations and export-oriented larger farms. We estimate this figure to be 40,000 –50,000 in the fresh produce industry with a similar level of employment in Kenya’s flower industry. 66 See Jaffee (1994) for a review of the perilous history of contract farming in Kenyan horticulture. 67 A related factor also contributes to the higher transaction costs of dealing with a broad array of smallholders, some located in relatively remote or poorly accessible areas. This is the consideration of transportation costs and the overall wear and tear on vehicles, including expensive controlled temperature or insulated trucks. 68 For example, this crop is very labor intensive given that the production in Kenya involves the construction and maintenance of holding tressles. In addition, significant disease problems may emerge on larger farmers when improper crop rotation of peas is practiced.

From Challenge to Opportunity 44
or vegetable combinations. Exporters have tended to grow these items on their own farms to ensure supplies to exact specifications.
Hence, a range of factors, in addition to the food safety/traceability challenge, has contributed to structural changes in the production of export-oriented vegetables. Most individual companies report that they have cut back on the numbers of smallholders from whom they purchase vegetables, although this trend is less evident in relation to Asian vegetables as there have yet to be strong signals from downstream buyers to tighten up supply chain oversight. Some observers are of the view that the further contraction of smallholder growers and supply share in this trade is inevitable given the broader trends and demands in the market. Indeed, several companies which are presently in the process of transition away from a wholesale market orientation to one which focuses on supplying selected supermarkets have charted a near-term path to vertically integrate as much of their businesses as possible.
However, this structural trend is not inevitable. Even firms that have invested in their own farms have maintained the position that smallholder farmers are more cost effective producers of certain crops (i.e. extra fine beans) and that continued procurement from smallholders is an important element of risk management. This is because of localized climatic events and because of the risk of pest or disease build-up in areas of concentrated production. Smallholders in certain locations have been found to be able to produce excellent snow, snap, and garden peas. However, for exporters who are primarily servicing the UK supermarkets and in light of the general expectation that more and more buyers within the UK and on the continent will be requiring more effective traceability and production oversight in the future, there is an important challenge facing the industry.
Can the industry—or individual firms—foster the necessary changes in smallholder production practices and be in a position to provide (nearly) full assurance about these practices and the safety of the resultant crop at a reasonable cost that does not unduly undercut exporter and/or smallholder farmer profitability? Is it possible to bridge the gap between the requirements laid out in the EUREPGAP protocol and the technical and documentary realities of smallholder farmers—even those organized into groups?
These are some of the challenges that have led to the development of the Pesticide Initiative Programme (PIP), launched in 2001 under the auspices of the COLEACP. One component of this program--the ‘Good Company Practices’ component—involves the provision of assistance to individual companies within a number ACP countries in order to design or improve food safety control and risk management systems and to provide technical assistance and training to company staff and smallholder outgrowers. The initiative is demand-driven with sub-projects being negotiated with individual export companies with the support tailored to the specific conditions, goals, and capacities of each company.
In Kenya, PIP is presently working with eleven companies, with six sub-projects currently being set-up and the remaining five at an earlier stage of design. Most of Kenya’s larger exporters have applied for support under the program and so have several smaller companies. The sub-projects are funded through a cost-sharing arrangement. For sub-projects with relatively large companies, PIP will cover up to 50 percent of the estimated costs, typically to finance consultants to provide training or assistance in management systems design. For smaller companies, PIP might finance upwards of 70 percent of the estimated sub-project costs. Most projects will be implemented over a two or three year period.
In Kenya, individual projects—taking account both of the PIP contribution and the resource and staff time contributions of the companies themselves, generally range in size from range from $40,000 to over $300,000. For some companies, the sub-projects focus predominantly upon (smallholder) farmer training and the (re-)design of systems for traceability. For others, the sub-projects also include capability building

Strategies and Costs of Compliance with Standards
45
and other measures to strengthen food safety management at the packhouse level and the broader supply chain. This all depends on the current status of company operations. Implementation is just getting under way.69 While it is too soon to predict the outcomes, the types of sub-projects being designed would appear to an excellent opportunity for exporters to maintain or even expand the scope of their smallholder procurement arrangements and to be in a position to utilize this produce in all of their market sales, including to the most demanding clients.
A number of collective efforts are also being undertaken to improve crop protection practices and safety and to otherwise enable the Kenyan horticultural industry to comply with EU and Member State pesticide approval regulations and MRL tolerances. For more than a decade, the local agro-chemical industry—working with several government agencies, has been implementing a ‘Safe Use Project’ through which some 650,000 farmers received training rela ted to ‘good agricultural practices’ (including the identification of pests and diseases, proper spraying practices, appropriate health precautions, and pesticide storage. Aspects of this program continue, and the Agro-Chemical Association of Kenya (AAK) estimates that it and other partners spend upwards of $150,000 per annum on field days, radio programs, and the dissemination of written materials. This program is not specifically focused on horticultural growers, although some such growers and some focused training materials have been involved.70
Parallel efforts are being made to improve the overall integrity of the pesticide distribution system—for example, through a program of training, licensing, and accreditation of stockists, and to remove illicit and non-registered pesticides from the local market. These efforts are being led by the Pest Control Product Board (PCPB), in collaboration with the AAK. The budgetary resources available to the PCPB have been limited and the AAK has voluntarily collected a cess on pesticide sales to provide additional resources for PCPB surveillance activities.
Specifically in relation to the horticultural sector, Fresh Produce Exporters Association of Kenya (FPEAK) drew up a series of crop protocols providing recommended crop protection strategies for different crops in the late 1990s. With the assistance of the PIP program, protocols for several fruits and vegetables are being revised to take in account the changes in the EU’s approved list of active substances, changes in official MRL tolerances, and new crop protection products which have been introduced over the past few years. PIP is also working closely with a National Steering Committee on MRLs, which was established in 2002 in order to: (i) update and revise the list of registered pesticides and those likely to remain registered within the EU, (ii) work to develop appropriate MRLs for Kenya, especially for crop/active substance combinations for which no MRLs are presently set, (iii) ensure the availability of information on alternative options, including ICM, IPM, biopesticides71, etc., and (iv) advise the Ministry of Agriculture on these matters.72
69 In implementing these sub-projects, there is significant scope to draw upon existing training materials and experienced local trainers, especially from the ‘Safe Use Project’ (see below). 70 Michalik (1998) provides survey results that suggest fairly significant advances over the course of the 1990s with regard to farmer awareness of pesticide safety issues as well as increased application of safe and appropriate practices.
71 Kenya presently lacks any legislation on biocontrol measures, although collaboration is taking place with South Africa to draft
biopesticide use guidelines. 72 The Managing Director of KEPHIS is the chairman of the Committee and the PCPB serves as its secretariat. There is representation from the government, horticultural growers and exporters, and the agro-chemical industry on the Committee.

From Challenge to Opportunity 46
A collective effort is being made to assess where there could be ‘gaps’ in the crop protection armory for export-oriented horticulture because of the EU’s regulatory changes and the performance of older and newer crop protection products. In response to these gaps one or more strategies will be employed, including the conduct of GAP trials to help establish appropriate MRLs, the testing of other non-chemical measures to address the particular pest/disease problem, etc. This process has recently been initiated. The preliminary analysis suggests that Kenyan export growers face very few ‘gaps’ in relation to vegetables, although there are some issues in relation to certain tropical or sub-tropical fruits.
Table 9 below provides an illustration of the changing crop protection strategies being used for key vegetables in the Kenyan trade.73 While a number of formerly used active substances have or are now being removed from the market in most instances there are replacement products which are considered to be superior in their efficacy and/or in their worker and/or environmental safety profile.74 Many of the newer chemicals are, however, more expensive to apply, at least on a per hectare basis.75 However, more evidence is needed to determine whether the newer remedies are in fact more expensive per kilogram of marketable yield. This will require data on the comparative performance of the older and newer chemicals. In addition, one needs to track the growing application of integrated pest management (IPM) approaches within the industry.
None of the exporters who were interviewed for this study presently regard the withdrawal of many active substances from approved use in the EU as a major concern for the viability of their businesses. They have already made most of the necessary adjustments on their own farms and are confident that through their own efforts, through PIP support and through collaboration with government agencies and with the Agro-Chemical Association the challenges associated with proper pesticide use by outgrowers will be sorted out in the near future. Many smallholder farmers undoubtedly still have leftover supplies of older chemicals whose approved use is being withdrawn in the EU or whose use is heavily restricted or banned by private fresh produce distributors. However, on-going efforts to sensitize farmers about the commercial risks of the continued use of such chemicals as well as direct supervision and documentation of smallholder supplier chemical usage seems to be yielding results. A further understanding is needed, however, on the economic impacts of these pesticide use changes.
Packhouse Facil it ies, Quality Assurance, and Food Safety Management
For many years, most fresh produce exporters maintained relatively simple packhouse structures consisting of a warehouse with concrete floors and aluminum roofing and facilities to unload and reload packed produce onto trucks. The leading firms had basic cold stores to hold the produce, which was
73 Apparently, growers have a range of options growers to deal with many of the pest or disease problems. Some of these are natural/biological products that are exempted from MRL requirements. These include Bt formulations, GC Mite, Azyditractin, and Pyegar 35.7 EC. 74 For Kenya’s leading vegetable export crop, green beans, many older fungicides and insecticides will likely be defended by the major agro-chemical companies and already have established MRLs within Europe. Fungicides include Iprodione, Vinclozolin, Bitertanol, Tebuconazole, Azoxystrobine, Cyproconazole, and Penconazole. Insecticides include Fenbutatin, Deltamethrin, Bifenthrin, Cyromazine, and Lamba-cyhalothrin. At least six international agro-chemical companies will defend older active substances that have applications for green beans. Information made available by the Agro-Chemical Association of Kenya. 75 Following labor and seed costs, agro-chemical costs are the third largest component of vegetable production costs, typically accounting for 15-20% of the total.

Strategies and Costs of Compliance with Standards
47
packed each day before evening departure on charter or commercial airlines. Quality control essentially involved re-grading and re-packing sub-par produce, which had arrived from farmers. While a couple of firms had somewhat more sophisticated systems, the above description represents the norm in the industry up through the early 1990s.
Over the past decade, substantial investment has been made in the modernization and expansion of packhouse facilities and in associated systems for quality assurance and food safety management. The bulk of this investment has been made by about one dozen companies whose business strategies have increasingly become centered on supplying the UK and continental supermarkets. For these companies, major upgrades have been made to existing warehouses/packhouses76 or entirely new buildings have been constructed, dedicated to particular segments in the business—i.e., ‘high care’ facilities. Major investments have gone into air-conditioning and ventilation systems, water purification systems, blast cooler systems, and a wide variety of equipment to attain very high standards of hygiene within the packhouse operations. A few companies have gone as far as to invest in their own on-site laboratories for product and staff health tests.77
Accompanying the expansion and modernization of packhouse facilities have been enormous changes in quality assurance and food safety management systems within the leading companies. Each of these companies has hired university-trained food technologists and scientists, adopted and refined HACCP systems and put in place other formal arrangements and documentation for improved quality assurance. For those firms with ‘high care’ product lines, this dimension of their business involves very demanding systems for product testing, environmental testing (i.e., daily water tests), and staff health testing. The hygienic conditions of ‘high care’ facilities have been described as akin to medical operating theatres. While this may be an exaggeration, it is not by a wide margin.
While companies previously had ‘quality assurance teams’ comprising a few people, now they have entire quality assurance divisions. One leading company’s quality assurance unit has increased in staff from three people to twenty-seven people over the past four years. The quality assurance function is now a major cost center in the company. The management structure of the firm is illustrated in figure 8 below. Notice the multiple layers of technical supervision in relation to quality assurance.
76 For example, changes have been made to flooring and walls plus glass windows have been replaced by other see-through structures. 77 Establishing such labs entailed investments of $40,000 to $50,000. One of these labs is ISO 9000 certified. Companies without their own labs send samples to various private or university labs that operate in Kenya. Tests typically cost about K4000 (i.e. $60) and the results are generally given within one or two days. Firms selling ‘high-care’ products must have tests down on each and every consignment. The records for these tests will be checked during the BRC or individual supermarket audits.

Table 9 Illustrative changes in pesticide usage for vegetable export commodities
Crop Problem
(Pest/disease) Old Pesticide or
Remedy Cost per Hectare
New Pesticide Or remedy4
Cost per Hectare
Reason for change5
Safety and environmental profile
Rust Triforine Triadimenol
33 38
Hexaconazole Tebuconazole Trifloxystrobin
29 28 50
2,.5 Shorter PHI Favorable features
Caterpillars Endosulfan 17 Bacillus thuringiensis 25 2, 5 Natural product (BT) Thiacloprid 48 2, 6
French Bean
Soil pests Thiram/Lindane 5 Imidacloprid 48 2, 5 No leaching Rust Oxycarboxin 35 Tebuconazole 28 2, 5 No leaching Trifloxystrobin 55 2, 5 Runner Bean Leaf miners Dimethoate 5 Thiacloprid 48 2, 6 Safe to beneficials Thrips Pirimiphos-methyl 25 Thiacloprid 48 2, 6 Rapid breakdown in the soil. Snap pea Spinosad 67 2, 6 Natural product Aphids Diazinon 27 Deltamethrin 7 3 ,5 Pyrethroid; rapid breakdown Garden Pea Whiteflies Methomyl 26 Thiacloprid 48 2 ,6 Very low mobility in soil
Aphids Oxydemeton-methyl
5 Thiacloprid 48 2 ,6 Rapid breakdown in soil.
P. mildews Triforine 33 Trifloxystrobin 55 2, 5
Okra
Tebuconazole 14 2, 5 Safe to marine life Chillies Anthracnose Chlorothalonil 22 Trifloxystrobin 55 2, 5
Stalk borer Endosulfan 17 Beta-cyfluthrin 7 2, 5 Less toxic pyrethroid Baby Corn MSV
Soil Pests Thiram/Lindane 5 Imidacloprid 48 2,5 Lower toxicity
Cost per hectare are in US dollars Reasons for Change: (1) global ban; (2) withdrawal of product; non re-registration in EU; (3) reduction in MRL in EU; (4) build-up of pest resistance; (5) superior performance/efficacy; or (6) significantly better safety and/or environmental profile.
49

Figure 8 Illustrative exporter site management structure
Managing Director
Technical Director Floriculture Director
General Manger - Site General Manager – Farm A General Manager – Farm B Group IPM Manager Flower Manager
Transport Manager
Workshop Manager
Systems Administrator
Group Manager Accountant
FARM Accounts Department
NAIROBI Account Department
Site Technical Manager
Raw Material Coordinator Pack - house Manager Pack - house Manager
Payment Clerk Senior Supervisor
Supervisor
Senior Supervisor Senior Supervisor Senior Supervisor
Product Coordinator
Product Coordinator
Product Coordinator
Admin Coordinator
Packing Coordinator
Packing Supervisor
Product Coordinator Product Coordinator
Asst. product Coordinator
QA Manager QA Manager Health & Hygiene Manager
Senior Quality Controller
Senior Quality Controller Senior Quality
Controller Senior Quality
Controller Label Coordinator Label Coordinator
Production QC Raw Material QC
Hygiene Supervisor
Production QC Raw Material QC
Hygiene Supervisor Production QC
Raw Material QC QC Clerk
Production QC Raw Material QC
QC Clerk Supervisor / Line
Leaders (2) Supervisor / Line Leaders (3) Supervisor / Line
Leaders (6) Supervisor / Line Leaders (4) Supervisor / Line
Leaders (4) Supervisor / Line
Leaders (4) Supervisor / Line Leaders (2)
Supervisor / Line Leaders (2)
FARMING OPERATIONS
RAW MATERIAL PRODUCTION PREPARED
PREPARED FRESH FRESH PREPARED
QUALITY ASSURANCE QUALITY ASSURANCE
Source: Kenya Exporter Interviews
50

From Challenge to Opportunity 50
The design and implementation of such food safety and quality assurance systems is expensive. The design process itself requires months of senior management time plus (usually) input from an array of consultants. One relatively large company, which does not now have an HACCP system, estimates that over the next three years it will cost it some $50,000-70,000 (in managers’ time, training, and consultant’s fees) to put such a system in place. Another large company estimates that the combined annual food safety management costs for its premium and high care lines of business is about $300,000, or 3 percent of its annual turnover of just under $10 million. This includes the pertinent technical staff78, cleaning chemicals, the operation of a water filtration system, and health testing of staff. At present, these overhead costs are substantially higher for the ‘high care’ business (i.e. 5 percent of turnover) than for the premium packing business (2 percent of turnover), although this may change as the former continues to grow.
All this could be considered as ‘costs of compliance’ with supermarket food hygiene standards. Additional costs are incurred for firms to prepare for certification under the British Retail Consortium Food Technical Standard. Firms estimate that the preparatory process requires three months of nearly full-time effort by a senior manager followed by a further one day per week input over six months by the same manager. That level of effort is equivalent to a cost of some $12,000. The audit itself cost about $1,500 per packhouse site. A few firms have several different sites that need to be audited especially if they pack some produce on their own farms. A considerable amount of additional documentation is also required for attaining and maintaining BRC certification. Firms estimate that the additional cost is approximately $200 per month because more office staff are needed (see box 3).79
Despite this cost, most exporters consider the BRC standard and audit process as being far superior to the previous system of diverse audit arrangements. They regard the BRC standard as giving Kenyan (and other) suppliers very clear guidelines on what is required of them. Still, firms that have attained BRC certification still find themselves being visited by various ‘technical audit’ personnel from individual supermarkets as part of broader technical and commercial discussions. Each supermarket has a different arrangement and number of times for visiting. Exporters normally pay the airfares and the local costs for these visits. Depending upon the number of clients a firm has this can cost an exporter from $5000 to $25,000 per year.
Changes in staff relations and conditions have accompanied the strengthening of quality assurance and food safety management systems. In the past, firms employed many casual workers and provided only very rudimentary training. This situation is changing very quickly, especially for firms in the high end of the business. Some of these firms are hiring packhouse staff on six-month contracts, are providing food safety and hygiene training as well as health counseling. 80 The larger firms have their own small medical staffs and clinics, conduct frequent health testing of staff, and have food canteens in close vicinity to the
78 Salaries for packhouse managers and food technologies have increased by some 25-40% over the past three years because of increased demand and competition among the leading firms for the most experienced staff. 79 One firm guided the author through a tour of twenty-eight files on an array of packhouse and staff issues. They indicated that ten of the files are kept for their own use while the other eighteen are essentially maintained for supermarket audits. Still, they don’t regard the records as unreasonable and understand that most of this record-keeping really does help to minimize the risk of food safety breakdowns and is not simply a matter of providing a due diligence defense. Another firm which has multiple clients maintains fifty seven different files, some specifically at the request of p articular clients. 80 The larger firms are now spending $15,000 to $30,000 per annum on staff training. Such programs and expenditures were minimal in the mid-1990s.

Strategies and Costs of Compliance with Standards
51
packhouses. Higher wages—including piece-rate bonuses—are being paid to packhouse staff and firms are beginning to introduce staff grievance procedures and worker committees.81
Only about ten companies have either already transformed their packhouse operations or are in the midst of major investment projects to bring about such a transformation. These companies do, however, account for more than two-thirds of the fresh vegetable trade. An array of other companies, most of whom operate on a relatively small scale (in other words, with annual exports of 100–500 tons of fresh produce), have made only modest adjustments in their physical facilities and management systems in recent years. For the most part, these firms have been directing their sales through wholesale markets in the UK or on the continent or have remained focused on the Asian/ethnic specialty line of trade. Their clients have therefore not applied pressure on them to develop HACCP systems let alone make large, transformational investments.
Box 3 Upgrading for BRC: the challenge for a smaller company Most of the companies that have recently obtained BRC certification have been selling to UK supermarkets
for a number of years and have made relatively large investments in upgrading their packhouse facilities over time, to accompany their overall business expansion. However, other firms that presently operate on a small scale, recognize that their long-term viability may depend upon their ability to service the UK or other supermarkets with value-added product. They are unsure whether they can maintain let alone grow a business based upon low margin sales of loose produce to clients whose prime concern is competitive pricing.
One such firm is examining the prospects of transitioning toward becoming supplier of pre-packed vegetables and one which would have in place the management systems and facilities to conform with BRC standards. This firm presently has annual produce sales of 600 tons, implying a turnover of perhaps $1.4 million and retained profit in the range of $40,000 to $60,000. It recently undertook a feasibility study that determined that it needed to invest just under $150,000 in packhouse modifications and equipment to reach the necessary standard.
Such investment would involve: § installing temperature control equipment in the packing area ($40,000); § partitioning cold rooms to accommodate pre-cooling, cold storage of ungraded produce and storage of graded
produce, all entailing new equipment ($38,000); § installing produce washing and drying equipment ($35,000); § lining the packing area and cold rooms and ceilings with panels coated with food grade materials ($19,000);
and § several other measures, including the development of an appropriate documentation system.
This would not be the end of the story. The firm also needs to hire the necessary food technology staff, develop a HACCP system, and develop an effective system of traceability for its produce. This will cost some additions tens of thousands of dollars for which the PIP program is likely to cost share.
Source: Kenya Exporter Interviews
Some of the newer entrants into the trade in recent years have chosen not to invest in their own packhouses as they have been able to rent temporary space in a large facility managed by the parastatal Horticultural Crops Development Authority nearby to the international airport. This large facility was financed with a loan from the Japanese Government. The original idea was to use the facility as an auction house with HCDA sourcing produce from smallholders, keeping it in cold storage, and then auctioning it off to exporters. Such an approach proved to be infeasible given the requirements of the major companies for assured and traceable supplies. In order to put the facility to some use, the HCDA
81 Three years ago, packhouse staff were generally making $1.20 – 1.50 per day. In late 2002, the prevailing rates were $2.00 – 2.60 per day. McCulloch and Ota (2002) and Dolan and Sutherland (2002) provide analyses of the changing employment patterns—both in rural areas and at packhouses—within the industry.

From Challenge to Opportunity 52
has been charging smaller exporters about $200 per month to be able to use part of the space, including access to sorting tables and cold storage facilities. This is a great bargain. Firms report that simply the running costs for their own small facilities would be upwards of $800 per month and this would require them to make the initial investment itself.
Still, the HCDA facility was not designed as a packing facility--there are glass windows, an improper lighting system, no proper ventilation or temperature control systems, and the doors remain open during packing operations. Product quality and shelf life is affected. Firms can therefore carry out a low margin business yet at a loss to government, which must repay the loan. In October 2002, the facility was handling some 30 tons per week compared with an estimated break-even of 289 tons per week. The program is clearly unsustainable and exporters do not see this as a long-term solution.
Hence, the industry has witnessed the significant transformation of certain companies from essentially being trading operations to resembling integrated food processing companies with rather sophisticated systems and very modern facilities. These operations have evolved both in response to external (and primarily private supermarket) standards and protocols and as part of the growing recognition by owners and managers of the requirements of a modern food business. They have made substantial investments, some of which can clearly be considered as ‘costs of compliance’ with food safety/hygiene standards while others are associated with the more general expansion of the companies and their efforts to improve and manage product quality. Other exporter operations have changed relatively little over the past decade, lacking both the challenges and the opportunities provided by business relations with very demanding European supermarkets or their category managers. The result has been a sharp segmentation of the Kenyan industry, as illustrated by table 10 below.
Given the combination of competitive pressures, the on-going structural changes in fresh produce distribution within Europe and the food hygiene and traceability requirements of buyers in key market segments, there appears to be two viable business strategies for Kenyan exporters. One is to remain small and to continue to minimize ones overhead costs and simply compete in the loose bulk produce market perhaps on a somewhat more seasonal basis which entails less direct competition with other suppliers from countries with lower freight rates. The other viable strategy is at the higher end, investing in facilities and systems to service the most discriminating clients who are willing to pay for value-addition. Here, you can specialize in supplying premium, pre-packed produce or (substantially) supplement this with a ‘high care’ product business.
There is a huge leap between the stage two and stage four type of company and then an additional significant leap to become a stage five company. The stage three type of operation no longer seems to be viable. Smaller firms which have grown their businesses over time have come to realize that their grown (and even viability) cannot be maintained without transforming their businesses to become high end suppliers and to ride the wave of the supermarkets (box 4). Even straddling the high end and lower end markets does not appear to be a workable model. Hence, it appears that one can no longer simply grow a smaller business over time. Stage two companies will either remain small operators with rather low profits or must acquire the resources and management team to specialized high-end premium suppliers. For those without their own reasonably sized farm, this leap certainly requires investments exceeding $1 million. For those who already have their own farms plus a decent warehouse structure, an investment of between $300,000 and $600,000 is probably needed.82
82 One of the leading exporters of Asian vegetables estimates that it would need to invest about $500,000 in order to establish a ‘premium pre-packing’ operation for these vegetables. This would involve a new building, cold store facilities, other equipment, insulated trucks and other up-front investments.

Strategies and Costs of Compliance with Standards
53
Table 10 Fresh produce exporter types, assets, and needed investments
Type Main Characteristics Major Facilities Main Skills (Incremental)
Investment ‘Brief Case’ Trader
Very small scale; intermittent and opportunistic sales
Pick-up truck Fax machine
Some trading skills Minimal as ‘facilities’ used for multiple purposes
SME Generic Exporter
Regular sales to regular clientele of one or two shipments per week; most sales are of loose packed produce; Virtually all sales to wholesaler-based distribution channels.
Small packing shed with some cold store capacity and basic equipment (i.e. sorting tables) Three to four pick-up trucks
Trading and management skills. At least one quality control person. One/few persons who rove around and interact with farmers. Several produce graders.
$50,000 to 75,000
Large Generic Exporter
Regular sales to regular clientele virtually every day. Sell mix of loose and pre-packed produce. Most sales to wholesaler-based distribution channels although also to smaller supermarkets.
Larger pack house facilities with some automation and significant cold store facilities. Larger fleet of trucks including several insulated trucks
Supply chain management skills. More quality control staff. Several agronomists and larger number of field staff
$500,000 to $650,000
‘Premium’ Supplier
Regular supplier to supermarkets and other up-market distributors. Most sales are of pre-packed produce with improved packaging and product combinations.
Seemingly requires development and operation of one or more farms (ensure supply control and traceability) with investments in irrigation and other farm equipment Upgraded central packhouse facilities (stainless steel tables; improved lighting; blast cooling system; good sanitation and worker hygiene systems) plus pre-cooling centers in major product sourcing areas
Supply chain and food hygiene/HACCP management skills. Multiple layers of quality assurance personnel Advanced production planning skills, including professional farm management skills. Need to be an ‘accredited’ supplier (i.e. BRC)
Small version handling 500 – 1500 tons/year: $1.5 million. Larger version handling >2500 tons/year: $4 to 5 million.
Value Added Prepared Food Operator
Same as ‘premium’ supplier with the addition of a ‘high-care’ line of prepared ready foods
The above plus separation of high and low risk areas and distinct ‘high-care’ rooms with the necessary temperature control and air venting systems, metal detectors, heat sealing equipment.
The above plus additional food science personnel
Varies by unit size and by need for new building. Minimal extra investment is $100,000 but more likely $0.5 to 1 million.
Source: Kenya Exporter Interviews
Box 4 Perceived advantages of servicing supermarket clients
Despite their more strict food hygiene, product quality, and other requirements, Kenyan exporters cite a wide

From Challenge to Opportunity 54
range of important benefits in supplying UK (and other) supermarkets or the category managers that serve them. These advantages include: § Higher margins than those possible through wholesale market transactions (this was illustrated earlier); § Demand is more consistent throughout the year with little or no seasonality. This helps in negotiating with
charter/commercial airfreight carriers; § A supply program is agreed at the beginning of the year, thus enabling the exporter to effective program own-
farm and outgrower production; § These clients provide detailed information on changing developments and requirements within the market; § The quality, hygiene and other specifications made provide very detailed guidelines for exporter operations
and good practice; § This is an excellent marketing tool. An exporter can ‘name drop’ its supermarket clients to other would-be
customers.
Source: Kenya Exporter Interviews
Most of the exporters consulted assume that for the European market the only viable market positioning for Kenya is at the higher end, whether this be premium pre-packs or high-care products. They see a further erosion of margins in the market for bulk produce and little likelihood that Kenyan airfreight costs would decline relative to those of competing suppliers. Hence, there is an expectation that the fresh produce export trade will become more concentrated in the future.
This trade has always been dominated by a limited number of companies. The highest level of concentration was actually back in the late 1960s through the mid-1970s when three companies accounted for three-fourths of the trade. By the mid-1980s, the leading half dozen companies accounted for two-thirds of the trade, although there were more than one hundred smaller and part-time operators. Back then, there were important economies of scale in logistics management, especially for airfreight.
Most of the leading companies today were also among the leaders some fifteen years ago, although their relative sizes and levels of business sophistication have changed. There has been a huge drop-off in the number of regular exporters, which is now down to about twenty-five.83 The reason for this is not the higher standards imposed by regulations or by the top tier buyers, but basic competitive pressures and economics at the low end in the trade. In the past few years, there has been some new entry into this business, both at the lower and upper ends of the market.
Taking Kenya’s fresh fruit and vegetable trade as a whole, industrial concentration is no higher today than it was a decade or fifteen years earlier (table 11). However, trade in fresh vegetables alone has certainly become more concentrated among a half dozen firms over the past five years in line with the increasing focus of the trade toward supermarket clients and the relatively high investment and systems barriers to entry to service particular components of that market. Data for earlier years is not available, yet we estimate that in 2001, only three companies accounted for 59 percent of the volume of fresh vegetables
83 Although in any one year there are typically another two dozen or more companies that each export five to twenty tons of fresh produce. Most of these are part -time operators who may send one or two consignments per month.
Table 11 Concentration in the Kenyan fresh fruit and vegetable export (percent share of export volumes)
Category 1985 1991 2001 Leading 3 Firms 49 57 51 Leading 6 Firms 67 75 71
Sources: Jaffee (1990; 1995), Exporter Interviews, and HCDA data.

Strategies and Costs of Compliance with Standards
55
traded and six firms accounted for 84 percent.84 These shares would be even higher with regard to the value of the fresh vegetable trade, given that only two or three firms account for the bulk of the current exports of ‘high care’ products. It is therefore likely that three firms now account for two-thirds of the value of the fresh vegetable trade and six firms for upwards of 90 percent.
Other Measures Taken
In addition to the adjustments in production, procurement, and packhouse operations, and the more collective actions taken on pesticide matters, there have been several other initiatives to better enable the fresh produce industry to meet emerging standards.
Phytosanitary and Quality Inspections
Part of this relates to the work of KEPHIS.85 This government agency has three basic roles: (i) implementing Kenya’s laws on plant variety protection; (ii) testing and monitoring the quality of seeds and fertilizers and registering companies engaged in their distribution; and (iii) phytosanitary management. For the latter role, KEPHIS is active in quarantining germplasm, inspecting produce that is imported or exported, controlling trade in endangered species, and implementing national policies related to crop biotechnology. Recently, KEPHIS has become a more active participant in the International Plant Protection Convention, although financial limitations have inhibited it becoming increasingly involved in relevant standards-setting processes.
KEPHIS implements a system of phytosanitary and quality checks and issues required phytosanitary certificates.86 This function was previously done at the airport by staff of the Ministry of Agriculture. Now a team of 22 staff go to the loading areas of the leading flower and fresh produce companies as well as service the freight depots in and around the airport area where many of the smaller exporters pack and palletize their product.87 The inspections are done visually with the aid of magnifying glasses. Depending upon the particular product—and past experience with particular exporters—inspections will typically involve a sampling of between two and ten percent of the exported product. The proportional sampling is increased when there are apparent problems with particular products or suppliers.88 During the past two years, actual rejections or retentions of fresh vegetables have been uncommon and when this occurs it is
84 The top ten companies had a share just under 95% of the total. 85 KEPHIS was formed in 1997 with some 287 staff inherited from the Kenya Agricultural Research Institute and the Ministry of Agriculture. It was actually created in 1994 yet the MOA was experiencing major budget cuts at the time which prevented the development of a proper structure and capacity for KEPHIS. 86 In 2001 it issued some 48,906 phytosanitary certificates for fruits and vegetables. KEPHIS now uses a special type of paper which prevents the duplication and forging of such certificates. 87 The total inspectorate staff of KEPHIS is 41people. Six other inspection staff operate at Mombasa port, four each at the plant quarantine station and diagnostic laboratory and two at Eldoret airport. KEPHIS also carries out farm inspection during periods of active plant growth in order to ensure than phytosanitary requirements are being met. 88 Inspection team is looking for more than phytosanitary problems. It also notes instances of subgrade quality and/or mixed grading of produce. If problems, there could be two courses of action. One is to reject the consignment or parts thereof—marking the produce and taking samples for holding in case of exporter appeal. The second action would be to issue an ‘advise notice’ encouraging the exporter to perform some re-grading and repacking of produce.

From Challenge to Opportunity 56
typically for very small quantities. KEPHIS charges an inspection fee for its services, yet these do not cover the full costs of this operation. 89
KEPHIS is in the process of upgrading its laboratory facilities and is seeking to have it attain full accreditation. Investments of some K35 million (US$500,000) have been made in equipment and there is on-going collaboration with the South African National Accreditation Services to train staff and to meet other accreditation requirements. At present, KEPHIS is doing relatively few pesticide residue tests itself with Kenyan exporters generally commissioning private labs at home or abroad to carry out this testing. It is important that KEPHIS be recognized by the EU Commission as a ‘competent authority’ for phytosanitary and quality inspections in order to minimize the likelihood of disruptions in the flow of Kenyan fresh produce through European entry points.
The need for detailed pest risk analyses (PRA) has posed some constraint on Kenya’s trade, although this has been in relation to trade with South Africa, the United States, and Japan rather than with the European Union. KEPHIS has a small team focused on this work and has gathered information required for PRAs for several crops—including avocado, pineapple, raspberries, cucumber, courgette, and aubergine, although most of these assessments were done in a restricted geographical area. Several exporters have indicated an interest in selling specialty vegetables to certain markets in the United States, yet the prospective cost of a detailed pest risk analysis has been a deterrent. The PRA for any crop would require information on the prevalence of particular pests and diseases within Kenya, the yield reducing effects of these, the locations within the country that are pest fee, and the control measures that are being undertaken. While the more limited PRAs that have been carried in Kenya have tended to cost about $7,500, one exporter estimates a cost of $25,000 to 30,000 to meet U.S. requirements.
Toward a ‘National Standard’
Another significant and on-going process relates to the development of a national standard or code of practice for horticultural industry. This development has its origins in the mid-1990s when a group of farmers and companies operating around Lake Naivaisha formed a task force and created a code of practice to better ensure the sustainable use of the lake for irrigation purposes and the minimization of chemical run-off. In subsequent years, the Kenya Flower Council developed a more elaborated code of practice covering environmental, social, and other dimensions. This has since been refined and an effective system put in place for grower audits and certification. The FPEAK developed its own code of practice, yet this proved to be a large and unwieldy protocol, which was not effectively recognized by the industry or overseas clients.
Within the last couple of years, there have been joint efforts to establish a national standard and these can to fruition with the approval, in April 2002, of the Code of Practice for the Horticultural Industry, by the Kenya Bureau of Standards. This “prescribes the requirements for the responsible and safe production of horticultural products, both edible and ornamental.” It is ostensibly geared toward all horticultural production and marketing in Kenya, although many references are made to exporters and its most
89 They charge Ksh 0.10 per kilogram, which is equivalent to about $1.33 per ton. In 2001, the total revenue raised from inspection of fruit, vegetables, and cut flowers was just under $132,000. No specific data are available on the total personnel and other costs for the inspectorate unit of KEPHIS. However, this unit comprises 28% of KEPHIS’ technical staff and just under 13% of its total staffing when support personnel are included. Taking a crude estimate that the inspectorate accounts for 22% of total KEPHIS costs this would imply staff and operational costs of some $335,000 in 2000/2001.

Strategies and Costs of Compliance with Standards
57
immediate relevance is for export-oriented supply systems. The scope of the code is very broad, encompassing features of Good Agricultural Practices, product quality management, hygiene and food safety management, supply chain management and traceability, environmental protection, and fostering the safety and well-being of workers in the industry.
Many of the provisions of the code—especially those related to worker rights and safety and to environmental management are linked to specific requirements under existing Kenyan laws. Other provisions—especially those related to quality management, packhouse operations, and product traceability are not grounded in law, but simply include guidelines which can be construed as good practices and which may or may not be required by downstream customers. Interestingly, the code explicitly brings in the notion of ‘due diligence’ and implies that it will be necessary for grower/exporters to maintain an extensive array of records to demonstrate and prove compliance with provisions of the code.
This national Code thus embodies features of the BRC and EUREPGAP codes and a blend of other legal and private market requirements. While it would be desirable for firms to engage in the good practices outlined in the Code, what are the implications of the Code as an enforceable standard? It is indicated that the Code will ‘provide the basis for the registration of horticultural produce exporters’. However, the majority of the existing smaller exporters do not have the management systems in place to comply and document compliance with many planks of the code. Only the largest six to eight companies could probably be able to fully comply with the code, yet these are essentially the same companies that are already being audited for various private codes.
As a practical matter, will the national code simply serve as a set of useful guidelines or will it in fact be enforced as a standard? If the latter, who will undertake the inspections and enforcement? No official agency is especially well positioned to do the auditing. KEPHIS has the appropriate technical staff yet these are not located in rural areas and that organization is already facing major challenges in fulfilling its mandate to do phytosanitary and other services.90 HCDA does not have a suitable technical staff and is likely to also undergo another major restructuring in the near future. KBS has only limited agro-related staff and these are not located in rural areas.
In Kenya’s flower industry a system of local auditors was created with the assistance of international auditing specialists. Yet, this was relatively easier to do in that industry because of its geographical and firm-level concentrations of production. This is more challenging in the fresh produce sector, even if there is not the intention to audit the vast realm of production geared toward the domestic market. Fruit and vegetable production for export remains quite dispersed geographically. An initial effort is being made to mimic the cut flower audit system. In 2002, ten people were trained by Bureau Veritas as fruit and vegetable system auditors, having been trained in modules dealing with ISO 9000 and 14000, with SA 8000 and with the national code of practice itself.
It remains uncertain whether this national code will be recognized by international buyers and thus a value placed on obtaining certification. 91 Some Kenyan stakeholders would like to see the national code
90 If it were decided that KEPHIS would oversee the implementation of the code, that organization’s capacity—both in terms of personnel and equipment—would need to be enhanced to enable it to carry out the necessary inspections. 91 Other external codes of practice have been criticized as not being pertinent to industries in which smallholder farmers and/or small traders play a significant role. The Kenyan code provides some flexibility to accommodate the constraints facing such
Continued …

From Challenge to Opportunity 58
recognized by EUREP as being broadly equivalent to the EUREPGAP, thus enabling growers to obtain certification locally without having to resort to relatively expensive third party auditors.
participants. However, in some regards its specifications are no more relevant than some external codes. For example, it specifies that all agreements with growers will be written and legally binding. It suggests that all growers should have environmental plans and that produce temperature, humidity, and air composition should be maintained and documented at all times.

59
6. Conclusions
The changing regulatory environment in Europe has raised concerns that developing countries will be unable to maintain—let alone expand—their trade in high value horticultural products. The fear is that increasingly stringent food safety, phytosanitary, and other regulations in Europe will either overwhelm the capacities of suppliers and official agencies in developing countries to comply or restrict continued participation in this trade to relatively few growers and exporters due to the high compliance costs. The growing concentration of fresh produce distribution channels, under the coordination of major supermarket companies, is seen to exacerbate this challenge and further increase the barriers to continued market participation.
The Kenyan fresh produce experience offers a ray of hope. The Kenyan fresh produce industry—with the assistance of the Kenyan Government and of others—is effectively meeting the challenge presented by rising standards and using it as an opportunity to redefine the industry’s comparative advantage. For the past five to seven years significant elements of the industry have been transforming their production, packing, and broader supply chain operations both in response to and in anticipation of changes in official regulations and private standards or protocols. This ongoing transformation is enabling the leaders of the industry to reposition themselves into relatively more profitable and faster growing value-added segments of the European fresh vegetable market at a time when profit margins are generally under pressure in this business. With these investments and adjustment to the product mix has come substantial growth in employment within the industry.
In recent years, the fresh produce industry in Kenya has become more concentrated, although for nearly fifty years this trade has been dominated by a handful of companies. In an earlier era, the concentration of the trade stemmed from economies of scale in logistics and product sourcing and from superior overseas market relations. The standards factor is a newer element. Yet, this has had far more to do with meeting the quality, market service, and food safety standards of larger private customers than complying with official EU or Member State requirements.
The need for increased product control and traceability has also been an important (yet by no means the sole) factor contributing to more vertical integration within the industry. Smallholder farmers now account for a smaller proportion of (exported) supply than they have previously, although the total volume of smallholder production that is being exported has probably not declined. The feared marginalization of such growers is not inevitable. There are basic economic and agronomic reasons for many smallholders to continue in this trade, and a number of collaborative initiatives involving Kenyan exporters, industry associations, governmental agencies, and external support programs are making progress in raising the standards and enhancing the traceable documentation of smallholder production.
The operative standards in the fresh produce market derive from a combination of consumer preferences, private strategies and protocols, and laws and regulations. Various EU harmonization processes notwithstanding, many of the prevailing rules in this trade are demand-driven and thus vary substantially between different supply chains and segments of the European market. Private standards appear to dominate over official requirements in actual practice, although the former are certainly stimulated and conditioned by the latter.

From Challenge to Opportunity 60
Kenyan suppliers do not face one ‘standards regime’ in Europe, but many. Some customers demand extremely high standards for food safety management, environmental management, and the like, while others put primary emphasis on competitive pricing. This has resulted in a mirror image within the Kenyan industry with some firms aiming at the top of the market with value-added products and sophisticated management systems and others continuing to aim at a bulk produce market, providing satisfactory quality and service at reasonable prices.
Given evolving competitive pressures and the relatively high freight costs that the Kenyan industry incurs, it is not clear if the low price, low margin component of the Kenyan trade can sustain itself in the future. The future of the industry may therefore mimic the trends of the recent past. That is, Kenya’s exports will become increasingly focused on value-added products sold to and through those segments of the market that place an especially high value on well designed and documented systems of food safety and environmental management. Rather than be endangered by the escalation and proliferation of standards, the Kenyan industry seems to be embracing these standards and using them to competitive advantage. As importers and distributors on the European continent raise food safety and other requirements, Kenyan exporters believe that they will be well (and better) placed to service these customers.
A half-dozen export companies have already made substantial investments in modernized farming and packhouse operations and several other firms are in the process of making similar investments. Significant improvements continue to be made in food safety and more general management systems. While there was once an extended period of time during which little cooperation occurred among different firms and other stakeholders, the challenge of standards and of raising the industry’s competitiveness has engendered a vastly increased level of collaboration within the private sector and between the industry and the Government of Kenya. One exporter refers to this as “Kenya, Inc.”
More work remains, however. Within Kenya, important challenges remain to ensure the application of ‘good agricultural practices’ and to more fully demonstrate and document the safety of fresh produce sourced from smallholder farmers. Modalities will need to be developed to enable (smallholder) outgrower systems to meet EUREPGAP or similar requirements as the enforcement of these is likely to grow in coming years. For those SMEs that are contemplating a shift in business orientation from bulk produce to value-added production there are both financial and technical barriers that still need to be addressed. There is also a need to further strengthen the capacity of KEPHIS and to have it recognized by the EU as being a ‘competent authority’ for phytosanitary and quality inspection services.
On the market side, the efforts to harmonize regulations and inspection services within Europe are still a ‘work in progress’ and one that will become even more complicated with the upcoming expansion of the EU. Developing country suppliers are looking for predictability, transparency, and consistency in the further development and application of the governing rules of the game. In many respects, this is not the current norm. The Kenyan trade has thus far encountered relatively few official barriers to its trade into Europe and none that really can be regarded as unreasonable. Still, there is a general, although modest sense of unease about how the emerging rules—with regard to MRLs, phytosanitary matters, quality control, traceability, etc.—will in fact be officially enforced.
In Kenya and in Europe there is a perceived disconnect between the increasingly stringent regulations on paper and the actual capacities of most member states to enforce these rules. This implies that enforcement will continue to be done by inspection and testing of samples, drawn either randomly or, more likely, purposively. This means that the reputation of a country and of particular products will probably be a significant factor in how intensively one’s supplies are subjected to official inspection.

Conclusions
61
Kenya needs to protect its seemingly high reputation for ‘clean’, high-quality produce. Exporters are uncertain regarding the official penalties for infractions of emerging EU or Member State regulations. Will future infractions result primarily in official communications or warnings, or will there be some automaticity in the issuance of fines, in the detention of supplies, or in suspension of market access for particular suppliers or even entire countries?
Even without such clarity, Kenya growers and exporters go about their business under the assumption that standards compliance is a necessity—because it is currently demanded by their leading private customers and will be demanded by other customers in the near future. Other developing country suppliers should adopt a similar posture, although for those suppliers who are focusing on the ‘competitive price’ segments of the European fresh produce market there will likely remain a medium-term transition period over which they will need to strengthen their food safety and other risk management systems.
This paper has focused on the changing regulatory and market requirements and the strategies that Kenyan exporters have adopted in this environment. Little attention was given to dynamic changes taking place at the farm level, especially among smallholder farmers who produce vegetables both for the export and domestic markets. There is a need for farm-level survey work to better understand the types of agronomic changes that are having to be made and the more general welfare implications of these changes as well as changes in the industry’s product mix. Further analysis is also needed comparing the production and monitoring costs associated with smallholder and larger farm supplies of export vegetables, and other factors that may constrain further smallholder participation in this industry in the future. Ongoing initiatives to enhance the oversight and traceability of smallholder produce should be closely monitored and the need for additional public interventions in this area considered. Several researchers have begun to examine the welfare aspects of employment within Kenya’s horticulture industry, both at the farm and packhouse levels. More analysis is needed in this area with particular emphasis on how the emerging changes are affecting worker incomes, job security, and safety.

62
References
Buurma, J., M. Mengelers, A. Smelt, and E. Muller. 2001. “Developing Countries and Products Affected by Setting New Maximum Residue Limits of Pesticides in the EU”. Agricultural Economics Research Institute, The Hague.
Chan, Man-Kwun, and Bill King. 2000. “Review of the Implications of Changes in EU Pesticides Legislation on the Production and Export of Fruits and Vegetables from Developing Country Suppliers”. Natural Resources and Ethical Trade Programme.
COLEACP. 2001. “EU Imports of Fresh Fruit and Vegetables From 1994 to 2000”. Paris.
Collinson, Chris. 2001. “The Business Costs of Ethical Supply Chain Management: Kenyan Flower Industry Case Study”. Natural Resources Institute.
Covino, Daniela and Angela Mariani. 1999. “EU Agri-Food System: An Overview of Structure and Competitiveness”. in The European Agro-Food System and the Challenge of Global Competition. Rome: Ismea.
DEFRA (Department of Environment, Food, and Rural Affairs). 2001. National Food Survey 2000. (2002) Review of London Wholesale Markets. London: HMSO.
Dijkstra, T. 1997. “Commercial Horticulture by African Smallholders: A Success Story from the Highlands of Kenya“. Scandinavian Journal of Development, Vol 16, No 1: 49-74.
Dolan, Catherine, John Humphrey, and C. Harris -Pascal. 1999. “Horticulture Commodity Chains: The Impact of the UK Market on the African Fresh Vegetable Industry”. IDS Working Paper 96. Sussex, UK.
Dolan, Catherine and John Humphrey. 2000. “Governance and Trade in Fresh Vegetables: The Impact of UK Supermarkets on the African Horticulture Industry”. Journal of Development Studies 37 (2).
Dolan, Catherine and Kirsty Sutherland. 2002. “Gender and Employment in the Kenya Horticulture Value Chain”. Globalisation and Poverty Discussion Paper #8. Institute for Development Studies: Sussex, UK.
EC (Commission of the European Communities). 2000a. Report from the Commission on the Second Series of Visits to the Member States Pursuant to Article 5 of Council Directive 93/99/EEC With a View to Evaluating the National Systems for the Official Control of Foodstuffs. COM (1999) 751 (01).
———. 2000b. Pesticide Residue Monitoring Programme. http://europa.eu.int/comm/food/fs/inspections/fnaoi/reports/annual_eu/index_en.html
———. 2000c. Report on the Application of Article 7 of Council Directive 86/362/EEC and Article 4 of Council Directive 90/642/EEC, Concerning the Monitoring of Pesticide Residues.
———. 2001d. Report from the Commission to the Council on the State of Implementation of Regulation (EC) No 2200/96 on the Common Organisation of the Market in Fruit and Vegetables.
European Coordination Office. 1998. Eurobarometre 49: La Securite des Produits Alimentaires. Brussels. http://europa.eu.int/comm/dgs/health_consumer/library/surveys/eb49_fr.pdf

References
63
Garcia, Marian, Nigel Poole, and Gh islaine Mennesson. 2002. “The Impact of European Private Safety and Quality Standards on Fresh Produce Exports from Mediterranean Countries”. Imperial College at Wye, University of London.
Harris, Craig, P. Vincent Hegarty, et al. 2001. “The Impacts of Standards on the Food Sector in Kenya. Institute for Food and Agricultural Standards”. Michigan State University. Report for the United States Agency for International Development.
Henson, Spencer, and others. 2002. Sanitary and Phytosanitary Requirements and Developing Country Agro-Food Exports: Methodological Guidelines for Country and Product Assessments. World Bank.
Humphrey, John. 2002. “The Kenya Fresh Vegetable Export Sector”. Processed.
Jaffee, Steven. 1990. Alternative Marketing Institutions for Agricultural Exports in Sub-Saharan Africa with Special Reference to Kenyan Horticulture. Unpublished D. Phil Thesis, University of Oxford, Oxford, UK.
———. 1994. “Contract Farming in the Shadow of Competitive Markets: The Experience of Kenyan Horticulture”. in Little, Peter and Michael Watts. 1994. Living Under Contract: Contract Farming and Agrarian Transformation in Sub-Saharan Africa. Madison: University of Wisconsin Press.
———. 1995. “The Many Faces of Success: The Development of Kenyan Horticultural Exports”. in Jaffee, S. and J. Morton, eds. Marketing Africa’s High-Value Foods: Comparative Experiences of an Emergent Private Sector. Dubuque, Iowa: Kendall/Hunt Publishing Company.
Jensen, Michael Friis. 2003. “Food Safety Requirements and Smallholders: A Case Study of Kenyan Fresh Produce Exports”. Unit of Economics, the Royal Veterinary and Agricultural University, Copenhagen, Denmark. Processed.
Kenya Bureau of Standards. 2002. Kenya Standard: Code of Practice for the Horticultural Industry. Nairobi.
Lambert, Andrew. 2002. “A Scoping Study for Detailed Case-Studies of Trade Facilitation/Export Promotion Projects for Non-Traditional Agricultural Products in Sub-Saharan Africa”. World Bank. Processed.
McCulloch, Neil and Masako Ota. 2002. “Export Horticulture and Poverty in Kenya. Paper presented at Conference on Globalisation and Inequality”. Centre for the Study of Globalisation and Regionalisation, University of Warwick.
Michalik, Susanne. 1998. “Kenya Safe Use Project: 1998 Audit Results”. Global Crop Protection Federation. Nairobi.
Mosi, R.O. and E.S. Ariga. 1998. “An Assessment of the Performance of Training Initiatives on Safe Use of Pesticides in Eastern Province of Kenya”. Processed.
Noor, Halima. 2001. “The Impact of SPS Measures on Kenya.” presented at a Consumer Unit and Trust Society (CUTS) seminar, Negotiating Agenda for Market Access: Cases of SPS & TBT, organized on 24-25 April, 2001 in Geneva, Switzerland. http://cuts.org/sps-analysis -sps_case_kny.htm
Pesticides Initiative Programme. 2001. General Presentation.
Stevens, C. and J. Kennan. 2000. “Will Africa’s Participation in Horticulture Chains Survive Liberalisation?” Working Paper No. 106. Institute of Development Studies.
Pesticide Residues Committee, Food Standards Agency, Government of the United Kingdom. Various years. Pesticide Residues Monitoring Reports. London. http://www.foodstandards.gov.uk/science/surveillance/prcstatement

From Challenge to Opportunity 64
Schapiro, M. and Wainaina, S. 1991. “Kenya’s Export of Horticultural Commodities”. Public Administration and Development. 11 (3): 257-61.
Swoffer, Kevin. 2002. “BRC Food Technical Standard: An Overview”. Presentation at the Keesing Conference, November 14, 2002.
Tassinari, V. 2001. “The Retailing Sector and the Development of New Technologies”. Paper presented at the AIEA2 Conference, Bologna, Italy.
Thoen, Ronaldt, Steven Jaffee, and Catherine Dolan. 1999. Equatorial Rose: The Kenyan-European Cut Flower Supply Chain. World Bank. Processed.
Weindlmaier, Hannes. 2000. “The Value-added Chain in the German Food Sector.” in Tangermann, S., ed. Agriculture in Germany. Frankfurt am Main: DLG Verlag.