Embed Size (px)
Citation preview
Document of
The World Bank
FOR OFFICIAL USE ONLY FILE COFP Y
Report No. 2180-ME
STAFF APPRAISAL REPORT
SMALL-SCALE AGRICULTURAL INFRASTRUCTURE PROJECT
MEXICO
December 1, 1978
Regional Projects DepartmentLatin America and the Caribbean Regional Office
This document has a restrieted distribution and may be used by recipients only in the performance oftheir official duties. Its contents may not otherwise be diselosed without World Bank authorization.
Pub
lic D
iscl
osur
e A
utho
rized
Pub
lic D
iscl
osur
e A
utho
rized
Pub
lic D
iscl
osur
e A
utho
rized
Pub
lic D
iscl
osur
e A
utho
rized
Pub
lic D
iscl
osur
e A
utho
rized
Pub
lic D
iscl
osur
e A
utho
rized
Pub
lic D
iscl
osur
e A
utho
rized
Pub
lic D
iscl
osur
e A
utho
rized
CURRENCY EQUIVALENTS
US$1 = Mex$23Mex$1 = US$0.0435Mex$1 million = US$43,500
WEIGHTS AND MEASURES
Metrie System British/US System
1 millimeter (mm). 0.04 inches1 meter (m) 3.28 feet1 kilometer (km) 0.62 miles
1 hectare (ha) 2.47 acres1 m ton 0.98 long ton
1 cubic meter per second (m 3/s) 35.35 cubic feet per second1 liter per second (l/s) 15.84 gallons per minute1 liter per second per hectare (l/s/ha) 6.41 gallons per minute per acre
ABBREVIATIONS
CONASUPO - National Marketing CorporationIDB - Inter-American Development BankOHDR - General Directorate Hydraulic Works and Agricultural Engineering
for Rural DevelopmentPIDER - Investment Program for Rural DevelopmentPLAMEPA - Plan for Improving On-farm Irrigation PracticesPNDR - National Plan for Small-Scale Agricultural Infrastructure
DevelopmentSAO - Undersecretariat of Agriculture and OperationSARH - Secretariat of Agriculture and Hydraulic ResourcesSIH - Undersecretariat of Hydraulic InfrastructureSPP - Secretariat of Programming and BudgetingSUDR - General Subdirectorate for Supervision of Rural Development Units
GOVERNMENT OF MEXICOFISCAL YEAR
January 1 - December 31
MEXICOFOR OFFICIAL USE ONILY
SMALL-SCALE AGRICULTURAL INFRASTRUCTURE PROJECT
Table of Contents
Page No.
I. BACKGROUND ............................... 1
A. Project Background ....... ................ .......... 1
B. The Agricultural Sector ..... ............... 1
C. Bank Participation .......................... 4
II. THE NATIONAL PLAN FOR SMALL-SCALE AGRICULTURALINFRASTRUCTURE DEVELOPMENT . ................ .......... 5
A. Institutional Framework ........................... 5
B. Historic Development and Present Situation ........ 8
C. The Future Outlook ................................ 11
III. THE PROJECT ........................................... 13
A. Description ................. ....................... 13
B. Organization and Management ..... .................. 15
C. Status of Project Preparation ................... .. 15
D. Design Standards ..................... ................ 17
E. Sub-project Appraisal ...... ....................... 18
F. Project Implementation ..... ....................... 19
G. Cost Estimates ....... ............................. 19
H. Financing ......................................... 21
1. Procurement ..................... .22
J. Disbursements .......... ............... ............ 23
K. Monitoring and Evaluation ..... .................... 23
L. Accounts and Auditing ...... ....................... 24
IV. AGRICULTURAL DEVELOPMENT .............................. 24
A. Irrigation Sub-projects ..... ...................... 24
B. Drainage Sub-projects ..... ........................ 25
C. Livestock Sub-projects ............................ 26
V. BENEFITS AND JUSTIFICATION ..... ....................... 27
A. Project Production, Demand and Marketing .......... 27
B. Beneficiaries ....... .............................. 28
C. Project Charges . . ............ 29
D. Economic Rate of Return and Sensitivity Analysis .. 31
E. Project Risk ...................................... 32
F. Environmental Impact ...... ........................ 32
VI. ASSURANCES OBTAINED DURING NEGOTIATIONS AND RECOMMENDATION 33
This report is based on the findings of an appraisal mission that visited Mexico
in April 1978. The mission comprised Mr. Carlos G. Moret and Ms. Althea L.
Duersten (IBRD) and Messrs. Enrique Franco and Patrick A. Domenico (Consultants).
This document has a restricted distribution and may be used by recipients only in the performanceof their official duties. Its contents may not otherwise be disclosed without World Bank authorization.
Table of Contents (cont'd)
ANNEXES
1. Supporting Tables and Charts
Tables
1. General Directorate of Hydraulic Works and AgricultureEngineering for Rural Development. Staff
2. Table of Contents of a Project Report3. General Subdirectorate for Supervision of Rural Development
Units. Staff4. Selected Indicators of the Third Stage of National Plan for
Small Scale Agricultural Infrastructure Development5. Key Technical Data of Selected Irrigation Sub-projects6. Summary Sheet for irrigation and/or drainage sub-projects7. Tubewells Development. Execution Cost Estimates8. Pumping Plants Development. Execution Cost Estimates9. Storage Dams Development. Execution Cost Estimates
10. Drainage Development. Execution Cost Estimates11. Project Cost Estimates12. Estimated Schedule of Expenditures13. Equipment for Studies14. Equipment for Construction15. Schedule of Disbursements
16-19. Sub-project: Valle de Canindo (Tubewell Development)Investment Costs; Development Period; Projected Land Use,Production and Income; Farm Budget
20-23. Sub-project: Los Laguneros (Tubewell Development)Investment Costs; Development Period; Project Land Use,Production and Income; Farm Budget
24-27. Sub-project: Dos Rayas (Pumping Plant Development)Investment Costs; Development Period; Projected Land Use,Production and Income; Farm Budget
28-31. Sub-project: Santa Teresa (Storage Dam Development)Investment Costs; Development Period; Projected Land Use,Production and Income; Farm Budget
32-35. Sub-project: Nacajuca (Drainage Development)Investment Costs; Development Period; Projected Land Use,Production and Income; Farm Budget
36-39. Sub-project: Miguel Hidalgo (Livestock Infrastructure:Dual Purpose Development)Investment Costs; Herd Projection; Projected Production
and Income; Farm Budget40. Rent and Cost Recovery Indices41. Prices Used in Economic and Financial Analysis42. Economic Rates of Return and Sensitivity Analysis
Table of Contents (cont'd)
Charts
1. Organization of the General Directorate of Hydraulic Worksand Agricultural Engineering for Rural Development
2. Organization of the General Subdirectorate for Supervisionof Rural Development Units
2. Documents Avaílable in Project File
MAP
IBRD 13930

MEXICO
SMALL-SCALE AGRICULTURAL INFRASTRUCTURE PROJECT
1I. BACKGROUND
A. Project Background
1.01 The proposed project would be a part of an on-going program for
agricultural development, based mainly on small-scale irrigation and dating
back to 1937, when the Directorate for Small-Scale Irrigation was created
within the National Commission for Irrigation with the purpose of benefittingsmall groups of low-income farmers. More recently, in 1967, the Government
established the National Plan for Small-Scale Irrigation, aímed at system-
atizing the approach to small-scale irrigation development. As a consequence
of the merger in December 1976 of the Secretariat of Hydraulic Resources and
the Secretariat of Agriculture and Livestock into the Secretariat of Agriculture
and Hydraulic Resources (SARH), the scope of the small-scale irrigation programwas enlarged to include infrastructure works for drainage and livestock devel-
opment and became the National Plan for Small-Scale Agricultural Infrastructure
Development (PNDR).
B. The Agricultural Sector
Agricultural Production
1.02 During the 1945-65 period, Mexico's crop output grew at a rapidaverage annual rate of 6%. 1/ Major causes were rapid expansion of irrigation,
supplemented by successful efforts in research directed to irrigated crops.
The increasing physical complexity and higher costs of large-scale irrigation
schemes and the lack of alternative strategies, together with the slowing down.
of private investments derived from the uneasiness felt by many land-owners
regarding the security of their land titles, were probably the main factors
leading to a substantial drop in the sector's growth rate, which for the1965-76 period was estimated at a mere 1%, well below the demographic growth
of 3.5% p.a. As a consequence, despite a sustained growth of about 4% p.a. in
livestock production, agriculture's share in Mexico's GDP decreased from 18%in 1955 to 10% in 1975.
Foreign Trade
1.03 Concurrent with the production trend, the agricultural trade balance
deteriorated during the early 1970s, although it recovered sharply in 1976 due
1/ Source: Banco de Mexico.
- 2 -
mainly to the abrupt jump in coffee prices. Owing to the advantage derived
from their relative prices, oilseeds and sorghum displaced wheat and maize to
an appreciable extent, particularly in irrigated areas, which brought about
large imports of these cereals while imports of oilseeds and sorghum are still
necessary. Adverse conditions of international markets caused a decline in
exports of cotton, vegetables and beef, while sugar exports fell to zero in
1976 since the moderate increase of production was absorbed by the growing
domestic demand.
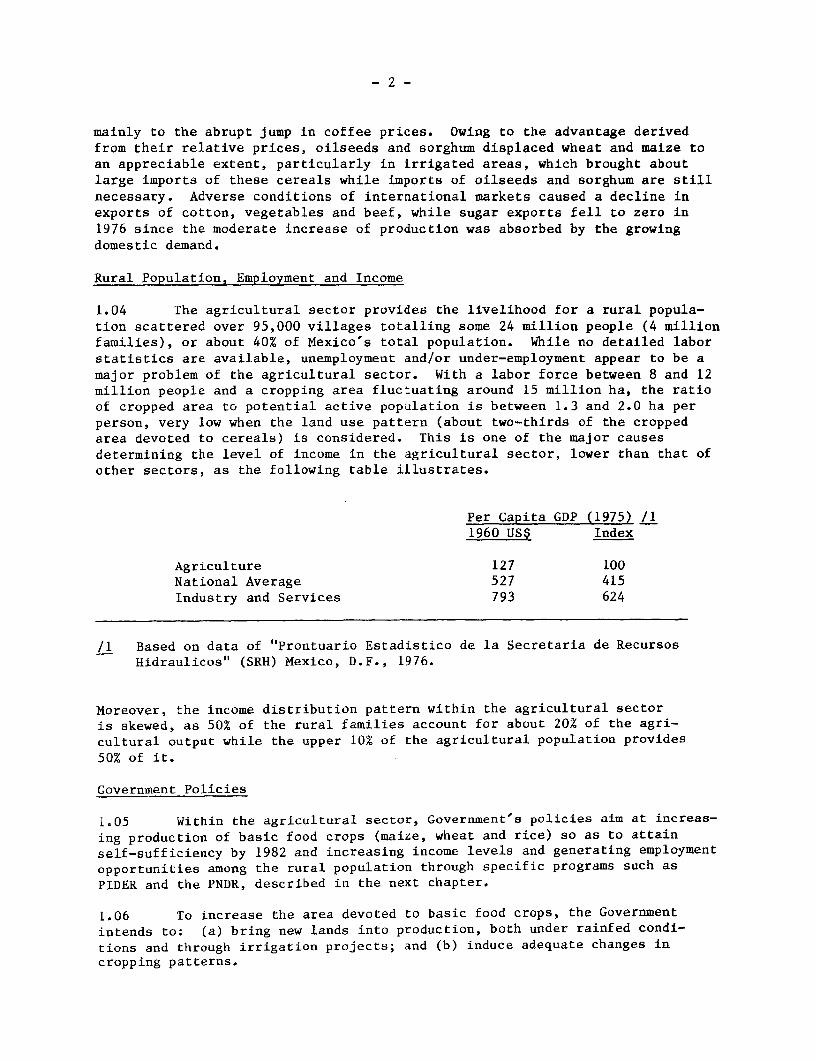
Rural Population, Employment and Income
1.04 The agricultural sector provides the livelihood for a rural popula-
tion scattered over 95,000 villages totalling some 24 million people (4 millionfamilies), or about 40% of Mexico's total population. While no detailed labor
statistics are available, unemployment and/or under-employment appear to be a
major problem of the agricultural sector. With a labor force between 8 and 12
million people and a cropping area fluctuating around 15 million ha, the ratio
of cropped area to potential active population is between 1.3 and 2.0 ha per
person, very low when the land use pattern (about two-thirds of the cropped
area devoted to cereals) is consídered. This is one of the major causesdetermining the level of income in the agricultural sector, lower than that ofother sectors, as the following table illustrates.
Per Capita GDP (1975) /11960 US$ Index
Agriculture 127 100Natíonal Average 527 415Industry and Services 793 624
/1 Based on data of "Prontuario Estadistico de la Secretaria de RecursosHídraulicos" (SRH) Mexico, D.F., 1976.
Moreover, the income distribution pattern within the agricultural sectoris skewed, as 50% of the rural families account for about 20% of the agri-
cultural output while the upper 10% of the agricultural populatíon provides
50% of it.
Government Policies
1.05 Within the agricultural sector, Government's policies aim at increas-
ing production of basic food crops (maize, wheat and rice) so as to attainself-sufficiency by 1982 and increasing income levels and generating employmentopportunities among the rural population through specific programs such asPIDER and the PNDR, described in the next chapter.
1.06 To íncrease the area devoted to basic food crops, the Governmnentintends to: (a) bring new lands into production, both under rainfed condi-
tions and through irrigation projects; and (b) induce adequate changes incropping patterns.
(a) Development of New Lands. Development of new rainfed lands isgetting underway mainly in the humid tropical zone, where an area of about8 million ha, at present unutilized or underutilized is estimated to havemedium to high agricultural potential. In this context, the Bank recently(April 1978) approved a US$56 million loan for a Tropical AgriculturalDevelopment Project (Loan 1554-ME). In the short term, development of newlands under irrigation would continue to take place mainly under the small-scale program and, in selected cases, medium and large conventional projectswould also be undertaken. In the long term, however, large-scale irrigationprojects will continue to be developed, although, due to their increasingphysical complexity, high investments and long gestation periods, futurelarge schemes are expected to yield lower benefit-cost ratios than the project:ssuccessfully implemented in the past. Thus, while priority should be givento improving water use efficiency and rehabilitating deteriorated projects,it may be well justified in the national interest, to carry out in due coursethe Government plans for the full use of the nation's still unused hydraulicpotential, which would bring the area under large-scale irrigation projectsto an impressive total of about 7.5 million hectares and about 2.5 millionhectares under small-scale projects (para 2.22) by the end of the century.
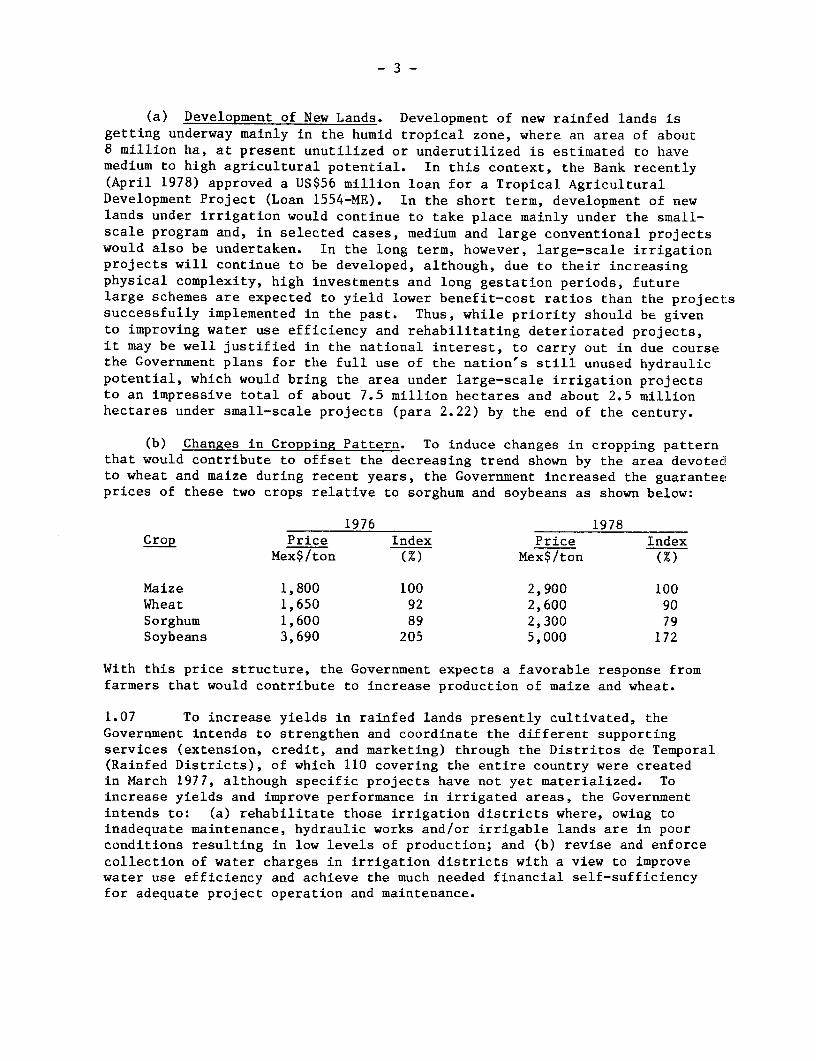
(b) Changes in Cropping Pattern. To induce changes in cropping patternthat would contribute to offset the decreasing trend shown by the area devotedto wheat and maize during recent years, the Government increased the guaranteeprices of these two crops relative to sorghum and soybeans as shown below:
1976 1978Crop Price Index Price Index
Mex$/ton (%) Mex$/ton (%)
Maize 1,800 100 2,900 100Wheat 1,650 92 2,600 90Sorghum 1,600 89 2,300 79Soybeans 3,690 205 5,000 172
With this price structure, the Government expects a favorable response fromfarmers that would contribute to increase production of maize and wheat.
1.07 To increase yields in rainfed lands presently cultivated, theGovernment intends to strengthen and coordinate the different supportingservices (extension, credit, and marketing) through the Distritos de Temporal(Rainfed Districts), of which 110 covering the entire country were createdin March 1977, although specific projects have not yet materialized. Toincrease yields and improve performance in irrigated areas, the Governmentintends to: (a) rehabilitate those irrigation districts where, owing toinadequate maintenance, hydraulic works and/or irrigable lands are in poorconditions resulting in low levels of production; and (b) revise and enforcecollection of water charges in irrigation districts with a view to improvewater use efficiency and achieve the much needed financial self-sufficiencyfor adequate project operation and maintenance.
- 4 -
C. Bank Participation
1.08 In the past five years (FY 1974-78) Bank participation in theagricultural sector amounted to US$835 million distributed over nine projectsas follows: irrigation (Panuco, Siía¿loa and Bajo Bravo/Bajo San Juan),US$174 million; rural development (PIDER 1 and II and Papaloapan Basin),US$280 million; credit (Fifth and Sixth projects), US$325 miliíon; and areadevelopment (Tropical Agriculture), US$56 míllion. Irrigation projectsencountered initial difficulties derived from inadequate project design and/orunexpected high price increases; these circumstances led to reformulation ofthe Bajo Bravo/Bajo San Juan project with subsequent cancellation of US$100(from an original loan of US$150 million) and to a supplementary loan ofUS$25 million, approved by the Bank on July 11, 1978 to assist financíng costoverruns of the Panuco project. A project to complete the works of theSinaloa Irrigation project and rehabilitate the Rio Fuerte IrrigationDistrict has been recently appraised (September 1978), for which a loanis under consideration. With these actions, implementation of the aboveprojects is now progressing satisfactorily. PIDER I and II are multi-sectoral projects designed for improving living conditions and increasingproductivity in localized small areas of rural poverty ("micro-regions").After some difficulties inherent to their nature, overall progress of theseprojects is improving along with steps taken to decentralize the decision-making process, although the success in carrying out the different componentsof the project varíes with the implementation capacity of the agenciesinvolved. The Papaloapan project had also a very slow start due to a severeshortage of budgetary allocatíons, a situation that now is being correctedwith a recent appropriatíon of funds (September 1978). Disbursement paceof the Fifth Credit project was faster than projected, although lately hasslowed down with respect to funds earmarked for low-income producers; inany case, the project is expected to be completed about six months beforeclosing date (January 1, 1980). The Sixth Credit project and the TropicalAgriculture project were signed on September 27, 1978; both loans are ex-pected to be effective before the end of the CY1978.
1.09 A Project Performance Audit (OED's Report 1573, April 27, 1977)on the Third Credit Project (Loan 747-ME) pointed out that the project madea significant contribution to improve financial assistance to commercialfarmers, but noted that technical aspects at farm level were to be improved;to thís aim, specific actions for monitoring agricultural development wereintroduced in the Fifth and Sixth Credit projects.
1.10 Bank assistance for the development of Mexican agriculture willprobably continue to focus on: (a) small-scale infrastructure projectswithin PNDR's framework; (b) water control projects, oriented toward rehabili-tation of irrigation districts or drainage and/or flood control projects;(c) development of new lands in the humid and sub-humid zones; (d) technicalassistance programs oriented toward ímprovíng performance of rainfed agricul-ture; (e) agricultural credit with a view to meeting the needs of (i) generaldevelopment programs drawn on a regional basis and/or (ii) specific projects,be they local or national; (f) rural development programs; and (g) selectedconventional irrigation projects.
- 5 -
II. TRE NATIONAL PLAN FOR SMALL-SCALE AGRICULTURAL
INFRASTRUCTURE DEVELOPMENT (PNDR)
A. Institutional Framework
2.01 The administrative structure of SARH rests on the following sevenunits: five undersecretariats (Planning; Hydraulic Infrastructure; Agricultureand Operation; Livestock; and Forestry); a Coordinating Office and an Admin-istrative Office. Responsibility for PNDR is shared by two undersecretariats:Hydraulic Infrastructure (SIH), for execution of project works; and Agricul-ture and Operation (SAO), for supervision and technical assistance.
The General Directorate of Hydraulic Works and Agricultural Engineeringfor Rural Development (OHDR)
2.02 Within SIH, the administrative unit in charge of PNDR is OHDR,whose structure comprises three levels: national, regional and state.A description of the functional structure of OHDR is given in followingparagraphs and its organization ís shown in Annex 1, Chart 1.
2.03 At headquarters, in Mexico D.F., OHDR has eight subdirectorates:Development Programs; Specific Studies; Projects; Hydraulic Engineering;Construction; Rural Engineering; Monitoring and Statistics; and Administra-tive Services. As of April 78, OHDR professional and technical supportstaff numbered 1,550, of which 404 are at headquarters. Annex 1, Table 1,gives a detailed breakdown of staff by regions and disciplines.
2.04 The Subdirectorate of Development Programs is both the startingand finishing unit of the project preparation process; it is responsiblefor the programming and budgeting of OHDR as well as reviewing the finalreports (para. 2.07) of the sub-projects submitted to the Secretariat ofProgramming and Budgeting (SPP) for approval prior to be included in PNDR.
2.05 At design stage, four subdirectorates are responsible for thetechnical aspects of PNDR; they are: Specific Studies, Projects, Hydrau-lic Engineering, and Rural Engineering. These subdirectorates assistregional offices in project preparation when technical complexities sorequire and supervise the engineering aspects of project reports. TheSubdirectorate of Construction is responsible for supervising the regionaloffices in the execution of project works. Physical progress of PNDRis followed up by the Subdirectorate of Monitoring and Statistics, whichis also in charge of preparing the progress reports to be submitted tofinancing institutions.
2.06 For the purpose of OHDR activities, the Mexican Republic is dividedinto four administrative regions (Map IBRD 13930): Northwest, with regional
-6-
headquarters in Hermosillo, Son; Northeast, in San Luis Potosi, S.L.P.;Central, in Queretaro, Qro.; and Peninsula and Isthmus, in Merída, Yuc. TheRegional Offices were created on January 11, 1974 with a view to expeditingthe administrative process and strengthening the preparation, construction
and supervision of projects included in PNDR. Regional Offices are headed by
a Deputy Regional Director, directly reporting to the General Director and
structured in departments whose titles and functions are parallel to those ofthe sub-directorate at headquarters. A detailed breakdown of regíonal staff,1,146 throughout the country, is shown in Annex 1, Table 1.
2.07 The Regional Offices are responsible for preparing their regions'plans, the report (expediente integrado) of each proposed sub-project and thephysícal implementation of sub-projects, be it by force account or contract.
Sub-project reports, which are prepared according to the standard guidelinesset forth by the central offíce, include: detailed engineering studies,
agricultural development plans, analysis of social and economic benefits andthe Convenio de Participacion (para 2.08) signed by all beneficiaries. As anillustration, Annex 1, Table 2, shows the table of contents of the report of
an actual case: a groundwater development sub-project, Valle de Canindo,which has been chosen as one of the representative sub-projects to be financedunder the proposed loan.
The Users' Association
2.08 A key feature of project implementation is the role played by the
beneficiaries themselves who, for each sub-project, are organized in aUsers' Association. The Federal Water Law (Art. 77) establishes that, atproject level, such users' associations--managed by an elected executive
committee--are responsible for the administration, operation and maintenanceof the subproject. After completing the preliminary studies for a sub-project
and before undertaking its execution, the Users' Association and SARHenter into a participation agreement (Convenio de Participacion) whichspecifically establishes that users' share in project financing will be
equivalent to 30% of total project cost, of which up to 10% can be contri-
buted as labor; the remainder will be in cash, either by financing, usuallythrough credit, the purchase of equípment or by means of annual payments tothe Users' Association. In addition, users must provide evidence of theirlegal right to use the land (ownership or possession) and, through their
Association, commit themselves to (a) receiving the works when SARH so deter-mines, and (b) establishing and collecting water charges to cover operationand maintenance of the project and, when applicable, to recover the users'cash contribution toward project cost.
The General Subdirectorate for Supervision of Rural Development Units (SUDR)
2.09 Within SAO, the unit in charge of supervising the operations ofPNDR and providing technical assistance to users' associations is SUDR, underthe General Directorate of Irrigation Districts and Rural Development Units.
- 7 -
While SUDR is also organized at national, regional and state levels, its basicactivities are carried out at state level under the supervision of the regionaloffices, whose territories coincide with those of OHDR. Details of SUDRfunctions are given in following paragraphs and its organization is shown inAnnex 1, Chart 2.
2.10 SUDR is divided into three departments: Rural Development; Tech-nical Services; and Evaluation and Statistics. As of April 1978, professionaland technical support staff numbered 1,615 of which only 44 were stationedat headquarters. Annex 1, Table 3, shows a breakdown of staff by regions andlevel.
2.11 The Rural Development Department is in charge of providing tech-nical assistance to PNDR beneficiaries. Prior to the merger of the two formersecretariats of Hydraulic Resources and Agriculture, emphasis was on irrigationtechniques, through a successful specific program, partly financed by theInter-American Development Bank (IDB): the Plan for Improving On-farm Irri-gation Practices (PLAMEPA). Currently, however, under PNDR's broader scope,general agricultural extension is provided by SUDR, using both its own regionalstaff and extension agents from the General Directorate of Extension andAgricultural Production, also within SAO.
2.12 The Technical Services Department is primarily responsible forpreparing farm plans, including credit requirements, and monitoring theagricultural, economic and social development at sub-project level.Each sub-project is monitored using a standard "master sheet" on which thefollowing information is recorded:
(a) Basic Data
- soil classification- land tenure (number of users, farm size, and such)- description of project works
(b) Water Use
- projected- actual
(c) Agricultural Development
- cropping pattern- inputs- credit- yields, production.- gross value of production
This information, which is recorded annually, is used to analyze the users'payment capacity and advise the users' associations in imposing water charges
- 8 -
to properly operate and maintain project facilities. In additíon, the Tech-nical Services Department 1s also responsible for assessing the performanceof users' associations.
2.13 The Evaluation and Statistics Department receives the field informa-tion and evaluates PNDR as a whole; it is the unit in charge of preparingperiodic reports on project development to be submitted to financing insti-tutíons.
B. Historic Development and Present Situation
2.14 Small-scale irrigation projects were initially conceived as a meansto reach the most depressed sector of the rural population. More than 90%of the area brought under irrigation by PNDR belongs to ejidos, a legalentity 1/ which, in essence, consists of the right of the rural communitiesto enjoy the usufruct of lands whose ownership remains with the Federation,and defines the rights of individual members, the ejidatarios, to share theusufruct right of their community. In the early stages of the Plan Nacionalde Pequena Irrigacion, many of these projects were justified on social ratherthan on purely economic grounds. During the previous six-year period (1971-76),however, more attention was paid to the economic aspects of the program as alogical consequence of the systematization brought about by its growth. Theprogram has been largely supported by the IDB, which has made 11 loans amountingto US$225 million to assist financing US$547 million worth of small scaleirrigation projects. IDB support of small-scale irrigation projects amountsto about 50% of its total contribution (US$520) to finance irrigation projectsand related supporting services (PLAMEPA, for example) in Mexico.
2.15 A related plan, the Investment Program for Rural Development (PIDER),was launched by the Government in 1973 with the objective of channeling multi-sectorial public investment packages, which include small-scale irrigation, inselected "micro-regions." 2/ PIDER is supported by IBRD (Loans 1110-ME,
1/ The concept of the ejido existed, de jure and de facto, during thecolonial period. Within the context of Mexican agrarian reformthe word first appeared in 1911, when Emiliano Zapata demanded therestitution of the ejido lands to the communities. The Constitutionof 1917 (Art. 27) recognized the ejido; further, the Ley de Ejidosof December 28, 1920, the Ley de Dotaciones y Restitucion de Tierrasof April 23, 1927 and Ley Federal de Reforma Agraria of March 16,1971 are the most relevant pieces of legislation regulatingthe ejidos.
2/ Micro-regions comprise an average of 50,000 people located in twoto seven contiguous rural municipalities within a state. They areselected using criteria that balance poverty levels (per capita incomeaveraging below US$100) with potential for income-increasing produc-tíve activities.
-9-
US$110 million, and 1462-ME, US$120 million) and IDB (one loan, US$40 million).Responsibility for implementation rests with the participating agencies underthe coordination of SPP, whose role vis-a-vis small-scale irrigation islimited to selecting the micro-regions where projects included in PIDER are tobe executed and appropriating financial resources. All other activitiesrelated to project execution--design, construction, contracting, and thelike--are carried out by OHDR, for which PIDER is simply one among its severalfinancial sources, which in 1976 supplied about 5% of its annual budget,a contribution that was raised to about 10% in 1977, is currently (1978) ata level of 15% and is expected to reach 25% in 1979. According to PIDERsources, the steady growth of its contribution to OHDR's budget is due tothe fact that the small-scale irrigation program is one of the most efficientwithin PIDER.
2.16 PNDR is now in its Fourth Stage; selected indicators of small scaleirrigation works completed under previous stages are summarized below:
InvestmentPNDR Stage Year Area Families Total Per ha Per FamJiv
(ha) (No.) (Mex$ mil.) --------(Mex$)--------
lst 67-69 119,100 47,000 1,200 10,100 25,5002nd 70-73 95,000 70,000 1,525 16,100 21,8003rd 74-76 89,400 39,100 1,621 18,100 41,500
Total 303,500 156,100
In addition to the above, under the Fourth Stage, about Mex$2,700 millionworth of irrigation infrastructure will be completed on about 61,000 ha,benefitting about 19,000 families; thus, in the Fourth Stage, the investmentper ha and per family would be, respectively, Mex$44,300 (US$1,920) andMex$142,100 (US$6,180).
2.17 To further illustrate the scope and results of PNDR, Annex 1,Table 4, presents a fairly detailed analysis of sub-projects larger than25 ha included in the Third Stage. The following remarks summarize themost relevant findings:
(a) 84% of irrigation sub-projects were based on groundwaterdevelopment;
(b) average family holding was 3.4 ha, ranging between 2.5 ha inthe Central Region and 4.9 ha in the Northwest Region;
(e) average investment per ha was US$1,410 ranging between US$700in the Isthmus and Yucatan Region and US$1,530 in the NorthwestRegion 1/;
1/ Based at the then prevailing rate: US$1 = Mex$12.50.
- 10 -
(d) average investment per family was US$4,760, varying betweenUS$2,100 in the Isthmus and Yucatan Region and US$7,540 in theNorthwest Region;
(e) in relative terms, average incremental gross value of productionper ha was seven times that of the pre-project situation; thehighest íncrement was obtained in the Isthmus and Yucatan Region(1,325%) and the lowest in the Central Region (630%);
(f) average incremental family income was US$1,540, or about four timesthat of the pre-project situation; the highest increment, US$2,460per family, or 770% over the pre-project situation, was obtained inthe Northeast; the lowest increment, US$820, or 280% over thepre-project situation, was obtained in the Isthmus and YucatanRegion;
(g) when referred to the hectare, the average incremental grossvalue of production was 56% of the investment; the highestratio was 68% in the Central Region and the lowest 35% inthe Northwest Region; and
(h) the ratio between the average incremental family income and theaverage gross value of production per family was 58%, rangingbetween 50% in the Central Region and 83% in the NortheastRegion; this is an índex of which part of the incrementaloutput of the project remains with the rural family.
2.18 An evaluation of PNDR was carried out in 1975 by SPP and SARH (thenSecretariat of the Presidency and Secretariat of Hydrulic Resources, respec-tively) and submitted to IDB. Conclusions of the Mexican agencies and IDB maybe summarized as follows:
(a) about 90% of the projected area was actually under irrigation;
(b) substantial improvements were made regarding;
(i) completion of on-farm works;
(ii) clarification of land tenure situations (since definition offarmers' rights to the.land is a condition for sub-projectappraisal);
(iii) organization and effectiveness of users' associations; and
(iv) project implementation (construction and agricultural develop-ment) periods decreased from five years in the First Stage tothree years in the Third Stage;
(c) double cropping is widely practiced;
(d) most sub-projects yield an EER better than 14%, with highestreturns in pumping sub-projects and lowest returns in storage
- 11 -
dam sub-projects; results were lower than expected in about15% of the sub-projects;
(e) about 95% of the area under irrigation has access to agriculturalcredit;
(f) operation and maintenance are satisfactory; water chargesimposed to that effect by the users' associations are fullypaid by farmers, although conversely, annual charges to coverfarmers' contríbution toward project cost were not yet collected
(paras 4.08 and 4.09); and
(h) in summary, "overall results are perfectly acceptable and, in
some respects, higher than the projected targets" 1/
2.19 In addition to the economic and social results, the institutionbuilding aspects are a major outcome of the program. OHDR has executed irri-
gation works on some 360,000 ha and SUDR is supervising operations on andproviding technical assistance over about 1,100,000 ha, which comprise the
area brought under irrigation by OHDR plus an additional area of some 700,000
ha of small-scale irrigaton works (executed outside of PNDR by private farmers,states or other entities) that, under provisions of Federal Water Law (Art.
73), have been brought into PNDR for the purpose of improving land and water
use through the supervision and. technical assistance provided by SUDR. On
grounds of the evaluation carried out by the Mexican agencies and IDB and
based also on its own knowledge of the small-scale irrigation program, the
Bank is of the opinion that both ORDR and SUDR are efficient organizations,which, with a highly motivated and qualified staff at headquarters and regional
offices and effective administrative structures, have made major contributions
to the successful development of PNDR.
C. The Future Outlook
2.20 For the "Sexenio" 1977-82, the current Mexican Administration setthe targets of PNDR at developing 570,000 ha and benefitting about 200,000
families with a total investment of US$840 million. The projected breakdown
of the total area is:
Type of Infrastructure Works Area (ha)
Irrigation 350,000Drainage 100,000Livestock 120,000
1/ IDB, Appraisal Report of the Fourth Stage of PNDR, PR-791-A, ME-0046.
Dec. 21, 1976, para 2.44.
- 12 -
The irrigation program, of which about 64% would be groundwater development,is proceeding satisfactorily, at a pace of about 60,000 ha per year; the
drainage program has recently started while the livestock program will be
initiated under the Fifth Stage. From past experience and current status of
studies, it appears that the irrigation and drainage programs are likely to
attain their targets; conversely, it seems doubtful that the livestock infra-
structure program can move fast enough to complete about 30 to 40,000 ha per
year.
2.21 In addition to the Fifth Stage, ORDR plans to launch further stages
to complete the financing of its six-year program and foresees that IDB
and IBRD will continue supporting PNDR. Thus, subject to the development
of the Fifth Stage, it is expected that a repeater project will be proposedto the Bank in two or three years.
2.22 Over the long term, PNDR 1s expected to have a larger share inSARH's program, which, for the year 2000--the time horizon adopted by the
Mexican policy makers for the agricultural sector--calls for extending thecultivated area up to 30 million ha, twice today's 15 million ha. Bothirrigated and rainfed areas, today estimated at about 5 and 10 million ha,
respectively, would be doubled by the end of the twentieth century. Within
this general framework, PNDR is expected to progress along the lines outlined
below:
(a) Irrigation Infrastructure. Of the new 5 million ha to be broughtunder irrigation, between 33% and 40% would be developed in small-scaleprojects which thus would account for about 2.5 million ha, or 25% of Mexico's
total irrigated area projected for the end of the century. Thus, by usinglocalized water resources where available, the small-scale approach would
constitute a valuable complement to large-scale schemes, which are to be
developed when the use of the resources of large rivers so requires. From an
operational point of view, the most notable advantages are: (1) due to a
systematic approach to project preparation and design standards, probabilítyof errors is low since unforeseen circumstances seldom arise; when errors dooccur, they are not too difficult to correct and, in any case, they do not
affect the entire program; (ii) investment costs, fluctuating around US$1,200
per ha for pumping plants, US$1,600 per ha for groundwater and US$2,200 per ha
for storage dams, are considerably lower than the US$3,500 to 5,000 per ha
frequently obtaíned in large scale irrigation schemes; in addition, due to the
relative simplicity of sub-projects, actual costs are kept fairly close to
estimates; (iii) due to project typology (a significant proportion of pumping
schemes), water control is reasonably efficient; and (iv) Government'sfinancial burden is lower than in the case of large projects since operationand maintenance costs are directly covered by beneficiaries, who also
contribute 30% of investment cost.
(b) Drainage Infrastructure. PNDR is to play a supporting rolesince drainage projects are usually required in the low lands of the hydro-graphic basins of the humid tropical regions, which, in general, require
- 13 -
large infrastructure schemes. Local drainage and flood control projects,however, are frequently advisable and those would be included in PNDR.
(c) Livestock Infrastructure. As noted at the outset (para 1.01),the scope of PNDR has been enlarged to include small-scale infrastructureprojects for livestock development, an attractive innovation which essen-tially consists of improving pastures and establishing animal wateringpoints, stables, corrals and fences, and is expected to have a major impact
on the productive and social structure of rural communities with few develop-ment alternatives and little off-farm employment opportunities. This type of
sub-project would mainly take place in those ejidos where most of the land is
generally unused due to physical constraints (unreliable rainfall, unsuitabletopography or poor soils) so that only a small fraction is cultivated. Small-
scale livestock infrastructure projects would be developed on land, eitherunused or devoted to low-level subsistence agriculture, but with a potential
for livestock development, and where Government initiative would be justified
because the farmers, due to their limited resources, would not be eligible for
obtaining credit under commercial conditions to finance the infrastructureworks. Once such works were executed, however, beneficiaries could financethe acquisition of livestock under the on-going credit programs for low-income
producers. Thus, by bringing into production lands otherwise greatly under-utilized, small-scale livestock infrastructure sub-projects would provide astrategy to increase income level and improve living conditions of a large
number of rural families who would otherwise remain at or below subsistencelevel if their only source of income were their rainfed farms. To effectively
enlarge the scope of its support to small farmers, OHDR counts on two points:first, its understanding of the peculiarities of communities of small farmers
gained through its efficiently decentralized technical and administrativestructure; and second, its absorption of the Department of Rural Engineeringof the former Ministry of Agriculture and Livestock, which was in charge of
similar activities. These considerations fully justify the decision of theMexican Government of applying the systematic approach of PNDR to the devel-
opment of small-scale livestock infrastructure sub-projects and vesting theresponsibility for its implementation in OHDR, which would be responsible for
designing and carrying out the infrastructure works of the sub-projects; the
acquisition of livestock would be financed by BANRURAL which, under itsstandard procedures, would prepare development plans and provide technicalassistance to beneficiaries.
III. THE PROJECT
A. Description
3.01 The Government of Mexico, through Nacional Financiera S.A.--itsspecialized agency for international financial operations--has requested aBank loan to help finance a Small Scale Agricultural Infrastructure Projectwhich would constitute the Fifth Stage of PNDR. The project, to be executed
- 14 -
in four years (1979-82) would consist of a series of about 250 sub-projects, scattered throughout the country, covering an aggregate area ofabout 150,000 ha and benefitting some 30,000 families, mostly ejidatarios,well within the poverty target group. The project was prepared by SARH andpresented to the Bank in February 1978; it would include:
(a) tGue eZecutiol of.
(i) irrigation infrastructure on about 56,000 ha, of which:
- 900 tubewells would command about 36,000 ha,
- 20 storage dams would command about 12,000 ha,
- 18 pumping plants would command about 8,000 ha;
(ii) drainage infrastructure on about 36,000 ha;
(iii) livestock infrastructure on about 58,000 ha; and
(b) the acquisition of equipment for:
(í) hydrogeological studies,
(ií) construction of civil and on-farm works,
(iii) tubewells and pumping plants, and
(iv) livestock farms.
3.02 The project comprises a wide range of activities with great geo-graphical dispersion. In an attempt to arrive at a meaningful definition ofthe engineering, agricultural, economic and social aspects of the project,about 25 sub-projects were studied. From such sample, the following six(Map IBRD 13930) have been selected to describe the conceptual aspects of theproject and quantify its relevant indicators:
- 15 -
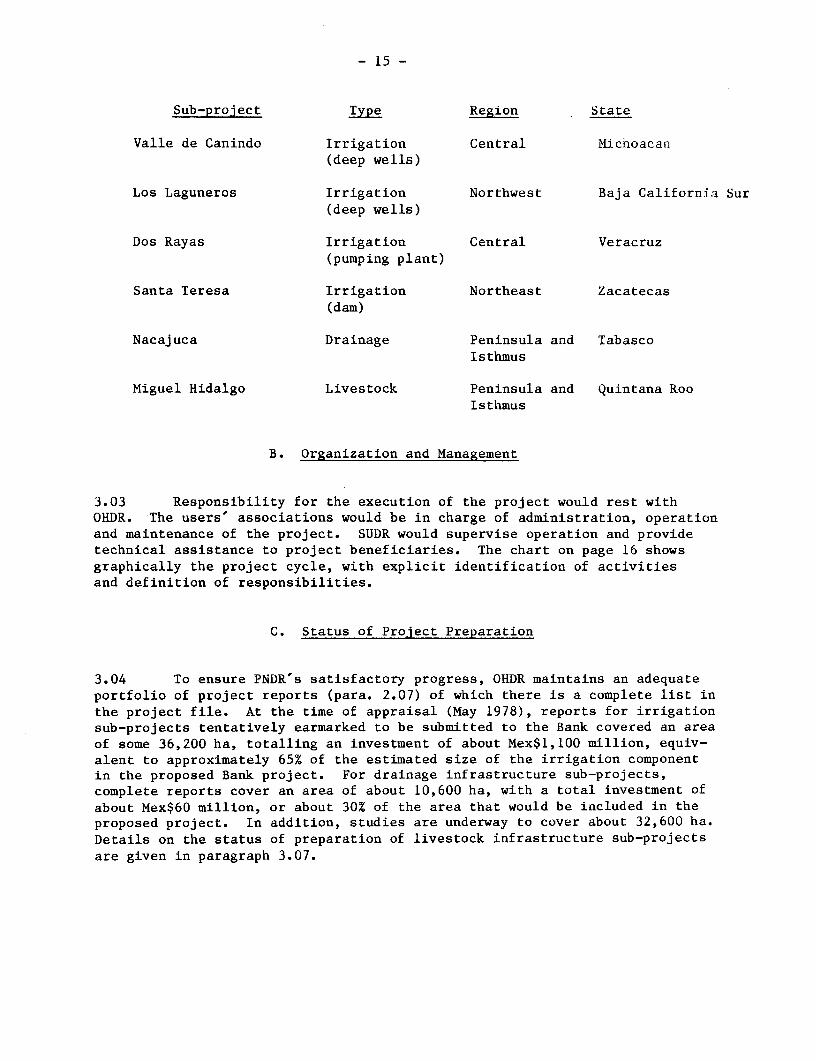
Sub-project Type Region State
Valle de Canindo Irrigation Central Michoacan(deep wells)
Los Laguneros Irrigation Northwest Baja California Sur(deep wells)
Dos Rayas Irrigation Central Veracruz(pumping plant)
Santa Teresa Irrigation Northeast Zacatecas(dam)
Nacajuca Drainage Peninsula and TabascoIsthmus
Miguel Hidalgo Livestock Peninsula and Quintana RooIsthmus
B. Organization and Management
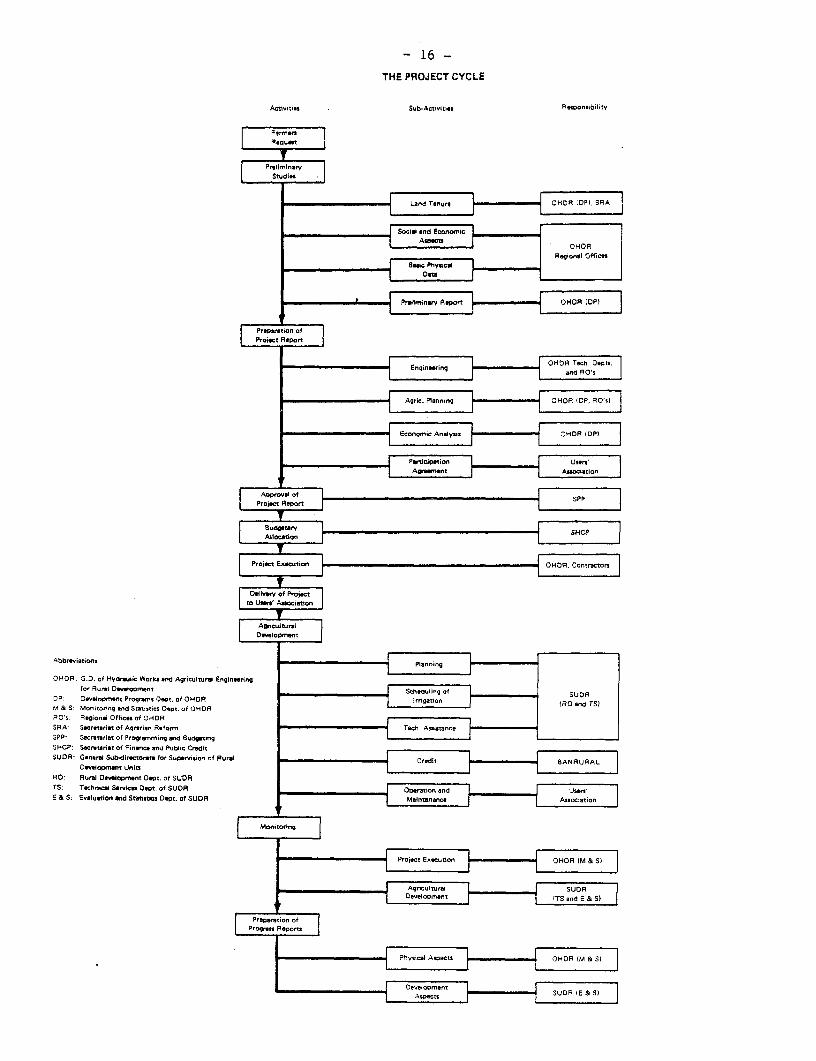
3.03 Responsibility for the execution of the project would rest withOHDR. The users' associations would be in charge of administration, operationand maintenance of the project. SUDR would supervise operation and providetechnical assistance to project beneficiaries. The chart on page 16 showsgraphically the project cycle, with explicit identification of activitiesand definition of responsibilities.
C. Status of Project Preparation
3.04 To ensure PNDR's satisfactory progress, OHDR maintains an adequateportfolio of project reports (para. 2.07) of which there is a complete list inthe project file. At the time of appraisal (May 1978), reports for irrigationsub-projects tentatively earmarked to be submitted to the Bank covered an areaof some 36,200 ha, totalling an investment of about Mex$1,100 million, equiv-alent to approximately 65% of the estimated size of the irrigation componentin the proposed Bank project. For drainage infrastructure sub-projects,complete reports cover an area of about 10,600 ha, with a total investment ofabout Mex$60 million, or about 30% of the area that would be included in theproposed project. In addition, studies are underway to cover about 32,600 ha.
Details on the status of preparation of livestock infrastructure sub-projectsare given in paragraph 3.07.
- 16 -
THE PROJECT CYCLE
Abflre.i.tAtiitn ii-AtviisRnonbit
fo,rneni R1~rel fSc,nEnm
OHORRrOgionel Offion
Pre ion foffSProj«t S.eo,t o
SUOR: Generel Sub-dlrenoo,e.u fo, Sop..oision of P -oH,i l.7P
Deeqlo~~re.eot UnjtO!
E & S: Ea: ti.. OHDdR SoT ch ofr |
A io"wt ~ ~ ~ ~ ~~ oeiomn
f., iR..t D~p,,nent &~~~~~~~~~~~~~~~~~SUR &S
Z~~~~~~~~~~~~~~~~~~~~~~~~~~~ |'~ 9090- Of¡nofCO
D~Opment ~ ~ ~ Ailcinw
A*rO: R, ~oe evi.tiof }U
TDP Dr eoreT~ PrgrrsemD oca of OHDR O_e_ (RD andTSEM S5: EMusitorng and SratisticiO n of OUORMa.nnc
Dekioprnt;nt~~~~~~~~~~~~~~~~~~~ Unit- I-I7S
- 17 -
D. Design Standards
Irrigation Infrastructure Projects
3.05 With more than 200 dams, several hundred pumping plants and over4,000 deep wells constructed and in operation over PNDR's 12 years of life,OHDR has systematized the technique of developing small-scale hydraulicschemes. Design criteria for small dams and pumping plants used by OHDR arebased on its own as well as world-wide experience and are published in aseries of well prepared manuals, a complete set of which is available in theproject file. Regarding groundwater sub-projects, exploration and developmentprogress simultaneously. When a suitable supply of groundwater is found, awell is completed and tested and, if favorable, irrigation works are completedaccording to well yield and land available (at the rate of 1 l/s/ha). Thisprocess continues until the zone is fully developed. In areas where a consid-erable development of groundwater resources has already taken place, wells aresystematically monitored and pumping rates are adjusted when depletion isobserved. In zones being mined, a 10 to 20% decline in yields over a period of10 years is anticipated, although depletion would not occur throughout theentire zone but only in certain wells where the degree of interference is highdue to close spacing and/or local geological conditions. To allow forreductions in yields, pumping rates are designed at 80% of the maximum yieldobtained when the well is tested. Key technical data of the irrigationsub-projects mentioned in paragraph 3.02 are given in Annex 1, Table 5.
Drainage Infrastructure Project
3.06 Drainage infrastructure projects are located mainly in the Penínsulaand Isthmus Region. In a first stage, sub-projects are designed to drain onlysuperficial excess of rainfall water from a limited area (generally a fewthousand hectares); sub-surface drainage would be studied at a later stage, ifand when justified by physical and economic considerations. Sub-projectsconsist generally of a main drain discharging to a water course draining thearea; secondary drains are spaced about 1,000 m apart, depending on topographicconditions; tertiary ditches are about 50 to 60 cm deep and spaced at intervalsof about 400 m.
Livestock Development Infrastructure Projects
3.07 Since OHDR experience with livestock development infrastructureprojects is not as extensive as it is in regard to design and execution ofhydraulic schemes, sub-projects prepared for Bank consideration were generallyoverdesigned. Infrastructure works (pasture improvement, installations), asoriginally planned, were to have been completed in the initial years, withoutallowing for phased development; thus, investments in infrastructure wereoverly concentrated in the early stage of the sub-projects and parallelprivate investments (credit) were estimated at the level required to financethe maximum carrying capacity of the farms, thereby reducing the number thatcould be reached; further, credit to finance private investment would thenmerely have supported the acquisition of livestock without promoting the
- 18 -
growth of herds. During appraisal, these issues were discussed with staff ofthe OHDR's Sub-directorate of Rural Engineering, who agreed to revise livestockinfrastructure sub-projects to slow down the development pace as well as theamount of private investments; technical risks would then be lower and economicreturns would be higher.
E. Sub-project Appraisal
Irrigation and Drainage Sub-proiects
3.08 PNDR s sub-projects are appraised by OHDR using criteria andmethodology agreed upon with IDB and submitted to SPP and IDB for approval.Under current procedures, sub-projects are tested against a B/C ratio of atleast unity obtained by discounting benefits and costs streams at 9%. Theassumptions used by OHDR in the calculations, however, are still thoseagreed upon in the early stages of PNDR, with yields and development pacethat were then considered prudently conservative but, in the light ofexperience, have turned out to be severely underestimated. An analysisduring appraisal of about 25 sub-projects (para 3.02) demonstrated that,with the use of more up-to-date cost and benefit assumptions, the ORDRcut-off point was in fact equivalent to an ERR of about 12%. Assuranceswere obtained during negotiations that, for each irrigation and/or drainagesub-project to be financed under the proposed loan, SARH would furnish tothe Bank for approval a "Summary Sheet" according to the outline presentedin Annex 1, Table 6. Only sub-projects with an economic rate of return ofat least 12% would be approved by the Bank.
Livestock Infrastructure Sub-projects
3.09 For the reasons pointed out in paragraph 3.07, the Bank would conducta desk appraisal of each livestock infrastructure sub-project. Assurances wereobtained during negotiations that OHDR would furnish to the Bank for approvala full feasibility report (Expediente Integrado, para 2.07) for each sub-projectof this type to be financed under the proposed loan; only sub-projects with aneconomic rate of return of at least 12% would be approved by the Bank. TheBank and OHDR would seek that adequate design and evaluation criteria forlivestock infrastructure sub-projects were developed and systematicallyapplied, with a view to eventually vest responsibility for appraisal in OHDRso that, as in the case of irrigtion and drainage sub-projects, the Bank couldgenerally be satisfied with the information provided on a summary sheet thatwould be designed in the course of supervision.
- 19 -
F. Project Implementation
3.10 The project would be executed in a period of four years (1979-82)
and its activities would be carried out according to the project cycle shownin the chart on page 16. Acquisition of equipment for studies and constructionof civil and on-farm works would take place in the early months of the firstyear. Irrigation and drainage sub-projects would be executed at an approxi-mately uniform rate. For livestock development sub-projects, however, due tothe technical and economic reasons above mentioned (para 3.07), completion ofon-farm works would generally require longer periods of time than the expecteddisbursement period; thus, while execution of these sub-projects would beundertaken on about 58,000 ha, project cost estimates and financial arrange-ments are based on a "time-slice" approach covering invest-costs incurredduring the four-year project execution period. Livestock development sub-projects approved by the Bank for inclusion in the project, but not completedduring the disbursement period, would be eligible for supplementary financingunder the expected (para 2.21) subsequent project. In any event, the Govern-ment would complete all sub-projects initiated under the proposed loan.
G. Cost Estimates
3.11 Project cost estimates were based on a detailed analysis of thefinal designs and bills of quantities of the six sub-projects mentioned above(para 3.02) from which relevant unit costs were obtained and then applied tothe quantities estimated for the entire project. Unit costs were furtherdisaggregated in labor, materials and equipment on which local and foreigncomponents were determined and then worked back to the main unit. Followingthis procedure, a cost table was prepared for each type of sub-project (Annex 1,Tables 7 to 10), thus arriving at the estimated execution cost, net of contin-gencies and OHDR's administration expenditures. These tables were lateraggregated into a general table (Annex 1, Table 11) in which:
(a) to avoid double counting (under civil works and equipment sub-headings), the cost of construction equipment (US$8.9 million)was deducted from irrigation infrastructure (US$7.3 million)and drainage infrastructure (US$1.6 million) proportionally totheir civil works costs;
(b) given the advanced status of project design, physical contin-gencies were estimated at 5% of engineering cost and 10% ofinfrastructure works and equipment;
(c) civil and on-farm costs do not include farmers contributiontoward project cost, through labor during construction period;the estimates are as follows (in US$ million): irrigation,3.2; drainage, 1.6; livestock, 1.5; total, 6.3;
- 20 -
(d) administration costs were estimated at 15% of execution costs,a coefficient obtained by OHDR from actual data of 1977; and
(e) price contingencies were based on a four-year execution periodat 7% for 1979 and 1980 and 6% for 1981 and 1982.
3.12 Including contingencies, project financial cost 1s estimated atUS$143.7 million, with a foreign exchange component of US$60 million (42%).By type of sub-projects, irrigation, drainage and livestock would account77, 12 and 11% respectively. A summary of the total project cost ispresented below:
PROJECT COST ESTIMATES
Percentage ofBase Foreign
Local Foreign Total Local Foreign Total Cost Exchange---- (Mex$Million) ----- ------(US $Million )------ -------(%)------
Engineering 83.4 13.2 96.6 3.6 0.6 4.2 3.4 14.3
Civil & On-farm WorksIrrigation 632.5 481.0 1,113.5 27.5 20.9 48.4 39.6 43.2Drainage 62.1 151.4 213.5 2.7 6.6 9.3 7.6 71.0Livestock 161.0 48.7 209.7 7.0 2.1 9.1 7.4 23.1
Subtotal 855.6 681.1 1,536.7 37.2 29.6 66.8 54.6 44.3
EquipmentStudies 3.5 31.0 34.5 0.1 1.4 1.5 1.2 90.0Construction 20.4 183.4 203.8 0.9 8.0 8.9 6.9 90.0Wells 182.7 63.0 245.7 8.0 2.7 10.7 8.3 25.2Pumping Plants 21.1 32.2 53.3 0.9 1.4 2.3 1.8 60.9Livestock 10.4 15.7 26.1 0.4 0.7 1.1 0.9 63.6
Subtotal 238.1 325.3 563.4 10.3 14.2 24.5 19.1 58.0
Physical Contingency -12.7. __la, 229.4 5.6 4.4 -. Q _1 44.0
Execution Cost 1,305.0 1,121.1 2,426.1 56.7 48.8 105.5 86.3 46.3
Administration 385.5 - 385.5 16.8 - 16.8 13.7 -
Baseline Cost 1,690.5 1,121.1 2,811.6 73.5 48.8 122.3 100.0 39.9
Price Contingency 234.6 257.6 492.2 10.2 11.2 21.4 17.5 52.3
TOTAL PROJECT COST 1,925.1 1,378.7 3,303.8 83.7 60.0 143.7 117.5 41.8
Beneficiaries contribution,through labor, duringconstruction period (atmarket rate in 1978) (144.2) - (144.2) (6.3) _ (6.3)
- 21 -
3.13 The estimated schedule of expenditures is detailed in Annex 1,
Table 12, and summarized below:
1979 1980 1981 1982 Total------------- (US$ million)---------------
Engineering 1.0 1.0 1.1 1.1 4.2Civil and On-farm Works 11.7 19.0 20.3 15.8 66.8Equipment 12.4 3.9 4.1 4.1 24.5Physical Contingencies 2.6 2.6 2.7 2.1 10.0
Execution Cost 27.7 26.5 28.2 23.1 105.5
Administration 4.3 4.3 4.5 3.7 16.8
Baseline Cost 32.0 30.8 32.7 26.8 122.3Price Contingencies 2.1 4.3 7.1 7.9 21.4
Total Expenditures 34.1 35.1 39.8 34.7 143.7
Farmers contribution, (1.1) (1.8) (1.9) (1.5) (6.3)through labor, duringconstruction period(at market rate in 1978)
H. Financing
3.14 Bank participation in project financing would be US$60 million,equivalent to the estimated foreign exchange component. Project bene-ficiaries would finance, through funds available under on-going creditprograms, the full cost of pumping sets, which, including contingencies,would amount to US$13.5 million equivalent. The remainder, US$70.2 millionequivalent, would be financed out of budgetary allocations to OIIDR. Whencontingencies are allocated to proper investment categories, the financialscheme is as follows:
Government Users Bank Total Percentage------------ US$ million --------
Engineering 4.6 - 0.7 5.3 3.7Infrastructure Works 1/ 43.1 - 47.4 90.5 63.0Equipment for Studies 0.2 - 1.7 1.9 1.3Equipment for Construction 1.1 - 10.2 11.3 7.9Equipment for Wells - 13.5 - 13.5 9.4
Administration 21.2 - - 21.2 14.7
Total 70.2 13.5 60.0 143.7 100.0Percentage 48.9 9.4 41.7 100.0
1/ Including equipment for pumping plants sub-projects and installationsfor livestock development sub-projects.
- 22 -
The Bank loan would be made to Nacional Financiera S.A. (para 3.01), for aterm of 17 years, including four years of grace, at the interest rate of7.35% p.a. Nacional Financiera would pass the funds on to the Governmentof Mexico, which would guarantee the loan.
I. Procurement
Civil Works
3.15 Currently, OHDR executes by force account all engineering studiesand about 30% of the irrigation and drainage networks and on-farm works.Construction of wells, pumping plants and dams and the balance of the irri-gation and drainage networks and on-farm works are contracted out followingsatisfactory local competitive bidding (LCB) procedures, or negotiatedcontracts, which are appropriated when the small size of the works or theremoteness of the area would result in higher construction cost if LCB proce-dures were followed. Mexican laws set forth an upper limit of Mex.$500,000(US$22,000) for negotiated contracts; in practice, however, appropriatejustification on a case-by-case basis has increased that limit up to Mex$3million (US$130,000), which appears reasonable in view of the present level ofcosts and prices. Under this set of circumstances, contracts for civil workswould be let under OHDR's ordinary procedures.
Equipment
3.16 Regarding equipment to be partly financed by the proposed Bankloan, procurement procedures would be as follows:
Equipment for Cost Estimate Procedure(US$ million)
Studies (Annex 1, Table 13) 1.5 ICB according to Bankguidelines, with 15%preference for localmanufacturers
Construction (Annex 1, Table 14) ICB according to Bank(a) of civil works 8.6 guidelines, with 15%
preference for localmanufacturers
(b) on-farm works 0.3 LCB
Pumping Plants 2.3 LCB
Livestock Development 1.1 LCB and/or negotiatedcontracts
- 23 -
J. Disbursements
3.17 To símplify administrative procedures, the proceeds of the Bank loanwould be disbursed under two categories, applying the appropriate disbursementpercentage to the total cost of each category. Definition of categories,allocation of Bank loan and percentage disbursement would be as follows:
Total Amount Bank LoanUS$ US$ Disbursement
Category million million Percentage
I. Infrastructure, includingequipment for pumpingplants and installationsfor livestock development 80.2 38.5 48
II. Equipment for Constructionor Studies 11.4 10.3 90
III. Unallocated 11.2
Total 60.0
3.18 Disbursement request for works carried out by force account wouldbe made against certificate of expenditures; the documentation for theseexpenditures would not be submitted to the Bank but would be retained bythe Borrower for inspection by the Bank during the course of project super-vision missions. Disbursement request for acquisition of equipment or workscarried out by contract would be fully documented.
3.19 The Bank loan is expected to be disbursed over a períod of fouryears (calendar years 1979-82). The estimated schedule of disbursementsis in Annex 1, Table 15.
K. Monitoring and Evaluation
3.20 The PNDR, as presently organized, includes an effective systemfor monitoring and evaluating the sub-projects. Data reflecting the physicalprogress of project execution are compiled by the Subdirectorate of Monitoringand Statistics of ORDR (para 2.05). The proposed project would be monitoredthrough these existing institutional arrangements. Assurances were obtainedduring negotiations that SARH would furnish promptly to the Bank annualProject Implementation Reports to cover physical and financial progress ofprocurement of equipment and execution of civil and on-farm works. Regardingagricultural development, SARH and the Bank would agree during the course of
- 24 -
project implementation, on defining a representative sample of sub-projectson which monitoring and evaluation of project impact would be carried out.Assurances were obtained during negotiations that SARH would furnish to theBank annual Agricultural Development Reports (period October 1-September 30)on or before March 31 of the following year on the sample of sub-projectsagreed upon, the first of these reports to be presented not later than March31, 1981.
L. Accounts and Auditing
3.21 The Subdirectorate of Administrative Services of OHDR (para 2.03)is in charge of the accounting functions and, therefore, would be responsiblefor the accounts of the proposed project. Assurances were obtained duringnegotiatíons that separate accounts would be established and kept for theproposed Bank project with appropriate identification of sources (Government,users or Bank) and application of funds.
3.22 SARH accounts are subject to the internal control of its DirectorateGeneral of Auditing, which is satisfactory. Assurances were obtained duringnegotiations that the separate project accounts would be audited annuallyin accordance with the Government's procedures and that such audited accounts,together with the auditor's statement, would be promptly furnished to theBank.
IV. AGRICULTURAL DEVELOPMENT
A. Irrigation Sub-projects
4.01 Four sub-projects were selected to represent the irrigation compo-nent--the most significant one--of PNDR. Two sub-projects are based ongroundwater development: one, Valle de Canindo (Michoacan), represents theshift from rainfed to irrigated agriculture in the central region, whereannual rainfall averages about 900 mm generally concetrated during the June-October period, which permits one cropping season; the other, Los Laguneros(Baja California Sur), is an example of the arid conditions of the vastnorthern and northwestern regions of Mexico, where without irrigation, agricul-ture provides only a marginal subsistence. The third irrigation sub-project,Dos Rayas (Veracruz), which is based on a pumping plant taking water from atributary (Tempoal river) of the Panuco river, is located in the low lands ofthe basin, a region where the annual rainfall fluctuates around 700 mm, but isvery erratic and the average yields of basic crops (maize and beans) are wellbelow one ton per ha. The fourth sub-project, Santa Teresa (Zacatecas), isbased on a storage dam that would regulate the flow of the Montescobedo river(Lerma basin), in the high lands (1,915 m.a.s.1.) of the Central Region, whereannual rainfall is about 500 mm and its unfavorable and unreliable distributiondoes not permit commercial agriculture.
- 25 -
4.02 In projecting agricultural development, actual data from on-goingsimilar sub-projects were considered. With few justified exceptions, cropsprojected under future conditions would be the same as presently grown,without dramatic shifts toward high value crops but with substantial increasesin yields and cropping intensities brought about by irrigation and, in addition,by improvements in farming techniques and use of credit; as experience demon-strates, such results are very seldom achieved by small farmers under rainfedconditions due to the risks derived from an unreliable and often insufficientrainfall. Based on the current status of PNDR, construction periods forgroundwater and pumping plant sub-projects were estimated at one year wherethe irrigation area was less than 300 ha and two years if larger. Storagedams are usually built in two years, and, including completion of the areadevelopment works, the construction period was estimated at three years.Full agricultural development would be reached in three to four years aftercompleting the infrastructure works. Investments, agricultural developmentand farm budgets of irrigation sub-projects are presented in Annex 1 (Tables16 through 31). A summary of the technical assumptions supporting the projectedagricultural development of irrigation sub-projects is presented below:
Canindo Los Laguneros Dos Rayas Santa TeresaCrop Area Yield Crop Area Yield Crop Area Yield Crop Area Yield
(%) ) * ~~~~~(%) (t/ha) (Z) (t/-ha) ()7&
W í t h o u t P r o j e c t
Wheat 14 1,4 Desert Maize 75 0.8 Maize 6.0 0.6Barley 6 1.5 Beans 25 0.6 Beans 4.0 0.7Maize 71 1.3 Total 100 Total 100.0Beans 9 0.7Total 100
W i t h P r o j e c t
V.heat 40 3.5 Cotton 50 3.5 Beans 39 2.2 Wheat 24 4.0Barley 20 4.0 Vegetables 10 15.0 Tomato 11 14.0 Maize 48 3.5Beans 20 1.8 Sorghum 30 4.5 Maize 57 3.5 Beans 26 2.5Soybeans 20 1.6 Beans 40 2.6 Sorghum 43 3.5 Chile 10 2.0Maize 40 3.5 Xaize 50 4.0 Total 150 Alfalfa 16 72.0Alfalfa 20 72.0 Total 180 Total 124Total 160
B. Drainage Sub-Projects
4.03 In extensive zones of the south, the Isthmus and Peninsular Region,rainfall is excessive so that vast areas otherwise suitable for commercialagriculture suffer from floods that prevent use of the land during the heaviestrainy season (May-December), introduce a severe risk element in crop productionduring the rest of the year, or force farmers to use their lands as naturalpastures with a low level of productivity. Given the uniformity of technicalfeatures, the selected sub-project, Nacajuca (Tabasco), provides adequaterepresentation of the PNDR drainage component.
4.04 Projected agricultural development would consist of introducingrice, a crop well suited to the conditions of the area, as a second crop ina rotation following beans, and improving the natural pastures now existingon rangelands. Investments, agricultural development and farm budgets ofdrainage sub-projects are presented in Annex 1 (Tables 32 through 35); tech-nical assumptions are summarized below:
- 26 -
Crop Area Yield(%) (tons/ha)
Without the ProjectMaize 41 1.0Beans 2 0.8Rangeland 57 10.0Total 100
With the ProjectMaize 33 2.4Beans 10 1.2Rice 10 3.0Pasture 57 40.0Total 110
C. Livestock Sub-projects
4.05 Most of the projected infrastructure schemes for supporting livestockdevelopment would be for dual-purpose cattle, although a few dairy, beef andsmall species operations are also foreseen. To represent the livestockcomponent of the project, a dual-purpose cattle development sub-project,Miguel Hidalgo (Quintana Roo), was selected. The sub-project would consist ofthe rehabilitation of existing pastures on about half of the ejido lands andestablishing new pastures on lands today unproductive. The livestock operationwould be started with the acquisition through credit, over a period of threeyears, of about 60% of the maximum number of cows that the pastures couldsupport at full development. Thus, the initial herd would gradually grow toreach its maximum size over eight to 10 years. To optimize the return on theiírvestments, infrastructure works--pasture development, fencing, corrals andinstallations--would be phased according to the herd's build-up; thus, actualanimal load would be, even during the first years, approximately equal to theranch's carrying capacity. The on-farm works investment program would becompleted in six years.
4.06 Details of the investments, projected herd development and farmbudgets are presented in Annex 1 (Tables 36 through 39). Technical assumptionsare summarized below:
Initial Full Development
Weaning rate (%) 60 65Cow culling rate (%) n.a. 26Adult mortality (%) 4.2 2.8Calf mortality (%) 6.2 3.7Pasture area (ha) 255 1,110Carrying capacity (AAU/ha) 1.0 1.0Actual animal load (AAU/ha) 0.8 1.0Milk/milking cow (lt/year) 600 900Milk/pasture area (lt/ha) 220 260Beef/pasture area (live kg/ha) n.a 100
- 27 -
V. BENEFITS AND JUSTIFICATION
A. Project Production, Demand and Marketing
5.01 The proposed project would assist in expanding the area underirrigation and drainage and would result in increases in the production ofbasic foodgrains, oilseeds and milk and meat. Based on projected land use andproduction of the selected sub-projects (Annex 1, Tables 18, 26, 30, 34 and37), and taking into account the area represented by each of them (para 3.01),the incremental project production, at full development, is estimated asfollows:
('000 m ton)
Maize 59.5Beans 25.0Sorghum 13.3Rice 10.8Wheat 53.6Tomato 13.4Barley 25.0Chile 2.3Milk 15.1Beef 4.6
Based on average 1977 farmgate prices, the annual value of incremental outputof project production at full development would be approximately Mex$520.8million (US$22.6 million). The distribution of these production gains wouldbe the result of increased productivity among the beneficiaries of infrastruc-ture provided under the project.
5.02 Given the shortfalls in the production of major crops experiencedin the recent period, the domestic demand prospects for project output arefavorable. Increases in current agricultural production have not beensufficient to meet the rising demands of a rapidly increasing population,particularly for basic foodgrains.
5.03 Domestic beef prices, which fluctuate freely, have increased fromMex$6.5 per kg in 1971 to Mex$13.8 per kg in 1977 reflecting the continuingstrong domestic market demand for beef. With rising per capita incomes, ahigh income elasticity of demand and rapid population growth, the long-termprospects for the domestic market are bright. In addition, the improvementin export prices in US dollar terms for both feeder cattle and boneless beefin 1976 has resulted in a rapid recovery of exports. Per capita consumptionof milk has also registered a strong increase, growing at the rate of 5.9%annually during the 1970-75 period while production increased at only 4.8%annually. Domestic demand has thus been met by supplementary imports ofmilk powder. Future demand is expected to continue to be strong and, coupledwith recent increases in the price of milk, indicate good prospects for milkproducers. Based on the present annual growth rate of Mexico's population of
- 28 -
about 3.3%, an increase in per capita income of about 3% per year and anincome elasticity of demand of about 0.4, an increase in the demand forfoodstuffs of about 4.5% p.a. can be expected. Incremental project production,particularly of basic foodgrains, could substitute for imports otherwiseneeded to meet rising domestic demand.
5.04 Given the size of individual sub-projects, their geographicaldispersion and the nature of their output (mainly basic crops), it is expectedthat most of the project's production would be marketed through the NationalMarketing Corporation (CONASUPO), which admínisters a farm price supportprogram for basic grains, state retail distribution outlets for foodstuffs,and several major agroindustries. The CONASUPO system is particularlybeneficial to small farmers due to its extensive network of rural stores thatcollect produce and pay for it promptly. The government has sought to use theCONASUPO price support system as a mechanism to provide greater incentives forthe production of basic foodstuffs such as wheat and maize. Support pricesfor these commodities have risen during the 1970-77 period and are generallyin line with world prices, with the exception of maize, which is substantiallyhigher.
5.05 Beef prices are not guaranteed nor does the government have anational procurement grid. The domestic beef market has been traditionallydominated by a supply of lean animals in the immediate areas of consumptionwhich are processed in local slaughterhouses. In recent years, packing plantshave begun to market quality meat principally through the direct sale ofrefrigerated meat to supermarkets. This new marketing channel has beenclosely associated with the growing supply of finished cattie from the tropics.In addition, exports of beef to the United States constitute an importantmarket channel, principally for feeder calves from northern Mexico or forboneless beef. Project output would, therefore, be handled through theseexisting private market channels, depending on regional location and otherfactors.
5.06 Milk prices to the farmer, pasteurizing plants and the consumer areset by the Ministry of Commerce and Industry. Only about 25% of marketed milkis pasteurized, with 4% sold as cheese and 2% as cream or butter. Currentofficial regional prices to the producer vary throughout Mexico and have beenincreased by the government some 40% since 1975 as an incentive to farmers andpasteurizing plants to increase production. It is expected that most of theproject output will be marketed as raw milk for local consumption in regionalmarkets.
B. Beneficiaries
5.07 By bringing some 56,000 ha under irrigation, providing drainage toabout 36,000 ha and developing 58,000 ha for livestock, the project wouldbenefít about 30,000 families of low-income farmers well within the povertytarget group, generating substantial increases in income levels as indicatedin the table below. As a further reference, the table presents also the
- 29 -
estimated level of income of hired workers in each region, based on thelegal minimum salaries and the employment opportunities, as measured by thecoefficients (para 5.14 c) used to shadow rate labor in the rural sectorthroughout the country.
Annual Income
Farming FamilyWithout With Project at Hired
Representative Sub-project Project Full Development Workers----------------- (US$)…
Valle de Canindo (Tubewell) 460 1,830 690Los Laguneros (Tubewell) new unit 4,460 1,500Dos Rayas (Pumping Plant) 430 2,270 1,100Santa Teresa (Storage Dam) 490 2,760 420
Nacajuca (Drainage) 770 2,250 700Miguel Hidalgo (Livestock) 40 ¡1 1,020 I1 590
/1 Represents income from livestock production only.
To ensure that project benefits would accrue to low-income farmers and thatthe number of beneficiaries would be as large as possible, assurances wereobtained during negotiations that: (a) project beneficiaries would havea pre-project annual income from farming activities not higher than US$2,500per family; and (b) for each sub-project, average investment per familywould not exceed US$10,000.
5.08 The project would also make a substantial contribution to employ-ment in the rural sector. Approximately 8,300 man-years of on-farm employmentwould be created, plus an additional 11,700 man-years of employment during theconstruction period of project works.
C. Project Charges
Operation and Maintenance
5.09 Following current practices under PNDR, project beneficiaries,through their users' association, would be fully responsible for the opera-tion and maintenance (0 & M) of sub-project facilities (para 2.08). As apart of the active role played by the users' associations, O & M activitiesare actually carried out by the beneficiaries themselves; full cost of laboris either paid in cash or credited to the individual worker. Additionalexpenditures (such as power, repairs, administrative costs and the like)are met through O & M charges imposed and efficiently collected by theusers' associations. In groundwater and pumping sub-projects, O & M charges,which usually include a provision for major repairs and replacements, are
- 30 -
related to volumetric consumption (generally a tariff per hour) while insurface sub-projects are estimated on a per ha basís. The present level
of annual 0 & M charges fluctuates around Mex$300 per ha for storage-
dam-type sub-projects, Mex$900 per ha for pumping plants and Mex$1,000
per ha for groundwater. While no previous experience exists with drainageand livestock sub-projects, beneficiaries of these projects would also
pay for the full 0 & M costs, which are expected to be much lower
(between Mex$150-200 per ha for drainage sub-projects and around Mex$50for livestock sub-projects).
Investment Recovery
5.10 While the principle of users' participation in project financing
is explicitly set forth and quantified in the Participation Agreements(para 2.08), actual practices vary according to the different types ofsub-projects as follows:
(a) groundwater sub-projects: users' contribution toward investmentcost consists of financing, through on-going credit programs forlow income producers, the purchase of the pumping sets forequiping the wells; and
(b) other type of sub-projects: contribution through labor duringconstruction period is credited to the users; the remainder upto 30% of investment cost, bearing an interest rate of 3.5%p.a., is to be met through annual payments over a period of25 years including four of grace (identical terms and conditions
than the IDB loan of January 1975).
5.11 The above practices would apply to the proposed project. To that
aim, assurances were obtained during negotiations that, for each sub-project,water charges would be imposed and collected to fully cover O & M costs and
recover a proportion of investment costs in accordance with current practicesunder PNDR, taking into account both the beneficiaries' payment capacity andthe need to maintain an incentive for them to make the best use of land andwater resources.
Cost and Rent Recovery Indices
5.12 Cost and rent recovery indices (CRI and RRI) were calculated according
to the criteria outlined above. For groundwater sub-projects, long-term loansfor financing the acquisition of pumping sets were considered at the prevailing
terms and conditions for low-income producers: up to 15 years, including up tofour of grace, at the rate of 11% p.a. For all other type of sub-projectsfarmers contribution through labor was estimated at 10% of investment; cash
payments were calculated to repay the remaining 20% under terms and conditionsdefined in 5.10(b) above. In all cases annual payments covered full 0 & Mcosts and a contribution toward investment (Annex 1, Tables 19, 23, 27, 31and 35). Results are presented in Annex 1, Table 40 and summarized as follows:
- 31 -
Sub-proiect Type CRI RR1…___(%) …____
Valle de Canindo Deep well 33 38Los Laguneros Deep well 27 28Dos Rayas Pumping Plant 26 25Santa Teresa Storage Dam 12 14Nacajuca Drainage 23 16
D. Economic Rate of Return and Sensitivity Analysis
5.13 In calculating the rate of ,eeturn to the economy, the following
assumptions and adjustments were made:
(a) Investment and operating costs were calculated using 1978prices and were assumed to remain constant in real terms;
(b) Output prices utilized were farmgate prices for the economicanalysis, except for maize, wheat, soybeans, sorghum, rice andcotton, which were recalculated according to internationalprices and adjusted for handling, processing and transportcosts to reach a farmgate equivalent. The future prices inconstant terms of these commodities and for beef were assumedto fluctuate in accordance with an index of EPD projectionsfor 1978-85. These prices appear in Annex 1, Table 41;
(c) Shadow wages for labor were estimated for representativemodels on the basis of regional variations in unemploymentand underemployment for unskilled labor in the rural sector.Rates utilized are as follows:
Sub-project (State)
Valle de Canindo (Michoacan) 0.6Los Laguneros (Baja Calif. Sur) 1.0Dos Rayas (Veracruz) 0.8Santa Teresa (Zacatecas) 0.5Nacajuca (Tabasco) 0.6Miguel Hidalgo (Quintana Roo) 0.5
(d) The exchange rate utilized was the average market rate ofMex$23 = US$1. No attempt was made to shadow price this rate;
(e) Since taxes are transfer payments within the economy, theywere excluded, to the extent possible, from the economic rateof return calculations;
(f) Incremental herd values were credited to the benefit stream of
the livestock development model; and
(g) Costs and benefits were phased to reflect the estimated rateof project implementation; economic life of sub-projects wasestimated at 25 years.
- 32 -
5.14 Based on these assumptions, the economic rates of return of repre-sentative sub-projects are calculated in Annex 1, Table 42 and summarizedbelow.
Sub-project Type ERR (%)
Valle de Canindo Deep Wells 24Los Laguneros Deep Wells 32Dos Rayas Pumping Plant 30Santa Teresa Storage Dam 18Nacajuca Drainage 26Miguel Hidalgo Livestock Development 16
When weighted according to investment cost aggregated bv type of sub-projectthe overall rate of return of the project is estimated at 23%.
5.15 Sensitivity analysis was performed on individual sub-projects withthe results summarized in Annex 1, Table 42. In all cases, rates of returnare more sensitive to variations in benefits. With the exception of livestockand drainage models, returns are relatively more sensitive to changes iír invest-ment costs than to changes in operating costs, which indicates the necessityof keeping the investment costs per ha as low as possible, and the concurrentneed to tie infrastructure development to on-farm improvements in yields andcropping patterns.
E. Project Risk
5.16 OHDR has a proven record as a successful implementing agency forsmall-scale irrigation works. The risk of shortfalls in the attainment ofproject goals is thus highest in sub-projects for drainage and livestockdevelopment, which constitute relatively new components of the program.However, given the strength of the institution and the low technicalcomplexity of these types of sub-projects, this constitutes an acceptablerisk for the project.
F. Environmental Impact
5.17 As a side benefit of the project, potable water and electrificationwould be brought to small villages in selected rural areas. No negativeeffects are foreseen, given the small size of individual sub-projects andtheir geographical dispersion.
- 33 -
VI. ASSURANCES OBTAINED DURING NEGOTIATIONS AND RECOMMENDATION
6.01 During negotiations, assurances were obtained that SARH would:
(a) furnish to the Bank, for approval, a "Summary Sheet` accordingto the outline presented in Annex 1, Table 6, for each irrigationandlor drainage sub-project to be financed under the proposedloan (para 3.08);
(b) furnish to the Bank, for approval, a full feasibility report(Expediente Integrado) for each livestock infrastructure sub-project to be financed under the proposed loan (para 3.09);
(c) furnish promptly to the Bank annual Project ImplementationReports to cover physical and financial progress of procurementof equipment and execution of civil and on-farm works (para 3.20);
(d) furnish to the Bank annual Agricultural Development Reports(periods October 1-September 30) on or before March 31 of thefollowing year, on the sample of sub-projects agreed upon, thefirst of these reports to be presented not later than March 31,1981 (para 3.20);
(e) establish and keep separate accounts for the proposed Bankproject with appropriate identification of sources (Government,users or Bank) and application of funds (para 3.21);
(f) have the project accounts audited annually according to itsordinary procedures and furnish promptly to the Bank the projectaccounts, together with the auditor's statement (para 3.22);
(g) select project beneficiaries with a pre-project annual familyincome from their farming activities not higher than US$2,500equivalent (para 5.07);
(h) for each sub-project, limit the average investment per familyto a maximum of US$10,000 (para 5.07); and
(i) impose and collect annual charges so that the beneficiaries'total contribution would fully cover O & M cost and recover aproportion of investment costs in accordance with presentpractices under PNDR (para 5.11).
6.02 With the above assurances, the proposed project would constitutea suitable basis for a Bank loan to Nacional Financiera S.A. (NAFINSA) ofUS$60 million, for a term of 17 years, including a grace period of fouryears, with interest at the rate of 7.35% p.a.; the loan would be guaranteedby the Government of Mexico (para 3.14).
December 1, 1978

MEXICO
SMALL SCALE AGRICULTURAL INFRASTRUCTURE PROJECT
General Directorate of Hydraulic Works andAgricultural Engineering for Rural Development
Staff
IsthmusL4/
NorthwestJ/ Northeast2/ CentraL3 and Yucatán Headquarters Total
Professionals
EngineersCivil 41 98 143 47 96 425Agricultural 4 8 6 - 2 20Other 9 9 17 1 22 58
Architects - - 2 - 3 5
Economists 6 6 10 1 12 35
Lawyers 1 2 2 - 3 8
Other 1 5 7 3 15 31
Sub-total 62 128 187 52 153 582
Technicians 105 221 307 84 251 968
Total 167 409 494 136 404 1,550
1/ Nayarit, Sinaloa, Sonora, Baja California Norte and Baja California Sur.2/ Coahuila, Chihuahua, Durango, Nuevo León, San Luis Potosi, Tamaulipas and Zacatecas.3/ Aguascalientes, Colima, Guanajuato, Hidalgo, Jalisco, México, Michoacán, Morelos, Puebla,
Querétaro, Tlaxcala and Veracruz.4/ Campeche, Quintana Roo, Yucatán, Chiapas, Guerrero, Oaxaca and Tabasco.
August 16, 1978
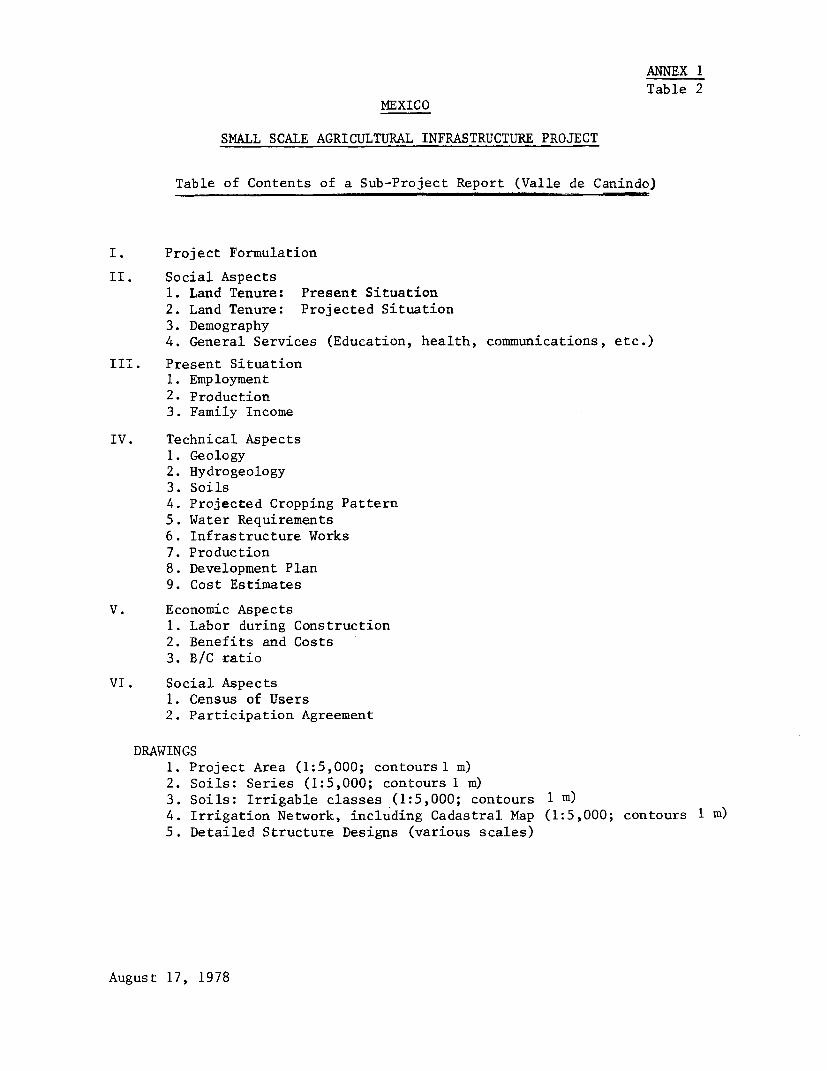
ANNEX 1Table 2
MEXICO
SMALL SCALE AGRICULTURAL INFRASTRUCTURE PROJECT
Table of Contents of a Sub-Project Report (Valle de Canindo)
I. Project Formulation
II. Social Aspects1. Land Tenure: Present Situatíon2. Land Tenure: Projected Situation3. Demography4. General Services (Education, health, communications, etc.)
III. Present Situation1. Employment2. Production3. Family Income
IV. Technical Aspects1. Geology2. Hydrogeology3. Soils4. Projected Cropping Pattern5. Water Requirements6. Infrastructure Works7. Production8. Development Plan9. Cost Estimates
V. Economic Aspects1. Labor during Construction2. Benefits and Costs3. B/C ratio
VI. Social Aspects1. Census of Users2. Participation Agreement
DRAWINGS1. Project Area (1:5,000; contoursl m)2. Soíls: Series (1:5,000; contours 1 m)3. Soils: Irrigable classes (1:5,000; contours 1 in)4. Irrigation Network, including Cadastral Map (1:5,000; contours 1 m)5. Detailed Structure Designs (various scales)
August 17, 1978
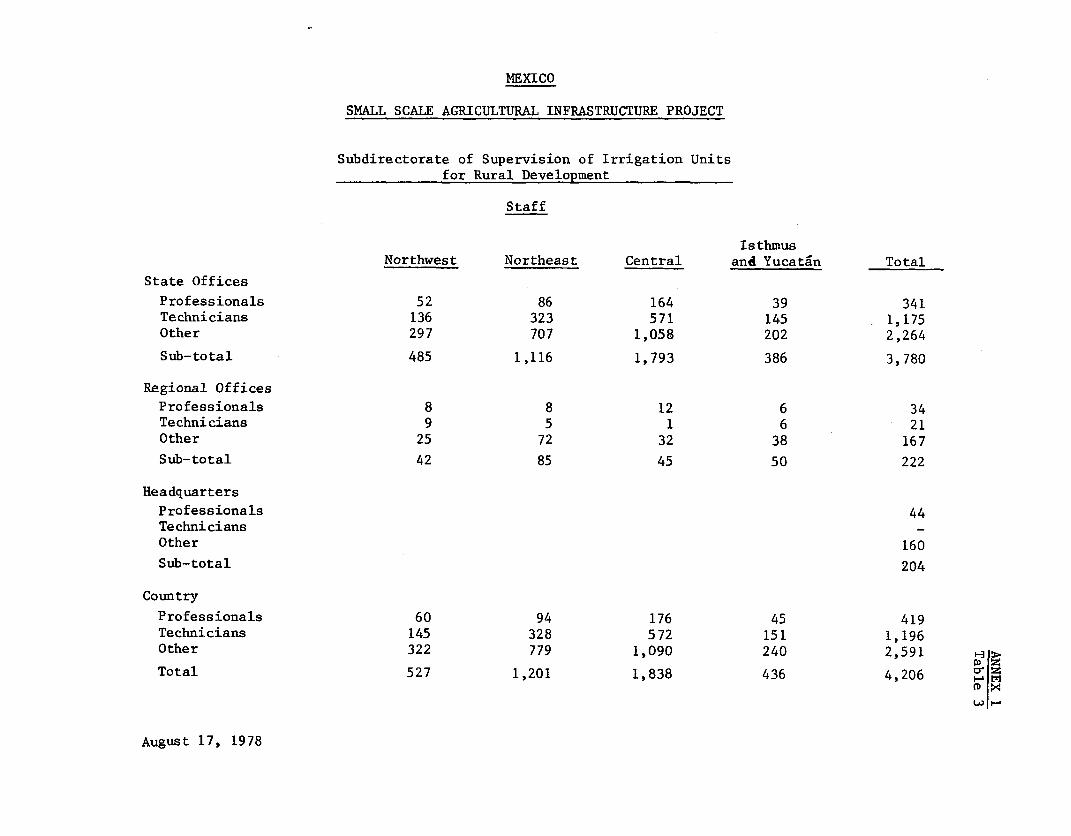
MEXICO
SMALL SCALE AGRICULTURAL INFRASTRUCTURE PROJECT
Subdirectorate of Supervision of Irrigation Units
for Rural Development
Staff
Isthmus
Northwest Northeast Central and Yucatán Total
State Offices
Professionals 52 86 164 39 341
Technicians 136 323 571 145 1,175
Other 297 707 1,058 202 2,264
Sub-total 485 1,116 1,793 386 3,780
Regional Offices
Professionals 8 8 12 6 34
Technicians 9 5 1 6 21
Other 25 72 32 38 167
Sub-total 42 85 45 50 222
Headquarters
Professionals 44
Technicians -
Other 160
Sub-total 204
Country
Professionals 60 94 176 45 419
Technicians 145 328 572 151 1,196
Other 322 779 1,090 240 2,591
Total 527 1,201 1,838 436 4,206 t M
August 17, 1978
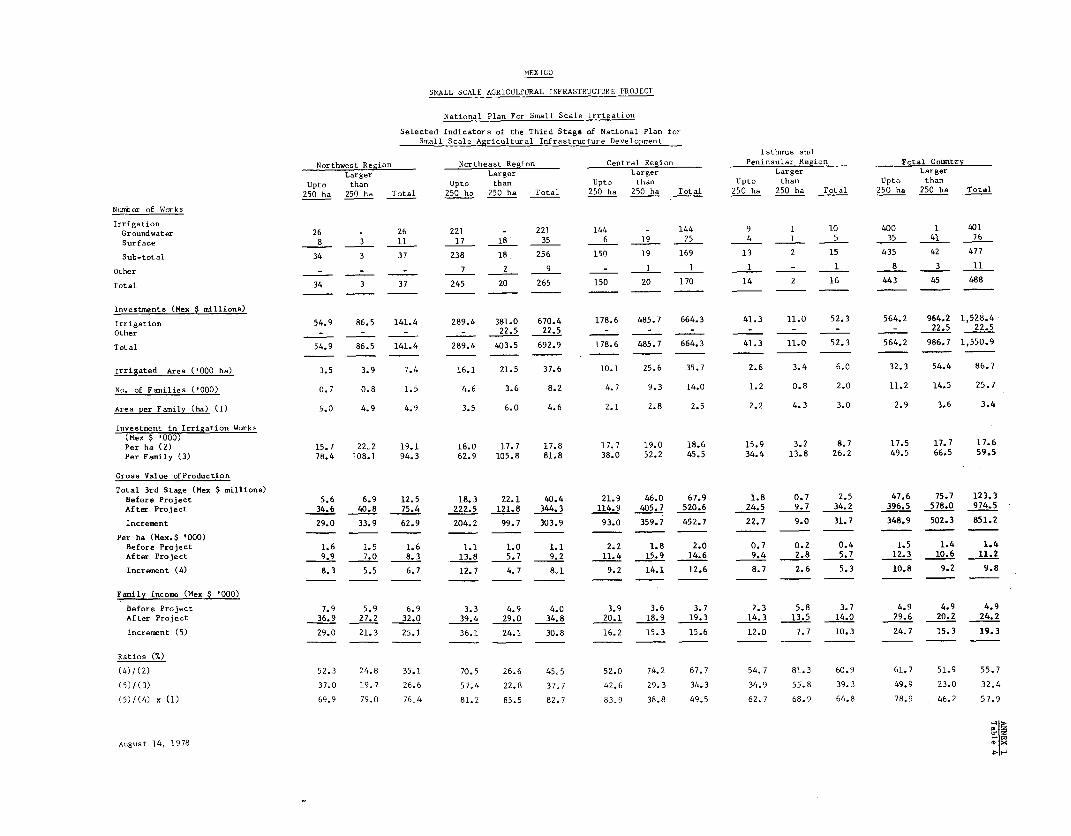
MEXICO
SMALL SCALE AGRICULTURAL INFRASTRUCTURE PROJECT
National Plan For Small Scale Irrigation
Selected Indicators of the Third Stage of National Plan fo'Smal1 Scale Agricultural Infrastructure Development
Isthmus andNorthwest Region Northeast Region Central Region Peninsular Region Total Countrv
Larger Larger Larger Larger LargerUpto than Upto than Upto than Upto than Upto than250 ha 250 ha Total 250 ha 250 ha Total 250 ha 250 ha Total 250 ha 250 ha Total 250 ha 250 ha Total
Nunter of Works
IrrigationGroundwater 26 - 26 221 - 221 144 - 144 9 1 10 400 1 401Surface 8 3 11 17 18 35 6 19 25 4 1 5 35 41 76Sub-total 34 3 37 238 18 256 150 19 169 13 2 15 435 42 477
Other _ - - 7 2 9 - 1 1 1 _ 1 8 3 11Total 34 3 37 245 20 265 150 20 170 14 2 16 443 45 488
Investmenta (Mex $ millions)
Irrigation 54.9 86.5 141.4 289.4 381.0 670.4 178.6 485.7 664.3 41.3 11.0 52.3 564.2 964.2 1,528.4Other - - - - 22.5 22.5 - - 22.5 22.5Total 54.9 86.5 141.4 289.4 403.5 692.9 178.6 485.7 664.3 41.3 11.0 52.3 564.2 986.7 1,550.9
Irrigated Area ('000 ha) 3.5 3.9 7.4 16.1 21.5 37.6 10.1 25.6 35.7 2.6 3.4 6.0 32.3 54.4 86.7No. of Families ('000) 0.7 0.8 1.5 4.6 3.6 8.2 4.7 9.3 14.0 1.2 0.8 2.0 11.2 14.5 25.7
Area per Family (ha) (1) 5.0 4.9 4.9 3.5 6.0 4.6 2.1 2.8 2.5 2.2 4.3 3.0 2.9 3.6 3.4
Investment in Irrigation Works(Mex $ '000)Per ha (2) 15.7 22.2 19.1 18.0 17.7 17.8 17.7 19.0 18.6 15.9 3.2 8.7 17.5 17.7 17.6Per Family (3) 78.4 108.1 94.3 62.9 105.8 81.8 38.0 52.2 45.5 34.4 13.8 26.2 49.5 66.5 59.5
Gross Value of Production
Total 3rd Stage (Mex $ millions)Before Project 5.6 6.9 12.5 18.3 22.1 40.4 21.9 46.0 67.9 1.8 0.7 2.5 47.6 75.7 123.3After Project 34.6 40.8 75.4 222.5 121.8 344.3 114.9 405.7 520.6 24.5 9.7 34.2 396.5 578.0 974.5Increment 29.0 33.9 62.9 204.2 99.7 303.9 93.0 359.7 452.7 22.7 9.0 31.7 348.9 502.3 851.2
Per ha (Mex.$ '000)Before Project 1.6 1.5 1.6 1.1 1.0 1.1 2.2 1.8 2.0 0.7 0.2 0.4 1.5 1.4 1.4After Project 9.9 7.0 8.3 13.8 5.7 9.2 11.4 15.9 14.6 9.4 2.8 5.7 12.3 10.6 11.2Increment (4) 8.3 5.5 6.7 12.7 4.7 8,1 9.2 14.1 12.6 8.7 2.6 5.3 10.8 9.2 9.8
Family Income (Mex $ '000)
Before Project 7.9 5.9 6.9 3.3 4.9 4.0 3.9 3.6 3.7 2.3 5.8 3.7 4.9 4.9 4.9After Project 36.9 27.2 32.0 39.4 29.0 34.8 20.1 18.9 19.3 14.3 13.5 14.0 29.6 20.2 24.2Increment (5) 29.0 21.3 25.1 36.1 24.1 30.8 16.2 15.3 15.6 12.0 7.7 10.3 24.7 15.3 19.3
Ratios (%)
(4)1(2) 52.3 24.8 35.1 70.5 26.6 45.5 52.0 74.2 67.7 54.7 81.3 60.9 61.7 51.9 55.7(5)/(3) 37.0 19.7 26.6 57.4 22.8 37.7 42.6 29.3 34.3 34.9 55.8 39.3 49.9 23.0 32.4(5)/(4) x (1) 69.9 79.0 76,4 81.2 85.5 82.7 83.9 38.8 49.5 62.7 68.9 64.8 78.9 46.2 57.9
August 14, 1978
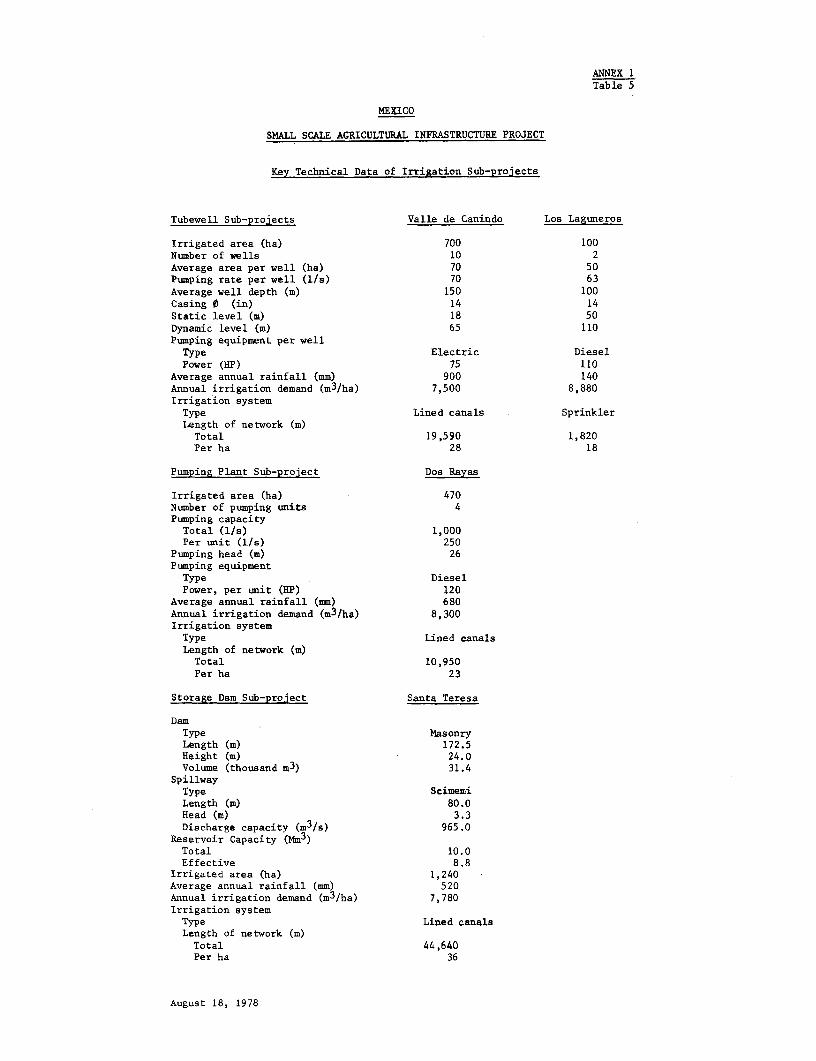
ANNEX 1Table 5
MEXICO
SMALL SCALE AGRICULTURAL INFRASTRUCTURE PROJECT
Key Technical Data of Irrigation Sub-projects
Tubewell Sub-projects Valle de Canindo Los Laguneros
Irrigated area (ha) 700 100Number of wells 10 2Average area per well (ha) 70 50Pumping rate per well (l/s) 70 63Average well depth (m) 150 100Casing 0 (in) 14 14Static level (m) 18 50Dynamic level (m) 65 110Pumping equipment per wellType Electric DieselPower (HP) 75 110
Average annual rainfall (mm) 900 140Annual irrigation demand (m3/ha) 7,500 8,880Irrigation systemType Lined canals SprinklerLength of network (m)Total 19,590 1,820Per ha 28 18
Pumping Plant Sub-project Dos Rayas
Irrigated area (ha) h70Number of pumping units 4Pumping capacityTotal (lIs) 1,000Per unit (lls) 250
Pumping head (m) 26Pumping equipment
Type DieselPower, per unit (HP) 120
Average annual rainfall (mm) 680Annual irrigation demand (m3 /ha) 8,300Irrigation system
Type Lined canalsLength of network (m)Total 10,950Per ha 23
Storage Dam Sub-project Santa Teresa
DamType MasonryLength (m) 172.5Height (m) 24.0Volume (thousand m3) 31.4
SpillwayType ScimemiLength (m) 80.0Head (m) 3.3Discharge capacity (m3/s) 965.0
Reservoir Capacity (Mm3)Total 10.0Effective 8.8
Irrigated area (ha) 1,240Average annual rainfall (mm) 520Annual irrigation demand (m3/ha) 7,780Irrigation systemType Lined canalsLength of network (m)Total 44,640Per ha 36
August 18, 1978
MEXICO
SMALL SCALE AGRICULTURAL INFRASTRUCTURE PROJECT
Summary Description forIrrigation and Drainage Sub-projects
1. General DataSub-project: Name, type and code numberState and MunicipalityDate
2. Basic Data2.1 Climate
Altitude (masl)Average temperature (max., mín., mean)Frost periodAverage rainfall (mm)Spring-Summer cycleFall-Winter cycleYear
2.2 Soils and Land UseIrrigable (or drainage) area (ha)Present land use (ha)Land classes (1 through 6, ha)
3. Technical Data
Groundwater Pumping Plant Dam Drainage
No. of wells No. of units Type Main drain(s)Average depth (m) Pumping capacity Length (m) Length (m)Casing 0 (in) Total (l/s) Height (m) Design capacity (m3/s)Tested yield (l/s) Per unit (l/s) Volume (m3) Secondary drainsPumping rate (l/s) Pumping head (m) Spillway Spacing (m)Area per well (ha) Pumping equipment Type Length (m)Static level (m) Type Length (m) Design capacity (m3/s)Dynamic level (m) Power per unit (HP) Head (m) Tertiary drainsPumping equipment Irrigation system Q (m3 /s) Spacing (m)
Type Type Reservoir capacity (Mm3) Length (m)Power per well (HP) Length (m) Total Desígn capacity (m3 /s)
Irrigation system Irrigation demand (m3/ha) EffectiveType Max. month Irrigation SystemLength (m) Annual Type d <
Irrigation demand (m3/ha) Length (m) m moQ cr zMax. month D 1 MAnnual N
4. Cost EstimatesYear 1 Year 2 ........ Total--------------(Mex $)---------------
1. Engineering2. Civil and on-farm works3. Equipment and Installation4. Contingencies5. Total Execution (1+2+3+4)6. Administration7. Total Expenditures (5+6)
5. Estimated Execution
Mex $
Force AccountLCB ContractsNegotiated ContractsImplementation: . Years
HD HtTS DXo >
6. Agricultural Development With Project
Without Development FullProject Period Development(per crop) (per year and crop) (per crop)
Area (ha)Yield (t/ha)Production (t)Price (Mex $/t)(*)Gross Value of Production
Per ha (Mex $) (1)Total (Mex $ '000) (2)
Production CostsPer ha (Mex $)
SeedsFertilizersPesticidesMachineryHired Labor (*)Family Labor (*)Total (3)
Per Sub-project (Mex $ '000) (4)Net Value of Production
Per ha (Mex $) (5)=(1)-(3)Per Sub-project (Mex $ '000) (6)=(2)-(4)Other Costs (per sub-project)
FinancialInsuranceTaxSub-total (7)
Sub-project ChargesO & MOtherSub-total (8)
(*) At on-going market rates.Ó<D i>t
IDCN-
7. Economic Analysis
(a) Costs Stream Total Expenditures, including replacement of equipment (as pertable of section 4, excluding price contingencies and, wherepossible, taxes), beneficiaries' investment, and O & M costs.
(b) Benefits Stream Net incremental value of production plus: salvage value, andlabor during construction period and operation period adjustedfor shadow prices, to be obtained through direct survey on acase by case basis.
(c) B/C, obtained by discounting at 12% annual costs and benefits over a period of 25 years.
8. Annual Family Income
(a) Aggregated family income per sub-project: Net Value of Productionplus : family laborless : other costsless : project sub-charges
(b) Number of families
(c) Average annual income per family (a/b)
9. Supporting Data
Unit prices, quantities and assumptions used for the preparation of section 6.
CD Xo'-
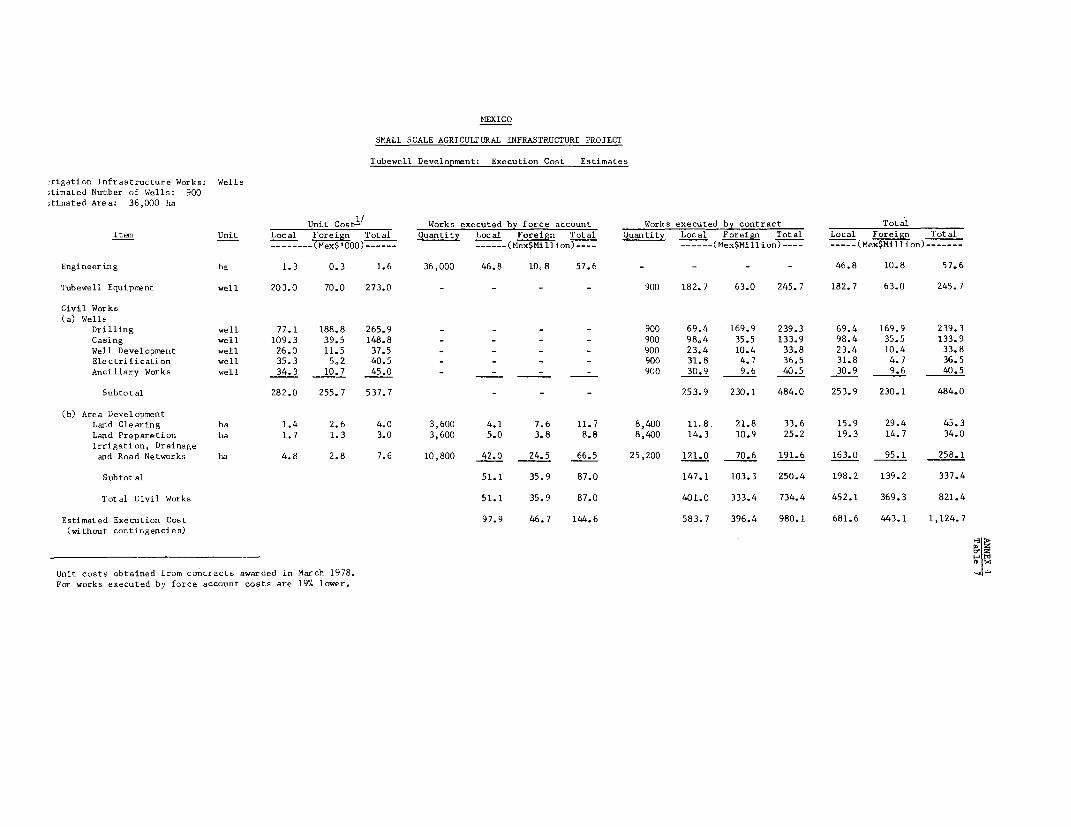
MEXICO
SMALL SCALE AGRICULTURAL INFRASTRUCTURE PROJECT
Tubewell Development: Execution Cost Estimates
7rigation Infrastructure Works: Wells;timated Number of Wells: 900;timated Are a: 36,000 ha
Unit Cost-/ Works executed by force account Works executed by contract TotalItem Unit Local Foreígn Total Quantity Local Foreígn Total Quantity Local Foreign Total Local Foreign Total
--------(Mex$'000) ----- ------(Mex$Million)---- -- -(Mex$Million)---- -----(Mex$Million)-------
Engineering ha 1.3 0.3 1.6 36,000 46.8 10 8 57.6 _- - - 46.8 10.8 57.6
Tubewell Equipmnt well 203.0 70.0 273.0 - - - - 900 182.7 63.0 245.7 182.7 63.0 245.7
Civil Works(a) Wells
Drilling well 77.1 188.8 265.9 - - - - 900 69.4 169.9 239.3 69.4 169.9 239.3Casing well 109.3 39.5 148.8 - - - - 900 98.4 35.5 133.9 98.4 35.5 133.9Well Development well 26.0 11.5 37.5 - - - - 900 23.4 10.4 33.8 23.4 10.4 33.8Electrification well 35.3 52 40.5 - - - - 900 31.8 4.7 36.5 31.8 4.7 36.5Ancillary Works well 34.3 10.7 45.0 - - - - 900 30.9 9.6 40.5 30.9 9.6 40.5
Subtotal 282.0 255.7 537.7 - - - 253.9 230.1 484.0 253.9 230.1 484.0
(b) Area DevelopmentLand Clearing ha 1.4 2.6 4.0 3,600 4.1 7.6 11.7 8,400 11 8. 21.8 33.6 15.9 29.4 45.3Land Preparetion ha 1.7 1.3 3.0 3,600 5.0 3.8 8.8 8,400 14.3 10.9 25.2 19.3 14.7 34.0Irrigation, Drainageand Road Networks ha 4.8 2.8 7.6 10,800 42.0 24.5 66.5 25,200 121.0 70.6 191.6 163.0 95.1 258.1
Subtot al 51.1 35.9 87.0 147.1 103.3 250.4 198.2 139.2 337.4
Total Civil Works 51.1 35.9 87.0 401.0 333.4 734.4 452.1 369.3 821.4
Estimated Execution Cost 97.9 46.7 144.6 583.7 396.4 980.1 681.6 443.1 1,124.7(without contingencies)
Unit costs obtained from contracts awarded in March 1978.For works executed by force account costs are 19% lower.
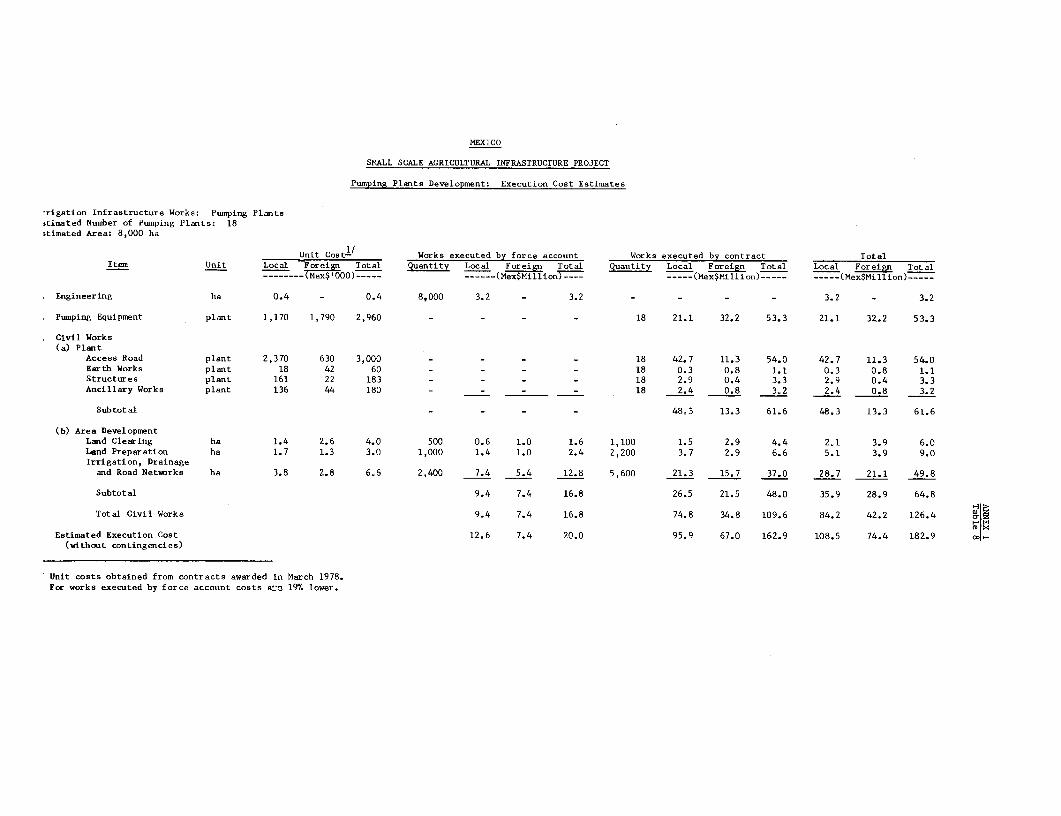
MEXICO
SMALL SCALE AGRICULTURAL INFRASTRUCTURE PROJECT
Pumping Plants Development: Execution Cost Estimates
-rigation Infrastructure Works: Pumping Plants3timated Number of Pumping Plants: 18stimated Area: 8,000 ha
Unit Cost / Works executed by force account Works executed by contract TotalItem Unit Local Foreign Total Quantity Local Foreign Total Quantity Local Foreign Total Local Foreign Total
-------- (Mex$'000) ----- ---- (Mex$Million)---- ---- (Mex$Million) …----- (Mex$Million)-----
Engineering ha 0.4 - 0.4 8,000 3.2 _ 3.2 -- - - 3.2 - 3.2
Pumping Equipment plant 1,170 1,790 2,960 - - - - 18 21.1 32.2 53.3 21.1 32.2 53.3
Civil Works(a) Plant
Access Road plant 2,370 630 3,000 - - - - 18 42.7 11.3 54.0 42.7 11.3 54.0Earth Works plant 18 42 60 - - - - 18 0.3 0.8 1.1 0.3 0.8 1.1Structures plant 161 22 183 - - - - 18 2.9 0.4 3.3 2.9 0.4 3.3Ancillary Works plant 136 44 180 - - - - 18 2.4 0.8 3,2 2.4 0.8 3.2
Subtotal - - - 48.3 13.3 61.6 48.3 13.3 61.6
(b) Area DevelopmentLand Clearing ha 1.4 2.6 4.0 500 0.6 1.0 1.6 1,100 1.5 2.9 4.4 2.1 3.9 6.0Land Preparation ha 1.7 1.3 3.0 1,000 1.4 1.0 2.4 2,200 3.7 2.9 6.6 5.1 3.9 9.0Irrigation, Drainage
and Road Netierks ha 3.8 2.8 6.6 2,400 7.4 5.4 12.8 5,600 21.3 15.7 37.0 28.7 21.1 49.8
Subtotal 9.4 7.4 16.8 26.5 21.5 48.0 35.9 28.9 64.8
Total Civil Works 9.4 7.4 16.8 74.8 34.8 109.6 84.2 42.2 126.4
Estimated Execution Cost 12.6 7.4 20.0 95.9 67.0 162.9 108.5 74.4 182.9(without contingencies)
Unit costs obtained from contracts awarded in March 1978.For works executed by force account costs awn 197' lower.
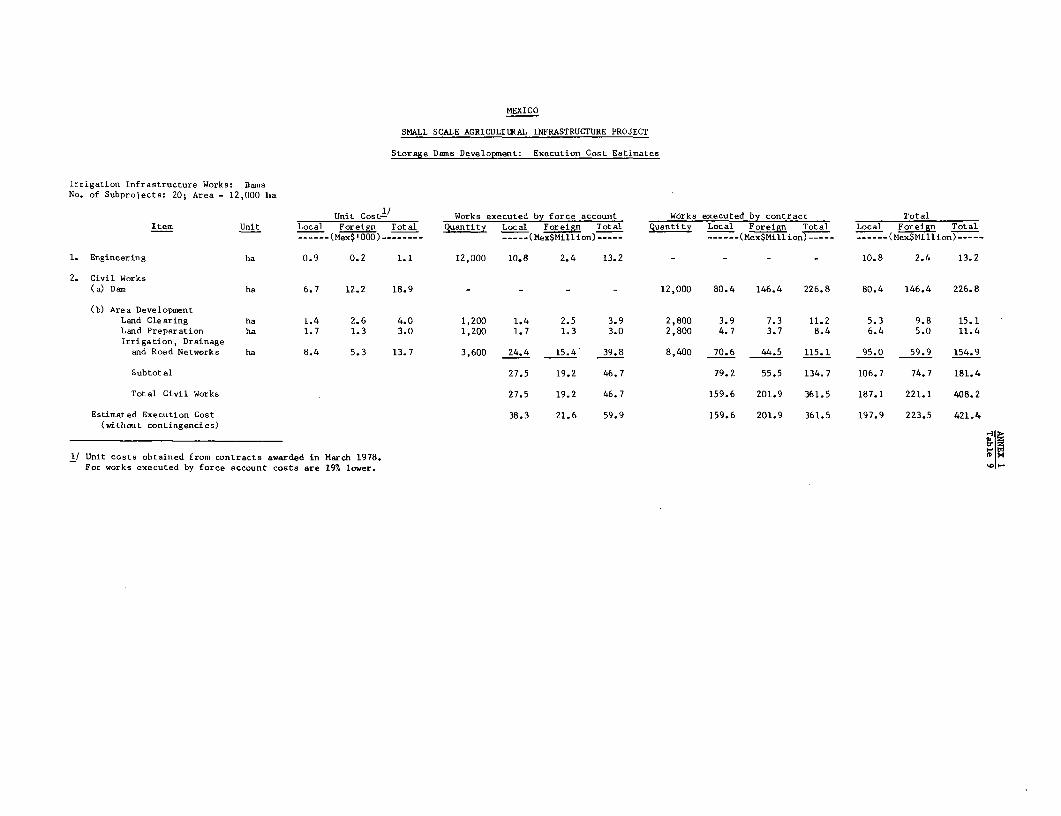
MEXICO
SMALL SCALE AGRICULTURAL INFRASTRUCTURE PROJECT
Storage Dama Development: Execution Cost Estimates
Irrigation Infrastructure Works: DamsNo. of Subprojects: 20; Area = 12,000 tia
Unit Cost1
/ Works executed by force account Works executed by contract TotalItem Unit Local Foreign Total Quantity Local Foreign Total Quantity Local Foreign Total Local Foreígn Total
-- ---- (Mex$'000) -------- ----- (Mex$Million) --- -- --- _- (Mex$Million) ------ ----- (Mex$Million) -----
1. Engineering ha 0.9 0.2 1.1 12,000 10.8 2.4 13.2 - - - - 10.8 2.4 13.2
2. Civil Works(a) Dam ha 6.7 12.2 18.9 - - - - 12,000 80.4 146.4 226.8 80.4 146.4 226.8
(b) Area DevelopmentLand Clearing ha 1.4 2.6 4.0 1,200 1.4 2.5 3.9 2,800 3.9 7.3 11.2 5.3 9.8 15.1Land Preparation ha 1.7 1.3 3.0 1,200 1.7 1.3 3.0 2,800 4.7 3.7 8.4 6.4 5.0 11.4Irrigation, Drainage
and Road Networks ha 8.4 5.3 13.7 3,600 24.4 15.4 39.8 8,400 70.6 44.5 115.1 95.0 59.9 154.9
Subtotal 27.5 19.2 46.7 79.2 55.5 134.7 106.7 74.7 181.4
Total Civil Works 27.5 19.2 46.7 159.6 201.9 361.5 187.1 221.1 408.2
Estimated Execution Cost 38.3 21.6 59.9 159.6 201.9 361.5 197.9 223.5 421.4(without contingencies)
1/ Unit costs obtained from contracta awarded in March 1978.For works executed by force account coats are 19% lower.
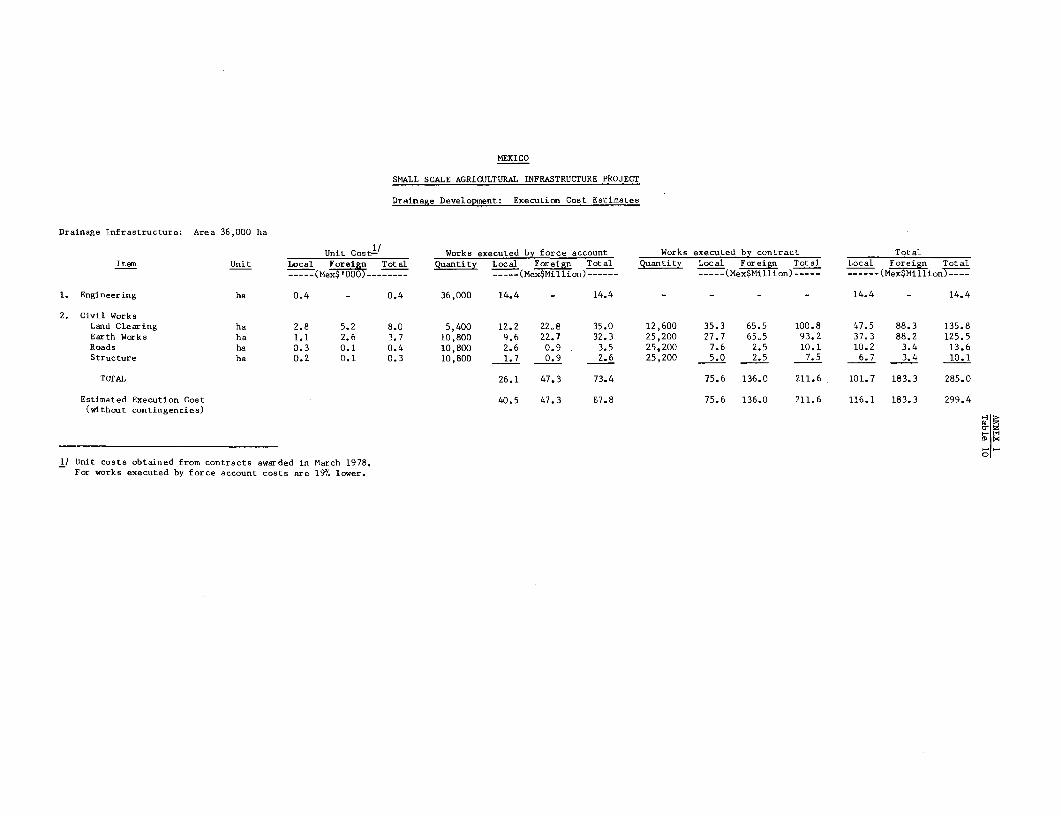
MEXICO
SMALL SCALE AGRICULTURAL INFRASTRUCTURE PROJECT
Drainage Development: Execution Cost Estimates
Drainage Infrastructure: Area 36,000 ha
Unit Costi/ Works executed by force account Works executed by contract TotalItem Unit Local Foreln Total Quantity Local Foreign Total Quantity Local Foreign Total Local Foreign Total
_____(Me0 ----- ----- (Mex$Million) ------ ___-(Mex$Míllion) ----- ------ (Mex$Million--
1. Engineering ha 0.4 - 0.4 36,000 14.4 - 14.4 - - - - 14.4 - 14.4
2. Civil WorksLand Clearing ha 2.8 5.2 8.0 5,400 12.2 22,8 35.0 12,600 35.3 65.5 100.8 47.5 88.3 135.8Earth Works ha 1.1 2.6 3.7 10,800 9.6 22.7 32.3 25,200 27.7 65.5 93.2 37.3 88.2 125.5Roads ha 0.3 0.1 0.4 10,800 2.6 0.9 3.5 25,200 7.6 2.5 10.1 10.2 3.4 13.6Structure ha 0.2 0.1 0.3 10,800 1.7 0.9 2.6 25,200 5.0 2.5 7.5 6.7 3.4 10.1
TOrAL 26.1 47.3 73.4 75.6 136.0 211.6 101.7 183.3 285.0
Estimated Execution Cost 40.5 47.3 87.8 75.6 136.0 211.6 116.1 183.3 299.4(without contingencies)
b mi
1/ Unit costs obtained from contracts awarded in March 1978.For works executed by force account costs are 19% lower.
Annex 1
Tablae 11
MEXICO
SMALL SCALE AGRICULTURAL INFRASTRUCTURE PROJECT
Project Cont Estimates
Local Forei n Total Local Fore n Total-(MexMillion)--------- ------- (U on)-------
A. Irrigation Infrastructure
EngineeringWells 46.8 10.8 57.6 2.0 0.5 2.5Pumping Plants 3.2 - 3.2 0.1 - 0.1Dama 10.8 2.4 13.2 0.5 0.1 0.6
Subtotal 60.8 13.2 74.0 2.6 0.6 3.2
Civil WorksWells 452.1 369.3 821.4 19.6 16.1 35.7Pumping Plants 61.2 42.2 103.4 2.7 1.8 4.5Dasm 136.0 221.1 357.1 5.9 9.6 15.5
Subtotal 649.3 632.6 1,281.9 28.2 27.5 55.7
Leas Cona. Equip. 16.8 151.6 168.4 0.7 6.6 7.3
Net Civil Works 632.5 481.0 1,113.5 27.5 20.9 48.4
EquipmentStudies 3.5 31.0 34.5 0.1 1.4 1.5Construction 16.8 151.6 168.4 0.7 6.6 7.3Wells 182.7 63.0 245.7 8.0 2.7 10.7Pumping Planta 21.1 32.2 53.3 0.9 1.4 2.3
Subtotal 224.1 277.8 501.9 9.7 12.1 21.8
Physical ContingenciesEngineering (5%) 3.0 0.7 3.7 0.1 - 0.1Civil Works (10%) 70.7 48.1 118.8 3.1 2.1 5.2Equipment (10%) 22.4 27.8 50.2 1.0 1.2 2.2
Subtotal 96.1 76.6 172.7 4.2 3.3 7.5
Execution Cost 1.013.5 848.6 1,862.1 44.0 36.9 80.9
B. Drainage Infrastructure
Engineering 14.4 - 14.4 0.6 - 0.6
Civil Works 65.6 183.3 248.9 2.9 8.0 10.9Leas Const. Equip. 3.5 31.9 35.4 0.2 1.4 1.6
Net Civil Works 62.1 151.4 213.5 2.7 6.6 9.3
Equipment (Construction) 3.6 31.8 35.4 0.2 1.4 1.6
Physical ContingenciesEngineering (5%) 0.7 - 0.7 - - -
Civil Works (10%) 9.8 15.2 25.0 0.5 0.7 1.2Equipment (10%) 0.4 3.2 3.6 - 0.1 0.1
Subtotal 10.9 18.4 29.3 0.5 0.8 1.3
Execution Costs 91.0 201.6 292.6 4.0 8.8 12.8
C. Livestock Infrastructure
Studies 8.2 - 8.2 0.4 - 0.4On-farm Works 161.0 48.7 209.7 7.0 2.1 9.1Installationa 10.4 15.7 26.1 0.4 0.7 1.1Physical Contingencies
Studies (5%) 0.4 - 0.4 - - -
On-farm Works (10%) 19.5 4.9 24.4 0.9 0.2 1.1Installations (10%) 1.0 1.6 2.6 - 0.1 0.1
Subtotal 20.9 6.5 27.4 0.9 0.3 1.2
Execution Cost 200.5 70.9 271.4 8.7 3.1 11.8
Total Execution Costs 1,305.0 1,121.1 2,426.1 56.7 48.8 105.5Administration 385.5 - 385.5 16.8 - 16.8
Baseline Cost 1,690.5 1,121.1 2,811.6 73.5 48.8 122.3
Price Contingencies 234.6 257.6 492.2 10.2 11.2 21.4
TOTAL PROJECT COST 1,925.1 1,378.7 3,303.8 93.7 60.0 143.7
Beneficiaries contribution, (144.2) - (144.2) (6.3) - (6.3)through labor, duringconstruction period
ANNEX 1Table 12
MEXICO
SMALL SCALE AGRICULTURAL INFRASTRUCTURE PROJECT
Estimated Schedule of Expenditures
1979 1980 1981 1982 Total-------- (US$ million)--------------
Engineering 1.0 1.0 1.1 1.1 4.2
Civil and On-farm WorksIrrigatíon 8.8 14.1 14.4 11.1 48.4Drainage 1.4 2.3 2.8 2.8 9.3Livestock 1.5 2.6 3,1 1.9 9.1
Sub-total 11.7 19.0 20.3 15.8 66.8
EquipmentStudies 1.5 - - - 1.5Construction 8.9 - - - 8.9
Wells 1.8 2.9 2.7 3.2 10.7Punmping Plants 0.2 0.8 0.8 0.5 2.3Livestock - 0.2 0.6 0.4 1.1
Sub-total 12.4 3.9 4.1 4.1 24.5
Physical Contingencies 2.6 2.6 2.7 2.1 10.0
Execution Cost 27.7 26.5 28.2 23.1 105.5
Administration 4.3 4.3 4.5 3.7 16.8
Baseline Cost 32.0 30.8 32.7 26.8 122.3
Price Contingencies 2.1 4.3 7.1 7.9 21.4
TOTAL EXPENDITURES 34.1 35.1 39.8 34.7 143.7
Beneficiaries contribution, (1.1) (1.8) (1.9) (1.5) (6.3)through labor, duringconstruction period
ANNEX 1Table 13
MEXICO
SMALL SCALE AGRICULTURAL INFRASTRUCTURE PROJECT
Equipment for Studies
Description 1/ Total CostMex$ '000 US$ '000
Soil Mechanics Laboratory 1,650.0 71.7
Geophysic Studies 2,400.0 104.4
Hydrogeologic Studies 6,000.0 260.9
Geologic Studies 6,450.0 280.4
Testing and Development 18,000.0 782.6
TOTAL 34,500.0 1,500.0
1/ See details in appendix to this table.
ANNEX 1Table 13Appendix
DETAILED DESCRIPTION OF EQUIPMENTFOR STUDIES
CANI. DESCRIPCION IMPORTL(en m¡le, )
CQUIPO LARORATORIO MFCANICA nE SIIFLOS
6 oBancos completos poro prucibns trioxio-lcis ccn 4 cámaras cada uno. $ 1,080.0
1 Bvnco completo pdro prueba+s triídxíaltáIcon 12 cámaras 570-0
SUMA 1,650.o
EQUIPO GLOIIIDROLO%GIA
4 Instru.cnto por c1fcctuar estudios deregiatroB eléctricol,
i (portAtitc-is), obtet- -n¡éndose gqratrcan ce po-tencial naaturaly dc resistividad, equipodos totnlmr,n-tt- con todos los accesorios, así c~cmo-
con 1,000 metro% J de cabie de acero (po#y) de 3/16" y 30 setrox de papel1 gr6-fiic dc 5- API. listos para su opera--
ci6n. 6,0o0.0
4 Irnutrumt!nto qeolfsisa< para exp IlOraCi6ónde¡ Iubsue lo
compIreto con lo s.au,rnte; Uni-
dad principaI para tomar lec-turas, fuerote dc poder de haterias, 4 carrete.% coicable., 5 ele.ctrodos, cables de intx!rco-ne; 6n, peso apru.imando 125 Kg. 2,400.0
SUMA 8,400.0
EQUIPO DF GEOLG 1A
.3 Perfortidora Long-year '44K 2,4C0.0
3 Vabezo de gato 48.0
,3 malacate Wirc Line! 150.0
3 Si¡stema% trtrhctm I 63.0
3 Aúcesorios de virranstro 54.0
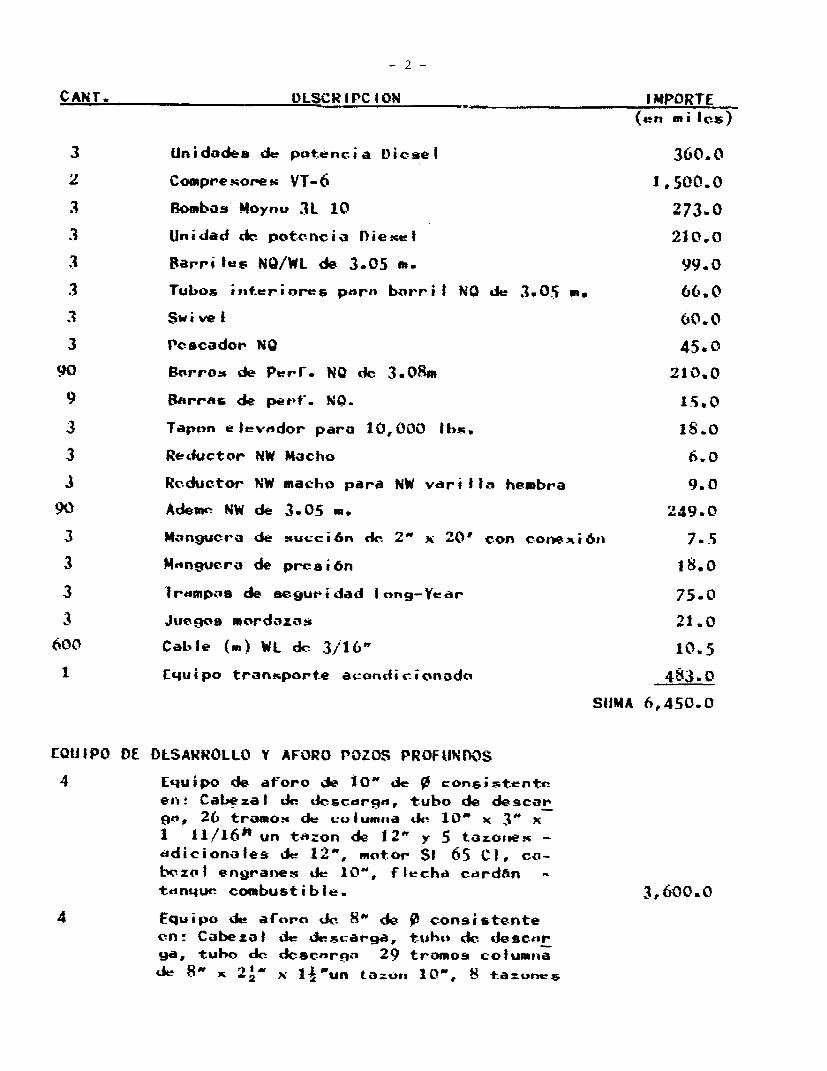
-2-
CANT. _LSCRIPCION IMPORTE(en mi Ic)
3 Unidades de potencia Di.sel 360.0
2 Compre>ore f VT-6 1, 500.0
3 Bombos. Moynu 31 10 273.0
.3 Unidad de pot-c-ncia nieel 210.0
.3 pçarri les NQ/WL de 3.05 m. 99.0
.3 Tub>os iuiteríores para borri I NO dct 3.05 m. 66.0
3 Swive 60.0
3 Pcscador NO 45.0
90 Borro,u de Perr. NO de 3.08m 210,0
9 B"rrAs de pert. NoC. 15.
3 Tapon e lev.sdor para 10,000 lb.s 18.0
3 Reductor NW Macho 6,0
3 Reductor NW macho para NW varill hembra 9.0
910 Ademr. NW de 3.05 , 49.0
3 Manguero de !uccibn de 2 x 2,0' con c-onexió6n 7.5
3 M"n9uera de presión 18.0
3 Trdmpos de segpuridad I,ong-Year 75.0
3 Juc_o9 mordozo-5 21.0
<'00? Cab le (m) WL d- 3/ 16" 10.5
1 Equipo tranucport.e acondiscionodo 4~83.O
SIIMA 6,450.0
EOUIPO DE DLSAWROLLO Y AFORO POZOS PROFUNIXIS
4 Equipo de aforo de 1O" de 0 cons&¡.-tcntc-een: Cabeza¡ sic desodrqd, tubo de descar
n 26 tramoN de .ulumr,a de 10" x 3" x1 11/16" un tnzon de 12" y 5 tazo.se -
ddicíonaoles de 12", motor SI 65 Cl, co-bc.zoa engranex de 10", f Iechhd card¿n -
tdnmuc- combustible. 3,600.0
4 Equipo de aforn de. 8c de 0 consistenteonr Cabeza 1 de dce;=arga, tuhil de. uescrya, tubo d0 dcscnrqna% 29 tramos columnlade 8" x 21" N 1 'un ta_or, lO", 8 t.a=urnS
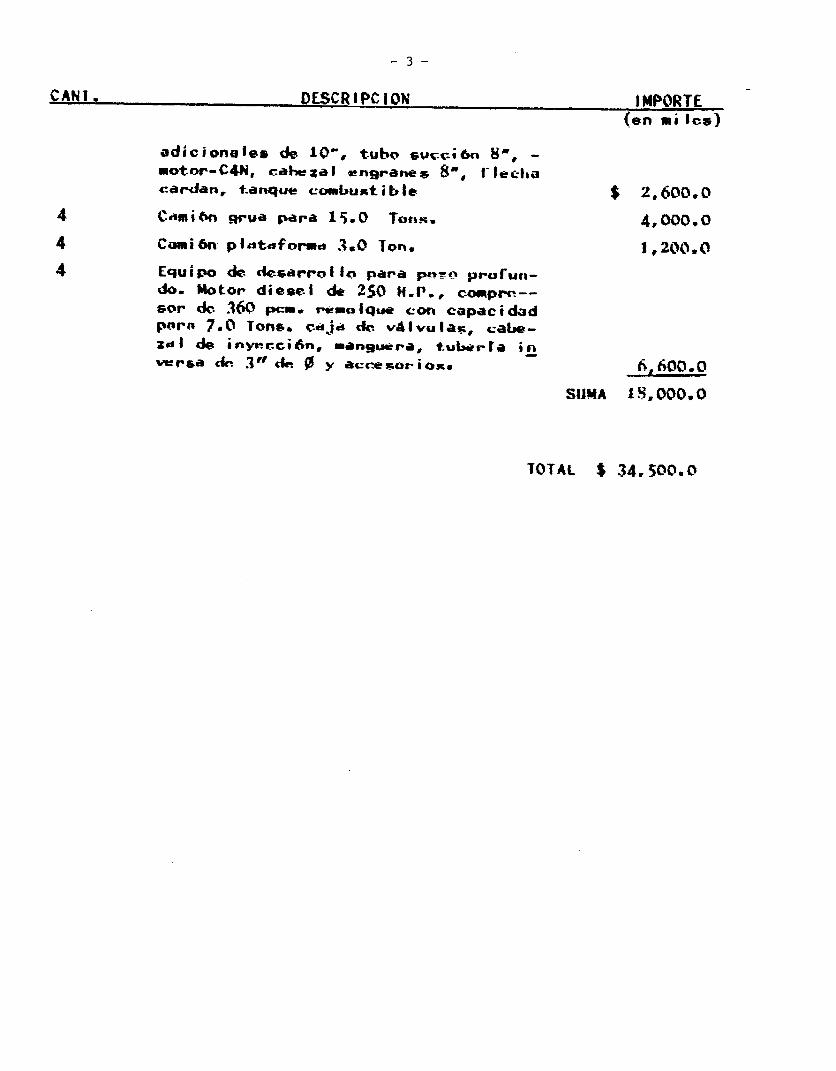
-3-
CANI. DESCRIPCION IMPORTE(en mi ls)
adicionales de 10', tubo svsci.6n 8,otor-C4N, cabezaI engranes 8", 'Iechia
cardan, tanque coawbuMtible $ 2.600.0
4 Cé1mi<mn Rr,a para 15.0 Tons. 4,000.0
4 Camión piJntoforma 3.0 Ton. 1 200.0
4 Equipo d< &ksarrolln para pn,' prurun-do. Motor die~# de 250 H.P., compre--sor dc. 360 pca. rtuo ¡que con capacidadporo 7.0 Ton&. cuija dc. válvula%, cabe-zXl de inyrcc;6n, manguera, tuLerra inwrsa dn I3f d 0 y acreroriox. hhQC.O
SuMA 1 S. 000. 0
TOTAL $ 34,500.0
MEXICO
SMALL SCALE AGRICULTURAL INFRASTRUCTURE PROJECT
Equipment for Construction
Description Quantity Unit Price Total CostMex $'000 US$'000 Mex $'000 US$'000
Equipment for Civil WorksTrack-type tractor: (200 HP) 5 2,800 121.7 14,000 608.5Track-type tractor: (300 HP) 3 5,000 217.4 15,000 652.2
with land clearing implements
Sheepsfoot roller 2 700 30.4 1,400 60.8Compressor (325 ft3 /min) 8 470 20.4 3,760 163.2Front loader (2 yd3) 16 1,800 78.3 28,800 1,252.8Wheel Tractor (300 HP) 12 5,000 217.4 60,000 2,608.8Tank Truck 30 400 17.4 12,000 522.0Track-drill with compressor 2 3,000 130.4 6,000 260.8
(600 ft3/min)
Flat-bed trailer 3 2,000 87.0 6,000 261.0
Dumper (16 ton) 5 400 17.4 2,000 87.0Truck (8 ton) 22 250 10.9 5,500 239.8Truck (3 ton) 22 200 8.7 4,400 191.4Sub-total 158,860 6,908.3
Equipment for On-farm Works
Tractor (105 HP) 6 400 17.4 2,400 78.0Land Preparation Implements 6 300 13.0 1,800 104.4Sub-total 4,200 182.4
Sub-total Equipment 163,060 7,090.7Spare Parts (25%) 40,765 1,772.7
TOTAL 203,825 8,863.4
August 18, 1978
ANNEX 1Table 15
MEXICO
SMALL SCALE AGRICULTURAL INFRASTRUCTURE PROJECT
Schedule of Disbursement
CumulativeBank FY and Semester Amount Disbursed Balance of Loan
--------------- (US$ thousand)----------------
1979June 30, 1979 300 59,700
1980December 31, 1979 8,500 51,500June 30, 1980 21,400 38,600
1981December 31, 1980 26,700 33,300June 30, 1981 34,600 25,400
1982December 31, 198] 40,300 19,700Jure 30, 1982 48,800 11,200
1983December 31, 1982 1/ 53,200 6,800June 30, 1983 2/ 60,000
1/ Estimated completion date.
2/ Estimated closing date.
November 6, 1978
MEXICO
SMALL SCALE AGRICULTURAL INFRASTRUCTURE PROJECT Sub-project: Valle de Canindo
Tubewell Development Model (700 ha) State: Miohoacan
Investment Costs
1/ ~~~~~~~~~~~~~~~~~~~~~~~~~~~~~~Phaslng ofUnit Cost Works Executed by Force Account Works Executed by Contract Total Investoient
Item Unit Local Foreign Total Quantity Local Foreígn Total Quantity Local Foreign Total Local Foreign Total Year 1 Year 2_ _ _ _ _--- ( Mex$'O000) ----(- e-$ ' 000) (Mex$'000) --- - (Mex$ ' 000)--
1. Engineeríng ha 1.3 0_3 1.6 700 910 210 1,120 - - - - 910 210 1,120 1,120 -
2. Tubewell Equipment well 203.0 70.0 273.0 - - - - 10 2,030 700 2,730 2,030 700 2,730 2,730 -
3. Civil Worksa) Wells
drilling well 77.1 188.8 265.9 - - 10 771 1,888 2,659 771 1,888 2,659 1,330 1,329casíng well 109.3 39.5 148.8 - - - - 10 1,093 395 1,488 1,093 395 1,488 744 744well development well 26.0 11.5 37.5 - - - - 10 260 115 375 260 115 315 188 187electrification vell 35.3 5.2 40.5 - - - - 10 353 52 405 353 52 405 202 203ancillary works well 34.3 10.7 45.0 - - - _ 10 343 107 450 343 107 450 225 225
Su,btotal 282.0 255.7 537.7 - - - 2,820 2,557 5,377 2,820 2,557 5,377 2,689 2,688
b) Area Developmentland preparation ha 1.7 1.3 3.0 70 119 91 210 150 255 195 450 374 286 660 _ 660irrigation, drainage
and road networks ha 4.8 2.8 7.6 200 960 560 1,520 500 2,400 1,400 3,800 3,360 1,960 5,320 - 5,320
Subtotal 1,079 651 1,730 2,655 1,595 4,250 3,734 2,246 5,980 - 5,980
Total Civil Works 1,079 651 1,730 5,475 4,152 9,627 6,554 4,803 11,357 2,689 8,668
4. Physícal Contingencies 199 86 285 751 485 1,236 950 571 1,521 654 867
5. Execution Cost 2,188 947 3,135 8,256 5,337 13,593 10,444 6,284 16,728 7,193 9,535
6. Supervision 328 142 470 1.238 801 2,039 1,566 943 2,509 1,079 1,430
7. Total Cost 2,516 1,089 3,605 9,494 6,138 15,632 12,010 7,227 19,237 8,272 10,965
1/ Unít costs for civil works obtained from contracta awarded in March 1978. For works executed byforce accounts costa are 19% lower.
August 2, 1978
MEXICO
SMALL SCALE AGRICULTURAL INFRASTRUCTURE PROJECT
Tubewell Development Model (700 ha unit)Sub-project: Valle de Canindo
Development Pe-^iod State: Michoacan
CroppingD E V E L O P M E N T P E R I C D Intensity
Crops Wheat Barley Beans Soya Maize Alfalfa TOTAL (%)
Price (Mex$/ton) 2,600.0i 1,740.0 5,250.0 5,500.0 2,900.0 300.0
--------------------------------- Year 3------------------------------
Area (ha) 120.0 80.0 100.0 - 400.0 - 100Yield (m ton/ha) 2.0 2.5 1.0 - 2.0 -Production (m ton) 240.0 200.0 100.0 - 800.0 -Gross Value of Production (Mex$'000) 624.0 348.0 525.0 - 2,320.0 - 3,817.0Total Operating Costs (Mex$'000) 513.6 327.0 262.0 - 952.0 - 2,054.6
Operating Income (Mex$'000) 110.4 21.0 263.0 - 1,368.0 - 1,762.4
…-- - - - -- - - - - -- - - - - ear 4 -…-- - - - - - - - - - - - -
Area (ha) 200.0 100.0 100.0 40.0 360.0 40.0 120Yield (m ton/ha) 2.5 3.2 1.4 1.3 2.7 56.0Production (m ton) 500.0 320.0 140.0 52.0 972.0 2,240.0Gross Value of Production (Mex$'000) 1,300.0 556.8 735.0 286.0 2,818.8 672.0 6,368.6Total Operating eosts (Mex$'000) 886.0 450.0 315.0 177.0 1,413.0 421.0 3,662.0
Operating Income (Mex$'000) 414.0 106.8 420.0 109.0 1,405.8 251.0 2,706.6
--------------------------------- Year 5----------------------------
Area (ha) 240.0 120.0 100.0 100.0 320.0 100.0 140Yield (m ton/ha) 3.1 3.7 1.6 1.5 3.2 64.0Production (m ton) 744.0 444.0 160.0 150.0 1,024.0 6,400.0Gross Value of Production (Mex$'000) 1,934.0 772.6 840.0 825.0 2,969.6 1,920.0 9,261.6Total Operating Costs (Mex$'000) 1,171.2 588.0 354.0 483.0 1,382.0 1,028.0 5,0G6.2
Operating Income (Mex$'000) 762.8 184.6 486.0 342.0 1,587.6 892.0 4,255.0
Du 2
August 2, 1978
MEXICO
SMALL SCALE AGRICULTURAL INFRASTRUCTURE PROJECT
Tubewell Development Model (700 ha) Sub.project: Valle de CanindoState: Michoacan
Projected Land Use, Production and Income
------------------With Project at Full Development (Year 6) ----------------------- - - - - - - Without Project - - - - - - - Cropping
Crops Wheat Barley Maize Beans Total Wheat Barley Beana Soybeans Maize Alfalfa Total Intensíty (7.)
Area (ha) 100 40 500 60 700 280 140 140 140 280 140 1,120 160Yield (m ton/ha) 1.4 1.5 1.3 .7 3.5 4.0 1.8 1.6 3.5 72.0Production (m ton) 140 60 650 42 980 560 252 224 980 10',080Price (Mex$ /m ton) 2,600 1,740 2,900 5,250 2,600 1,740 5,250 5,500 2,900 300Gross Value of Production:
per ha (Mex$) 3,640 2,610 3,770 3,675 9,100 6,960 9,450 8,800 10,150 21,600per unit (Mex$ '000) 364 104.4 1,885 220.5 2,573.9 2,548 974.4 1,323 1,232 2,842 3,024 11,943.4
Operating Costs
per ha (Mex$):Seeds 260 230 60 33 420 670 650 350 180 400Fertilizer - - 250 180 640 400 360 420 530 280Pesticides - - - - 250 200 150 300 150 400Family Labor_/1 880 880 1,100 880 1,460 1,460 1,170 1,920 2,190 5,260Machinery 650 650 450 300 1,050 1,050 600 1,200 600 1,800Water Charges - - - - 800 800 140 140 300 1,400Insurance 64 62 53 36 160 220 130 170 120 300Tax 146 105 151 147 325 280 380 350 410 865Total 2,000 1,927 2,064 1,576 5,105 5,080 3,580 4,850 4,480 10,705
per Unit (Mex$ '000) 200 77.1 1,032 94.5 1,403.6 1,429.4 711.2 501.2 679 1,254.4 1,498.7 6,073.9
Operating Income
per ha (Me>$) 1,640 683 1,706 2,099 3,995 1,880 5,870 3,950 5,670 10 895per unit (Mex$ '000) 164 27.3 853 126 1,170.3 1,118.6 263.2 821.8 553 1,587.6 1,525.3 5,869.5
1/ At Mex$ 73 per day.
August 2, 1978
SMALL SCALE AGRICULTURAL INFRASTRUCTURE PROJECr
Tubea,ll Development Model (700 ha) Stutrj Mi Vhaleea
(Mex $ ' 000)
W i t h P t -- -- - -- - -- -- - -- - -- -- - -- - -- -With-t i----------------------------------------------------------------------------------------------- Y.--- ------------ ___--_------ __--------- __-__----------------------____________
At Untt L-cl Proeject 1 2 3 4 5 6 7 8 9 10 11 12 13 14 15 16 17 18-25
Cash Inflow
51aes 2 2,573.9 2,573.9 2,573.9 3,817.0 6,368.6 9,423.4 11,943.4 11,943.4 11,943.4 11,943.4 11,943.4 11,943.4 11,943.4 11,943.4 11,943.4 11,943.4 11,943.4 11,943.4 11,943.4Long-trer ,852.9 - - - - - - - - - - - - - - - - -Short-term Credit
2' 192.5 192.5 192.5 355.6 1.255.8 2,123.4 2,393.3 2,393.3 2,393.3 2,393.3 2,393.3 2,393.3 2,393.3 2,393.3 2,393.3 2,393.3 2,393.3 2,393.3 2,393.3
Total lnflow 2,766.4 5,619.3 2,766.4 4,152.6 7,624.4 11,546.8 14,336.7 14,336.7 14,336.7 14,336.7 14,336.7 14,336.7 14,336.7 14,336.7 14,336.7 14,336.7 14,336.7 14,336.7 14,336.7
Cash QOtfloo
lovcetcente and Roplac.. 7enct - 3,003.0 - - - - - - - 3,003.0 - - - - - - - 3,003.0 -Cash Opera--a 8 lpenpee- 677.7 677.7 677.7 475.6 1,607.8 2,392.8 3,023.3 3,023.3 3,023.3 3,023.3 3,023.3 3,023.3 3.023.3 3,023.3 3,023.3 3,023.3 3.023.3 3,023.3 3,023.3
Intersat:Long-tar Loae (11%) - 313.8 313.8 313.8 313.8 313.8 297.8 280.0 260.2 238.3 213.9 186.9 156.9 123.6 86.6 45.6 - - -Sh-rt-t«r Credit (15%) 28.9 28.9 28.9 50.3 188.4 318.5 359.0 359.0 359.0 359.0 359.0 359.0 359.0 359.0 359.0 359.0 359.0 359.0 359.0
Prinpeipl:Long-tr Ltoan (11%) - - - - - 145.8 161.9 179.7 199.5 221.4 245.8 272.8 302.8 336.1 373.1 414.1 - - -Short-t-rm Credit (13/) 192.5 192.5 192.5 335.6 1,255.8 2,123.4 2,393.3 2,393.3 2,393.3 2,393.3 2,393.3 2,393.3 2,393.3 2.393.3 2,393.3 2,393.3 2,393.3 2,393.3 2,393.3
S.b-tota1 899.1 4,215.9 1,212.9 1,175.3 3,365.8 5,294.3 6,235.3 6,235.3 6,235.3 9,238.3 6,235.3 6,235.3 6,235.3 6,235.3 6,235.3 6,235.3 5,775.6 8,778.6 5,775.6
Project Chargea:0 6 M Coct - - - a94.0 432.0 552.0 655.2 655.2 655.2 655.2 655.2 655.2 655.2 655.2 655.2 655.2 655.2 655.2 655.2
Total Otflea 899.1 4,215.9 1,212.9 1,469.3 3,797.8 5,846.3 6,890.5 6,890.5 6,890.5 9,893.5 6,890.5 6,890.5 6,890.5 6,890.5 6,890.5 6,890.5 6,430.8 9,433.8 6,430.8
Net Inoron ParUnit 1,867.3 1,403.4 1,553.5 2,683.3 3,826.6 5,700.5 7,446.2 7,446.2 7,446.2 4,443.2 7,446.2 7,446.2 7,445.2 7,446.2 7,446.2 7,446.2 7,905.9 4,902.9 7,905.9
At FPre FPmily Lecel
Net Incor Pe Fily-/ 10.6 7.9 8.8 15.2 21.6 32.2 42.1 42.1 42.1 25.1 42.1 42.1 42.1 42.1 42.1 42.1 44.7 27.7 44.7
1/ 95% of total investment cast of poepIeg eqipment.
2/ Corera .caS operating ae..esa- e-c-pt jesn--nce and tio.
3/ 1eol1des purchased Sapote, -- ehi-ery, ls.r-nce -nd ttx.
4/ .es.flaiarea eoertbhti,ton tas-d inosa.etnt í la vta credit fnr pumpiap eqíipeent a.d labor during thi cooetructilo pertiod.
5/ Sub-projeat .o.prís.. 177 fanili.s vith 80 a-era-g holding of 4 hS pon fasily.
Aogoat 10, 1978
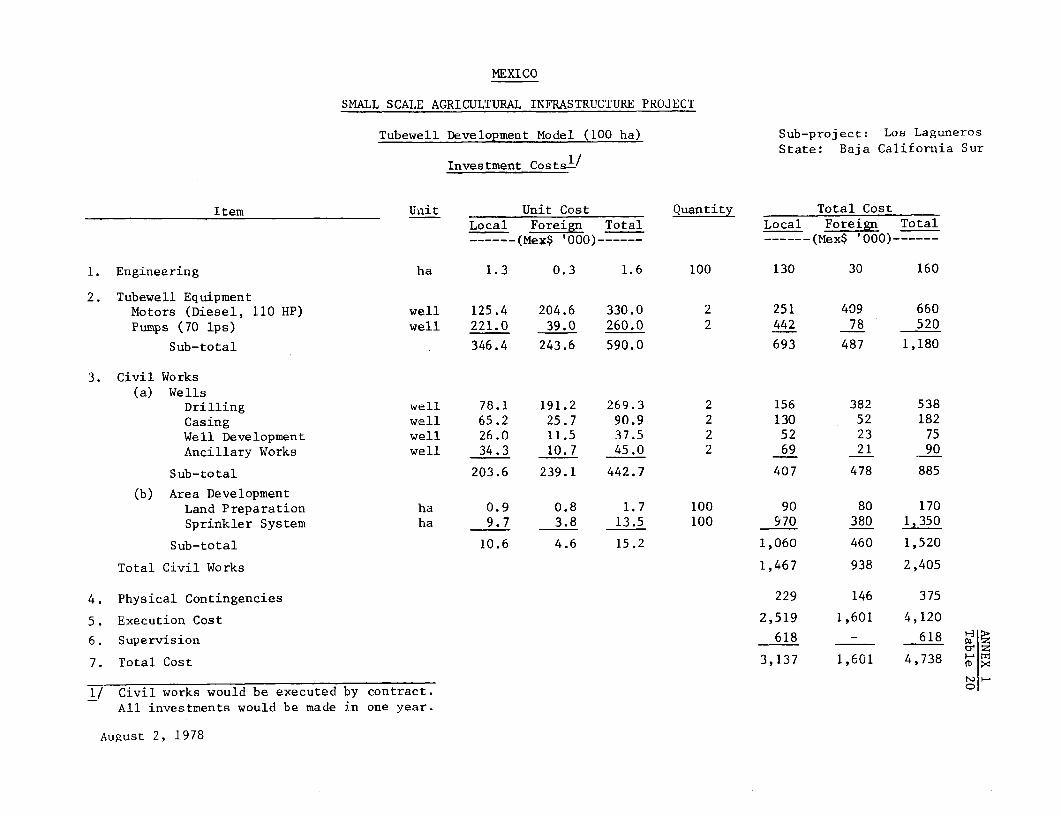
MEXICO
SMALL SCALE AGRICULTURAL INFRASTRUCTURE PROJECT
Tubewell Development Model (100 ha) Sub-project: Los Laguneros
State: Baja California Sur
Investment Costs!/
Item Unit Unit Cost Quantity Total Cost
Local Foreign Total Local Foreign Total- (Mex$ '000) = - (Mex$ '000)------
1. Engineering ha 1.3 0.3 1.6 100 130 30 160
2. Tubewell EquipmentMotors (Diesel, 110 HP) well 125.4 204.6 330.0 2 251 409 660
Pumps (70 lps) well 221.0 39.0 260.0 2 442 78 520
Sub-total 346.4 243.6 590.0 693 487 1,180
3. Civil Works(a) Wells
Drilling well 78.1 191.2 269.3 2 156 382 538
Casing well 65.2 25.7 90.9 2 130 52 182
Well Development well 26.0 11.5 37.5 2 52 23 75
Ancillary Works well 34.3 10.7 45.0 2 69 21 90
Sub-total 203.6 239.1 442.7 407 478 885
(b) Area DevelopmentLand Preparation ha 0.9 0.8 1.7 100 90 80 170
Sprinkler System ha 9.7 3.8 13.5 100 970 380 1,350
Sub-total 10.6 4.6 15.2 1,060 460 1,520
Total Civil Works 1,467 938 2,405
4. Physical Contingencies 229 146 375
5. Execution Cost 2,519 1,601 4,120
6. Supervision 618 - 618 H
7. Total Cost 3,137 1,601 4,738 f
1/ Civil works would be executed by contract. °
All investments would be made in one year.
August 2, 1978
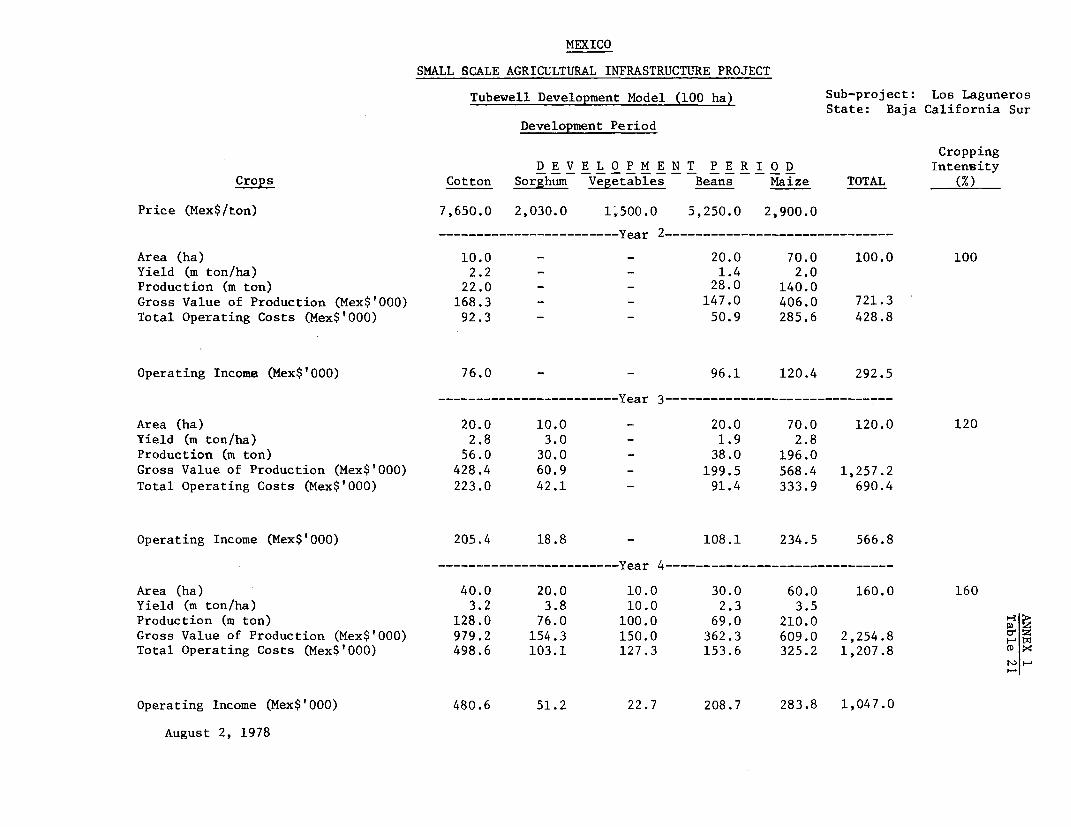
MEXICO
SMALL SCALE AGRICULTURAL INFRASTRUCTURE PROJECT
Tubewell Development Model (100 ha) Sub-project: Los LagunerosState: Baja California Sur
Development Period
Cropping
D E V E L 0 P M E N T P E R I O D Intensity
Crops Cotton Sorghum Vegetables Beans Maize TOTAL (%)
Price (Mex$/ton) 7,650.0 2,030.0 1,500.0 5,250.0 2,900.0
------------------------ Year 2…_____________________________
Area (ha) 10.0 - - 20.0 70.0 100.0 100
Yield (m ton/ha) 2.2 - - 1.4 2.0
Production (m ton) 22.0 - - 28.0 140.0
Gross Value of Production (Mex$'000) 168.3 - - 147.0 406.0 721.3
Total Operating Costs (Mex$'000) 92.3 - - 50.9 285.6 428.8
Operating Income (Mex$'000) 76.0 96.1 120.4 292.5
…--------------------…Year 3------------
Area (ha) 20.0 10.0 - 20.0 70.0 120.0 120
Yield (m ton/ha) 2.8 3.0 - 1.9 2.8
Production (m ton) 56.0 30.0 - 38.0 196.0
Gross Value of Production (Mex$'000) 428.4 60.9 _ 199.5 568.4 1,257.2
Total Operating Costs (Mex$'000) 223.0 42.1 - 91.4 333.9 690.4
Operating Income (Mex$'000) 205.4 18.8 108.1 234.5 566.8
-------…--------------…Year 4--------------------------…--
Area (ha) 40.0 20.0 10.0 30.0 60.0 160.0 160
Yield (m ton/ha) 3.2 3.8 10.0 2.3 3.5
Production (m ton) 128.0 76.0 100.0 69.0 210.0
Gross Value of Production (Mex$'000) 979.2 154.3 150.0 362.3 609.0 2,254.8 . w
Total Operating Costs (Mex$'000) 498.6 103.1 127.3 153.6 325.2 1,207.8
Operating Income (Mex$'000) 480.6 51.2 22.7 208.7 283.8 1,047.0
August 2, 1978
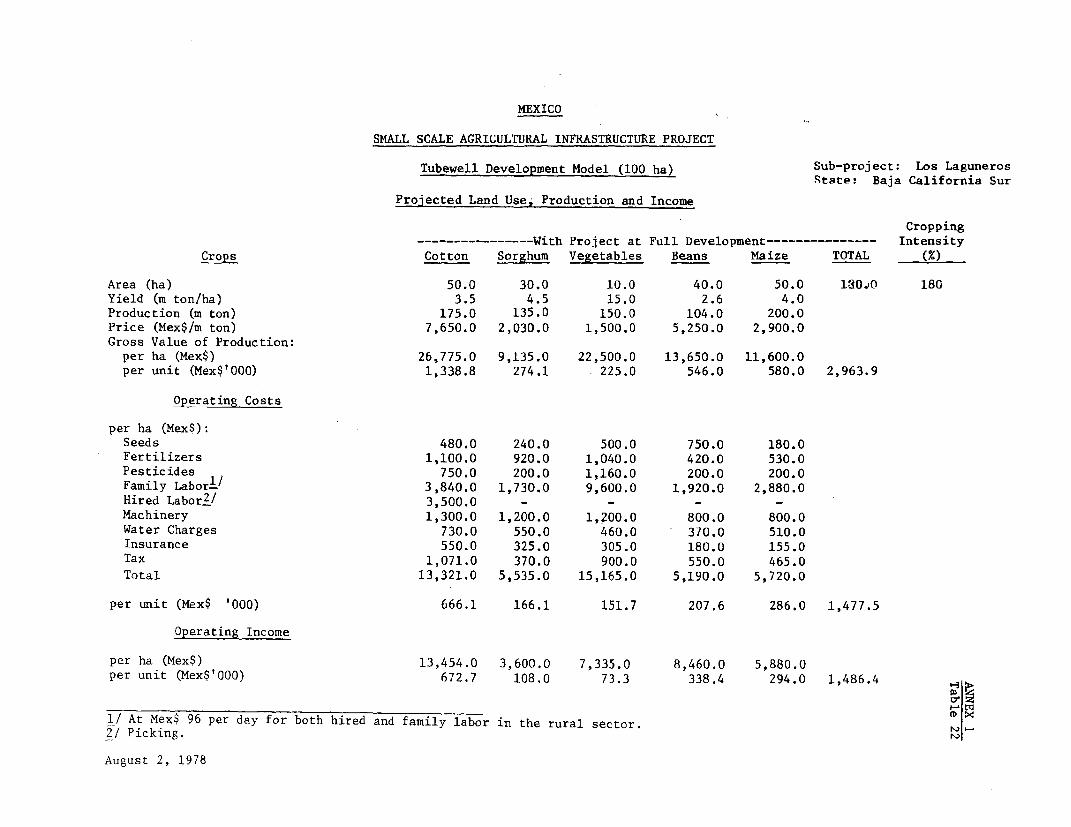
MEXICO
SMALL SCALE AGRICULTURAL INFRASTRUCTURE PROJECT
Tubewell Development Model (100 ha) Sub-project: Los LagunerosRtate- Baja California Sur
Projected Land Use, Production and Income
Cropping
----- With Project at Full Development--------------- Intensity
Crops Cotton Sorghum Vegetables Beans Maize TOTAL (%)
Area (ha) 50.0 30.0 10.0 40.0 50.0 l80.Jo 180Yield (m ton/ha) 3.5 4.5 15.0 2.6 4.0Production (m ton) 175.0 135.0 150.0 104.0 200.0Price (Mex$/m ton) 7,650.0 2,030.0 1,500.0 5,250.0 2,900.0
Gross Value of Production:per ha (Mex$) 26,775.0 9,135.0 22,500.0 13,650.0 11,600.0per unit (Mex$'000) 1,338.8 274.1 225.0 546.0 580.0 2,963.9
Operating Costs
per ha (Mex$):Seeds 480.0 240.0 500.0 750.0 180.0Fertilizers 1,100.0 920.0 1,040.0 420.0 530.0Pesticides 750.0 200.0 1,160.0 200,0 200.0Family Laborl' 3,840.0 1,730.0 9,600.0 1,920.0 2,880.0Hired Laborll 3,500.0 - - -
Machinery 1,300.0 1,200.0 1,200.0 800.0 800.0Water Charges 730.0 550.0 460.0 370.0 510.0Insurance 550.0 325.0 305.0 180.0 155.0Tax 1,071.0 370.0 900.0 550.0 465.0
Total 13,321.0 5,535.0 15,165.0 5,190.0 5,720.0
per unit (Mex$ '000) 666.1 166.1 151.7 207.6 286.0 1,477.5
Operating Income
per ha (Mex$) 13,454.0 3,600.0 7,335.0 8,460.0 5,880.0per unit (Mex$'000) 672.7 108,0 73.3 338.4 294.0 1,486.4 H
1/ At Mex$ 96 per day for both hired and family labor in the rural sector.2/ Picking. i
August 2, 1978
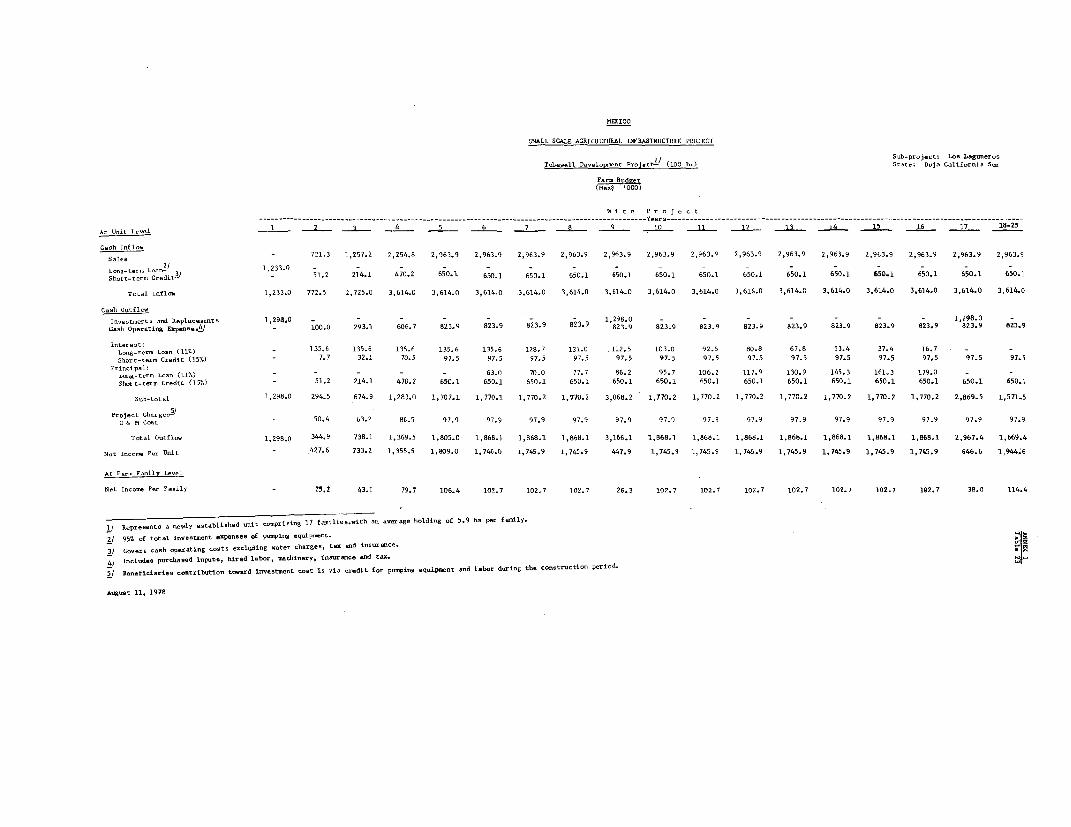
lIflICO
SMALL SCALE AGRICULTUEAL IEFRASTRUCTURE PROJECT
1/ lai~~~~~~~~~~~.-prajeat: LosLgueoTubewella D-vlopopat Paject-/ (100 ha) State Baja California Sur
Fara Bdget(Me,cl ' 000)
W i t h Pro je t
At Unit U evl 1 2 1 4 5 6 7 8 9 1O 11 12 13 1J4 15 1S 6 17 18-25
Csash Inflats
Salas - 721.3 1,257.2 2,254.8 2,963.9 2,963.9 2,963.9 2,963.9 2,963.9 2,963.9 2,963.9 2,963.9 2,963.9 2,963.9 2,963.9 2,963.9 2,963.9 2,963.92/ ~~~~~~1,233.0 - - - - - - - - - - - - - - - - -Loí 1 -tar Loas- 3d1, . 51.2 214.1 470.2 650.1 650.1 650.1 650.1 650.1 650.1 650.1 650.1 650.1 650.1 650.1 650.1 650.1 650.1
Total inflas 1,233.0 772.5 2,725.0 3,614.0 3,614.f 3,614.0 3,614.0 3,614.0 3,614.0 3,614.0 3,614.0 3.614.0 3,614.0 3,614.0 3,614.0 3,614.0 3,614.0 3,614.0
lovosimasis and ltnplacoa-ts 1,294,0 - - - - - - - 1 298 0 - - - - - - - 1,298.0 -Cash Op-r-ting Expessea
4/ - 100.0 293.1 606.7 823.9 823.9 823.9 823.9 923:9 823.9 823.9 823.9 823.9 823.9 823.9 823.9 823.9 823.9
ILnt--set 135.6 135.6 135.6 135.6 135.6 128.7 121.0 112.5 103.0 92.5 80.8 67.8 53.4 37.4 16.7Sh-rt-te-m Cradít 1157.) - 7.7 32.1 70.5 97.5 97.5 97.5 97.5 97.5 97.5 97.5 97.5 97.5 97.5 97.5 97.5 97.5 97.5
Principal:Loag-term L.as (11%) - - - - 63.0 70.0 77.7 86.2 95.7 106.2 117.9 130.9 145.3 161L3 179.0 - -sha-t-t-eo Credit (15%) - 51.2 214.1 470.2 650.1 650.1 650.1 650.1 650.1 650.1 650.1 650.1 650.1 650.1 650.1 650.1 650.1 650.1
Slb-total 1,298.0 294.5 674.9 1,283.0 1,707.1 1,770.1 1,770.2 1,770.2 3,068.2 1,770.2 1,770.2 1,770.2 1,770.2 1,770.2 1,770.2 1,770.2 2,869.5 1,571.5
Pro0eoL Chast,- 50.4 63.2 86.5 97.9 97.9 97.9 97.9 97.9 97.9 97.9 97.9 97.9 97.9 97.9 97.9 97.9 97.9
Total 0utflov 1,298.0 344.9 738.1 1,369.5 1,805.0 1 ,868.1 1,868.1 1,868.1 3,166.1 1,868.1 1,868.1 1,868.1 1,868.1 1,868.1 1,868.1 1,868.1 2,967.4 1,669.4
Net --ncome Pmr Unit - 427.6 733.2 1,355.5 1,09.0 1,746.0 1,745.9 1,745.9 447.9 1,745.9 1,745.9 1,745.9 1,745.9 1,745.9 1,745.9 1,745.9 646.6 1,944.6
At Faro Ferily L-v1l
Net la-oso Poe FmAnly _ 25,2 43.1 79.7 106.4 102.7 102_7 102.7 26.3 102.7 102.7 102.7 102.7 102.7 102.7 192.7 38.0 114.4
1/ BaprasaBiO a aewly asrablíshed unit roaprislas 17 fa_ilis.--ith sn avaraga holding so 5.9 ha pee family.
2/ 95% of total laoesatssr ...pa.ses of pumplo" equipoar.-
31 --e-s tasah opsrat4ng tasit ettlsding -asic oharges, ta mnd in-ura---. EJE4Y1bladas purahased lnpsts, hired labor, oaribnerpy, In--rana nld t-a.
5/ Banafileartes rvntribution tird ilvet-nant tasi Os vla credit fos ps gping equipent aed labor duieg the. c-n---t-tisn period.
Asgust 11. 1978
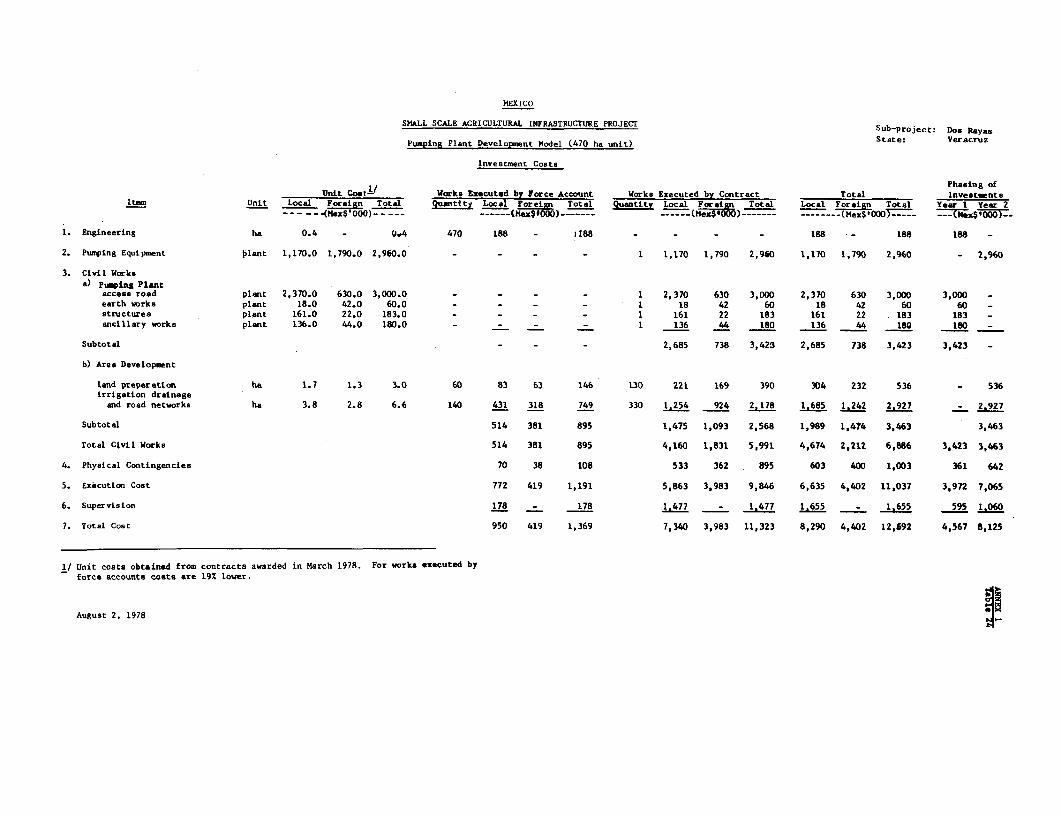
MEXICO
SMALL SCALE AGRICULTURAL INFRASTRUCTURE PROJECT Sub-project: Dos Rayas
Pumping Plant Development Model (470 ha unit) State Veracruz
Investment Costs
1/ ~~~~~~~~~~~~~~~~~~~~~~~~~~~~~Phasing ofUnit Co.tl- Works Executed by Force Account Works Executed by Contract Total Invest,enta
Itam Unit Local Foreign Total Quantity Local Foreiln Total Quantity Local F!rd Total Local Fore in Total Year 1 Year 2___ _-.(MexS'000) <I - . i 0 ------------- --------------------- 000 --- --- (txs --
1. Engineering ha 0.4 - Q*4 470 188 - 1188 - - - 188 - 188 188 -
2. Pumping Equipmnent bplant 1,170.0 1,790.0 2,960.0 - - - - 1 1,170 1,790 2,940 1,170 1,790 2,960 - 2,960
3. CíviI Worksa) Puwçing Plant
acceso road plant 2,370.0 630.0 3,000.0 - - - - 1 2,370 630 3,000 2,370 630 3,000 3,000 -earth works plant 18.0 42.0 60.0 - - - - 1 18 42 60 18 42 60 60 -structures plant 161.0 22.0 183.0 - - - - 1 161 22 183 161 22 183 183 -ancillary works plant 136.0 44.0 180.0 - - - - 1 136 44 180 136 44 18Q 180
Subtotal - - - 2,685 738 3,423 2,685 738 3,423 3,423 -
b) Ares Developnent
land preparation ha 1.7 1.3 3.0 60 83 63 146 130 221 169 390 304 232 536 - 536irrigation drainage
and road networks ha 3.8 2.8 6.6 140 431 318 749 330 1.254 924 2.178 1.685 1.242 2 927 - 2.927
Subtotal 514 381 895 1,475 1,093 2,568 1,989 1,474 3,463 3,463
Total Civil Works 514 381 895 4,160 1,831 5,991 4,674 2,212 6,886 3,423 3,463
4. Physical Contingencies 70 38 108 533 362 895 603 400 1,003 361 642
5. Execution Cost 772 419 1,191 5,863 3,983 9,846 6,635 4,402 11,037 3,972 7,065
6. Supervision 178 - 178 1.477 - 1.477 1.655 _ 1.655 595 1.060
7. Total Cost 950 419 1,369 7,340 3,983 11,323 8,290 4,402 12,692 4,567 8,125
1/ Unit costa obtained from contracts awarded in March 1978. For worka executed byforce accounts costa are 19% lower.
August 2, 1978
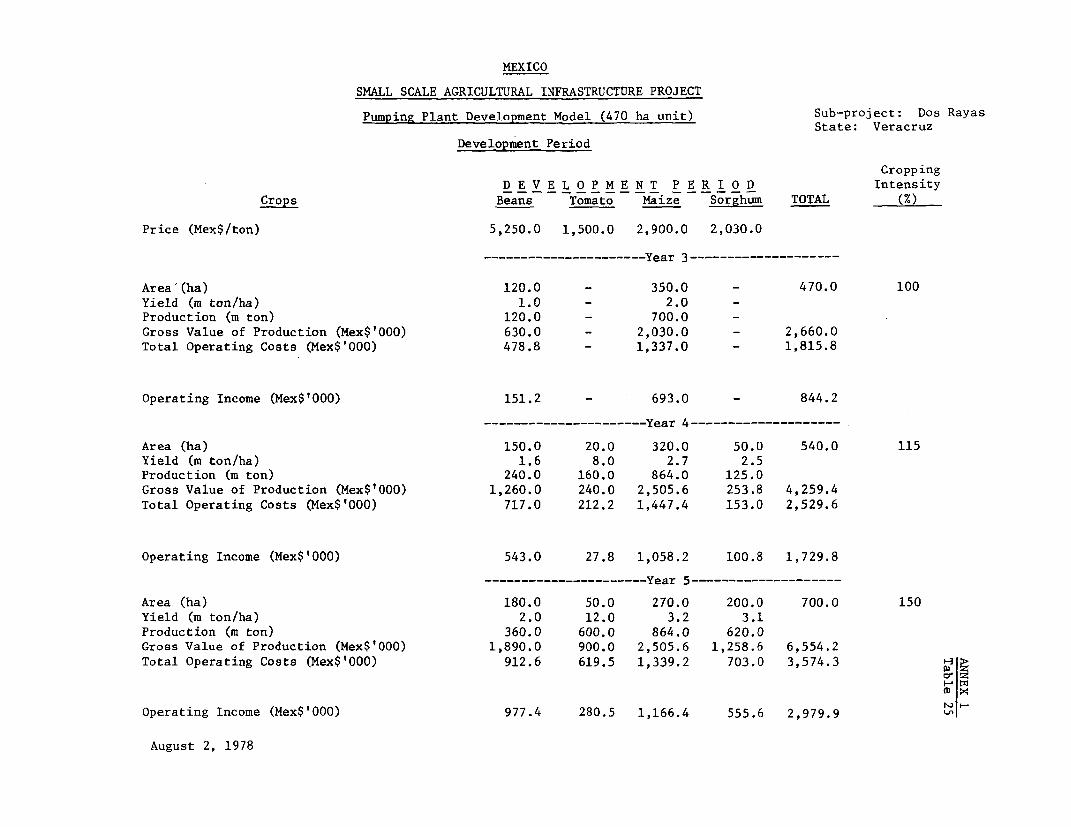
MEXICO
SMALL SCALE AGRICULTURAL INFRASTRUCTURE PROJECT
Pumping Plant Development Model (470 ha unit) Sub-project: Dos RayasState: Veracruz
Development Period
CroppingD E V E L O P M E N T P E R I 0 D Intensity
Crops Beans Tomato Maize Sorghum TOTAL (%)
Price (Mex$Iton) 5,250.0 1,500.0 2,900.0 2,030.0
---------------------- Year 3--------------------
Area'(ha) 120.0 - 350.0 - 470.0 100Yield (m ton/ha) 1.0 - 2.0 -Production (m ton) 120.0 - 700.0 -Gross Value of Production (Mex$'000) 630.0 - 2,030.0 - 2,660.0Total Operating Costs (Mex$'000) 478.8 - 1,337.0 - 1,815.8
Operating Income (Mex$'000) 151.2 - 693.0 - 844.2
--------------------…Year 4-------------------…
Area (ha) 150.0 20.0 320.0 50.0 540.0 115Yield (m ton/ha) 1.6 8.0 2.7 2.5Production (m ton) 240.0 160.0 864.0 125.0Gross Value of Production (Mex$'000) 1,260.0 240.0 2,505.6 253.8 4,259.4Total Operating Costs (Mex$'000) 717.0 212.2 1,447.4 153.0 2,529.6
Operating Income (Mex$'000) 543.0 27.8 1,058.2 100.8 1,729.8
--------------- ----- Year 5-------------------…
Area (ha) 180.0 50.0 270.0 200.0 700.0 150Yield (m ton/ha) 2.0 12.0 3.2 3.1Production (m ton) 360.0 600.0 864.0 620.0Gross Value of Production (Mex$'000) 1,890.0 900.0 2,505.6 1,258.6 6,554.2Total Operating Costs (Mex$'000) 912.6 619.5 1,339.2 703.0 3,574.3
/D >
Operating Income (Mex$'000) 977.4 280.5 1,166.4 555.6 2,979.9
August 2, 1978
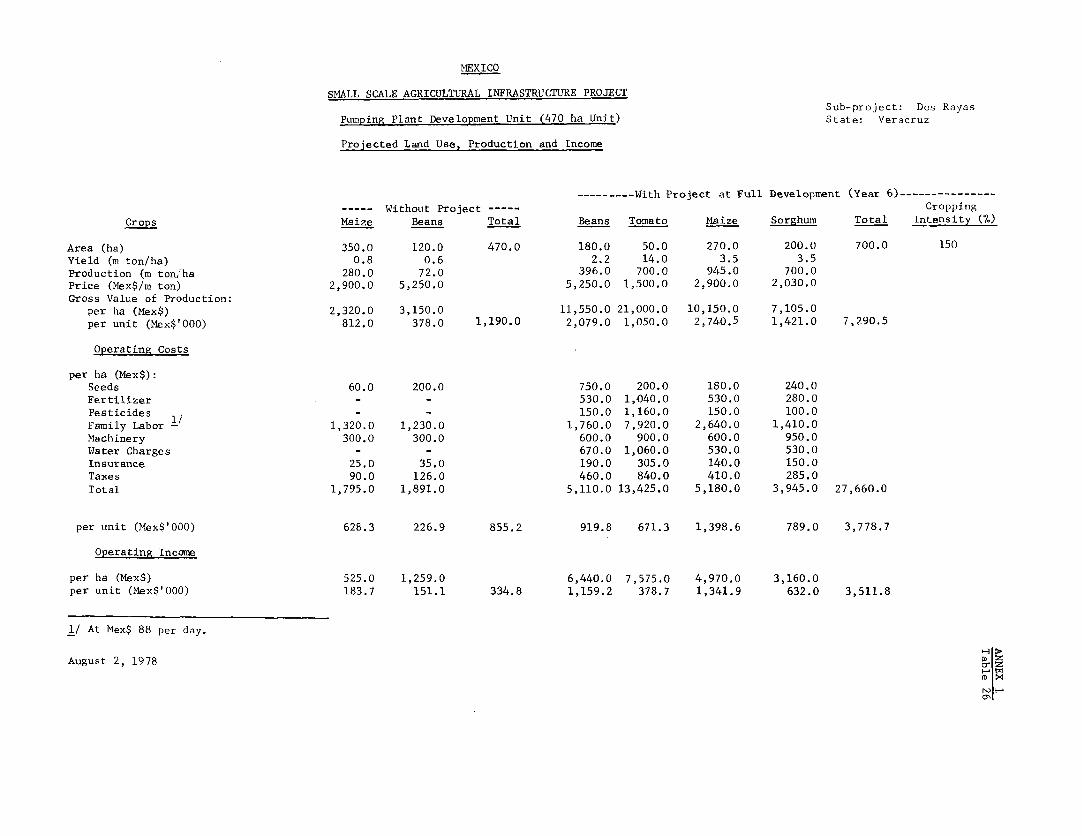
MEXICO
SMALL SCALE AGRICULTURAL INFRASTRUCTURE PROJECT
Sub-project: Dos RayasPumping Plant Development Unit (470 ha Unit) State: Veracruz
Projected Land Use, Production and Income
---------With Project at Full Development (Year 6)-------------Without Project ----- CroppingCrops Maize Beans Total Beans Tomato Maize Sorghum Total intensity (%)
Area (ha) 350.0 120.0 470.0 180.0 50.0 270.0 200.0 700.0 150Yíeld (m ton/ha) 0.8 0.6 2.2 14.0 3.5 3.5Production (m ton,'ha 280.0 72.0 396.0 700.0 945.0 700.0Price (Mex$/m ton) 2,900.0 5,250.0 5,250.0 1,500.0 2,900.0 2,030.0Gross Value of Production:per ha (Mex$) 2,320.0 3,150.0 11,550.0 21,000.0 10,150.0 7,105.0per unit (Mex$'000) 812.0 378.0 1,190.0 2,079.0 1,050.0 2,740.5 1,421.0 7,290.5
Operating Costs
per ha (Mex$):Seeds 60.0 200.0 750.0 200.0 180.0 240.0Fertilizer - - 530.0 1,040.0 530.0 280.0Pesticides 1/ - - 150.0 1,160.0 150.0 100.0Family Labor - 1,320.0 1,230.0 1,760.0 7,920.0 2,640.0 1,410.0Machinery 300.0 300.0 600.0 900.0 600.0 950.0Water Charges - - 670.0 1,060.0 530.0 530.0Insurance 25.0 35.0 190.0 305.0 140.0 150.0Taxes 90.0 126.0 460.0 840.0 410.0 285.0Total 1,795.0 1,891.0 5,110.0 13,425.0 5,180.0 3,945.0 27,660.0
per unit (Mex$'000) 628.3 226.9 855.2 919.8 671.3 1,398.6 789.0 3,778.7
Operating Income
per ha (Mex$) 525.0 1,259.0 6,440.0 7,575.0 4,970.0 3,160.0per unit (Mex$'000) 183.7 151.1 334.8 1,159.2 378.7 1,341.9 632.0 3,511.8
1/ At Mex$ 88 per day.
August 2, 1978 >
(D XP-. t-1
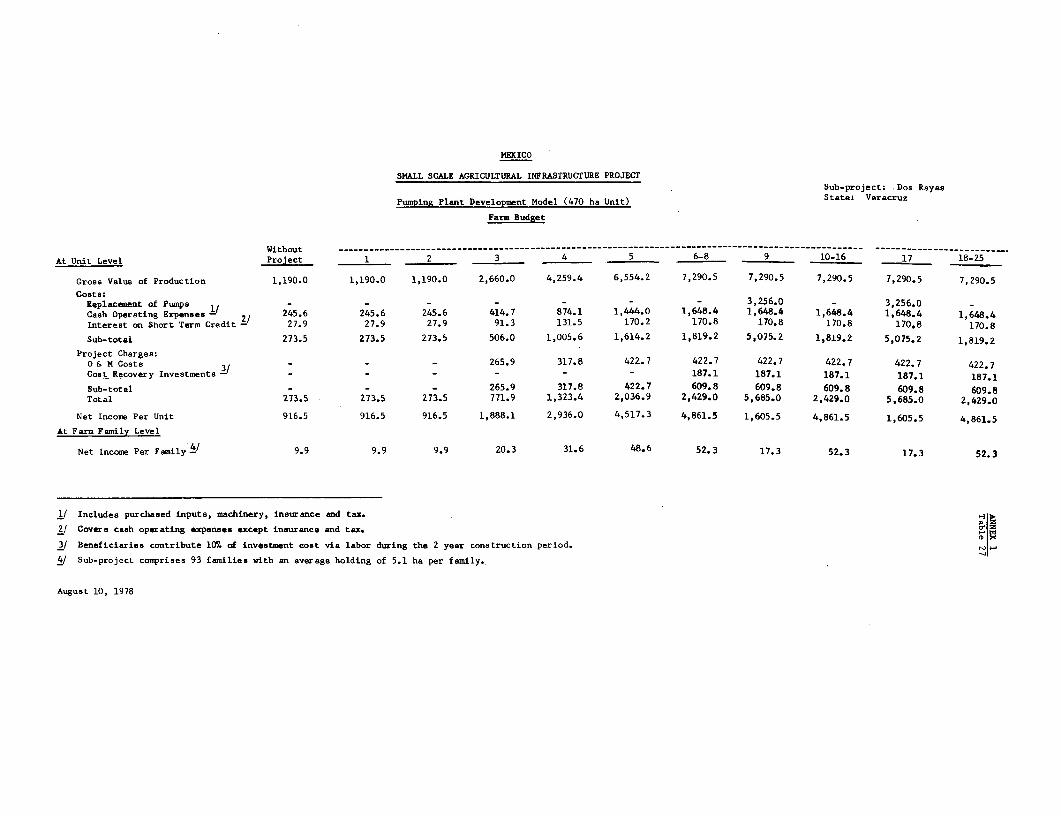
MEXICO
SMALL SCALE AGRICULTURAL INFRASTRUCTURE PROJECT
Sub-project: Dos Rayas
Pumping Plant Development Model (470 ha Unit) State: Veracruz
Parm Budget
Without- 6-- -----16-------------2
At Unit Level Project 1 2 3 4 5 6-8 9 10-16 17 18-25
Grose Value of Production 1,190.0 1,190.0 1,190.0 2,660.0 4,259.4 6,554.2 7,290.5 7,290.5 7,290.5 7,290.5 7,290.5
Coste:
Replacement of Pumps 31/.0-325. Cash Operating Expenues 2 245.6 245.6 245.6 414.7 874.1 1,444.0 1,648.4 1,648.4 1,648.4 1,648.4 1,648.4
Interest on Short Term Credit - 27.9 27.9 27.9 91.3 131.5 170.2 170.8 170,8 170.8 170.8 170.8
Sub-total 273.5 273.5 273.5 506.0 1,005.6 1,614.2 1,819.2 5,075.2 1,819.2 5,075.2 1,819.2
Pro.ject Charges:0 & M Costs 3/ - - - 265.9 317.8 422.7 422.7 422.7 422.7 422.7 422.7
Cost Recovery Investments - - - - - - - 187.1 187.1 187.1 187.1 187.1
Sub-total - - - 265.9 317.8 422.7 609.8 609.8 609.8 609.8 609.8
Total 173.5 273.5 273.5 771.9 1,323.4 2,036.9 2,429.0 5,685.0 2,429.0 5,685.0 2,429.0
Net Income Per Unit 916.5 916.5 916.5 1,888.1 2,936.0 4,517.3 4,861.5 1,605.5 4,861.5 1,605.5 4,861.5
At Farm Family Level
Net Income Per Family Al 9.9 9.9 9.9 20.3 31.6 48.6 52.3 17.3 52.3 17.3 52.3
1/ Includes purchased inputs, machinery, insurance and tax.
2 Covers cash operating expenses except insurance and tax. o Z
3/ Beneficiaries contribute 10% of investment cost via labor during the 2 year construction period. , .
4/ Sub-project comprises 93 families with an average holding of 5.1 ha per family.
August 10, 1978
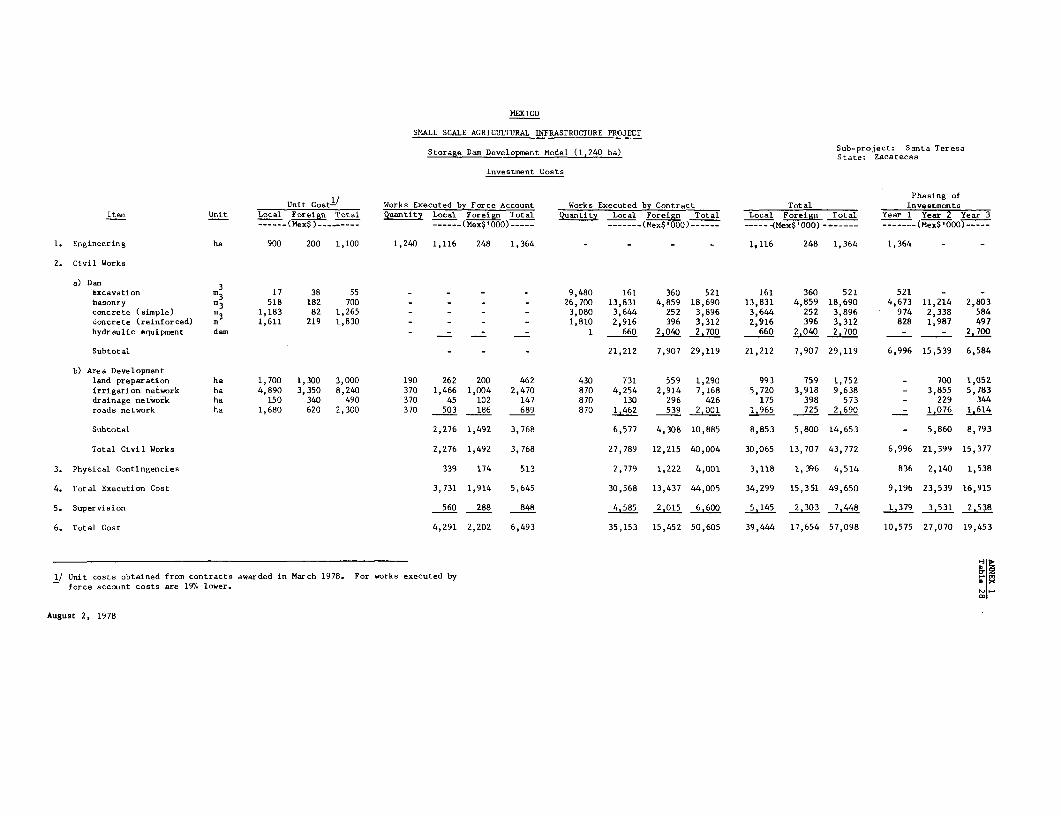
MEXICO
SMALL SCALE AGRI CULTURAL INFRASTRUCTURE PROJECT
Storage Dams Development Model (1,240 ha) Stateoject: Santa Teresa
Investtient Costs
1/ ~~~~~~~~~~~~~~~~~~~~~~~~~~~~~Phasing ofUnit Cost-/ Works Executed by Force Account Works Executed by Contract Total Investments
Item Unit Local Foreign Total Quantity Local Foreign Total Quantity Local Foreign Total Local Foreign Total Year 1 Year 2 Year 3_____ (Mex$) ---------- _____ (Mex$'000) ----- ------- (Mex$'000) --- ------ (Mex$'000) ------- _____- (Mex$'000°) -…
1. Engineering ha 900 200 1,100 1,240 1,116 248 1,364 - - - - 1,116 248 1,364 1,364 -
2. Civil Works
a) Dam 3Excavation m3 17 38 55 - - - - 9,480 161 360 521 161 360 521 521 -
hSasonry m3 518 182 700 - - - - 26,700 13,831 4,859 18,690 13,831 4,859 18,690 4,673 11,214 2,803concrete (simple) m3 1,183 82 1,265 - - - - 3,080 3,644 252 3,896 3,644 252 3,896 974 2,338 584ooncrete (reinforced) m3 1,611 219 1,830 - - - - 1,810 2,916 396 3,312 2,916 396 3,312 828 1,987 497
hydraulic equipment dam - _ - 1 660 2,040 2.700 660 2,040 2 700 - - 2,700
Subtotal - - - 21,212 7,907 29,119 21,212 7,907 29,119 6,996 15,539 6,584
b) Area Developmentland preparation ha 1,700 1,300 3,000 190 262 200 462 430 731 559 1,290 993 759 1,752 - 700 1,052irrigation network ha 4,890 3,350 8,240 370 1,466 1,004 2,470 870 4,254 2,914 7,168 5,720 3,918 9,638 - 3,855 5,783drainage network ha 150 340 490 370 45 102 147 870 130 296 426 175 398 573 - 229 344roads network ha 1,680 620 2,300 370 503 186 689 870 1,462 539 2,001 1,965 725 2,690 - 1,076 1.614
Subtotal 2,276 1,492 3,768 6,577 4,308 10,885 8,853 5,800 14,653 - 5,860 8,793
Total Civil Works 2,276 1,492 3,768 27,789 12,215 40,004 30,065 13,707 43,772 6,996 21,399 15,377
3. Physical Contingencies 339 174 513 2,779 1,222 4,001 3,118 1, 396 4,514 836 2,140 1,538
4. Total Execution Cost 3,731 1,914 5,645 30,568 13,437 44,005 34,299 15,351 49,650 9,196 23,539 16,915
5. Supervision 560 288 848 4,585 2,015 6,600 5,145 2,303 7,448 i,379 3,531 2,538
6. Total Cost 4,291 2,202 6,493 35,153 15,452 50,605 39,444 17,654 57,098 10,575 27,070 19,453
l/ Unit costs obtained from contracts awarded in March 1978. For works executed by Mforce account costs are 19b, lower.
August 2, 1978
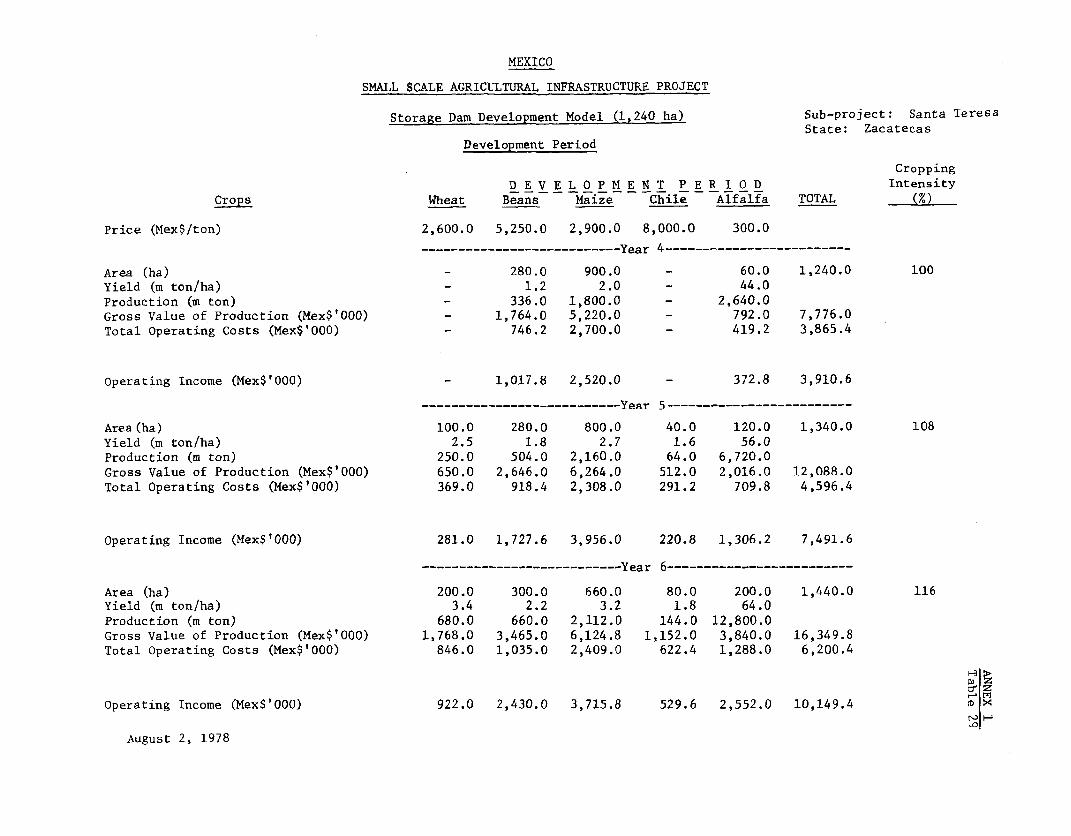
MEXICO
SMALL SCALE AGRICULTURAL INFRASTRUCTURE PROJECT
Storage Dam Development Model (1,240 ha) Sub-project: Santa TeresaState: Zacatecas
Development Period
CroppíngD E V E L O P M E N T P E R I O D Intensíty
Crops Wheat Beans Maize Chile Alfalfa TOTAL (%)
Price (Mex$/ton) 2,600.0 5,250.0 2,900.0 8,000.0 300.0
--------------- Year 4 - ------------
Area (ha) - 280.0 900.0 - 60.0 1,240.0 100Yield (m ton/ha) - 1.2 2.0 - 44.0Production (m ton) - 336.0 1,800.0 - 2,640.0Gross Value of Production (Mex$'000) - 1,764.0 5,220.0 - 792.0 7,776.0Total Operating Costs (Mex$'000) - 746.2 2,700.0 - 419.2 3,865.4
operating Income (Mex$'000) - 1,017.8 2,520.0 - 372.8 3,910.6
-__________________-----Year 5-------------------------
Area (ha) 100.0 280.0 800.0 40.0 120.0 1,340.0 108Yield (m ton/ha) 2.5 1.8 2.7 1.6 56.0Production (m ton) 250.0 504.0 2,160.0 64.0 6,720.0Gross Value of Production (Mex$'000) 650.0 2,646.0 6,264.0 512.0 2,016.0 12,088.0Total Operating Costs (Mex$'000) 369.0 918.4 2,308.0 291.2 709.8 4,596.4
Operating Income (Mex$'000) 281.0 1,727.6 3,956.0 220.8 1,306.2 7,491.6
--------------------------- Year 6-------------------------
Area (ha) 200.0 300.0 660.0 80.0 200.0 1,440.0 116Yield (m ton/ha) 3.4 2.2 3.2 1.8 64.0Production (m ton) 680.0 660.0 2,112.0 144.0 12,800.0Gross Value of Production (Mex$'000) 1,768.0 3,465.0 6,124.8 1,152.0 3,840.0 16,349.8Total Operating Costs (Mex$'000) 846.0 1,035.0 2,409.0 622.4 1,288.0 6,200.4
Operating Income (Mex$'000) 922.0 2,430.0 3,715.8 529.6 2,552.0 10,149.4 sDX
August 2, 1978
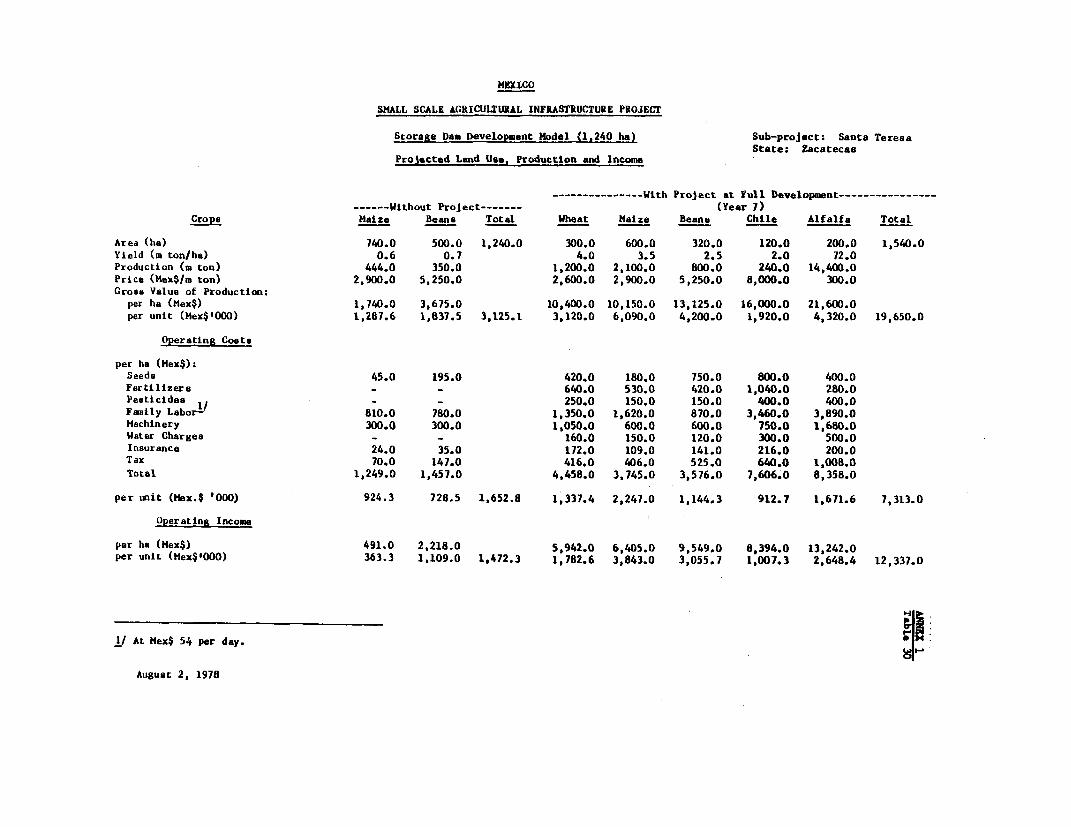
MEXICO
SMALL SCALE AGRICULTURAL INFRASTRUCTURE PROJECT
Storage Da- Development Model (1,240 ha) Sub-project: Santa TeresaState: Zacatecas
Prolected Land Usa, Production and Income
--------------- Wtth Project at Full Development---------------------- Without Project ------- (Year 7)
CrPop Maigo Beana Total Wheat Maize Beans Chile Alfalfa Total
Area (ha) 740.0 500.0 1,240.0 300.0 600.0 320.0 120.0 200.0 1,540.0Yield (m ton/ha) 0.6 0.7 4.0 3.5 2.5 2.0 72.0Production (m ton) 444.0 350.0 1,200.0 2,100.0 800.0 240.0 14,400.0Price (Mex$/m ton) 2,900.0 5,250.0 2,600.0 2,900.0 5,250.0 8,000.0 300.0Groos Value of Production:per ha (Mex$) 1,740.0 3,675.0 10,400.0 10,150.0 13,125.0 16,000.0 21,600.0per unit (Mex$0000) 1,287.6 1,837.5 3,125.1 3,120.0 6,090.0 4,200.0 1,920.0 4,320.0 19,650.0
Operating Costa
per ha (Mex$):Seeds 45.0 195.0 420.0 180.0 750.0 800.0 400.0Fertilizere - - 640.0 530.0 420.0 1,040.0 280.0Pesticid I - - 250.0 150.0 150.0 400.0 400.0Fanily Labor- 810.0 780.0 1,350.0 1,620.0 870.0 3,460.0 3,890.0Machinery 300.0 300.0 1,050.0 600.0 600.0 750.0 1,680.0Water Charges - - 160.0 150.0 120.0 300.0 500.0Insurance 24.0 35.0 172.0 109.0 141.0 216.0 200.0Tax 70.0 147.0 416.0 406.0 525.0 640.0 1,008.0Total 1,249.0 1,457.0 4,458.0 3,745.0 3,576.0 7,606.0 8,358.0
per unit (Mex.$ '000) 924.3 728.5 1,652.8 1,337.4 2,247.0 1,144.3 912.7 1,671.6 7,313.0
Operating Income
per ha (Mex$) 491.0 2,218.0 5,942.0 6,405.0 9,549.0 8,394.0 13,242.0per unit (Mex$#000) 363.3 1,109.0 1,472.3 1,782.6 3,843.0 3,055.7 1,007.3 2,648.4 12,337.0
1/ At Mex$ 54 per day.
Auguat 2, 1978
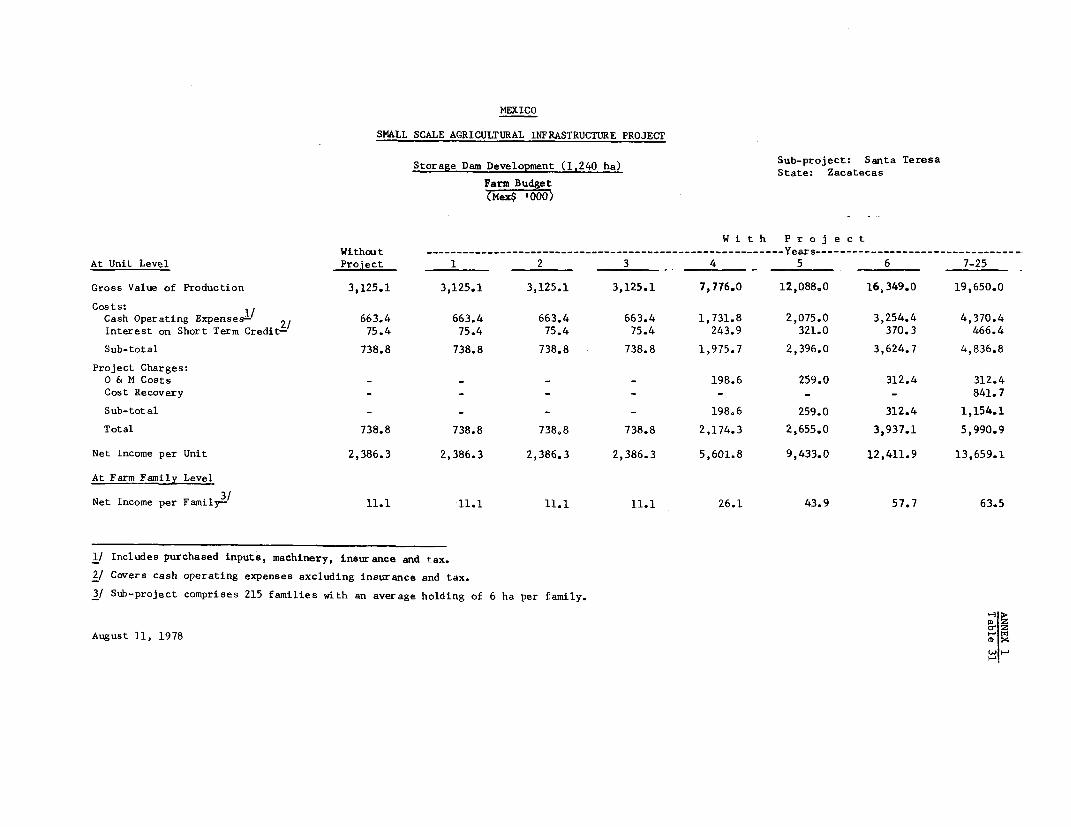
MEXICO
SMALL SCALE AGRICULTURAL INFRASTRUCTURE PROJECT
Storage Dam Development (1,240 ha) Sub-project: Santa TeresaState: Zacatecas
Farm Budget
( Mex$ '000>j
W it h P ro je ctWithout - - -------------------------------- - Years------------------------------
At Unit Level Project 1 2 3 4 5 6 7-25
Gross Value of Production 3,125.1 3,125.1 3,125.1 3,125.1 7,776.0 12,088.0 16,349.0 19,650.0
Costs:Cash Operating Expenses-' 2/ 663.4 663.4 663.4 663.4 1,731.8 2,075.0 3,254.4 4,370.4Interest on Short Term Credit- 75.4 75.4 75.4 75.4 243.9 321.0 370.3 466.4
Sub-total 738.8 738.8 738.8 738.8 1,975.7 2,396.0 3,624.7 4,836.8
Project Charges:O & M Costs - - - - 198.6 259.0 312.4 312.4
Cost Recovery - - - _ - 841.7
Sub-total _- - - 198.6 259.0 312.4 1,154.1
Total 738.8 738.8 738.8 738.8 2,174.3 2,655.0 3,937.1 5,990.9
Net Income per Unit 2,386.3 2,386.3 2,386.3 2,386.3 5,601.8 9,433.0 12,411.9 13,659.1
At Farm Family Level
Net Income per Family3 11.1 11.1 11.1 11.1 26.1 43.9 57.7 63.5
1/ Includes purchased ínputs, machinery, insurance and tax.
2/ Cavers cash operating expenses excluding insurance and tax.
3/ Sub-project comprises 215 families with an average holding of 6 ha per family.
August 11, 1978 O x
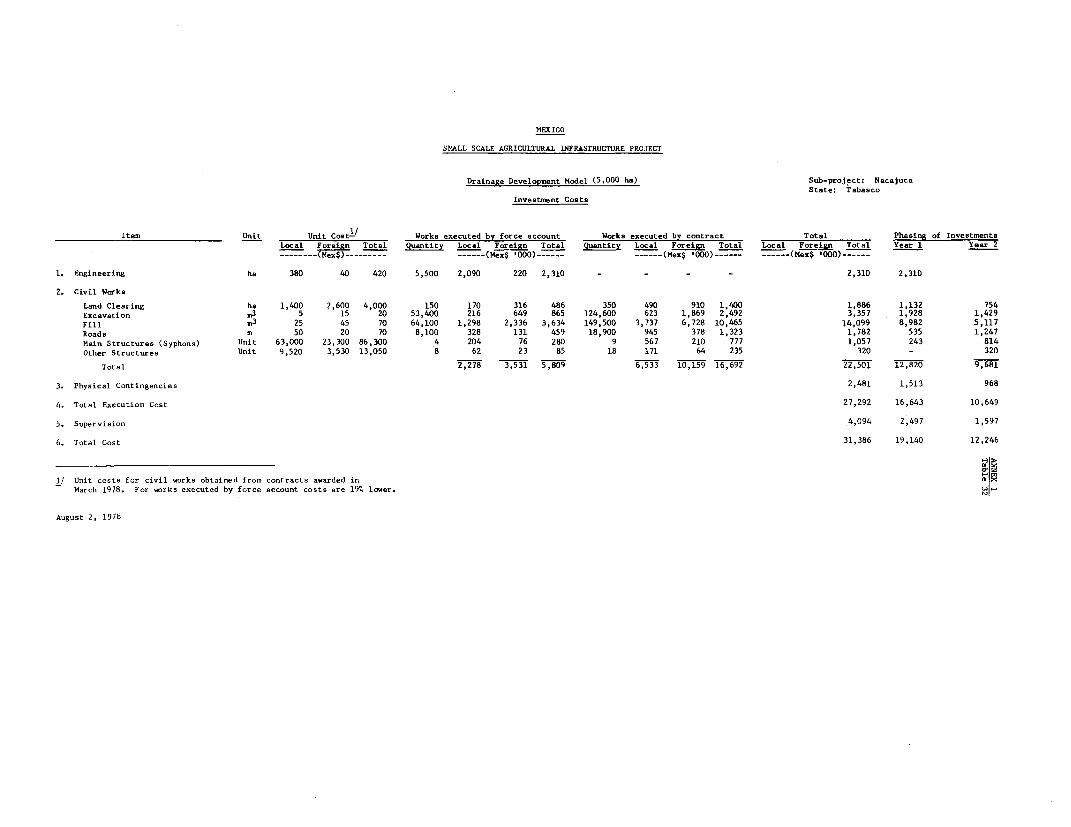
MEXICO
SMALL SCALE AGRICULTURAL INFRASTRUCTURE PROJECT
Drainage Development Model (5,000 ha) Sub-project: NacajucaState: Tabasco
Investment Costa
Item Unit Unit Cost-1 Works executed by force account Works executed by contract Total Phasing of InvestmentsLocal Foreign Total Quantity Local Foreign Total Quantitv Local Foreign Total Local Foreign Total Year 1 Year 2________(Mex$) ----- ------ (Mex$ 000) -- ------ (Mex$ '000) ------ --- (Mex '000)…------
1. Engineering ha 380 40 420 5,500 2,090 220 2,310 - - - - 2,310 2,310
2. Civil Works
Land Clearing ha 1,400 2,600 4,000 150 170 316 486 350 490 910 1 ,400 1 886 1,132 754Excavation m3 5 15 20 53,400 216 649 865 124,600 623 1,869 2,492 3,357 1,928 1,429Fll m3 25 45 70 64,100 1,298 2,336 3,634 149,500 3,737 6,728 10,465 14,099 8,982 5,117Roads m 50 20 70 8,100 328 131 459 18,900 945 378 1,323 1,782 535 1,247Main Structures (Syphons) Unit 63,000 23,300 86,300 4 204 76 280 9 567 210 777 1,057 243 814Other Structures Unit 9,520 3,530 13,050 8 62 23 85 18 171 64 235 320 - 320
Total 2,278 3,531 5,809 6,533 10,159 16,692 22,501 12,820 9,681
3. Physical Contingencies 2,481 1,513 968
4. Total Execution Cost 27,292 16,643 10,649
5. Superviaion 4,094 2,497 1,597
6. Total Cost 31,386 19,140 12,246
1/ Unit cost. for civil works obtained fro. contracts awarded inMarch 1978. For works executed by force account costa are 19%/. lower.
August 2, 1978
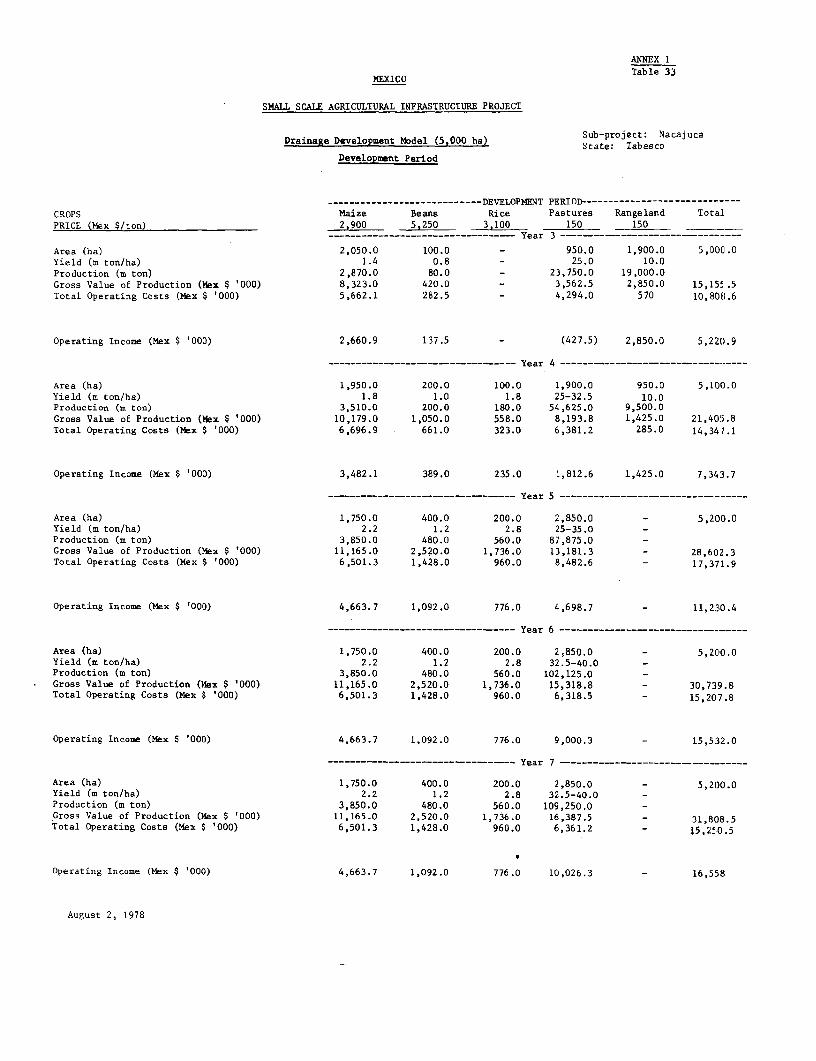
ANNEX 1
Table 33MEXICO
SMALL SCALE AGRICULTURAL INFRASTRUCTURE PROJECT
Sub-project: NacajucaDrainage DeveloPment Model (5,000 ha) State: Tabasco
Development Períod
----------------------------DEVELOPMENT PERIOD ----------------------------CROPS Maize Beans Rice Pastures Rangeland TotalPRICE (Mex $/ton) 2,900 5,250 3,100 150 150 _ __
--------- - - ------------ - ------- Year 3 ---- -
Area (ha) 2,050.0 100.0 - 950.0 1,900.0 5,000.0Yield (m ton/ha) 1.4 0.8 - 25.0 10.0Production (m ton) 2,870.0 80.0 - 23,750.0 19,000.0Gross Value of Production (Mex $ '000) 8,323.0 420.0 - 3,562.5 2,850.0 15,15'.5Total Operating Costs (Mex $ '000) 5,662.1 282.5 - 4,294.0 570 10,808.6
Operating Income (Mex $ '000) 2,660.9 137.5 - (427.5) 2,850.0 5,220.9
------------------------------- - Year 4 ------ - -------- - ---- - -----------
Area (ha) 1,950.0 200.0 100.0 1,900.0 950.0 5,100.0Yield (m ton/ha) 1.8 1.0 1.8 25-32.5 10.0Production (m ton) 3,510.0 200.0 180.0 54,625.0 9,500.0Gross Value of Production (Mex $ '000) 10,179.0 1,050.0 558.0 8,193.8 1,425.0 21,405.8Total Operating Costs (Mex $ '000) 6,696.9 661.0 323.0 6,381.2 285.0 14,347.1
Operating Income (Mex $ '000) 3,482.1 389.0 235.0 1,812.6 1,425.0 7,34:3.7
------------ - ------------ - -- --- Year 5 -------- ------- - --------------
Area (ha) 1,750.0 400.0 200.0 2,850.0 - 5,200.0Yield (m ton/ha) 2.2 1.2 2.8 25-35.0 -Production (m ton) 3,850.0 480.0 560.0 87,875.0 -Gross Value of Production (Mex $ '000) 11,165.0 2,520.0 1,736.0 13,181.3 - 28,602.3Total Operating Costs (Mex $ '000) 6,501.3 1,428.0 960.0 8,482.6 - 17,371.9
Operating Income (Mex $ '000) 4,663.7 1,092.0 776.0 4,698.7 11,230.4
____________----------- -- - ---- Year 6 --------- - -- - -------------…----
Area (ha) 1,750.0 400.0 200.0 2,850.0 - 5,200.0Yield (m ton/ha) 2.2 1.2 2.8 32.5-40.0 -Production (m ton) 3,850.0 480.0 560.0 102,125.0 -Gross Value of Production (Mex $ '000) 11,165.0 2,520.0 1,736.0 15,318.8 - 30,739.8Total Operating Costs (Mex $ '000) 6,501.3 1,428.0 960.0 6,318.5 - 15,207.8
Operating Income (Mex $ '000) 4,663.7 1,092.0 776.0 9,000.3 - 15,532.0
… ----- -- ----- ------ Year 7 ----------- ----- ----…- ----.----
Area (ha) 1,750.0 400.0 200.0 2,850.0 - 5,200.0Yield (m ton/ha) 2.2 1.2 2.8 32.5-40.0 -Production (m ton) 3,850.0 480.0 560.0 109,250.0 -Gross Value of Production (Mex $ '000) 11,165.0 2,520.0 1,736.0 16,387.5 - 31,808.5Total Operating Costs (Mex $ '000) 6,501.3 1,428.0 960.0 6,361.2 - 15,250.5
Operating Income (Mex $ '000) 4,663.7 1,092.0 776.0 10,026.3 - 16,558
August 2, 1978
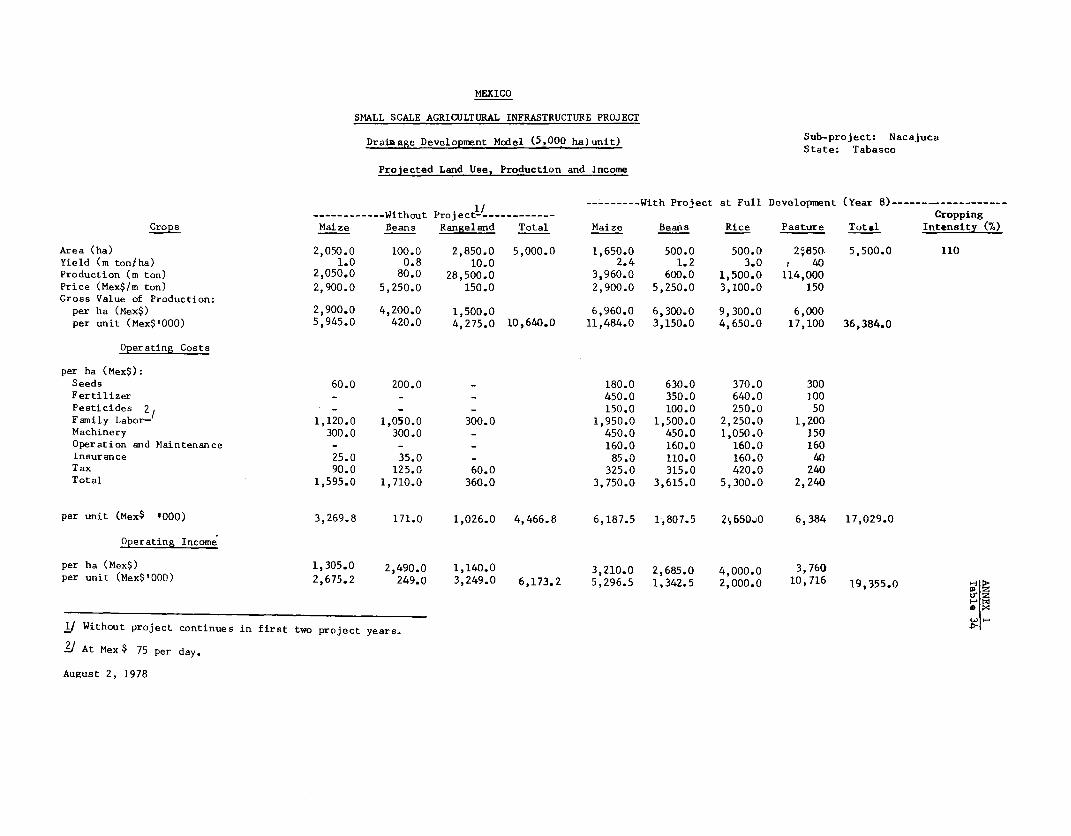
MEXICO
SMALL SCALE AGRICULTURAL INFRASTRUCTURE PROJECT
Draincge Development Model (5,000 ha)unit) Sub-project Nacajuca
Projected Land Use, Production and Income
1/ ----- With Proiect at Full Development (Year 8)…-------…----_---_ -------------Without Project ------------- CroppingCrops Maize Beans Rangeland Total Maize Beans Rice Pasture Total Intensity (%)
Area (ha) 2,050.0 100.0 2,850.0 5,000.0 1,650.0 500.0 500.0 2c850 5,500.0 110Yield (m tonlha) 1.0 0.8 10.0 2.4 1.2 3.0 40Production (m ton) 2,050.0 80.0 28,500.0 3,960.0 600.0 1,500.0 114,000Price (Mex$/m ton) 2,900.0 5,250.0 150.0 2,900.0 5,250.0 3,100.0 150Gross Value of Production:per ha (Mex$) 2,900.0 4,200.0 1,500.0 6,960.0 6,300.0 9,300.0 6,000per unit (Mex$'000) 5,945.0 420.0 4,275.0 10,640.0 11,484.0 3,150.0 4,650.0 17,100 36,384.0
Operating Costs
per ha (Mex$):Seeds 60.0 200.0 - 180.0 630.0 370.0 300Fertilizer - - - 450.0 350.0 640.0 100Pesticides 2 - 150.0 100.0 250.0 50Family Labor-/ 1,120.0 1,050.0 300.0 1,950.0 1,500.0 2,250.0 1,200Machinery 300.0 300.0 - 450.0 450.0 1,050.0 150Operation and Maintenance - - - 160.0 160.0 160.0 160Insurance 25.0 35.0 - 85.0 110.0 160.0 40Tax 90.0 125.0 60.0 325.0 315.0 420.0 240Total 1,595.0 1,710.0 360.0 3,750.0 3,615.0 5,300.0 2,240
per unit (Mex$ '000) 3,269.8 171.0 1,026.0 4,466.8 6,187.5 1,807.5 2650O.0 6,384 17,029.0Operating Income
per ha (Mex$) 1,305.0 2,490.0 1,140.0 3,210.0 2,685.0 4,000.0 3,760per unit (Mex$1000) 2,675.2 249.0 3,249.0 6,173.2 5,296.5 1,342.5 2,000.0 10,716 19,355.0
(D X
1/ Without project continues in first two project years.
1/ At Mex $ 75 per day.
August 2, 1978
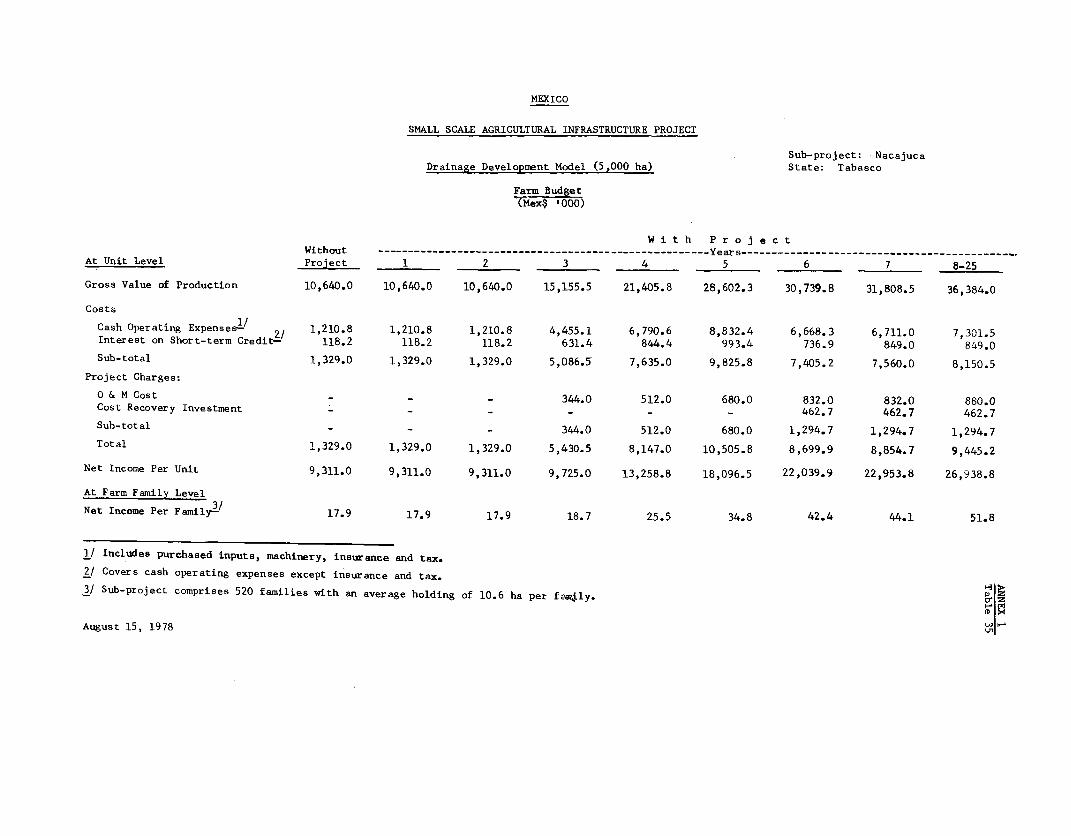
MEXICO
SMALL SCALE AGRICULTURAL INFRASTRUCTURE PROJECT
Sub-project: Nacajuca
Drainage Development Model (5,000 ha) State: Tabasco
Farm Budget(Mex$ '000)
W i t h P r o j e c t
Without ------------------------------------------------------ Years…---------------------------------------------At Unit Level Project 1 2 3 4 5 6 7 8-25
Gross Value of Production 10,640.0 10,640.0 10,640.0 15,155.5 21,405.8 28,602.3 30,739.8 31,808.5 36,384.0
Costs
Cash Operating Expensesl- 2/ 1,210.8 1,210.8 1,210.8 4,455.1 6,790.6 8,832.4 6,668.3 6,711.0 7,301.5
Interest on Short-term Credit- 118.2 118.2 118.2 631.4 844.4 993.4 736.9 849.0 849.0
Sub-total 1,329.0 1,329.0 1,329.0 5,086.5 7,635.0 9,825.8 7,405.2 7,560.0 8,150.5
Project Charges:
O & M Cost - - - 344.0 512.0 680.0 832.0 832.0 880.0Cost Recovery Investment - - - - 462.7 462.7 462.7
Sub-total - - - 344.0 512.0 680.0 1,294.7 1,294.7 1,294.7
Total 1,329.0 1,329.0 1,329.0 5,430.5 8,147.0 10,505.8 8,699.9 8,854.7 9,445.2
Net Income Per Unit 9,311.0 9,311.0 9,311.0 9,725.0 13,258.8 18,096.5 22,039.9 22,953.8 26,938.8
At Farm Family Level
Net Income Per Family -3 17.9 17.9 17.9 18.7 25.5 34.8 42.4 44.1 51.8
1/ Includes purchased inputs, machinery, insurance and tax.
2/ Covers cash operating expenses except insurance and tax.
3/ Sub-project comprises 520 families with an average holding of 10.6 ha per fra4ly.
Aiu 1.
August 15, 1978 Ji-
MEXICO
SMALL SCALE AGRICULTURAL INFRASTRUCTURE PROJECT
Livesteck Infrastructure: Dual Purpose Development Model (1110 ha) Sub-project: Miguel HidalgoState. Quintana Roo
Investment Costs-
Item Unit Unit Cost Quantity Total Cost Pha-ang of InvestmentsLocal Foreign Total Local Foreign Total Year 1 Year 2 Year 3 Year Yee S Year 6------ (MexS '000) ------ _-_-(Mex$ '000) --- -- _ - ------- (Mex$ 000)-------
1. Studies sub-project 1 140 - 140 140 - - - -
2. On-farm Works
Pasture Rehabilitation ha 1.5 0.3 1.8 510 765 153 918 270 270 378 - - -Pasture Establishnent ha 2.0 0.4 3.6 600 1,200 243 1,440 - - - 480 480 480Fencea km 8.8 2.9 11.7 53 467 153 620 85 85 120 110 110 110Corrals sub-project 675.0 225.0 900.0 1 675 225 900 120 120 180 160 160 160Milking Facilities sub-project 580.0 120.0 700.0 1 580 151 700 - 350 - 350 - -Silos Unit 22.0 8.0 30.0 2 44 16 60 30 30 - -Power and Water sub-project 120.0 80.0 200.0 1 120 80 200 200 - - -Housing Unit 218.4 54.6 273.0 2 438 110 548 274 - 274 -Miscellaneous sub-project 80.0 20.0 100.0 1 80 20 100 20 40 40 -
Sub-total 4,369 1,117 5,486 999 955 932 1,100 750 750
3. Livestock (Cows) head 7.0 - 7.0 300 2,100 - 2,100 - 700 700 700 - -4. Physical Contingencies 437 112 549 100 96 93 110 75 755. Total Execution Cost .7,016 1,129 8,275 1,239 1,751 1,725 1,910 825 8256. Supervision 905 - 905 165 157 153 182 124 124
7. Total Cost 7,951 1,229 9,180 1,404 1,908 1,878 2,092 949 949
1/ Works would be done by force account. D
01August 3, 1978
|
MEXICO
SMALL SCALE AGRICULTURAL INFRASTRUCTURE PROJECT Sub-project: Miguel Hidalgo
State: Quintana RooLivestock Infrastructure: Dual Purpose Development Model (1110 ha)
Herd Projection
--------- i--- ---- hPr-- o-------------- ------------ ---------Wíth Projec----------------------------------------------------- -- ~------------------------Years ---------------------------- _-----------------______--_____________-
Preprojeect- 1 2 3 4 5 6 7 8 9 10 11-25Purchases (Cows) 100 100 100 - - - - - - -
Herd CompositionCows 20 11 96 190 282 314 370 430 483 500 500 500Heifers 2-3 4 3 - - 42 68 94 87 104 101 143 149Heifers 1-2 4 4 - 43 70 96 90 107 128 146 152 152Calves (F7male) 5 - 45 72 98 92 110 131 149 156 156 156Calves (Male) 5 - 45 72 98 92 110 131 149 156 156 156Steers 1-2 4 4 - 43 70 96 90 107 128 146 152 152
Total Head 28 11 186 420 660 758 864 993 1,141 1,205 1,259 1,265
Births 12 - 96 152 206 193 230 273 310 324 324 324
DeathsCows 1 2 4 6 8 10 12 14 14 15 16 16Heifers 2-3 1 1 - - 1 2 2 3 3 3 3 3Heifers 1-2 1 1 - 2 2 2 2 3 3 3 4 4Calves (Female) 1 1 3 4 5 4 5 5 6 6 6 6Calves (Male) 1 1 3 4 5 5 5 6 6 6 6 6Steers 1-2 1 1 - 2 2 2 2 3 3 3 4 4
Total Head 6 7 10 18 23 25 28 34 35 36 39 39
SalesCows (head) 2 10 - - - - 20 20 72 86 127 133Steers 1-2 (head) 4 18 - 43 70 96 90 107 128 146 152 152Milk (thousand lt) 3.0 0.7 57.6 91.2 144.2 154.4 207.0 245.7 279.0 291.6 291.6 291.6
Production CoefficientsWeaning Rate ('b) - - - 61.5 62.2 63.5 64.2 64.8 64.8 64.8Cow Culling Rate (Z) - - - - 5.4 4.7 14.4 17.2 25.4 26.6Adult Mortality (%) 4.2 3.6 2.8 2.8 2.8 3.1 2.7 2.7 2.8 2.8Calves Mortality (7.) 6.2 5.3 4.9 4.6 4.6 4.0 3.9 3.7 3.7 3.7Pasture Area (ha) 150 300 510 710 910 1,110 1,110 1,110 1,110 1,110Adult Animal Units (AAU) 119 286 467 555 656 744 903 959 1,047 1,058Actual Animal Load (AAU/ha) 0.8 1.0 0.9 0.8 0.9 0.7 0.8 0.9 0.9 1.0Milk/Milking Cow (lt) 200 600 600 700 800 900 900 900 900 900 900Milk/Pasture Area (lt/ha) n.a. n.a. n.a. 217 227 227 227 227 227 227
1/ Existing herd which is shown under pre-project column, would be entirely replaced -by the new herd. The existing herd would be sold during year 1 as shown in the í table and the remainder in year 2 (not shown in the table).
August 16, 1978 _
MEXICO
SMALL SCALE AGRICULTURAL INFRASTRUCTURE PROJECT
Livestock Infrastructurei Dual Purpose Development Model (1110 ha) State: Ouintana Roo
Projected Production and Income
Without 1 2 3 4 5 6 7 8 9 10 11-25Project - 2 ________---- Ye rs_____ _
Gross Value of Production-/Cows 10.8 54.0 - - - - 108.0 108.0 388.8 464.4 685.8 718.2Steers 16.8 54.0 - 180.6 294.0 403.2 378.0 449.4 537.6 613.2 638.4 638.4Milk 18.0 4.0 345.6 547.2 865.2 926.4 1,242.0 1,474.2 1,674.0 1,749.6 1,749.6 1,749.6
Sub-total 45.6 112.0 345.6 727.8 1,159.2 1,329.6 1,728.0 2,031.6 2,600.4 2,827.2 3,073.8 3,106.2
Operating CostaMaterials "t 3.92 3.92 55.8 126.0 198.0 227.4 265.2 303.9 363.9 387.3 415.8 419.4Labor (Hired)- ' - - 108.0 162.0 216.0 243.0 270.0 297.0 324.0 324.0 324.0 324.0Pasture Maintenance- 5 - - - 63.8 152.5 202.5 277.5 277.5 277.5 277.5 277.5 277.5Installations elintenance-/ - - - - - - 138.2 138.2 138.2 276.3 276.3 276.3Admin5stration- - - 130.0 180.0 180.0 180.0 180.0 180.0 180.0 180.0 180.0 180.0Taxes. .08 .08 - 0.9 1.4 1.9 2.2 2.5 4.0 4.6 5.6 5.7
Sub-total 4.00 4.00 293.8 532.7 747.9 854.8 1,133.1 1,199.1 1,287.6 1,449.7 1,479.2 1,482.9
Operating Income
Total 41.6 108.0 51.8 195.1 411.3 474.8 594.9 832.5 1,312.8 1,377.5 1,594.6 1,623.3Per AAU (Mex$) 440 680 880 860 910 1,120 1,450 1,440 1,520 1,530
1/ Unit Prices. Cows: 5,400 Mex$/head; Steers: 4,200 Mex$/head; Milk: 6 Mex$/lt.2/ Feed Supplements: 180 Mex$/head; Animal Health: 120 Mex$Ihead; Total 300 Mex$/head.3/ Permanent Workers: Average Salary 27,000 Mex$/year.
Year 2 3 4 5 6 7 8-25No. of Workers 4 6 8 9 10 11 12
4/ 250 Mex$/ha.
5/ 47. of investment cost from years 6 to 10; 8'. of investment costs from year 11 onwards.6/ Manager, 80,000 Mex$; 2 Assistante, 50,000 Mex$ each.7/ Mex$ 20 per head sold. A
August 2, 1978
HEXICO
SMALL SCALE AORICULTURAL INFRASTRUCTURE PROJECT
Livastock Infrattructure: Dual Purpose Cattle Development Modal (1,110 ha) State: p uiotaMa Roo
(ma.$ '000)
Faro Budget
i;ithout - - - - - - -h-P-r-o-Ye e c t ___________________At Unit Leel Proiect 1 2 3 4 5 6 7 8 9 10 11 12 13 14 15 16 17 18 19-25
Cash lufloo
Soles 45.6 112.0 457.0 835.8 1,159.2 1,329.2 1,728.0 2,031.6 2,600.4 2,827.2 3,073.8 3,106.2 3,106.2 3,106.2 3,106.2 3,106.2 3,106.2 3,106.2 3,106.2 3,106.2LoaS-te- L-oas - - 760.0 760.0 760.0 - - - - - - - - - - - - - - -Short-term Credit - 30.0 30.0 40.0 50.0 64.0 100.0 100.0 100.0 100.0 100.0 100.0 100.0 100.0 100.0 100.0 100.0 100.0 100.0 100.0 100.0
Total Iaflov 75.6 142.0 125.7 1,663.8 1,983.2 1,429.2 1,828.0 2,131.6 2,700.4 2,927.2 3,173.8 3,206.2 3,206.2 3,206.2 3,206.2 3,206.2 3,206.2 3,206.2 3,206.2 3,206.2
Cash Outf loo
Investment - - 800.0 800.0 800.0 - - - - - - - - - - - - - - -
Cosh Operatig Expensas- 4.0 4.1 297.9 532.7 749.7 854.8 1,131.1 1,199.1 1,287.6 1,449.7 1,479.2 1,482.9 1,482.9 1,482.9 1,482.9 1,482.9 1,482.9 1,482.9 1,482.9 1,482.9
loterest:
Long-tere L.o.s (117.) - - 83.6 167.2 250.8 250.8 250.8 246.5 237.5 232.2 207.4 189.9 170.3 148.6 124.6 97.9 68.3 35.2 12.1 -Short-term Credit (15/.) 4.5 4.5 6.0 7.5 9.6 15.0 15.0 15.0 15.0 15.0 15.0 15.0 15.0 15.0 15.0 15.0 15.0 15.0 15.0 15.0
PrincIpal:
Long-term Looan (11.) - - - - - - 38.9 82.0 129.9 144.1 160.0 177.6 197.2 218.9 242.9 269.6 299.2 209.7 110.3 -Short-tera Credit (15%) 30.0 30.0 40.0 50.0 64.0 100.0 100.0 100.0 100.0 100.0 100.0 100.0 100.0 100.0 100.0 100.0 100.0 100.0 100.0 100.0
Project Ch-arges:
Cost Raoovary: Investoent 4/ - - - - - - - - - 111.1 111.1 111.1 111.1 111.1 111.1 111.1 111.1 111.1 111.1
Total Ootflow 38.5 38.6 1,227.5 1,557.4 1,874.1 1,220.6 1,535.8 1,642.6 1,770.0 1,941.0 2,072.7 2,076.5 2,076.5 2,076.5 2,076.5 2,076.5 2,076.5 1,953.9 1,821.4 1,709.0
Net Income Par Modal 3711 103.4 29.5 106.4 109.1 208.6 292.2 489 930.4 986.2 1,101.1 1,129.7 1,129.7 1,129.7 1,129.7 1,129.7 1,129.7 1,252.3 1,384.8 1,497.2
At Faro Family Level--
Net Irome Pee Family 0.8 2.2 0.6 2.2 2.3 4.3 6.1 10.2 19.4 20.5 22.9 23.5 23.5 23.5 23.5 23.5 23.5 26.1 28.9 31.2
1/ 95%/ of iavestment cost of cattle porchoses.2/ Cavers ca,h aperatiag expensen ocaePt insuranea asd tao3/ Inludos Purchasad iaputa, htred labor, insurance and t.
/ D-rlag ooastrcmzioa period, bh.efioiarlos oontribution te via labor ototllisg 10. of investment cost;reoaboder le ala quotas.
51 Sob-project comprEsas 48 familias iíth 00 average holding of 23 ha par family.S.oll dif£ereacat de t.o rounding.
August 2, 1978
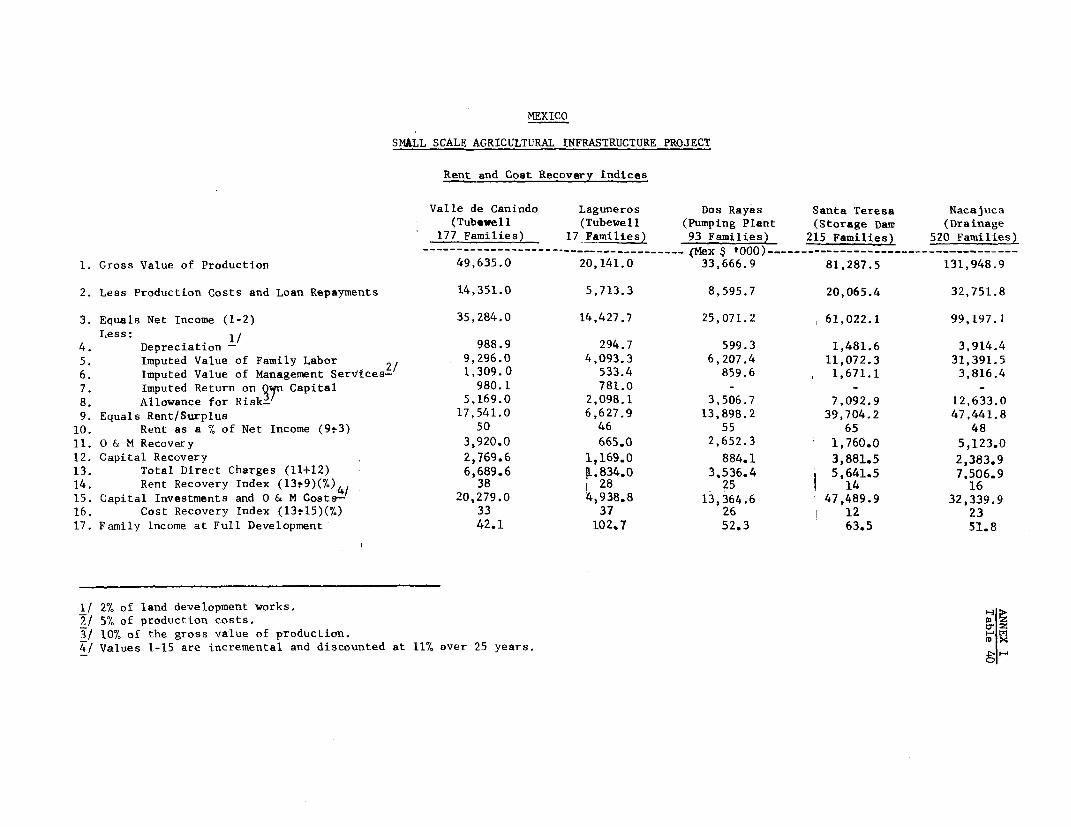
MEXICO
SMALL SCALE AGRICULTURAL INFRASTRUCTURE PROJECT
Rent and Cost Recovery Indices
Valle de Canindo Laguneros Dos Rayas Santa Teresa Nacajuca
(Tubevell (Tubewell (Pumping Plant (Storage Dam (Drainage
177 Families) 17 Fami) 93 Families) 215 Families) 520 Families)
-------------- ----------------- (Mex $ '000)-------------------------------------
1. Gross Value of Production 49,635.0 20,141.0 33,666.9 81,287.5 131,948.9
2. Less Production Costs and Loan Repayments 14,351.0 5,713.3 8,595.7 20,065.4 32,751.8
3. Equals Net Income (1-2) 35,284.0 14,427.7 25,071.2 í 61,022.1 99,197.1
4.Less: Depreciation 1 988.9 294.7 599.3 1,481.6 3,914.4
5. Imputed Value of Family Labor 9,296.0 4,093.3 6,207.4 11,072.3 31,391.5
6. Imputed Value of Management Services-/ 1,309.0 533.4 859.6 1,671.1 3,816.4
7. Imputed Return on Qkn Capital 980.1 781.0 _ _
8. Allowance for Risk3/ 5,169.0 2,098.1 3,506.7 7,092.9 12,633.0
9. Equals Rent/Surplus 17,541.0 6,627.9 13,898.2 39,704.2 47,441.8
10. Rent as a % of Net Income (9t3) 50 46 55 65 48
11. 0 & M Recovery 3,920.0 665.0 2,652.3 1,760.0 5,123.0
12. Capital Recovery 2,769.6 1,169.0 884.1 3,881.5 2,383.9
13. Total Direct Charges (11+12) 6,689.6 1.834.0 3,536.4 5,641.5 7,506.9
14. Rent Recovery Index (13i9)(%)4¡ 38 28 - 25 14 16
15. Capital Investments and O & M Costa- 20,279.0 4,938.8 13,364.6 47,489.9 32,339.9
16. Cost Recovery Index (13i15)(%) 33 37 26 12 23
17. Family Income at Full Development 42.1 102.7 52.3 63.5 51.8
1/ 27. of land development works.2/ 5% of production costs,3/ 10% of the gross value of production. M t
4/ Values 1-15 are incremental and discounted at 11% over 25 years.
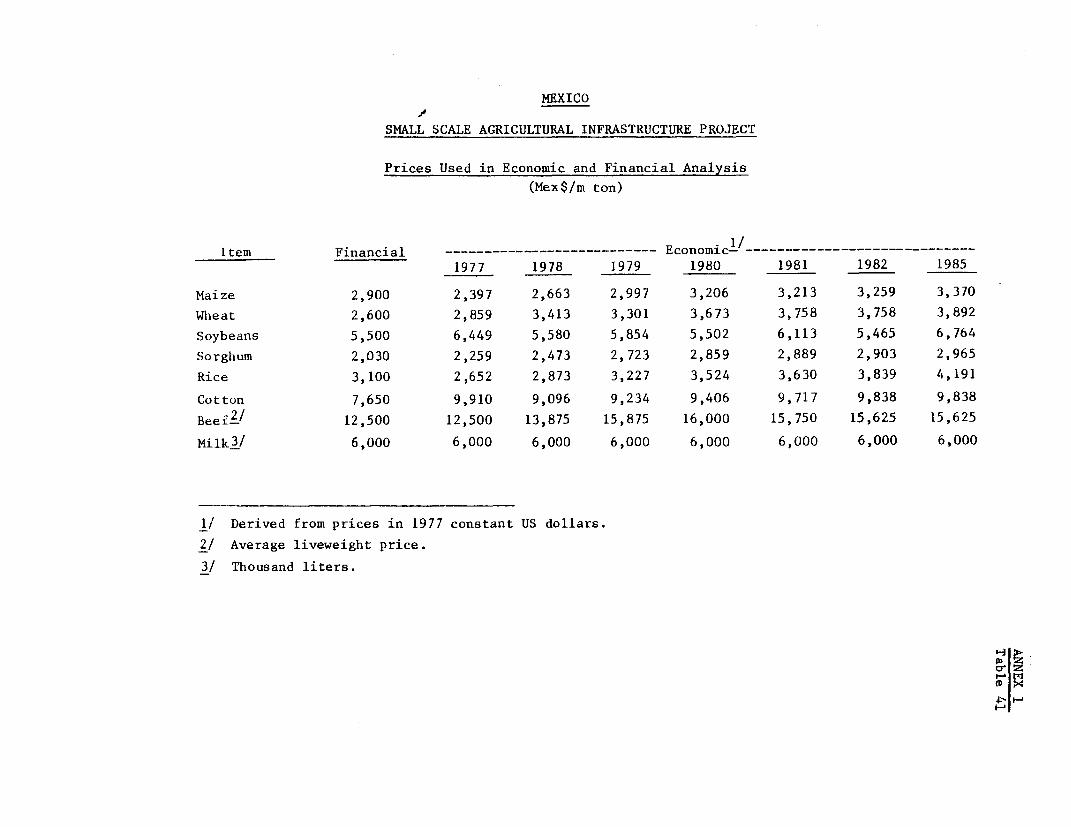
MEXICO
SMALL SCALE AGRICULTURAL INFRASTRUCTURE PROJECT
Prices Used in Economic and Financial Analysis
(Mex$/m ton)
Item Financial ------------------…-------- Economic1/---------------------…------1977 1978 1979 1980 1981 1982 1985
Maize 2,900 2,397 2,663 2,997 3,206 3,213 3,259 3,370
Wleat 2,600 2,859 3,413 3,301 3,673 3,758 3,758 3,892
Soybeans 5,500 6,449 5,580 5,854 5,502 6,113 5,465 6,764Sorghum 2,030 2,259 2,473 2,723 2,859 2,889 2,903 2,965
Rice 3,100 2,652 2,873 3,227 3,524 3,630 3,839 4,191
Cotton 7,650 9,910 9,096 9,234 9,406 9,717 9,838 9,838
Beer2/ 12,500 12,500 13,875 15,875 16,000 15,750 15,625 15,625
Milk3/ 6,000 6,000 6,000 6,000 6,000 6,000 6,000 6,000
1/ Derived from prices in 1977 constant US dollars.
21 Average liveweíght price.
3/ Thousand liters.
Iz D
tD >
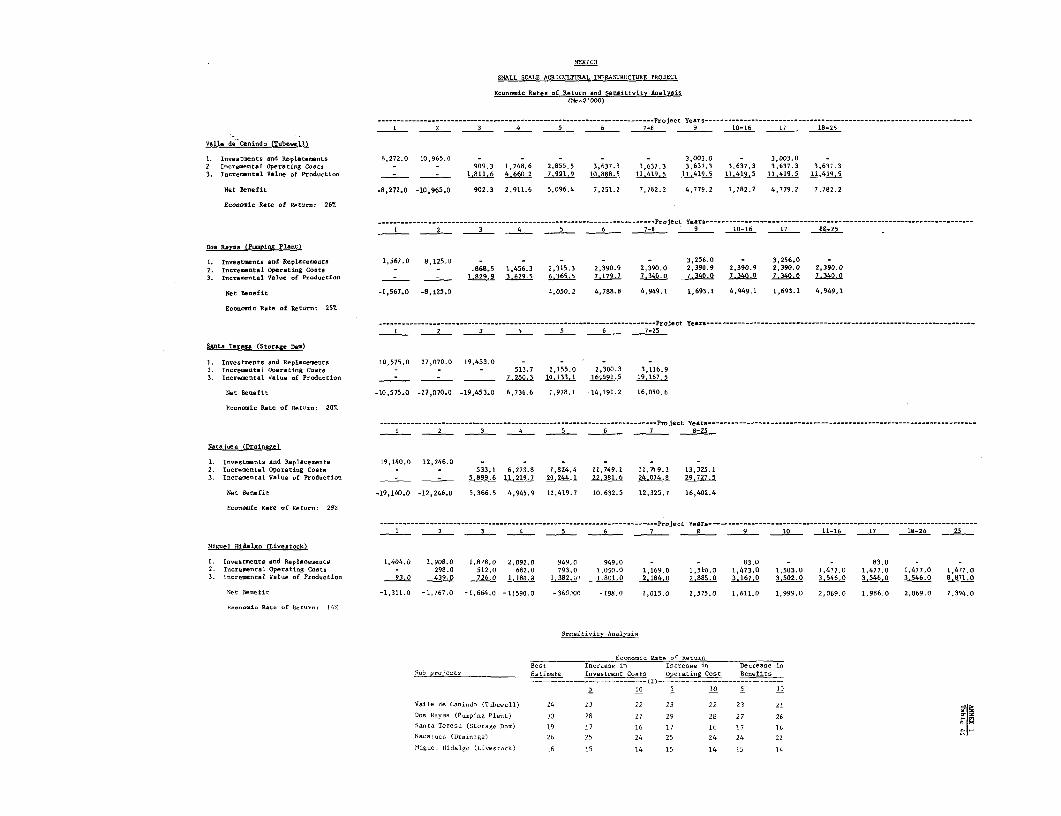
,MEX 140
SM0LL SCALE AGRICULTURAL INFRASTRUCTURE PROJECr
Ecoo.íel Ratee of Retute ad Seoeltivltv _noivete-
(Men7 OOOj)
*----------------- --- -------- --- ------- --------- ----- ---- ---- ----------- P-oJect Yea - --- - --- -------- ------- ----- ----- _--------------------------------------_
I 2 3 4 5 6 7-8 9 10-16 17 18-25
Valla de Cainido (Tobewíl3
1. Inveateent sed RMplace. nse 8,272.0 10,965.0 - - - - - 3,003.0 - 3,003.0 -2. r1-r-e- etal Operatleg Costo - - 909.3 1,748.6 2,855.5 3,637.3 3,637.3 3,637.3 3,637.3 3,637.3 3,637,3
3. Ic-ee- etat Value of Production _ - 1.811.6 4.660,2 79.219 10.888.5 11,419.5 1.i419.5 11.419.5 11.419.5 11.419,5
Net Benefit -8,272.0 -10,965.0 902.3 2,911.6 5,096.4 7,251.2 7,782.2 4,779.2 7,782.2 4,779.2 7,782.2
Ecuoneti Reaí uf Reture: 26%
----- -- --------- Pro- -c- -ea-t…------------------------…---j-t Y…-------…-----…--------------------------------------_-__
1 3 3 4 5 6 7-8 9 10-16 17 *t025
Do. Ravo (Pueping Pleetí
1. Ivesteoto sed Replaoeensc 1,567,0 8,125.0 - - - - - 3,256.0 - 3,256.0 -2. Ieraental Op-tatisg Coste - - .868_5 1,456.3 2,315.3 2,390.9 2,390.0 2,390.9 2,390.9 2,390.0 2,390.03. Ie-re-eeta Vlue of Prdtio - - 129.9 3.6295 6365.5 7.179.7 7.340.0 7.340.0 7.340.0 7.340.0 7.340.0
Net Renefit -1,567.0 -8,125.0 4,050.2 4,788.8 4,949.1 1,693.1 4,949.1 1,693.1 4,949,1
EcosM-et Rete of Roture: 25%
-- - - - - - - ----- -- ~~~~~~~ ---- ---- ---- -------- ---- ~~~~~~-----~---- --- ------ Project Year --- _-----_------------------------------- - ---------------------------
1 2 3 4 5 6 7-25
Santa Tetean (Oterase 2am)
1. Tevoeteete sed Replaseeote 10,575.0 27,070.0 19,453.0 -
2. Opereeetaí Operating Costo - - - 513.7 2,155.0 2,300.3 3,116.93. Teors-- tal Velos of Podrrtion - -_ 7.250.3 10,133.1 16_,491.5 19.167.5
Net Benefit -10,575.0 -27,070.0 -19,453.0 6,736.6 7,978.1 14,191.2 16,050.6
Eononeic Rate of Reture: 207%
----- ~~ -- ~---~~~~~~~~~---~ ~~~~ ~~~~~~~~------------------------------------ ~ject ----s-------------------------------------------------------_---_------_--
1 2 3 4 5 6 7 8-25
Natiita (Drsiosfe)
1. Ieveaeeta sed Replatee-te 19,140.0 12,246.0 - - - - - -2. Iurce~.tal Opepatiíg Coste - - 533.1 6,273.8 7,824.4 11,749.1 11,749.1 13,325.1
3. Iooremeetal Vflco of Prodoctíie _ - 5 899.6 11,219.7 20,244.1 22,381.6 24.074.8 29,727.5
Net Renefít -19,140.0 -12,246.0 5,366.5 4,945.9 12,419.7 10,632.5 12,325.7 16,402.4
Eososgil Rata of Ratero: 29%
---- -- --- - 1 ---- --- --- --- --- i- --------------- ~~------------------- P-o7 -t Yesr ---- _ _------------- ------------ ------------ ------------ ------------
1 2 3 4 5 6 7 8 9 10 11-16 17 18-24 25
Miguel Híalso (Liveatook)
1. IeveSteete .ed ReplIaee--ta 1,404.0 1,908.0 1,878.0 2,092.0 949.0 949.0 - - 83.0 - - 83.0
2. I-r-e- tel Oper-tig Coata - 298.0 512,0 682.0 793.0 1,050.0 1,169.0 1,310.0 1,473.0 1,503.0 1,477.0 1,477.0 1,477,0 1,477.03. 1ocre-eetal Value of Production 93,0 43S.0 726,0 1.18d.9 1,382.[¿ _ 1,.801,0 2 184.0 2.885.0 3.167,0 3502.0 3.546,0 3.546.0 3.546.0 88710
Net Renefít -1,311.0 -1,767.0 -1,664.0 -1(590.0 -3603n0 -198,0 1,015.0 1,575.0 1,611.0 1,999.0 2,069.0 1,986.0 2,069.0 7,394.0
roecucono Roto of Roture: 14R
Occoitirí ty Aroslycio
Ercoe.oi Rate of Rotur-
Becot inreúse j Inocrreuse ic Decrease. iSub-pr-j-rt. Eutio-te Ieroutooot Costo operating Coct Bonefits
…(4)…------------------------- - - …-- - - -…-- - ------ ~------- -…
5 10 5 10 5 ID
VRllo de Cuojisd (Tub-well) 24 23 22 23 22 23 21 osf
Doo Royos (Puopiog PIu,,t) 30 28 27 29 28 27 26
5.oto Toroso (Storuge Dar) l9 17 16 17 16 17 14
Norsjucr (Draitage) 24 25 24 25 24 24 22
Migusl hlidalgo (Li-e-to-k) 16 15 14 15 14 15 14
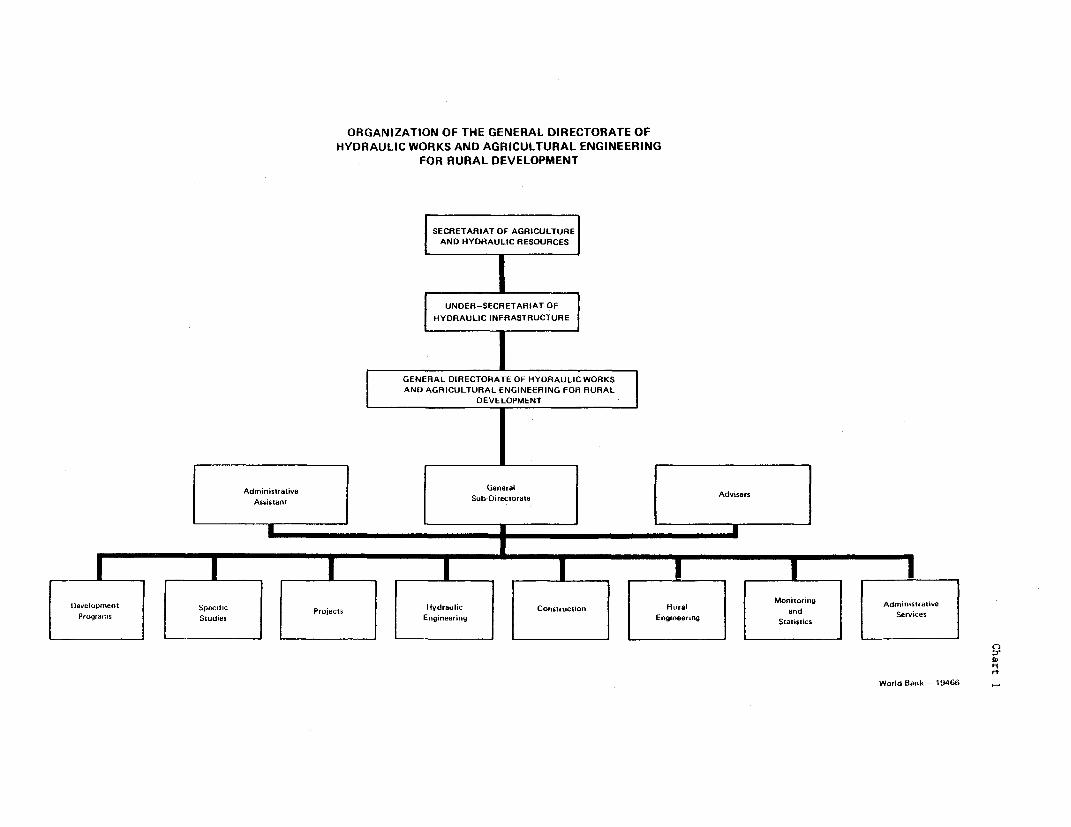
ORGANIZATION OF THE GENERAL DIRECTORATE OFHYDRAULIC WORKS AND AGRICULTURAL ENGINEERING
FOR RURAL DEVELOPMENT
SECRETARIAT OF AGRICULTUREAND HYDRAULIC RESOURCES
| UNDER-SECRETARIAT OF
HYDRAULIC INFRASTRUCTURE
GENERAL DIRECTORATE OF HYDRAULICWORKSAND AGRICULTURAL ENGINEERING FOR RURAL
DEVE LOPMENT
Administrativo General
Assistant Sub-Directorate Advisers
Spac¡f¡c Hydraulac ~~~~~~~~~~~~~~~~~~~~uriMonitoring Adrnufustrat veDeeloPmant 1 Projacts vdalic Constructio a and Services
| Prograrns l l Studies l l Engineering Enguneering Stalisties
ar
rt
Worid Bank -- 19466 _
ORGANIZATION OF THE GENERAL SUB-DIRECTORATE FORSUPERVISION OF RURAL DEVELOPMENT UNITS
SECRETARiAT OF AGRIUCLTUREAND HYDRAULIC RESOURCES
UNDER-SECRETARIAT OFAGRICULTURE AND OPERATION |
GENERAL DIRECTOAATE OFIRRIGATION OISTRICTS AND
RURAL DEVELOPMENT UNITS
GENERAL SUB-DIRECTORATEFOR SUPERVISION OF RURAL¡
DEVELOPMENT UNITS
DePlartnm o# Rurai Deveopment ||Dep rtnwnt of Technica t Smvic n | n E we
Oiviujon fOío fOvs of of Oiv. of ofOoioni,s ivon nfof oision <> i¡¡nof D,visiwnoo
Li",t~ Soial AUsoltancc Maiot.n .nc Operation rrptiMon t Statilii Ew ation Inastrtul--
,ooram$ P,ogw~ , n ag E Wnglosrinr
W.,ld Bank - 19465 *
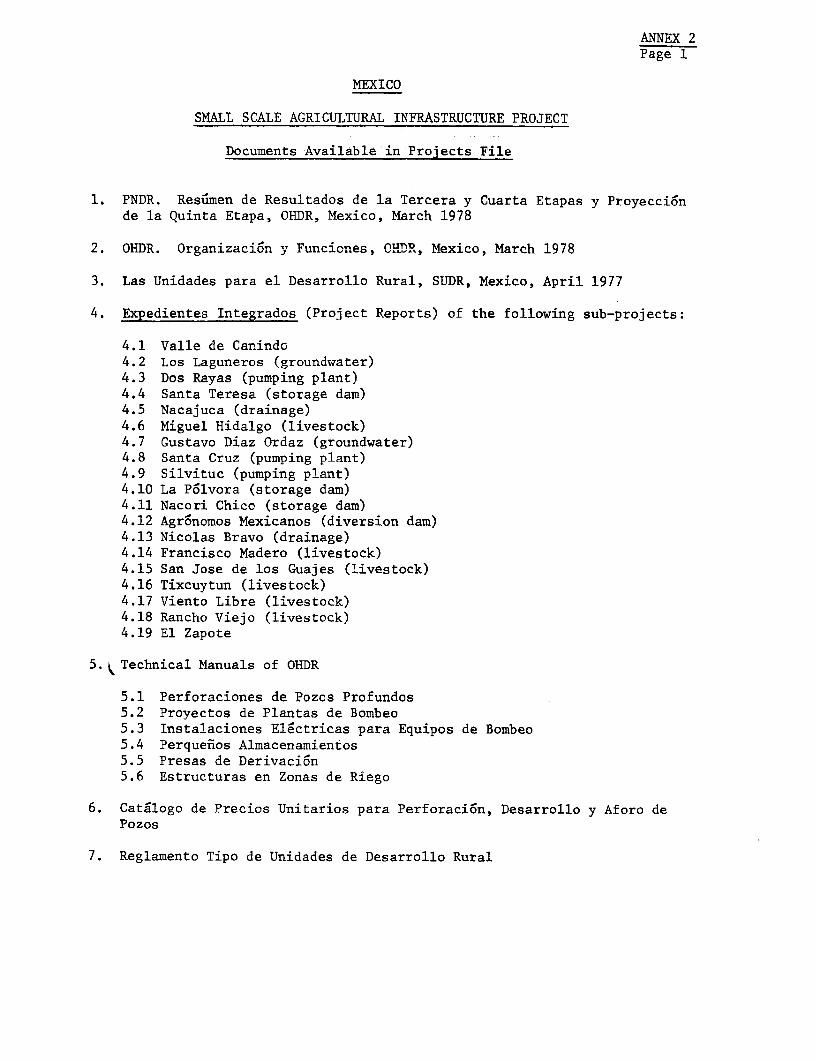
ANNEX 2Page 1
MEXICO
SM1ALL SCALE AGRICULTURAL INFRASTRUCTURE PROJECT
Documents Available in Projects File
1. PNDR. Resúmen de Resultados de la Tercera y Cuarta Etapas y Proyecciónde la Quinta Etapa, OHDR, Mexico, March 1978
2. OHDR. Organización y Funciones, nD1R, Mexico, March 1978
3. Las Unidades para el Desarrollo Rural, SUDR, Mexico, April 1977
4. Expedientes Integrados (Project Reports) of the following sub-projects:
4.1 Valle de Canindo4.2 Los Laguneros (groundwater)4.3 Dos Rayas (pumping plant)4.4 Santa Teresa (storage dam)4.5 Nacajuca (drainage)4.6 Miguel Hidalgo (livestock)4.7 Gustavo Diaz Ordaz (groundwater)4.8 Santa Cruz (pumping plant)4.9 Silvituc (pumping plant)4.10 La Pólvora (storage dam)4.11 Nacori Chico (storage dam)4.12 Agrónomos Mexicanos (diversion dam)4.13 Nícolas Bravo (drainage)4.14 Francisco Madero (livestock)4.15 San Jose de los Guajes (livestock)4.16 Tixcuytun (livestock)4.17 Viento Libre (livestock)4.18 Rancho Viejo (livestock)4.19 El Zapote
5. Technical Manuals of OHDR
5.1 Perforaciones de Pozos Profundos5.2 Proyectos de Plantas de Bombeo5.3 Instalaciones Eléctricas para Equipos de Bombeo5.4 Perqueñios Almacenamientos5.5 Presas de Derivación5.6 Estructuras en Zonas de Riego
6. Catálogo de Precios Unitarios para Perforaci6n, Desarrollo y Aforo dePozos
7. Reglamento Tipo de Unidades de Desarrollo Rural

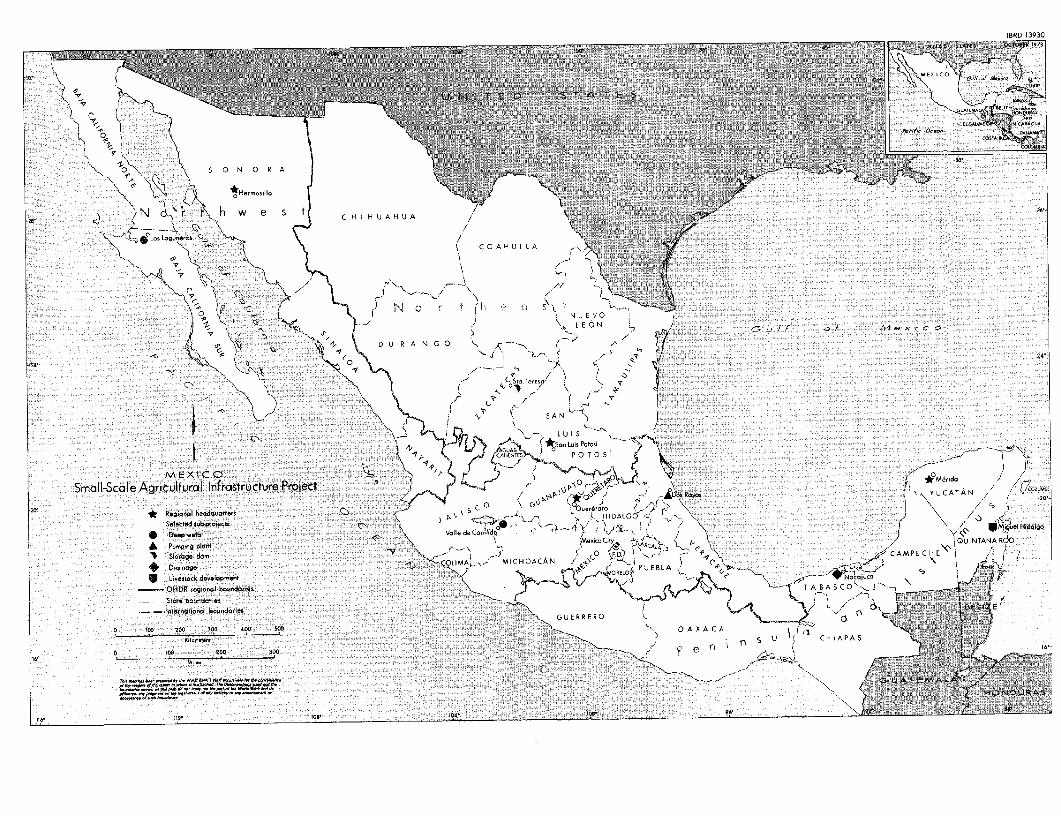
IBRD 13930
~'ew- GCT~ 1970-MIM .77Z777777177=� 'J
MEXICO919 9,1 2
c~d, % ..... ..F- T
lz, v,
L r �il� rqpa i. 0-
j��iv Tl n
5 0 N 0 R A
w e C H 1 H U A H U A
r S
C 0 A H U 1 L A
0N U E v
L E ó N f
R A N G 0
20.
24-17 71
C St..T--<', 0,1
5 A N
L U 15
p
P'jT 1
mrxlcoSmall-Scale Agricultural Infrastructure Project
YuCATAN
2T ¿HIDALGO
S.I.cted s.bp,.ja,: Vi el HidolgoV.Iie d. C-M.oDe.p wetis
�m.�,c.city �, iQU l NTANA Rlp~ ,,g pl---t ;k. �
sto,ng. d.. ¿F ��.) 1 ,�,�'c A M P E C H ECOLIMA, MICHIJACAN
PUEBLA
lo Li�estock d"elop-mt Nocol,,-z:p_-OHDR t.gi.nol bou.dorio. T A B A 5 C 0
E
GUERRERO clfip 290 300 4(?0 ii� �,ío 0 A X A C A j
ti 1 � C H 1 A P A 5n0 100
wL
Z-11-U R Adl
vr 112- 104- loo- W