Embed Size (px)
Citation preview
8/6/2019 World Bank Economic Monitor - Malaysia Brain Drain (April 2011)
http://slidepdf.com/reader/full/world-bank-economic-monitor-malaysia-brain-drain-april-2011 1/150
Ap
Brain D
MALAYSIA ECONOMIC MONIT
6148

8/6/2019 World Bank Economic Monitor - Malaysia Brain Drain (April 2011)
http://slidepdf.com/reader/full/world-bank-economic-monitor-malaysia-brain-drain-april-2011 2/150
8/6/2019 World Bank Economic Monitor - Malaysia Brain Drain (April 2011)
http://slidepdf.com/reader/full/world-bank-economic-monitor-malaysia-brain-drain-april-2011 3/150
MALAYSIA ECONOMIC MONITOR
APRIL 2011
BRAIN DRAIN
THE WORLD BANK

8/6/2019 World Bank Economic Monitor - Malaysia Brain Drain (April 2011)
http://slidepdf.com/reader/full/world-bank-economic-monitor-malaysia-brain-drain-april-2011 4/150
This volume is a product of the staff of the International Bank for Reconstruction and Development / The WorldBank. The findings, interpretations, and conclusions expressed in this volume do not necessarily reflect the viewsof the Executive Directors of The World Bank or the governments they represent. The pictures on the cover are
attributed to United Nations Photo (flag), Phinalanji (Airplane), Rob Chan (graduation), Syafiq Sirajuddin (man with
newspaper) under the Creative Commons License. The report is based on information available as of mid-April,
2011.
Please address queries and comments to:
Philip SchellekensThe World Bank
30th Floor, Siam Tower
989 Rama I Road, PathumwanBangkok 10330, Thailand
(662) 686-8300
www.worldbank.org/my
8/6/2019 World Bank Economic Monitor - Malaysia Brain Drain (April 2011)
http://slidepdf.com/reader/full/world-bank-economic-monitor-malaysia-brain-drain-april-2011 5/150
CONTENTS
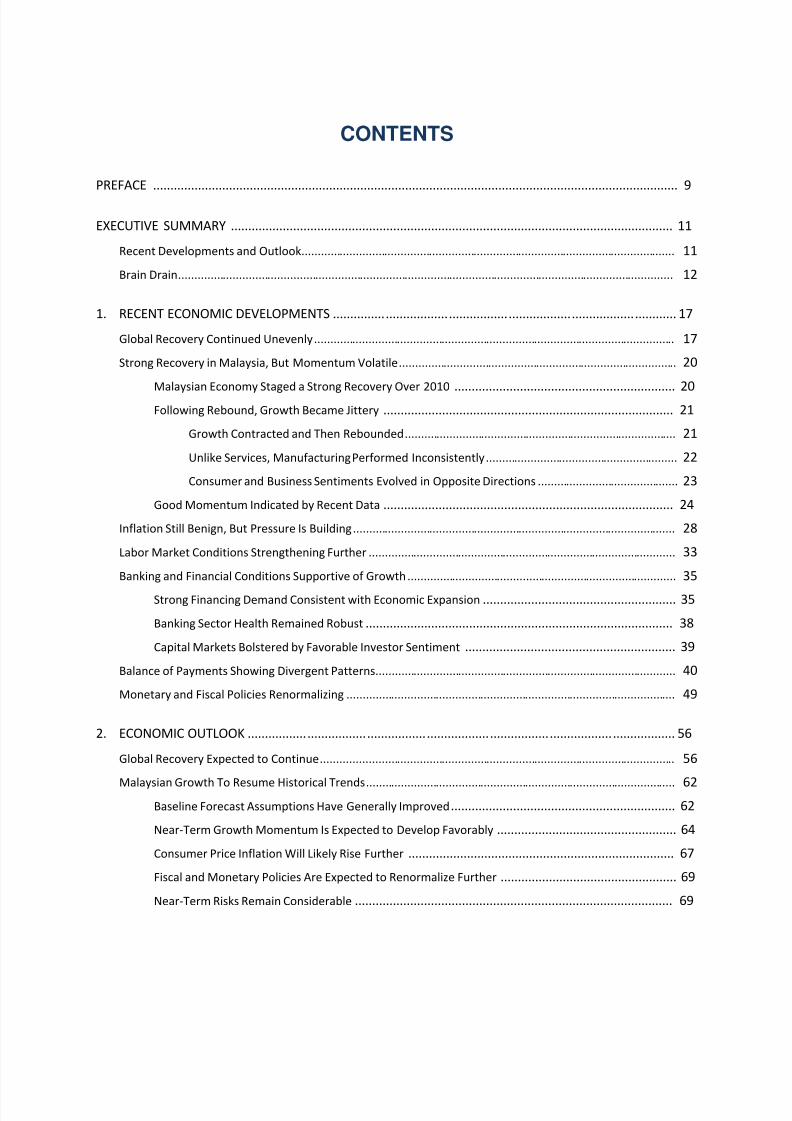
PREFACE ........................................................................................................................................................ 9
EXECUTIVE SUMMARY ................................................................................................................................ 11
Recent Developments and Outlook..................................................................................................................... 11
Brain Drain ...........................................................................................................................................................12
1. RECENT ECONOMIC DEVELOPMENTS .................................................................................................. 17
Global Recovery Continued Unevenly ................................................................................................................. 17
Strong Recovery in Malaysia, But Momentum Volatile....................................................................................... 20
Malaysian Economy Staged a Strong Recovery Over 2010................................................................ 20
Following Rebound, Growth Became Jittery .................................................................................... 21
Growth Contracted and Then Rebounded ..................................................................................... 21
Unlike Services, Manufacturing Performed Inconsistently ............................................................22
Consumer and Business Sentiments Evolved in Opposite Directions ............................................ 23
Good Momentum Indicated by Recent Data .................................................................................... 24
Inflation Still Benign, But Pressure Is Building ..................................................................................................... 28
Labor Market Conditions Strengthening Further ................................................................................................33
Banking and Financial Conditions Supportive of Growth ....................................................................................35
Strong Financing Demand Consistent with Economic Expansion ........................................................ 35
Banking Sector Health Remained Robust ......................................................................................... 38
Capital Markets Bolstered by Favorable Investor Sentiment ............................................................. 39
Balance of Payments Showing Divergent Patterns..............................................................................................40
Monetary and Fiscal Policies Renormalizing ....................................................................................................... 49
2. ECONOMIC OUTLOOK .......................................................................................................................... 56
Global Recovery Expected to Continue ............................................................................................................... 56
Malaysian Growth To Resume Historical Trends ................................................................................................. 62 Baseline Forecast Assumptions Have Generally Improved................................................................. 62
Near-Term Growth Momentum Is Expected to Develop Favorably .................................................... 64
Consumer Price Inflation Will Likely Rise Further ............................................................................. 67
Fiscal and Monetary Policies Are Expected to Renormalize Further ................................................... 69
Near-Term Risks Remain Considerable ............................................................................................ 69

8/6/2019 World Bank Economic Monitor - Malaysia Brain Drain (April 2011)
http://slidepdf.com/reader/full/world-bank-economic-monitor-malaysia-brain-drain-april-2011 6/150
Medium-Term Outlook Contingent on Reform Implementation ........................................................................ 71
Malaysia’s Medium-Term Challenges in Perspective......................................................................... 71
A Historical Perspective ................................................................................................................. 71
A Counterfactual Perspective......................................................................................................... 72
A Forward-Looking Perspective ..................................................................................................... 75
Policy Approaches to Strengthen Medium-Term Prospects ............................................................... 77
Government Transformation Programme ..................................................................................... 78
Economic Transformation Programme .......................................................................................... 78
Assessment of Medium-Term Outlook and Risks .............................................................................. 79
Implementation is Progressing, But Skepticism Remains .............................................................. 79
Tackling Cross-Cutting Issues Remains Crucial ............................................................................... 80
3. BRAIN DRAIN ........................................................................................................................................ 83
Brain Drain as a Global Phenomenon .................................................................................................................. 84
Magnitude of Brain Drain .................................................................................................................................... 89
A First Glance at the Data............................................................................................................... 90
Diaspora Is Large, Mainly Concentrated in Singapore ................................................................... 90
After Brisk Growth, Migration Momentum Slowed ....................................................................... 91
But Brain Drain Was Magnified by Changing Patterns in Skill Selectivity ......................................93
Scenario-Based Estimates .............................................................................................................. 97
Estimates Are Extrapolated to 2010 on the Basis of Moderate Growth ........................................97
Extent of Nonresident Diaspora in Singapore Could Surprise on the Upside ................................ 99 Diaspora Likely Reaches One Million, a Third of Which Is Brain Drain ........................................103
Economic Impact of Brain Drain ........................................................................................................................105
Significance of Brain Drain............................................................................................................ 105
Relative to Narrow Skill Base, Intensity of Brain Drain Is High.....................................................105
Brain Drain Is Not Alleviated By Compensating Inflows...............................................................108
Large Share of Diaspora Acquired Education Overseas ...............................................................112
Channels of Impact ...................................................................................................................... 113
Brain Drain Can Erode Skill Base and Depress Innovation ...........................................................114
But Incentive Effects May Boost Human Capital Formation ........................................................114
Other Benefits Accrue From Remittances, Return Migration and Diaspora Effects ....................115
Effect on Malaysian Human Capital Base ....................................................................................... 115
Brain Drain Does Not Appear to Have Eroded Stock of Tertiary-Educated .................................115
But Skills Shortages Point to Concerns about Quality of Human Capital .....................................116
8/6/2019 World Bank Economic Monitor - Malaysia Brain Drain (April 2011)
http://slidepdf.com/reader/full/world-bank-economic-monitor-malaysia-brain-drain-april-2011 7/150
Policy Approaches to Brain Drain ......................................................................................................................118
Fundamental Drivers of Brain Drain .............................................................................................. 118
Push and Pull Factors Drive the Migration Decision ....................................................................118
Economic Incentives and Social Disincentives Matter Most ........................................................121
Comprehensive Approaches ......................................................................................................... 122
Boosting Productivity ...................................................................................................................122
Strengthening Inclusiveness.........................................................................................................125
Targeted Approaches................................................................................................................... 129
Competing for Talent ...................................................................................................................129
Engaging with the Diaspora .........................................................................................................134
Conclusion .........................................................................................................................................................136
REFERENCES .............................................................................................................................................. 143
BOXES
Box 1. Malaysia’s Economic Performance in Regional Context..................................................................................26
Box 2. How Do Price Developments Compare Within the Region? ............................................................................ 30
Box 3. Does Rising Household Indebtedness Pose a Risk? ......................................................................................... 37
Box 4. Foreign Direct Investment in Malaysia: A Regional Perspective......................................................................44
Box 5. Fiscal Consolidation in Malaysia: A Historical Perspective .............................................................................. 51
Box 6. Economic Impact of the Calamity in Japan ...................................................................................................... 60 Box 7. The Geography of Poverty in Malaysia ............................................................................................................73
Box 8. What is Brain Drain? ........................................................................................................................................ 85
Box 9. The Malaysian Diaspore in Singapore: A 2010 Census Profile ......................................................................... 95
Box 10. Immigrant Workers in Malaysia ...................................................................................................................109
Box 11. Determinants of Brain Drain: Cross-Country Evidence ................................................................................119
Box 12. Suggestions from the Diaspora ....................................................................................................................128
Box 13. Attitudes Towards Return Migration ...........................................................................................................133

8/6/2019 World Bank Economic Monitor - Malaysia Brain Drain (April 2011)
http://slidepdf.com/reader/full/world-bank-economic-monitor-malaysia-brain-drain-april-2011 8/150
8/6/2019 World Bank Economic Monitor - Malaysia Brain Drain (April 2011)
http://slidepdf.com/reader/full/world-bank-economic-monitor-malaysia-brain-drain-april-2011 9/150
PREFACE
The partnership between the Government of Malaysia and the World Bank is centered on the policyobjective of transforming Malaysia into a high-income economy. The Malaysia Economic Monitor seriesis a key pillar in this partnership and serves as a platform for public discussion, analysis, and the sharingof knowledge on the challenges facing Malaysia along its high-income journey.
This fourth issue of the Malaysia Economic Monitor is themed Brain Drain. The report reviewsrecent economic developments, updates the World Bank’s view on the economic outlook, andanalyzes—in the report’s thematic section—how Malaysia can manage brain drain. The report isaccompanied by an outreach effort to a wide audience of policymakers, private sector leaders, marketparticipants, civil society, think tanks, journalists and the public at large. This report as well as the threeprevious ones—namely Repositioning For Growth, Growth Through Innovation, and Inclusive Growth—
are available at www.worldbank.org/my.
This Malaysia Economic Monitor was prepared by Philip Schellekens (Task Team Leader), VatcharinSirimaneetham and Kiyoshi Taniguchi, with contributions from Thomas Farole, Yue Li, Frederico GilSander, Swarnim Wagle, and under the overall guidance of Annette Dixon, Vikram Nehru and MathewVerghis. The thematic chapter benefited from input by Ximena Del Carpio, Sanket Mohapatra andÇağlar Özden. The team thanks Anna Elicano and Trinn Suwannapha for assistance in external relationsand web production, Indra Irnawan for designing the cover and back, and Angkanee Luangpenthong andPiathida Poonprasit for program and administrative support.
This report also benefited from external input by Greg Foo and Johann Harnoss of the Kennedy
School of Government at Harvard University, with whom the World Bank set up a project on brain drainand organized a study visit to Malaysia. In this connection, the report also benefited from a surveyconducted on the Malaysian diaspora.
The Malaysia Economic Monitor further benefited from fruitful discussions, comments andinformation from the Prime Minister’s Economic Council, Bank Negara Malaysia, Department of Statistics, Economic Planning Unit, Ministry of Finance, Ministry of Foreign Affairs, Ministry of HumanResources, National Economic Advisory Council, Performance Management and Delivery Unit, TalentCorporation, and numerous other government ministries and agencies. We are indebted to theEconomic Planning Unit for their collaboration with the World Bank and in particular their assistance inthe launch of this report.
We also thank representatives from Federation of Malaysian Manufacturers, Malaysian Institute of Economic Research and Malaysian International Chamber of Commerce and Industry, and severalfinancial institutions for helpful discussions. We further appreciated the input by representatives andstudents from Institute of Southeast Asian Studies (Singapore), International Medical University,National University of Singapore, Nottingham University (Malaysia), Singapore Management Universityand University of Malaya. Last but not least, we thank the numerous members of the Malaysiandiaspora who took the time to respond to the survey presented in this report.

8/6/2019 World Bank Economic Monitor - Malaysia Brain Drain (April 2011)
http://slidepdf.com/reader/full/world-bank-economic-monitor-malaysia-brain-drain-april-2011 10/150
8/6/2019 World Bank Economic Monitor - Malaysia Brain Drain (April 2011)
http://slidepdf.com/reader/full/world-bank-economic-monitor-malaysia-brain-drain-april-2011 11/150
11
EXECUTIVE SUMMARY
RECENT DEVELOPMENTS AND OUTLOOK
The Malaysian economy staged a strong recovery over the course of 2010, but the momentum of growth had progressively weakened over the year. The strong rebound was driven mainly by thedomestic private sector, with some support from commodity exports towards year-end. Electronicsunderperformed, however, raising concerns about underlying competitiveness. Private consumptionremained firm, despite flat sequential growth, amid favorable labor and credit market conditions. In linewith domestic demand, growth in the services sector was sustained. Industrial production picked up onbetter performance in domestic-oriented industries, with capacity utilization at normal levels again.
Malaysia’s positive growth performance was accompanied by a build-up in inflationary pressure anda surge in foreign capital inflows. While still benign, inflation rose on higher food and fuel prices amidstsharp increases in global commodity prices. Meanwhile, the continued inflow of foreign capital saw therecovery of foreign direct investment from its steep decline in 2009. Estimates suggest FDI continues tounderperform, however, and Malaysia could tap into a large unrealized potential.
The economic rebound also paved the beginning for macroeconomic policy normalization. As thesurge in interest rate-sensitive capital flows complicated the conduct of monetary policy, macro-prudential measures and the statutory reserve requirement were used instead of the overnight policyrate. Nevertheless, the overall monetary policy stance had remained accommodative to growth. On thefiscal front, efforts to consolidate the fiscal deficit proceeded as planned. Restraint on operatingexpenditure was the main contributor to the lower fiscal deficit—a key difference from previous fiscalconsolidation episodes.
The near-term outlook is for growth to resume at pre-crisis pace, with domestic demand the main
driver. Growth is expected at 5.3 percent for 2011 and 5.5 percent in 2012 as the global recoverybecomes more broad-based and reform momentum picks up. While private consumption is expected toremain robust, fixed investment will likely benefit. Higher inflation is anticipated as cost-push inflationwill likely translate into more widespread demand-pull pressure. Against these expectations,macroeconomic policies are likely to normalize further. The three key risks in the near term are: aweaker-than-expected global recovery, which would dampen growth momentum; a furtherstrengthening of inflationary pressures, which may undermine consumer spending; and, weak fiscalconsolidation, which may hurt policy credibility and would limit the ability to deal with future shocks.
Over the medium term, the implementation of structural reforms needs to be accelerated forMalaysia to successfully become a high income nation by 2020. While progress is being made with the
Government Transformation Programme (GTP) and the projects under the Economic TransformationProgramme (ETP) would help to boost economic growth, a more lasting impact would require morebroad-based productivity and investment climate enhancements. These two factors are precisely whatthe New Economic Model (NEM) has set out to address, but limited headway has been made on thisfront. While investor sentiment has warmed up towards the project-based approach, skepticismabounds with respect to the NEM measures. The intensification of competition in the region provides acall for action. The recent increase as well as geographically concentrated nature of poverty in Malaysiaadds further to this urgency.
8/6/2019 World Bank Economic Monitor - Malaysia Brain Drain (April 2011)
http://slidepdf.com/reader/full/world-bank-economic-monitor-malaysia-brain-drain-april-2011 12/150
12
BRAIN DRAIN
Brain drain—the migration of talent across borders—touches the core of Malaysia’s aspiration tobecome a high-income nation. Human capital is the bedrock of the high-income economy. Sustained andskill-intensive growth will require talent going forward. For Malaysia to stand success in its journey tohigh income, it will need to develop, attract and retain talent. Brain drain does not appear to square
with this objective: Malaysia needs talent, but talent seems to be leaving.
Brain drain has long been a subject of debate and controversy. Anecdotes are abundant, but fewstudies have documented the phenomenon in the Malaysian context—be it in terms of magnitude,impact or policy response. This Chapter attempts to fill these gaps by providing an updated estimate of the extent of brain drain, examining its economic impact and suggesting possible policy responses.
The analysis of brain drain is subject to a host of complications. Quantification is made difficult bydata discrepancies in terms quality, availability, timeliness and cross-country comparability. Brain drainis a multi-faceted phenomenon that affects an economy in multiple ways and also transcends thenarrow realm of economics. The findings of this Chapter should be interpreted with these caveats inmind.
How Large Is Malaysia’s Brain Drain?
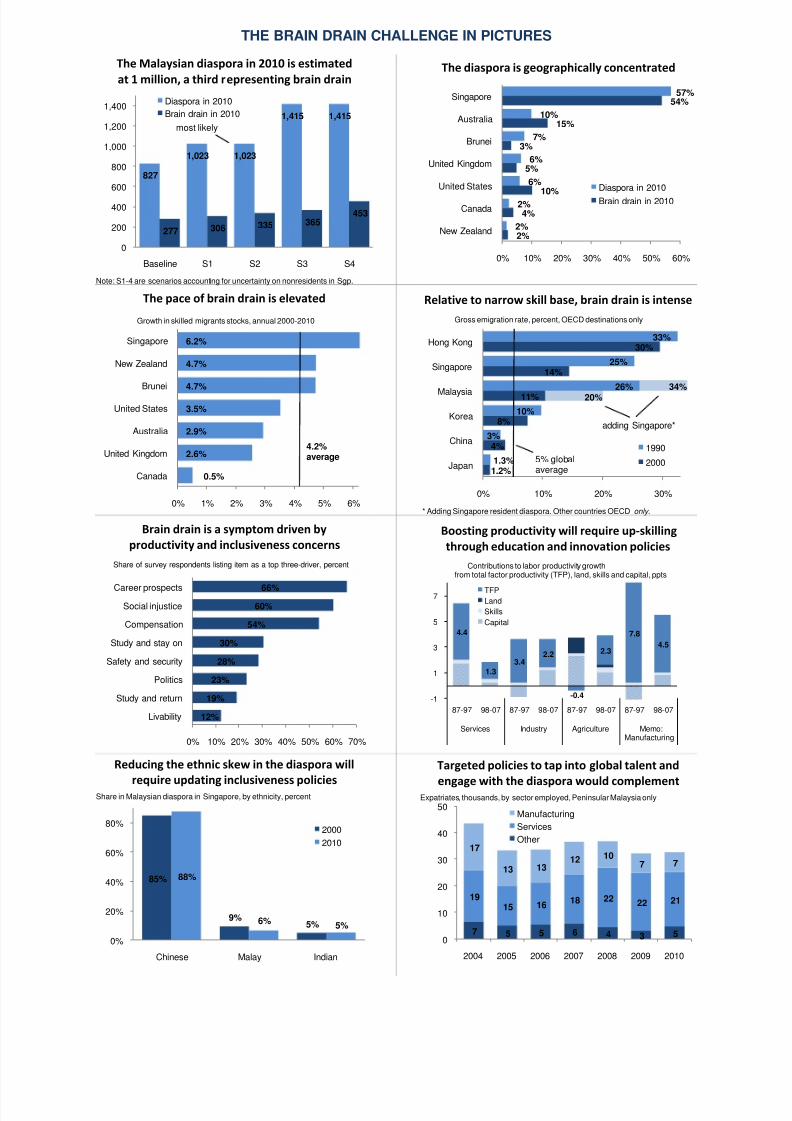
The Malaysian diaspora is large and expanding. Our conservative estimate puts the worldwidediaspora at one million people in 2010. The actual number could be significantly larger depending onhow many Malaysian-born are part of the nonresident population of Singapore—no data is available.The diaspora has grown rapidly: it almost quadrupled over the last three decades.
The diaspora is geographically concentrated and ethnically skewed. Singapore alone absorbs 57
percent of the entire diaspora, with most of the remainder residing in Australia, Brunei, United Kingdomand United States. Ethnic Chinese account for almost 90 percent of the Malaysian diaspora in Singapore;
they are similarly overrepresented in the countries of the OECD.
About a third of all migration is brain drain. Malaysia’s rate of brain drain is elevated: the skilleddiaspora is now three times larger than two decades ago. Migration has increasingly become thepreserve of the skilled. Singapore absorbed most of the brain drain, both in terms of stock (54 percent in2010) and increment (68 percent over the last decade). Over the last decade, the skilled diaspora inSingapore has grown at a yearly rate of 6 percent.
What Is the Impact of Brain Drain?
Malaysia’s brain drain is intense relative to a narrow skill base. One out of ten Malaysians with atertiary degree migrated in 2000 to an OECD country—this is twice the world average and including
Singapore would make this two out of ten. Brain drain is aggravated by a lack of compensating inflows.Malaysia is a major receiving country, but most immigrants are low-skill and the high-skill expatriatebase has shrunk by a quarter since 2004. Many skilled migrants have spent their formative yearsoverseas, which lowered the fiscal cost of migration but also the chances of return migration.
8/6/2019 World Bank Economic Monitor - Malaysia Brain Drain (April 2011)
http://slidepdf.com/reader/full/world-bank-economic-monitor-malaysia-brain-drain-april-2011 13/150
13
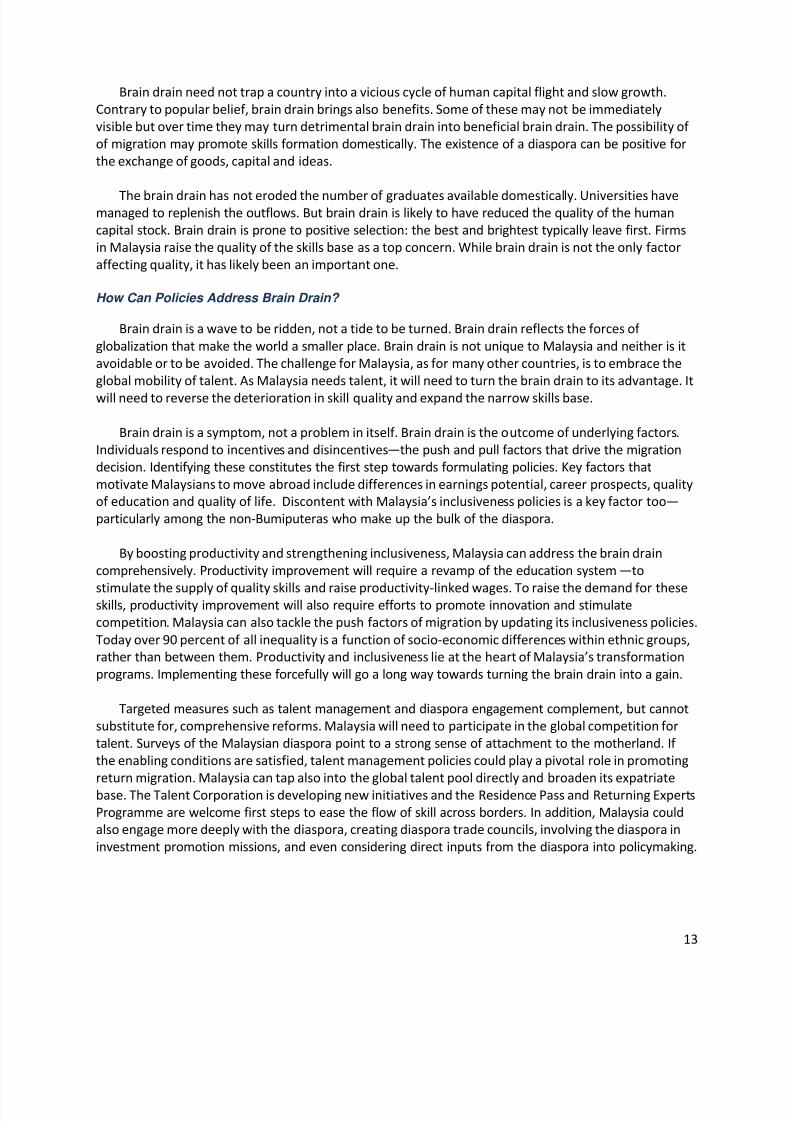
Brain drain need not trap a country into a vicious cycle of human capital flight and slow growth.Contrary to popular belief, brain drain brings also benefits. Some of these may not be immediatelyvisible but over time they may turn detrimental brain drain into beneficial brain drain. The possibility of of migration may promote skills formation domestically. The existence of a diaspora can be positive forthe exchange of goods, capital and ideas.
The brain drain has not eroded the number of graduates available domestically. Universities havemanaged to replenish the outflows. But brain drain is likely to have reduced the quality of the humancapital stock. Brain drain is prone to positive selection: the best and brightest typically leave first. Firmsin Malaysia raise the quality of the skills base as a top concern. While brain drain is not the only factoraffecting quality, it has likely been an important one.
How Can Policies Address Brain Drain?
Brain drain is a wave to be ridden, not a tide to be turned. Brain drain reflects the forces of
globalization that make the world a smaller place. Brain drain is not unique to Malaysia and neither is itavoidable or to be avoided. The challenge for Malaysia, as for many other countries, is to embrace theglobal mobility of talent. As Malaysia needs talent, it will need to turn the brain drain to its advantage. It
will need to reverse the deterioration in skill quality and expand the narrow skills base.
Brain drain is a symptom, not a problem in itself. Brain drain is the outcome of underlying factors.Individuals respond to incentives and disincentives—the push and pull factors that drive the migrationdecision. Identifying these constitutes the first step towards formulating policies. Key factors thatmotivate Malaysians to move abroad include differences in earnings potential, career prospects, qualityof education and quality of life. Discontent with Malaysia’s inclusiveness policies is a key factor too—particularly among the non-Bumiputeras who make up the bulk of the diaspora.
By boosting productivity and strengthening inclusiveness, Malaysia can address the brain draincomprehensively. Productivity improvement will require a revamp of the education system—to
stimulate the supply of quality skills and raise productivity-linked wages. To raise the demand for theseskills, productivity improvement will also require efforts to promote innovation and stimulatecompetition. Malaysia can also tackle the push factors of migration by updating its inclusiveness policies.
Today over 90 percent of all inequality is a function of socio-economic differences within ethnic groups,rather than between them. Productivity and inclusiveness lie at the heart of Malaysia’s transformationprograms. Implementing these forcefully will go a long way towards turning the brain drain into a gain.
Targeted measures such as talent management and diaspora engagement complement, but cannotsubstitute for, comprehensive reforms. Malaysia will need to participate in the global competition fortalent. Surveys of the Malaysian diaspora point to a strong sense of attachment to the motherland. If the enabling conditions are satisfied, talent management policies could play a pivotal role in promotingreturn migration. Malaysia can tap also into the global talent pool directly and broaden its expatriatebase. The Talent Corporation is developing new initiatives and the Residence Pass and Returning ExpertsProgramme are welcome first steps to ease the flow of skill across borders. In addition, Malaysia couldalso engage more deeply with the diaspora, creating diaspora trade councils, involving the diaspora ininvestment promotion missions, and even considering direct inputs from the diaspora into policymaking.
8/6/2019 World Bank Economic Monitor - Malaysia Brain Drain (April 2011)
http://slidepdf.com/reader/full/world-bank-economic-monitor-malaysia-brain-drain-april-2011 14/150
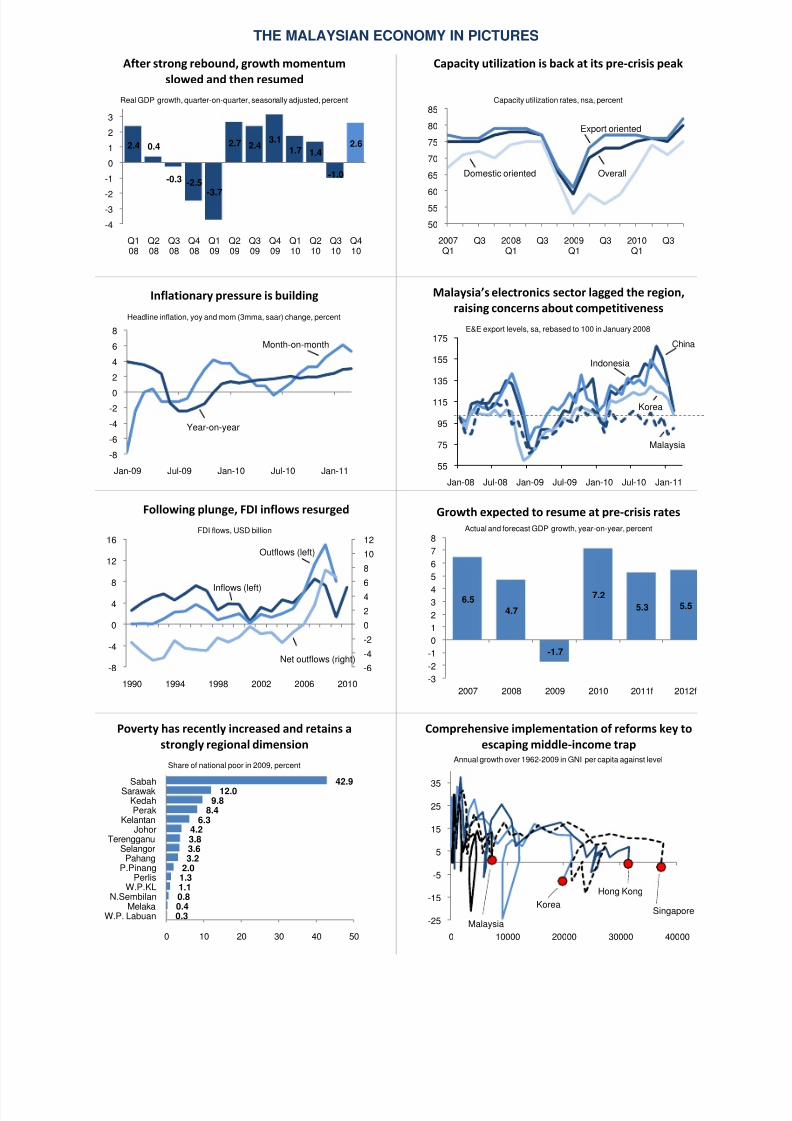
THE MALAYSIAN ECONOMY IN PICTURES
After strong rebound, growth momentum
slowed and then resumed
Real GDP growth, quarter-on-quarter, seasonally adjusted, percent
Capacity utilization is back at its pre-crisis peak
Capacity utilization rates, nsa, percent
Inflationary pressure is building
Headline inflation, yoy and mom (3mma, saar) change, percent
Malaysia’s electronics sector lagged the region,
raising concerns about competitiveness
E&E export levels, sa, rebased to 100 in January 2008
Following plunge, FDI inflows resurged
FDI flows, USD billion
Growth expected to resume at pre-crisis rates
Actual and forecast GDP growth, year-on-year, percent
Poverty has recently increased and retains a
strongly regional dimension
Share of national poor in 2009, percent
Comprehensive implementation of reforms key to
escaping middle-income trapAnnual growth over 1962-2009 in GNI per capita against level
2.4 0.4
-0.3 -2.5
-3.7
2.7 2.43.1
1.7 1.4
-1.0
2.6
-4
-3-2
-1
0
1
2
3
Q108
Q208
Q308
Q408
Q109
Q209
Q309
Q409
Q110
Q210
Q310
Q410
50
5560
65
70
75
80
85
2007Q1
Q3 2008Q1
Q3 2009Q1
Q3 2010Q1
Q3
-8
-6
-4
-20
2
4
6
8
Jan-09 Jul-09 Jan-10 Jul-10 Jan-11 55
75
95
115
135
155
175
Jan-08 Jul-08 Jan-09 Jul-09 Jan-10 Jul-10 Jan-11
-6
-4
-2
0
2
4
6
8
10
12
-8
-4
0
4
8
12
16
1990 1994 1998 2002 2006 2010
6.5
4.7
-1.7
7.2
5.3 5.5
-3-2
-1012
34
56
78
2007 2008 2009 2010 2011f 2012f
0.30.40.81.11.32.03.23.63.84.2
6.38.4
9.812.0 42.9
0 10 20 30 40 50
W.P. LabuanMelaka
N.SembilanW.P.KL
PerlisP.Pinang
PahangSelangor
TerengganuJohor
KelantanPerak
KedahSarawakSabah
-25
-15
-5
5
15
25
35
0 10000 20000 30000 40000
OverallDomestic oriented
Export oriented
China
Malaysia
Korea
Indonesia
Inflows (left)
Outflows (left)
Net outflows (right)
Malaysia
Korea
Hong Kong
Singapore
Year-on-year
Month-on-month
8/6/2019 World Bank Economic Monitor - Malaysia Brain Drain (April 2011)
http://slidepdf.com/reader/full/world-bank-economic-monitor-malaysia-brain-drain-april-2011 15/150
THE BRAIN DRAIN CHALLENGE IN PICTURES
The Malaysian diaspora in 2010 is estimated
at 1 million, a third representing brain drain
Note: S1-4 are scenarios accounting for uncertainty on nonresidents in Sgp.
The diaspora is geographically concentrated
The pace of brain drain is elevated
Growth in skilled migrants stocks, annual 2000-2010
Relative to narrow skill base, brain drain is intense
Gross emigration rate, percent, OECD destinations only
* Adding Singapore resident diaspora. Other countries OECD only .
Brain drain is a symptom driven by
productivity and inclusiveness concerns
Share of survey respondents listing item as a top three-driver, percent
Boosting productivity will require up-skilling
through education and innovation policies
Contributions to labor productivity growthfrom total factor productivity (TFP), land, skills and capital, ppts
Reducing the ethnic skew in the diaspora will
require updating inclusiveness policiesShare in Malaysian diaspora in Singapore, by ethnicity, percent
Targeted policies to tap into global talent and
engage with the diaspora would complement Expatriates, thousands, by sector employed, Peninsular Malaysia only
827
1,023 1,023
1,415 1,415
277 306 335 365453
0
200
400
600
800
1,000
1,200
1,400
Baseline S1 S2 S3 S4
Diaspora in 2010Brain drain in 2010
most likely
2%
4%
10%
5%
3%
15%
54%
2%
2%
6%
6%
7%
10%
57%
0% 10% 20% 30% 40% 50% 60%
New Zealand
Canada
United States
United Kingdom
Brunei
Australia
Singapore
Diaspora in 2010
Brain drain in 2010
0.5%
2.6%
2.9%
3.5%
4.7%
4.7%
6.2%
0% 1% 2% 3% 4% 5% 6%
Canada
United Kingdom
Australia
United States
Brunei
New Zealand
Singapore
4.2%average
1.2%
4%
8%
11%
14%
30%
1.3%
3%
10%
26%
25%
33%
0% 10% 20% 30%
Japan
China
Korea
Malaysia
Singapore
Hong Kong
1990
20005% globalaverage
20%34%
adding Singapore*
12%
19%
23%
28%
30%
54%
60%
66%
0% 10% 20% 30% 40% 50% 60% 70%
Livability
Study and return
Politics
Safety and security
Study and stay on
Compensation
Social injusticeCareer prospects
4.4
1.3
3.42.2
-0.4
2.3
7.8
4.5
-1
1
3
5
7
87-97 98-07 87-97 98-07 87-97 98-07 87-97 98-07
Services Industry Agriculture Memo:Manufacturing
TFPLandSkillsCapital
85%
9%5%
88%
6%5%
0%
20%
40%
60%
80%
Chinese Malay Indian
2000
2010
7 5 5 6 4 3 5
1915 16
18 2222 21
17
13 1312 10
7 7
0
10
20
30
40
50
2004 2005 2006 2007 2008 2009 2010
ManufacturingServicesOther

8/6/2019 World Bank Economic Monitor - Malaysia Brain Drain (April 2011)
http://slidepdf.com/reader/full/world-bank-economic-monitor-malaysia-brain-drain-april-2011 16/150
8/6/2019 World Bank Economic Monitor - Malaysia Brain Drain (April 2011)
http://slidepdf.com/reader/full/world-bank-economic-monitor-malaysia-brain-drain-april-2011 17/150
1. RECENT ECONOMIC DEVELOPMENTS
Recent economic developments in Malaysia reflected to a large extent the developments in the
global economy during the review period. Malaysia recorded a strong recovery over 2010. However,following the rebound, momentum seemed to taper off and growth became jittery. Output firstcontracted and then rebounded, manufacturing performed inconsistently and consumer and businesssentiment evolved in opposite directions. Recent indicators, however, are encouraging and suggestrenewed momentum.
Inflationary pressures have built—even though they remain comparatively benign. While labormarkets strengthened, real wage increases seem to have remained moderate for now. Yet, inflationarypressure seems to become more broad-based than before. Banking and financial conditions remainedsupportive of the real economy, with household debt rising against continued banking system strength.The current account surplus widened on commodity strength, masking a weakness in manufacturing
export volumes, raising concerns about a possible erosion in competitiveness. Foreign direct inflowsstaged a remarkable cyclical come-back, but underperformed structurally.
Policies were renormalized gradually. This reflected the still-uncertain and multi-speed globalrecovery. Fiscal consolidation reduced the federal government balance but not that of the consolidatedpublic sector. Restraint on federal operating expenditures played an important role initially, but recentcommodity price strength has put pressure on subsidy bills. Monetary policy was tightened to keepinflationary pressure in check but remained complicated by the global multi-speed growth environmentand attendant capital inflows. Macro-prudential measures complemented traditional instruments topre-emptively address potential pockets of vulnerability arising from credit growth.
GLOBAL RECOVERY CONTINUED UNEVENLY
The global economic recovery continued at varying speeds in the second half of 2010. Theunevenness in economic performance between the advanced and emerging economies persisted,
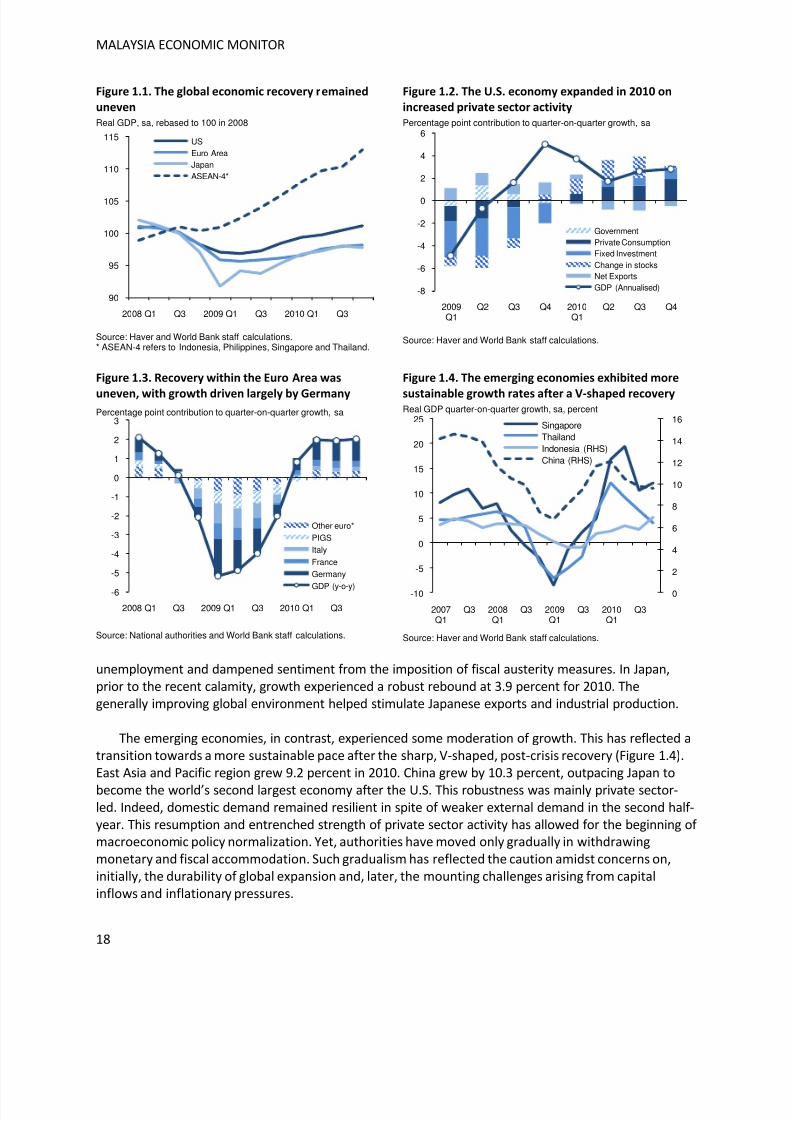
despite some narrowing in their growth paths. Within the advanced economies, the pace of economicrecovery began to diverge, particularly between the U.S. and the E.U. (Figure 1.1). In view of this multi-speed nature of the global recovery, macroeconomic policy stances also showed a marked geographicaldifferentiation. As a result, liquidity flows, asset prices and exchange rates saw divergent developments.
Advanced economies recovered more strongly than expected. U.S. growth picked up to 2.8 percentin 2010 (Figure 1.2). Macroeconomic policies remained expansionary, supported by additionalquantitative easing (QE2) and tax relief introduced towards year-end. Encouraging signs of strongerprivate sector activity have emerged. Private consumption expenditure and non-residential fixedinvestment trended higher amidst rising consumer and business sentiments. Labor market conditionshave meaningfully improved as the private sector recorded net job creation and the unemployment ratefell below nine percent in February 2011—the first time in 22 months. Meanwhile, the E.U. expanded by1.7 percent, though this was driven largely by Germany (Figure 1.3). The German economy grew by 3.6percent amid a strong export-led recovery with positive spillovers onto domestic demand. In theperipheral European economies, however, demand conditions remained weighed down by high
8/6/2019 World Bank Economic Monitor - Malaysia Brain Drain (April 2011)
http://slidepdf.com/reader/full/world-bank-economic-monitor-malaysia-brain-drain-april-2011 18/150
MALAYSIA ECONOMIC MONITOR
18
Figure 1.1. The global economic recovery remained
uneven
Real GDP, sa, rebased to 100 in 2008
Source: Haver and World Bank staff calculations.* ASEAN-4 refers to Indonesia, Philippines, Singapore and Thailand.
Figure 1.2. The U.S. economy expanded in 2010 on
increased private sector activity
Percentage point contribution to quarter-on-quarter growth, sa
Source: Haver and World Bank staff calculations.
Figure 1.3. Recovery within the Euro Area was
uneven, with growth driven largely by GermanyPercentage point contribution to quarter-on-quarter growth, sa
Source: National authorities and World Bank staff calculations.
Figure 1.4. The emerging economies exhibited more
sustainable growth rates after a V-shaped recoveryReal GDP quarter-on-quarter growth, sa, percent
Source: Haver and World Bank staff calculations.
unemployment and dampened sentiment from the imposition of fiscal austerity measures. In Japan,prior to the recent calamity, growth experienced a robust rebound at 3.9 percent for 2010. Thegenerally improving global environment helped stimulate Japanese exports and industrial production.
The emerging economies, in contrast, experienced some moderation of growth. This has reflected atransition towards a more sustainable pace after the sharp, V-shaped, post-crisis recovery (Figure 1.4).East Asia and Pacific region grew 9.2 percent in 2010. China grew by 10.3 percent, outpacing Japan to
become the world’s second largest economy after the U.S. This robustness was mainly private sector-led. Indeed, domestic demand remained resilient in spite of weaker external demand in the second half-year. This resumption and entrenched strength of private sector activity has allowed for the beginning of macroeconomic policy normalization. Yet, authorities have moved only gradually in withdrawingmonetary and fiscal accommodation. Such gradualism has reflected the caution amidst concerns on,initially, the durability of global expansion and, later, the mounting challenges arising from capitalinflows and inflationary pressures.
90
95
100
105
110
115
2008 Q1 Q3 2009 Q1 Q3 2010 Q1 Q3
USEuro AreaJapanASEAN-4*
0
2
4
6
8
10
12
14
16
-10
-5
0
5
10
15
20
25
2007Q1
Q3 2008Q1
Q3 2009Q1
Q3 2010Q1
Q3
SingaporeThailandIndonesia (RHS)China (RHS)
-6
-5
-4
-3
-2
-1
0
1
2
3
2008 Q1 Q3 2009 Q1 Q3 2010 Q1 Q3
Other euro*
PIGS
Italy
France
Germany
GDP (y-o-y)
-8
-6
-4
-2
0
2
4
6
2009Q1
Q2 Q3 Q4 2010Q1
Q2 Q3 Q4
GovernmentPrivate ConsumptionFixed InvestmentChange in stocksNet ExportsGDP (Annualised)
8/6/2019 World Bank Economic Monitor - Malaysia Brain Drain (April 2011)
http://slidepdf.com/reader/full/world-bank-economic-monitor-malaysia-brain-drain-april-2011 19/150
8/6/2019 World Bank Economic Monitor - Malaysia Brain Drain (April 2011)
http://slidepdf.com/reader/full/world-bank-economic-monitor-malaysia-brain-drain-april-2011 20/150
MALAYSIA ECONOMIC MONITOR
20
STRONG RECOVERY IN MALAYSIA, BUT MOMENTUM VOLATILE
The Malaysian economy registered strong growth over the course of 2010. Heavily reliant on trade,the economy benefited from the turnaround in the external environment. However, following therebound, the momentum of growth seemed to taper off and growth became jittery. Recent indicatorshowever have provided some encouraging signals.
Malaysian Economy Staged a Strong Recovery Over 2010
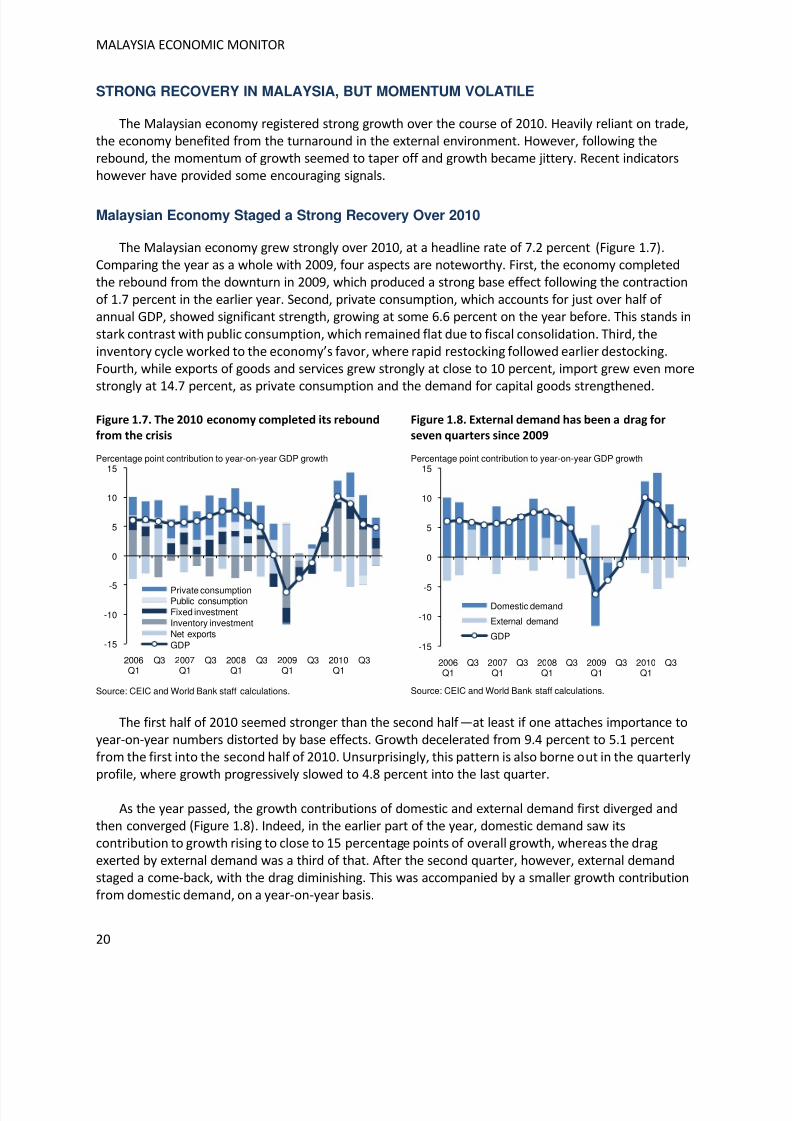
The Malaysian economy grew strongly over 2010, at a headline rate of 7.2 percent (Figure 1.7).Comparing the year as a whole with 2009, four aspects are noteworthy. First, the economy completedthe rebound from the downturn in 2009, which produced a strong base effect following the contractionof 1.7 percent in the earlier year. Second, private consumption, which accounts for just over half of annual GDP, showed significant strength, growing at some 6.6 percent on the year before. This stands in
stark contrast with public consumption, which remained flat due to fiscal consolidation. Third, theinventory cycle worked to the economy’s favor, where rapid restocking followed earlier destocking.Fourth, while exports of goods and services grew strongly at close to 10 percent, import grew even more
strongly at 14.7 percent, as private consumption and the demand for capital goods strengthened.
Figure 1.7. The 2010 economy completed its rebound
from the crisis
Percentage point contribution to year-on-year GDP growth
Source: CEIC and World Bank staff calculations.
Figure 1.8. External demand has been a drag for
seven quarters since 2009
Percentage point contribution to year-on-year GDP growth
Source: CEIC and World Bank staff calculations.
The first half of 2010 seemed stronger than the second half —at least if one attaches importance toyear-on-year numbers distorted by base effects. Growth decelerated from 9.4 percent to 5.1 percentfrom the first into the second half of 2010. Unsurprisingly, this pattern is also borne out in the quarterlyprofile, where growth progressively slowed to 4.8 percent into the last quarter.
As the year passed, the growth contributions of domestic and external demand first diverged andthen converged (Figure 1.8). Indeed, in the earlier part of the year, domestic demand saw itscontribution to growth rising to close to 15 percentage points of overall growth, whereas the dragexerted by external demand was a third of that. After the second quarter, however, external demandstaged a come-back, with the drag diminishing. This was accompanied by a smaller growth contributionfrom domestic demand, on a year-on-year basis.
-15
-10
-5
0
5
10
15
2006Q1
Q3 2007Q1
Q3 2008Q1
Q3 2009Q1
Q3 2010Q1
Q3
Private consumptionPublic consumptionFixed investmentInventory investmentNet exportsGDP -15
-10
-5
0
5
10
15
2006Q1
Q3 2007Q1
Q3 2008Q1
Q3 2009Q1
Q3 2010Q1
Q3
Domestic demand
External demand
GDP
8/6/2019 World Bank Economic Monitor - Malaysia Brain Drain (April 2011)
http://slidepdf.com/reader/full/world-bank-economic-monitor-malaysia-brain-drain-april-2011 21/150
RECENT ECONOMIC DEVELOPMENTS
21
Figure 1.9. Expenditure components saw divergent
patterns during the last two quarters of 2010
Percentage point contribution to GDP growth, qoq, sa
Source: Haver and World Bank staff calculations.
Figure 1.10. External demand picked up recently,
with domestic demand flat
Percentage point contributions to GDP growth, qoq, sa
Source: Haver and World Bank staff calculations.
Following Rebound, Growth Became Jittery
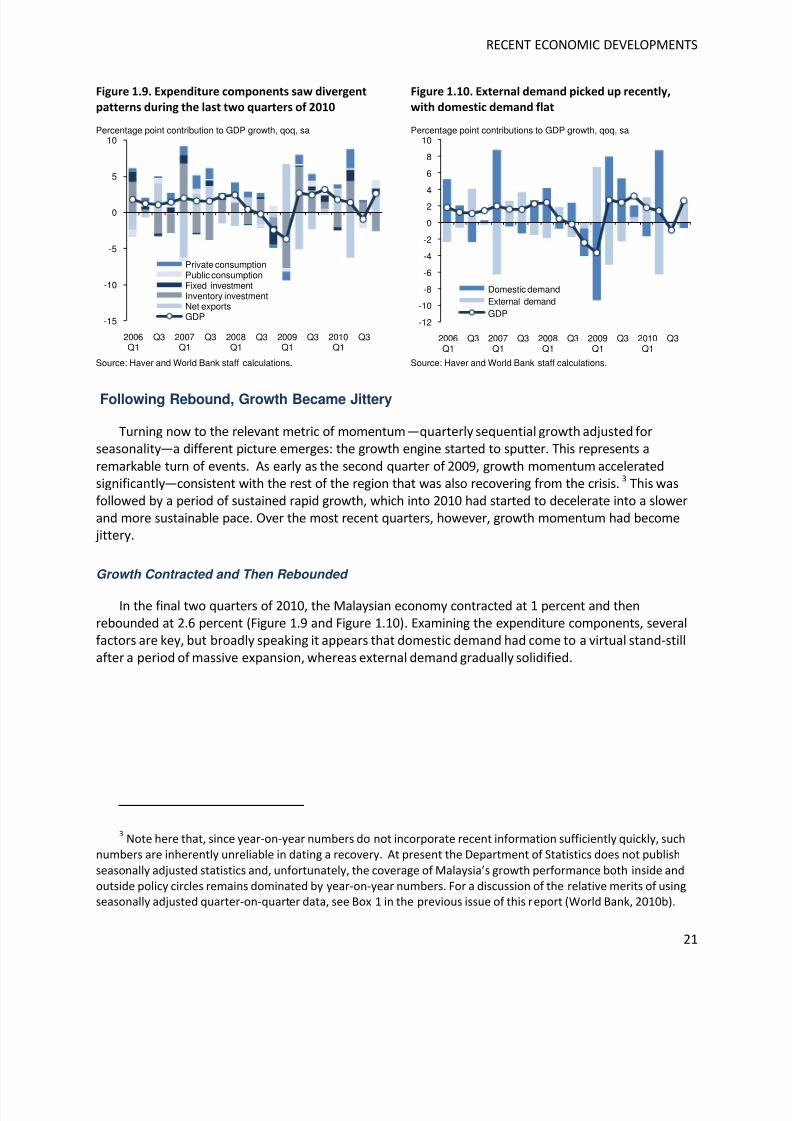
Turning now to the relevant metric of momentum—quarterly sequential growth adjusted forseasonality—a different picture emerges: the growth engine started to sputter. This represents a
remarkable turn of events. As early as the second quarter of 2009, growth momentum acceleratedsignificantly—consistent with the rest of the region that was also recovering from the crisis. 3 This wasfollowed by a period of sustained rapid growth, which into 2010 had started to decelerate into a slowerand more sustainable pace. Over the most recent quarters, however, growth momentum had become
jittery.
Growth Contracted and Then Rebounded
In the final two quarters of 2010, the Malaysian economy contracted at 1 percent and thenrebounded at 2.6 percent (Figure 1.9 and Figure 1.10). Examining the expenditure components, severalfactors are key, but broadly speaking it appears that domestic demand had come to a virtual stand-stillafter a period of massive expansion, whereas external demand gradually solidified.
3Note here that, since year-on-year numbers do not incorporate recent information sufficiently quickly, such
numbers are inherently unreliable in dating a recovery. At present the Department of Statistics does not publish
seasonally adjusted statistics and, unfortunately, the coverage of Malaysia’s growth performance both inside and
outside policy circles remains dominated by year-on-year numbers. For a discussion of the relative merits of usingseasonally adjusted quarter-on-quarter data, see Box 1 in the previous issue of this report (World Bank, 2010b).
-15
-10
-5
0
5
10
2006Q1
Q3 2007Q1
Q3 2008Q1
Q3 2009Q1
Q3 2010Q1
Q3
Private consumptionPublic consumptionFixed investmentInventory investmentNet exportsGDP
-12
-10
-8
-6
-4
-2
0
2
4
6
8
10
2006Q1
Q3 2007Q1
Q3 2008Q1
Q3 2009Q1
Q3 2010Q1
Q3
Domestic demandExternal demandGDP
8/6/2019 World Bank Economic Monitor - Malaysia Brain Drain (April 2011)
http://slidepdf.com/reader/full/world-bank-economic-monitor-malaysia-brain-drain-april-2011 22/150
MALAYSIA ECONOMIC MONITOR
22
Figure 1.11. Private consumption stayed flat, with
public consumption initially falling and then rising
Percentage point contribution to GDP growth, qoq, sa
Source: Haver and World Bank staff calculations.
Figure 1.12. Fixed investment rose recently, with
inventory stocks declining as exports picked up
Percentage point contributions to GDP growth, qoq, sa
Source: Haver and World Bank staff calculations.
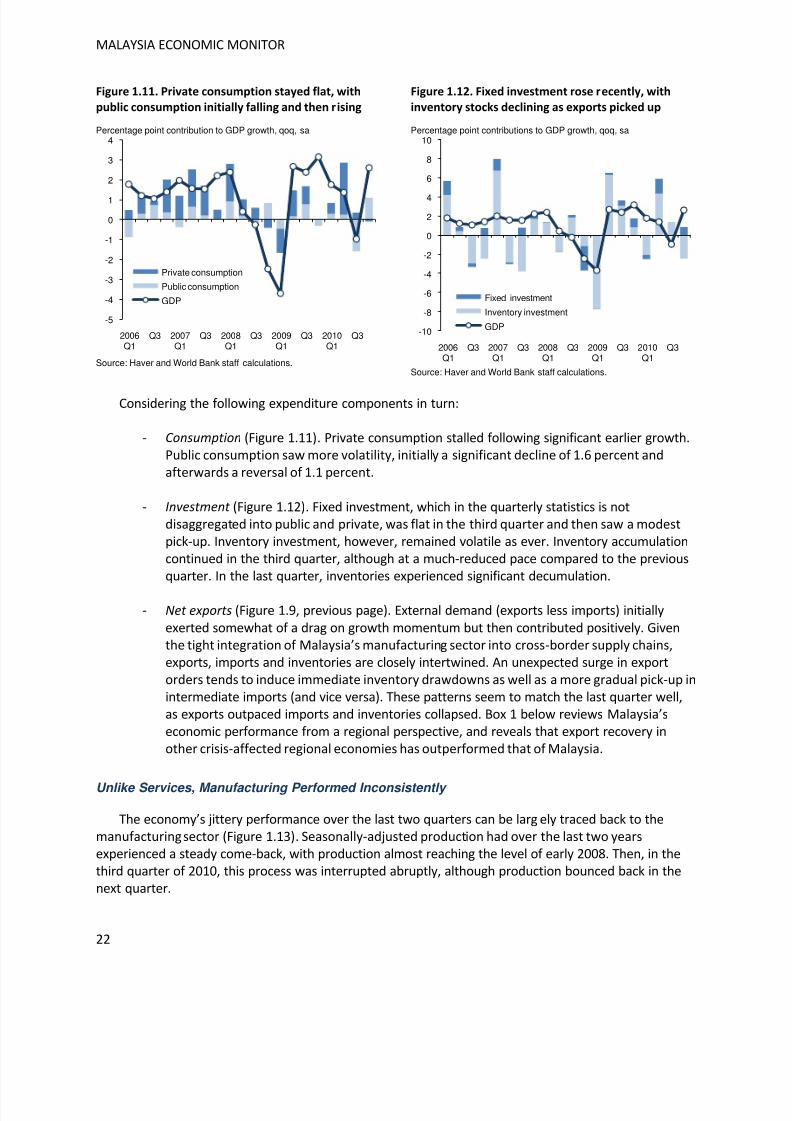
Considering the following expenditure components in turn:
- Consumption (Figure 1.11). Private consumption stalled following significant earlier growth.Public consumption saw more volatility, initially a significant decline of 1.6 percent andafterwards a reversal of 1.1 percent.
- Investment (Figure 1.12). Fixed investment, which in the quarterly statistics is notdisaggregated into public and private, was flat in the third quarter and then saw a modestpick-up. Inventory investment, however, remained volatile as ever. Inventory accumulationcontinued in the third quarter, although at a much-reduced pace compared to the previousquarter. In the last quarter, inventories experienced significant decumulation.
- Net exports (Figure 1.9, previous page). External demand (exports less imports) initially
exerted somewhat of a drag on growth momentum but then contributed positively. Giventhe tight integration of Malaysia’s manufacturing sector into cross-border supply chains,exports, imports and inventories are closely intertwined. An unexpected surge in exportorders tends to induce immediate inventory drawdowns as well as a more gradual pick-up inintermediate imports (and vice versa). These patterns seem to match the last quarter well,as exports outpaced imports and inventories collapsed. Box 1 below reviews Malaysia’seconomic performance from a regional perspective, and reveals that export recovery inother crisis-affected regional economies has outperformed that of Malaysia.
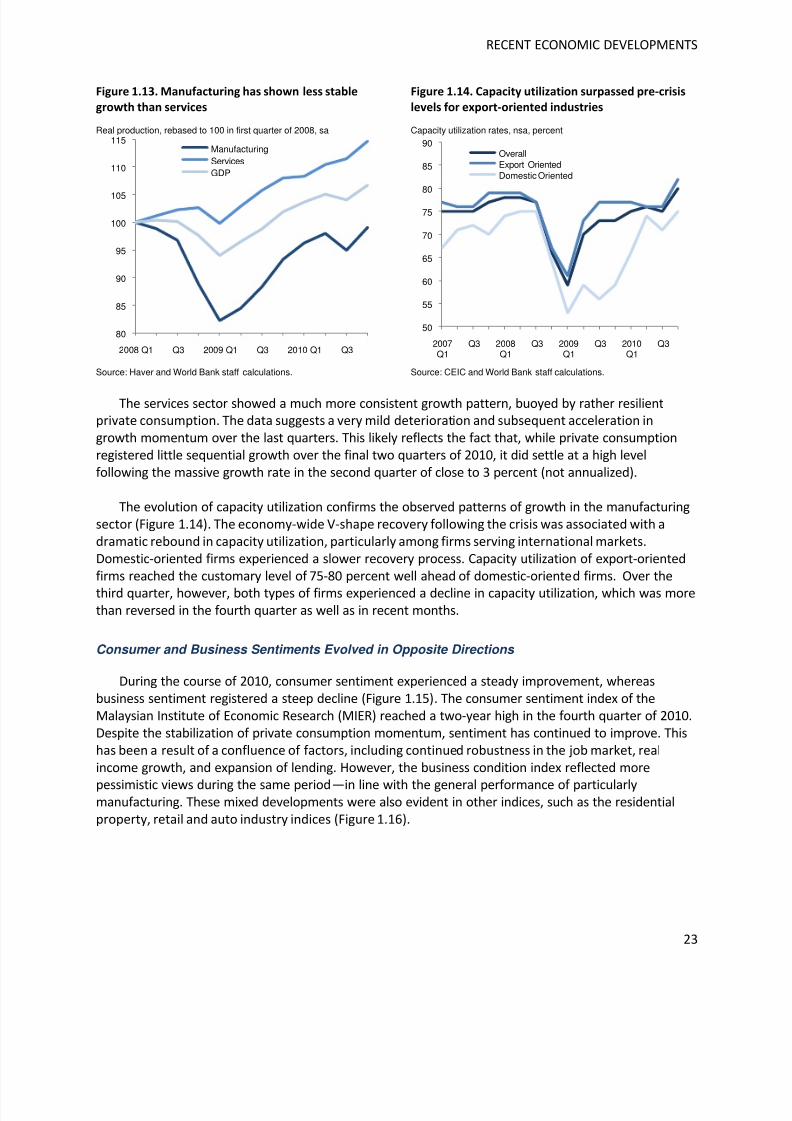
Unlike Services, Manufacturing Performed Inconsistently
The economy’s jittery performance over the last two quarters can be largely traced back to themanufacturing sector (Figure 1.13). Seasonally-adjusted production had over the last two yearsexperienced a steady come-back, with production almost reaching the level of early 2008. Then, in thethird quarter of 2010, this process was interrupted abruptly, although production bounced back in thenext quarter.
-5
-4
-3
-2
-1
0
1
2
3
4
2006Q1
Q3 2007Q1
Q3 2008Q1
Q3 2009Q1
Q3 2010Q1
Q3
Private consumption
Public consumption
GDP
-10
-8
-6
-4
-2
0
2
4
6
8
10
2006Q1
Q3 2007Q1
Q3 2008Q1
Q3 2009Q1
Q3 2010Q1
Q3
Fixed investment
Inventory investment
GDP
8/6/2019 World Bank Economic Monitor - Malaysia Brain Drain (April 2011)
http://slidepdf.com/reader/full/world-bank-economic-monitor-malaysia-brain-drain-april-2011 23/150
RECENT ECONOMIC DEVELOPMENTS
23
Figure 1.13. Manufacturing has shown less stable
growth than services
Real production, rebased to 100 in first quarter of 2008, sa
Source: Haver and World Bank staff calculations.
Figure 1.14. Capacity utilization surpassed pre-crisis
levels for export-oriented industries
Capacity utilization rates, nsa, percent
Source: CEIC and World Bank staff calculations.
The services sector showed a much more consistent growth pattern, buoyed by rather resilientprivate consumption. The data suggests a very mild deterioration and subsequent acceleration ingrowth momentum over the last quarters. This likely reflects the fact that, while private consumptionregistered little sequential growth over the final two quarters of 2010, it did settle at a high levelfollowing the massive growth rate in the second quarter of close to 3 percent (not annualized).
The evolution of capacity utilization confirms the observed patterns of growth in the manufacturingsector (Figure 1.14). The economy-wide V-shape recovery following the crisis was associated with adramatic rebound in capacity utilization, particularly among firms serving international markets.Domestic-oriented firms experienced a slower recovery process. Capacity utilization of export-orientedfirms reached the customary level of 75-80 percent well ahead of domestic-oriented firms. Over the
third quarter, however, both types of firms experienced a decline in capacity utilization, which was morethan reversed in the fourth quarter as well as in recent months.
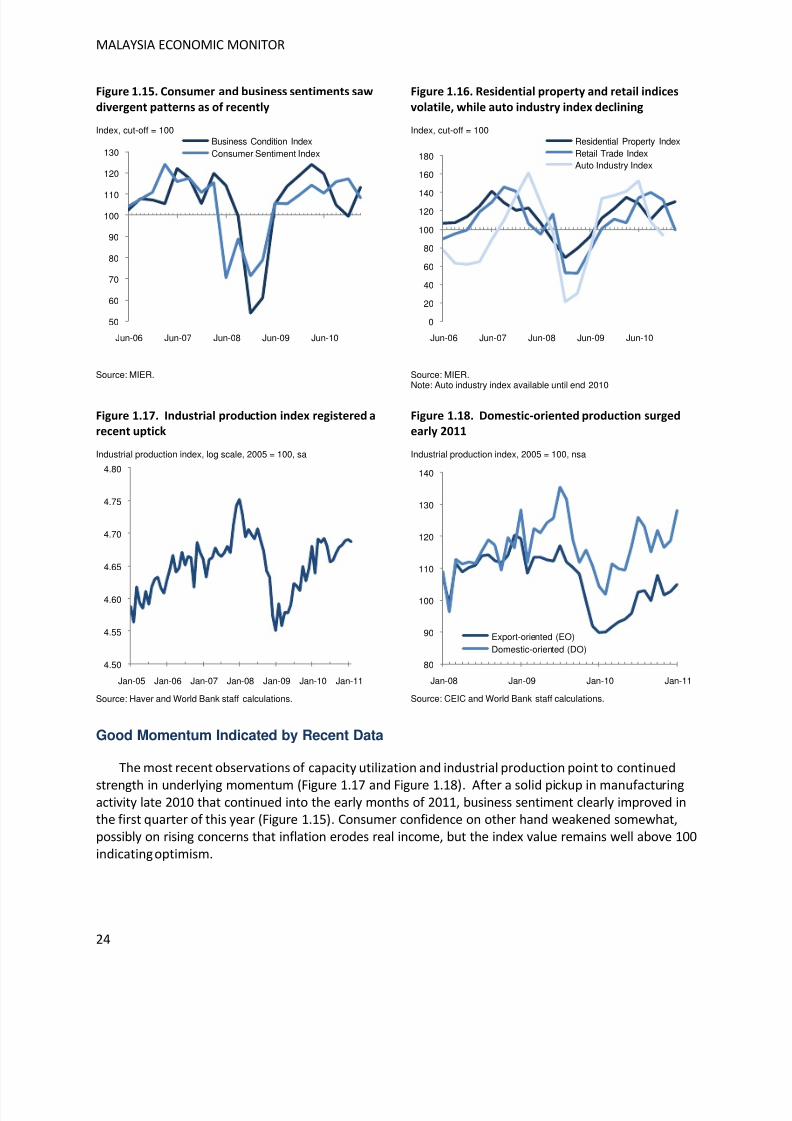
Consumer and Business Sentiments Evolved in Opposite Directions
During the course of 2010, consumer sentiment experienced a steady improvement, whereasbusiness sentiment registered a steep decline (Figure 1.15). The consumer sentiment index of theMalaysian Institute of Economic Research (MIER) reached a two-year high in the fourth quarter of 2010.Despite the stabilization of private consumption momentum, sentiment has continued to improve. Thishas been a result of a confluence of factors, including continued robustness in the job market, realincome growth, and expansion of lending. However, the business condition index reflected more
pessimistic views during the same period—in line with the general performance of particularlymanufacturing. These mixed developments were also evident in other indices, such as the residentialproperty, retail and auto industry indices (Figure 1.16).
80
85
90
95
100
105
110
115
2008 Q1 Q3 2009 Q1 Q3 2010 Q1 Q3
ManufacturingServicesGDP
50
55
60
65
70
75
80
85
90
2007Q1
Q3 2008Q1
Q3 2009Q1
Q3 2010Q1
Q3
OverallExport OrientedDomestic Oriented
8/6/2019 World Bank Economic Monitor - Malaysia Brain Drain (April 2011)
http://slidepdf.com/reader/full/world-bank-economic-monitor-malaysia-brain-drain-april-2011 24/150
MALAYSIA ECONOMIC MONITOR
24
Figure 1.15. Consumer and business sentiments saw
divergent patterns as of recently
Index, cut-off = 100
Source: MIER.
Figure 1.16. Residential property and retail indices
volatile, while auto industry index declining
Index, cut-off = 100
Source: MIER.Note: Auto industry index available until end 2010
Figure 1.17. Industrial production index registered a
recent uptick
Industrial production index, log scale, 2005 = 100, sa
Source: Haver and World Bank staff calculations.
Figure 1.18. Domestic-oriented production surged
early 2011
Industrial production index, 2005 = 100, nsa
Source: CEIC and World Bank staff calculations.
Good Momentum Indicated by Recent Data
The most recent observations of capacity utilization and industrial production point to continued
strength in underlying momentum (Figure 1.17 and Figure 1.18). After a solid pickup in manufacturingactivity late 2010 that continued into the early months of 2011, business sentiment clearly improved inthe first quarter of this year (Figure 1.15). Consumer confidence on other hand weakened somewhat,possibly on rising concerns that inflation erodes real income, but the index value remains well above 100indicating optimism.
50
60
70
80
90
100
110
120
130
Jun-06 Jun-07 Jun-08 Jun-09 Jun-10
Business Condition IndexConsumer Sentiment Index
0
20
40
60
80
100
120140
160
180
Jun-06 Jun-07 Jun-08 Jun-09 Jun-10
Residential Property IndexRetail Trade IndexAuto Industry Index
4.50
4.55
4.60
4.65
4.70
4.75
4.80
Jan-05 Jan-06 Jan-07 Jan-08 Jan-09 Jan-10 Jan-11
80
90
100
110
120
130
140
Jan-08 Jan-09 Jan-10 Jan-11
Export-oriented (EO)Domestic-oriented (DO)
8/6/2019 World Bank Economic Monitor - Malaysia Brain Drain (April 2011)
http://slidepdf.com/reader/full/world-bank-economic-monitor-malaysia-brain-drain-april-2011 25/150
RECENT ECONOMIC DEVELOPMENTS
25
Following a strong and continuous recovery, industrial production registered significant volatilityduring most of 2010 and remained below pre-crisis heights. The most recent data points are positive,particularly for domestic-oriented industries which were buoyed by domestic consumption and a goodperformance in the construction sector. An improvement in manufacturing activities in February 2011was in line with stronger-than-expected electronics shipments.
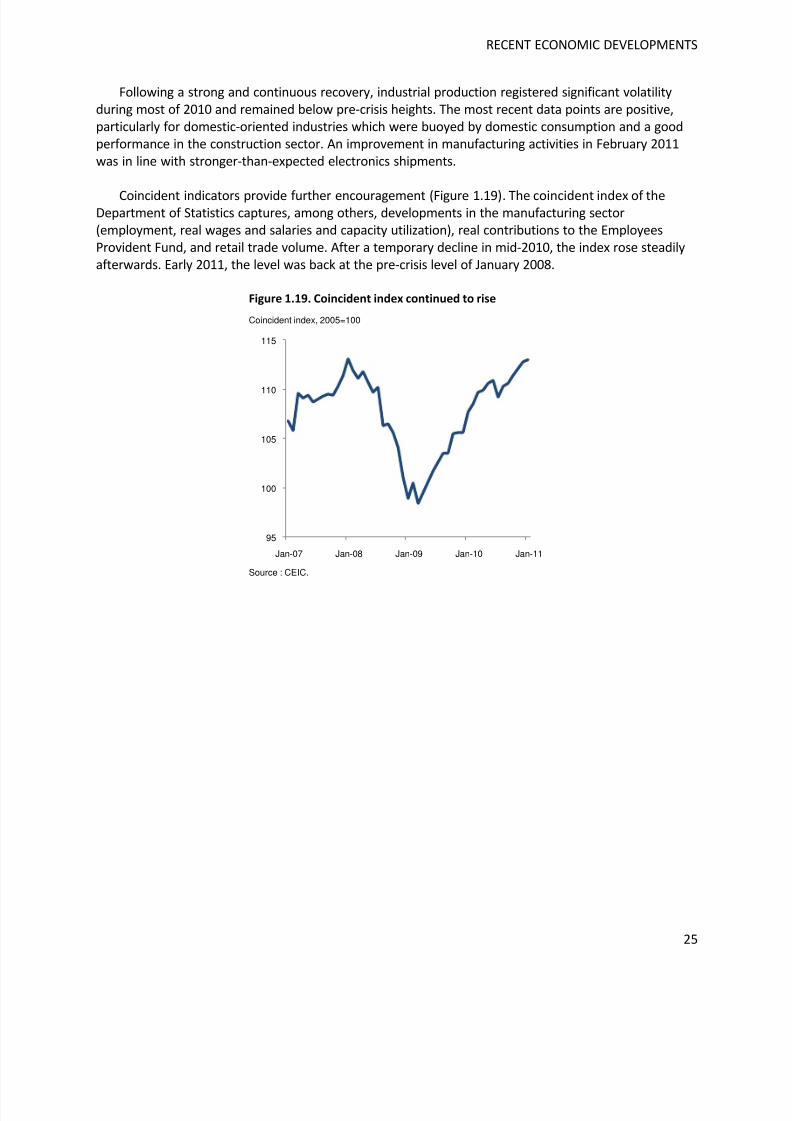
Coincident indicators provide further encouragement (Figure 1.19). The coincident index of theDepartment of Statistics captures, among others, developments in the manufacturing sector(employment, real wages and salaries and capacity utilization), real contributions to the EmployeesProvident Fund, and retail trade volume. After a temporary decline in mid-2010, the index rose steadilyafterwards. Early 2011, the level was back at the pre-crisis level of January 2008.
Figure 1.19. Coincident index continued to rise
Coincident index, 2005=100
Source : CEIC.
95
100
105
110
115
Jan-07 Jan-08 Jan-09 Jan-10 Jan-11
8/6/2019 World Bank Economic Monitor - Malaysia Brain Drain (April 2011)
http://slidepdf.com/reader/full/world-bank-economic-monitor-malaysia-brain-drain-april-2011 26/150
MALAYSIA ECONOMIC MONITOR
26
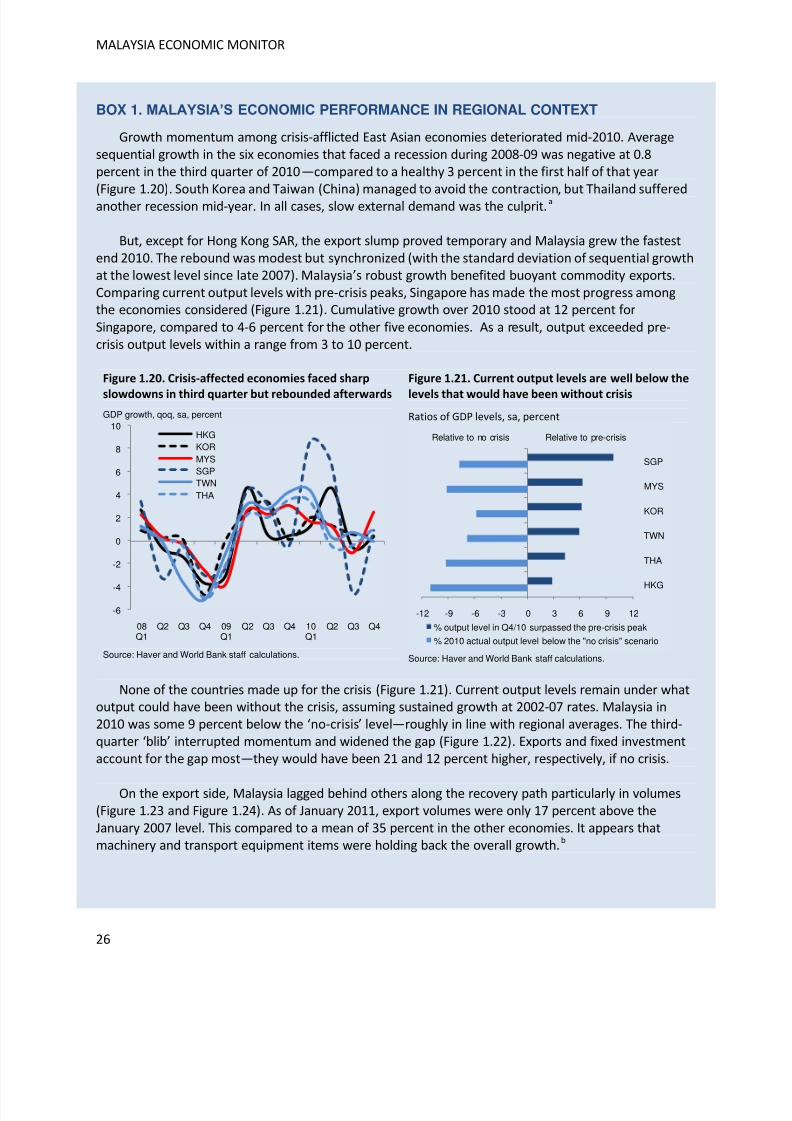
BOX 1. MALAYSIA’S ECONOMIC PERFORMANCE IN REGIONAL CONTEXT
Growth momentum among crisis-afflicted East Asian economies deteriorated mid-2010. Averagesequential growth in the six economies that faced a recession during 2008-09 was negative at 0.8percent in the third quarter of 2010—compared to a healthy 3 percent in the first half of that year(Figure 1.20). South Korea and Taiwan (China) managed to avoid the contraction, but Thailand sufferedanother recession mid-year. In all cases, slow external demand was the culprit.a
But, except for Hong Kong SAR, the export slump proved temporary and Malaysia grew the fastestend 2010. The rebound was modest but synchronized (with the standard deviation of sequential growthat the lowest level since late 2007). Malaysia’s robust growth benefited buoyant commodity exports.Comparing current output levels with pre-crisis peaks, Singapore has made the most progress amongthe economies considered (Figure 1.21). Cumulative growth over 2010 stood at 12 percent for
Singapore, compared to 4-6 percent for the other five economies. As a result, output exceeded pre-crisis output levels within a range from 3 to 10 percent.
Figure 1.20. Crisis-affected economies faced sharp
slowdowns in third quarter but rebounded afterwards
GDP growth, qoq, sa, percent
Source: Haver and World Bank staff calculations.
Figure 1.21. Current output levels are well below the
levels that would have been without crisis
Ratios of GDP levels, sa, percent
Source: Haver and World Bank staff calculations.
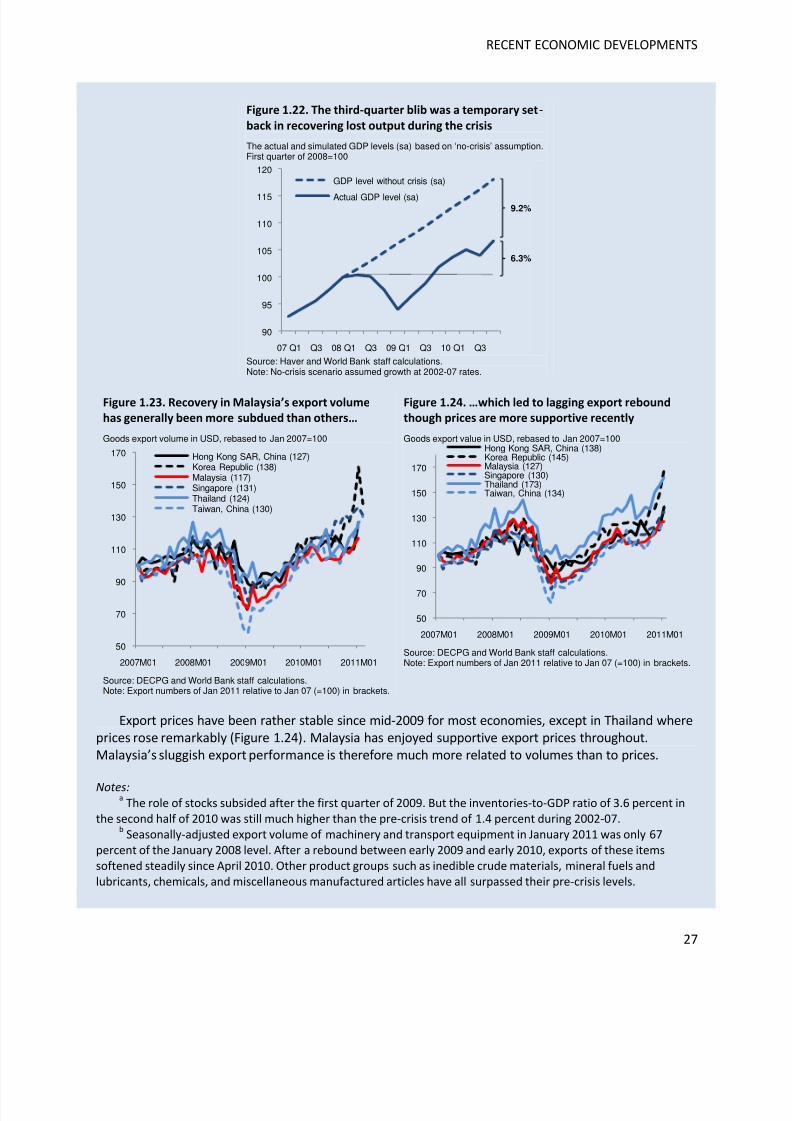
None of the countries made up for the crisis (Figure 1.21). Current output levels remain under whatoutput could have been without the crisis, assuming sustained growth at 2002-07 rates. Malaysia in2010 was some 9 percent below the ‘no-crisis’ level—roughly in line with regional averages. The third-quarter ‘blib’ interrupted momentum and widened the gap (Figure 1.22). Exports and fixed investmentaccount for the gap most—they would have been 21 and 12 percent higher, respectively, if no crisis.
On the export side, Malaysia lagged behind others along the recovery path particularly in volumes(Figure 1.23 and Figure 1.24). As of January 2011, export volumes were only 17 percent above theJanuary 2007 level. This compared to a mean of 35 percent in the other economies. It appears thatmachinery and transport equipment items were holding back the overall growth.b
-6
-4
-2
0
2
4
6
8
10
08Q1
Q2 Q3 Q4 09Q1
Q2 Q3 Q4 10Q1
Q2 Q3 Q4
HKGKORMYSSGPTWNTHA
-12 -9 -6 -3 0 3 6 9 12
HKG
THA
TWN
KOR
MYS
SGP
% output level in Q4/10 surpassed the pre-crisis peak
% 2010 actual output level below the "no crisis" scenario
Relative to no crisis Relative to pre-crisis
8/6/2019 World Bank Economic Monitor - Malaysia Brain Drain (April 2011)
http://slidepdf.com/reader/full/world-bank-economic-monitor-malaysia-brain-drain-april-2011 27/150
RECENT ECONOMIC DEVELOPMENTS
27
Figure 1.22. The third-quarter blib was a temporary set-
back in recovering lost output during the crisis
The actual and simulated GDP levels (sa) based on ‘no-crisis’ assumption.First quarter of 2008=100
Source: Haver and World Bank staff calculations.Note: No-crisis scenario assumed growth at 2002-07 rates.
Figure 1.23. Recovery in Malaysia’s export volume
has generally been more subdued than others…
Goods export volume in USD, rebased to Jan 2007=100
Source: DECPG and World Bank staff calculations.Note: Export numbers of Jan 2011 relative to Jan 07 (=100) in brackets.
Figure 1.24. …which led to lagging export rebound
though prices are more supportive recently
Goods export value in USD, rebased to Jan 2007=100
Source: DECPG and World Bank staff calculations.Note: Export numbers of Jan 2011 relative to Jan 07 (=100) in brackets.
Export prices have been rather stable since mid-2009 for most economies, except in Thailand whereprices rose remarkably (Figure 1.24). Malaysia has enjoyed supportive export prices throughout.Malaysia’s sluggish export performance is therefore much more related to volumes than to prices.
Notes:a
The role of stocks subsided after the first quarter of 2009. But the inventories-to-GDP ratio of 3.6 percent in
the second half of 2010 was still much higher than the pre-crisis trend of 1.4 percent during 2002-07.b
Seasonally-adjusted export volume of machinery and transport equipment in January 2011 was only 67
percent of the January 2008 level. After a rebound between early 2009 and early 2010, exports of these items
softened steadily since April 2010. Other product groups such as inedible crude materials, mineral fuels and
lubricants, chemicals, and miscellaneous manufactured articles have all surpassed their pre-crisis levels.
90
95
100
105
110
115
120
07 Q1 Q3 08 Q1 Q3 09 Q1 Q3 10 Q1 Q3
GDP level without crisis (sa)
Actual GDP level (sa)9.2%
6.3%
50
70
90
110
130
150
170
2007M01 2008M01 2009M01 2010M01 2011M01
Hong Kong SAR, China (127)Korea Republic (138)Malaysia (117)Singapore (131)Thailand (124)Taiwan, China (130)
50
70
90
110
130
150
170
2007M01 2008M01 2009M01 2010M01 2011M01
Hong Kong SAR, China (138)Korea Republic (145)Malaysia (127)Singapore (130)Thailand (173)Taiwan, China (134)
8/6/2019 World Bank Economic Monitor - Malaysia Brain Drain (April 2011)
http://slidepdf.com/reader/full/world-bank-economic-monitor-malaysia-brain-drain-april-2011 28/150
MALAYSIA ECONOMIC MONITOR
28
INFLATION STILL BENIGN, BUT PRESSURE IS BUILDING
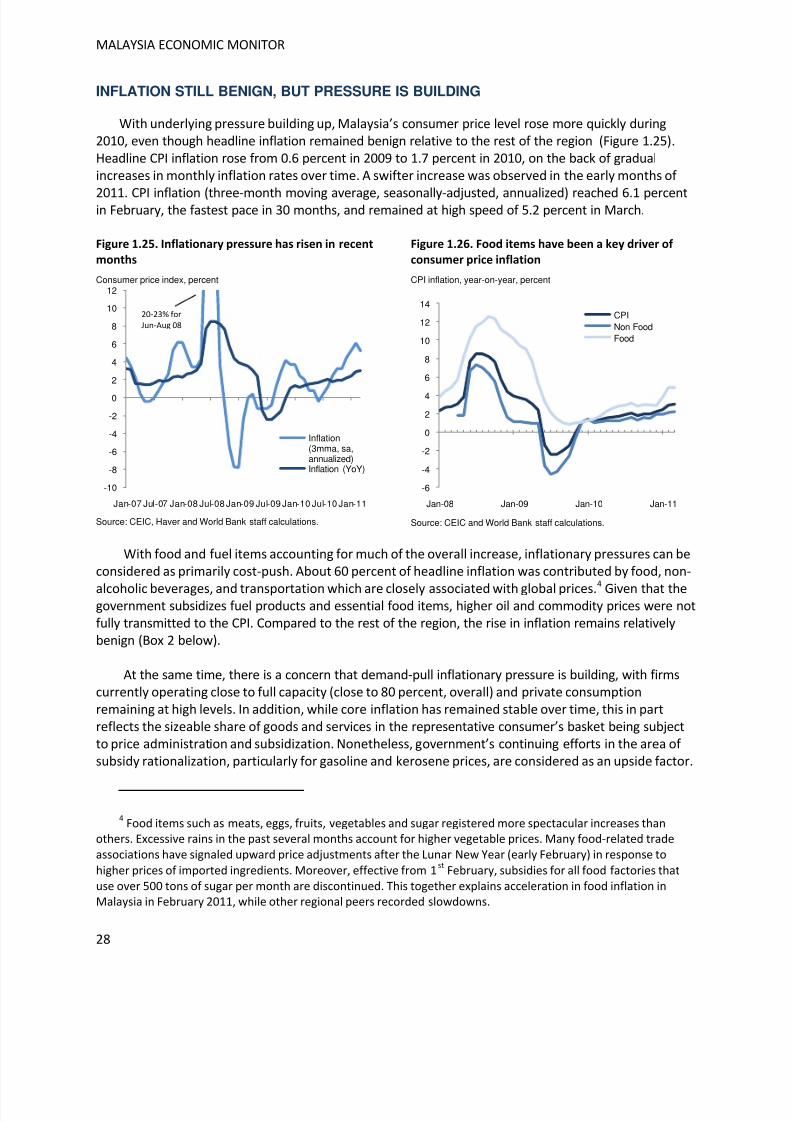
With underlying pressure building up, Malaysia’s consumer price level rose more quickly during2010, even though headline inflation remained benign relative to the rest of the region (Figure 1.25).Headline CPI inflation rose from 0.6 percent in 2009 to 1.7 percent in 2010, on the back of gradualincreases in monthly inflation rates over time. A swifter increase was observed in the early months of
2011. CPI inflation (three-month moving average, seasonally-adjusted, annualized) reached 6.1 percentin February, the fastest pace in 30 months, and remained at high speed of 5.2 percent in March.
Figure 1.25. Inflationary pressure has risen in recent
months
Consumer price index, percent
Source: CEIC, Haver and World Bank staff calculations.
Figure 1.26. Food items have been a key driver of
consumer price inflation
CPI inflation, year-on-year, percent
Source: CEIC and World Bank staff calculations.
With food and fuel items accounting for much of the overall increase, inflationary pressures can beconsidered as primarily cost-push. About 60 percent of headline inflation was contributed by food, non-
alcoholic beverages, and transportation which are closely associated with global prices.4
Given that thegovernment subsidizes fuel products and essential food items, higher oil and commodity prices were notfully transmitted to the CPI. Compared to the rest of the region, the rise in inflation remains relativelybenign (Box 2 below).
At the same time, there is a concern that demand-pull inflationary pressure is building, with firmscurrently operating close to full capacity (close to 80 percent, overall) and private consumptionremaining at high levels. In addition, while core inflation has remained stable over time, this in partreflects the sizeable share of goods and services in the representative consumer’s basket being subjectto price administration and subsidization. Nonetheless, government’s continuing efforts in the area of subsidy rationalization, particularly for gasoline and kerosene prices, are considered as an upside factor.
4Food items such as meats, eggs, fruits, vegetables and sugar registered more spectacular increases than
others. Excessive rains in the past several months account for higher vegetable prices. Many food-related trade
associations have signaled upward price adjustments after the Lunar New Year (early February) in response to
higher prices of imported ingredients. Moreover, effective from 1st
February, subsidies for all food factories that
use over 500 tons of sugar per month are discontinued. This together explains acceleration in food inflation inMalaysia in February 2011, while other regional peers recorded slowdowns.
-10
-8
-6
-4
-2
0
2
4
6
8
10
12
Jan-07 Jul-07 Jan-08 Jul-08 Jan-09 Jul-09 Jan-10 Jul-10 Jan-11
Inflation(3mma, sa,annualized)Inflation (YoY)
20-23% for
Jun-Aug 08
-6
-4
-2
0
2
4
6
8
10
12
14
Jan-08 Jan-09 Jan-10 Jan-11
CPINon FoodFood
8/6/2019 World Bank Economic Monitor - Malaysia Brain Drain (April 2011)
http://slidepdf.com/reader/full/world-bank-economic-monitor-malaysia-brain-drain-april-2011 29/150
RECENT ECONOMIC DEVELOPMENTS
29
Figure 1.27. Producer price inflation substantially
exceeds consumer price inflation
Index rebased to 100 in Jan 05 for PPI and Jan 10 for CPI, log scale, sa
Source: CEIC and World Bank staff calculations.
Figure 1.28. Higher global commodity prices pulled
up producer prices
Index rebased to 100 in January 2007, sa
Source: CEIC and World Bank staff calculations.
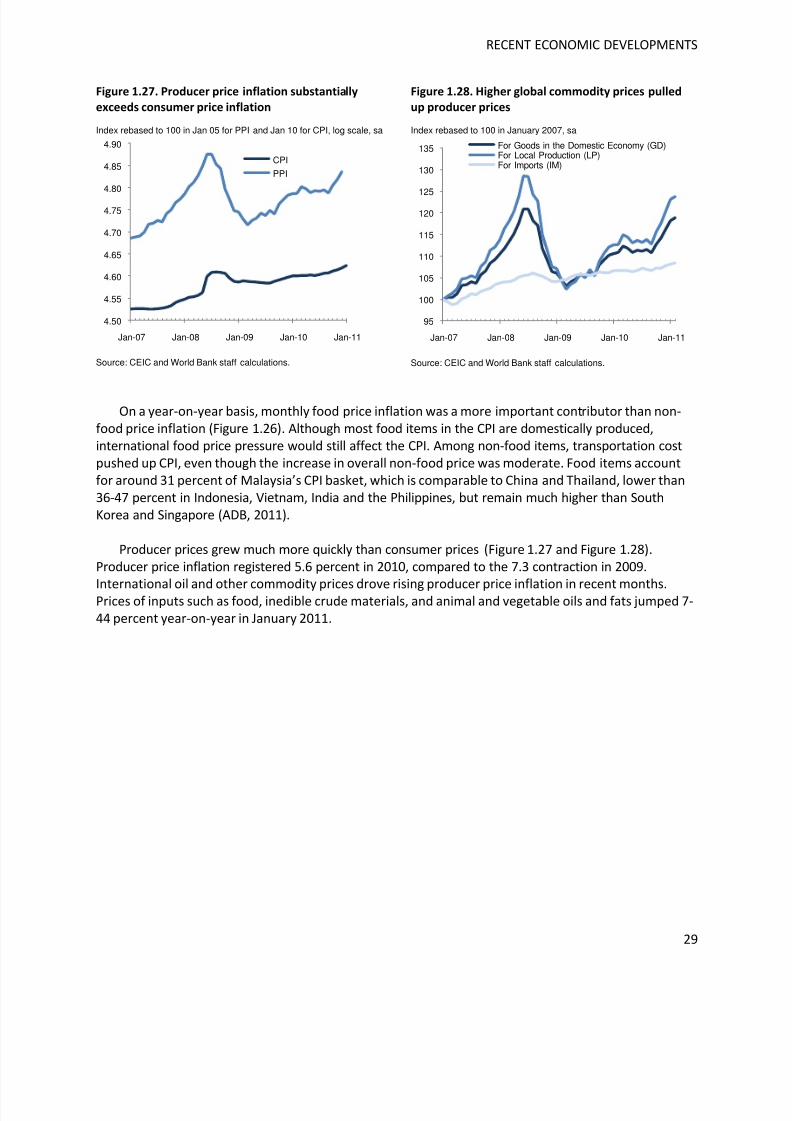
On a year-on-year basis, monthly food price inflation was a more important contributor than non-food price inflation (Figure 1.26). Although most food items in the CPI are domestically produced,international food price pressure would still affect the CPI. Among non-food items, transportation costpushed up CPI, even though the increase in overall non-food price was moderate. Food items accountfor around 31 percent of Malaysia’s CPI basket, which is comparable to China and Thailand, lower than36-47 percent in Indonesia, Vietnam, India and the Philippines, but remain much higher than SouthKorea and Singapore (ADB, 2011).
Producer prices grew much more quickly than consumer prices (Figure 1.27 and Figure 1.28).Producer price inflation registered 5.6 percent in 2010, compared to the 7.3 contraction in 2009.
International oil and other commodity prices drove rising producer price inflation in recent months.Prices of inputs such as food, inedible crude materials, and animal and vegetable oils and fats jumped 7-44 percent year-on-year in January 2011.
4.50
4.55
4.60
4.65
4.70
4.75
4.80
4.85
4.90
Jan-07 Jan-08 Jan-09 Jan-10 Jan-11
CPI
PPI
95
100
105
110
115
120125
130
135
Jan-07 Jan-08 Jan-09 Jan-10 Jan-11
For Goods in the Domestic Economy (GD)For Local Production (LP)For Imports (IM)
8/6/2019 World Bank Economic Monitor - Malaysia Brain Drain (April 2011)
http://slidepdf.com/reader/full/world-bank-economic-monitor-malaysia-brain-drain-april-2011 30/150
MALAYSIA ECONOMIC MONITOR
30
BOX 2. HOW DO PRICE DEVELOPMENTS COMPARE WITHIN THE REGION?
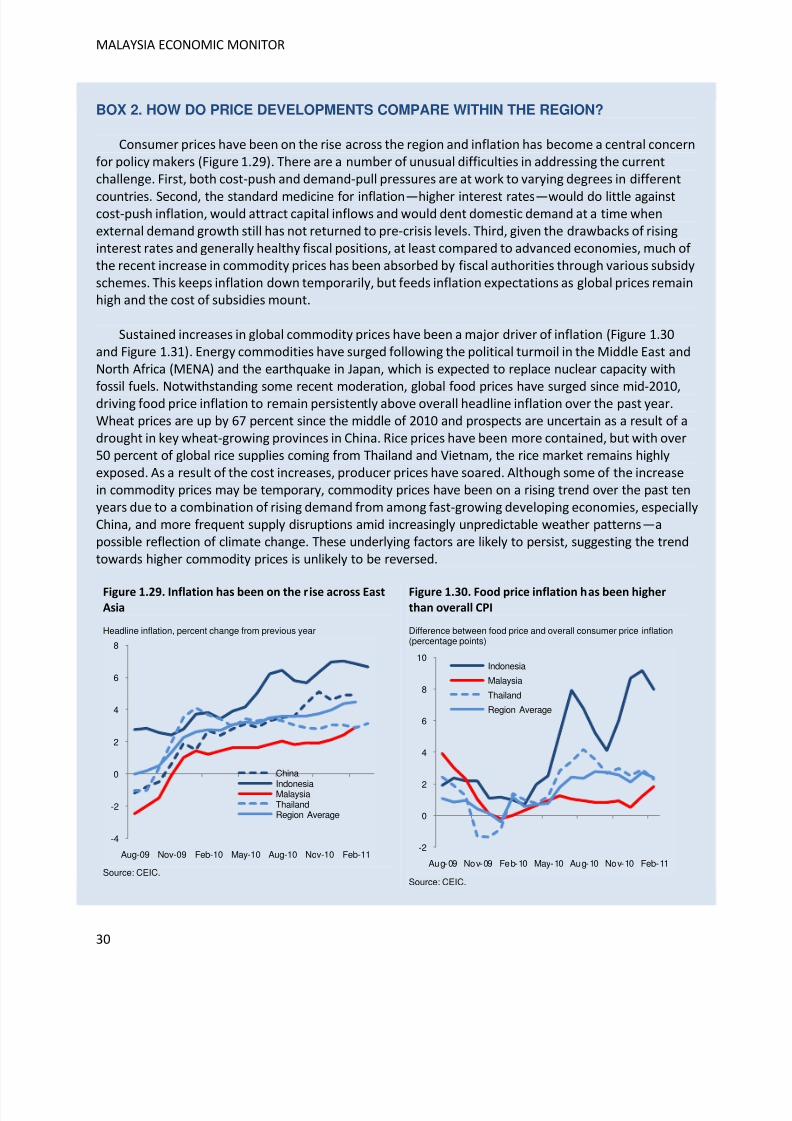
Consumer prices have been on the rise across the region and inflation has become a central concernfor policy makers (Figure 1.29). There are a number of unusual difficulties in addressing the currentchallenge. First, both cost-push and demand-pull pressures are at work to varying degrees in different
countries. Second, the standard medicine for inflation—higher interest rates—would do little againstcost-push inflation, would attract capital inflows and would dent domestic demand at a time whenexternal demand growth still has not returned to pre-crisis levels. Third, given the drawbacks of risinginterest rates and generally healthy fiscal positions, at least compared to advanced economies, much of the recent increase in commodity prices has been absorbed by fiscal authorities through various subsidyschemes. This keeps inflation down temporarily, but feeds inflation expectations as global prices remainhigh and the cost of subsidies mount.
Sustained increases in global commodity prices have been a major driver of inflation (Figure 1.30and Figure 1.31). Energy commodities have surged following the political turmoil in the Middle East andNorth Africa (MENA) and the earthquake in Japan, which is expected to replace nuclear capacity with
fossil fuels. Notwithstanding some recent moderation, global food prices have surged since mid-2010,driving food price inflation to remain persistently above overall headline inflation over the past year.Wheat prices are up by 67 percent since the middle of 2010 and prospects are uncertain as a result of adrought in key wheat-growing provinces in China. Rice prices have been more contained, but with over50 percent of global rice supplies coming from Thailand and Vietnam, the rice market remains highlyexposed. As a result of the cost increases, producer prices have soared. Although some of the increasein commodity prices may be temporary, commodity prices have been on a rising trend over the past tenyears due to a combination of rising demand from among fast-growing developing economies, especiallyChina, and more frequent supply disruptions amid increasingly unpredictable weather patterns—apossible reflection of climate change. These underlying factors are likely to persist, suggesting the trendtowards higher commodity prices is unlikely to be reversed.
Figure 1.29. Inflation has been on the rise across EastAsia
Headline inflation, percent change from previous year
Source: CEIC.
Figure 1.30. Food price inflation has been higherthan overall CPI
Difference between food price and overall consumer price inflation(percentage points)
Source: CEIC.
-4
-2
0
2
4
6
8
Aug-09 Nov-09 Feb-10 May-10 Aug-10 Nov-10 Feb-11
China
IndonesiaMalaysiaThailandRegion Average
-2
0
2
4
6
8
10
Aug-09 Nov-09 Feb-10 May-10 Aug-10 Nov-10 Feb-11
Indonesia
Malaysia
Thailand
Region Average
8/6/2019 World Bank Economic Monitor - Malaysia Brain Drain (April 2011)
http://slidepdf.com/reader/full/world-bank-economic-monitor-malaysia-brain-drain-april-2011 31/150
RECENT ECONOMIC DEVELOPMENTS
31
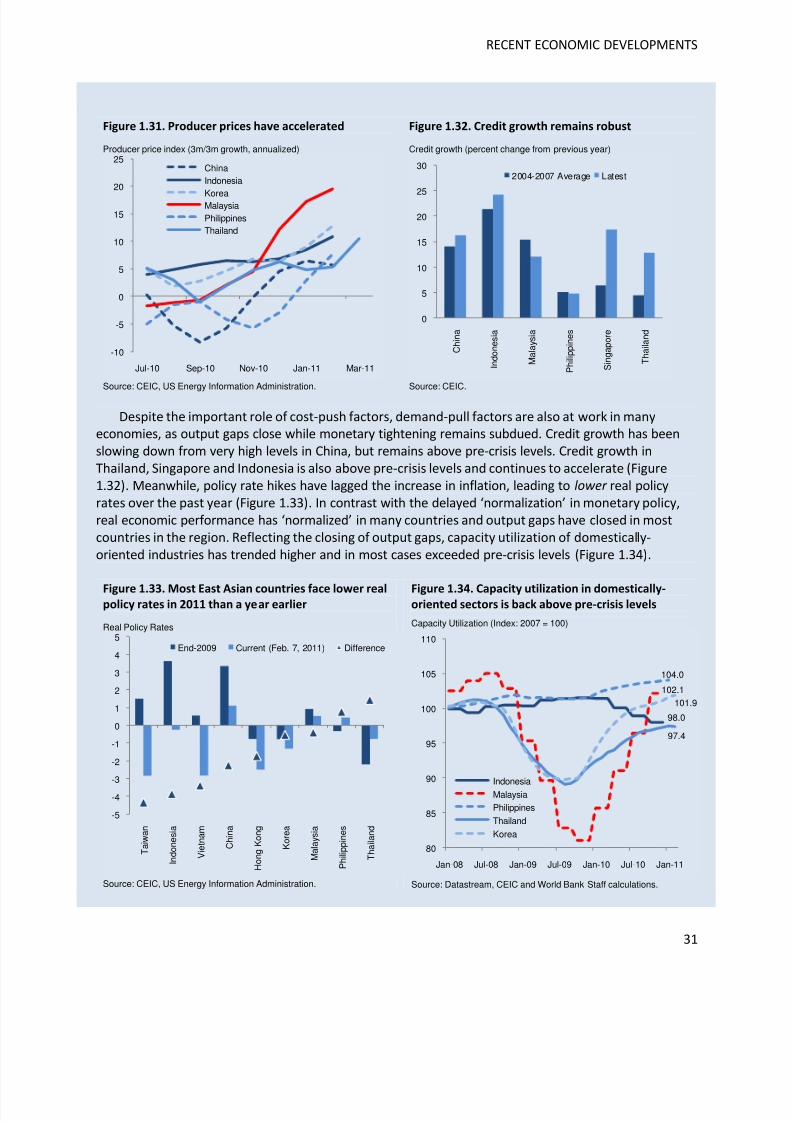
Figure 1.31. Producer prices have accelerated
Producer price index (3m/3m growth, annualized)
Source: CEIC, US Energy Information Administration.
Figure 1.32. Credit growth remains robust
Credit growth (percent change from previous year)
Source: CEIC.
Despite the important role of cost-push factors, demand-pull factors are also at work in manyeconomies, as output gaps close while monetary tightening remains subdued. Credit growth has beenslowing down from very high levels in China, but remains above pre-crisis levels. Credit growth inThailand, Singapore and Indonesia is also above pre-crisis levels and continues to accelerate (Figure1.32). Meanwhile, policy rate hikes have lagged the increase in inflation, leading to lower real policyrates over the past year (Figure 1.33). In contrast with the delayed ‘normalization’ in monetary policy,real economic performance has ‘normalized’ in many countries and output gaps have closed in mostcountries in the region. Reflecting the closing of output gaps, capacity utilization of domestically-oriented industries has trended higher and in most cases exceeded pre-crisis levels (Figure 1.34).
Figure 1.33. Most East Asian countries face lower realpolicy rates in 2011 than a year earlier
Real Policy Rates
Source: CEIC, US Energy Information Administration.
Figure 1.34. Capacity utilization in domestically-oriented sectors is back above pre-crisis levels
Capacity Utilization (Index: 2007 = 100)
Source: Datastream, CEIC and World Bank Staff calculations.
-10
-5
0
5
10
15
20
25
Jul-10 Sep-10 Nov-10 Jan-11 Mar-11
ChinaIndonesia
KoreaMalaysiaPhilippinesThailand
0
5
10
15
20
25
30
C h i n a
I n d o n e s i a
M a l a y s i a
P h i l i p p i n e s
S i n g a p o r e
T h a i l a n d
2004-2007 Average Latest
-5
-4
-3
-2
-1
0
1
2
3
4
5
T a i w a n
I n d o n e s i a
V i e t n a m
C h i n a
H o n g K o n g
K o r e a
M a l a y s i a
P h i l i p p i n e s
T h a i l a n d
End-2009 Current (Feb. 7, 2011) Difference
98.0
102.1
104.0
97.4
101.9
80
85
90
95
100
105
110
Jan-08 Jul-08 Jan-09 Jul-09 Jan-10 Jul-10 Jan-11
IndonesiaMalaysia
Philippines
Thailand
Korea
8/6/2019 World Bank Economic Monitor - Malaysia Brain Drain (April 2011)
http://slidepdf.com/reader/full/world-bank-economic-monitor-malaysia-brain-drain-april-2011 32/150
MALAYSIA ECONOMIC MONITOR
32
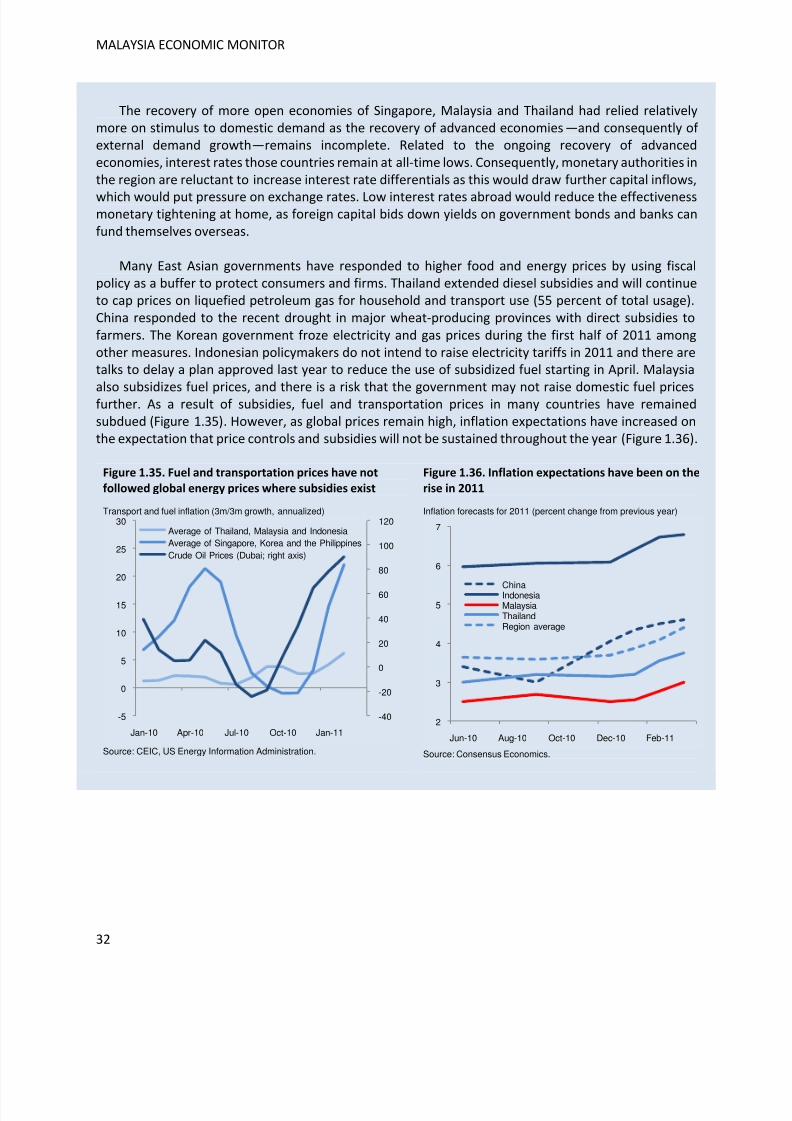
The recovery of more open economies of Singapore, Malaysia and Thailand had relied relativelymore on stimulus to domestic demand as the recovery of advanced economies —and consequently of external demand growth—remains incomplete. Related to the ongoing recovery of advancedeconomies, interest rates those countries remain at all-time lows. Consequently, monetary authorities inthe region are reluctant to increase interest rate differentials as this would draw further capital inflows,
which would put pressure on exchange rates. Low interest rates abroad would reduce the effectivenessmonetary tightening at home, as foreign capital bids down yields on government bonds and banks canfund themselves overseas.
Many East Asian governments have responded to higher food and energy prices by using fiscalpolicy as a buffer to protect consumers and firms. Thailand extended diesel subsidies and will continueto cap prices on liquefied petroleum gas for household and transport use (55 percent of total usage).China responded to the recent drought in major wheat-producing provinces with direct subsidies to
farmers. The Korean government froze electricity and gas prices during the first half of 2011 amongother measures. Indonesian policymakers do not intend to raise electricity tariffs in 2011 and there aretalks to delay a plan approved last year to reduce the use of subsidized fuel starting in April. Malaysia
also subsidizes fuel prices, and there is a risk that the government may not raise domestic fuel pricesfurther. As a result of subsidies, fuel and transportation prices in many countries have remainedsubdued (Figure 1.35). However, as global prices remain high, inflation expectations have increased onthe expectation that price controls and subsidies will not be sustained throughout the year (Figure 1.36).
Figure 1.35. Fuel and transportation prices have not
followed global energy prices where subsidies exist
Transport and fuel inflation (3m/3m growth, annualized)
Source: CEIC, US Energy Information Administration.
Figure 1.36. Inflation expectations have been on the
rise in 2011 Inflation forecasts for 2011 (percent change from previous year)
Source: Consensus Economics.
-40
-20
0
20
40
60
80
100
120
-5
0
5
10
15
20
25
30
Jan-10 Apr-10 Jul-10 Oct-10 Jan-11
Average of Thailand, Malaysia and IndonesiaAverage of Singapore, Korea and the PhilippinesCrude Oil Prices (Dubai; right axis)
2
3
4
5
6
7
Jun-10 Aug-10 Oct-10 Dec-10 Feb-11
ChinaIndonesiaMalaysiaThailandRegion average
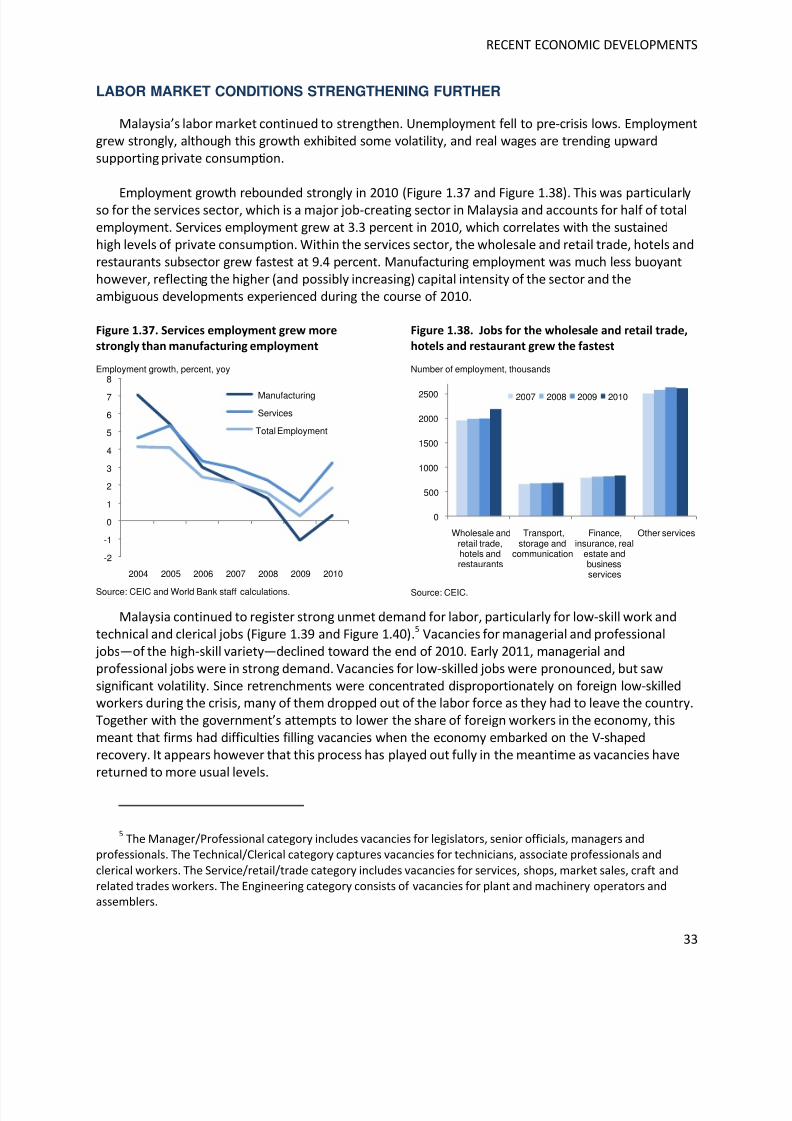
8/6/2019 World Bank Economic Monitor - Malaysia Brain Drain (April 2011)
http://slidepdf.com/reader/full/world-bank-economic-monitor-malaysia-brain-drain-april-2011 33/150
RECENT ECONOMIC DEVELOPMENTS
33
LABOR MARKET CONDITIONS STRENGTHENING FURTHER
Malaysia’s labor market continued to strengthen. Unemployment fell to pre-crisis lows. Employmentgrew strongly, although this growth exhibited some volatility, and real wages are trending upwardsupporting private consumption.
Employment growth rebounded strongly in 2010 (Figure 1.37 and Figure 1.38). This was particularlyso for the services sector, which is a major job-creating sector in Malaysia and accounts for half of totalemployment. Services employment grew at 3.3 percent in 2010, which correlates with the sustainedhigh levels of private consumption. Within the services sector, the wholesale and retail trade, hotels andrestaurants subsector grew fastest at 9.4 percent. Manufacturing employment was much less buoyanthowever, reflecting the higher (and possibly increasing) capital intensity of the sector and theambiguous developments experienced during the course of 2010.
Figure 1.37. Services employment grew more
strongly than manufacturing employment
Employment growth, percent, yoy
Source: CEIC and World Bank staff calculations.
Figure 1.38. Jobs for the wholesale and retail trade,
hotels and restaurant grew the fastest
Number of employment, thousands
Source: CEIC.
Malaysia continued to register strong unmet demand for labor, particularly for low-skill work andtechnical and clerical jobs (Figure 1.39 and Figure 1.40).5 Vacancies for managerial and professional
jobs—of the high-skill variety—declined toward the end of 2010. Early 2011, managerial andprofessional jobs were in strong demand. Vacancies for low-skilled jobs were pronounced, but sawsignificant volatility. Since retrenchments were concentrated disproportionately on foreign low-skilledworkers during the crisis, many of them dropped out of the labor force as they had to leave the country.Together with the government’s attempts to lower the share of foreign workers in the economy, thismeant that firms had difficulties filling vacancies when the economy embarked on the V-shapedrecovery. It appears however that this process has played out fully in the meantime as vacancies havereturned to more usual levels.
5The Manager/Professional category includes vacancies for legislators, senior officials, managers and
professionals. The Technical/Clerical category captures vacancies for technicians, associate professionals and
clerical workers. The Service/retail/trade category includes vacancies for services, shops, market sales, craft and
related trades workers. The Engineering category consists of vacancies for plant and machinery operators andassemblers.
-2
-1
0
1
2
3
4
5
6
7
8
2004 2005 2006 2007 2008 2009 2010
Manufacturing
Services
Total Employment
0
500
1000
1500
2000
2500
Wholesale andretail trade,hotels andrestaurants
Transport,storage and
communication
Finance,insurance, real
estate andbusinessservices
Other services
2007 2008 2009 2010
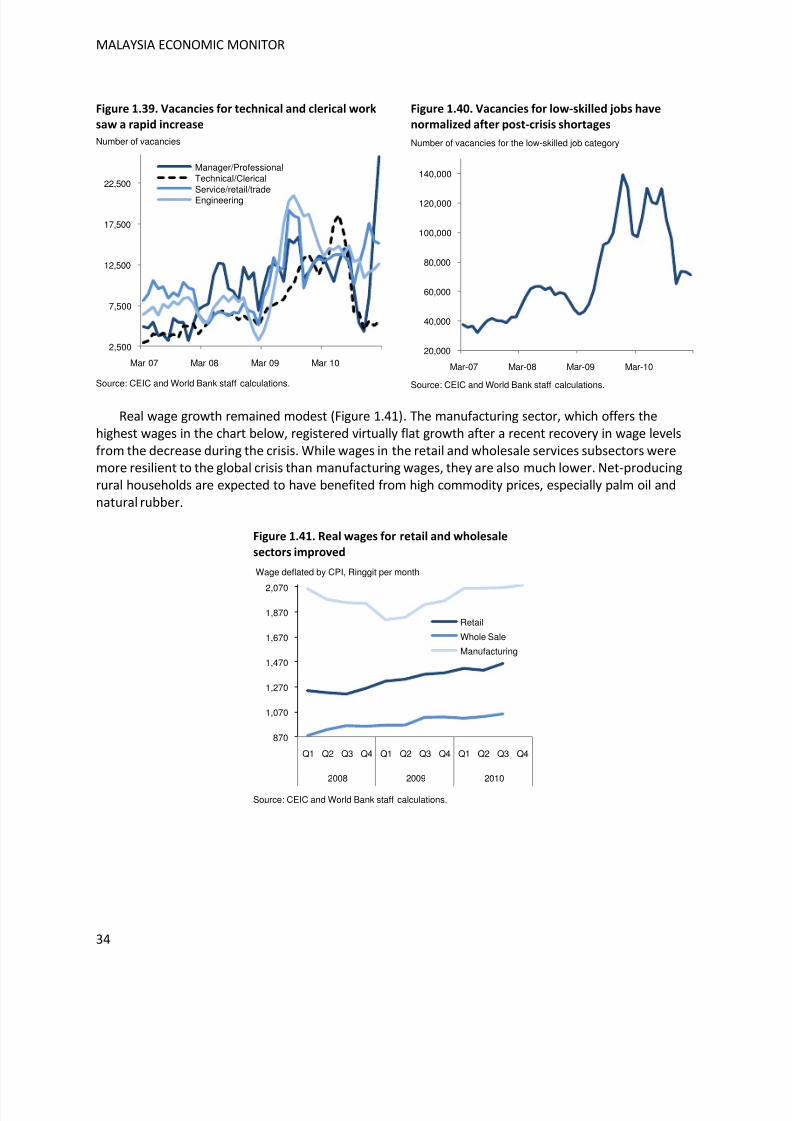
8/6/2019 World Bank Economic Monitor - Malaysia Brain Drain (April 2011)
http://slidepdf.com/reader/full/world-bank-economic-monitor-malaysia-brain-drain-april-2011 34/150
MALAYSIA ECONOMIC MONITOR
34
Figure 1.39. Vacancies for technical and clerical work
saw a rapid increase
Number of vacancies
Source: CEIC and World Bank staff calculations.
Figure 1.40. Vacancies for low-skilled jobs have
normalized after post-crisis shortages
Number of vacancies for the low-skilled job category
Source: CEIC and World Bank staff calculations.
Real wage growth remained modest (Figure 1.41). The manufacturing sector, which offers thehighest wages in the chart below, registered virtually flat growth after a recent recovery in wage levelsfrom the decrease during the crisis. While wages in the retail and wholesale services subsectors weremore resilient to the global crisis than manufacturing wages, they are also much lower. Net-producingrural households are expected to have benefited from high commodity prices, especially palm oil andnatural rubber.
Figure 1.41. Real wages for retail and wholesale
sectors improved
Wage deflated by CPI, Ringgit per month
Source: CEIC and World Bank staff calculations.
2,500
7,500
12,500
17,500
22,500
Mar 07 Mar 08 Mar 09 Mar 10
Manager/ProfessionalTechnical/ClericalService/retail/tradeEngineering
20,000
40,000
60,000
80,000
100,000
120,000
140,000
Mar-07 Mar-08 Mar-09 Mar-10
870
1,070
1,270
1,470
1,670
1,870
2,070
Q1 Q2 Q3 Q4 Q1 Q2 Q3 Q4 Q1 Q2 Q3 Q4
2008 2009 2010
Retail
Whole Sale
Manufacturing
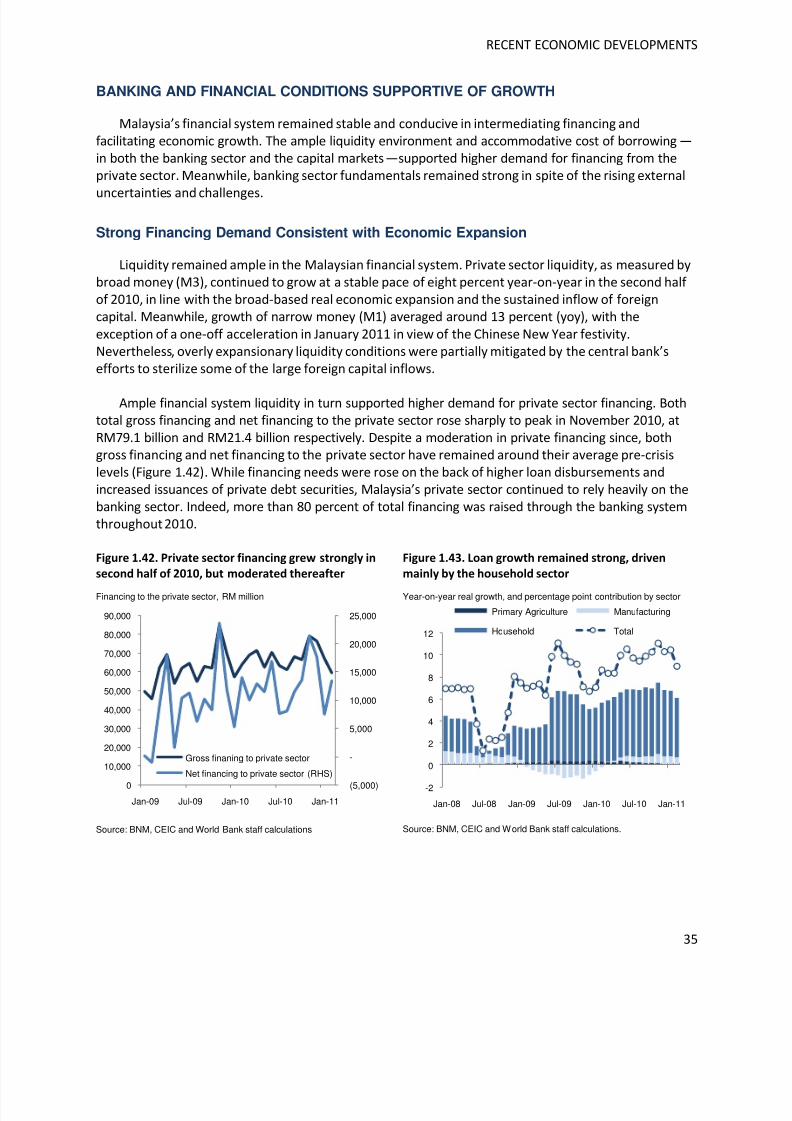
8/6/2019 World Bank Economic Monitor - Malaysia Brain Drain (April 2011)
http://slidepdf.com/reader/full/world-bank-economic-monitor-malaysia-brain-drain-april-2011 35/150
RECENT ECONOMIC DEVELOPMENTS
35
BANKING AND FINANCIAL CONDITIONS SUPPORTIVE OF GROWTH
Malaysia’s financial system remained stable and conducive in intermediating financing andfacilitating economic growth. The ample liquidity environment and accommodative cost of borrowing —in both the banking sector and the capital markets—supported higher demand for financing from theprivate sector. Meanwhile, banking sector fundamentals remained strong in spite of the rising external
uncertainties and challenges.
Strong Financing Demand Consistent with Economic Expansion
Liquidity remained ample in the Malaysian financial system. Private sector liquidity, as measured bybroad money (M3), continued to grow at a stable pace of eight percent year-on-year in the second half of 2010, in line with the broad-based real economic expansion and the sustained inflow of foreigncapital. Meanwhile, growth of narrow money (M1) averaged around 13 percent (yoy), with the
exception of a one-off acceleration in January 2011 in view of the Chinese New Year festivity.Nevertheless, overly expansionary liquidity conditions were partially mitigated by the central bank’sefforts to sterilize some of the large foreign capital inflows.
Ample financial system liquidity in turn supported higher demand for private sector financing. Bothtotal gross financing and net financing to the private sector rose sharply to peak in November 2010, atRM79.1 billion and RM21.4 billion respectively. Despite a moderation in private financing since, bothgross financing and net financing to the private sector have remained around their average pre-crisislevels (Figure 1.42). While financing needs were rose on the back of higher loan disbursements andincreased issuances of private debt securities, Malaysia’s private sector continued to rely heavily on thebanking sector. Indeed, more than 80 percent of total financing was raised through the banking systemthroughout 2010.
Figure 1.42. Private sector financing grew strongly in
second half of 2010, but moderated thereafter
Financing to the private sector, RM million
Source: BNM, CEIC and World Bank staff calculations
Figure 1.43. Loan growth remained strong, driven
mainly by the household sector
Year-on-year real growth, and percentage point contribution by sector
Source: BNM, CEIC and World Bank staff calculations.
(5,000)
-
5,000
10,000
15,000
20,000
25,000
0
10,000
20,000
30,000
40,000
50,000
60,000
70,000
80,000
90,000
Jan-09 Jul-09 Jan-10 Jul-10 Jan-11
Gross finaning to private sector
Net financing to private sector (RHS)
-2
0
2
4
6
8
10
12
Jan-08 Jul-08 Jan-09 Jul-09 Jan-10 Jul-10 Jan-11
Primary Agriculture Manufacturing
Household Total
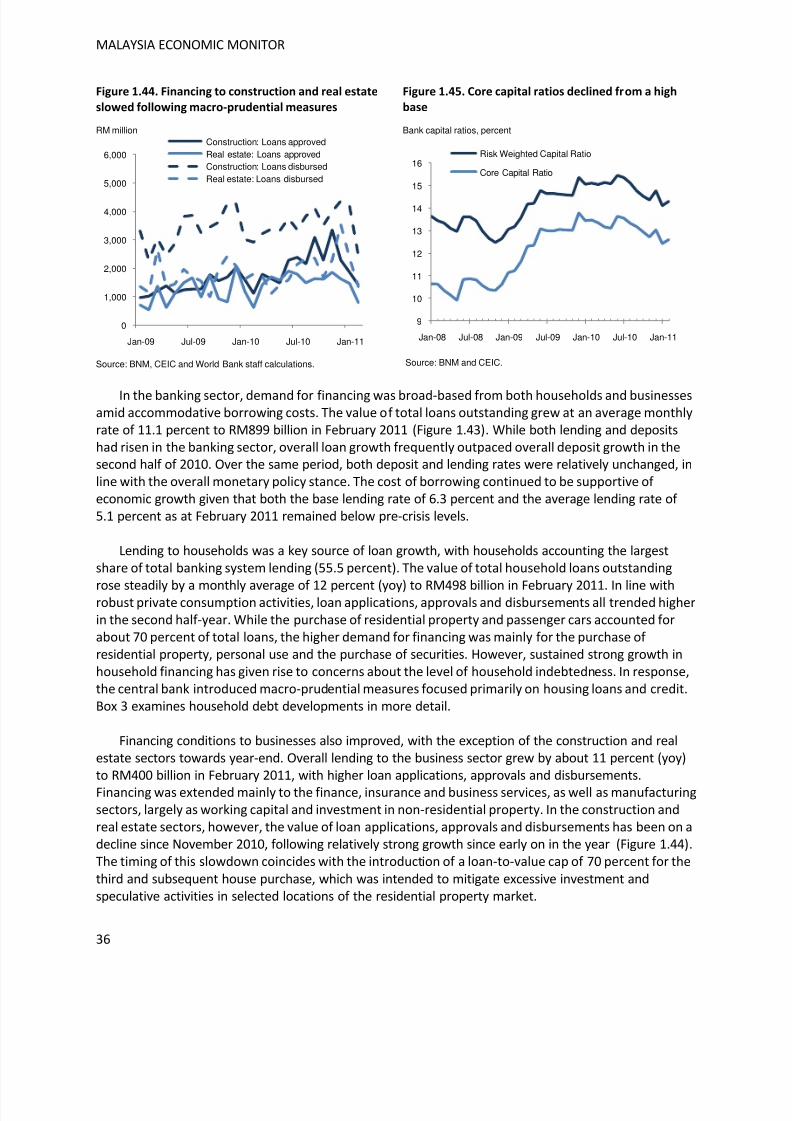
8/6/2019 World Bank Economic Monitor - Malaysia Brain Drain (April 2011)
http://slidepdf.com/reader/full/world-bank-economic-monitor-malaysia-brain-drain-april-2011 36/150
MALAYSIA ECONOMIC MONITOR
36
Figure 1.44. Financing to construction and real estate
slowed following macro-prudential measures
RM million
Source: BNM, CEIC and World Bank staff calculations.
Figure 1.45. Core capital ratios declined from a high
base
Bank capital ratios, percent
Source: BNM and CEIC.
In the banking sector, demand for financing was broad-based from both households and businessesamid accommodative borrowing costs. The value of total loans outstanding grew at an average monthlyrate of 11.1 percent to RM899 billion in February 2011 (Figure 1.43). While both lending and depositshad risen in the banking sector, overall loan growth frequently outpaced overall deposit growth in thesecond half of 2010. Over the same period, both deposit and lending rates were relatively unchanged, inline with the overall monetary policy stance. The cost of borrowing continued to be supportive of economic growth given that both the base lending rate of 6.3 percent and the average lending rate of 5.1 percent as at February 2011 remained below pre-crisis levels.
Lending to households was a key source of loan growth, with households accounting the largestshare of total banking system lending (55.5 percent). The value of total household loans outstanding
rose steadily by a monthly average of 12 percent (yoy) to RM498 billion in February 2011. In line withrobust private consumption activities, loan applications, approvals and disbursements all trended higherin the second half-year. While the purchase of residential property and passenger cars accounted forabout 70 percent of total loans, the higher demand for financing was mainly for the purchase of residential property, personal use and the purchase of securities. However, sustained strong growth inhousehold financing has given rise to concerns about the level of household indebtedness. In response,the central bank introduced macro-prudential measures focused primarily on housing loans and credit.Box 3 examines household debt developments in more detail.
Financing conditions to businesses also improved, with the exception of the construction and realestate sectors towards year-end. Overall lending to the business sector grew by about 11 percent (yoy)to RM400 billion in February 2011, with higher loan applications, approvals and disbursements.
Financing was extended mainly to the finance, insurance and business services, as well as manufacturingsectors, largely as working capital and investment in non-residential property. In the construction andreal estate sectors, however, the value of loan applications, approvals and disbursements has been on adecline since November 2010, following relatively strong growth since early on in the year (Figure 1.44).The timing of this slowdown coincides with the introduction of a loan-to-value cap of 70 percent for the
third and subsequent house purchase, which was intended to mitigate excessive investment andspeculative activities in selected locations of the residential property market.
0
1,000
2,000
3,000
4,000
5,000
6,000
Jan-09 Jul-09 Jan-10 Jul-10 Jan-11
Construction: Loans approvedReal estate: Loans approvedConstruction: Loans disbursedReal estate: Loans disbursed
9
10
11
12
13
14
15
16
Jan-08 Jul-08 Jan-09 Jul-09 Jan-10 Jul-10 Jan-11
Risk Weighted Capital Ratio
Core Capital Ratio
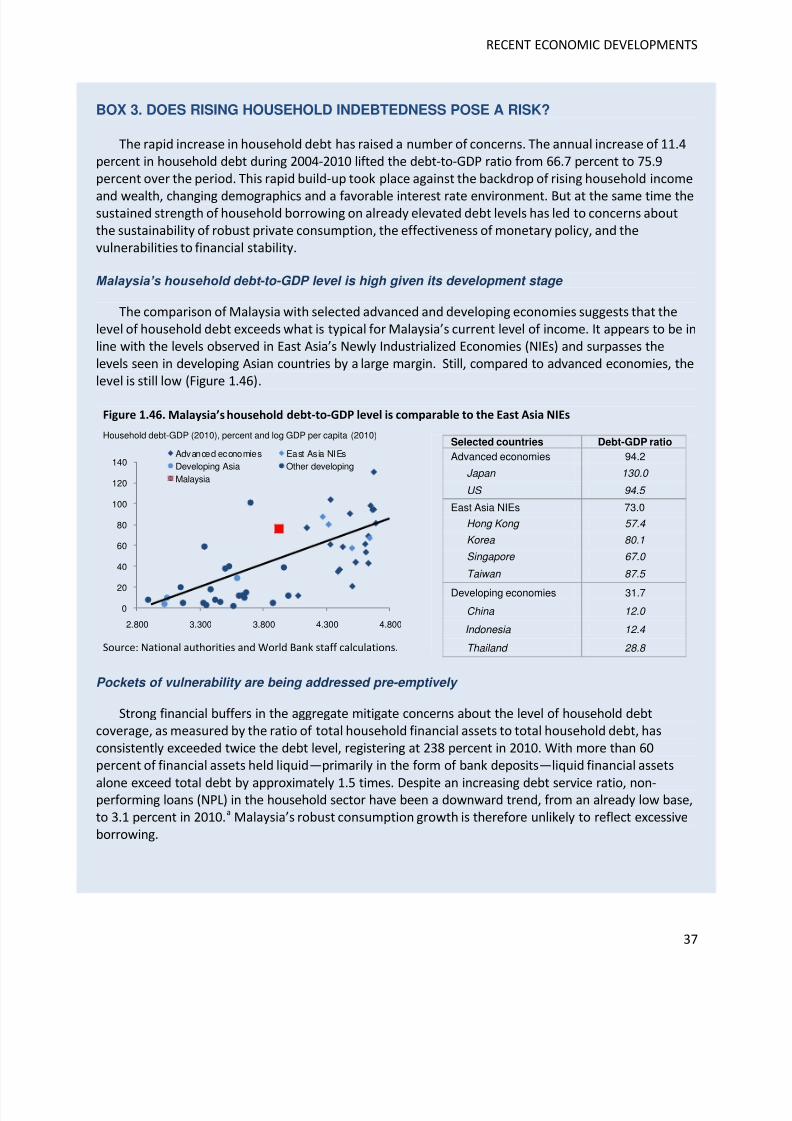
8/6/2019 World Bank Economic Monitor - Malaysia Brain Drain (April 2011)
http://slidepdf.com/reader/full/world-bank-economic-monitor-malaysia-brain-drain-april-2011 37/150
RECENT ECONOMIC DEVELOPMENTS
37
BOX 3. DOES RISING HOUSEHOLD INDEBTEDNESS POSE A RISK?
The rapid increase in household debt has raised a number of concerns. The annual increase of 11.4percent in household debt during 2004-2010 lifted the debt-to-GDP ratio from 66.7 percent to 75.9percent over the period. This rapid build-up took place against the backdrop of rising household income
and wealth, changing demographics and a favorable interest rate environment. But at the same time thesustained strength of household borrowing on already elevated debt levels has led to concerns aboutthe sustainability of robust private consumption, the effectiveness of monetary policy, and thevulnerabilities to financial stability.
Malaysia’s household debt -to-GDP level is high given its development stage
The comparison of Malaysia with selected advanced and developing economies suggests that thelevel of household debt exceeds what is typical for Malaysia’s current level of income. It appears to be inline with the levels observed in East Asia’s Newly Industrialized Economies (NIEs) and surpasses thelevels seen in developing Asian countries by a large margin. Still, compared to advanced economies, thelevel is still low (Figure 1.46).
Figure 1.46. Malaysia’s household debt-to-GDP level is comparable to the East Asia NIEs
Household debt-GDP (2010), percent and log GDP per capita (2010)
Source: National authorities and World Bank staff calculations.
Selected countries Debt-GDP ratio
Advanced economies 94.2
Japan 130.0
US 94.5
East Asia NIEs 73.0
Hong Kong 57.4
Korea 80.1
Singapore 67.0
Taiwan 87.5
Developing economies 31.7
China 12.0
Indonesia 12.4
Thailand 28.8
Pockets of vulnerability are being addressed pre-emptively
Strong financial buffers in the aggregate mitigate concerns about the level of household debtcoverage, as measured by the ratio of total household financial assets to total household debt, hasconsistently exceeded twice the debt level, registering at 238 percent in 2010. With more than 60percent of financial assets held liquid—primarily in the form of bank deposits—liquid financial assets
alone exceed total debt by approximately 1.5 times. Despite an increasing debt service ratio, non-performing loans (NPL) in the household sector have been a downward trend, from an already low base,to 3.1 percent in 2010.a Malaysia’s robust consumption growth is therefore unlikely to reflect excessiveborrowing.
0
20
40
60
80
100
120
140
2.800 3.300 3.800 4.300 4.800
Advanced economies East Asia NIEsDeveloping Asia Other developingMalaysia
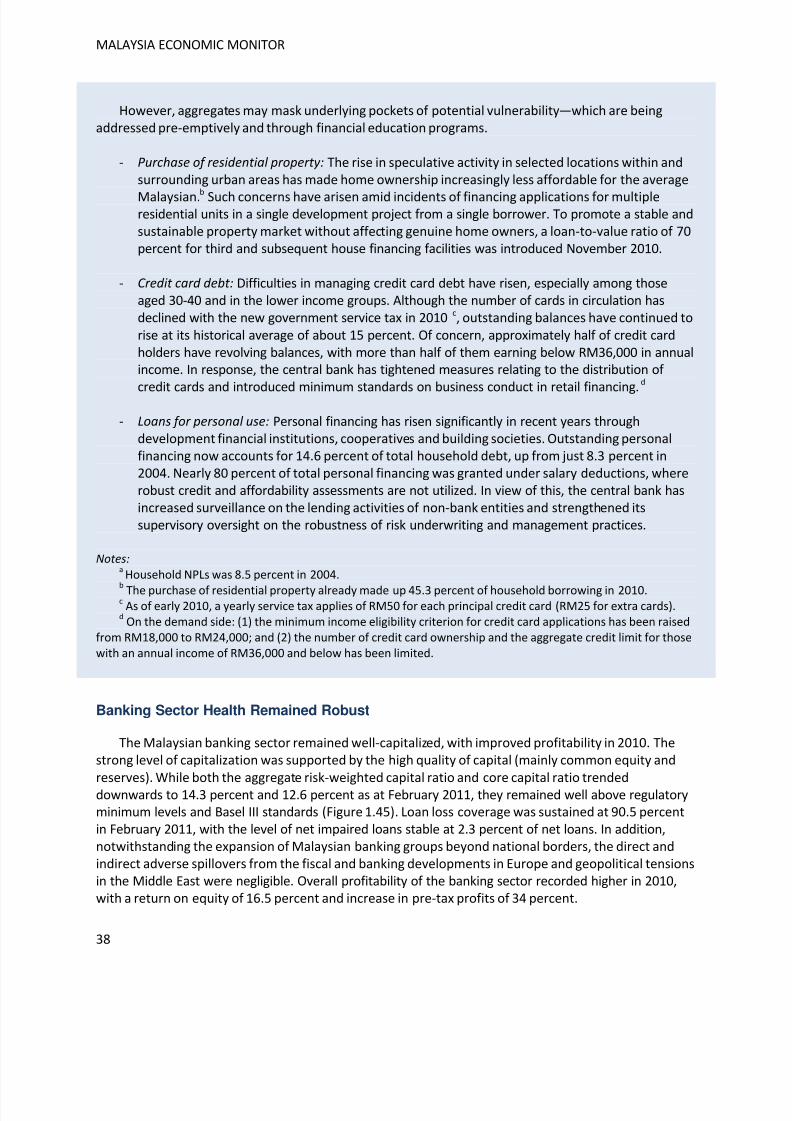
8/6/2019 World Bank Economic Monitor - Malaysia Brain Drain (April 2011)
http://slidepdf.com/reader/full/world-bank-economic-monitor-malaysia-brain-drain-april-2011 38/150
MALAYSIA ECONOMIC MONITOR
38
However, aggregates may mask underlying pockets of potential vulnerability—which are beingaddressed pre-emptively and through financial education programs.
- Purchase of residential property: The rise in speculative activity in selected locations within andsurrounding urban areas has made home ownership increasingly less affordable for the average
Malaysian.b
Such concerns have arisen amid incidents of financing applications for multipleresidential units in a single development project from a single borrower. To promote a stable andsustainable property market without affecting genuine home owners, a loan-to-value ratio of 70percent for third and subsequent house financing facilities was introduced November 2010.
- Credit card debt: Difficulties in managing credit card debt have risen, especially among thoseaged 30-40 and in the lower income groups. Although the number of cards in circulation hasdeclined with the new government service tax in 2010 c, outstanding balances have continued to
rise at its historical average of about 15 percent. Of concern, approximately half of credit cardholders have revolving balances, with more than half of them earning below RM36,000 in annualincome. In response, the central bank has tightened measures relating to the distribution of
credit cards and introduced minimum standards on business conduct in retail financing.
d
- Loans for personal use: Personal financing has risen significantly in recent years throughdevelopment financial institutions, cooperatives and building societies. Outstanding personalfinancing now accounts for 14.6 percent of total household debt, up from just 8.3 percent in2004. Nearly 80 percent of total personal financing was granted under salary deductions, whererobust credit and affordability assessments are not utilized. In view of this, the central bank hasincreased surveillance on the lending activities of non-bank entities and strengthened itssupervisory oversight on the robustness of risk underwriting and management practices.
Notes: a
Household NPLs was 8.5 percent in 2004.b
The purchase of residential property already made up 45.3 percent of household borrowing in 2010.cAs of early 2010, a yearly service tax applies of RM50 for each principal credit card (RM25 for extra cards).
dOn the demand side: (1) the minimum income eligibility criterion for credit card applications has been raised
from RM18,000 to RM24,000; and (2) the number of credit card ownership and the aggregate credit limit for those
with an annual income of RM36,000 and below has been limited.
Banking Sector Health Remained Robust
The Malaysian banking sector remained well-capitalized, with improved profitability in 2010. Thestrong level of capitalization was supported by the high quality of capital (mainly common equity and
reserves). While both the aggregate risk-weighted capital ratio and core capital ratio trendeddownwards to 14.3 percent and 12.6 percent as at February 2011, they remained well above regulatoryminimum levels and Basel III standards (Figure 1.45). Loan loss coverage was sustained at 90.5 percentin February 2011, with the level of net impaired loans stable at 2.3 percent of net loans. In addition,notwithstanding the expansion of Malaysian banking groups beyond national borders, the direct andindirect adverse spillovers from the fiscal and banking developments in Europe and geopolitical tensionsin the Middle East were negligible. Overall profitability of the banking sector recorded higher in 2010,with a return on equity of 16.5 percent and increase in pre-tax profits of 34 percent.
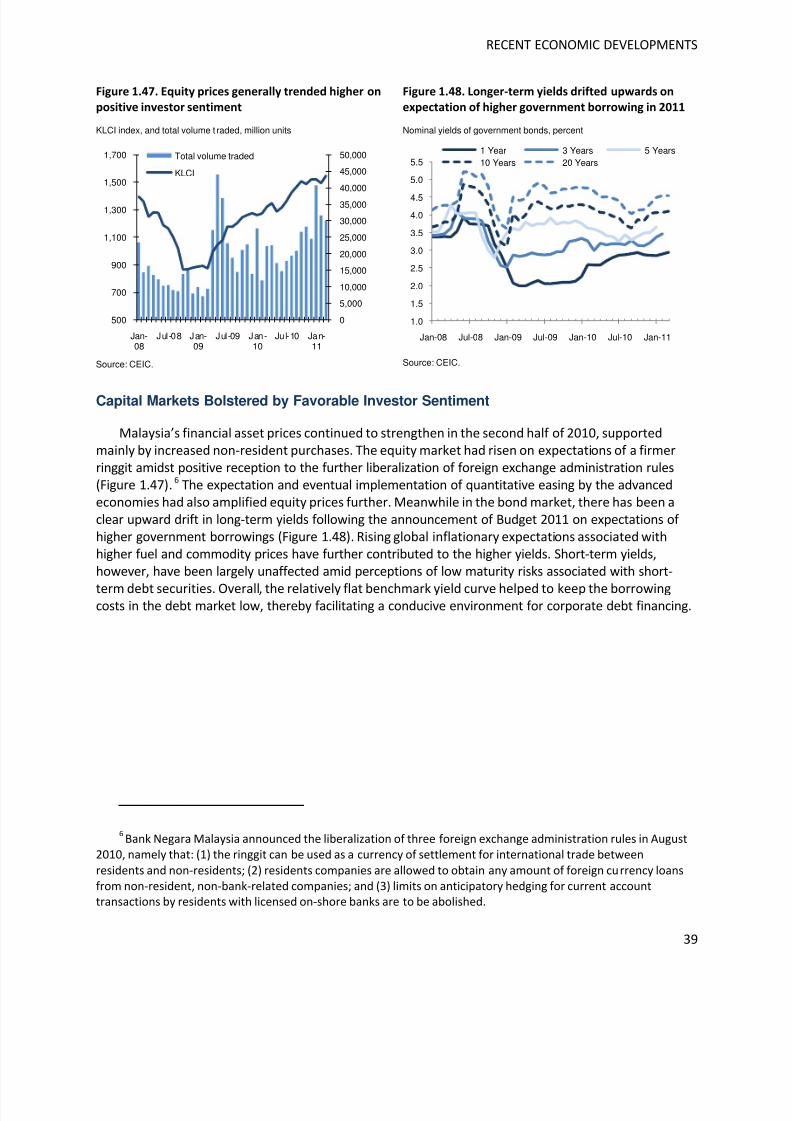
8/6/2019 World Bank Economic Monitor - Malaysia Brain Drain (April 2011)
http://slidepdf.com/reader/full/world-bank-economic-monitor-malaysia-brain-drain-april-2011 39/150
RECENT ECONOMIC DEVELOPMENTS
39
Figure 1.47. Equity prices generally trended higher on
positive investor sentiment
KLCI index, and total volume t raded, million units
Source: CEIC.
Figure 1.48. Longer-term yields drifted upwards on
expectation of higher government borrowing in 2011
Nominal yields of government bonds, percent
Source: CEIC.
Capital Markets Bolstered by Favorable Investor Sentiment
Malaysia’s financial asset prices continued to strengthen in the second half of 2010, supportedmainly by increased non-resident purchases. The equity market had risen on expectations of a firmerringgit amidst positive reception to the further liberalization of foreign exchange administration rules(Figure 1.47). 6 The expectation and eventual implementation of quantitative easing by the advancedeconomies had also amplified equity prices further. Meanwhile in the bond market, there has been aclear upward drift in long-term yields following the announcement of Budget 2011 on expectations of higher government borrowings (Figure 1.48). Rising global inflationary expectations associated withhigher fuel and commodity prices have further contributed to the higher yields. Short-term yields,however, have been largely unaffected amid perceptions of low maturity risks associated with short-
term debt securities. Overall, the relatively flat benchmark yield curve helped to keep the borrowingcosts in the debt market low, thereby facilitating a conducive environment for corporate debt financing.
6Bank Negara Malaysia announced the liberalization of three foreign exchange administration rules in August
2010, namely that: (1) the ringgit can be used as a currency of settlement for international trade between
residents and non-residents; (2) residents companies are allowed to obtain any amount of foreign currency loans
from non-resident, non-bank-related companies; and (3) limits on anticipatory hedging for current accounttransactions by residents with licensed on-shore banks are to be abolished.
0
5,000
10,000
15,000
20,000
25,000
30,000
35,000
40,000
45,000
50,000
500
700
900
1,100
1,300
1,500
1,700
Jan-08
Jul-08 Jan-09
Jul-09 Jan-10
Jul-10 Jan-11
Total volume traded
KLCI
1.0
1.5
2.0
2.5
3.0
3.5
4.0
4.5
5.0
5.5
Jan-08 Jul-08 Jan-09 Jul-09 Jan-10 Jul-10 Jan-11
1 Year 3 Years 5 Years10 Years 20 Years
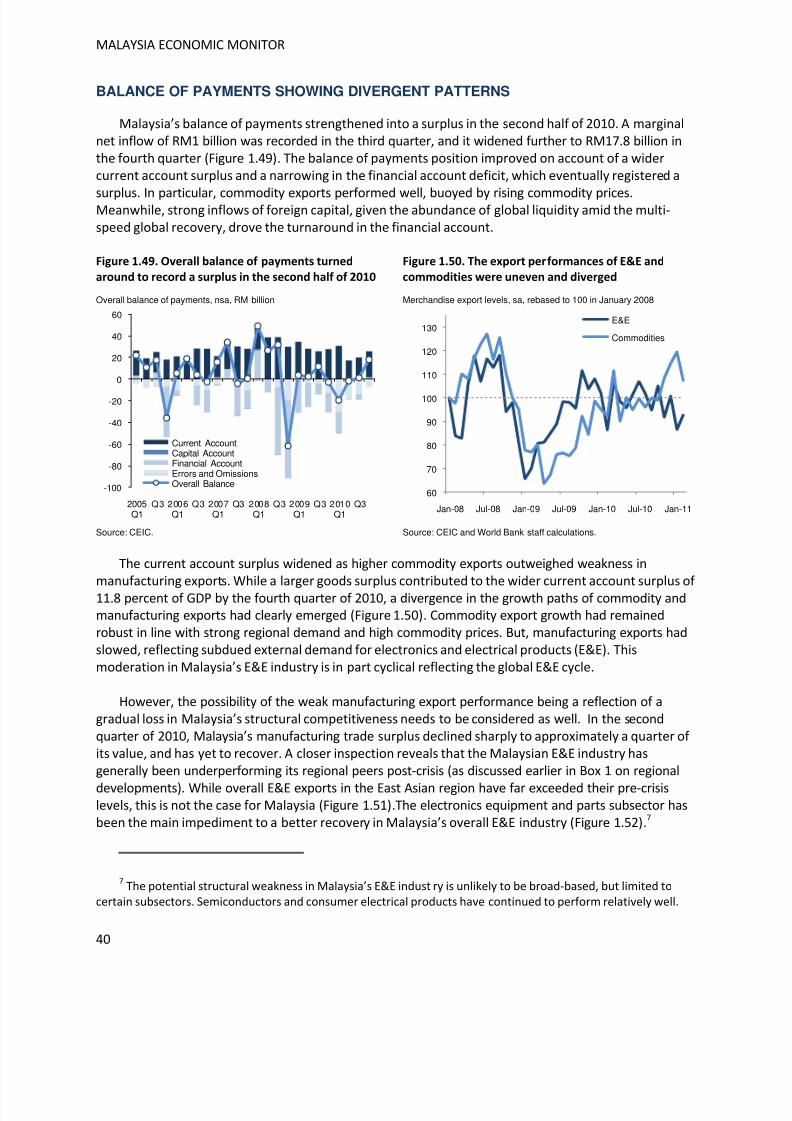
8/6/2019 World Bank Economic Monitor - Malaysia Brain Drain (April 2011)
http://slidepdf.com/reader/full/world-bank-economic-monitor-malaysia-brain-drain-april-2011 40/150
MALAYSIA ECONOMIC MONITOR
40
BALANCE OF PAYMENTS SHOWING DIVERGENT PATTERNS
Malaysia’s balance of payments strengthened into a surplus in the second half of 2010. A marginalnet inflow of RM1 billion was recorded in the third quarter, and it widened further to RM17.8 billion inthe fourth quarter (Figure 1.49). The balance of payments position improved on account of a widercurrent account surplus and a narrowing in the financial account deficit, which eventually registered a
surplus. In particular, commodity exports performed well, buoyed by rising commodity prices.Meanwhile, strong inflows of foreign capital, given the abundance of global liquidity amid the multi-speed global recovery, drove the turnaround in the financial account.
Figure 1.49. Overall balance of payments turned
around to record a surplus in the second half of 2010
Overall balance of payments, nsa, RM billion
Source: CEIC.
Figure 1.50. The export performances of E&E and
commodities were uneven and diverged
Merchandise export levels, sa, rebased to 100 in January 2008
Source: CEIC and World Bank staff calculations.
The current account surplus widened as higher commodity exports outweighed weakness inmanufacturing exports. While a larger goods surplus contributed to the wider current account surplus of 11.8 percent of GDP by the fourth quarter of 2010, a divergence in the growth paths of commodity andmanufacturing exports had clearly emerged (Figure 1.50). Commodity export growth had remainedrobust in line with strong regional demand and high commodity prices. But, manufacturing exports hadslowed, reflecting subdued external demand for electronics and electrical products (E&E). Thismoderation in Malaysia’s E&E industry is in part cyclical reflecting the global E&E cycle.
However, the possibility of the weak manufacturing export performance being a reflection of agradual loss in Malaysia’s structural competitiveness needs to be considered as well. In the secondquarter of 2010, Malaysia’s manufacturing trade surplus declined sharply to approximately a quarter of its value, and has yet to recover. A closer inspection reveals that the Malaysian E&E industry hasgenerally been underperforming its regional peers post-crisis (as discussed earlier in Box 1 on regional
developments). While overall E&E exports in the East Asian region have far exceeded their pre-crisislevels, this is not the case for Malaysia (Figure 1.51).The electronics equipment and parts subsector hasbeen the main impediment to a better recovery in Malaysia’s overall E&E industry (Figure 1.52).7
7 The potential structural weakness in Malaysia’s E&E industry is unlikely to be broad-based, but limited to
certain subsectors. Semiconductors and consumer electrical products have continued to perform relatively well.
-100
-80
-60
-40
-20
0
20
40
60
2005Q1
Q3 2006Q1
Q3 2007Q1
Q3 2008Q1
Q3 2009Q1
Q3 2010Q1
Q3
Current AccountCapital AccountFinancial AccountErrors and OmissionsOverall Balance
60
70
80
90
100
110
120
130
Jan-08 Jul-08 Jan-09 Jul-09 Jan-10 Jul-10 Jan-11
E&E
Commodities
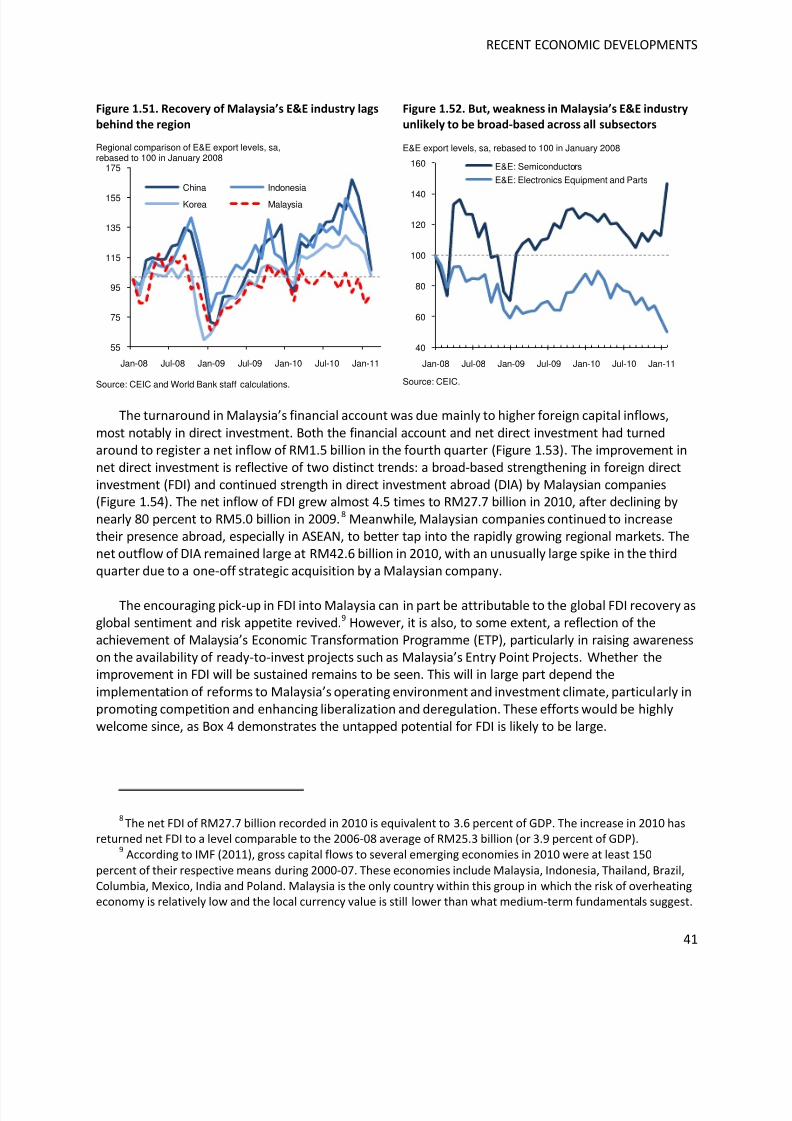
8/6/2019 World Bank Economic Monitor - Malaysia Brain Drain (April 2011)
http://slidepdf.com/reader/full/world-bank-economic-monitor-malaysia-brain-drain-april-2011 41/150
RECENT ECONOMIC DEVELOPMENTS
41
Figure 1.51. Recovery of Malaysia’s E&E industry lags
behind the region
Regional comparison of E&E export levels, sa,rebased to 100 in January 2008
Source: CEIC and World Bank staff calculations.
Figure 1.52. But, weakness in Malaysia’s E&E industry
unlikely to be broad-based across all subsectors
E&E export levels, sa, rebased to 100 in January 2008
Source: CEIC.
The turnaround in Malaysia’s financial account was due mainly to higher foreign capital inflows,
most notably in direct investment. Both the financial account and net direct investment had turnedaround to register a net inflow of RM1.5 billion in the fourth quarter (Figure 1.53). The improvement innet direct investment is reflective of two distinct trends: a broad-based strengthening in foreign directinvestment (FDI) and continued strength in direct investment abroad (DIA) by Malaysian companies(Figure 1.54). The net inflow of FDI grew almost 4.5 times to RM27.7 billion in 2010, after declining bynearly 80 percent to RM5.0 billion in 2009.8 Meanwhile, Malaysian companies continued to increasetheir presence abroad, especially in ASEAN, to better tap into the rapidly growing regional markets. Thenet outflow of DIA remained large at RM42.6 billion in 2010, with an unusually large spike in the thirdquarter due to a one-off strategic acquisition by a Malaysian company.
The encouraging pick-up in FDI into Malaysia can in part be attributable to the global FDI recovery asglobal sentiment and risk appetite revived.9 However, it is also, to some extent, a reflection of theachievement of Malaysia’s Economic Transformation Programme (ETP), particularly in raising awarenesson the availability of ready-to-invest projects such as Malaysia’s Entry Point Projects. Whether theimprovement in FDI will be sustained remains to be seen. This will in large part depend the
implementation of reforms to Malaysia’s operating environment and investment climate, particularly inpromoting competition and enhancing liberalization and deregulation. These efforts would be highlywelcome since, as Box 4 demonstrates the untapped potential for FDI is likely to be large.
8The net FDI of RM27.7 billion recorded in 2010 is equivalent to 3.6 percent of GDP. The increase in 2010 has
returned net FDI to a level comparable to the 2006-08 average of RM25.3 billion (or 3.9 percent of GDP).
9According to IMF (2011), gross capital flows to several emerging economies in 2010 were at least 150
percent of their respective means during 2000-07. These economies include Malaysia, Indonesia, Thailand, Brazil,
Columbia, Mexico, India and Poland. Malaysia is the only country within this group in which the risk of overheatingeconomy is relatively low and the local currency value is still lower than what medium-term fundamentals suggest.
55
75
95
115
135
155
175
Jan-08 Jul-08 Jan-09 Jul-09 Jan-10 Jul-10 Jan-11
China Indonesia
Korea Malaysia
40
60
80
100
120
140
160
Jan-08 Jul-08 Jan-09 Jul-09 Jan-10 Jul-10 Jan-11
E&E: Semiconductors
E&E: Electronics Equipment and Parts
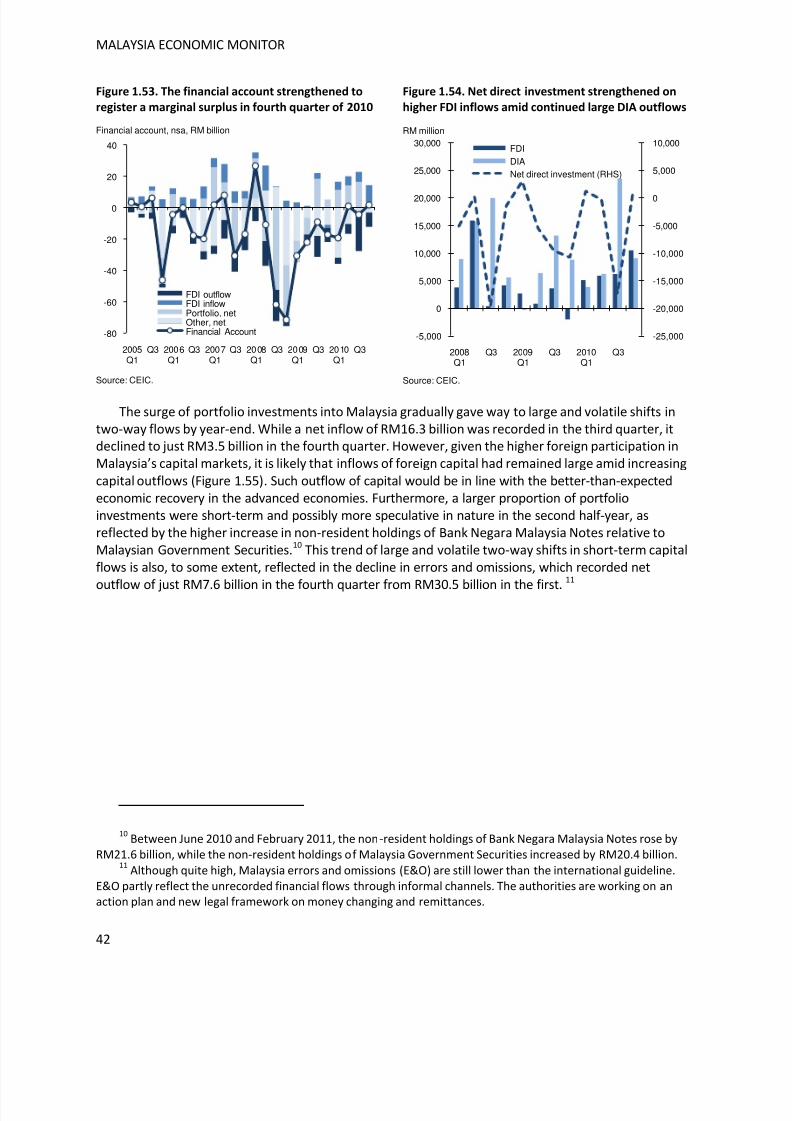
8/6/2019 World Bank Economic Monitor - Malaysia Brain Drain (April 2011)
http://slidepdf.com/reader/full/world-bank-economic-monitor-malaysia-brain-drain-april-2011 42/150
MALAYSIA ECONOMIC MONITOR
42
Figure 1.53. The financial account strengthened to
register a marginal surplus in fourth quarter of 2010
Financial account, nsa, RM billion
Source: CEIC.
Figure 1.54. Net direct investment strengthened on
higher FDI inflows amid continued large DIA outflows
RM million
Source: CEIC.
The surge of portfolio investments into Malaysia gradually gave way to large and volatile shifts intwo-way flows by year-end. While a net inflow of RM16.3 billion was recorded in the third quarter, itdeclined to just RM3.5 billion in the fourth quarter. However, given the higher foreign participation inMalaysia’s capital markets, it is likely that inflows of foreign capital had remained large amid increasing
capital outflows (Figure 1.55). Such outflow of capital would be in line with the better-than-expectedeconomic recovery in the advanced economies. Furthermore, a larger proportion of portfolioinvestments were short-term and possibly more speculative in nature in the second half-year, asreflected by the higher increase in non-resident holdings of Bank Negara Malaysia Notes relative toMalaysian Government Securities.10 This trend of large and volatile two-way shifts in short-term capitalflows is also, to some extent, reflected in the decline in errors and omissions, which recorded net
outflow of just RM7.6 billion in the fourth quarter from RM30.5 billion in the first.
11
10Between June 2010 and February 2011, the non-resident holdings of Bank Negara Malaysia Notes rose by
RM21.6 billion, while the non-resident holdings of Malaysia Government Securities increased by RM20.4 billion. 11
Although quite high, Malaysia errors and omissions (E&O) are still lower than the international guideline.
E&O partly reflect the unrecorded financial flows through informal channels. The authorities are working on anaction plan and new legal framework on money changing and remittances.
-80
-60
-40
-20
0
20
40
2005Q1
Q3 2006Q1
Q3 2007Q1
Q3 2008Q1
Q3 2009Q1
Q3 2010Q1
Q3
FDI outflowFDI inflowPortfolio, netOther, netFinancial Account -25,000
-20,000
-15,000
-10,000
-5,000
0
5,000
10,000
-5,000
0
5,000
10,000
15,000
20,000
25,000
30,000
2008Q1
Q3 2009Q1
Q3 2010Q1
Q3
FDI
DIANet direct investment (RHS)
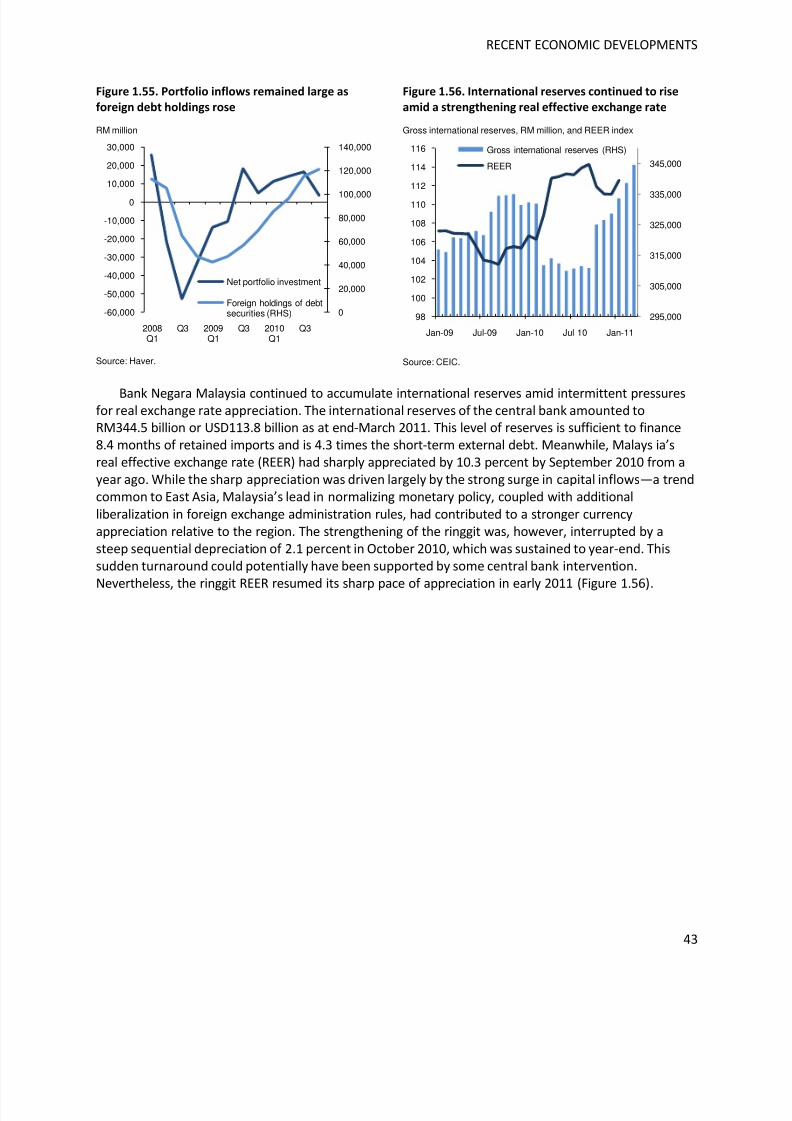
8/6/2019 World Bank Economic Monitor - Malaysia Brain Drain (April 2011)
http://slidepdf.com/reader/full/world-bank-economic-monitor-malaysia-brain-drain-april-2011 43/150
RECENT ECONOMIC DEVELOPMENTS
43
Figure 1.55. Portfolio inflows remained large as
foreign debt holdings rose
RM million
Source: Haver.
Figure 1.56. International reserves continued to rise
amid a strengthening real effective exchange rate
Gross international reserves, RM million, and REER index
Source: CEIC.
Bank Negara Malaysia continued to accumulate international reserves amid intermittent pressuresfor real exchange rate appreciation. The international reserves of the central bank amounted toRM344.5 billion or USD113.8 billion as at end-March 2011. This level of reserves is sufficient to finance8.4 months of retained imports and is 4.3 times the short-term external debt. Meanwhile, Malays ia’sreal effective exchange rate (REER) had sharply appreciated by 10.3 percent by September 2010 from ayear ago. While the sharp appreciation was driven largely by the strong surge in capital inflows—a trendcommon to East Asia, Malaysia’s lead in normalizing monetary policy, coupled with additional
liberalization in foreign exchange administration rules, had contributed to a stronger currencyappreciation relative to the region. The strengthening of the ringgit was, however, interrupted by asteep sequential depreciation of 2.1 percent in October 2010, which was sustained to year-end. Thissudden turnaround could potentially have been supported by some central bank intervention.
Nevertheless, the ringgit REER resumed its sharp pace of appreciation in early 2011 (Figure 1.56).
0
20,000
40,000
60,000
80,000
100,000
120,000
140,000
-60,000
-50,000
-40,000
-30,000
-20,000
-10,000
0
10,000
20,000
30,000
2008Q1
Q3 2009Q1
Q3 2010Q1
Q3
Net portfolio investment
Foreign holdings of debtsecurities (RHS) 295,000
305,000
315,000
325,000
335,000
345,000
98
100
102
104
106
108
110
112
114
116
Jan-09 Jul-09 Jan-10 Jul-10 Jan-11
Gross international reserves (RHS)
REER
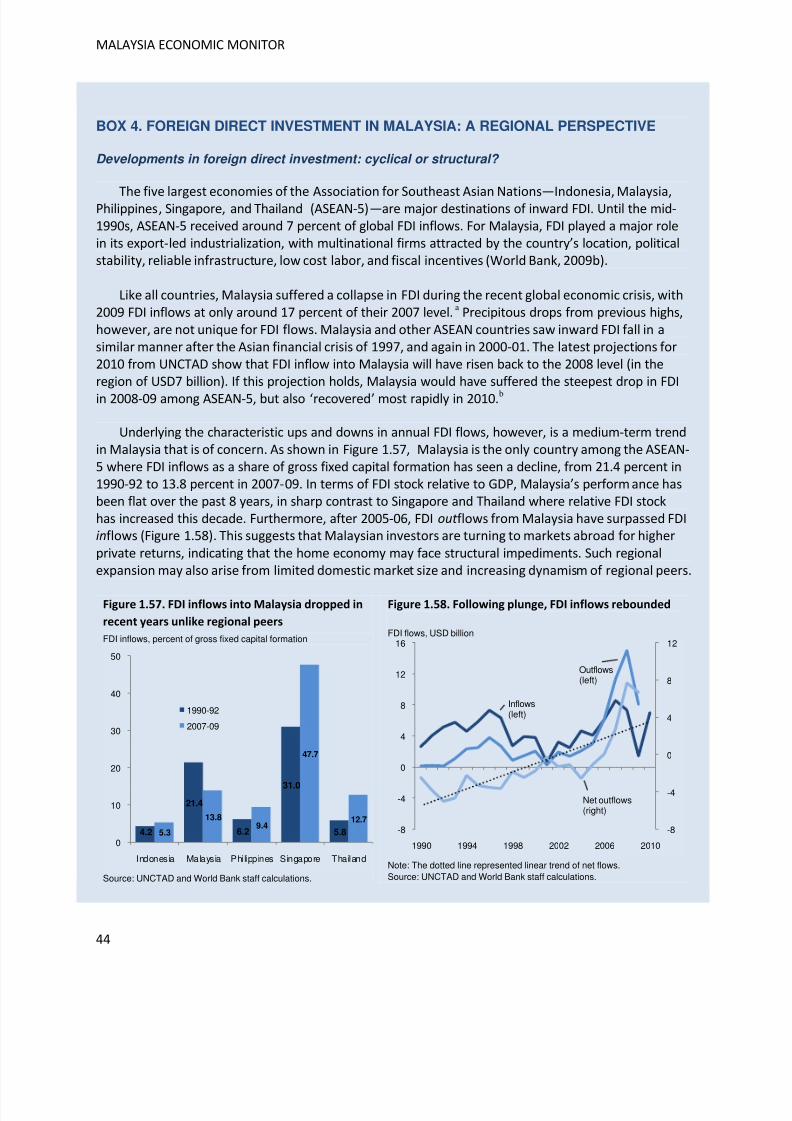
8/6/2019 World Bank Economic Monitor - Malaysia Brain Drain (April 2011)
http://slidepdf.com/reader/full/world-bank-economic-monitor-malaysia-brain-drain-april-2011 44/150
MALAYSIA ECONOMIC MONITOR
44
BOX 4. FOREIGN DIRECT INVESTMENT IN MALAYSIA: A REGIONAL PERSPECTIVE
Developments in foreign direct investment: cyclical or structural?
The five largest economies of the Association for Southeast Asian Nations—Indonesia, Malaysia,Philippines, Singapore, and Thailand (ASEAN-5)—are major destinations of inward FDI. Until the mid-1990s, ASEAN-5 received around 7 percent of global FDI inflows. For Malaysia, FDI played a major rolein its export-led industrialization, with multinational firms attracted by the country’s location, politicalstability, reliable infrastructure, low cost labor, and fiscal incentives (World Bank, 2009b).
Like all countries, Malaysia suffered a collapse in FDI during the recent global economic crisis, with2009 FDI inflows at only around 17 percent of their 2007 level.a Precipitous drops from previous highs,however, are not unique for FDI flows. Malaysia and other ASEAN countries saw inward FDI fall in asimilar manner after the Asian financial crisis of 1997, and again in 2000-01. The latest projections for2010 from UNCTAD show that FDI inflow into Malaysia will have risen back to the 2008 level (in theregion of USD7 billion). If this projection holds, Malaysia would have suffered the steepest drop in FDI
in 2008-09 among ASEAN-5, but also ‘recovered’ most rapidly in 2010.b
Underlying the characteristic ups and downs in annual FDI flows, however, is a medium-term trendin Malaysia that is of concern. As shown in Figure 1.57, Malaysia is the only country among the ASEAN-5 where FDI inflows as a share of gross fixed capital formation has seen a decline, from 21.4 percent in1990-92 to 13.8 percent in 2007-09. In terms of FDI stock relative to GDP, Malaysia’s performance hasbeen flat over the past 8 years, in sharp contrast to Singapore and Thailand where relative FDI stockhas increased this decade. Furthermore, after 2005-06, FDI out flows from Malaysia have surpassed FDIinflows (Figure 1.58). This suggests that Malaysian investors are turning to markets abroad for higher
private returns, indicating that the home economy may face structural impediments. Such regionalexpansion may also arise from limited domestic market size and increasing dynamism of regional peers.
Figure 1.57. FDI inflows into Malaysia dropped in
recent years unlike regional peers
FDI inflows, percent of gross fixed capital formation
Source: UNCTAD and World Bank staff calculations.
Figure 1.58. Following plunge, FDI inflows rebounded
FDI flows, USD billion
Note: The dotted line represented linear trend of net flows.Source: UNCTAD and World Bank staff calculations.
4.2
21.4
6.2
31.0
5.85.3
13.89.4
47.7
12.7
0
10
20
30
40
50
Indonesia Malaysia Philippines Singapore Thailand
1990-92
2007-09
-8
-4
0
4
8
12
-8
-4
0
4
8
12
16
1990 1994 1998 2002 2006 2010
Inflows(left)
Net outflows(right)
Outflows(left)
8/6/2019 World Bank Economic Monitor - Malaysia Brain Drain (April 2011)
http://slidepdf.com/reader/full/world-bank-economic-monitor-malaysia-brain-drain-april-2011 45/150
RECENT ECONOMIC DEVELOPMENTS
45
Malaysia is also subject to broader shifts in trade and FDI regionally. The rise of China-centeredglobal production networks has affected Malaysia’s overall attractiveness as a location for efficiency-seeking (vertical) FDI.c Indeed, evidence that Malaysia’s performance in FDI appears to be driven by areluctance of MNCs (in line with Malaysian private investors) to invest in the manufacturing sector addscredence to the argument that the Malaysian economy may be caught in a ‘middle income trap’,
increasingly less able to compete with China and others in low-cost production but without sufficientinnovation and skills to upgrade to higher levels of specialization.d But does the ‘middle income trap’ argument really explain the recent FDI trends we observe in Malaysia—i.e., to what degree do cyclicalor structural determinants explain these recent trends? And if structural factors are important, to whatdegree are these really long-term structural in nature or policy-induced factors that can be addressedin the short-to-medium term? The answer to these questions has important implications on the policylevers that can be pulled to attract further foreign, and indeed domestic, investment to facilitateongoing growth and structural transformation in the economy.
Investment policy, skills and innovation are key determinants of FDI
We run a fixed-effects regression by controlling for average differences across the 5 ASEANcountries in the observable and time-invariant, unobservable country-specific characteristics using apanel data over 15 years. Because FDI flows are highly volatile year-on-year, they are grouped into 3-year periods from 1995-97 to 2007-09.e OECD countries have historically accounted for anoverwhelming share of FDI into developing countries. For a richer analysis than what could be obtainedfrom aggregate FDI inflows, we use bilateral FDI from each OECD source country to the 5 ASEAN hostcountries, controlling for the bilateral aspects of each observation with gravity variables: distance,history of colonialism, and whether two countries share a common language. Because no ASEANcountry is contiguous with an OECD country, the ‘border’ effect is redundant.
There are two sets of major regressors: variables that are more controllable by policymakers andthose that are not. The ‘policy’ variables capture, i) quality of FDI-related regulations and institutions, ii)
skills and innovation, iii) wages, and iv) infrastructure. Policy restrictions on cross-border investmentare captured by the Heritage Foundation’s indicator on Investment Freedom. f Quality of governanceand institutions are an averaged index of five sub-indicators from the World Governance Indicators onthe rule of law, regulatory quality, government effectiveness, control of corruption, and politicalstability. Skills/innovation are measured by the percentage of population with completed secondaryeducation (Barro and Lee 2010) and the number of patent applications by residents (WIPO), scaled bypopulation. Infastructure is proxied by energy use per capita (kg of oil equivalent). Data on averagemonthly wages is from the EIU.
Variables that are used as control variables are ‘cyclical’ in nature and not immediately under thecontrol of policymakers: host country GDP (reflecting economic size) and its lagged economic growth
rate (countries that grow fast now can expect to attract more FDI in the next period). Other variablesinclude source country GDP and its growth rate, trade-to-GDP ratio (to measure an economy’s
openness), share of parts and components in exports (to account for the heavy presence of vertical FDIand product fragmentation in East Asia), and the share of services in the economy (to capture the factthat an increasing share of FDI is into services). Both FDI flows and FDI stock are regressed on acommon set of explanatory variables to assess their importance in accounting for FDI into ASEAN-5.
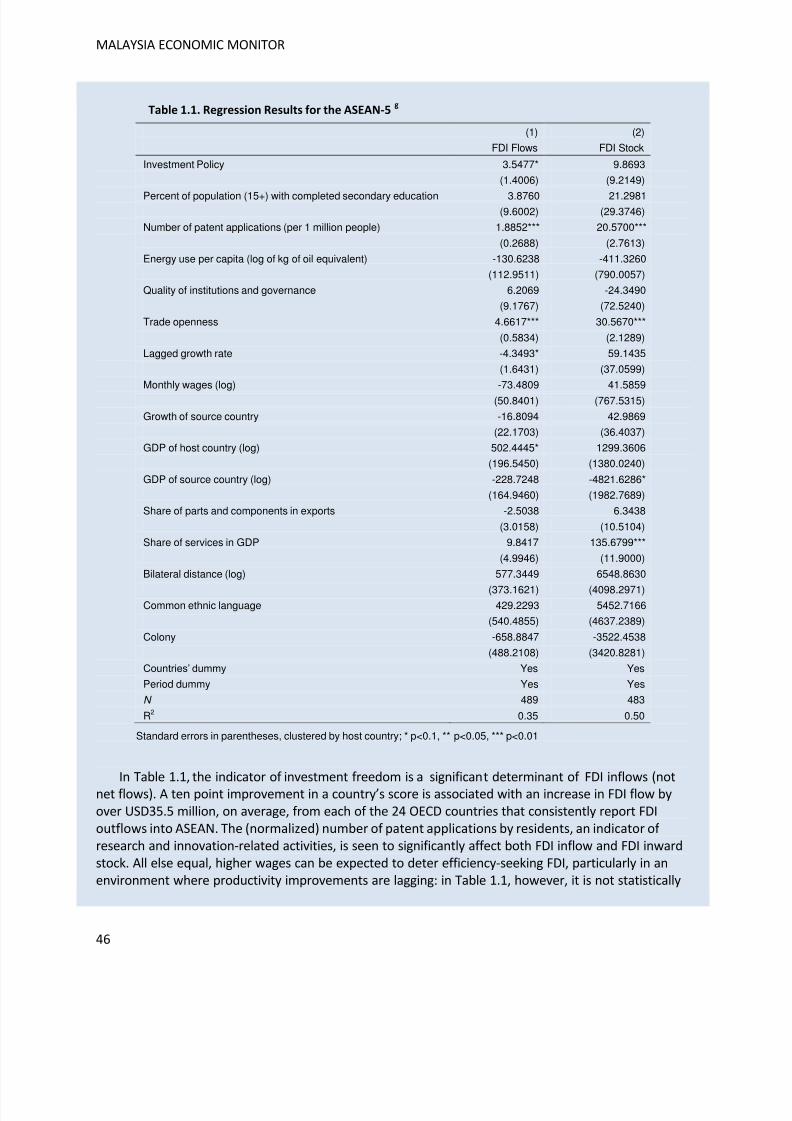
8/6/2019 World Bank Economic Monitor - Malaysia Brain Drain (April 2011)
http://slidepdf.com/reader/full/world-bank-economic-monitor-malaysia-brain-drain-april-2011 46/150
MALAYSIA ECONOMIC MONITOR
46
Table 1.1. Regression Results for the ASEAN-5g
(1) (2)
FDI Flows FDI Stock
Investment Policy 3.5477* 9.8693
(1.4006) (9.2149)
Percent of population (15+) with completed secondary education 3.8760 21.2981(9.6002) (29.3746)
Number of patent applications (per 1 million people) 1.8852*** 20.5700***
(0.2688) (2.7613)
Energy use per capita (log of kg of oil equivalent) -130.6238 -411.3260
(112.9511) (790.0057)
Quality of institutions and governance 6.2069 -24.3490
(9.1767) (72.5240)
Trade openness 4.6617*** 30.5670***
(0.5834) (2.1289)
Lagged growth rate -4.3493* 59.1435
(1.6431) (37.0599)
Monthly wages (log) -73.4809 41.5859
(50.8401) (767.5315)
Growth of source country -16.8094 42.9869
(22.1703) (36.4037)
GDP of host country (log) 502.4445* 1299.3606
(196.5450) (1380.0240)
GDP of source country (log) -228.7248 -4821.6286*
(164.9460) (1982.7689)
Share of parts and components in exports -2.5038 6.3438
(3.0158) (10.5104)
Share of services in GDP 9.8417 135.6799***
(4.9946) (11.9000)
Bilateral distance (log) 577.3449 6548.8630
(373.1621) (4098.2971)Common ethnic language 429.2293 5452.7166
(540.4855) (4637.2389)
Colony -658.8847 -3522.4538
(488.2108) (3420.8281)
Countries’ dummy Yes Yes
Period dummy Yes Yes
N 489 483
R2 0.35 0.50
Standard errors in parentheses, clustered by host country; * p<0.1, ** p<0.05, *** p<0.01
In Table 1.1, the indicator of investment freedom is a significant determinant of FDI inflows (notnet flows). A ten point improvement in a country’s score is associated with an increase in FDI flow byover USD35.5 million, on average, from each of the 24 OECD countries that consistently report FDIoutflows into ASEAN. The (normalized) number of patent applications by residents, an indicator of research and innovation-related activities, is seen to significantly affect both FDI inflow and FDI inwardstock. All else equal, higher wages can be expected to deter efficiency-seeking FDI, particularly in anenvironment where productivity improvements are lagging: in Table 1.1, however, it is not statistically
8/6/2019 World Bank Economic Monitor - Malaysia Brain Drain (April 2011)
http://slidepdf.com/reader/full/world-bank-economic-monitor-malaysia-brain-drain-april-2011 47/150
RECENT ECONOMIC DEVELOPMENTS
47
significant. Completion rates for secondary education, the quality of governance, and the quality of infrastructure (proxied by energy use) also do not show up as significant. As expected, some variablesare more important for FDI stock than FDI flows.
Openness to trade, which reflects the degree of competition and facilitation of cross-border
movement of goods, is a significant determinant of both FDI flows and FDI stock. GDP of host countries,an indicator of market size, also attracts FDI. Perhaps reflecting the fact that an increasing share of FDIis in services (or that services facilitate manufacturing exports and, therefore, vertical FDI) an economywith increasing value-addition derived from the services sector attracts more FDI. In Malaysia,investment climate surveys show that manufacturing firms consider the supply of business supportservices inadequate and perceive it to be a binding constraint. Surprisingly, (logged) GDP of sourcecountries is not significant, as is none of the gravity variables. From this regression analysis, twofactors stand out as those that are important and can be influenced in the short-to-medium run by
policymakers: investment policy, and skills and innovation.
To realize FDI potential, improvements are necessary in investment policy, innovation and skills
From Table 1.1, only those variables that are significant below the 10 percent level in explainingeither FDI inflows or inward FDI stock are retained for the purpose of predicting FDI. We regress a newmodel only with these significant variables (e.g., investment policy, patents, trade orientation, GDP andlagged economic growth rate of host country, GDP of source country, and the share of services). Then,the average values of explanatory variables for Malaysia during 2007-09 are computed and multipliedby the regression coefficients obtained from the new model. Together with coefficients on the timedummy for 2007-09 and the country dummy for Malaysia, the linear combination of regressioncoefficients and mean regressor values predicts FDI inflows for Malaysia. This is then contrasted withthe actual FDI inflow during the same period.
Table 1.2 shows that the regression model predicts an average FDI inflow into Malaysia from (24)
OECD countries to be USD5.5 billion. This is much higher than the actual FDI inflow of USD3.8 billionfrom these countries. Thus, based on the average performance of Malaysia and its peers in the regionduring 2007-09, Malaysia appears to have attracted less FDI than expected from OECD countries. Nocountry in ASEAN-5 has been immune to the ‘cyclical’ fluctuations in FDI, especially around the crisisyears of 1997-98, 2000-01, and 2008. All of them have suffered a dip and then rebounded. Neither theGDP of FDI source countries nor their growth rates—both major sources of cyclicality in FDI flows— come out as a positively significant determinant of the variation in FDI inflows into ASEAN-5. Incontrast, in the model that captures average effects of variables like policies, innovation, institutions,and infrastructure over time, Malaysia underperforms. This points to structural shortcomings over themedium to long term, and points to structural rather than cyclical factors. The model predicts that FDIcould weaken further if weaknesses in investment policy environment and innovation persist.
Similarly, actual stock of FDI is much lower than predicted for 2007-09. Because FDI stock reflects
the existing value of capital (net of debt) from past investments, it is surprising given Malaysia’s successin the earlier period in attracting FDI that the stock is still much lower than what a linear regressionmodel would predict.
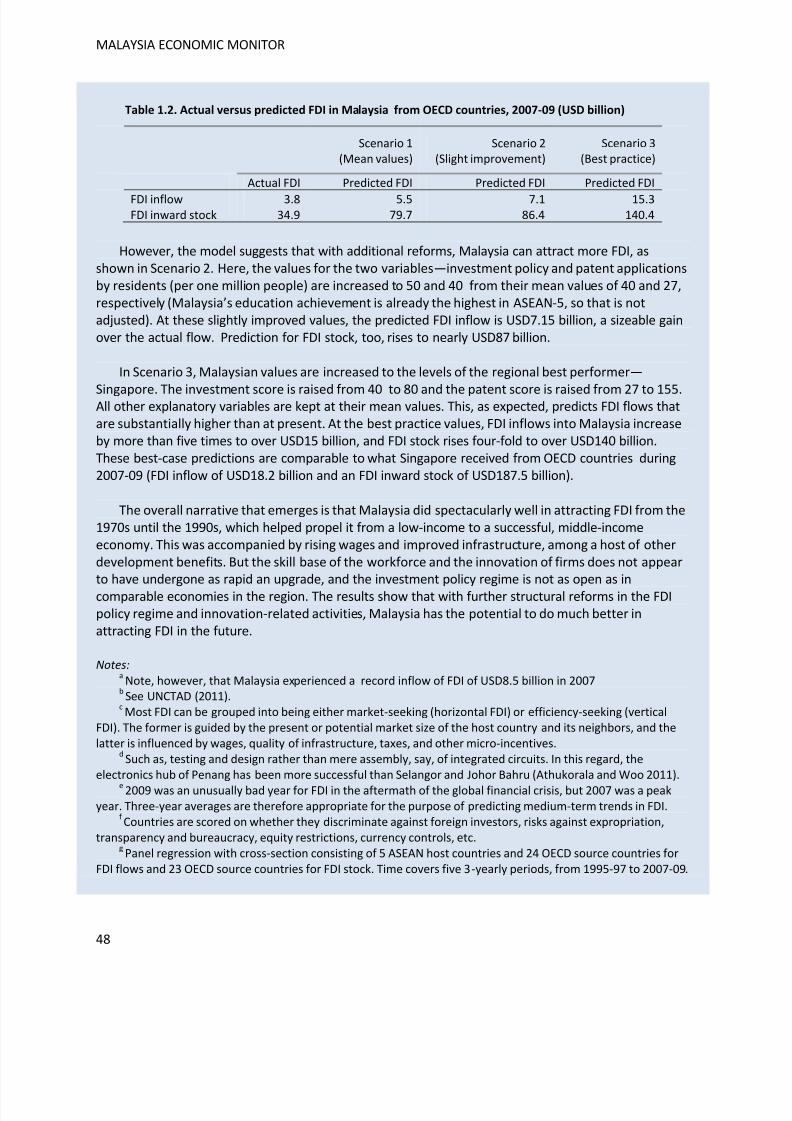
8/6/2019 World Bank Economic Monitor - Malaysia Brain Drain (April 2011)
http://slidepdf.com/reader/full/world-bank-economic-monitor-malaysia-brain-drain-april-2011 48/150
MALAYSIA ECONOMIC MONITOR
48
Table 1.2. Actual versus predicted FDI in Malaysia from OECD countries, 2007-09 (USD billion)
Scenario 1(Mean values)
Scenario 2(Slight improvement)
Scenario 3(Best practice)
Actual FDI Predicted FDI Predicted FDI Predicted FDI
FDI inflow 3.8 5.5 7.1 15.3FDI inward stock 34.9 79.7 86.4 140.4
However, the model suggests that with additional reforms, Malaysia can attract more FDI, asshown in Scenario 2. Here, the values for the two variables—investment policy and patent applicationsby residents (per one million people) are increased to 50 and 40 from their mean values of 40 and 27,respectively (Malaysia’s education achievement is already the highest in ASEAN-5, so that is notadjusted). At these slightly improved values, the predicted FDI inflow is USD7.15 billion, a sizeable gainover the actual flow. Prediction for FDI stock, too, rises to nearly USD87 billion.
In Scenario 3, Malaysian values are increased to the levels of the regional best performer—
Singapore. The investment score is raised from 40 to 80 and the patent score is raised from 27 to 155.All other explanatory variables are kept at their mean values. This, as expected, predicts FDI flows thatare substantially higher than at present. At the best practice values, FDI inflows into Malaysia increaseby more than five times to over USD15 billion, and FDI stock rises four-fold to over USD140 billion.These best-case predictions are comparable to what Singapore received from OECD countries during2007-09 (FDI inflow of USD18.2 billion and an FDI inward stock of USD187.5 billion).
The overall narrative that emerges is that Malaysia did spectacularly well in attracting FDI from the1970s until the 1990s, which helped propel it from a low-income to a successful, middle-incomeeconomy. This was accompanied by rising wages and improved infrastructure, among a host of otherdevelopment benefits. But the skill base of the workforce and the innovation of firms does not appearto have undergone as rapid an upgrade, and the investment policy regime is not as open as incomparable economies in the region. The results show that with further structural reforms in the FDIpolicy regime and innovation-related activities, Malaysia has the potential to do much better inattracting FDI in the future.
Notes:a
Note, however, that Malaysia experienced a record inflow of FDI of USD8.5 billion in 2007b
See UNCTAD (2011).cMost FDI can be grouped into being either market-seeking (horizontal FDI) or efficiency-seeking (vertical
FDI). The former is guided by the present or potential market size of the host country and its neighbors, and the
latter is influenced by wages, quality of infrastructure, taxes, and other micro-incentives.
dSuch as, testing and design rather than mere assembly, say, of integrated circuits. In this regard, the
electronics hub of Penang has been more successful than Selangor and Johor Bahru (Athukorala and Woo 2011).e 2009 was an unusually bad year for FDI in the aftermath of the global financial crisis, but 2007 was a peak
year. Three-year averages are therefore appropriate for the purpose of predicting medium-term trends in FDI.f Countries are scored on whether they discriminate against foreign investors, risks against expropriation,
transparency and bureaucracy, equity restrictions, currency controls, etc.gPanel regression with cross-section consisting of 5 ASEAN host countries and 24 OECD source countries for
FDI flows and 23 OECD source countries for FDI stock. Time covers five 3-yearly periods, from 1995-97 to 2007-09.
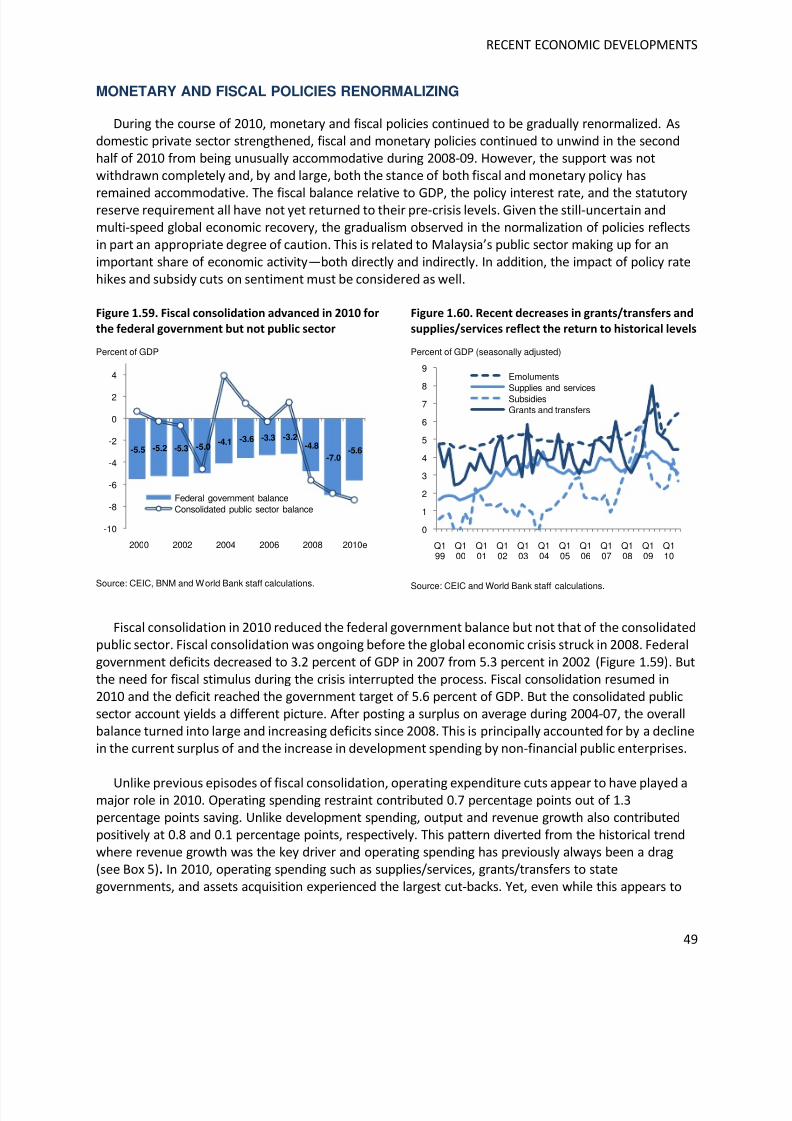
8/6/2019 World Bank Economic Monitor - Malaysia Brain Drain (April 2011)
http://slidepdf.com/reader/full/world-bank-economic-monitor-malaysia-brain-drain-april-2011 49/150
RECENT ECONOMIC DEVELOPMENTS
49
MONETARY AND FISCAL POLICIES RENORMALIZING
During the course of 2010, monetary and fiscal policies continued to be gradually renormalized. Asdomestic private sector strengthened, fiscal and monetary policies continued to unwind in the secondhalf of 2010 from being unusually accommodative during 2008-09. However, the support was notwithdrawn completely and, by and large, both the stance of both fiscal and monetary policy has
remained accommodative. The fiscal balance relative to GDP, the policy interest rate, and the statutoryreserve requirement all have not yet returned to their pre-crisis levels. Given the still-uncertain andmulti-speed global economic recovery, the gradualism observed in the normalization of policies reflectsin part an appropriate degree of caution. This is related to Malaysia’s public sector making up for animportant share of economic activity—both directly and indirectly. In addition, the impact of policy ratehikes and subsidy cuts on sentiment must be considered as well.
Figure 1.59. Fiscal consolidation advanced in 2010 for
the federal government but not public sector
Percent of GDP
Source: CEIC, BNM and World Bank staff calculations.
Figure 1.60. Recent decreases in grants/transfers and
supplies/services reflect the return to historical levels
Percent of GDP (seasonally adjusted)
Source: CEIC and World Bank staff calculations.
Fiscal consolidation in 2010 reduced the federal government balance but not that of the consolidatedpublic sector. Fiscal consolidation was ongoing before the global economic crisis struck in 2008. Federalgovernment deficits decreased to 3.2 percent of GDP in 2007 from 5.3 percent in 2002 (Figure 1.59). Butthe need for fiscal stimulus during the crisis interrupted the process. Fiscal consolidation resumed in2010 and the deficit reached the government target of 5.6 percent of GDP. But the consolidated publicsector account yields a different picture. After posting a surplus on average during 2004-07, the overallbalance turned into large and increasing deficits since 2008. This is principally accounted for by a declinein the current surplus of and the increase in development spending by non-financial public enterprises.
Unlike previous episodes of fiscal consolidation, operating expenditure cuts appear to have played amajor role in 2010. Operating spending restraint contributed 0.7 percentage points out of 1.3percentage points saving. Unlike development spending, output and revenue growth also contributedpositively at 0.8 and 0.1 percentage points, respectively. This pattern diverted from the historical trendwhere revenue growth was the key driver and operating spending has previously always been a drag(see Box 5). In 2010, operating spending such as supplies/services, grants/transfers to stategovernments, and assets acquisition experienced the largest cut-backs. Yet, even while this appears to
-5.5 -5.2 -5.3 -5.0-4.1 -3.6 -3.3 -3.2
-4.8
-7.0-5.6
-10
-8
-6
-4
-2
0
2
4
2000 2002 2004 2006 2008 2010e
Federal government balanceConsolidated public sector balance
0
1
2
3
4
5
6
7
8
9
Q199
Q100
Q101
Q102
Q103
Q104
Q105
Q106
Q107
Q108
Q109
Q110
Emoluments
Supplies and servicesSubsidiesGrants and transfers
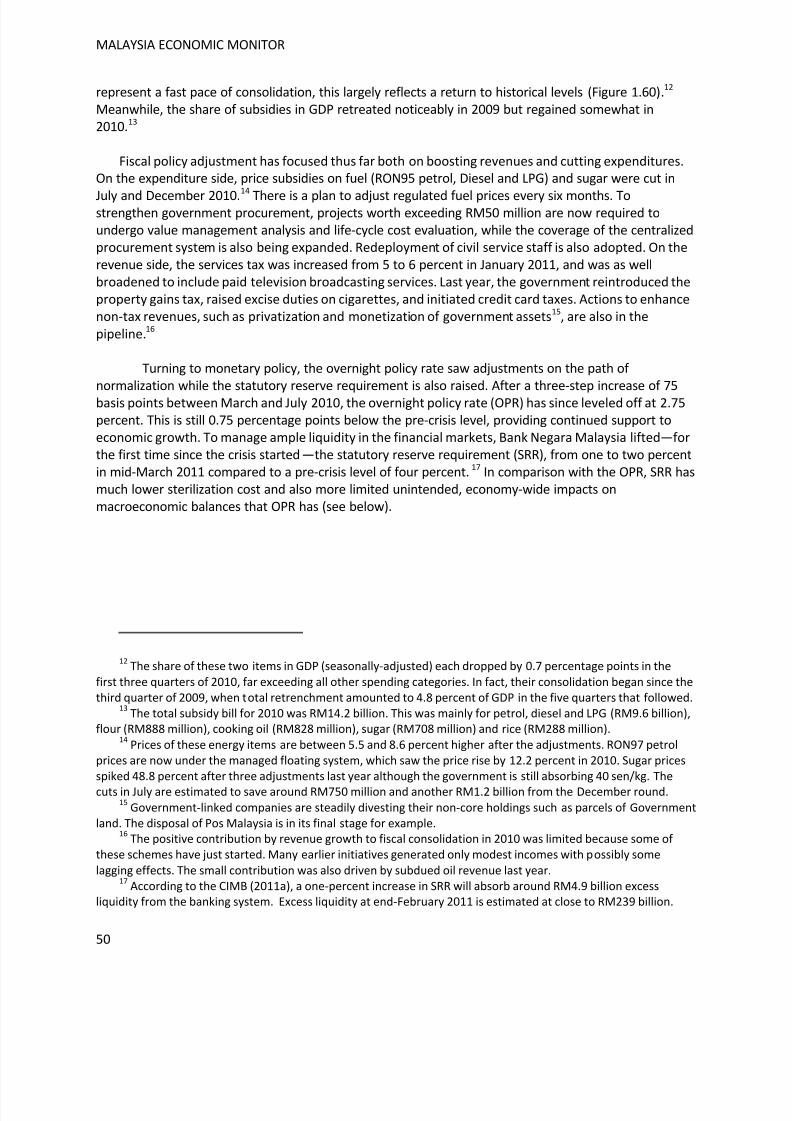
8/6/2019 World Bank Economic Monitor - Malaysia Brain Drain (April 2011)
http://slidepdf.com/reader/full/world-bank-economic-monitor-malaysia-brain-drain-april-2011 50/150
MALAYSIA ECONOMIC MONITOR
50
represent a fast pace of consolidation, this largely reflects a return to historical levels (Figure 1.60).12 Meanwhile, the share of subsidies in GDP retreated noticeably in 2009 but regained somewhat in2010.13
Fiscal policy adjustment has focused thus far both on boosting revenues and cutting expenditures.On the expenditure side, price subsidies on fuel (RON95 petrol, Diesel and LPG) and sugar were cut in
July and December 2010.14
There is a plan to adjust regulated fuel prices every six months. Tostrengthen government procurement, projects worth exceeding RM50 million are now required toundergo value management analysis and life-cycle cost evaluation, while the coverage of the centralizedprocurement system is also being expanded. Redeployment of civil service staff is also adopted. On therevenue side, the services tax was increased from 5 to 6 percent in January 2011, and was as wellbroadened to include paid television broadcasting services. Last year, the government reintroduced theproperty gains tax, raised excise duties on cigarettes, and initiated credit card taxes. Actions to enhancenon-tax revenues, such as privatization and monetization of government assets15, are also in the
pipeline.16
Turning to monetary policy, the overnight policy rate saw adjustments on the path of normalization while the statutory reserve requirement is also raised. After a three-step increase of 75basis points between March and July 2010, the overnight policy rate (OPR) has since leveled off at 2.75percent. This is still 0.75 percentage points below the pre-crisis level, providing continued support toeconomic growth. To manage ample liquidity in the financial markets, Bank Negara Malaysia lifted—forthe first time since the crisis started—the statutory reserve requirement (SRR), from one to two percentin mid-March 2011 compared to a pre-crisis level of four percent. 17 In comparison with the OPR, SRR hasmuch lower sterilization cost and also more limited unintended, economy-wide impacts onmacroeconomic balances that OPR has (see below).
12The share of these two items in GDP (seasonally-adjusted) each dropped by 0.7 percentage points in the
first three quarters of 2010, far exceeding all other spending categories. In fact, their consolidation began since the
third quarter of 2009, when total retrenchment amounted to 4.8 percent of GDP in the five quarters that followed.13
The total subsidy bill for 2010 was RM14.2 billion. This was mainly for petrol, diesel and LPG (RM9.6 billion),flour (RM888 million), cooking oil (RM828 million), sugar (RM708 million) and rice (RM288 million).
14Prices of these energy items are between 5.5 and 8.6 percent higher after the adjustments. RON97 petrol
prices are now under the managed floating system, which saw the price rise by 12.2 percent in 2010. Sugar prices
spiked 48.8 percent after three adjustments last year although the government is still absorbing 40 sen/kg. The
cuts in July are estimated to save around RM750 million and another RM1.2 billion from the December round.15
Government-linked companies are steadily divesting their non-core holdings such as parcels of Government
land. The disposal of Pos Malaysia is in its final stage for example.16
The positive contribution by revenue growth to fiscal consolidation in 2010 was limited because some of
these schemes have just started. Many earlier initiatives generated only modest incomes with possibly some
lagging effects. The small contribution was also driven by subdued oil revenue last year.17
According to the CIMB (2011a), a one-percent increase in SRR will absorb around RM4.9 billion excessliquidity from the banking system. Excess liquidity at end-February 2011 is estimated at close to RM239 billion.
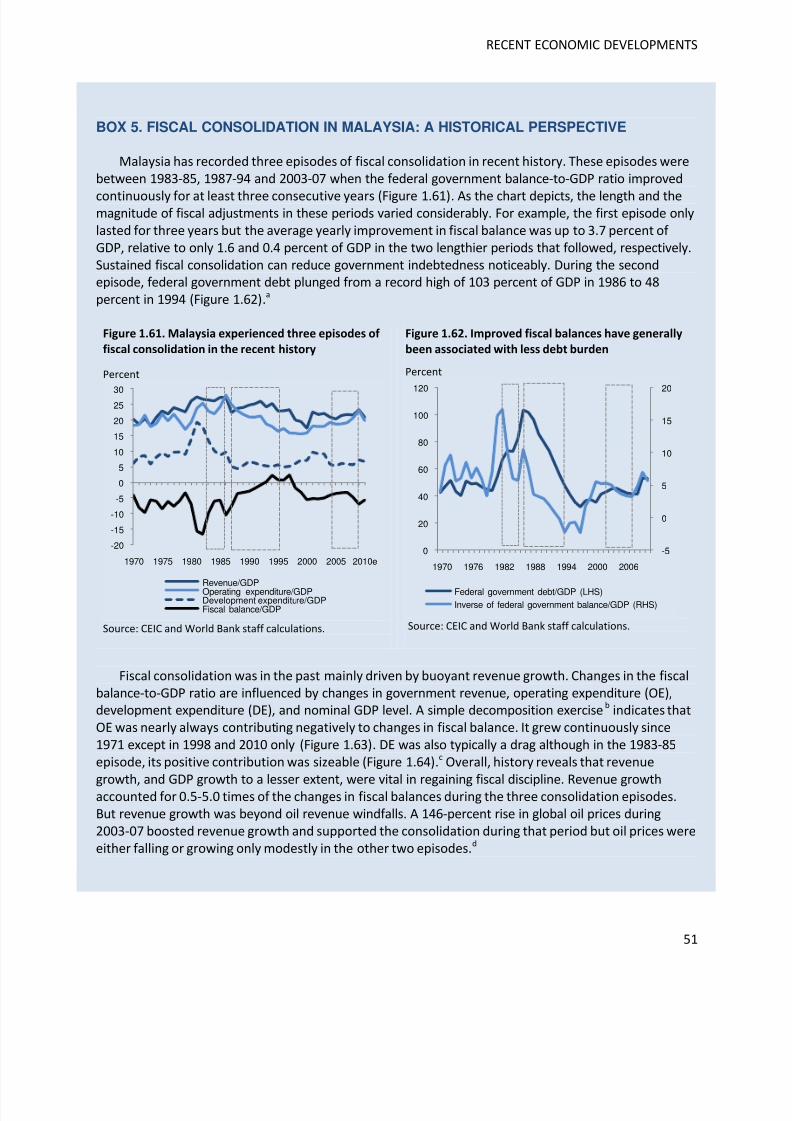
8/6/2019 World Bank Economic Monitor - Malaysia Brain Drain (April 2011)
http://slidepdf.com/reader/full/world-bank-economic-monitor-malaysia-brain-drain-april-2011 51/150
RECENT ECONOMIC DEVELOPMENTS
51
BOX 5. FISCAL CONSOLIDATION IN MALAYSIA: A HISTORICAL PERSPECTIVE
Malaysia has recorded three episodes of fiscal consolidation in recent history. These episodes werebetween 1983-85, 1987-94 and 2003-07 when the federal government balance-to-GDP ratio improved
continuously for at least three consecutive years (Figure 1.61). As the chart depicts, the length and themagnitude of fiscal adjustments in these periods varied considerably. For example, the first episode onlylasted for three years but the average yearly improvement in fiscal balance was up to 3.7 percent of GDP, relative to only 1.6 and 0.4 percent of GDP in the two lengthier periods that followed, respectively.Sustained fiscal consolidation can reduce government indebtedness noticeably. During the secondepisode, federal government debt plunged from a record high of 103 percent of GDP in 1986 to 48percent in 1994 (Figure 1.62).a
Figure 1.61. Malaysia experienced three episodes of
fiscal consolidation in the recent history
Percent
Source: CEIC and World Bank staff calculations.
Figure 1.62. Improved fiscal balances have generally
been associated with less debt burden
Percent
Source: CEIC and World Bank staff calculations.
Fiscal consolidation was in the past mainly driven by buoyant revenue growth. Changes in the fiscalbalance-to-GDP ratio are influenced by changes in government revenue, operating expenditure (OE),development expenditure (DE), and nominal GDP level. A simple decomposition exerciseb indicates thatOE was nearly always contributing negatively to changes in fiscal balance. It grew continuously since1971 except in 1998 and 2010 only (Figure 1.63). DE was also typically a drag although in the 1983-85episode, its positive contribution was sizeable (Figure 1.64).c Overall, history reveals that revenue
growth, and GDP growth to a lesser extent, were vital in regaining fiscal discipline. Revenue growthaccounted for 0.5-5.0 times of the changes in fiscal balances during the three consolidation episodes.But revenue growth was beyond oil revenue windfalls. A 146-percent rise in global oil prices during2003-07 boosted revenue growth and supported the consolidation during that period but oil prices wereeither falling or growing only modestly in the other two episodes.d
-20
-15
-10
-5
0
5
10
15
20
2530
1970 1975 1980 1985 1990 1995 2000 2005 2010e
Revenue/GDPOperating expenditure/GDPDevelopment expenditure/GDPFiscal balance/GDP
-5
0
5
10
15
20
0
20
40
60
80
100
120
1970 1976 1982 1988 1994 2000 2006
Federal government debt/GDP (LHS)Inverse of federal government balance/GDP (RHS)
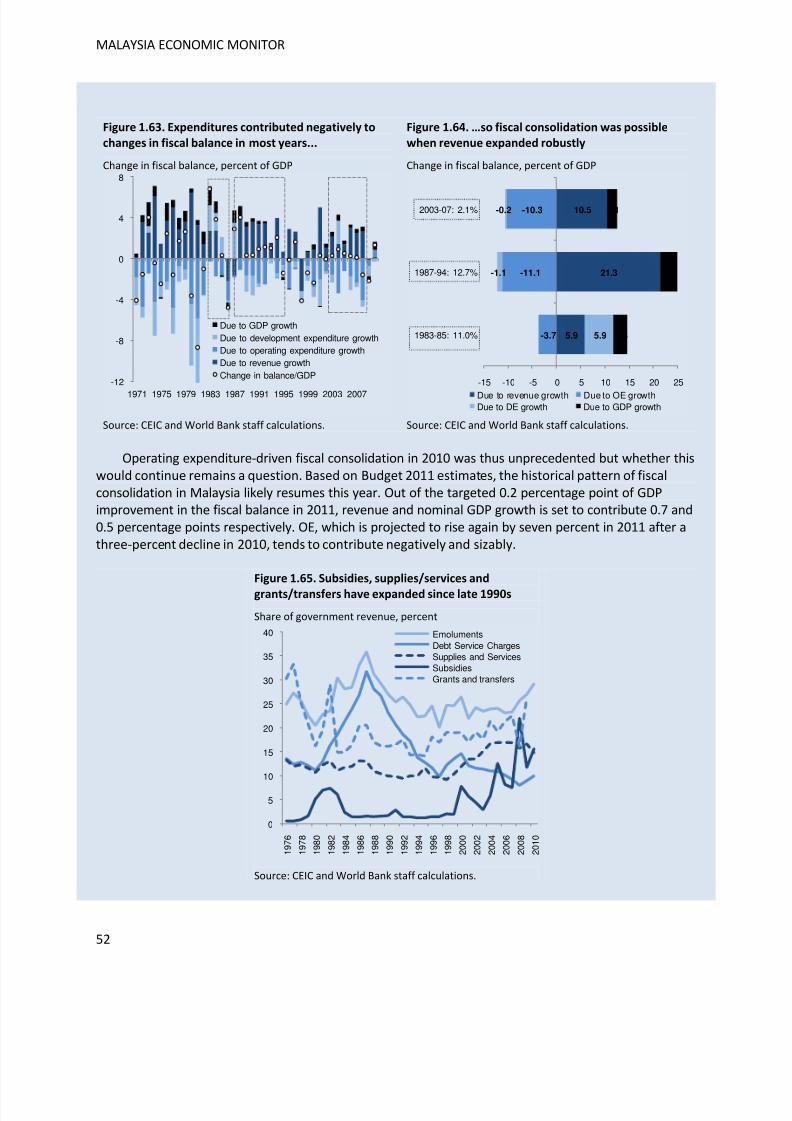
8/6/2019 World Bank Economic Monitor - Malaysia Brain Drain (April 2011)
http://slidepdf.com/reader/full/world-bank-economic-monitor-malaysia-brain-drain-april-2011 52/150
MALAYSIA ECONOMIC MONITOR
52
Figure 1.63. Expenditures contributed negatively to
changes in fiscal balance in most years...
Change in fiscal balance, percent of GDP
Source: CEIC and World Bank staff calculations.
Figure 1.64. …so fiscal consolidation was possible
when revenue expanded robustly
Change in fiscal balance, percent of GDP
Source: CEIC and World Bank staff calculations.
Operating expenditure-driven fiscal consolidation in 2010 was thus unprecedented but whether thiswould continue remains a question. Based on Budget 2011 estimates, the historical pattern of fiscalconsolidation in Malaysia likely resumes this year. Out of the targeted 0.2 percentage point of GDPimprovement in the fiscal balance in 2011, revenue and nominal GDP growth is set to contribute 0.7 and0.5 percentage points respectively. OE, which is projected to rise again by seven percent in 2011 after athree-percent decline in 2010, tends to contribute negatively and sizably.
Figure 1.65. Subsidies, supplies/services and
grants/transfers have expanded since late 1990s
Share of government revenue, percent
Source: CEIC and World Bank staff calculations.
-12
-8
-4
0
4
8
1971 1975 1979 1983 1987 1991 1995 1999 2003 2007
Due to GDP growthDue to development expenditure growthDue to operating expenditure growthDue to revenue growthChange in balance/GDP
5.9
21.3
10.5
-3.7
-11.1
-10.3
5.9
-1.1
-0.2
2.8
3.6
2.1
-15 -10 -5 0 5 10 15 20 25
1983-85: 11.0%
1987-94: 12.7%
2003-07: 2.1%
Due to revenue growth Due to OE growthDue to DE growth Due to GDP growth
0
5
10
15
20
25
30
35
40
1 9 7 6
1 9 7 8
1 9 8 0
1 9 8 2
1 9 8 4
1 9 8 6
1 9 8 8
1 9 9 0
1 9 9 2
1 9 9 4
1 9 9 6
1 9 9 8
2 0 0 0
2 0 0 2
2 0 0 4
2 0 0 6
2 0 0 8
2 0 1 0
EmolumentsDebt Service ChargesSupplies and ServicesSubsidiesGrants and transfers
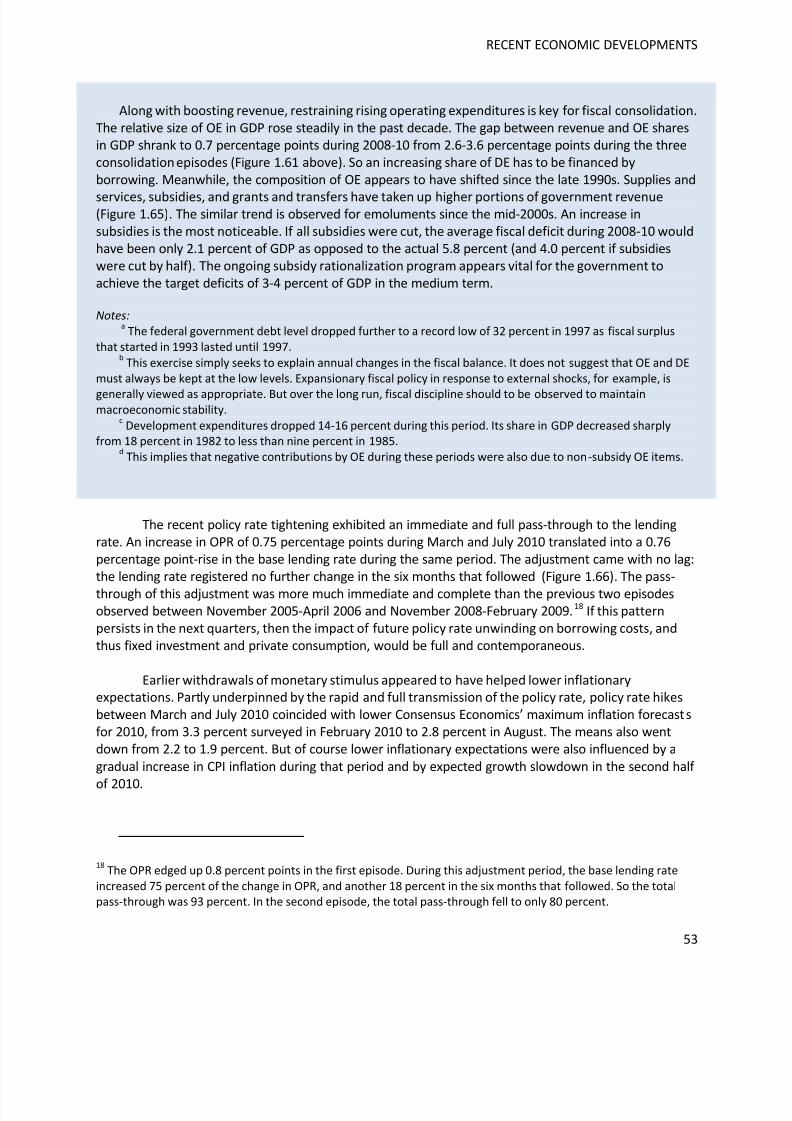
8/6/2019 World Bank Economic Monitor - Malaysia Brain Drain (April 2011)
http://slidepdf.com/reader/full/world-bank-economic-monitor-malaysia-brain-drain-april-2011 53/150
RECENT ECONOMIC DEVELOPMENTS
53
Along with boosting revenue, restraining rising operating expenditures is key for fiscal consolidation.The relative size of OE in GDP rose steadily in the past decade. The gap between revenue and OE sharesin GDP shrank to 0.7 percentage points during 2008-10 from 2.6-3.6 percentage points during the threeconsolidation episodes (Figure 1.61 above). So an increasing share of DE has to be financed byborrowing. Meanwhile, the composition of OE appears to have shifted since the late 1990s. Supplies and
services, subsidies, and grants and transfers have taken up higher portions of government revenue(Figure 1.65). The similar trend is observed for emoluments since the mid-2000s. An increase insubsidies is the most noticeable. If all subsidies were cut, the average fiscal deficit during 2008-10 wouldhave been only 2.1 percent of GDP as opposed to the actual 5.8 percent (and 4.0 percent if subsidieswere cut by half). The ongoing subsidy rationalization program appears vital for the government toachieve the target deficits of 3-4 percent of GDP in the medium term.
Notes:
aThe federal government debt level dropped further to a record low of 32 percent in 1997 as fiscal surplus
that started in 1993 lasted until 1997.b
This exercise simply seeks to explain annual changes in the fiscal balance. It does not suggest that OE and DE
must always be kept at the low levels. Expansionary fiscal policy in response to external shocks, for example, is
generally viewed as appropriate. But over the long run, fiscal discipline should to be observed to maintainmacroeconomic stability.
cDevelopment expenditures dropped 14-16 percent during this period. Its share in GDP decreased sharply
from 18 percent in 1982 to less than nine percent in 1985.d
This implies that negative contributions by OE during these periods were also due to non-subsidy OE items.
The recent policy rate tightening exhibited an immediate and full pass-through to the lendingrate. An increase in OPR of 0.75 percentage points during March and July 2010 translated into a 0.76percentage point-rise in the base lending rate during the same period. The adjustment came with no lag:the lending rate registered no further change in the six months that followed (Figure 1.66). The pass-
through of this adjustment was more much immediate and complete than the previous two episodesobserved between November 2005-April 2006 and November 2008-February 2009.18 If this patternpersists in the next quarters, then the impact of future policy rate unwinding on borrowing costs, andthus fixed investment and private consumption, would be full and contemporaneous.
Earlier withdrawals of monetary stimulus appeared to have helped lower inflationaryexpectations. Partly underpinned by the rapid and full transmission of the policy rate, policy rate hikesbetween March and July 2010 coincided with lower Consensus Economics’ maximum inflation forecastsfor 2010, from 3.3 percent surveyed in February 2010 to 2.8 percent in August. The means also wentdown from 2.2 to 1.9 percent. But of course lower inflationary expectations were also influenced by a
gradual increase in CPI inflation during that period and by expected growth slowdown in the second half
of 2010.
18The OPR edged up 0.8 percent points in the first episode. During this adjustment period, the base lending rate
increased 75 percent of the change in OPR, and another 18 percent in the six months that followed. So the totalpass-through was 93 percent. In the second episode, the total pass-through fell to only 80 percent.
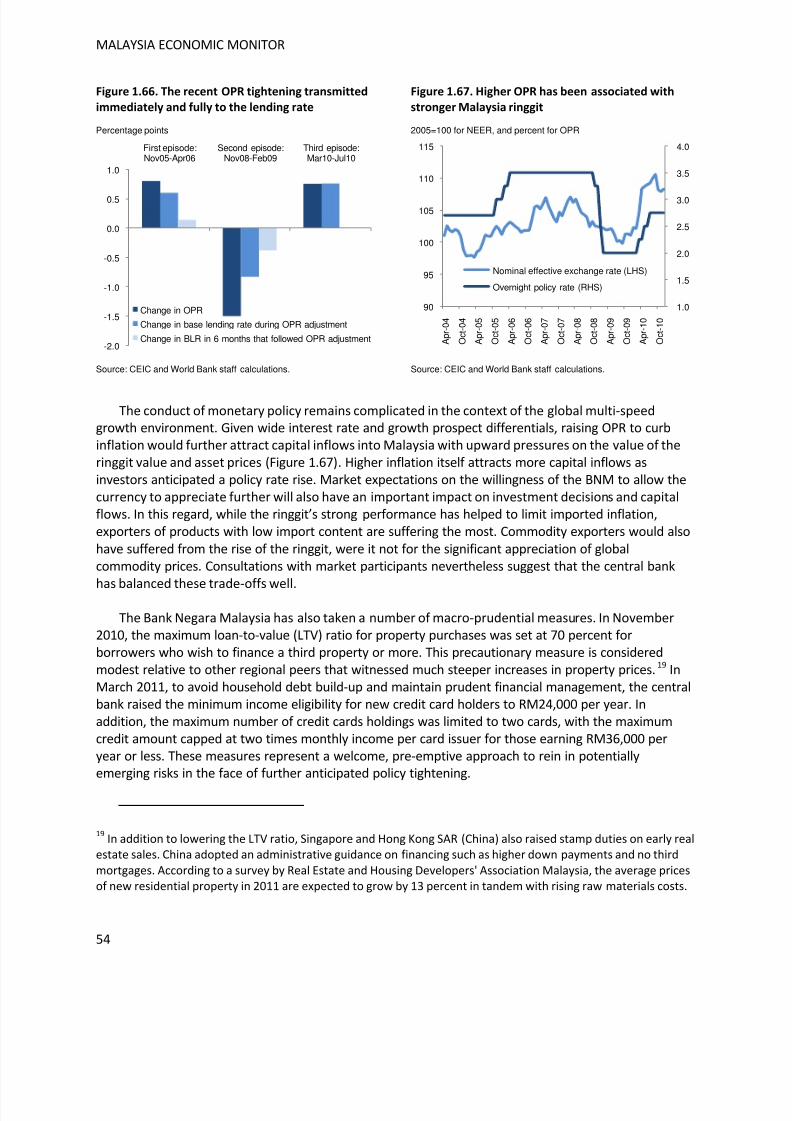
8/6/2019 World Bank Economic Monitor - Malaysia Brain Drain (April 2011)
http://slidepdf.com/reader/full/world-bank-economic-monitor-malaysia-brain-drain-april-2011 54/150
MALAYSIA ECONOMIC MONITOR
54
Figure 1.66. The recent OPR tightening transmitted
immediately and fully to the lending rate
Percentage points
Source: CEIC and World Bank staff calculations.
Figure 1.67. Higher OPR has been associated with
stronger Malaysia ringgit
2005=100 for NEER, and percent for OPR
Source: CEIC and World Bank staff calculations.
The conduct of monetary policy remains complicated in the context of the global multi-speedgrowth environment. Given wide interest rate and growth prospect differentials, raising OPR to curbinflation would further attract capital inflows into Malaysia with upward pressures on the value of theringgit value and asset prices (Figure 1.67). Higher inflation itself attracts more capital inflows asinvestors anticipated a policy rate rise. Market expectations on the willingness of the BNM to allow thecurrency to appreciate further will also have an important impact on investment decisions and capitalflows. In this regard, while the ringgit’s strong performance has helped to limit imported inflation,exporters of products with low import content are suffering the most. Commodity exporters would also
have suffered from the rise of the ringgit, were it not for the significant appreciation of globalcommodity prices. Consultations with market participants nevertheless suggest that the central bank
has balanced these trade-offs well.
The Bank Negara Malaysia has also taken a number of macro-prudential measures. In November2010, the maximum loan-to-value (LTV) ratio for property purchases was set at 70 percent forborrowers who wish to finance a third property or more. This precautionary measure is consideredmodest relative to other regional peers that witnessed much steeper increases in property prices.19 InMarch 2011, to avoid household debt build-up and maintain prudent financial management, the centralbank raised the minimum income eligibility for new credit card holders to RM24,000 per year. Inaddition, the maximum number of credit cards holdings was limited to two cards, with the maximumcredit amount capped at two times monthly income per card issuer for those earning RM36,000 peryear or less. These measures represent a welcome, pre-emptive approach to rein in potentiallyemerging risks in the face of further anticipated policy tightening.
19In addition to lowering the LTV ratio, Singapore and Hong Kong SAR (China) also raised stamp duties on early real
estate sales. China adopted an administrative guidance on financing such as higher down payments and no third
mortgages. According to a survey by Real Estate and Housing Developers' Association Malaysia, the average prices
of new residential property in 2011 are expected to grow by 13 percent in tandem with rising raw materials costs.
-2.0
-1.5
-1.0
-0.5
0.0
0.5
1.0
First episode:Nov05-Apr06
Second episode:Nov08-Feb09
Third episode:Mar10-Jul10
Change in OPR
Change in base lending rate during OPR adjustment
Change in BLR in 6 months that followed OPR adjustment
1.0
1.5
2.0
2.5
3.0
3.5
4.0
90
95
100
105
110
115
A p r - 0 4
O c t - 0 4
A p r - 0 5
O c t - 0 5
A p r - 0 6
O c t - 0 6
A p r - 0 7
O c t - 0 7
A p r - 0 8
O c t - 0 8
A p r - 0 9
O c t - 0 9
A p r - 1 0
O c t - 1 0
Nominal effective exchange rate (LHS)
Overnight policy rate (RHS)

8/6/2019 World Bank Economic Monitor - Malaysia Brain Drain (April 2011)
http://slidepdf.com/reader/full/world-bank-economic-monitor-malaysia-brain-drain-april-2011 55/150
RECENT ECONOMIC DEVELOPMENTS
55
On capital market development policy, the second masterplan (2011-2020) with the theme ongrowth and governance is launched in April. Among others, the growth theme focuses on promotingcapital formation, expanding intermediation efficiency and scope, and deepening liquidity. Thegovernance aspect seeks to enhance regulatory framework, strengthen accountability, and augmentoversight of risks. Financing innovative ventures, large-scale projects, and frontier green technology is
also one of the priorities. Detailed measures that should be effective later this year are deregulations onfundraising, introduction of a new dual licensing scheme allowing dealers to trade in both the equity andderivatives markets, and increase in the number of proprietary day traders.
8/6/2019 World Bank Economic Monitor - Malaysia Brain Drain (April 2011)
http://slidepdf.com/reader/full/world-bank-economic-monitor-malaysia-brain-drain-april-2011 56/150
2. ECONOMIC OUTLOOK
The multi-speed nature of the global recovery, as seen in 2010, is expected to proceed into 2011,
but with some heightened risks. Growth momentum in both advanced and emerging economiesremains positive, but is expected to slow slightly. As the global recovery continues, macroeconomicpolicies will likely normalize further, though with geographical variations in pace. The conduct of globalmacroeconomic policy will likely remain complicated by the persistence of elevated inflationarypressures and the continued volatility in global capital flows.
As to the near-term outlook, the baseline forecast assumptions have generally improved comparedto our previous assessment in November 2010. Growth projections are therefore upgraded. Real outputgrowth in the coming years should resume its historical trend. Since external demand remains fragile,domestic demand would be propelling the Malaysian economy, particularly private consumption andfixed investment as fiscal consolidation moves forward. Downside risks, mainly from external factors,
remain considerable.
Whereas the near-term outlook for Malaysia is highly dependent on external developments, themedium-term outlook will depend to a large extent on the domestic structural reform agenda. On thisfront, the Government of Malaysia has launched over the last year a series of initiatives centered aroundthe objective of transforming Malaysia into a high-income economy through a process of inclusive andsustainable growth. These initiatives are welcome and provide a sound basis to revitalize the engine of growth. The medium-term outlook remains subject to upside and downside risks, both of them relatingto the degree of implementation of the structural reform agenda.
GLOBAL RECOVERY EXPECTED TO CONTINUE
The uneven global recovery is expected to proceed, albeit more moderately, amid heighteneduncertainty. Overall global GDP is projected to grow by 3.3 percent in 2011, before picking up to 3.6percent in 2012 (Table 2.1). The emerging economies are expected to continue to lead global growth,
driven mainly by strong domestic demand. Meanwhile, growth in the advanced economies will likelyremain dampened by necessary fiscal and household consolidation, as well as restructuring in thebanking and property sectors. Notwithstanding this, heightened downside risks on the sustainability of global recovery exist. There are three concerns: the pace of macroeconomic policy normalization, theelevated levels of fuel and commodity prices, and the volatility in global capital flows.
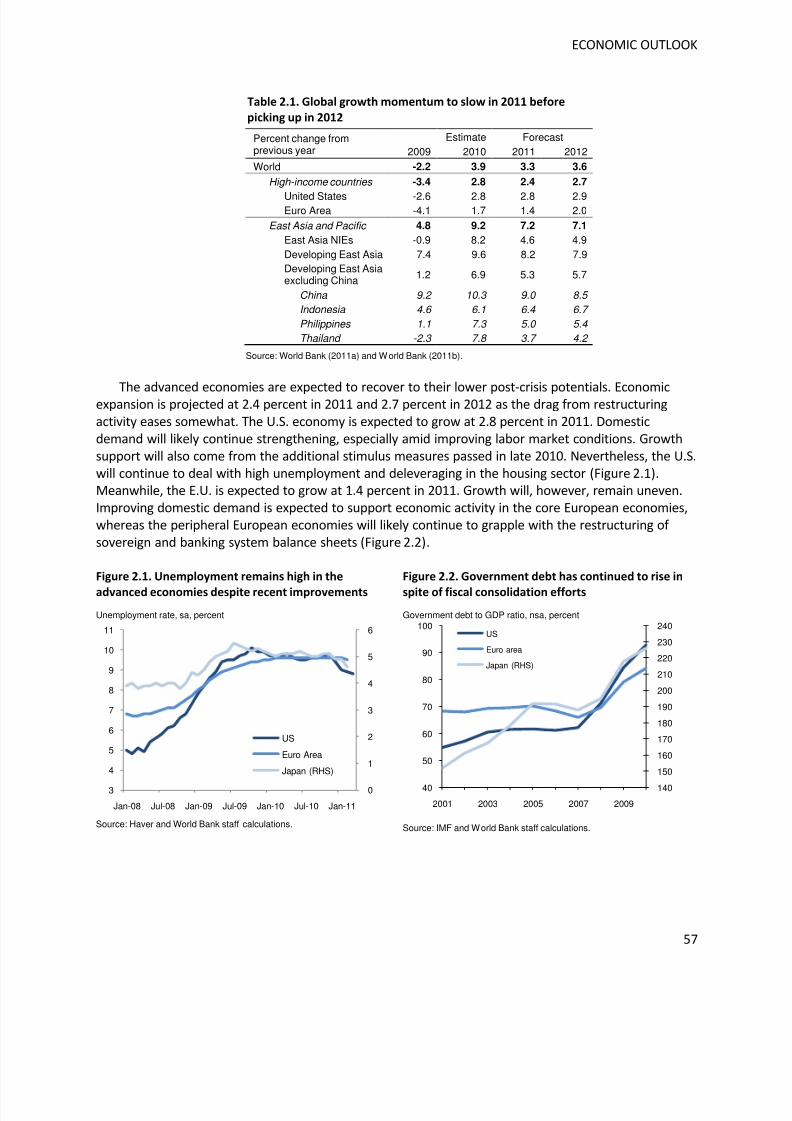
8/6/2019 World Bank Economic Monitor - Malaysia Brain Drain (April 2011)
http://slidepdf.com/reader/full/world-bank-economic-monitor-malaysia-brain-drain-april-2011 57/150
ECONOMIC OUTLOOK
57
Table 2.1. Global growth momentum to slow in 2011 before
picking up in 2012
Percent change fromprevious year
Estimate Forecast2009 2010 2011 2012
World -2.2 3.9 3.3 3.6
High-income countries -3.4 2.8 2.4 2.7
United States -2.6 2.8 2.8 2.9Euro Area -4.1 1.7 1.4 2.0
East Asia and Pacific 4.8 9.2 7.2 7.1
East Asia NIEs -0.9 8.2 4.6 4.9Developing East Asia 7.4 9.6 8.2 7.9Developing East Asiaexcluding China 1.2 6.9 5.3 5.7
China 9.2 10.3 9.0 8.5
Indonesia 4.6 6.1 6.4 6.7
Philippines 1.1 7.3 5.0 5.4
Thailand -2.3 7.8 3.7 4.2
Source: World Bank (2011a) and World Bank (2011b).
The advanced economies are expected to recover to their lower post-crisis potentials. Economicexpansion is projected at 2.4 percent in 2011 and 2.7 percent in 2012 as the drag from restructuringactivity eases somewhat. The U.S. economy is expected to grow at 2.8 percent in 2011. Domesticdemand will likely continue strengthening, especially amid improving labor market conditions. Growthsupport will also come from the additional stimulus measures passed in late 2010. Nevertheless, the U.S.will continue to deal with high unemployment and deleveraging in the housing sector (Figure 2.1).Meanwhile, the E.U. is expected to grow at 1.4 percent in 2011. Growth will, however, remain uneven.Improving domestic demand is expected to support economic activity in the core European economies,whereas the peripheral European economies will likely continue to grapple with the restructuring of sovereign and banking system balance sheets (Figure 2.2).
Figure 2.1. Unemployment remains high in the
advanced economies despite recent improvements
Unemployment rate, sa, percent
Source: Haver and World Bank staff calculations.
Figure 2.2. Government debt has continued to rise in
spite of fiscal consolidation efforts
Government debt to GDP ratio, nsa, percent
Source: IMF and World Bank staff calculations.
0
1
2
3
4
5
6
3
4
5
6
7
8
9
10
11
Jan-08 Jul-08 Jan-09 Jul-09 Jan-10 Jul-10 Jan-11
US
Euro Area
Japan (RHS)
140
150
160
170
180
190
200
210
220
230
240
40
50
60
70
80
90
100
2001 2003 2005 2007 2009
US
Euro area
Japan (RHS)
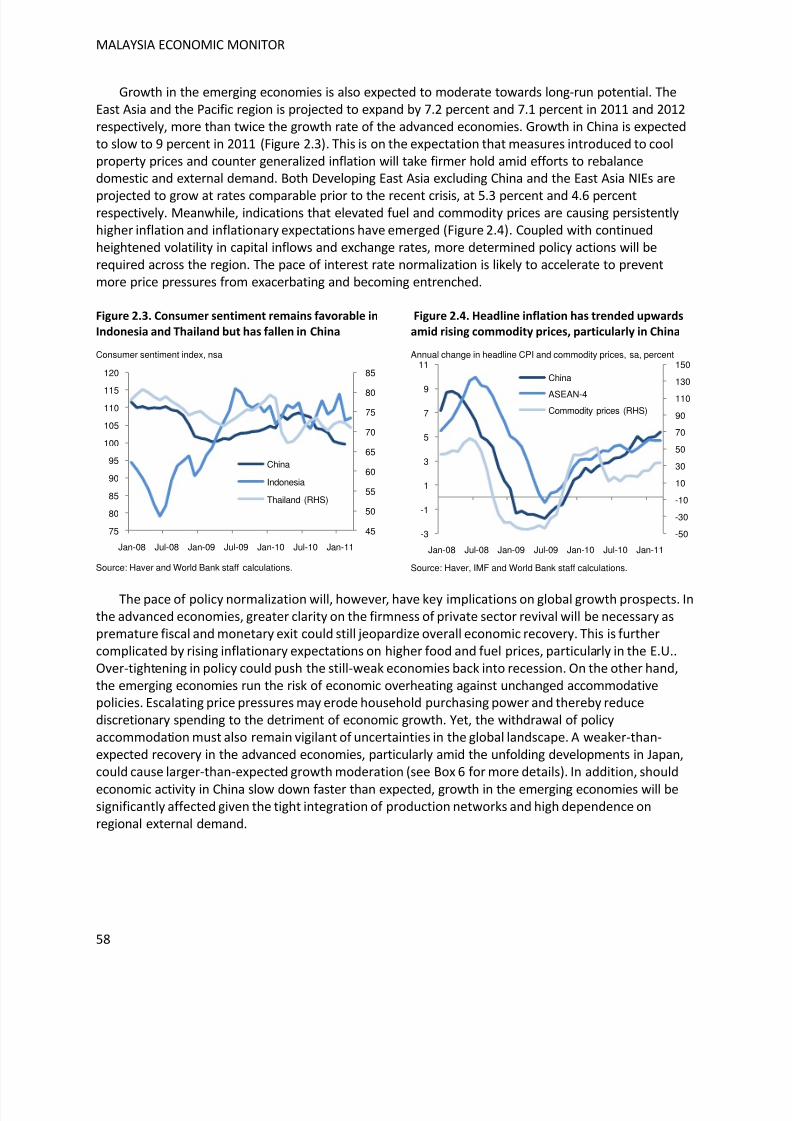
8/6/2019 World Bank Economic Monitor - Malaysia Brain Drain (April 2011)
http://slidepdf.com/reader/full/world-bank-economic-monitor-malaysia-brain-drain-april-2011 58/150
MALAYSIA ECONOMIC MONITOR
58
Growth in the emerging economies is also expected to moderate towards long-run potential. TheEast Asia and the Pacific region is projected to expand by 7.2 percent and 7.1 percent in 2011 and 2012respectively, more than twice the growth rate of the advanced economies. Growth in China is expectedto slow to 9 percent in 2011 (Figure 2.3). This is on the expectation that measures introduced to coolproperty prices and counter generalized inflation will take firmer hold amid efforts to rebalancedomestic and external demand. Both Developing East Asia excluding China and the East Asia NIEs are
projected to grow at rates comparable prior to the recent crisis, at 5.3 percent and 4.6 percentrespectively. Meanwhile, indications that elevated fuel and commodity prices are causing persistentlyhigher inflation and inflationary expectations have emerged (Figure 2.4). Coupled with continuedheightened volatility in capital inflows and exchange rates, more determined policy actions will berequired across the region. The pace of interest rate normalization is likely to accelerate to preventmore price pressures from exacerbating and becoming entrenched.
Figure 2.3. Consumer sentiment remains favorable in
Indonesia and Thailand but has fallen in China
Consumer sentiment index, nsa
Source: Haver and World Bank staff calculations.
Figure 2.4. Headline inflation has trended upwards
amid rising commodity prices, particularly in China
Annual change in headline CPI and commodity prices, sa, percent
Source: Haver, IMF and World Bank staff calculations.
The pace of policy normalization will, however, have key implications on global growth prospects. Inthe advanced economies, greater clarity on the firmness of private sector revival will be necessary aspremature fiscal and monetary exit could still jeopardize overall economic recovery. This is furthercomplicated by rising inflationary expectations on higher food and fuel prices, particularly in the E.U..Over-tightening in policy could push the still-weak economies back into recession. On the other hand,the emerging economies run the risk of economic overheating against unchanged accommodativepolicies. Escalating price pressures may erode household purchasing power and thereby reducediscretionary spending to the detriment of economic growth. Yet, the withdrawal of policyaccommodation must also remain vigilant of uncertainties in the global landscape. A weaker-than-expected recovery in the advanced economies, particularly amid the unfolding developments in Japan,could cause larger-than-expected growth moderation (see Box 6 for more details). In addition, should
economic activity in China slow down faster than expected, growth in the emerging economies will besignificantly affected given the tight integration of production networks and high dependence onregional external demand.
45
50
55
60
65
70
75
80
85
75
80
85
90
95
100
105
110115
120
Jan-08 Jul-08 Jan-09 Jul-09 Jan-10 Jul-10 Jan-11
China
Indonesia
Thailand (RHS)
-50
-30
-10
10
30
50
70
90
110
130
150
-3
-1
1
3
5
7
9
11
Jan-08 Jul-08 Jan-09 Jul-09 Jan-10 Jul-10 Jan-11
China
ASEAN-4Commodity prices (RHS)
8/6/2019 World Bank Economic Monitor - Malaysia Brain Drain (April 2011)
http://slidepdf.com/reader/full/world-bank-economic-monitor-malaysia-brain-drain-april-2011 59/150
ECONOMIC OUTLOOK
59
If high fuel and commodity prices were to persist at current high levels or rise even further, thesustainability of global recovery may be endangered. Expectations are for fuel and commodity prices tomoderate in the second half of 2011 as supply disruptions from adverse weather conditions lessen.However, potentially higher global demand given the need for substantial rebuilding activity in Japan,together with any threat of disruption in energy and commodity supplies due to escalating geopoliticalfactors, could cause prices to surpass historical highs instead. This could spur panic, potentially resulting
in high inflation globally and subsequently a double-dip recession in the advanced economies. Inaddition, as fuel and commodity prices have a relatively firm floor underpinned by sustained globaldemand but a soft ceiling amid geopolitical unrests, speculative activity in commodities may intensify,further worsening the price increases.
Large two-way shifts in volatile capital flows are expected to feature prominently in the globallandscape over the near to medium term. Given the continued unevenness in global growthperformances and the consequent differences in interest-rate policies, the emerging economies can
expect to receive a continued inflow of capital, as seen in 2010. However, given the improving economicprospects of the advanced economies, particularly in the U.S., a better-than-expected recovery couldresult in a rapid reversal of short-term capital. Such heightened volatility in large amounts of capitalcould result in disorderly exchange rate movements and periodic financial market volatility globally.
8/6/2019 World Bank Economic Monitor - Malaysia Brain Drain (April 2011)
http://slidepdf.com/reader/full/world-bank-economic-monitor-malaysia-brain-drain-april-2011 60/150
MALAYSIA ECONOMIC MONITOR
60
BOX 6. ECONOMIC IMPACT OF THE CALAMITY IN JAPAN
Japan was hit by a disastrous calamity on March 11, 2011. A 9.0-magnitude earthquake had set off a40 meter-high tsunami along the northeastern coast of Japan and triggered a crisis at Fukushima nuclearpower plant. The earthquake is the worst recorded in Japan’s history and the fourth most severe in the
world. The nuclear crisis has been assessed to be at least as serious as the 1986 Chernobyl accident.
One month on, the scale of the destruction is still largely unknown. As of mid-April, the human costwas quickly approaching 30,000 people, with the direct damage to infrastructure estimated at 4-6percent of GDP. The situation in the nuclear plants and consequent impact remains uncertain. In anycase, power shortages have occurred in the Tokyo metropolitan area and rolling black-outs havedisrupted the resumption of economic activity, especially in the car, electronics and other energy-intensive industries.
A V-shaped recovery for Japan against elevated downside risks
It is too early to make any definitive assessments. Based on the information available as of mid-
April, the economy is likely—as with the Kobe quake in 1995—to experience a V-shaped impact:negative through mid-2011 and then positive through end-2011. Even if the directly affected areasaccount for just 4 percent of total output, the economy is likely to experience a technical output declineduring the first quarter. This is due to a contraction in industrial production and exports, followingcapacity loss, power shortages, and supply chain disruptions. As reconstruction gains momentum anddisruptions ease, the recovery should be swift, with robust external demand from the region providingsupport.
Three downside risks cloud the near- and medium-term horizon, which could potentially result inpotential international spill-over effects:
- Nuclear radiation: If radiation levels in Fukushima remain elevated and contamination spreadsthroughout the country, business and consumer sentiment would like be affected even more.Exports as well as tourism to and from Japan would also be expected to take a further hit underthese circumstances.
- Prolonged power shortages: As energy demand rises during the summer, power shortages could
intensify. This would particularly affect the car and electronics industries around Tokyo,responsible for 11 percent of GDP. Differences in power frequency across regions complicatematters. Continued uncertainty could trigger or accelerate relocation to overseas.
- Limited macro policy flexibility: Given the limited fiscal space prior to the disaster, yields are likelyto rise if the USD120 billion emergency budget is financed with new debt.a Tax increases coulddampen consumer spending in the short run. The monetary stance is already highlyaccommodative.
8/6/2019 World Bank Economic Monitor - Malaysia Brain Drain (April 2011)
http://slidepdf.com/reader/full/world-bank-economic-monitor-malaysia-brain-drain-april-2011 61/150
8/6/2019 World Bank Economic Monitor - Malaysia Brain Drain (April 2011)
http://slidepdf.com/reader/full/world-bank-economic-monitor-malaysia-brain-drain-april-2011 62/150
MALAYSIA ECONOMIC MONITOR
62
MALAYSIAN GROWTH TO RESUME HISTORICAL TRENDS
After a period of crisis-related volatility, Malaysia’s growth momentum is expected to converge topre-crisis trends. In this process, domestic demand is expected to take on an increasing role. Privateconsumption will likely be a key growth driver, with rural areas benefitting from elevated commodityprices and urban areas from continued growth in the manufacturing and services sectors. Buoyant
domestic consumer spending and a later pick-up in advanced economies would use up spare productioncapacity. Additional fixed investment is likely but is also sensitive to investor sentiment and the progressmade on the structural reform agenda. On the policy front, barring any unexpected developments, fiscaland monetary policy normalization would normally continue at a steady pace. Consumer inflation isexpected to be higher on account of cost-push factors, but demand-pull factors are gaining strength andwill become more visible in the coming quarters.
Baseline Forecast Assumptions Have Generally Improved
The recent growth outturn was only slightly weaker than we had predicted earlier. The baselinescenario in the November 2010 Malaysia Economic Monitor pictured a sharp deceleration, but not a
contraction, in the second half of 2010. The sequential decline in the third quarter was therefore largelyunexpected and only seen as a low-case scenario in our previous assessment. But with the solidsequential rebound in the fourth quarter, the discrepancy narrowed. For the second half of 2010, netexports were holding back GDP growth more forcefully than predicted, which directly translated intolarger restocking by firms (Figure 2.5).20 While our views on private consumption did materialize, fiscalconsolidation advanced more swiftly than envisaged. Given the more sluggish second half, the full-year2010 growth projection of 7.4 percent in our previous assessment exceeded the actual growth by 0.2percentage points.
20Box 2 in the November 2010 Malaysia Economic Monitor showed that changes in stock essentially mirror
net real exports of goods and services in Malaysia. So any underestimation of a negative contribution to growth by
net exports will be reflected in a comparable underestimation of positive contribution to growth by changes instocks.
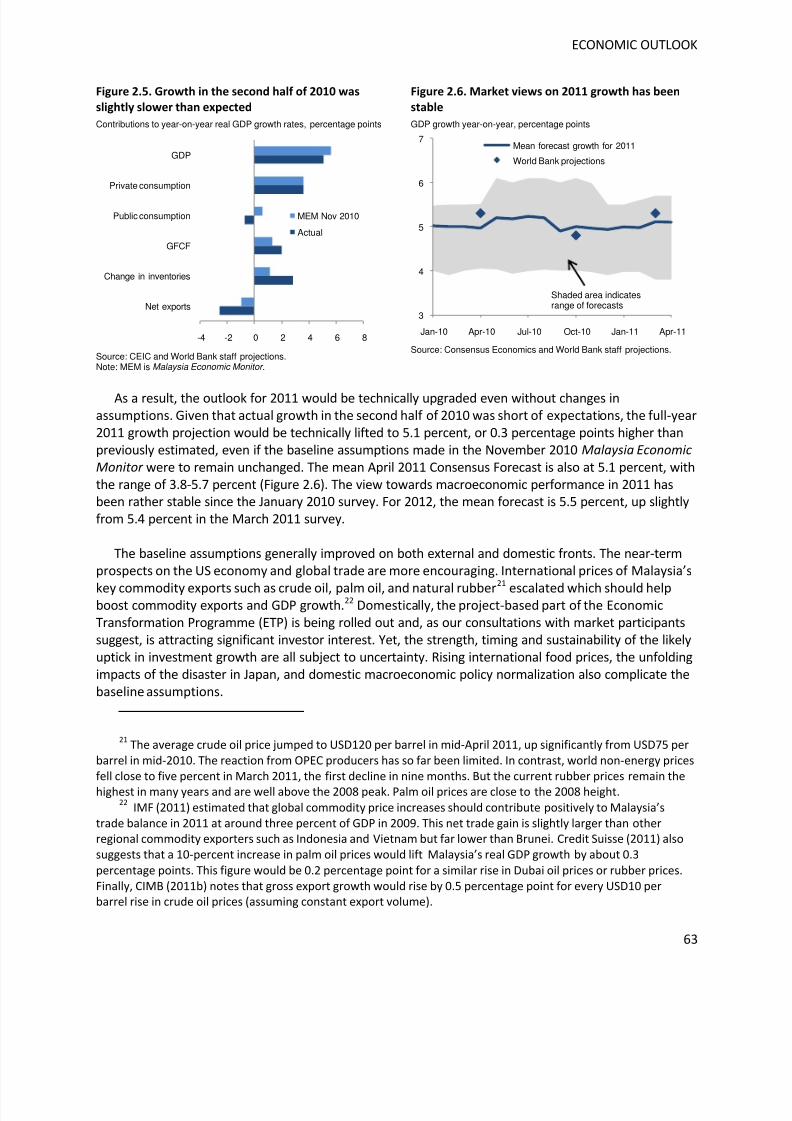
8/6/2019 World Bank Economic Monitor - Malaysia Brain Drain (April 2011)
http://slidepdf.com/reader/full/world-bank-economic-monitor-malaysia-brain-drain-april-2011 63/150
ECONOMIC OUTLOOK
63
Figure 2.5. Growth in the second half of 2010 was
slightly slower than expected
Contributions to year-on-year real GDP growth rates, percentage points
Source: CEIC and World Bank staff projections.Note: MEM is Malaysia Economic Monitor .
Figure 2.6. Market views on 2011 growth has been
stable
GDP growth year-on-year, percentage points
Source: Consensus Economics and World Bank staff projections.
As a result, the outlook for 2011 would be technically upgraded even without changes inassumptions. Given that actual growth in the second half of 2010 was short of expectations, the full-year2011 growth projection would be technically lifted to 5.1 percent, or 0.3 percentage points higher thanpreviously estimated, even if the baseline assumptions made in the November 2010 Malaysia Economic
Monitor were to remain unchanged. The mean April 2011 Consensus Forecast is also at 5.1 percent, withthe range of 3.8-5.7 percent (Figure 2.6). The view towards macroeconomic performance in 2011 hasbeen rather stable since the January 2010 survey. For 2012, the mean forecast is 5.5 percent, up slightlyfrom 5.4 percent in the March 2011 survey.
The baseline assumptions generally improved on both external and domestic fronts. The near-termprospects on the US economy and global trade are more encouraging. International prices of Malaysia’s
key commodity exports such as crude oil, palm oil, and natural rubber21
escalated which should helpboost commodity exports and GDP growth.22 Domestically, the project-based part of the EconomicTransformation Programme (ETP) is being rolled out and, as our consultations with market participantssuggest, is attracting significant investor interest. Yet, the strength, timing and sustainability of the likelyuptick in investment growth are all subject to uncertainty. Rising international food prices, the unfoldingimpacts of the disaster in Japan, and domestic macroeconomic policy normalization also complicate thebaseline assumptions.
21The average crude oil price jumped to USD120 per barrel in mid-April 2011, up significantly from USD75 per
barrel in mid-2010. The reaction from OPEC producers has so far been limited. In contrast, world non-energy prices
fell close to five percent in March 2011, the first decline in nine months. But the current rubber prices remain the
highest in many years and are well above the 2008 peak. Palm oil prices are close to the 2008 height.22
IMF (2011) estimated that global commodity price increases should contribute positively to Malaysia’s
trade balance in 2011 at around three percent of GDP in 2009. This net trade gain is slightly larger than otherregional commodity exporters such as Indonesia and Vietnam but far lower than Brunei. Credit Suisse (2011) also
suggests that a 10-percent increase in palm oil prices would lift Malaysia’s real GDP growth by about 0.3
percentage points. This figure would be 0.2 percentage point for a similar rise in Dubai oil prices or rubber prices.
Finally, CIMB (2011b) notes that gross export growth would rise by 0.5 percentage point for every USD10 perbarrel rise in crude oil prices (assuming constant export volume).
-4 -2 0 2 4 6 8
Net exports
Change in inventories
GFCF
Public consumption
Private consumption
GDP
MEM Nov 2010
Actual
3
4
5
6
7
Jan-10 Apr-10 Jul-10 Oct-10 Jan-11 Apr-11
Mean forecast growth for 2011
World Bank projections
Shaded area indicatesrange of forecasts
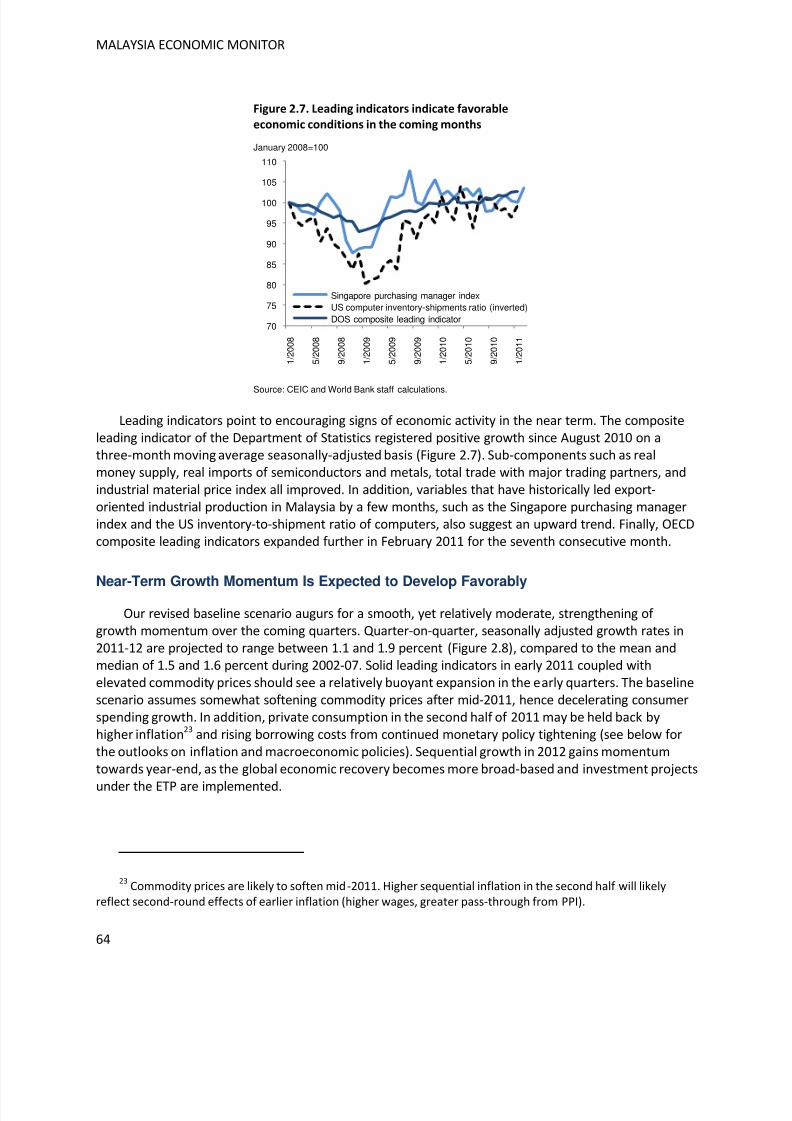
8/6/2019 World Bank Economic Monitor - Malaysia Brain Drain (April 2011)
http://slidepdf.com/reader/full/world-bank-economic-monitor-malaysia-brain-drain-april-2011 64/150
MALAYSIA ECONOMIC MONITOR
64
Figure 2.7. Leading indicators indicate favorable
economic conditions in the coming months
January 2008=100
Source: CEIC and World Bank staff calculations.
Leading indicators point to encouraging signs of economic activity in the near term. The compositeleading indicator of the Department of Statistics registered positive growth since August 2010 on athree-month moving average seasonally-adjusted basis (Figure 2.7). Sub-components such as realmoney supply, real imports of semiconductors and metals, total trade with major trading partners, andindustrial material price index all improved. In addition, variables that have historically led export-oriented industrial production in Malaysia by a few months, such as the Singapore purchasing managerindex and the US inventory-to-shipment ratio of computers, also suggest an upward trend. Finally, OECDcomposite leading indicators expanded further in February 2011 for the seventh consecutive month.
Near-Term Growth Momentum Is Expected to Develop Favorably
Our revised baseline scenario augurs for a smooth, yet relatively moderate, strengthening of growth momentum over the coming quarters. Quarter-on-quarter, seasonally adjusted growth rates in2011-12 are projected to range between 1.1 and 1.9 percent (Figure 2.8), compared to the mean andmedian of 1.5 and 1.6 percent during 2002-07. Solid leading indicators in early 2011 coupled withelevated commodity prices should see a relatively buoyant expansion in the early quarters. The baselinescenario assumes somewhat softening commodity prices after mid-2011, hence decelerating consumerspending growth. In addition, private consumption in the second half of 2011 may be held back byhigher inflation23 and rising borrowing costs from continued monetary policy tightening (see below forthe outlooks on inflation and macroeconomic policies). Sequential growth in 2012 gains momentumtowards year-end, as the global economic recovery becomes more broad-based and investment projects
under the ETP are implemented.
23Commodity prices are likely to soften mid-2011. Higher sequential inflation in the second half will likely
reflect second-round effects of earlier inflation (higher wages, greater pass-through from PPI).
70
75
80
85
90
95
100
105
110
1 / 2 0 0 8
5 / 2 0 0 8
9 / 2 0 0 8
1 / 2 0 0 9
5 / 2 0 0 9
9 / 2 0 0 9
1 / 2 0 1 0
5 / 2 0 1 0
9 / 2 0 1 0
1 / 2 0 1 1
Singapore purchasing manager indexUS computer inventory-shipments ratio (inverted)DOS composite leading indicator
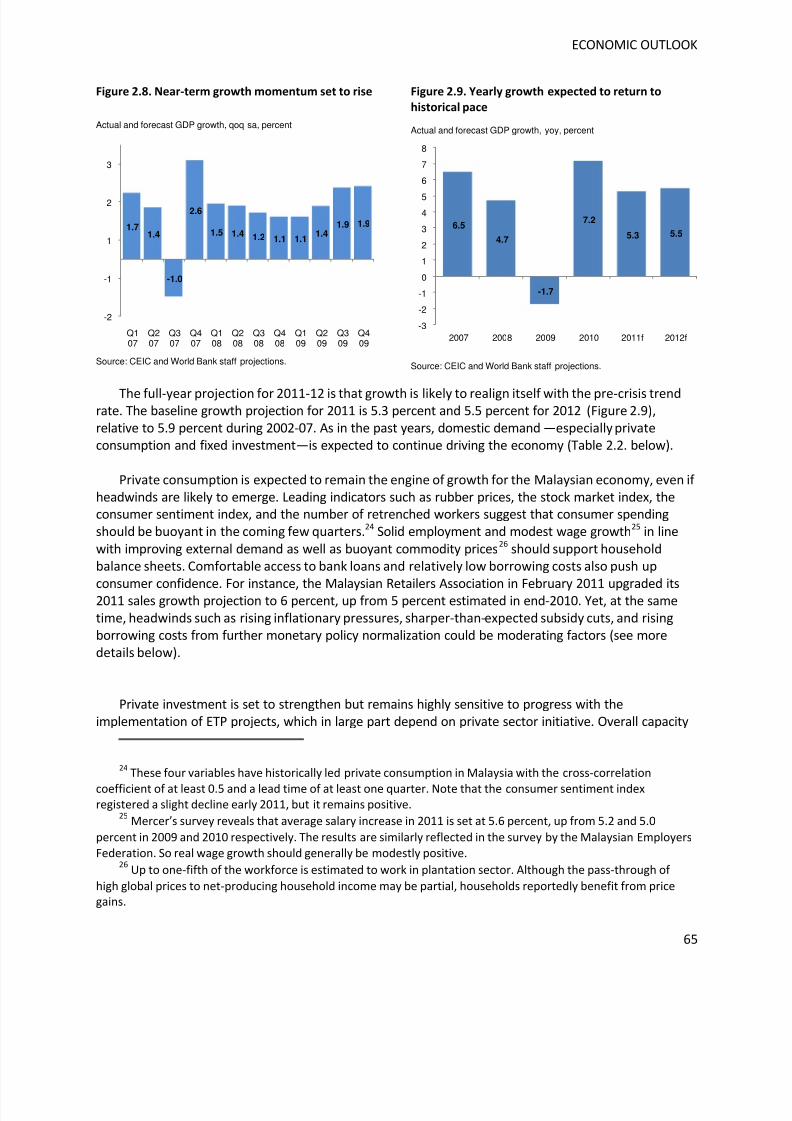
8/6/2019 World Bank Economic Monitor - Malaysia Brain Drain (April 2011)
http://slidepdf.com/reader/full/world-bank-economic-monitor-malaysia-brain-drain-april-2011 65/150
ECONOMIC OUTLOOK
65
Figure 2.8. Near-term growth momentum set to rise
Actual and forecast GDP growth, qoq sa, percent
Source: CEIC and World Bank staff projections.
Figure 2.9. Yearly growth expected to return to
historical pace
Actual and forecast GDP growth, yoy, percent
Source: CEIC and World Bank staff projections.
The full-year projection for 2011-12 is that growth is likely to realign itself with the pre-crisis trendrate. The baseline growth projection for 2011 is 5.3 percent and 5.5 percent for 2012 (Figure 2.9),relative to 5.9 percent during 2002-07. As in the past years, domestic demand—especially privateconsumption and fixed investment—is expected to continue driving the economy (Table 2.2. below).
Private consumption is expected to remain the engine of growth for the Malaysian economy, even if headwinds are likely to emerge. Leading indicators such as rubber prices, the stock market index, theconsumer sentiment index, and the number of retrenched workers suggest that consumer spendingshould be buoyant in the coming few quarters.24 Solid employment and modest wage growth25 in line
with improving external demand as well as buoyant commodity prices26 should support householdbalance sheets. Comfortable access to bank loans and relatively low borrowing costs also push up
consumer confidence. For instance, the Malaysian Retailers Association in February 2011 upgraded its2011 sales growth projection to 6 percent, up from 5 percent estimated in end-2010. Yet, at the sametime, headwinds such as rising inflationary pressures, sharper-than-expected subsidy cuts, and risingborrowing costs from further monetary policy normalization could be moderating factors (see moredetails below).
Private investment is set to strengthen but remains highly sensitive to progress with theimplementation of ETP projects, which in large part depend on private sector initiative. Overall capacity
24These four variables have historically led private consumption in Malaysia with the cross-correlation
coefficient of at least 0.5 and a lead time of at least one quarter. Note that the consumer sentiment indexregistered a slight decline early 2011, but it remains positive.
25 Mercer’s survey reveals that average salary increase in 2011 is set at 5.6 percent, up from 5.2 and 5.0
percent in 2009 and 2010 respectively. The results are similarly reflected in the survey by the Malaysian Employers
Federation. So real wage growth should generally be modestly positive.26
Up to one-fifth of the workforce is estimated to work in plantation sector. Although the pass-through of
high global prices to net-producing household income may be partial, households reportedly benefit from pricegains.
1.71.4
-1.0
2.6
1.5 1.4 1.2 1.1 1.11.4
1.9 1.9
-2
-1
1
2
3
Q107
Q207
Q307
Q407
Q108
Q208
Q308
Q408
Q109
Q209
Q309
Q409
6.5
4.7
-1.7
7.2
5.3 5.5
-3
-2
-1
0
1
2
3
45
6
7
8
2007 2008 2009 2010 2011f 2012f
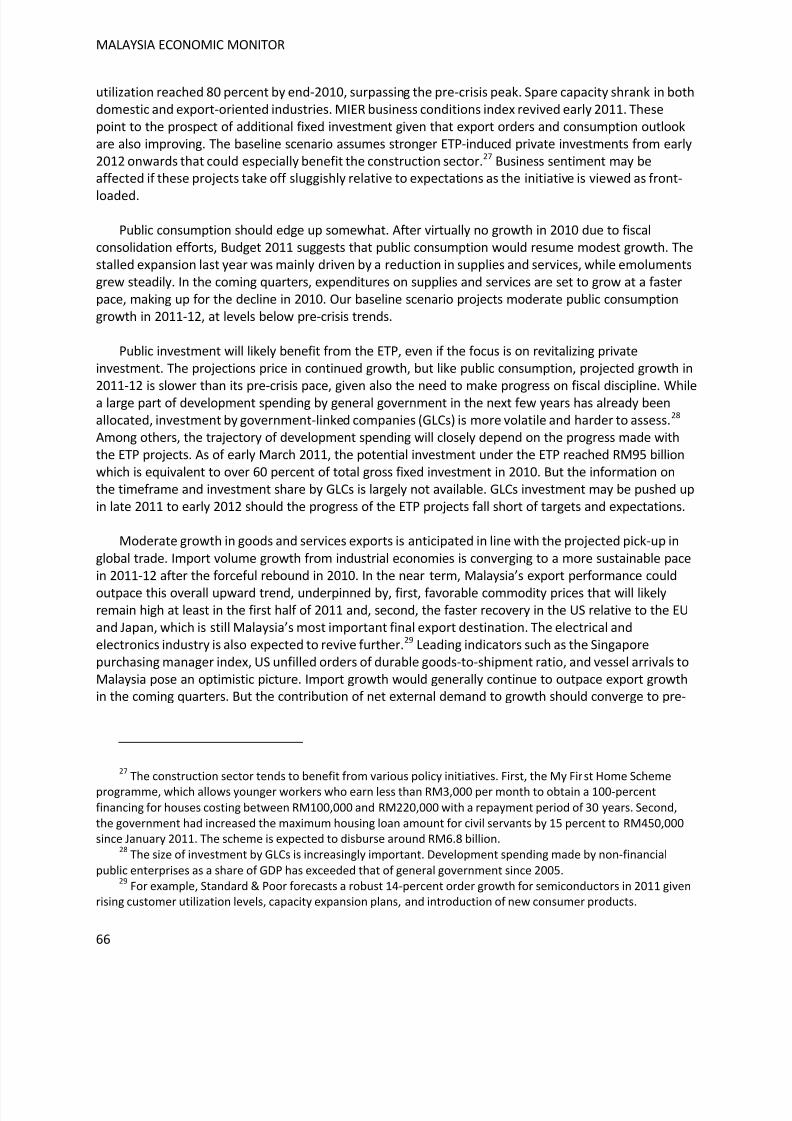
8/6/2019 World Bank Economic Monitor - Malaysia Brain Drain (April 2011)
http://slidepdf.com/reader/full/world-bank-economic-monitor-malaysia-brain-drain-april-2011 66/150
MALAYSIA ECONOMIC MONITOR
66
utilization reached 80 percent by end-2010, surpassing the pre-crisis peak. Spare capacity shrank in bothdomestic and export-oriented industries. MIER business conditions index revived early 2011. Thesepoint to the prospect of additional fixed investment given that export orders and consumption outlookare also improving. The baseline scenario assumes stronger ETP-induced private investments from early2012 onwards that could especially benefit the construction sector.27 Business sentiment may beaffected if these projects take off sluggishly relative to expectations as the initiative is viewed as front-
loaded.
Public consumption should edge up somewhat. After virtually no growth in 2010 due to fiscalconsolidation efforts, Budget 2011 suggests that public consumption would resume modest growth. Thestalled expansion last year was mainly driven by a reduction in supplies and services, while emolumentsgrew steadily. In the coming quarters, expenditures on supplies and services are set to grow at a fasterpace, making up for the decline in 2010. Our baseline scenario projects moderate public consumptiongrowth in 2011-12, at levels below pre-crisis trends.
Public investment will likely benefit from the ETP, even if the focus is on revitalizing privateinvestment. The projections price in continued growth, but like public consumption, projected growth in2011-12 is slower than its pre-crisis pace, given also the need to make progress on fiscal discipline. Whilea large part of development spending by general government in the next few years has already beenallocated, investment by government-linked companies (GLCs) is more volatile and harder to assess.28 Among others, the trajectory of development spending will closely depend on the progress made withthe ETP projects. As of early March 2011, the potential investment under the ETP reached RM95 billionwhich is equivalent to over 60 percent of total gross fixed investment in 2010. But the information onthe timeframe and investment share by GLCs is largely not available. GLCs investment may be pushed upin late 2011 to early 2012 should the progress of the ETP projects fall short of targets and expectations.
Moderate growth in goods and services exports is anticipated in line with the projected pick-up in
global trade. Import volume growth from industrial economies is converging to a more sustainable pacein 2011-12 after the forceful rebound in 2010. In the near term, Malaysia’s export performance could
outpace this overall upward trend, underpinned by, first, favorable commodity prices that will likelyremain high at least in the first half of 2011 and, second, the faster recovery in the US relative to the EUand Japan, which is still Malaysia’s most important final export destination. The electrical andelectronics industry is also expected to revive further.29 Leading indicators such as the Singaporepurchasing manager index, US unfilled orders of durable goods-to-shipment ratio, and vessel arrivals toMalaysia pose an optimistic picture. Import growth would generally continue to outpace export growthin the coming quarters. But the contribution of net external demand to growth should converge to pre-
27The construction sector tends to benefit from various policy initiatives. First, the My First Home Scheme
programme, which allows younger workers who earn less than RM3,000 per month to obtain a 100-percentfinancing for houses costing between RM100,000 and RM220,000 with a repayment period of 30 years. Second,
the government had increased the maximum housing loan amount for civil servants by 15 percent to RM450,000since January 2011. The scheme is expected to disburse around RM6.8 billion.
28The size of investment by GLCs is increasingly important. Development spending made by non-financial
public enterprises as a share of GDP has exceeded that of general government since 2005.29
For example, Standard & Poor forecasts a robust 14-percent order growth for semiconductors in 2011 givenrising customer utilization levels, capacity expansion plans, and introduction of new consumer products.
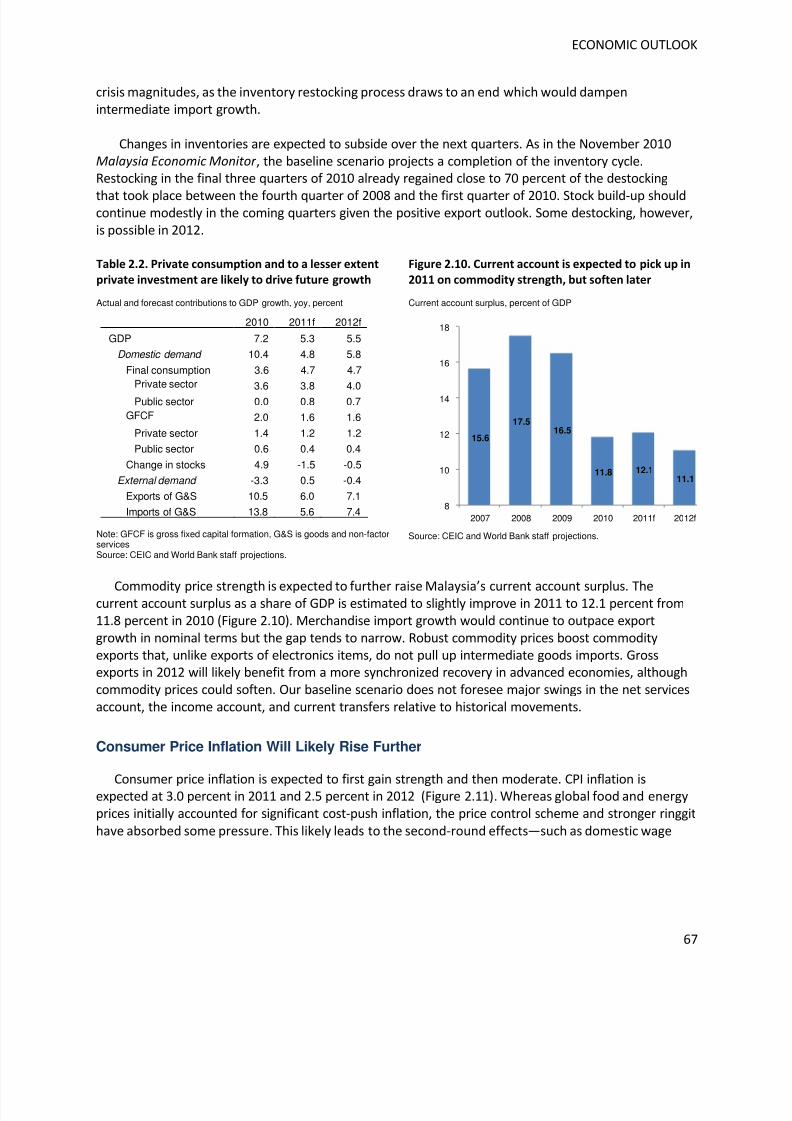
8/6/2019 World Bank Economic Monitor - Malaysia Brain Drain (April 2011)
http://slidepdf.com/reader/full/world-bank-economic-monitor-malaysia-brain-drain-april-2011 67/150
ECONOMIC OUTLOOK
67
crisis magnitudes, as the inventory restocking process draws to an end which would dampenintermediate import growth.
Changes in inventories are expected to subside over the next quarters. As in the November 2010Malaysia Economic Monitor , the baseline scenario projects a completion of the inventory cycle.Restocking in the final three quarters of 2010 already regained close to 70 percent of the destocking
that took place between the fourth quarter of 2008 and the first quarter of 2010. Stock build-up shouldcontinue modestly in the coming quarters given the positive export outlook. Some destocking, however,is possible in 2012.
Table 2.2. Private consumption and to a lesser extent
private investment are likely to drive future growth
Actual and forecast contributions to GDP growth, yoy, percent
2010 2011f 2012f
GDP 7.2 5.3 5.5
Domestic demand 10.4 4.8 5.8
Final consumption 3.6 4.7 4.7Private sector 3.6 3.8 4.0
Public sector 0.0 0.8 0.7GFCF 2.0 1.6 1.6
Private sector 1.4 1.2 1.2
Public sector 0.6 0.4 0.4
Change in stocks 4.9 -1.5 -0.5
External demand -3.3 0.5 -0.4
Exports of G&S 10.5 6.0 7.1
Imports of G&S 13.8 5.6 7.4
Note: GFCF is gross fixed capital formation, G&S is goods and non-factorservicesSource: CEIC and World Bank staff projections.
Figure 2.10. Current account is expected to pick up in
2011 on commodity strength, but soften later
Current account surplus, percent of GDP
Source: CEIC and World Bank staff projections.
Commodity price strength is expected to further raise Malaysia’s current account surplus. Thecurrent account surplus as a share of GDP is estimated to slightly improve in 2011 to 12.1 percent from11.8 percent in 2010 (Figure 2.10). Merchandise import growth would continue to outpace exportgrowth in nominal terms but the gap tends to narrow. Robust commodity prices boost commodityexports that, unlike exports of electronics items, do not pull up intermediate goods imports. Grossexports in 2012 will likely benefit from a more synchronized recovery in advanced economies, althoughcommodity prices could soften. Our baseline scenario does not foresee major swings in the net servicesaccount, the income account, and current transfers relative to historical movements.
Consumer Price Inflation Will Likely Rise Further
Consumer price inflation is expected to first gain strength and then moderate. CPI inflation isexpected at 3.0 percent in 2011 and 2.5 percent in 2012 (Figure 2.11). Whereas global food and energyprices initially accounted for significant cost-push inflation, the price control scheme and stronger ringgit
have absorbed some pressure. This likely leads to the second-round effects—such as domestic wage
15.6
17.516.5
11.8 12.111.1
8
10
12
14
16
18
2007 2008 2009 2010 2011f 2012f
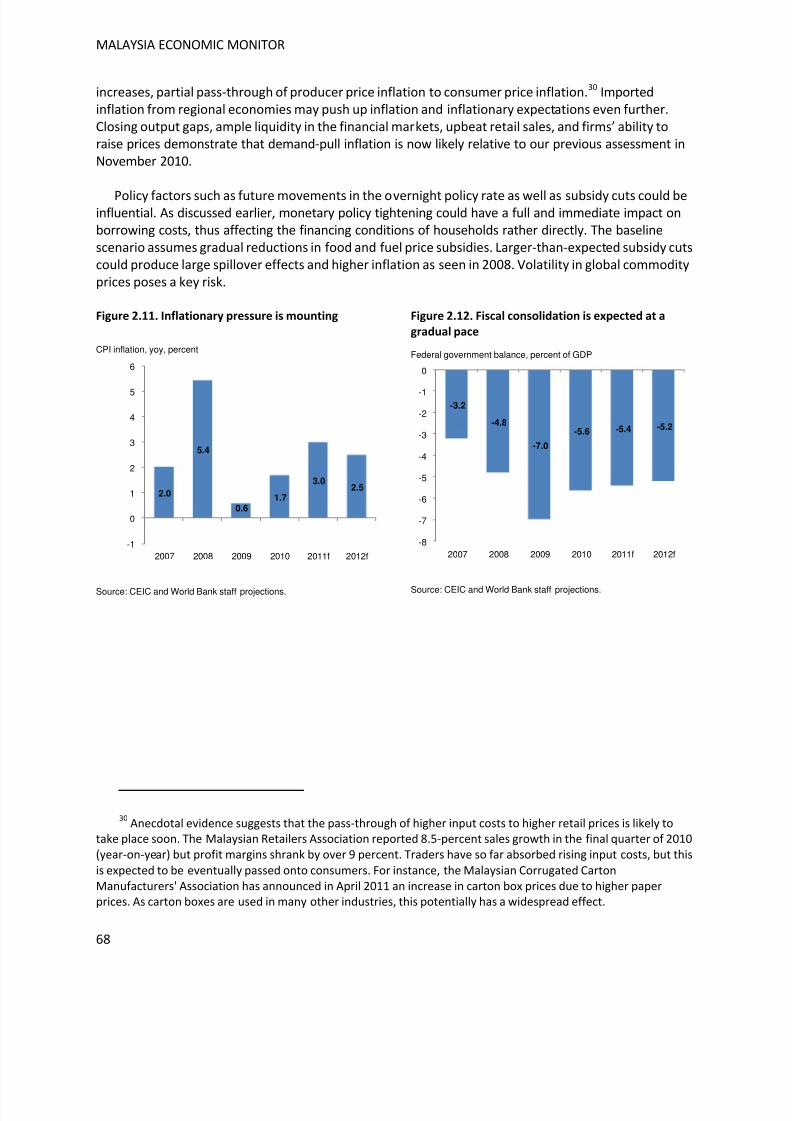
8/6/2019 World Bank Economic Monitor - Malaysia Brain Drain (April 2011)
http://slidepdf.com/reader/full/world-bank-economic-monitor-malaysia-brain-drain-april-2011 68/150
MALAYSIA ECONOMIC MONITOR
68
increases, partial pass-through of producer price inflation to consumer price inflation.30 Importedinflation from regional economies may push up inflation and inflationary expectations even further.Closing output gaps, ample liquidity in the financial markets, upbeat retail sales, and firms’ ability toraise prices demonstrate that demand-pull inflation is now likely relative to our previous assessment inNovember 2010.
Policy factors such as future movements in the overnight policy rate as well as subsidy cuts could beinfluential. As discussed earlier, monetary policy tightening could have a full and immediate impact onborrowing costs, thus affecting the financing conditions of households rather directly. The baselinescenario assumes gradual reductions in food and fuel price subsidies. Larger-than-expected subsidy cutscould produce large spillover effects and higher inflation as seen in 2008. Volatility in global commodityprices poses a key risk.
Figure 2.11. Inflationary pressure is mounting
CPI inflation, yoy, percent
Source: CEIC and World Bank staff projections.
Figure 2.12. Fiscal consolidation is expected at a
gradual pace
Federal government balance, percent of GDP
Source: CEIC and World Bank staff projections.
30Anecdotal evidence suggests that the pass-through of higher input costs to higher retail prices is likely to
take place soon. The Malaysian Retailers Association reported 8.5-percent sales growth in the final quarter of 2010
(year-on-year) but profit margins shrank by over 9 percent. Traders have so far absorbed rising input costs, but this
is expected to be eventually passed onto consumers. For instance, the Malaysian Corrugated Carton
Manufacturers' Association has announced in April 2011 an increase in carton box prices due to higher paperprices. As carton boxes are used in many other industries, this potentially has a widespread effect.
2.0
5.4
0.61.7
3.02.5
-1
0
1
2
3
4
5
6
2007 2008 2009 2010 2011f 2012f
-3.2
-4.8
-7.0
-5.6 -5.4 -5.2
-8
-7
-6
-5
-4
-3
-2
-1
0
2007 2008 2009 2010 2011f 2012f
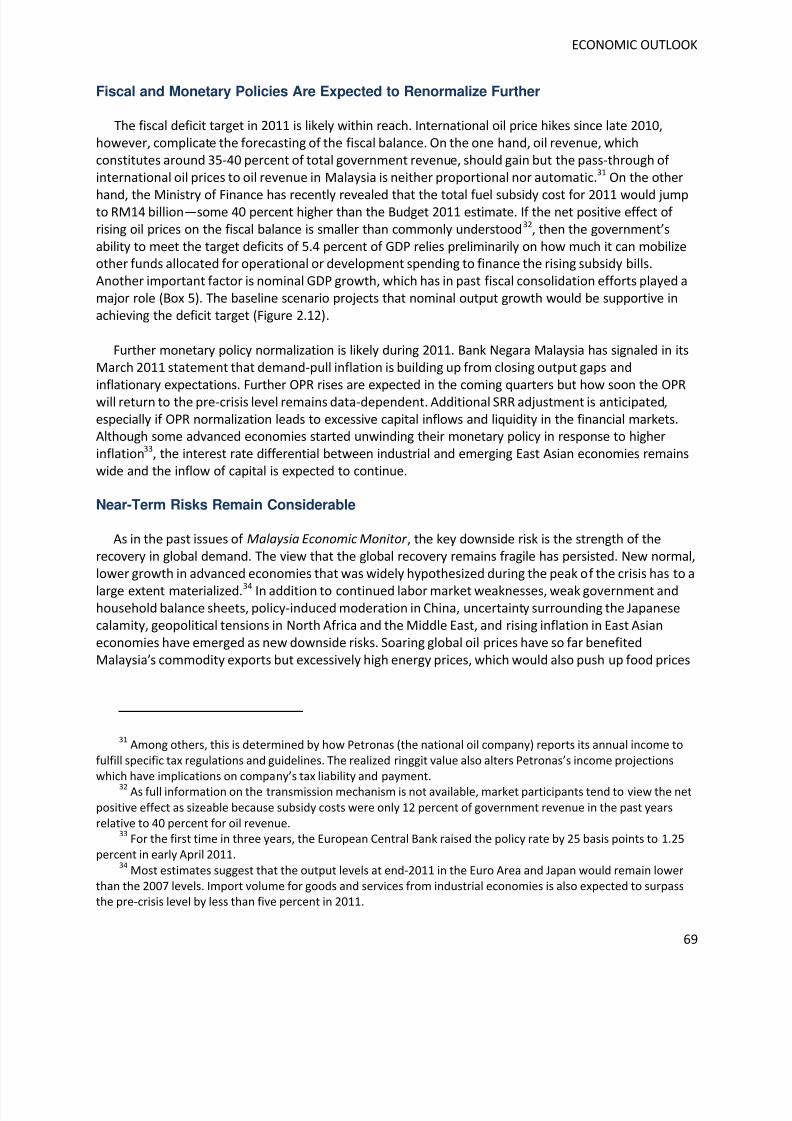
8/6/2019 World Bank Economic Monitor - Malaysia Brain Drain (April 2011)
http://slidepdf.com/reader/full/world-bank-economic-monitor-malaysia-brain-drain-april-2011 69/150
ECONOMIC OUTLOOK
69
Fiscal and Monetary Policies Are Expected to Renormalize Further
The fiscal deficit target in 2011 is likely within reach. International oil price hikes since late 2010,however, complicate the forecasting of the fiscal balance. On the one hand, oil revenue, whichconstitutes around 35-40 percent of total government revenue, should gain but the pass-through of international oil prices to oil revenue in Malaysia is neither proportional nor automatic.31 On the other
hand, the Ministry of Finance has recently revealed that the total fuel subsidy cost for 2011 would jumpto RM14 billion—some 40 percent higher than the Budget 2011 estimate. If the net positive effect of rising oil prices on the fiscal balance is smaller than commonly understood32, then the government’sability to meet the target deficits of 5.4 percent of GDP relies preliminarily on how much it can mobilizeother funds allocated for operational or development spending to finance the rising subsidy bills.Another important factor is nominal GDP growth, which has in past fiscal consolidation efforts played amajor role (Box 5). The baseline scenario projects that nominal output growth would be supportive inachieving the deficit target (Figure 2.12).
Further monetary policy normalization is likely during 2011. Bank Negara Malaysia has signaled in itsMarch 2011 statement that demand-pull inflation is building up from closing output gaps andinflationary expectations. Further OPR rises are expected in the coming quarters but how soon the OPRwill return to the pre-crisis level remains data-dependent. Additional SRR adjustment is anticipated,especially if OPR normalization leads to excessive capital inflows and liquidity in the financial markets.Although some advanced economies started unwinding their monetary policy in response to higherinflation33, the interest rate differential between industrial and emerging East Asian economies remainswide and the inflow of capital is expected to continue.
Near-Term Risks Remain Considerable
As in the past issues of Malaysia Economic Monitor , the key downside risk is the strength of therecovery in global demand. The view that the global recovery remains fragile has persisted. New normal,lower growth in advanced economies that was widely hypothesized during the peak of the crisis has to a
large extent materialized.34 In addition to continued labor market weaknesses, weak government andhousehold balance sheets, policy-induced moderation in China, uncertainty surrounding the Japanesecalamity, geopolitical tensions in North Africa and the Middle East, and rising inflation in East Asianeconomies have emerged as new downside risks. Soaring global oil prices have so far benefitedMalaysia’s commodity exports but excessively high energy prices, which would also push up food prices
31Among others, this is determined by how Petronas (the national oil company) reports its annual income to
fulfill specific tax regulations and guidelines. The realized ringgit value also alters Petronas’s income projections
which have implications on company’s tax liability and payment.32 As full information on the transmission mechanism is not available, market participants tend to view the net
positive effect as sizeable because subsidy costs were only 12 percent of government revenue in the past years
relative to 40 percent for oil revenue.33
For the first time in three years, the European Central Bank raised the policy rate by 25 basis points to 1.25
percent in early April 2011.34
Most estimates suggest that the output levels at end-2011 in the Euro Area and Japan would remain lower
than the 2007 levels. Import volume for goods and services from industrial economies is also expected to surpassthe pre-crisis level by less than five percent in 2011.
8/6/2019 World Bank Economic Monitor - Malaysia Brain Drain (April 2011)
http://slidepdf.com/reader/full/world-bank-economic-monitor-malaysia-brain-drain-april-2011 70/150
MALAYSIA ECONOMIC MONITOR
70
through higher transportation costs, could stall economic activities worldwide. This may dent Malaysia’snon-commodity exports as well as potentially oil export volume if rising prices depress demand for oil.35
Domestically, inflationary pressure poses an increasing risk. CPI inflation may weaken consumerspending, which is in the baseline the key growth propeller for 2011-12. Rising prices especially hurt net-consuming rural households and urban residents who do not benefit from booming commodity prices.
Real savings deposit rates would turn more negative (already at -1.9 percent in February 2011). At thesame time, inflation prompts higher policy and lending rates and ringgit appreciation. Rising borrowingcosts, in tandem with larger-than-expected subsidy cuts36 and sustained household debts37, coulddestabilize private consumption. The stronger ringgit also dampens future employment and wagegrowth and therefore spending by workers in certain export sectors. Higher borrowing costs cansuppress some new investment projects. In sum, consumer price inflation influences both current andfuture consumer spending, and likely has indirect detrimental effects on export performance and fixedinvestment.
Failure to achieve fiscal consolidation may put into question the government’s commitment towardsthe reform agenda. Box 8 of the April 2010 Malaysia Economic Monitor highlighted that thesustainability of general government debt is particularly sensitive to output growth (hence theimportance of structural reform) and global oil prices. Yet, as nearly all of this is domestic debt with alarge share held by domestic public entities, exchange rate and capital reversal risks would be expectedto be limited. In addition, the solid financing position, the large current account surplus and the amplelevel of foreign reserves mitigate concerns. Although the level of public debt in itself may not be of immediate concern, it does limit the government’s ability to cope with any future adverse shocks.Should for example global food and energy price inflation rise further with its concomitant risks foroutput growth, then there would be limited room for fiscal policy maneuver. Importantly, lacklusterprogress on the fiscal consolidation front could also hurt policy credibility that may spill over intoperceptions on other parts of the reform agenda.
35A general equilibrium simulation in ADB (2011) shows that a combined oil and food price shock would cut
Malaysia’s real GDP growth in 2011 by 0.7-0.8 percentage points and over one percentage point in 2012. While the
impact in 2011 is comparable to regional economies, the effect in 2012 is larger than others. The simulation
assumes 30-percent increases in both global oil and food prices in 2011 before the oil prices retreat by five percentin 2012 and three percent for food prices.
36The baseline scenario assumes gradual subsidy rationalization but sharper subsidy reductions are not
impossible especially if international oil prices, and thus fiscal burden on subsidies, rise much faster-than-expected.37
Household debt-to-GDP ratio stood at 76 percent in 2009-10, up from the mean of 67 percent during 2006-
08. Although the debt level has risen, household assets-to-debts ratio was at least 2.3 times in these years. Non-
performing consumer loan ratios also remain at low levels. The risk is higher among lower-income households thatsuffer from rising borrowing costs and possible negative real income growth.
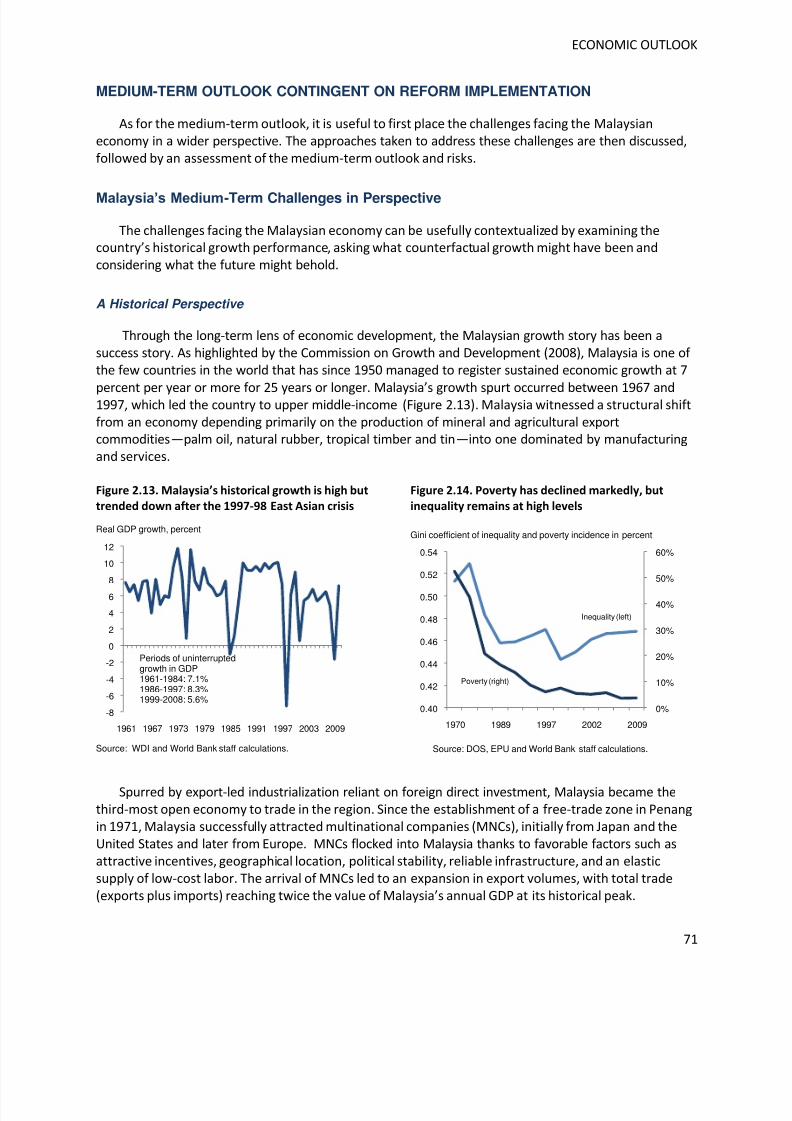
8/6/2019 World Bank Economic Monitor - Malaysia Brain Drain (April 2011)
http://slidepdf.com/reader/full/world-bank-economic-monitor-malaysia-brain-drain-april-2011 71/150
ECONOMIC OUTLOOK
71
MEDIUM-TERM OUTLOOK CONTINGENT ON REFORM IMPLEMENTATION
As for the medium-term outlook, it is useful to first place the challenges facing the Malaysianeconomy in a wider perspective. The approaches taken to address these challenges are then discussed,followed by an assessment of the medium-term outlook and risks.
Malaysia’s Medium-Term Challenges in Perspective
The challenges facing the Malaysian economy can be usefully contextualized by examining thecountry’s historical growth performance, asking what counterfactual growth might have been andconsidering what the future might behold.
A Historical Perspective
Through the long-term lens of economic development, the Malaysian growth story has been asuccess story. As highlighted by the Commission on Growth and Development (2008), Malaysia is one of the few countries in the world that has since 1950 managed to register sustained economic growth at 7
percent per year or more for 25 years or longer. Malaysia’s growth spurt occurred between 1967 and1997, which led the country to upper middle-income (Figure 2.13). Malaysia witnessed a structural shiftfrom an economy depending primarily on the production of mineral and agricultural exportcommodities—palm oil, natural rubber, tropical timber and tin—into one dominated by manufacturingand services.
Figure 2.13. Malaysia’s historical growth is high but
trended down after the 1997-98 East Asian crisis
Real GDP growth, percent
Source: WDI and World Bank staff calculations.
Figure 2.14. Poverty has declined markedly, but
inequality remains at high levels
Gini coefficient of inequality and poverty incidence in percent
Source: DOS, EPU and World Bank staff calculations.
Spurred by export-led industrialization reliant on foreign direct investment, Malaysia became thethird-most open economy to trade in the region. Since the establishment of a free-trade zone in Penangin 1971, Malaysia successfully attracted multinational companies (MNCs), initially from Japan and theUnited States and later from Europe. MNCs flocked into Malaysia thanks to favorable factors such asattractive incentives, geographical location, political stability, reliable infrastructure, and an elasticsupply of low-cost labor. The arrival of MNCs led to an expansion in export volumes, with total trade(exports plus imports) reaching twice the value of Malaysia’s annual GDP at its historical peak.
-8
-6
-4
-2
0
2
4
6
8
10
12
1961 1967 1973 1979 1985 1991 1997 2003 2009
0%
10%
20%
30%
40%
50%
60%
0.40
0.42
0.44
0.46
0.48
0.50
0.52
0.54
1970 1989 1997 2002 2009
Inequality (left)
Poverty (right)
Periods of uninterruptedgrowth in GDP1961-1984: 7.1%1986-1997: 8.3%1999-2008: 5.6%
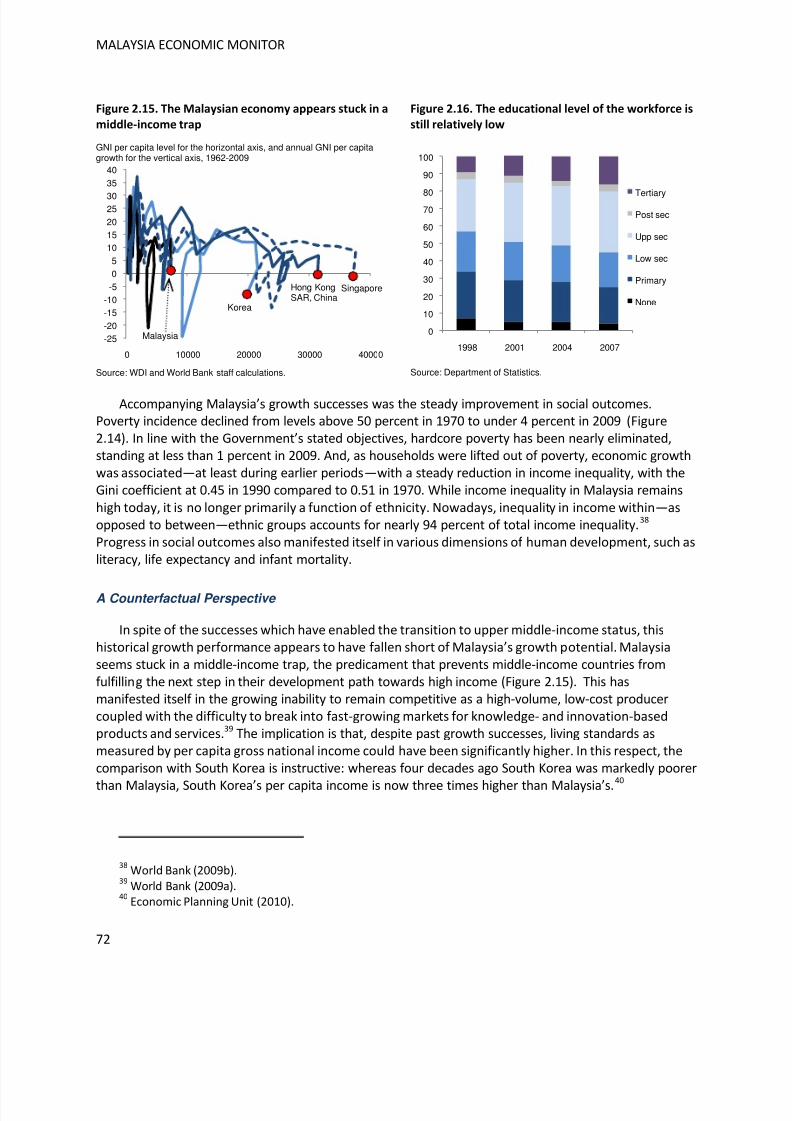
8/6/2019 World Bank Economic Monitor - Malaysia Brain Drain (April 2011)
http://slidepdf.com/reader/full/world-bank-economic-monitor-malaysia-brain-drain-april-2011 72/150
MALAYSIA ECONOMIC MONITOR
72
Figure 2.15. The Malaysian economy appears stuck in a
middle-income trap
GNI per capita level for the horizontal axis, and annual GNI per capitagrowth for the vertical axis, 1962-2009
Source: WDI and World Bank staff calculations.
Figure 2.16. The educational level of the workforce is
still relatively low
Source: Department of Statistics.
Accompanying Malaysia’s growth successes was the steady improvement in social outcomes.Poverty incidence declined from levels above 50 percent in 1970 to under 4 percent in 2009 (Figure2.14). In line with the Government’s stated objectives, hardcore poverty has been nearly eliminated,standing at less than 1 percent in 2009. And, as households were lifted out of poverty, economic growthwas associated—at least during earlier periods—with a steady reduction in income inequality, with theGini coefficient at 0.45 in 1990 compared to 0.51 in 1970. While income inequality in Malaysia remains
high today, it is no longer primarily a function of ethnicity. Nowadays, inequality in income within—asopposed to between—ethnic groups accounts for nearly 94 percent of total income inequality.38 Progress in social outcomes also manifested itself in various dimensions of human development, such asliteracy, life expectancy and infant mortality.
A Counterfactual Perspective
In spite of the successes which have enabled the transition to upper middle-income status, thishistorical growth performance appears to have fallen short of Malaysia’s growth potential. Malaysiaseems stuck in a middle-income trap, the predicament that prevents middle-income countries fromfulfilling the next step in their development path towards high income (Figure 2.15). This hasmanifested itself in the growing inability to remain competitive as a high-volume, low-cost producercoupled with the difficulty to break into fast-growing markets for knowledge- and innovation-basedproducts and services.39 The implication is that, despite past growth successes, living standards asmeasured by per capita gross national income could have been significantly higher. In this respect, thecomparison with South Korea is instructive: whereas four decades ago South Korea was markedly poorer
than Malaysia, South Korea’s per capita income is now three times higher than Malaysia’s.40
38World Bank (2009b).
39World Bank (2009a).
40Economic Planning Unit (2010).
-25
-20
-15
-10
-5
0
5
10
15
20
2530
35
40
0 10000 20000 30000 40000
0
10
20
30
40
50
60
7080
90
100
1998 2001 2004 2007
Tertiary
Post sec
Upp sec
Low sec
Primary
None
Malaysia
Korea
Hong KongSAR, China
Singapore
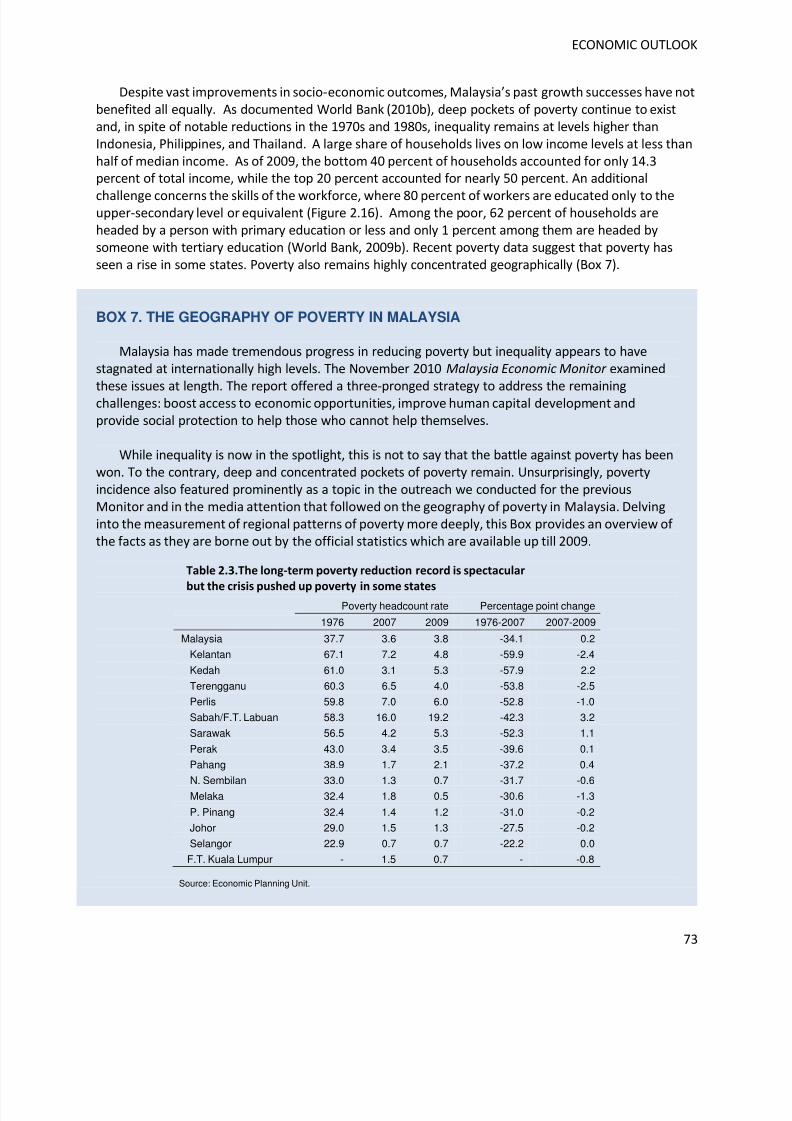
8/6/2019 World Bank Economic Monitor - Malaysia Brain Drain (April 2011)
http://slidepdf.com/reader/full/world-bank-economic-monitor-malaysia-brain-drain-april-2011 73/150
ECONOMIC OUTLOOK
73
Despite vast improvements in socio-economic outcomes, Malaysia’s past growth successes have notbenefited all equally. As documented World Bank (2010b), deep pockets of poverty continue to existand, in spite of notable reductions in the 1970s and 1980s, inequality remains at levels higher thanIndonesia, Philippines, and Thailand. A large share of households lives on low income levels at less thanhalf of median income. As of 2009, the bottom 40 percent of households accounted for only 14.3percent of total income, while the top 20 percent accounted for nearly 50 percent. An additional
challenge concerns the skills of the workforce, where 80 percent of workers are educated only to theupper-secondary level or equivalent (Figure 2.16). Among the poor, 62 percent of households areheaded by a person with primary education or less and only 1 percent among them are headed bysomeone with tertiary education (World Bank, 2009b). Recent poverty data suggest that poverty hasseen a rise in some states. Poverty also remains highly concentrated geographically (Box 7).
BOX 7. THE GEOGRAPHY OF POVERTY IN MALAYSIA
Malaysia has made tremendous progress in reducing poverty but inequality appears to havestagnated at internationally high levels. The November 2010 Malaysia Economic Monitor examined
these issues at length. The report offered a three-pronged strategy to address the remainingchallenges: boost access to economic opportunities, improve human capital development andprovide social protection to help those who cannot help themselves.
While inequality is now in the spotlight, this is not to say that the battle against poverty has beenwon. To the contrary, deep and concentrated pockets of poverty remain. Unsurprisingly, povertyincidence also featured prominently as a topic in the outreach we conducted for the previousMonitor and in the media attention that followed on the geography of poverty in Malaysia. Delvinginto the measurement of regional patterns of poverty more deeply, this Box provides an overview of the facts as they are borne out by the official statistics which are available up till 2009.
Table 2.3.The long-term poverty reduction record is spectacular
but the crisis pushed up poverty in some statesPoverty headcount rate Percentage point change
1976 2007 2009 1976-2007 2007-2009
Malaysia 37.7 3.6 3.8 -34.1 0.2
Kelantan 67.1 7.2 4.8 -59.9 -2.4
Kedah 61.0 3.1 5.3 -57.9 2.2
Terengganu 60.3 6.5 4.0 -53.8 -2.5
Perlis 59.8 7.0 6.0 -52.8 -1.0
Sabah/F.T. Labuan 58.3 16.0 19.2 -42.3 3.2
Sarawak 56.5 4.2 5.3 -52.3 1.1
Perak 43.0 3.4 3.5 -39.6 0.1
Pahang 38.9 1.7 2.1 -37.2 0.4
N. Sembilan 33.0 1.3 0.7 -31.7 -0.6Melaka 32.4 1.8 0.5 -30.6 -1.3
P. Pinang 32.4 1.4 1.2 -31.0 -0.2
Johor 29.0 1.5 1.3 -27.5 -0.2
Selangor 22.9 0.7 0.7 -22.2 0.0
F.T. Kuala Lumpur - 1.5 0.7 - -0.8
Source: Economic Planning Unit.
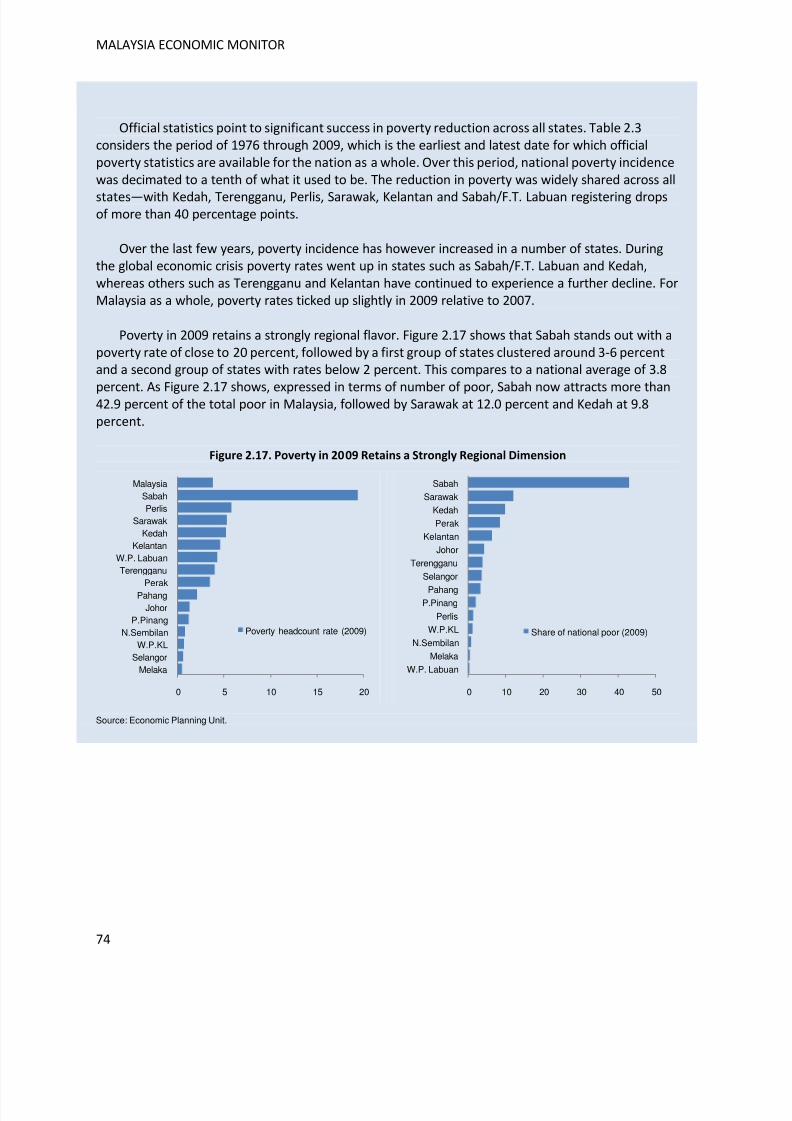
8/6/2019 World Bank Economic Monitor - Malaysia Brain Drain (April 2011)
http://slidepdf.com/reader/full/world-bank-economic-monitor-malaysia-brain-drain-april-2011 74/150
MALAYSIA ECONOMIC MONITOR
74
Official statistics point to significant success in poverty reduction across all states. Table 2.3considers the period of 1976 through 2009, which is the earliest and latest date for which officialpoverty statistics are available for the nation as a whole. Over this period, national poverty incidencewas decimated to a tenth of what it used to be. The reduction in poverty was widely shared across all
states—with Kedah, Terengganu, Perlis, Sarawak, Kelantan and Sabah/F.T. Labuan registering dropsof more than 40 percentage points.
Over the last few years, poverty incidence has however increased in a number of states. Duringthe global economic crisis poverty rates went up in states such as Sabah/F.T. Labuan and Kedah,whereas others such as Terengganu and Kelantan have continued to experience a further decline. ForMalaysia as a whole, poverty rates ticked up slightly in 2009 relative to 2007.
Poverty in 2009 retains a strongly regional flavor. Figure 2.17 shows that Sabah stands out with apoverty rate of close to 20 percent, followed by a first group of states clustered around 3-6 percentand a second group of states with rates below 2 percent. This compares to a national average of 3.8
percent. As Figure 2.17 shows, expressed in terms of number of poor, Sabah now attracts more than42.9 percent of the total poor in Malaysia, followed by Sarawak at 12.0 percent and Kedah at 9.8percent.
Figure 2.17. Poverty in 2009 Retains a Strongly Regional Dimension
Source: Economic Planning Unit.
0 5 10 15 20
MelakaSelangor
W.P.KLN.Sembilan
P.PinangJohor
PahangPerak
TerengganuW.P. Labuan
KelantanKedah
SarawakPerlis
SabahMalaysia
Poverty headcount rate (2009)
0 10 20 30 40 50
W.P. Labuan
Melaka
N.Sembilan
W.P.KL
Perlis
P.PinangPahang
Selangor
Terengganu
Johor
Kelantan
Perak
Kedah
Sarawak
Sabah
Share of national poor (2009)
8/6/2019 World Bank Economic Monitor - Malaysia Brain Drain (April 2011)
http://slidepdf.com/reader/full/world-bank-economic-monitor-malaysia-brain-drain-april-2011 75/150
ECONOMIC OUTLOOK
75
A Forward-Looking Perspective
Productivity and inclusiveness—the two factors discussed so far that have held back Malaysia’sgrowth relative to counterfactual—remain the two single most critical factors that are now posing abinding constraint to growth. For Malaysia to become a high-income economy, it will need toincreasingly base its growth momentum on innovation and creativity, which boosts the efficiency with
which capital and labor are put to use, and this will need to be supported by a healthy level of investment as well in physical and human capital. This will in turn require further efforts to raiseproductivity and promote inclusiveness, which will help raise the rates of return on investment inphysical and human capital.
Raising the rate of return on physical capital is important as following the Asian financialcrisis the investment share to GDP took a dive in Malaysia and, unlike other regionaleconomies, never recovered afterwards. While investment rates should not expected toreturn to pre-crisis Asian crisis levels, there is a general recognition that investment hasbeen too low for a dynamically efficient economy that aims to become dependent on
innovation-led growth.41 By creating productive opportunities domestically both foreign anddomestic investors can take advantage of these. By promoting inclusiveness individuals can
afford themselves better to take entrepreneurial risks and larger segments of society cancontribute to the augmentation of domestic capital.
Equally, if not more, important will be efforts to raise the return on human capitalinvestment. The currently low returns to education in Malaysia—both as a result of deficiencies in skills formation as well as inefficiencies in firm productivity—create powerfulincentives for outward migration and equally potent disincentives for return migration.Higher productivity levels will be required to boost wage levels and reduce cost of living-adjusted wage differentials so as to attract and retain talent in the country. Better
inclusiveness, in the sense of fostering greater meritocracy, will mitigate the push factors foremigration. These issues are more fully discussed in Chapter 3 on Malaysia’s brain drain.
In tackling the legacy problems on productivity and inclusiveness, Malaysia will also need to considera number of external challenges (arising from changes in the global environment) and internalchallenges (arising from changes in the domestic economy as Malaysia embarks on its journey towardsthe high-income economy).
Among the external challenges, the emergence of China and India on the global stage has increasedthe competitive threat—even though counterbalancing this are the opportunities arising from intra-regional trade creation. And, as the global rebalancing process continues to unfold, export demand fromadvanced economies may be less buoyant going forward, creating additional export competition (Figure2.18). Also, competition for FDI is intensifying, especially as the geographical center of gravity is
41As some of the pre-crisis investment constituted overinvestment and also going forward a more services-
oriented economy requires less capital than one oriented towards heavy industry. For an analysis of Malaysia’sinvestment rates, see World Bank (2008b, 2009a).
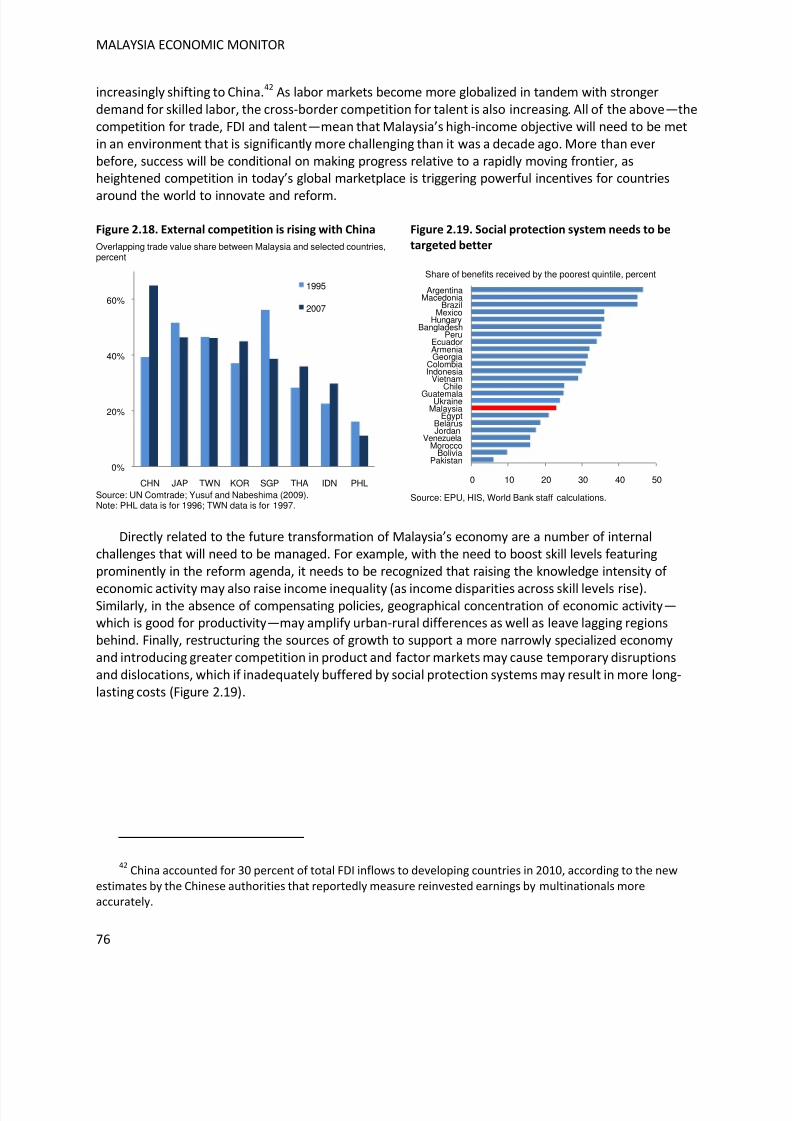
8/6/2019 World Bank Economic Monitor - Malaysia Brain Drain (April 2011)
http://slidepdf.com/reader/full/world-bank-economic-monitor-malaysia-brain-drain-april-2011 76/150
MALAYSIA ECONOMIC MONITOR
76
increasingly shifting to China.42 As labor markets become more globalized in tandem with strongerdemand for skilled labor, the cross-border competition for talent is also increasing. All of the above—thecompetition for trade, FDI and talent—mean that Malaysia’s high-income objective will need to be metin an environment that is significantly more challenging than it was a decade ago. More than everbefore, success will be conditional on making progress relative to a rapidly moving frontier, asheightened competition in today’s global marketplace is triggering powerful incentives for countries
around the world to innovate and reform.
Figure 2.18. External competition is rising with China
Overlapping trade value share between Malaysia and selected countries,percent
Source: UN Comtrade; Yusuf and Nabeshima (2009).Note: PHL data is for 1996; TWN data is for 1997.
Figure 2.19. Social protection system needs to be
targeted better
Share of benefits received by the poorest quintile, percent
Source: EPU, HIS, World Bank staff calculations.
Directly related to the future transformation of Malaysia’s economy are a number of internalchallenges that will need to be managed. For example, with the need to boost skill levels featuringprominently in the reform agenda, it needs to be recognized that raising the knowledge intensity of
economic activity may also raise income inequality (as income disparities across skill levels rise).Similarly, in the absence of compensating policies, geographical concentration of economic activity—which is good for productivity—may amplify urban-rural differences as well as leave lagging regionsbehind. Finally, restructuring the sources of growth to support a more narrowly specialized economyand introducing greater competition in product and factor markets may cause temporary disruptionsand dislocations, which if inadequately buffered by social protection systems may result in more long-lasting costs (Figure 2.19).
42China accounted for 30 percent of total FDI inflows to developing countries in 2010, according to the new
estimates by the Chinese authorities that reportedly measure reinvested earnings by multinationals moreaccurately.
0%
20%
40%
60%
CHN JAP TWN KOR SGP THA IDN PHL
1995
2007
0 10 20 30 40 50
PakistanBolivia
MoroccoVenezuela
JordanBelarus
EgyptMalaysiaUkraineGuatemala
ChileVietnam
IndonesiaColombia
GeorgiaArmeniaEcuador
PeruBangladesh
HungaryMexico
BrazilMacedonia
Argentina
8/6/2019 World Bank Economic Monitor - Malaysia Brain Drain (April 2011)
http://slidepdf.com/reader/full/world-bank-economic-monitor-malaysia-brain-drain-april-2011 77/150
ECONOMIC OUTLOOK
77
Policy Approaches to Strengthen Medium-Term Prospects
Against this general background of strong historical performance, yet large untapped potential andemerging challenges on the horizon, the Government of Malaysia has initiated a comprehensiveassessment of the country’s requirements for structural reform. The assessment that has emergedarticulates well the magnitude of the challenges facing Malaysia and also the urgency to make progress
on addressing them.
- “A new economic model is necessary for Malaysia t o progress and join the league of high-income
nations. A paradigm shift is required, especially in terms of national economic strategy and
public policy. The transformational nature of change requires, in our collective selves, the sense
of urgency for change. We need to see the reality for what it is: we are on a burning platform.”
(Economic Planning Unit, 2010, p. 7)
- “Business as usual will not be enough to deliver on the goals of high income, inclusiveness and
sustainability. Malaysia is at a critical point in its economic development. There has been a loss
of growth momentum over the past decade, and it has become increasingly clear that the
historical drivers of growth can no longer be relied on to deliver strong economic outcomes. In an
increasingly competitive global economy it is more difficult to generate high rates of economic
growth. Growth can no longer be taken for granted, but needs to be earned.” (Pemandu, 2010,p. 60)
- “Incremental solutions to address considerable legacy problems and intense international
competition will not succeed. Malaysia must aim for a ‘game change’ package that will stimulate
growth, whilst at the same time address the long-term structural issues that will take time to
resolve.” (National Economic Advisory Council, 2010b, p. 4)
The Government’s approach to tackle the medium-term challenges consists of several pillars, whichwere unveiled consecutively over the last year or so. These pillars remain anchored on Vision 2020,
which envisages the transformation of Malaysia into a high-income country by the year 2020. This wouldbring Malaysia at a per capita income level between USD15,000-20,000 compared to its current level atabout USD7,000. This requires growth levels above 6 percent, which if they are to materialize wouldconstitute a marked improvement over the 4.4 percent achieved during the Ninth Malaysia Plan periodof 2006-2010.
Four interrelated government programs have been developed to meet the Vision 2020 challenge.The first, 1Malaysia, focuses on building support for a ‘People First, Performance Now’ concept. Thesecond is the Tenth Malaysia Plan (RMK10), covering the period of 2011-2015 and incorporatingmacroeconomic and socio-economic targets and development expenditure allocations within aframework of ‘10 Big Ideas’. In particular it targets a revival of private investment, improvement in
productivity and rationalization of the role of the government. The third is the GovernmentTransformation Program (GTP), which aims to improve the efficiency of delivery of government servicesin six National Key Results Areas (NKRAs). The fourth is the Economic Transformation Programme (ETP),launched October 2010, which aims to structurally transform the macro- and micro-enabling economicenvironments and catalyze investment in specific sectors of strategic interest.
In what follows, the two transformation programs—GTO and ETP—will be discussed in more detail.
8/6/2019 World Bank Economic Monitor - Malaysia Brain Drain (April 2011)
http://slidepdf.com/reader/full/world-bank-economic-monitor-malaysia-brain-drain-april-2011 78/150
MALAYSIA ECONOMIC MONITOR
78
Government Transformation Programme
The Government Transformation Programme (GTP) seeks to enhance government effectiveness indelivering public services. As part of the reform agenda to achieve Vision 2020, the GTP was firstlaunched in April 2009 and will be implemented in three phases over 2010-2020. The Programmefocuses on six key priority areas, or National Key Result Areas (NKRAs), namely reducing crime, fighting
corruption, improving student outcomes, raising living standards of low income households, improvingrural basic infrastructure, and improving urban public transport. Individual ministers are tasked to leadthe NKRAs to ensure accountability of outcomes. There is a set of National Key Performance Indicators(NKPIs) for each NKRA to measure Ministers’ performance. Specific targets, typically numerical, are
reviewed and adjusted on an annual basis. For example, the Minister of Home Affairs is taking the leadon the Reducing Crime NKRA, with NKPIs such as a five-percent reduction in index crime and a 20-percent decrease in street crime in 2010. Meanwhile, NKRAs are a dynamic concept so they may changeas the GTP progresses. Other important areas that are not covered under NKRAs, such as cutting thenumber of road traffic accidents, are called Ministerial Key Result Areas (MKRAs, 29 in total) with theirown Ministerial Key Performance Indicators (MKPIs)
Economic Transformation Programme
The ETP was introduced after the GTP and consists of two components. The first one is the NewEconomic Model, which comprises two reports produced by the National Economic Advisory Councildelivered in April and December 2010. The New Economic Model addresses Malaysia’s cross -cuttingbottlenecks and consists of 8 Strategic Reform Initiatives.43 The NEM sets out policy options to improvethe enabling environment so as to achieve the macro targets of the 10MP and Vision 2020.
The second component consists of the National Key Economic Activities (NKEAs), which werediscussed in an Open House in the second half of September. The NKEA initiatives represents a bottom-up consultative approach to identifying investment opportunities in support of Malaysia’s high-incomeobjective. The intensive NKEA consultations and ‘labs’ that took place quantified the potential gross
national income benefits of projects in different economic areas. This decentralized process involvedexperts from the private sector, GLCs and public sector. A total of 12 NKEAs were identified including 11economic sectors — oil, gas and energy, financial services, palm oil, wholesale and retail trade, tourism,E&E, business services, education, communications content and infrastructure, healthcare, agriculture— and one geographic sector — the greater Kuala Lumpur conurbation.
The NKEA projects identified require substantial fixed investment. Within the NKEAs 131 entry pointprojects (EPPs) were identified, i.e. projects which can be implemented relatively quickly and withsizeable estimated impact on gross national income. A further 60 business opportunities for futureinvestment projects were also highlighted. The investment required over 2011-2020 for the EPPs isestimated to be USD444 billion, of which an estimated 8 percent is from the non-GLC public sector, 32
percent from the GLCs and 60 percent from the private sector. Just over a quarter of the overall figure isplanned to come through in the form of foreign investment.
43These include (i) re-energizing the private sector, (ii) developing a quality workforce, (iii) creating a
competitive domestic economy, (iv) strengthening the public sector, (v) transparent and market-friendly
affirmative action, (vi) building the knowledge-based and infrastructure, (vii) enhancing the sources of growth, and(viii) ensuring sustainability of growth
8/6/2019 World Bank Economic Monitor - Malaysia Brain Drain (April 2011)
http://slidepdf.com/reader/full/world-bank-economic-monitor-malaysia-brain-drain-april-2011 79/150
ECONOMIC OUTLOOK
79
Assessment of Medium-Term Outlook and Risks
Relative to the previous issue of the Malaysia Economic Monitor , the economic challenges facingMalaysia have come into sharper focus. On the one hand, progress has been made on theimplementation side, particularly with respect to the Government Transformation Programme and theNKEA projects under the Economic Transformation Programme. On the other hand, investor sentiment
appears to remain skeptical about the prospect of implementation of the measures that tackle theunderlying cross-cutting bottlenecks that hold Malaysia back from realizing its full growth potential.
Implementation is Progressing, But Skepticism Remains
Consultations with private sector counterparts in Malaysia and overseas suggest that investorsentiment appears to have warmed up considerably insofar as it concerns the project-based approachunder the NKEAs. On this basis, there is a general sense that investment momentum will accelerate
within the foreseeable future even if not all of the projects announced are considered to reflectincremental investment relative to what the private sector may have invested anyway.
The GTP has successfully achieved many targets in its first year of implementation. Out of the sixNKRAs, Reducing Crime and Improving Student Outcomes appeared to have moved more quickly thanothers. All 2010 NKPIs under these two NKRAs are satisfactorily met. Street crime reportedly came downby 35 percent which was the first reduction in four years, while many more violent crime backlog caseswere also cleared. On education, targets for pre-school enrolment, literacy rate, and numeracy rate arefulfilled.44 In other areas, changes were made to legal and institutional arrangements, where the impacton outcomes are expected to show only over time. For example, under the NKRA of Fighting Corruption,new initiatives include the Whistleblower Protection Act 2010 and the launch of a website that listsdetails of government contracts and awarded tenders. One NKPI that was not satisfactorily concernedthe reduction of poor households by 46,000 in 2010. This partly related to the 2009 poverty incidence
estimate, which was not available when the target was being set, turning out higher than previouslyanticipated.
Several implementation challenges remain for the GTP. The GTP is widely praised for its outcomeaccountability, commitment from top-level management, broad buy-in within the civil services,reasonably high public engagement, and monitoring and evaluation efforts. Nonetheless, thegovernment has acknowledged several challenges in moving the GTP forward. The most significant oneis coordination across government agencies as NKRAs are inter-agency in nature. Cutting agency-specificred tape (e.g. permits and documentation), enhancing communication strategy, and minimizingduplication of tasks seem to be priorities in this respect. Shortages of some non-financial resources alsopose difficulties but this will take time to address, e.g. upgrading the quality of pre-school teachers.Tackling these issues is needed to sustain the success of the GTP. Going forward, targets will becomeincreasingly demanding and outcomes are naturally more difficult to achieve.45
44Nevertheless, these targets tend to primarily capture the quantitative aspect of educational achievement.
Specific targets on the quality of students based on international standardized test scores are uncommon.45
For example, in combating crime, the government has spent disproportionately high resources on selected
high-crime areas. Once the crime rate in these areas is down and crime is more evenly dispersed across areas, asharp reduction in overall crime is harder.
8/6/2019 World Bank Economic Monitor - Malaysia Brain Drain (April 2011)
http://slidepdf.com/reader/full/world-bank-economic-monitor-malaysia-brain-drain-april-2011 80/150
MALAYSIA ECONOMIC MONITOR
80
The project-side of the ETP demonstrated notable progress. As of mid-April 2011, the ETP hasattracted 72 potential projects that are together estimated to invest RM106.4 billion by 2020 orequivalent to 70 percent of total gross fixed investment in 2010. Government estimates suggest thatthese projects would generate 298,865 jobs (which is 2.4 percent of the Malaysian labor force). Thelarger projects in terms of potential income generation (over USD10 billion) include the Kuala Lumpururban mass rapid transit system and initiatives in solar, semiconductors, aviation maintenance & repair,
and energy efficiency-enhancement. The level of commitments in these projects also seems to increase.Out of 131 EPPs, the number of committed projects increased to 21 in March 2011, up from 7 projects inOctober 2010. The number of ‘close to commitment’ projects also rose from 12 to 25. So far, the twoNKEAs that have attracted higher investment values relative to their targets are Greater KL and Oil, gasand energy. The announced-to-target investment value ratio reached 23 and 13 percent as of mid-April2011 respectively.
Counterparts, however, remained skeptical about the impact of the cross-cutting reform
announcements under the NEM. Most do not price the NEM measures into their medium-termforecasts, considering them instead as upside risk factors. The skepticism observed among counterpartsis likely to reflect two issues:
The difficulty of the cross-cutting route. To be successful, the NEM route will require acomprehensive overhaul of policy frameworks, where success may show itself only after aperiod of many years of steady implementation—for example, there are few quick wins instrengthening the country’s education system. The NEM reform agenda is therefore also
more difficult to implement.
A perceptions issue. Given the considerable efforts the Government of Malaysia is taking tomake the NEM proposals concrete (consider for example the various ongoing labs on theStrategic Reform Initiatives46) and enhance the pressure to implement (consider thatministers and ministries have been given specific key performance indicators), there alsoappears to be a perceptions issue, which could be addressed by enhanced communication.
Tackling Cross-Cutting Issues Remains Crucial
Given the importance of the cross-cutting policy reforms, the apparent high level of skepticism and
the perceptions issue, it is in our view critical that NEM implementation is accelerated. Bolder effortswill be needed to sway investor sentiment and tap into Malaysia’s vast unrealized growth potentialamidst intensified regional competition.
This view is based on the presumption that the alternative of gradual and incompleteimplementation of the NEM is unlikely to reverse the erosion of the internal dynamism and externalcompetitiveness of Malaysia’s economy. Two factors will make it likely that Malaysia’s economic
performance will deteriorate under this scenario:
46In the past few months, the government has conducted a number of labs attended by various participants
from the public and private sectors. These labs sought to gather opinions in order to deliver 51 cross-cutting policymeasures announced under the concluding part of the NEM concretely and tangibly.
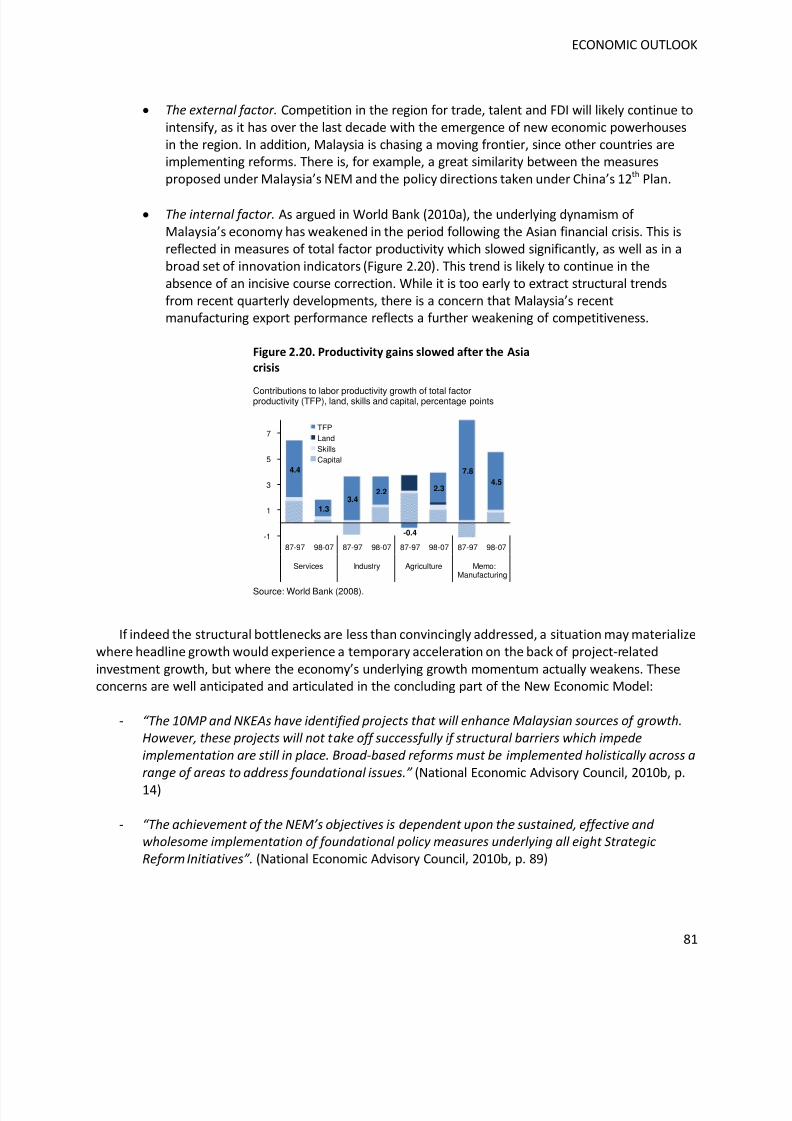
8/6/2019 World Bank Economic Monitor - Malaysia Brain Drain (April 2011)
http://slidepdf.com/reader/full/world-bank-economic-monitor-malaysia-brain-drain-april-2011 81/150
ECONOMIC OUTLOOK
81
The external factor. Competition in the region for trade, talent and FDI will likely continue tointensify, as it has over the last decade with the emergence of new economic powerhousesin the region. In addition, Malaysia is chasing a moving frontier, since other countries areimplementing reforms. There is, for example, a great similarity between the measuresproposed under Malaysia’s NEM and the policy directions taken under China’s 12th Plan.
The internal factor. As argued in World Bank (2010a), the underlying dynamism of Malaysia’s economy has weakened in the period following the Asian financial crisis. This isreflected in measures of total factor productivity which slowed significantly, as well as in abroad set of innovation indicators (Figure 2.20). This trend is likely to continue in theabsence of an incisive course correction. While it is too early to extract structural trendsfrom recent quarterly developments, there is a concern that Malaysia’s recentmanufacturing export performance reflects a further weakening of competitiveness.
Figure 2.20. Productivity gains slowed after the Asia
crisis
Contributions to labor productivity growth of total factorproductivity (TFP), land, skills and capital, percentage points
Source: World Bank (2008).
If indeed the structural bottlenecks are less than convincingly addressed, a situation may materializewhere headline growth would experience a temporary acceleration on the back of project-related
investment growth, but where the economy’s underlying growth momentum actually weakens. Theseconcerns are well anticipated and articulated in the concluding part of the New Economic Model:
- “The 10MP and NKEAs have identified pro jects that will enhance Malaysian sources of growth.
However, these projects will not take off successfully if structural barriers which impede
implementation are still in place. Broad-based reforms must be implemented holistically across a
range of areas to address foundational issues.” (National Economic Advisory Council, 2010b, p.
14)
- “The achievement of the NEM’s objectives is dependent upon the sustained, effective and
wholesome implementation of foundational policy measures underlying all eight Strategic
Reform Initiatives”. (National Economic Advisory Council, 2010b, p. 89)
4.4
1.3
3.42.2
-0.4
2.3
7.8
4.5
-1
1
3
5
7
87-97 98-07 87-97 98-07 87-97 98-07 87-97 98-07
Services Industry Agriculture Memo:Manufacturing
TFPLandSkillsCapital
8/6/2019 World Bank Economic Monitor - Malaysia Brain Drain (April 2011)
http://slidepdf.com/reader/full/world-bank-economic-monitor-malaysia-brain-drain-april-2011 82/150
MALAYSIA ECONOMIC MONITOR
82
- “While the NKEAs focus on sectors and industries that will drive economic growth, its initiatives
will face the same constraints and obstacles as those attempted in the past unless the
foundational NEM SRIs are implemented simultaneously. Similarly, the SRIs themselves are
interdependent and must be implemented in a holistic and comprehensive manner.” (NationalEconomic Advisory Council, 2010b, p. 99)
To support the acceleration of reform implementation, policymakers could consider reprioritizingthe reform agenda, refocusing on the critical binding constraints to growth first and attempting to over-deliver on these. The good news is that, in the face of Malaysia’s vast unrealized potential, the criticalbottlenecks also present significant opportunities to accelerate growth. In this respect concrete policyactions that support productivity and inclusiveness should attract first priority—at theme that will beechoed in the next Chapter.
8/6/2019 World Bank Economic Monitor - Malaysia Brain Drain (April 2011)
http://slidepdf.com/reader/full/world-bank-economic-monitor-malaysia-brain-drain-april-2011 83/150
3. BRAIN DRAIN
“Malaysia faces an exodus of talent. Not only is our education system failing to deliver
the required talent, we have not been able to retain local talent of all races nor attract
foreign ones due to poor prospects and a lack of high-skilled jobs." (NEAC, 2010a, p.60)
Human capital is the bedrock of the high-income economy. As Malaysia prepares to join the leagueof high-income nations, it is embarking upon a structural transformation of its economy that relies onskill-intensive and innovation-led growth. Unsurprisingly, the agenda of human capital development hastaken center stage in the reform agenda. For Malaysia to meet the requirements of its new growthmodel, it will need to develop, attract and retain talent.
Against this backdrop, brain drain—or the cross-border migration of talent—poses a specificchallenge. If indeed there has been and continues to be an ‘exodus of talent’ as the quote above
suggests, the brain drain could well be a major stumbling block in Malaysia’s journey towards highincome. Indeed, the outflow of talent does not seem to square with what is needed domestically: askilled, entrepreneurial and creative labor force that helps propel value added.
Brain drain has long been a subject of debate and controversy, but few studies have characterizedthe phenomenon in the Malaysian context—be it in terms of magnitude, impact or policy response. AsDanny Quah of the London School of Economics remarked in a recent New York Times interview,“people have left, growth prospects have dimmed, and then more people continue to leave … It is avicious cycle that the economy has had to confront for the last decade or longer” (Gooch, 2010).
These observations alone lead to three sets of questions
The fact that “people have left” is largely uncontested. But what is the magnitude and intensityof Malaysia’s brain drain, what are its characteristics and for what reasons do people emigrate?
“Growth prospects have dimmed.” This may be true, but is brain drain a f undamental cause ora symptomatic consequence? Is brain drain necessarily negative? What is the overall impact?
If indeed brain drain is responsible for “a vicious cycle”, how can Malaysia break out of thiscycle? Is there a role for policy? What would these policies consist of?
This Chapter attempts to address these questions in the following sequence. It first places the braindrain in the global context, highlighting that brain drain is far from unique to Malaysia. Next it presents
new estimates, based on the latest information available, of the magnitude of the Malaysian diasporaand brain drain. It then examines the economic impact of brain drain, where the significance of Malaysia’s brain drain, the channels of economic impact, and the overall effect on human capitalformation are considered. Finally, it offers broad policy suggestions, which are anchored on theunderlying determinants of brain drain and distinguish between comprehensive and targetedapproaches.
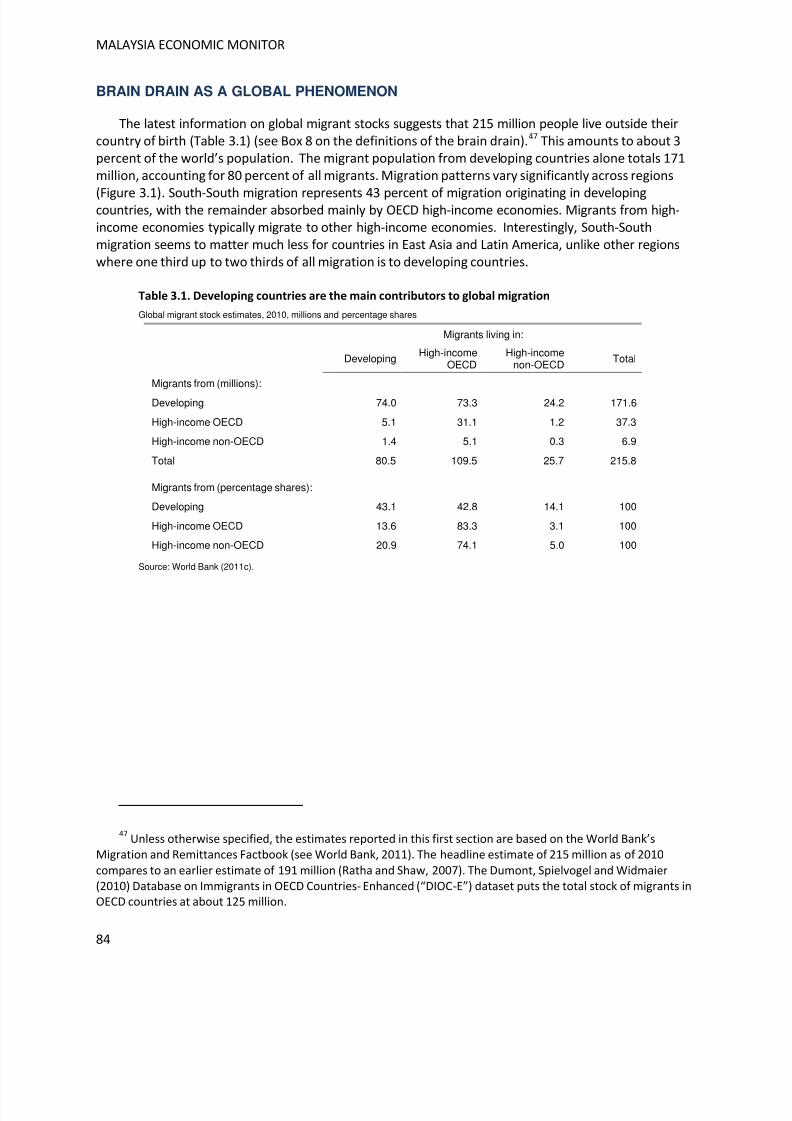
8/6/2019 World Bank Economic Monitor - Malaysia Brain Drain (April 2011)
http://slidepdf.com/reader/full/world-bank-economic-monitor-malaysia-brain-drain-april-2011 84/150
MALAYSIA ECONOMIC MONITOR
84
BRAIN DRAIN AS A GLOBAL PHENOMENON
The latest information on global migrant stocks suggests that 215 million people live outside theircountry of birth (Table 3.1) (see Box 8 on the definitions of the brain drain).47 This amounts to about 3percent of the world’s population. The migrant population from developing countries alone totals 171million, accounting for 80 percent of all migrants. Migration patterns vary significantly across regions
(Figure 3.1). South-South migration represents 43 percent of migration originating in developingcountries, with the remainder absorbed mainly by OECD high-income economies. Migrants from high-income economies typically migrate to other high-income economies. Interestingly, South-Southmigration seems to matter much less for countries in East Asia and Latin America, unlike other regionswhere one third up to two thirds of all migration is to developing countries.
Table 3.1. Developing countries are the main contributors to global migration
Global migrant stock estimates, 2010, millions and percentage shares
Migrants living in:
DevelopingHigh-income
OECDHigh-income
non-OECDTotal
Migrants from (millions):
Developing 74.0 73.3 24.2 171.6
High-income OECD 5.1 31.1 1.2 37.3
High-income non-OECD 1.4 5.1 0.3 6.9
Total 80.5 109.5 25.7 215.8
Migrants from (percentage shares):
Developing 43.1 42.8 14.1 100
High-income OECD 13.6 83.3 3.1 100
High-income non-OECD 20.9 74.1 5.0 100
Source: World Bank (2011c).
47 Unless otherwise specified, the estimates reported in this first section are based on the World Bank’s
Migration and Remittances Factbook (see World Bank, 2011). The headline estimate of 215 million as of 2010
compares to an earlier estimate of 191 million (Ratha and Shaw, 2007). The Dumont, Spielvogel and Widmaier
(2010) Database on Immigrants in OECD Countries-Enhanced (“DIOC-E”) dataset puts the total stock of migrants inOECD countries at about 125 million.
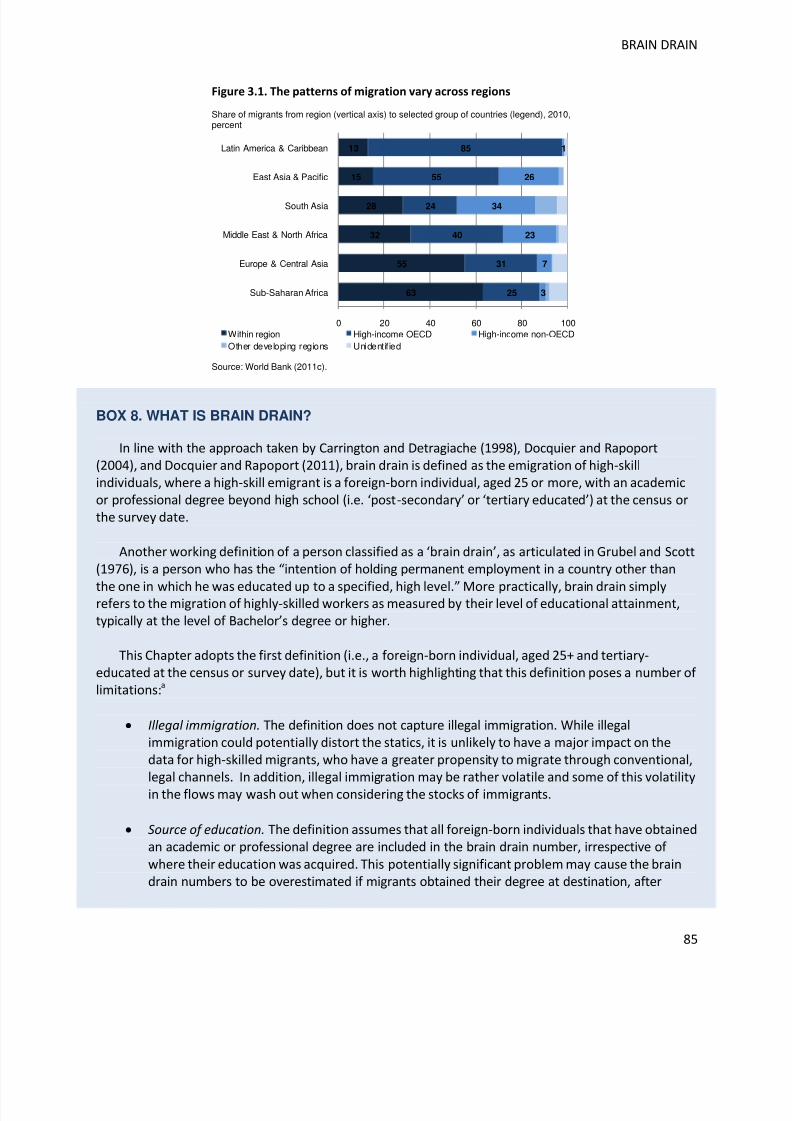
8/6/2019 World Bank Economic Monitor - Malaysia Brain Drain (April 2011)
http://slidepdf.com/reader/full/world-bank-economic-monitor-malaysia-brain-drain-april-2011 85/150
BRAIN DRAIN
85
Figure 3.1. The patterns of migration vary across regions
Share of migrants from region (vertical axis) to selected group of countries (legend), 2010,percent
Source: World Bank (2011c).
BOX 8. WHAT IS BRAIN DRAIN?
In line with the approach taken by Carrington and Detragiache (1998), Docquier and Rapoport(2004), and Docquier and Rapoport (2011), brain drain is defined as the emigration of high-skillindividuals, where a high-skill emigrant is a foreign-born individual, aged 25 or more, with an academicor professional degree beyond high school (i.e. ‘post-secondary’ or ‘tertiary educated’) at the census orthe survey date.
Another working definition of a person classified as a ‘brain drain’, as articulated in Grubel and Scott(1976), is a person who has the “intention of holding permanent employment in a country other than
the one in which he was educated up to a specified, high level.” More practically, brain drain simplyrefers to the migration of highly-skilled workers as measured by their level of educational attainment,typically at the level of Bachelor’s degree or higher.
This Chapter adopts the first definition (i.e., a foreign-born individual, aged 25+ and tertiary-educated at the census or survey date), but it is worth highlighting that this definition poses a number of limitations:a
Illegal immigration. The definition does not capture illegal immigration. While illegalimmigration could potentially distort the statics, it is unlikely to have a major impact on thedata for high-skilled migrants, who have a greater propensity to migrate through conventional,legal channels. In addition, illegal immigration may be rather volatile and some of this volatilityin the flows may wash out when considering the stocks of immigrants.
Source of education. The definition assumes that all foreign-born individuals that have obtainedan academic or professional degree are included in the brain drain number, irrespective of
where their education was acquired. This potentially significant problem may cause the braindrain numbers to be overestimated if migrants obtained their degree at destination, after
63
55
32
28
15
13
25
31
40
24
55
85
3
7
23
34
26
1
0 20 40 60 80 100
Sub-Saharan Africa
Europe & Central Asia
Middle East & North Africa
South Asia
East Asia & Pacific
Latin America & Caribbean
Within region High-income OECD High-income non-OECDOther developing regions Unidentified
8/6/2019 World Bank Economic Monitor - Malaysia Brain Drain (April 2011)
http://slidepdf.com/reader/full/world-bank-economic-monitor-malaysia-brain-drain-april-2011 86/150
MALAYSIA ECONOMIC MONITOR
86
migrating. If migrants arrived after having received their education at home, then this is a moreserious phenomenon because the home country spent resources educating these individualsbut is not reaping the social dividend on their investment in human capital. Corrections basedon the date of entry of immigrants, as a proxy for whether education was acquired in the homeor host country, may shed light on the magnitude of this bias. Immigrant surveys may provide
further insight.
Heterogeneity in human capital levels. The definition equates the notion of high-skill withhaving obtained an academic or professional degree, but does not make any furtherdifferentiation on the actual skill level of the migrant. To put it simply, foreign-born individualsare considered ‘brain drain’, independent of what they are actually doing in the recipientcountry and there may be ‘brain wastage’ as well. Field of study, type of degree, actualoccupation and work experience all matter greatly and perhaps more so than the binaryconsideration whether or not the migrant has a tertiary degree.
Additional complications arise in connection with the measurement of migratory flows more
generally:
Lack of uniformity in data collection. There is also no uniformity in the practices of variousdestination countries when it comes to collection of census data. Some countries ask forcountry of birth while others ask for country of citizenship. This poses particular issues whenattempting to compare numbers across countries and also over time, where in some cases a
jurisdiction may have switched from collecting country of citizenship to country of birth (suchas in the case of Singapore from the 1990 census onwards).
Foreign-born migrants versus foreign citizens who are migrants. Consider a US expatriate of Caucasian ethnicity has a child during her stay in Malaysia and afterwards returns to the US.The child will be counted as a Malaysian-born migrant. Looking at the US census returns for2000, it seems that the number of such individuals, while not many, is by no means trivial. Outof 49,460 Malaysian-born migrants, 3,335 were not of Asian ethnicity. In other words, 6.7percent of the stock of Malaysian-born migrants in the US were not considered ‘migrants’ inthe sense of ethno-cultural transition to a different country.
Note:a
The discussion draws upon Docquier and Rapoport (2011) and Docquier and Marfouk (2006).
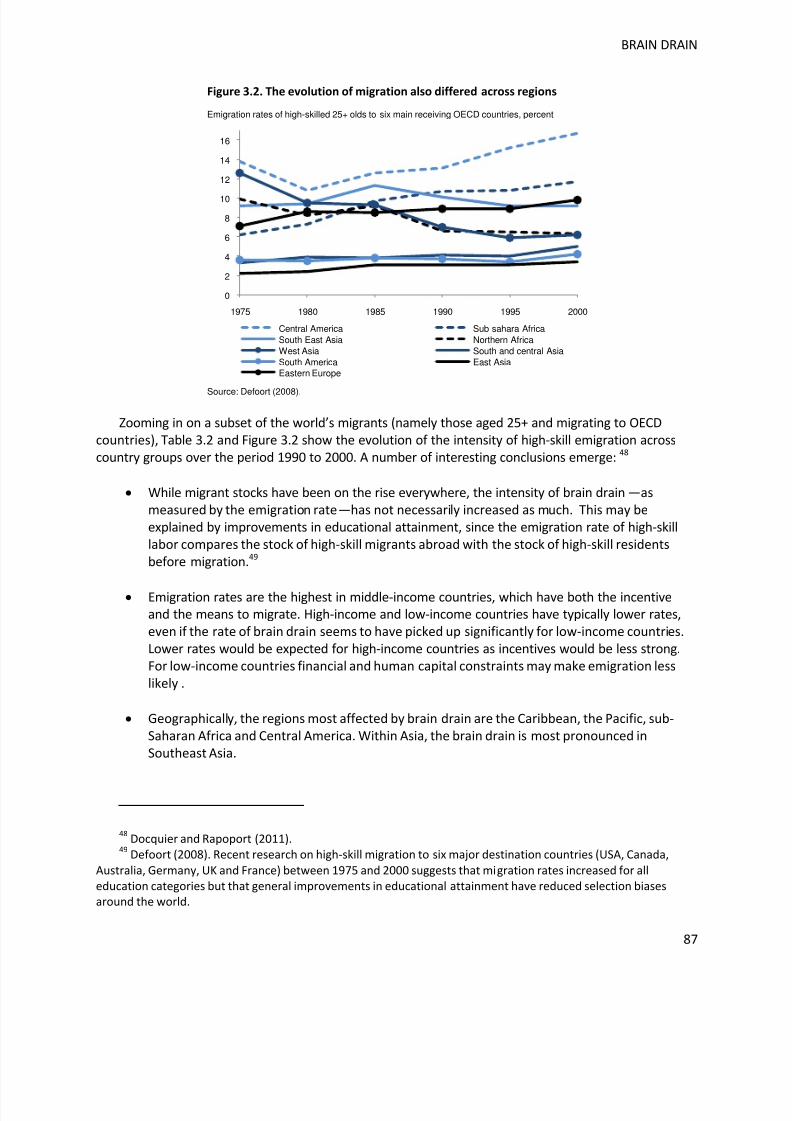
8/6/2019 World Bank Economic Monitor - Malaysia Brain Drain (April 2011)
http://slidepdf.com/reader/full/world-bank-economic-monitor-malaysia-brain-drain-april-2011 87/150
BRAIN DRAIN
87
Figure 3.2. The evolution of migration also differed across regions
Emigration rates of high-skilled 25+ olds to six main receiving OECD countries, percent
Source: Defoort (2008).
Zooming in on a subset of the world’s migrants (namely those aged 25 and migrating to OECDcountries), Table 3.2 and Figure 3.2 show the evolution of the intensity of high-skill emigration acrosscountry groups over the period 1990 to 2000. A number of interesting conclusions emerge: 48
While migrant stocks have been on the rise everywhere, the intensity of brain drain —asmeasured by the emigration rate—has not necessarily increased as much. This may beexplained by improvements in educational attainment, since the emigration rate of high-skilllabor compares the stock of high-skill migrants abroad with the stock of high-skill residentsbefore migration.49
Emigration rates are the highest in middle-income countries, which have both the incentiveand the means to migrate. High-income and low-income countries have typically lower rates,even if the rate of brain drain seems to have picked up significantly for low-income countries.Lower rates would be expected for high-income countries as incentives would be less strong.For low-income countries financial and human capital constraints may make emigration lesslikely .
Geographically, the regions most affected by brain drain are the Caribbean, the Pacific, sub-Saharan Africa and Central America. Within Asia, the brain drain is most pronounced inSoutheast Asia.
48Docquier and Rapoport (2011).
49Defoort (2008). Recent research on high-skill migration to six major destination countries (USA, Canada,
Australia, Germany, UK and France) between 1975 and 2000 suggests that migration rates increased for all
education categories but that general improvements in educational attainment have reduced selection biasesaround the world.
0
2
4
6
8
10
12
14
16
1975 1980 1985 1990 1995 2000
Central America Sub-sahara AfricaSouth East Asia Northern AfricaWest Asia South and central AsiaSouth America East AsiaEastern Europe
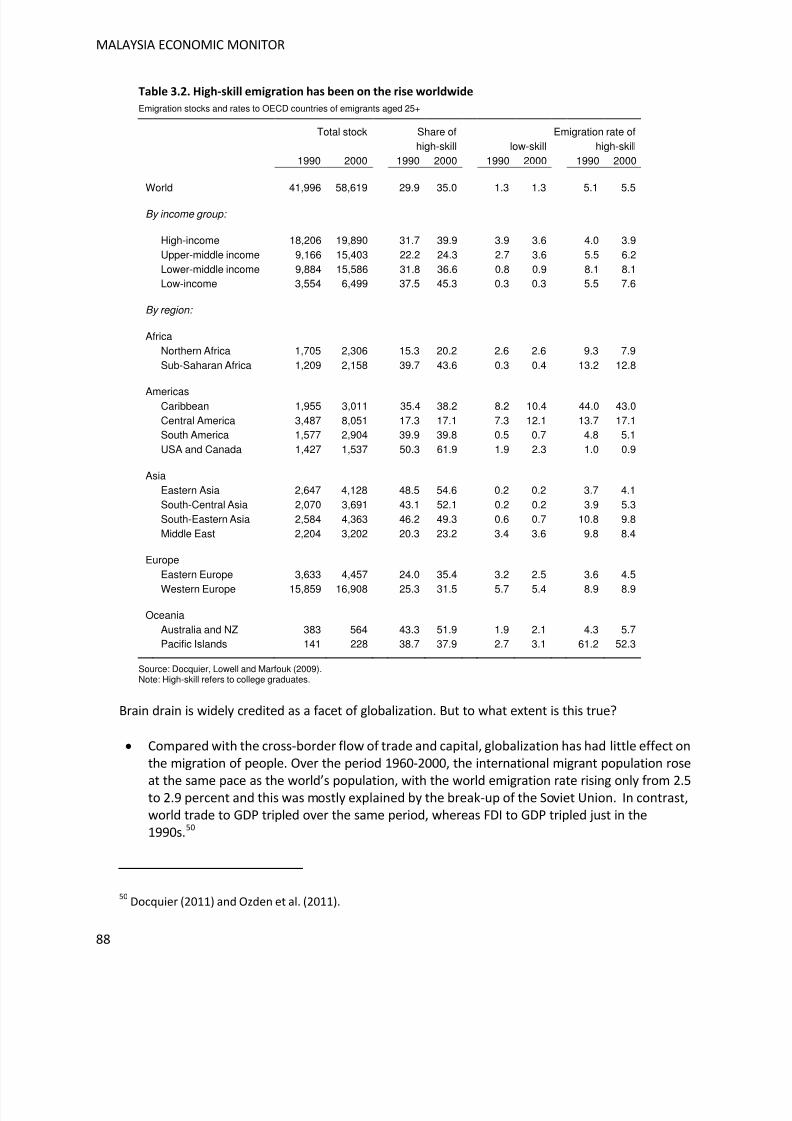
8/6/2019 World Bank Economic Monitor - Malaysia Brain Drain (April 2011)
http://slidepdf.com/reader/full/world-bank-economic-monitor-malaysia-brain-drain-april-2011 88/150
MALAYSIA ECONOMIC MONITOR
88
Table 3.2. High-skill emigration has been on the rise worldwide
Emigration stocks and rates to OECD countries of emigrants aged 25+
Total stock Share of Emigration rate ofhigh-skill low-skill high-skill
1990 2000 1990 2000 1990 2000 1990 2000
World 41,996 58,619 29.9 35.0 1.3 1.3 5.1 5.5
By income group:
High-income 18,206 19,890 31.7 39.9 3.9 3.6 4.0 3.9Upper-middle income 9,166 15,403 22.2 24.3 2.7 3.6 5.5 6.2Lower-middle income 9,884 15,586 31.8 36.6 0.8 0.9 8.1 8.1Low-income 3,554 6,499 37.5 45.3 0.3 0.3 5.5 7.6
By region:
AfricaNorthern Africa 1,705 2,306 15.3 20.2 2.6 2.6 9.3 7.9Sub-Saharan Africa 1,209 2,158 39.7 43.6 0.3 0.4 13.2 12.8
AmericasCaribbean 1,955 3,011 35.4 38.2 8.2 10.4 44.0 43.0Central America 3,487 8,051 17.3 17.1 7.3 12.1 13.7 17.1South America 1,577 2,904 39.9 39.8 0.5 0.7 4.8 5.1USA and Canada 1,427 1,537 50.3 61.9 1.9 2.3 1.0 0.9
AsiaEastern Asia 2,647 4,128 48.5 54.6 0.2 0.2 3.7 4.1South-Central Asia 2,070 3,691 43.1 52.1 0.2 0.2 3.9 5.3South-Eastern Asia 2,584 4,363 46.2 49.3 0.6 0.7 10.8 9.8Middle East 2,204 3,202 20.3 23.2 3.4 3.6 9.8 8.4
EuropeEastern Europe 3,633 4,457 24.0 35.4 3.2 2.5 3.6 4.5
Western Europe 15,859 16,908 25.3 31.5 5.7 5.4 8.9 8.9
OceaniaAustralia and NZ 383 564 43.3 51.9 1.9 2.1 4.3 5.7Pacific Islands 141 228 38.7 37.9 2.7 3.1 61.2 52.3
Source: Docquier, Lowell and Marfouk (2009).Note: High-skill refers to college graduates.
Brain drain is widely credited as a facet of globalization. But to what extent is this true?
Compared with the cross-border flow of trade and capital, globalization has had little effect onthe migration of people. Over the period 1960-2000, the international migrant population rose
at the same pace as the world’s population, with the world emigration rate rising only from 2.5to 2.9 percent and this was mostly explained by the break-up of the Soviet Union. In contrast,world trade to GDP tripled over the same period, whereas FDI to GDP tripled just in the1990s.50
50Docquier (2011) and Ozden et al. (2011).
8/6/2019 World Bank Economic Monitor - Malaysia Brain Drain (April 2011)
http://slidepdf.com/reader/full/world-bank-economic-monitor-malaysia-brain-drain-april-2011 89/150
BRAIN DRAIN
89
The picture completely changes if we focus the cross-border flow of skilled people— braindrain. Table 3.2 points to a stock of 20 million highly skilled migrants in 2000 who are educatedat tertiary level, were born abroad and now live in the OECD countries. Compare this to 1990:the stock back then was only 12 million. This fast growth of 70 percent occurred over the spanof a single decade, at about double the rate of increase of low-skilled migrants.51
MAGNITUDE OF BRAIN DRAIN
Clearly the brain drain is by no means unique to Malaysia, but how large is it then? What is themagnitude of Malaysia’s diaspora—the worldwide assortment overseas of men, women and childrenborn in Malaysia? How many among them are skilled and can be considered as part of the brain drain?These are the questions that this section will attempt to address.
Estimating the magnitude of Malaysia’s diaspora and brain drain is a complex undertaking. Over thelast decade significant progress has been made in statistical efforts to document the cross-border flowof people and skills. In spite of this, international migration data remains spotty and imprecise,
particularly compared to data on capital and trade flows. Underreporting of irregular migration,reporting lags in census data, and cross-country variations in the very definition of a migrant all affectthe quality, availability, timeliness and comparability of the data. Statistical discrepancies remain animportant limiting factor.
Given these complexities, quantifying Malaysia’s diaspora and brain drain with a single pointestimate would convey a false sense of precision. Instead, this chapter provides a ball-park range forextent of the diaspora and brain drain and it also provides a judgment as to which numbers are morelikely than others. The estimates are constructed along the following steps:
- A first glance at the data. We first examine the numbers as they come in directly fromnational statistical offices and other reputable sources. Based on these, we measure the sizeof the Malaysian diaspora and brain drain, its key characteristics, and the evolution over thepast three decades. We provide an updated picture on the basis of the most recentinformation available, including Singapore’s census results which were released early 2011.The estimates derived in this way serve as a baseline for further analysis.
- Scenario-based estimates. Further analysis is required because of two critical missing piecesin the puzzle: first, the evolution of migrant stocks between the latest data release and2010; and second, the share of Malaysian-born individuals in Singapore’s nonresident population which makes up a quarter of Singapore’s population. To address these gaps inour understanding, we extrapolate the latest numbers to 2010 using an assumption of moderate growth. We also construct scenarios to provide a structured and transparent view
on the ‘known unknowns’ about Singapore’s nonresident population. Based on thesescenarios we arrive at a range of estimates of the diaspora and brain drain —worldwide andcurrent as of 2010.
51Docquier and Rapoport (2006).
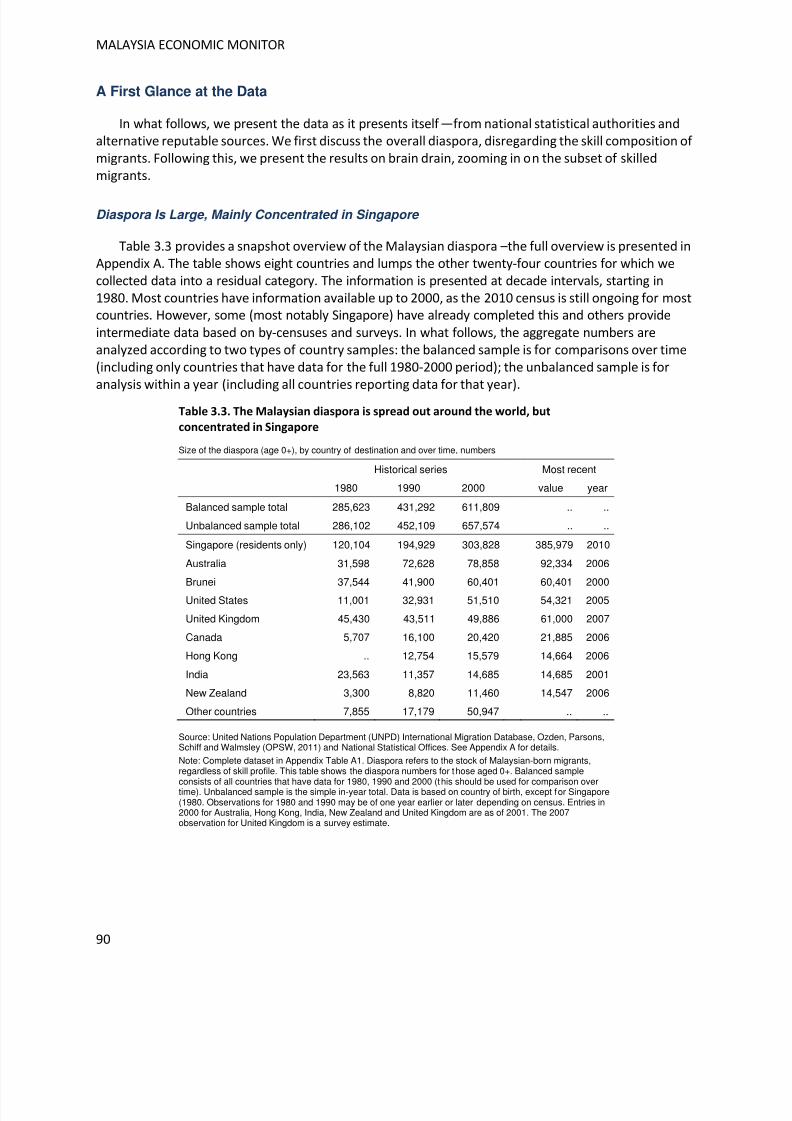
8/6/2019 World Bank Economic Monitor - Malaysia Brain Drain (April 2011)
http://slidepdf.com/reader/full/world-bank-economic-monitor-malaysia-brain-drain-april-2011 90/150
MALAYSIA ECONOMIC MONITOR
90
A First Glance at the Data
In what follows, we present the data as it presents itself —from national statistical authorities andalternative reputable sources. We first discuss the overall diaspora, disregarding the skill composition of migrants. Following this, we present the results on brain drain, zooming in on the subset of skilledmigrants.
Diaspora Is Large, Mainly Concentrated in Singapore
Table 3.3 provides a snapshot overview of the Malaysian diaspora –the full overview is presented inAppendix A. The table shows eight countries and lumps the other twenty-four countries for which wecollected data into a residual category. The information is presented at decade intervals, starting in1980. Most countries have information available up to 2000, as the 2010 census is still ongoing for mostcountries. However, some (most notably Singapore) have already completed this and others provide
intermediate data based on by-censuses and surveys. In what follows, the aggregate numbers areanalyzed according to two types of country samples: the balanced sample is for comparisons over time(including only countries that have data for the full 1980-2000 period); the unbalanced sample is foranalysis within a year (including all countries reporting data for that year).
Table 3.3. The Malaysian diaspora is spread out around the world, but
concentrated in Singapore
Size of the diaspora (age 0+), by country of destination and over time, numbers
Historical series Most recent
1980 1990 2000 value year
Balanced sample total 285,623 431,292 611,809 .. ..
Unbalanced sample total 286,102 452,109 657,574 .. ..
Singapore (residents only) 120,104 194,929 303,828 385,979 2010
Australia 31,598 72,628 78,858 92,334 2006
Brunei 37,544 41,900 60,401 60,401 2000
United States 11,001 32,931 51,510 54,321 2005
United Kingdom 45,430 43,511 49,886 61,000 2007
Canada 5,707 16,100 20,420 21,885 2006
Hong Kong .. 12,754 15,579 14,664 2006
India 23,563 11,357 14,685 14,685 2001
New Zealand 3,300 8,820 11,460 14,547 2006
Other countries 7,855 17,179 50,947 .. ..
Source: United Nations Population Department (UNPD) International Migration Database, Ozden, Parsons,Schiff and Walmsley (OPSW, 2011) and National Statistical Offices. See Appendix A for details.
Note: Complete dataset in Appendix Table A1. Diaspora refers to the stock of Malaysian-born migrants,regardless of skill profile. This table shows the diaspora numbers for those aged 0+. Balanced sample
consists of all countries that have data for 1980, 1990 and 2000 (this should be used for comparison overtime). Unbalanced sample is the simple in-year total. Data is based on country of birth, except for Singapore(1980. Observations for 1980 and 1990 may be of one year earlier or later depending on census. Entries in2000 for Australia, Hong Kong, India, New Zealand and United Kingdom are as of 2001. The 2007observation for United Kingdom is a survey estimate.
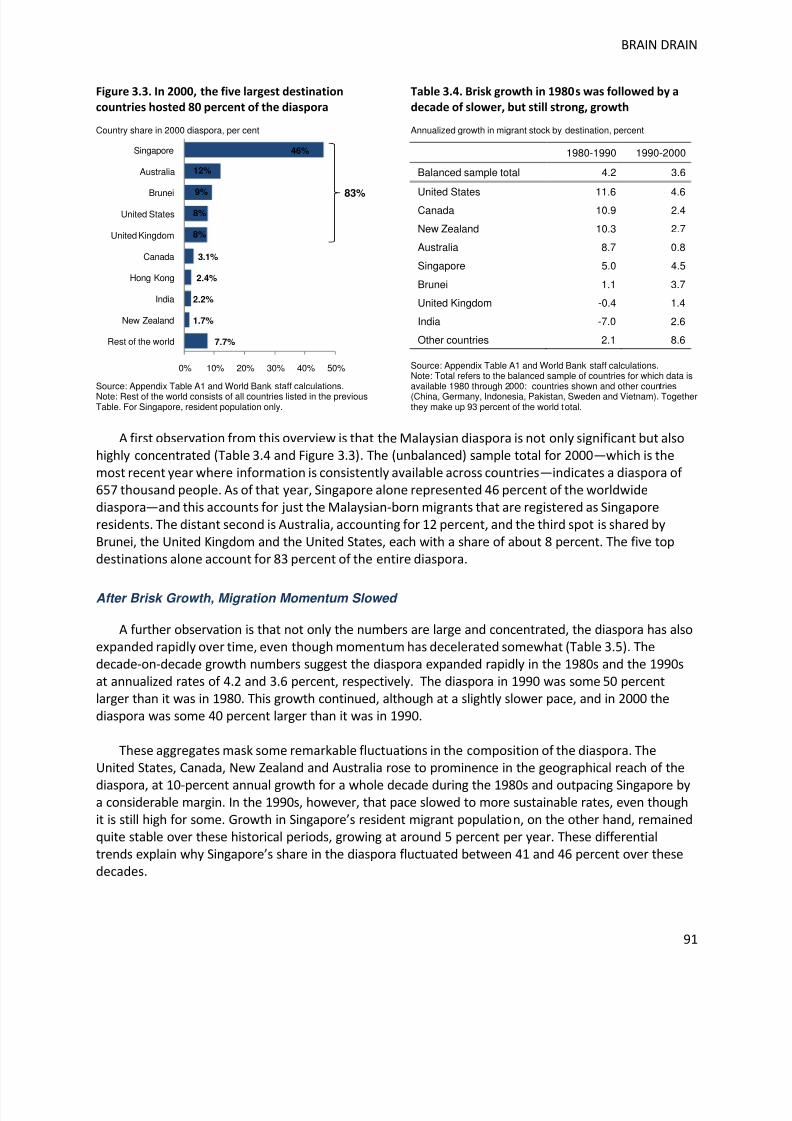
8/6/2019 World Bank Economic Monitor - Malaysia Brain Drain (April 2011)
http://slidepdf.com/reader/full/world-bank-economic-monitor-malaysia-brain-drain-april-2011 91/150
BRAIN DRAIN
91
Figure 3.3. In 2000, the five largest destination
countries hosted 80 percent of the diaspora
Country share in 2000 diaspora, per cent
Source: Appendix Table A1 and World Bank staff calculations.Note: Rest of the world consists of all countries listed in the previousTable. For Singapore, resident population only.
Table 3.4. Brisk growth in 1980s was followed by a
decade of slower, but still strong, growth
Annualized growth in migrant stock by destination, percent
1980-1990 1990-2000
Balanced sample total 4.2 3.6
United States 11.6 4.6Canada 10.9 2.4
New Zealand 10.3 2.7
Australia 8.7 0.8
Singapore 5.0 4.5
Brunei 1.1 3.7
United Kingdom -0.4 1.4
India -7.0 2.6
Other countries 2.1 8.6
Source: Appendix Table A1 and World Bank staff calculations.Note: Total refers to the balanced sample of countries for which data isavailable 1980 through 2000: countries shown and other countries(China, Germany, Indonesia, Pakistan, Sweden and Vietnam). Togetherthey make up 93 percent of the world total.
A first observation from this overview is that the Malaysian diaspora is not only significant but alsohighly concentrated (Table 3.4 and Figure 3.3). The (unbalanced) sample total for 2000—which is themost recent year where information is consistently available across countries—indicates a diaspora of 657 thousand people. As of that year, Singapore alone represented 46 percent of the worldwidediaspora—and this accounts for just the Malaysian-born migrants that are registered as Singaporeresidents. The distant second is Australia, accounting for 12 percent, and the third spot is shared byBrunei, the United Kingdom and the United States, each with a share of about 8 percent. The five topdestinations alone account for 83 percent of the entire diaspora.
After Brisk Growth, Migration Momentum Slowed
A further observation is that not only the numbers are large and concentrated, the diaspora has alsoexpanded rapidly over time, even though momentum has decelerated somewhat (Table 3.5). Thedecade-on-decade growth numbers suggest the diaspora expanded rapidly in the 1980s and the 1990sat annualized rates of 4.2 and 3.6 percent, respectively. The diaspora in 1990 was some 50 percentlarger than it was in 1980. This growth continued, although at a slightly slower pace, and in 2000 thediaspora was some 40 percent larger than it was in 1990.
These aggregates mask some remarkable fluctuations in the composition of the diaspora. TheUnited States, Canada, New Zealand and Australia rose to prominence in the geographical reach of the
diaspora, at 10-percent annual growth for a whole decade during the 1980s and outpacing Singapore bya considerable margin. In the 1990s, however, that pace slowed to more sustainable rates, even thoughit is still high for some. Growth in Singapore’s resident migrant population, on the other hand, remainedquite stable over these historical periods, growing at around 5 percent per year. These differentialtrends explain why Singapore’s share in the diaspora fluctuated between 41 and 46 percent over thesedecades.
7.7%
1.7%
2.2%
2.4%
3.1%
8%
8%
9%
12%
46%
0% 10% 20% 30% 40% 50%
Rest of the world
New Zealand
India
Hong Kong
Canada
United Kingdom
United StatesBrunei
Australia
Singapore
83%
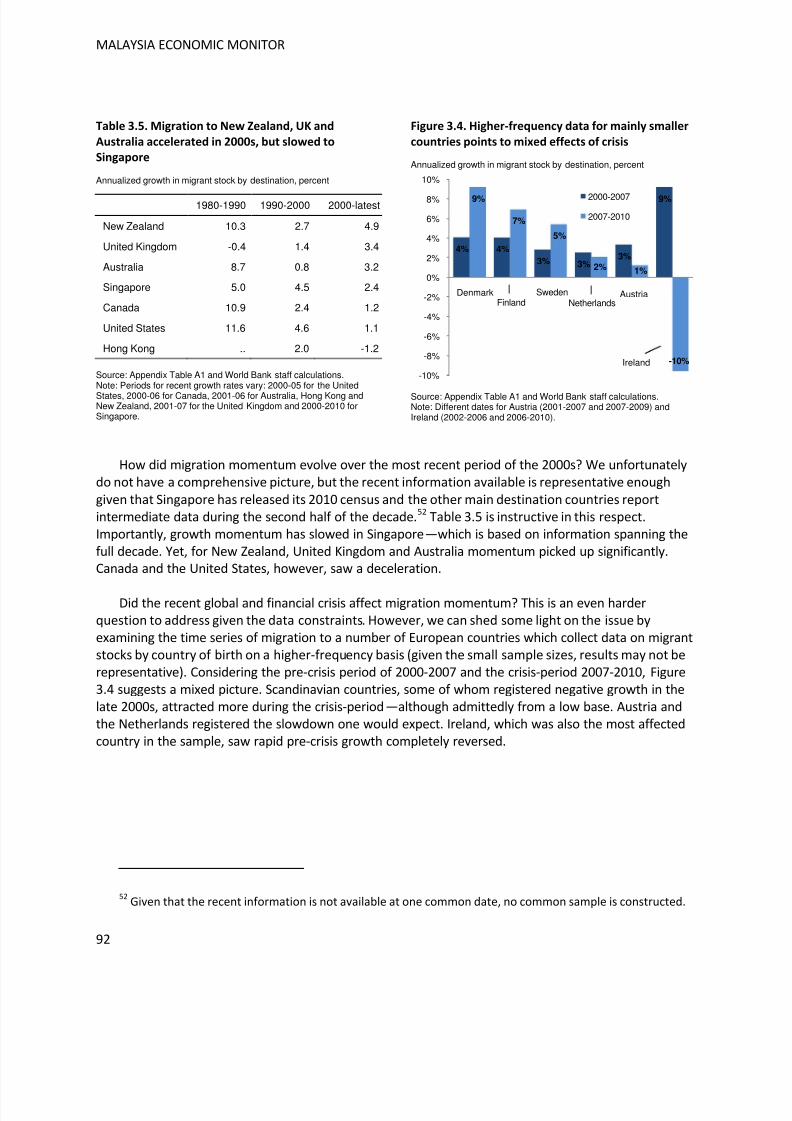
8/6/2019 World Bank Economic Monitor - Malaysia Brain Drain (April 2011)
http://slidepdf.com/reader/full/world-bank-economic-monitor-malaysia-brain-drain-april-2011 92/150
MALAYSIA ECONOMIC MONITOR
92
Table 3.5. Migration to New Zealand, UK and
Australia accelerated in 2000s, but slowed to
Singapore
Annualized growth in migrant stock by destination, percent
1980-1990 1990-2000 2000-latest
New Zealand 10.3 2.7 4.9
United Kingdom -0.4 1.4 3.4
Australia 8.7 0.8 3.2
Singapore 5.0 4.5 2.4
Canada 10.9 2.4 1.2
United States 11.6 4.6 1.1
Hong Kong .. 2.0 -1.2
Source: Appendix Table A1 and World Bank staff calculations.Note: Periods for recent growth rates vary: 2000-05 for the UnitedStates, 2000-06 for Canada, 2001-06 for Australia, Hong Kong andNew Zealand, 2001-07 for the United Kingdom and 2000-2010 forSingapore.
Figure 3.4. Higher-frequency data for mainly smaller
countries points to mixed effects of crisis
Annualized growth in migrant stock by destination, percent
Source: Appendix Table A1 and World Bank staff calculations.Note: Different dates for Austria (2001-2007 and 2007-2009) andIreland (2002-2006 and 2006-2010).
How did migration momentum evolve over the most recent period of the 2000s? We unfortunatelydo not have a comprehensive picture, but the recent information available is representative enough
given that Singapore has released its 2010 census and the other main destination countries reportintermediate data during the second half of the decade.52 Table 3.5 is instructive in this respect.Importantly, growth momentum has slowed in Singapore—which is based on information spanning thefull decade. Yet, for New Zealand, United Kingdom and Australia momentum picked up significantly.Canada and the United States, however, saw a deceleration.
Did the recent global and financial crisis affect migration momentum? This is an even harderquestion to address given the data constraints. However, we can shed some light on the issue byexamining the time series of migration to a number of European countries which collect data on migrantstocks by country of birth on a higher-frequency basis (given the small sample sizes, results may not berepresentative). Considering the pre-crisis period of 2000-2007 and the crisis-period 2007-2010, Figure3.4 suggests a mixed picture. Scandinavian countries, some of whom registered negative growth in thelate 2000s, attracted more during the crisis-period—although admittedly from a low base. Austria andthe Netherlands registered the slowdown one would expect. Ireland, which was also the most affectedcountry in the sample, saw rapid pre-crisis growth completely reversed.
52Given that the recent information is not available at one common date, no common sample is constructed.
4% 4%
3% 3%3%
9%9%
7%
5%
2% 1%
-10%
-10%
-8%
-6%
-4%
-2%
0%
2%
4%
6%
8%
10%
2000-2007
2007-2010
DenmarkFinland
SwedenNetherlands
Austria
Ireland
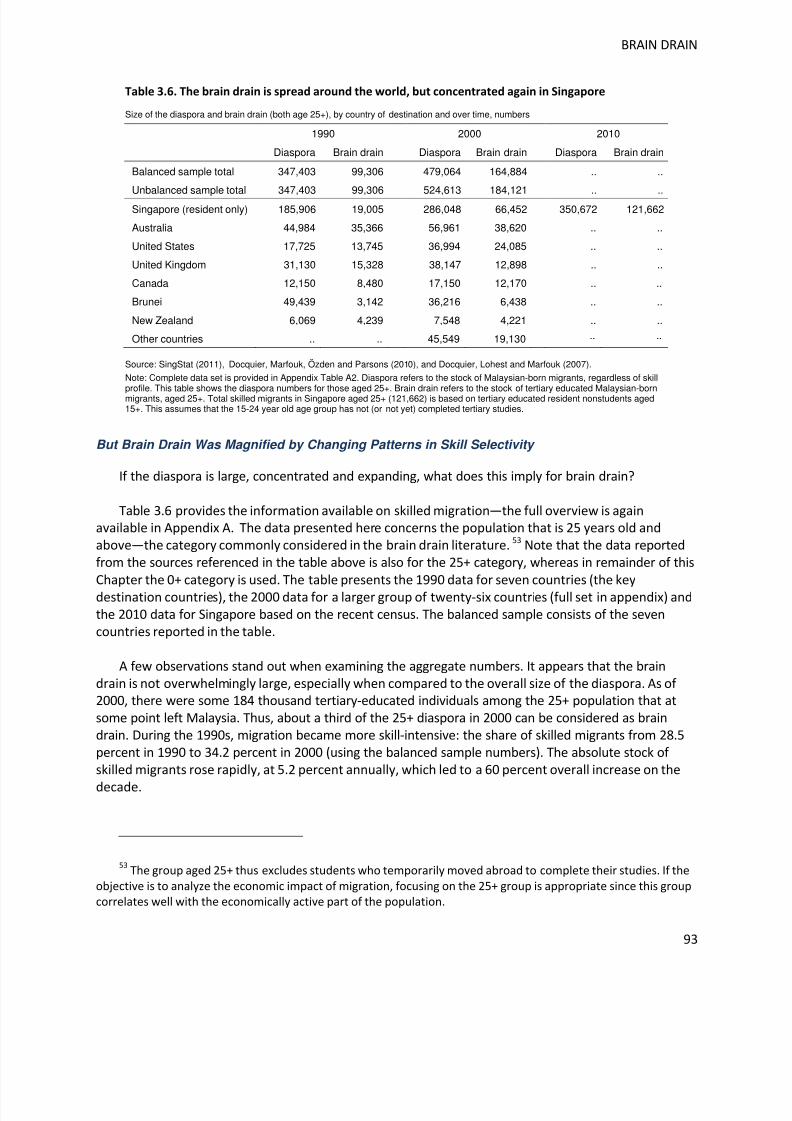
8/6/2019 World Bank Economic Monitor - Malaysia Brain Drain (April 2011)
http://slidepdf.com/reader/full/world-bank-economic-monitor-malaysia-brain-drain-april-2011 93/150
BRAIN DRAIN
93
Table 3.6. The brain drain is spread around the world, but concentrated again in Singapore
Size of the diaspora and brain drain (both age 25+), by country of destination and over time, numbers
1990 2000 2010
Diaspora Brain drain Diaspora Brain drain Diaspora Brain drain
Balanced sample total 347,403 99,306 479,064 164,884 .. ..
Unbalanced sample total 347,403 99,306 524,613 184,121 .. ..
Singapore (resident only) 185,906 19,005 286,048 66,452 350,672 121,662
Australia 44,984 35,366 56,961 38,620 .. ..
United States 17,725 13,745 36,994 24,085 .. ..
United Kingdom 31,130 15,328 38,147 12,898 .. ..
Canada 12,150 8,480 17,150 12,170 .. ..
Brunei 49,439 3,142 36,216 6,438 .. ..
New Zealand 6,069 4,239 7,548 4,221 .. ..
Other countries .. .. 45,549 19,130 .. ..
Source: SingStat (2011), Docquier, Marfouk, Özden and Parsons (2010), and Docquier, Lohest and Marfouk (2007).
Note: Complete data set is provided in Appendix Table A2. Diaspora refers to the stock of Malaysian-born migrants, regardless of skill
profile. This table shows the diaspora numbers for those aged 25+. Brain drain refers to the stock of tertiary educated Malaysian-bornmigrants, aged 25+. Total skilled migrants in Singapore aged 25+ (121,662) is based on tertiary educated resident nonstudents aged15+. This assumes that the 15-24 year old age group has not (or not yet) completed tertiary studies.
But Brain Drain Was Magnified by Changing Patterns in Skill Selectivity
If the diaspora is large, concentrated and expanding, what does this imply for brain drain?
Table 3.6 provides the information available on skilled migration—the full overview is againavailable in Appendix A. The data presented here concerns the population that is 25 years old andabove—the category commonly considered in the brain drain literature. 53 Note that the data reportedfrom the sources referenced in the table above is also for the 25+ category, whereas in remainder of this
Chapter the 0+ category is used. The table presents the 1990 data for seven countries (the keydestination countries), the 2000 data for a larger group of twenty-six countries (full set in appendix) andthe 2010 data for Singapore based on the recent census. The balanced sample consists of the sevencountries reported in the table.
A few observations stand out when examining the aggregate numbers. It appears that the braindrain is not overwhelmingly large, especially when compared to the overall size of the diaspora. As of 2000, there were some 184 thousand tertiary-educated individuals among the 25+ population that atsome point left Malaysia. Thus, about a third of the 25+ diaspora in 2000 can be considered as braindrain. During the 1990s, migration became more skill-intensive: the share of skilled migrants from 28.5percent in 1990 to 34.2 percent in 2000 (using the balanced sample numbers). The absolute stock of skilled migrants rose rapidly, at 5.2 percent annually, which led to a 60 percent overall increase on the
decade.
53The group aged 25+ thus excludes students who temporarily moved abroad to complete their studies. If the
objective is to analyze the economic impact of migration, focusing on the 25+ group is appropriate since this groupcorrelates well with the economically active part of the population.
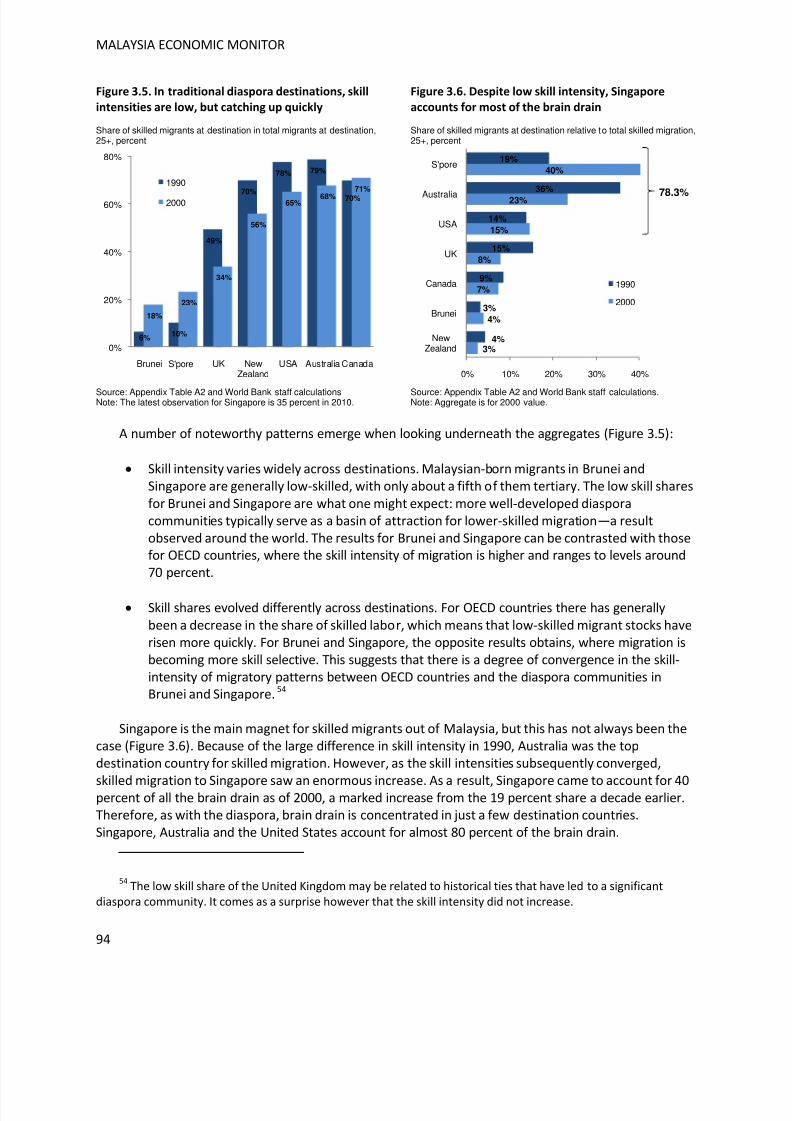
8/6/2019 World Bank Economic Monitor - Malaysia Brain Drain (April 2011)
http://slidepdf.com/reader/full/world-bank-economic-monitor-malaysia-brain-drain-april-2011 94/150
MALAYSIA ECONOMIC MONITOR
94
Figure 3.5. In traditional diaspora destinations, skill
intensities are low, but catching up quickly
Share of skilled migrants at destination in total migrants at destination,25+, percent
Source: Appendix Table A2 and World Bank staff calculationsNote: The latest observation for Singapore is 35 percent in 2010.
Figure 3.6. Despite low skill intensity, Singapore
accounts for most of the brain drain
Share of skilled migrants at destination relative to total skilled migration,25+, percent
Source: Appendix Table A2 and World Bank staff calculations.Note: Aggregate is for 2000 value.
A number of noteworthy patterns emerge when looking underneath the aggregates (Figure 3.5):
Skill intensity varies widely across destinations. Malaysian-born migrants in Brunei andSingapore are generally low-skilled, with only about a fifth of them tertiary. The low skill shares
for Brunei and Singapore are what one might expect: more well-developed diasporacommunities typically serve as a basin of attraction for lower-skilled migration—a resultobserved around the world. The results for Brunei and Singapore can be contrasted with thosefor OECD countries, where the skill intensity of migration is higher and ranges to levels around70 percent.
Skill shares evolved differently across destinations. For OECD countries there has generally
been a decrease in the share of skilled labor, which means that low-skilled migrant stocks haverisen more quickly. For Brunei and Singapore, the opposite results obtains, where migration isbecoming more skill selective. This suggests that there is a degree of convergence in the skill-intensity of migratory patterns between OECD countries and the diaspora communities inBrunei and Singapore. 54
Singapore is the main magnet for skilled migrants out of Malaysia, but this has not always been thecase (Figure 3.6). Because of the large difference in skill intensity in 1990, Australia was the topdestination country for skilled migration. However, as the skill intensities subsequently converged,
skilled migration to Singapore saw an enormous increase. As a result, Singapore came to account for 40percent of all the brain drain as of 2000, a marked increase from the 19 percent share a decade earlier.Therefore, as with the diaspora, brain drain is concentrated in just a few destination countries.Singapore, Australia and the United States account for almost 80 percent of the brain drain.
54The low skill share of the United Kingdom may be related to historical ties that have led to a significant
diaspora community. It comes as a surprise however that the skill intensity did not increase.
6%10%
49%
70%
78% 79%
70%
18%
23%
34%
56%
65% 68%
71%
0%
20%
40%
60%
80%
Brunei UK NewZealand
USA Australia Canada
1990
2000
S'pore
3%
4%
7%
8%
15%
23%
40%
4%
3%
9%
15%
14%
36%
19%
0% 10% 20% 30% 40%
NewZealand
Brunei
Canada
UK
USA
Australia
S'pore
1990
2000
78.3%
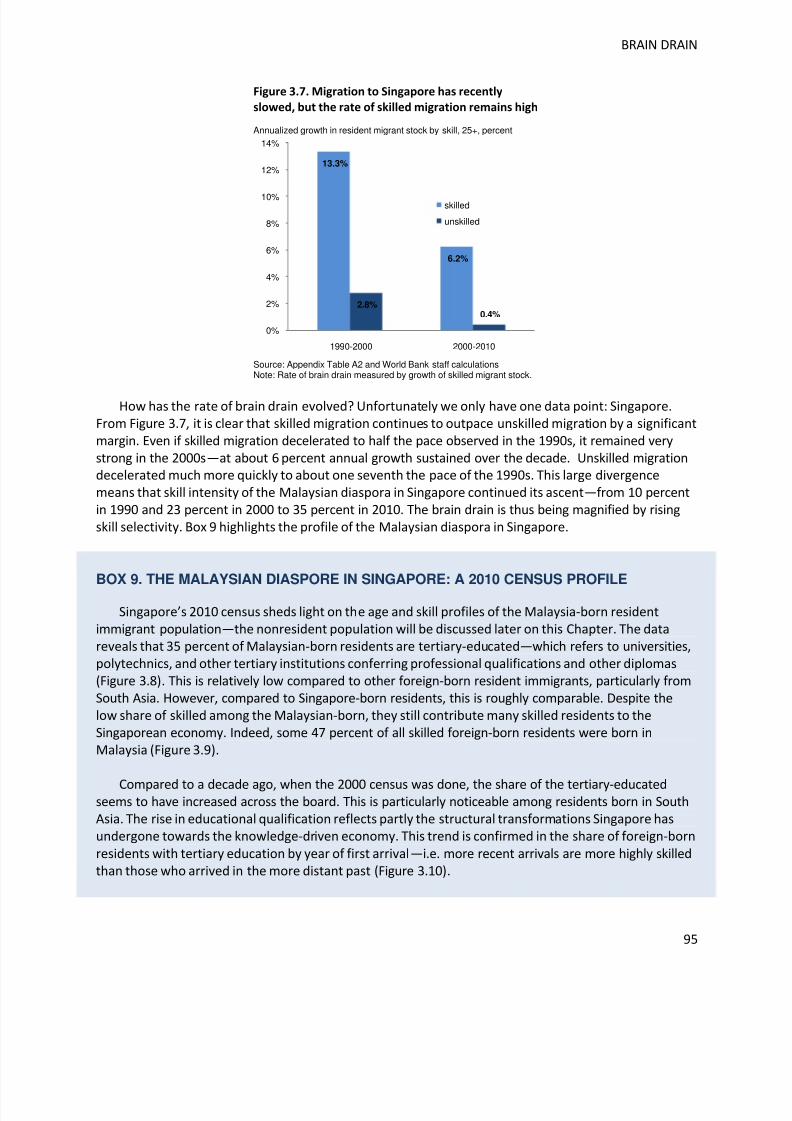
8/6/2019 World Bank Economic Monitor - Malaysia Brain Drain (April 2011)
http://slidepdf.com/reader/full/world-bank-economic-monitor-malaysia-brain-drain-april-2011 95/150
BRAIN DRAIN
95
Figure 3.7. Migration to Singapore has recently
slowed, but the rate of skilled migration remains high
Annualized growth in resident migrant stock by skill, 25+, percent
Source: Appendix Table A2 and World Bank staff calculationsNote: Rate of brain drain measured by growth of skilled migrant stock.
How has the rate of brain drain evolved? Unfortunately we only have one data point: Singapore.From Figure 3.7, it is clear that skilled migration continues to outpace unskilled migration by a significantmargin. Even if skilled migration decelerated to half the pace observed in the 1990s, it remained verystrong in the 2000s—at about 6 percent annual growth sustained over the decade. Unskilled migrationdecelerated much more quickly to about one seventh the pace of the 1990s. This large divergencemeans that skill intensity of the Malaysian diaspora in Singapore continued its ascent—from 10 percentin 1990 and 23 percent in 2000 to 35 percent in 2010. The brain drain is thus being magnified by risingskill selectivity. Box 9 highlights the profile of the Malaysian diaspora in Singapore.
BOX 9. THE MALAYSIAN DIASPORE IN SINGAPORE: A 2010 CENSUS PROFILE
Singapore’s 2010 census sheds light on the age and skill profiles of the Malaysia-born residentimmigrant population—the nonresident population will be discussed later on this Chapter. The datareveals that 35 percent of Malaysian-born residents are tertiary-educated—which refers to universities,polytechnics, and other tertiary institutions conferring professional qualifications and other diplomas(Figure 3.8). This is relatively low compared to other foreign-born resident immigrants, particularly fromSouth Asia. However, compared to Singapore-born residents, this is roughly comparable. Despite thelow share of skilled among the Malaysian-born, they still contribute many skilled residents to theSingaporean economy. Indeed, some 47 percent of all skilled foreign-born residents were born inMalaysia (Figure 3.9).
Compared to a decade ago, when the 2000 census was done, the share of the tertiary-educatedseems to have increased across the board. This is particularly noticeable among residents born in SouthAsia. The rise in educational qualification reflects partly the structural transformations Singapore hasundergone towards the knowledge-driven economy. This trend is confirmed in the share of foreign-born
residents with tertiary education by year of first arrival—i.e. more recent arrivals are more highly skilledthan those who arrived in the more distant past (Figure 3.10).
13.3%
6.2%
2.8%0.4%
0%
2%
4%
6%
8%
10%
12%
14%
1990-2000 2000-2010
skilled
unskilled
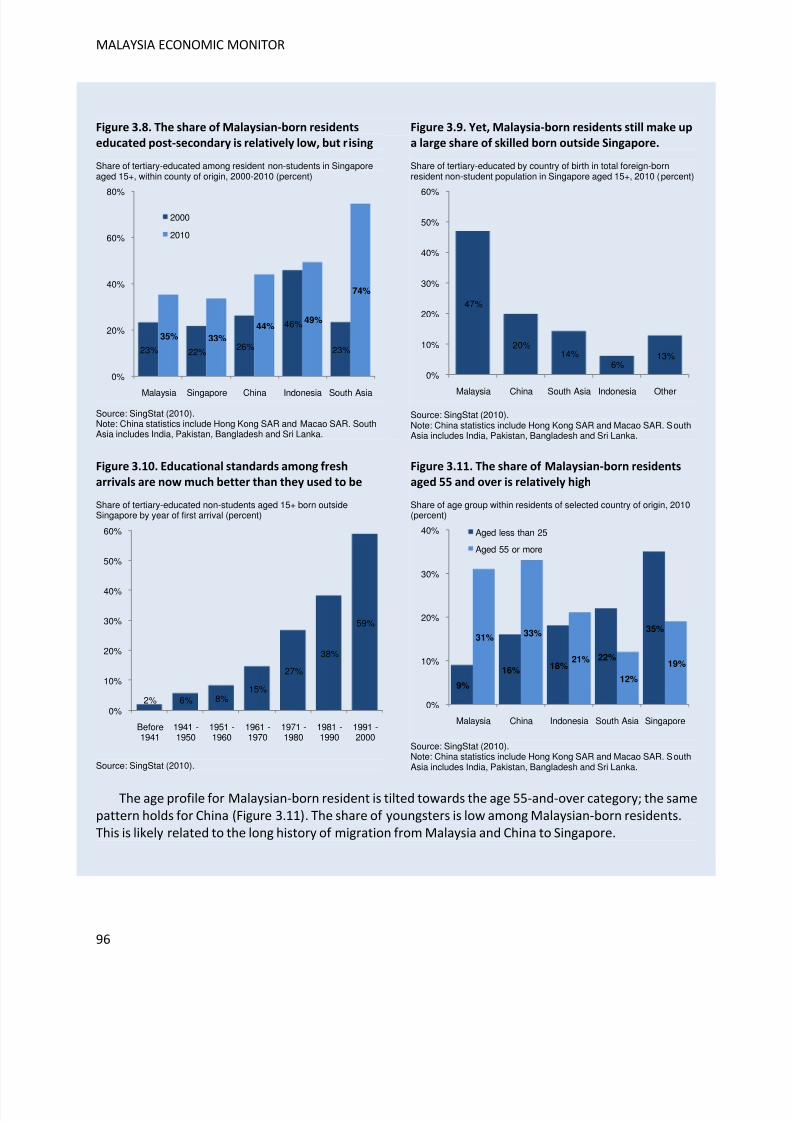
8/6/2019 World Bank Economic Monitor - Malaysia Brain Drain (April 2011)
http://slidepdf.com/reader/full/world-bank-economic-monitor-malaysia-brain-drain-april-2011 96/150
MALAYSIA ECONOMIC MONITOR
96
Figure 3.8. The share of Malaysian-born residents
educated post-secondary is relatively low, but rising
Share of tertiary-educated among resident non-students in Singaporeaged 15+, within county of origin, 2000-2010 (percent)
Source: SingStat (2010).Note: China statistics include Hong Kong SAR and Macao SAR. SouthAsia includes India, Pakistan, Bangladesh and Sri Lanka.
Figure 3.9. Yet, Malaysia-born residents still make up
a large share of skilled born outside Singapore.
Share of tertiary-educated by country of birth in total foreign-bornresident non-student population in Singapore aged 15+, 2010 (percent)
Source: SingStat (2010).Note: China statistics include Hong Kong SAR and Macao SAR. SouthAsia includes India, Pakistan, Bangladesh and Sri Lanka.
Figure 3.10. Educational standards among fresh
arrivals are now much better than they used to be
Share of tertiary-educated non-students aged 15+ born outsideSingapore by year of first arrival (percent)
Source: SingStat (2010).
Figure 3.11. The share of Malaysian-born residents
aged 55 and over is relatively high
Share of age group within residents of selected country of origin, 2010(percent)
Source: SingStat (2010).Note: China statistics include Hong Kong SAR and Macao SAR. SouthAsia includes India, Pakistan, Bangladesh and Sri Lanka.
The age profile for Malaysian-born resident is tilted towards the age 55-and-over category; the samepattern holds for China (Figure 3.11). The share of youngsters is low among Malaysian-born residents.This is likely related to the long history of migration from Malaysia and China to Singapore.
23% 22%26%
46%
23%
35% 33%
44%49%
74%
0%
20%
40%
60%
80%
Malaysia Singapore China Indonesia South Asia
2000
2010
47%
20%14%
6%13%
0%
10%
20%
30%
40%
50%
60%
Malaysia China South Asia Indonesia Other
2% 6% 8%15%
27%
38%
59%
0%
10%
20%
30%
40%
50%
60%
Before1941
1941 -1950
1951 -1960
1961 -1970
1971 -1980
1981 -1990
1991 -2000
9%
16%18%
22%
35%31%
33%
21%
12%
19%
0%
10%
20%
30%
40%
Malaysia China Indonesia South Asia Singapore
Aged less than 25
Aged 55 or more
8/6/2019 World Bank Economic Monitor - Malaysia Brain Drain (April 2011)
http://slidepdf.com/reader/full/world-bank-economic-monitor-malaysia-brain-drain-april-2011 97/150
BRAIN DRAIN
97
Scenario-Based Estimates
Based on the information available, the previous part established a common baseline estimate forthe magnitude of Malaysia’s diaspora and brain drain. In what follows, we refine this baseline byconsidering ways to deal with two missing pieces of the puzzle:
- What are the stocks of Malaysian-born skilled and unskilled migrants as of 2010? For mostcountries information on the size of the diaspora is not up-to-date. For all countries, exceptSingapore, information on the skills break-down is missing.
- How significantly represented is the Malaysian diaspora and brain drain among thenonresident population of Singapore? The nonresident population in Singapore is large, butno information is available on the composition of the nonresidents.
To deal with these uncertainties, we extrapolate the baseline estimates to 2010 with an assumptionof moderate growth. We also construct scenarios to estimate the likely magnitude of Malaysian-bornnonresidents in Singapore. Based on these two extensions, we present estimates for the worldwidediaspora and brain drain as of 2010
Estimates Are Extrapolated to 2010 on the Basis of Moderate Growth
Two further steps are required to estimate the 2010 diaspora numbers. First, we need toincorporate the most recent information that has been released already. As mentioned, most of theimportant destination countries have more recent information than 2000 and Singapore has releasedthe 2010 data. Second, we need to extrapolate the latest information available into a 2010 numberbased on certain growth assumptions. This growth assumption is applied throughout the entire decadefor those countries that report data only for 2000. In cases where we have more recent information, the
growth assumption is applied to the rest of the decade.
In what follows, the numbers are extrapolated on the basis of a 2.4 percent growth rate. Thisnumber is motivated by several factors. First, resident migrants stocks in Singapore grew at this rate.Second, the most recent data available suggests that other destination countries have grown, onaverage, at a rate close to 2.4 percent. There has been some marked variation in growth patterns amongthese other destination countries—a point that will be discussed later—but this largely averages out andsettles at a rate close to the assumed growth rate.
Estimating the 2010 brain drain requires additional manipulations. The first is to transform the 0+diaspora estimate for 2010 into a 25+ estimate. Here we make a conservative assumption of a 75percent scale factor (share of 25+ in 0+). This assumption is based on the information we have as of 2010 for Singapore (scale factor of 90.9 percent), 2006 for Australia (74.9 percent) and 2005 for the
United States (85.5 percent). We choose the lowest among these, so as not to bias the results upwards.The second is to transform the 25+ diaspora population into the 25+ skilled diaspora population (braindrain). Here take advantage of the observed 25+ skill shares for 2000. It is thus assumed that over thecourse of the decade the skill share did not increase, which again is likely to bias the estimates to thedownside.
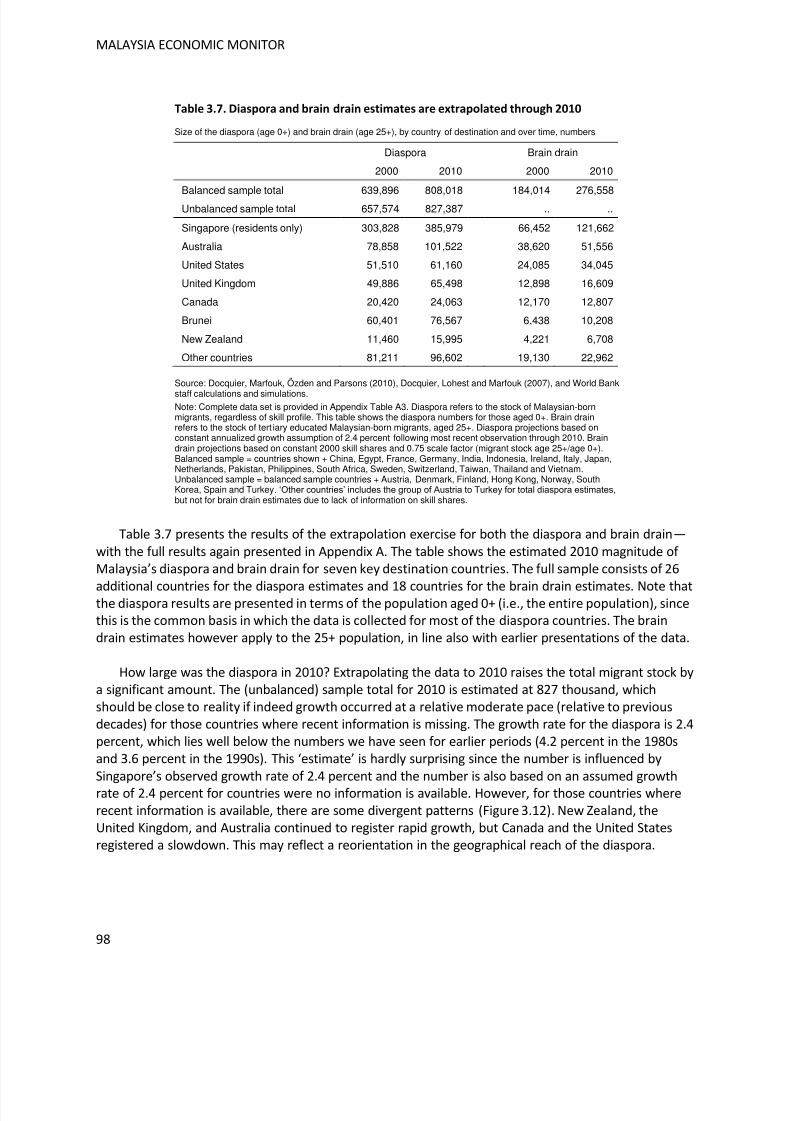
8/6/2019 World Bank Economic Monitor - Malaysia Brain Drain (April 2011)
http://slidepdf.com/reader/full/world-bank-economic-monitor-malaysia-brain-drain-april-2011 98/150
MALAYSIA ECONOMIC MONITOR
98
Table 3.7. Diaspora and brain drain estimates are extrapolated through 2010
Size of the diaspora (age 0+) and brain drain (age 25+), by country of destination and over time, numbers
Diaspora Brain drain
2000 2010 2000 2010
Balanced sample total 639,896 808,018 184,014 276,558
Unbalanced sample total 657,574 827,387 .. ..
Singapore (residents only) 303,828 385,979 66,452 121,662
Australia 78,858 101,522 38,620 51,556
United States 51,510 61,160 24,085 34,045
United Kingdom 49,886 65,498 12,898 16,609
Canada 20,420 24,063 12,170 12,807
Brunei 60,401 76,567 6,438 10,208
New Zealand 11,460 15,995 4,221 6,708
Other countries 81,211 96,602 19,130 22,962
Source: Docquier, Marfouk, Özden and Parsons (2010), Docquier, Lohest and Marfouk (2007), and World Bank
staff calculations and simulations.Note: Complete data set is provided in Appendix Table A3. Diaspora refers to the stock of Malaysian-bornmigrants, regardless of skill profile. This table shows the diaspora numbers for those aged 0+. Brain drainrefers to the stock of tert iary educated Malaysian-born migrants, aged 25+. Diaspora projections based onconstant annualized growth assumption of 2.4 percent following most recent observation through 2010. Braindrain projections based on constant 2000 skill shares and 0.75 scale factor (migrant stock age 25+/age 0+).Balanced sample = countries shown + China, Egypt, France, Germany, India, Indonesia, Ireland, Italy, Japan,Netherlands, Pakistan, Philippines, South Africa, Sweden, Switzerland, Taiwan, Thailand and Vietnam.Unbalanced sample = balanced sample countries + Austria, Denmark, Finland, Hong Kong, Norway, SouthKorea, Spain and Turkey. ‘Other countries’ includes the group of Austria to Turkey for total diaspora estimates,but not for brain drain estimates due to lack of information on skill shares.
Table 3.7 presents the results of the extrapolation exercise for both the diaspora and brain drain—
with the full results again presented in Appendix A. The table shows the estimated 2010 magnitude of Malaysia’s diaspora and brain drain for seven key destination countries. The full sample consists of 26
additional countries for the diaspora estimates and 18 countries for the brain drain estimates. Note thatthe diaspora results are presented in terms of the population aged 0+ (i.e., the entire population), sincethis is the common basis in which the data is collected for most of the diaspora countries. The braindrain estimates however apply to the 25+ population, in line also with earlier presentations of the data.
How large was the diaspora in 2010? Extrapolating the data to 2010 raises the total migrant stock bya significant amount. The (unbalanced) sample total for 2010 is estimated at 827 thousand, whichshould be close to reality if indeed growth occurred at a relative moderate pace (relative to previousdecades) for those countries where recent information is missing. The growth rate for the diaspora is 2.4percent, which lies well below the numbers we have seen for earlier periods (4.2 percent in the 1980sand 3.6 percent in the 1990s). This ‘estimate’ is hardly surprising since the number is influenced by
Singapore’s observed growth rate of 2.4 percent and the number is also based on an assumed growthrate of 2.4 percent for countries were no information is available. However, for those countries whererecent information is available, there are some divergent patterns (Figure 3.12). New Zealand, theUnited Kingdom, and Australia continued to register rapid growth, but Canada and the United Statesregistered a slowdown. This may reflect a reorientation in the geographical reach of the diaspora.
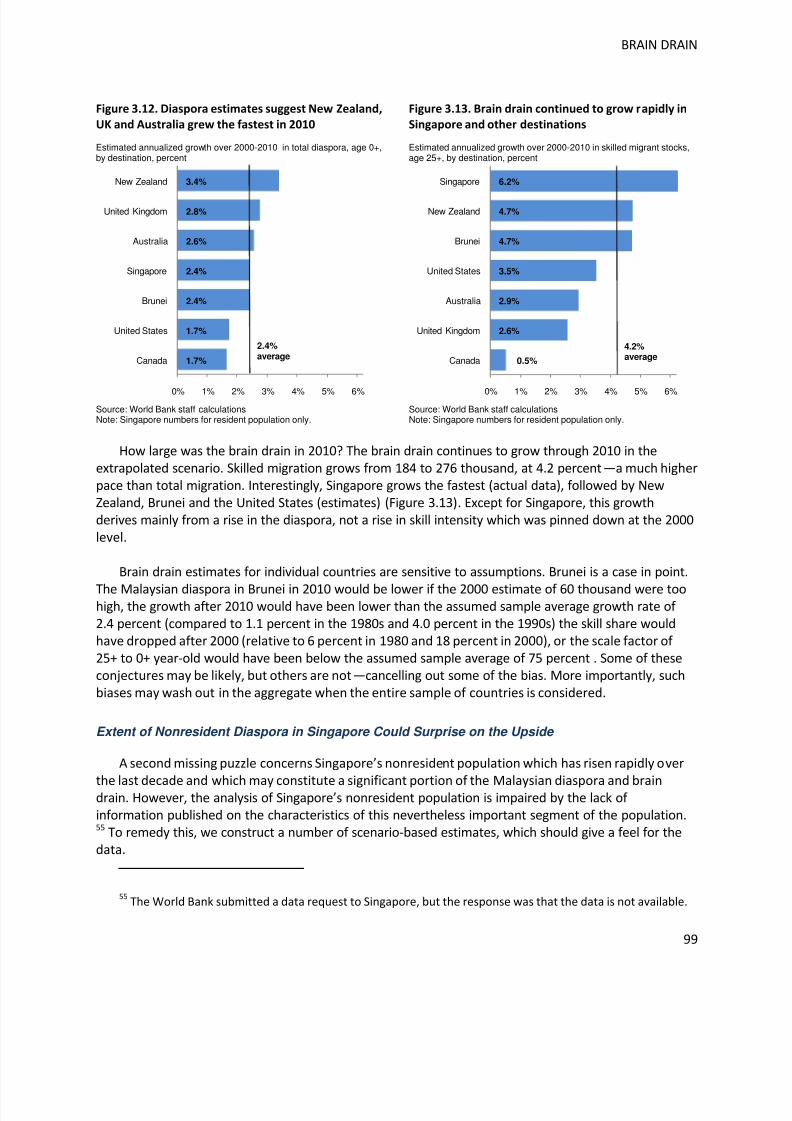
8/6/2019 World Bank Economic Monitor - Malaysia Brain Drain (April 2011)
http://slidepdf.com/reader/full/world-bank-economic-monitor-malaysia-brain-drain-april-2011 99/150
BRAIN DRAIN
99
Figure 3.12. Diaspora estimates suggest New Zealand,
UK and Australia grew the fastest in 2010
Estimated annualized growth over 2000-2010 in total diaspora, age 0+,by destination, percent
Source: World Bank staff calculationsNote: Singapore numbers for resident population only.
Figure 3.13. Brain drain continued to grow rapidly in
Singapore and other destinations
Estimated annualized growth over 2000-2010 in skilled migrant stocks,age 25+, by destination, percent
Source: World Bank staff calculationsNote: Singapore numbers for resident population only.
How large was the brain drain in 2010? The brain drain continues to grow through 2010 in theextrapolated scenario. Skilled migration grows from 184 to 276 thousand, at 4.2 percent—a much higherpace than total migration. Interestingly, Singapore grows the fastest (actual data), followed by NewZealand, Brunei and the United States (estimates) (Figure 3.13). Except for Singapore, this growthderives mainly from a rise in the diaspora, not a rise in skill intensity which was pinned down at the 2000level.
Brain drain estimates for individual countries are sensitive to assumptions. Brunei is a case in point.
The Malaysian diaspora in Brunei in 2010 would be lower if the 2000 estimate of 60 thousand were toohigh, the growth after 2010 would have been lower than the assumed sample average growth rate of 2.4 percent (compared to 1.1 percent in the 1980s and 4.0 percent in the 1990s) the skill share wouldhave dropped after 2000 (relative to 6 percent in 1980 and 18 percent in 2000), or the scale factor of 25+ to 0+ year-old would have been below the assumed sample average of 75 percent . Some of theseconjectures may be likely, but others are not—cancelling out some of the bias. More importantly, suchbiases may wash out in the aggregate when the entire sample of countries is considered.
Extent of Nonresident Diaspora in Singapore Could Surprise on the Upside
A second missing puzzle concerns Singapore’s nonresident population which has risen rapidly over
the last decade and which may constitute a significant portion of the Malaysian diaspora and braindrain. However, the analysis of Singapore’s nonresident population is impaired by the lack of information published on the characteristics of this nevertheless important segment of the population.55 To remedy this, we construct a number of scenario-based estimates, which should give a feel for thedata.
55The World Bank submitted a data request to Singapore, but the response was that the data is not available.
1.7%
1.7%
2.4%
2.4%
2.6%
2.8%
3.4%
0% 1% 2% 3% 4% 5% 6%
Canada
United States
Brunei
Singapore
Australia
United Kingdom
New Zealand
2.4%average
0.5%
2.6%
2.9%
3.5%
4.7%
4.7%
6.2%
0% 1% 2% 3% 4% 5% 6%
Canada
United Kingdom
Australia
United States
Brunei
New Zealand
Singapore
4.2%average
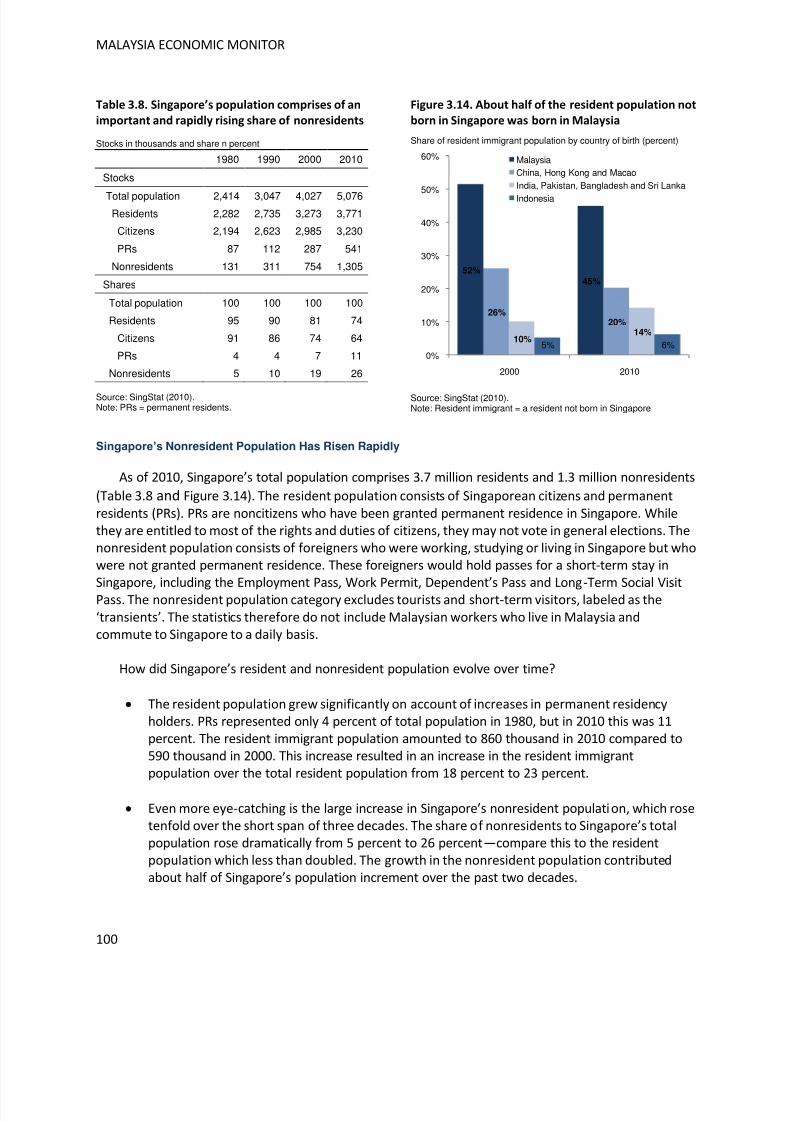
8/6/2019 World Bank Economic Monitor - Malaysia Brain Drain (April 2011)
http://slidepdf.com/reader/full/world-bank-economic-monitor-malaysia-brain-drain-april-2011 100/150
MALAYSIA ECONOMIC MONITOR
100
Table 3.8. Singapore’s population comprises of an
important and rapidly rising share of nonresidents
Stocks in thousands and share n percent
1980 1990 2000 2010
Stocks
Total population 2,414 3,047 4,027 5,076Residents 2,282 2,735 3,273 3,771
Citizens 2,194 2,623 2,985 3,230
PRs 87 112 287 541
Nonresidents 131 311 754 1,305
Shares
Total population 100 100 100 100
Residents 95 90 81 74
Citizens 91 86 74 64
PRs 4 4 7 11
Nonresidents 5 10 19 26
Source: SingStat (2010).Note: PRs = permanent residents.
Figure 3.14. About half of the resident population not
born in Singapore was born in Malaysia
Share of resident immigrant population by country of birth (percent)
Source: SingStat (2010).Note: Resident immigrant = a resident not born in Singapore
Singapore’s Nonresident Population Has Risen Rapidly
As of 2010, Singapore’s total population comprises 3.7 million residents and 1.3 million nonresidents
(Table 3.8 and Figure 3.14). The resident population consists of Singaporean citizens and permanent
residents (PRs). PRs are noncitizens who have been granted permanent residence in Singapore. Whilethey are entitled to most of the rights and duties of citizens, they may not vote in general elections. Thenonresident population consists of foreigners who were working, studying or living in Singapore but whowere not granted permanent residence. These foreigners would hold passes for a short-term stay in
Singapore, including the Employment Pass, Work Permit, Dependent’s Pass and Long-Term Social VisitPass. The nonresident population category excludes tourists and short-term visitors, labeled as the
‘transients’. The statistics therefore do not include Malaysian workers who live in Malaysia andcommute to Singapore to a daily basis.
How did Singapore’s resident and nonresident population evolve over time?
The resident population grew significantly on account of increases in permanent residencyholders. PRs represented only 4 percent of total population in 1980, but in 2010 this was 11percent. The resident immigrant population amounted to 860 thousand in 2010 compared to590 thousand in 2000. This increase resulted in an increase in the resident immigrantpopulation over the total resident population from 18 percent to 23 percent.
Even more eye-catching is the large increase in Singapore’s nonresident population, which rosetenfold over the short span of three decades. The share of nonresidents to Singapore’s totalpopulation rose dramatically from 5 percent to 26 percent—compare this to the residentpopulation which less than doubled. The growth in the nonresident population contributedabout half of Singapore’s population increment over the past two decades.
52%
45%
26%20%
10%14%
5% 6%0%
10%
20%
30%
40%
50%
60%
2000 2010
MalaysiaChina, Hong Kong and Macao
India, Pakistan, Bangladesh and Sri Lanka
Indonesia
8/6/2019 World Bank Economic Monitor - Malaysia Brain Drain (April 2011)
http://slidepdf.com/reader/full/world-bank-economic-monitor-malaysia-brain-drain-april-2011 101/150
BRAIN DRAIN
101
Data Gaps Obscure Efforts to Measure Malaysia-Born Nonresidents
The United Nations Population Division’s definition of immigrants, which we use, is based oncountry of birth and does not differentiate between resident immigrants and nonresident immigrants.Given the sheer size of Singapore’s nonresident population, omitting nonresidents is likely to severelydistort our overall estimates. But estimating the nonresident population is complicated by data gaps.
In the absence of official statistics, we need to resort to two sets of assumptions about parametervalues: the first is on the share of Malaysia-born individuals classified as nonresidents; the second on theshare of tertiary educated people among Malaysia-born nonresidents. Our scenarios will be based onthe following ranges for these parameters values:
Share of Malaysia-born migrants: between 15 and 45 percent. The upper boundary is based onthe share of Malaysia-born residents in total foreign-born residents (which equals 45 percent).The lower boundary of 15 percent corresponds more closely to what we think is likely. The
significant share of high-skill expatriates and low-skill foreign labor born outside of Malaysiaare expected to account for a much larger share in the nonresident population than in theresident population. Also, many of the nonresident Malaysians working in Singapore are not
even captured in the nonresident statistics, since they are transient day-workers crossing theborder during the day and returning home in the evening.
Skill share among Malaysia-born migrants: between 15 and 30 percent. A large share amongnonresidents is non-tertiary educated—hence, it is also more difficult for them to obtainresidency. As to the expatriate professional population, only 142 thousand in 2010 weregranted an Employment Pass under the categories P1, P2 or Q —a proxy for high-skillqualifications. Compared to a total of 1.3 million nonresidents, this amounts to a skill share of
only 10.8 percent (as reported in Kok, 2011).56 The 15 percent lower boundary is motivated bythese numbers. The upper boundary reflects the share of tertiary educated among Malaysia-born resident immigrants.57
Based on these ranges, we construct four scenarios: S1, S2, S3 and S4 (Table 3.9). S1 and S4 give thelowest and highest estimates, where S1 assumes the lowest parameter values for both variables and S4the highest ones.58 S2 and S4 are variations producing intermediate values, with S2 assuming a 15percent share in nonresidents and a 30 percent skill share and vice versa for S3.
56 These low numbers are consistent with Yeoh (2007): where Singapore’s nonresident workforce rose rapidly
from 248 thousand in 1990 to 670 thousand in 2006, about 580 thousand foreign workers (or 86 percent) are
considered lower-skilled. These work primarily in construction, service/manufacturing and marine industries or as
domestic maids. The remaining 90 thousand are likely skilled employment pass holders. Apart from Malaysia,these likely come from China and India.
57In 2010, 121,662 were reported as being tertiary educated among Malaysian-born resident immigrants who
are not students and 15 years of age or older. Assuming that most in the age group 15-24 would not (or not yet)
have complete tertiary education, the relates to an overall 25+ population of 350,672 (34.7 percent) or an overall
0+ population of 385,979 (31.5 percent). The latter number motivates the assumption of 30 percent.58
To give an example, if there are 400 nonresidents in Singapore, then scenario S1 assumes there are 60Malaysian-born migrants (15 percent), and among these, 9 of them (15 percent) are high-skilled.
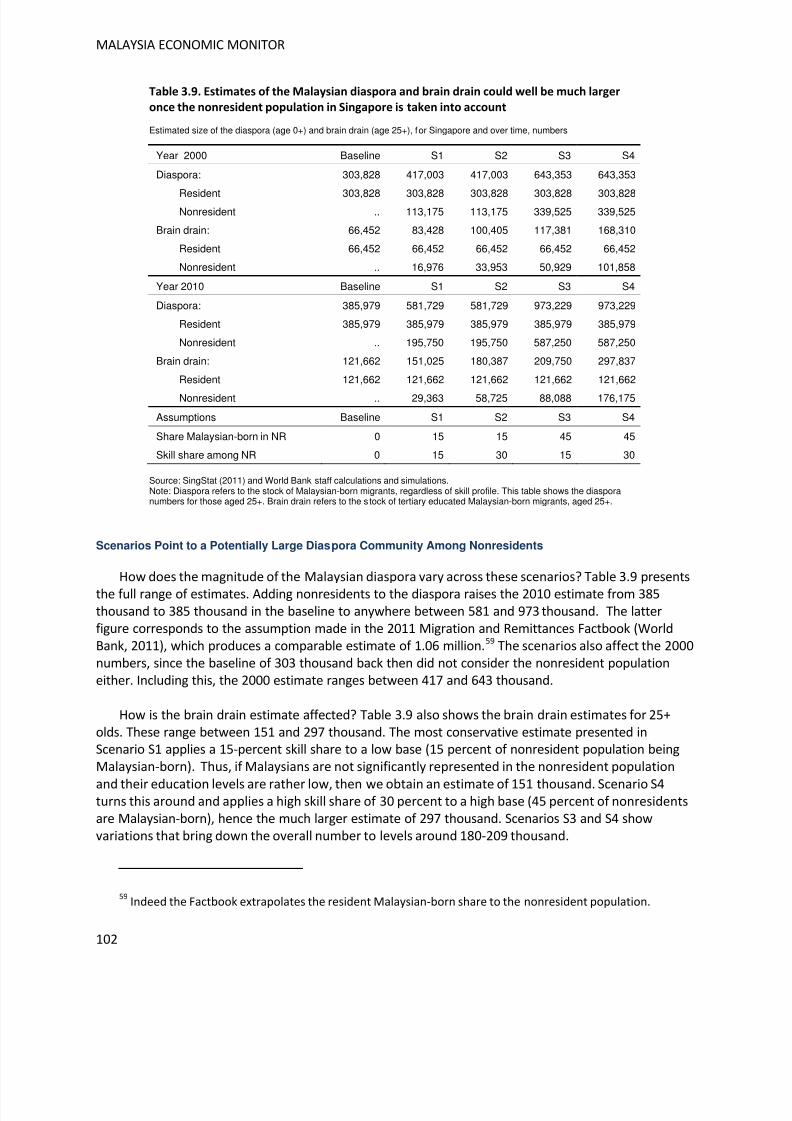
8/6/2019 World Bank Economic Monitor - Malaysia Brain Drain (April 2011)
http://slidepdf.com/reader/full/world-bank-economic-monitor-malaysia-brain-drain-april-2011 102/150
MALAYSIA ECONOMIC MONITOR
102
Table 3.9. Estimates of the Malaysian diaspora and brain drain could well be much larger
once the nonresident population in Singapore is taken into account
Estimated size of the diaspora (age 0+) and brain drain (age 25+), for Singapore and over time, numbers
Year 2000 Baseline S1 S2 S3 S4
Diaspora: 303,828 417,003 417,003 643,353 643,353
Resident 303,828 303,828 303,828 303,828 303,828Nonresident .. 113,175 113,175 339,525 339,525
Brain drain: 66,452 83,428 100,405 117,381 168,310
Resident 66,452 66,452 66,452 66,452 66,452
Nonresident .. 16,976 33,953 50,929 101,858
Year 2010 Baseline S1 S2 S3 S4
Diaspora: 385,979 581,729 581,729 973,229 973,229
Resident 385,979 385,979 385,979 385,979 385,979
Nonresident .. 195,750 195,750 587,250 587,250
Brain drain: 121,662 151,025 180,387 209,750 297,837
Resident 121,662 121,662 121,662 121,662 121,662
Nonresident .. 29,363 58,725 88,088 176,175
Assumptions Baseline S1 S2 S3 S4
Share Malaysian-born in NR 0 15 15 45 45
Skill share among NR 0 15 30 15 30
Source: SingStat (2011) and World Bank staff calculations and simulations.Note: Diaspora refers to the stock of Malaysian-born migrants, regardless of skill profile. This table shows the diasporanumbers for those aged 25+. Brain drain refers to the s tock of tertiary educated Malaysian-born migrants, aged 25+.
Scenarios Point to a Potentially Large Diaspora Community Among Nonresidents
How does the magnitude of the Malaysian diaspora vary across these scenarios? Table 3.9 presents
the full range of estimates. Adding nonresidents to the diaspora raises the 2010 estimate from 385thousand to 385 thousand in the baseline to anywhere between 581 and 973 thousand. The latterfigure corresponds to the assumption made in the 2011 Migration and Remittances Factbook (WorldBank, 2011), which produces a comparable estimate of 1.06 million.59 The scenarios also affect the 2000numbers, since the baseline of 303 thousand back then did not consider the nonresident populationeither. Including this, the 2000 estimate ranges between 417 and 643 thousand.
How is the brain drain estimate affected? Table 3.9 also shows the brain drain estimates for 25+olds. These range between 151 and 297 thousand. The most conservative estimate presented inScenario S1 applies a 15-percent skill share to a low base (15 percent of nonresident population beingMalaysian-born). Thus, if Malaysians are not significantly represented in the nonresident population
and their education levels are rather low, then we obtain an estimate of 151 thousand. Scenario S4turns this around and applies a high skill share of 30 percent to a high base (45 percent of nonresidentsare Malaysian-born), hence the much larger estimate of 297 thousand. Scenarios S3 and S4 showvariations that bring down the overall number to levels around 180-209 thousand.
59Indeed the Factbook extrapolates the resident Malaysian-born share to the nonresident population.
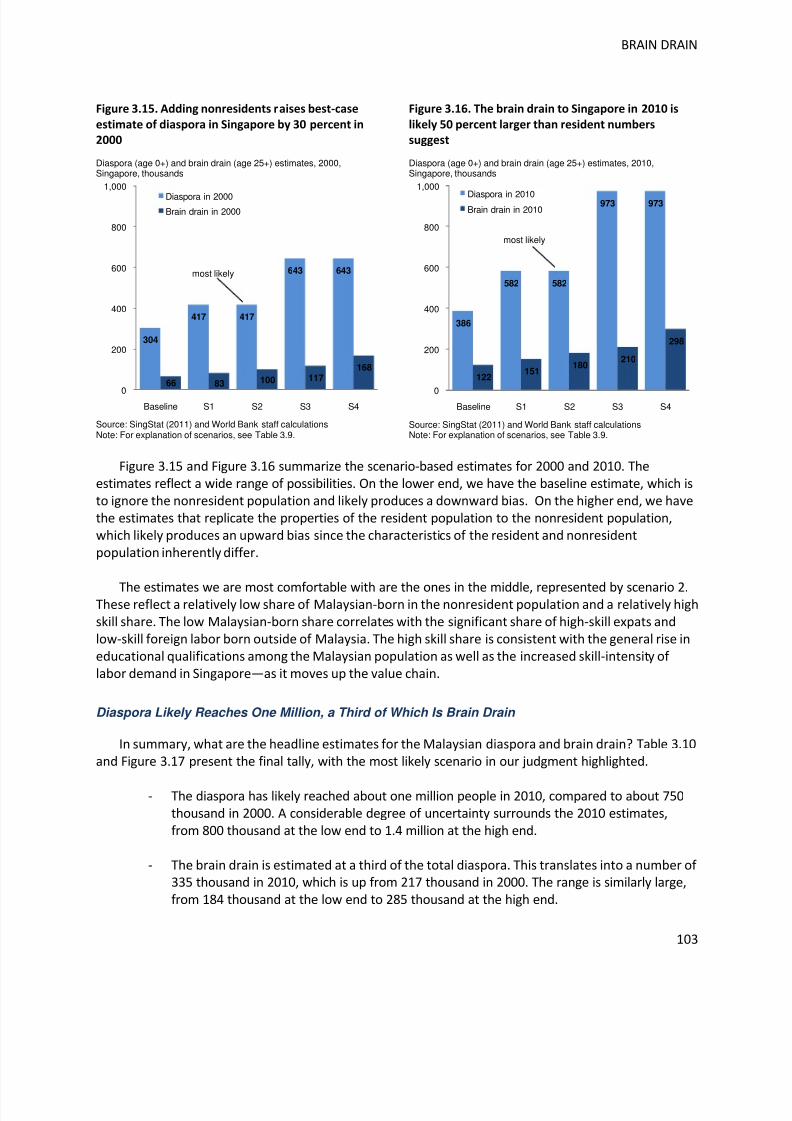
8/6/2019 World Bank Economic Monitor - Malaysia Brain Drain (April 2011)
http://slidepdf.com/reader/full/world-bank-economic-monitor-malaysia-brain-drain-april-2011 103/150
BRAIN DRAIN
103
Figure 3.15. Adding nonresidents raises best-case
estimate of diaspora in Singapore by 30 percent in
2000
Diaspora (age 0+) and brain drain (age 25+) estimates, 2000,Singapore, thousands
Source: SingStat (2011) and World Bank staff calculationsNote: For explanation of scenarios, see Table 3.9.
Figure 3.16. The brain drain to Singapore in 2010 is
likely 50 percent larger than resident numbers
suggest
Diaspora (age 0+) and brain drain (age 25+) estimates, 2010,Singapore, thousands
Source: SingStat (2011) and World Bank staff calculationsNote: For explanation of scenarios, see Table 3.9.
Figure 3.15 and Figure 3.16 summarize the scenario-based estimates for 2000 and 2010. Theestimates reflect a wide range of possibilities. On the lower end, we have the baseline estimate, which isto ignore the nonresident population and likely produces a downward bias. On the higher end, we havethe estimates that replicate the properties of the resident population to the nonresident population,which likely produces an upward bias since the characteristics of the resident and nonresidentpopulation inherently differ.
The estimates we are most comfortable with are the ones in the middle, represented by scenario 2.These reflect a relatively low share of Malaysian-born in the nonresident population and a relatively highskill share. The low Malaysian-born share correlates with the significant share of high-skill expats andlow-skill foreign labor born outside of Malaysia. The high skill share is consistent with the general rise ineducational qualifications among the Malaysian population as well as the increased skill-intensity of labor demand in Singapore—as it moves up the value chain.
Diaspora Likely Reaches One Million, a Third of Which Is Brain Drain
In summary, what are the headline estimates for the Malaysian diaspora and brain drain? Table 3.10and Figure 3.17 present the final tally, with the most likely scenario in our judgment highlighted.
- The diaspora has likely reached about one million people in 2010, compared to about 750thousand in 2000. A considerable degree of uncertainty surrounds the 2010 estimates,from 800 thousand at the low end to 1.4 million at the high end.
- The brain drain is estimated at a third of the total diaspora. This translates into a number of 335 thousand in 2010, which is up from 217 thousand in 2000. The range is similarly large,from 184 thousand at the low end to 285 thousand at the high end.
304
417 417
643 643
66 83 100 117168
0
200
400
600
800
1,000
Baseline S1 S2 S3 S4
Diaspora in 2000Brain drain in 2000
most likely
386
582 582
973 973
122151
180210
298
0
200
400
600
800
1,000
Baseline S1 S2 S3 S4
Diaspora in 2010Brain drain in 2010
most likely
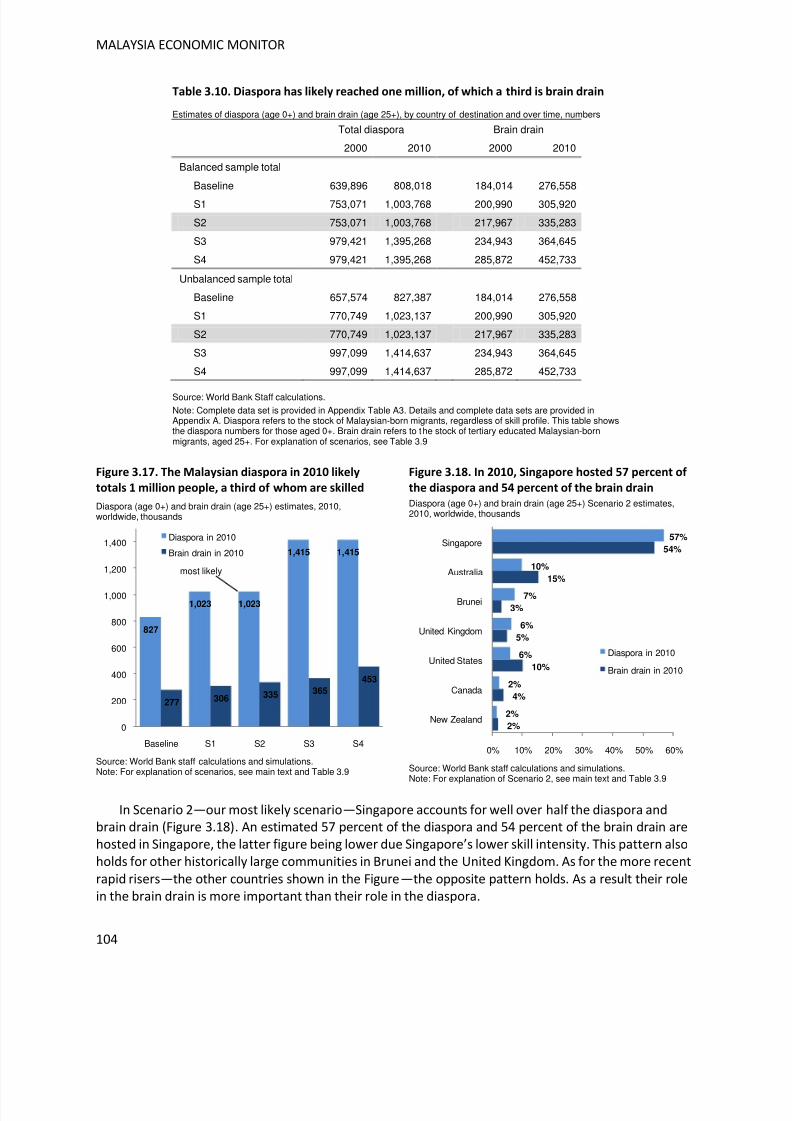
8/6/2019 World Bank Economic Monitor - Malaysia Brain Drain (April 2011)
http://slidepdf.com/reader/full/world-bank-economic-monitor-malaysia-brain-drain-april-2011 104/150
8/6/2019 World Bank Economic Monitor - Malaysia Brain Drain (April 2011)
http://slidepdf.com/reader/full/world-bank-economic-monitor-malaysia-brain-drain-april-2011 105/150
BRAIN DRAIN
105
ECONOMIC IMPACT OF BRAIN DRAIN
Has the brain drain been harmful to Malaysia’s economic performance? Whereas the previoussection established the magnitude of Malaysia’s diaspora and brain drain, this section qualifies thesenumbers in terms of their likely impact on the Malaysian economy. We first examine how significant thebrain drain is, then provide an overview of the channels through which brain drain affects economic
outcomes, and conclude with an assessment how the potentially opposing effects are playing out onhuman capital formation in Malaysia.
Significance of Brain Drain
How significant is Malaysia’s brain drain? In other words, what do the numbers mean in terms of their likely importance for the Malaysian economy? A number of considerations will be relevant. First,how does the brain drain related to the human capital base of the economy? Clearly, any given
magnitude of brain drain will be more costly the narrower is the human capital base. Second, how doemigration patterns differ from immigration patterns? If a large outflow of talent is compensated byinflows of similar magnitude and kind—as is the case in Singapore—then brain drain might be a less
significant cause for concern. Third, to what extent have those leaving been educated at home?Emigration would be less costly if those that migrate acquire their education at destination rather thanin the home country.
Relative to Narrow Skill Base, Intensity of Brain Drain Is High
More important than the magnitude of the brain drain as measured by the absolute numbers is theintensity of the brain drain, which is measured by the skilled emigration rate. The skilled emigration raterelates how many skilled migrants are leaving to initial skills base of the sending country—that is thestock of skilled people, which includes both the skilled resident population and the skilled migrantsbefore migration. When the ratio is high, brain drain represents a more significant draw upon a nation’shuman capital than when it is low.
Malaysia’s brain drain intensity is high (Table 3.11). At the surface, however, it seems as if braindrain does not present an issue. After all, as Figure 3.19 shows, other countries in the region have seen a
more rapid increase in their respective diasporas over the period 1990-2000 (based on the OECDnumbers reported by Docquier and Rapoport, 2010). Yet, when we examine Figure 3.20, a differentpicture emerges. Relative to the domestic skills base, Malaysia climbs up the rankings in the chart onbrain drain intensity. This suggests that, despite slower emigration than elsewhere, Malaysia’s stock of human capital domestically has not grown as fast as elsewhere. True, the level of brain drain intensityhas fallen in Malaysia, as it has elsewhere in the world, but brain drain intensity remains high.
For every ten skilled Malaysians born in Malaysia, one of them elects to leave the country. This is
double the world average. Superficially, it would appear that the numbers are more in line with what isobserved among other countries within the region (Figure 3.20). But the high numbers for Hong Kongand Singapore distort the regional picture and their high numbers are also typical for relatively small andopen economies.
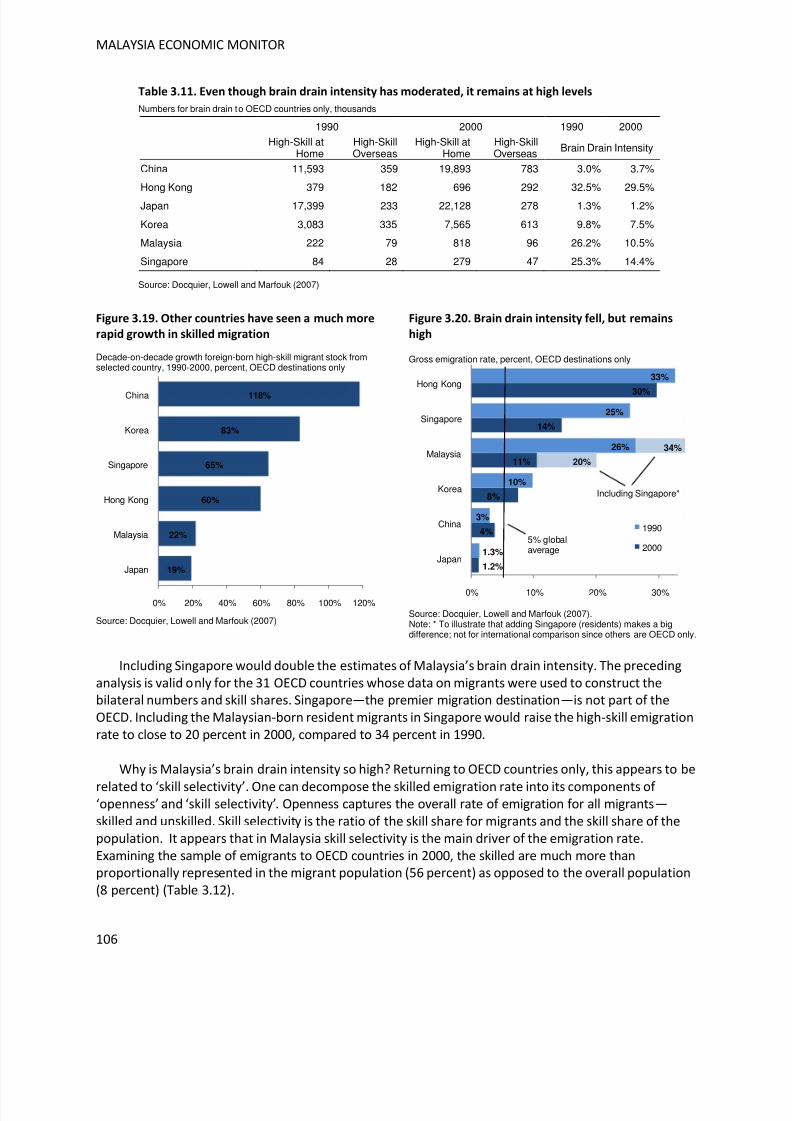
8/6/2019 World Bank Economic Monitor - Malaysia Brain Drain (April 2011)
http://slidepdf.com/reader/full/world-bank-economic-monitor-malaysia-brain-drain-april-2011 106/150
MALAYSIA ECONOMIC MONITOR
106
Table 3.11. Even though brain drain intensity has moderated, it remains at high levels
Numbers for brain drain to OECD countries only, thousands
1990 2000 1990 2000
High-Skill atHome
High-SkillOverseas
High-Skill atHome
High-SkillOverseas Brain Drain Intensity
China 11,593 359 19,893 783 3.0% 3.7%
Hong Kong 379 182 696 292 32.5% 29.5%
Japan 17,399 233 22,128 278 1.3% 1.2%
Korea 3,083 335 7,565 613 9.8% 7.5%
Malaysia 222 79 818 96 26.2% 10.5%
Singapore 84 28 279 47 25.3% 14.4%
Source: Docquier, Lowell and Marfouk (2007)
Figure 3.19. Other countries have seen a much more
rapid growth in skilled migration
Decade-on-decade growth foreign-born high-skill migrant stock fromselected country, 1990-2000, percent, OECD destinations only
Source: Docquier, Lowell and Marfouk (2007)
Figure 3.20. Brain drain intensity fell, but remains
high
Gross emigration rate, percent, OECD destinations only
Source: Docquier, Lowell and Marfouk (2007).Note: * To illustrate that adding Singapore (residents) makes a bigdifference; not for international comparison since others are OECD only.
Including Singapore would double the estimates of Malaysia’s brain drain intensity. The precedinganalysis is valid only for the 31 OECD countries whose data on migrants were used to construct thebilateral numbers and skill shares. Singapore—the premier migration destination—is not part of theOECD. Including the Malaysian-born resident migrants in Singapore would raise the high-skill emigrationrate to close to 20 percent in 2000, compared to 34 percent in 1990.
Why is Malaysia’s brain drain intensity so high? Returning to OECD countries only, this appears to be
related to ‘skill selectivity’. One can decompose the skilled emigration rate into its components of ‘openness’ and ‘skill selectivity’. Openness captures the overall rate of emigration for all migrants—skilled and unskilled. Skill selectivity is the ratio of the skill share for migrants and the skill share of thepopulation. It appears that in Malaysia skill selectivity is the main driver of the emigration rate.Examining the sample of emigrants to OECD countries in 2000, the skilled are much more thanproportionally represented in the migrant population (56 percent) as opposed to the overall population(8 percent) (Table 3.12).
19%
22%
60%
65%
83%
118%
0% 20% 40% 60% 80% 100% 120%
Japan
Malaysia
Hong Kong
Singapore
Korea
China
1.2%
4%
8%
11%
14%
30%
1.3%
3%
10%
26%
25%
33%
0% 10% 20% 30%
Japan
China
Korea
Malaysia
Singapore
Hong Kong
1990
20005% globalaverage
20%
34%
Including Singapore*
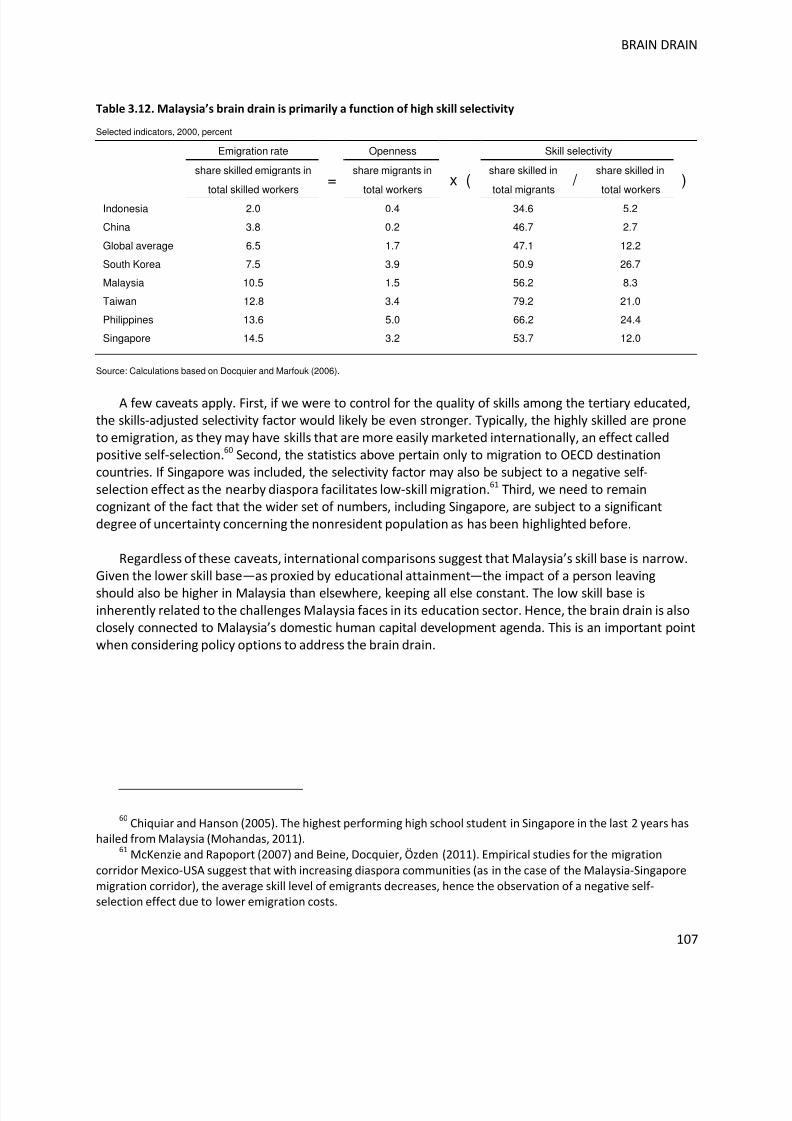
8/6/2019 World Bank Economic Monitor - Malaysia Brain Drain (April 2011)
http://slidepdf.com/reader/full/world-bank-economic-monitor-malaysia-brain-drain-april-2011 107/150
BRAIN DRAIN
107
Table 3.12. Malaysia’s brain drain is primarily a function of high skill selectivity
Selected indicators, 2000, percent
Emigration rate Openness Skill selectivity
share skilled emigrants in=
share migrants inx (
share skilled in /
share skilled in)
total skilled workers total workers total migrants total workers
Indonesia 2.0 0.4 34.6 5.2
China 3.8 0.2 46.7 2.7
Global average 6.5 1.7 47.1 12.2
South Korea 7.5 3.9 50.9 26.7
Malaysia 10.5 1.5 56.2 8.3
Taiwan 12.8 3.4 79.2 21.0
Philippines 13.6 5.0 66.2 24.4
Singapore 14.5 3.2 53.7 12.0
Source: Calculations based on Docquier and Marfouk (2006).
A few caveats apply. First, if we were to control for the quality of skills among the tertiary educated,the skills-adjusted selectivity factor would likely be even stronger. Typically, the highly skilled are proneto emigration, as they may have skills that are more easily marketed internationally, an effect calledpositive self-selection.60 Second, the statistics above pertain only to migration to OECD destinationcountries. If Singapore was included, the selectivity factor may also be subject to a negative self-selection effect as the nearby diaspora facilitates low-skill migration.61 Third, we need to remaincognizant of the fact that the wider set of numbers, including Singapore, are subject to a significantdegree of uncertainty concerning the nonresident population as has been highlighted before.
Regardless of these caveats, international comparisons suggest that Malaysia’s skill base is narrow.Given the lower skill base—as proxied by educational attainment—the impact of a person leaving
should also be higher in Malaysia than elsewhere, keeping all else constant. The low skill base isinherently related to the challenges Malaysia faces in its education sector. Hence, the brain drain is alsoclosely connected to Malaysia’s domestic human capital development agenda. This is an important pointwhen considering policy options to address the brain drain.
60Chiquiar and Hanson (2005). The highest performing high school student in Singapore in the last 2 years has
hailed from Malaysia (Mohandas, 2011).61
McKenzie and Rapoport (2007) and Beine, Docquier, Özden (2011). Empirical studies for the migration
corridor Mexico-USA suggest that with increasing diaspora communities (as in the case of the Malaysia-Singapore
migration corridor), the average skill level of emigrants decreases, hence the observation of a negative self-selection effect due to lower emigration costs.
8/6/2019 World Bank Economic Monitor - Malaysia Brain Drain (April 2011)
http://slidepdf.com/reader/full/world-bank-economic-monitor-malaysia-brain-drain-april-2011 108/150
MALAYSIA ECONOMIC MONITOR
108
Encouragingly, however, we also know that—albeit from a low base—educational attainment didimprove considering longer periods of time. Indeed, Malaysia’s universities have been churning outlarger numbers of graduates over the years. This then also explains why the emigration rate has fallenover time, thanks to improvements in the skills base. As such, while many people have been leaving, theimpact on the overall stock of skill Malaysians was lower than before and therefore the intensity of thebrain drain appears to have lowered—even if it remains at a high level. Yet, the quality of education
needs to be considered also. If a recent expansion in the provision of tertiary education wasaccompanied by a decline in standards, then the fall in the emigration rate due to an effect on numbersmight not make a large difference. A larger stock of poorer-quality students may contribute to theeconomy in a similar way as a smaller stock of better-quality students.
Brain Drain Is Not Alleviated By Compensating Inflows
Malaysia is not just a sending country but, even more so, a receiving country. The World Bank’s2011 Migration and Remittances Factbook estimates Malaysia’s overall immigrant population at 2.4
million, with the stock of Indonesian-born immigrants accounting for about 1.4 million. This places theIndonesia-Malaysia migration corridor among the largest migration corridors in the world (the 13 th
largest if one excludes the countries of the Former Soviet Union) and, compared to the Malaysia-Singapore corridor, the Indonesia-Malaysia corridor is about a third larger.62
Immigration could in principle alleviate some of the brain drain. However, as documented further inBox 10, the overall patterns of immigration are such that immigrants are mostly poorly educated andare employed in low-skill occupations in assembly-based industries, low-end services and extractiveindustries. The upshot is that migratory patterns exert downward pressure on the skill composition of the domestic human capital base. The outflow of both skilled and unskilled Malaysians seems to havebeen overwhelmed by the inflow of low-skilled foreign labor.
These patterns are likely exacerbated by illegal immigration. The in- and outflow of high-skillindividuals tends to be generally well-documented since the highly-skilled tend to migrate legally. But
this is not the case of for low- or unskilled migration where illegal migration is more prevalent.Estimates of the number of illegal immigrants in Malaysia vary widely, but it is clear that the totalnumber is high—ranging from half a million to one million, and up—and it can be safely assumed thatvirtually all of the illegal immigrants are low-skilled (Tham, 2010). Once illegal migration is taken intoaccount, it becomes clear that the impact of immigration on the domestic skills base is skewed muchfurther to the low end of the spectrum than official statistics would suggest.
62As mentioned in the previous section, where we estimate the magnitude of the brain drain, the Factbook
assumes that the share of Malaysia-born residents applies to total foreign-born residents, which results in a highestimate of about 1.1 million Malaysian-born migrants in Singapore.

8/6/2019 World Bank Economic Monitor - Malaysia Brain Drain (April 2011)
http://slidepdf.com/reader/full/world-bank-economic-monitor-malaysia-brain-drain-april-2011 109/150
BRAIN DRAIN
109
BOX 10. IMMIGRANT WORKERS IN MALAYSIA
Foreign workers have stabilized at a high share of the labor force
The share of migrants in the Malaysian labor force has stabilized since 2000. Migration grew initiallyvery rapidly in the 1990s, doubling as a share in the labor force in the middle of the decade. Then theAsia crisis struck and the share stabilized at roughly 10 percent (Figure 3.21). As the unemploymentrate among the migrant workers remained very low and much lower than for Malaysian citizens, itappears that the increased flow of migrants was in response to higher demand.
Figure 3.21. Following rapid increase, the share of
migrants in the labor force has stabilized
Persons for the left axis and percent for the right axis
Source: EPU and World Bank staff calculations.
Figure 3.22. The share of low-skill migrants in total
migrants continued to rise however
Percent
Source: EPU and World Bank staff calculations.
Education levels of foreign workers are generally low
Migrants are typically low-skilled. Only 40 percent of employed migrants received secondaryeducation and about 10 percent obtained tertiary education. The share of less educated migrants hasbeen rising especially in recent years: nearly 40 percent of migrants had no formal education at all inrecent years (Figure 3.22). A large number of migrants also report ‘not applicable’ as their educationlevel. Furthermore, labor force surveys are generally better at catching higher skilled workers. Both of these factors should bias the actual education level of migrants further downward.
Relative to citizens, the levels of educational attainment of migrants are significantly lower.Migrants’ education level has remained much the same since 2000. The share of tertiary education even
fell slightly in recent years. But, citizens’ education level has risen steadily (Figure 3.23). As a result, thegap is widening over time, especially for higher education. This indicates that migrants are filling thedemand for unskilled labor in the Malaysian economy as the overall skill level of the natives isincreasing.
0
2
4
6
8
10
12
14
0
200
400
600
800
1000
1200
1982 1986 1990 1996 2000 2004 2008Total non-citizen labor force (LHS)% share of non-citizen in total workforce% share of non-citizen in total employed% share of non-citizen in total unemployed
0
5
10
15
20
25
30
35
40
1982 1986 1990 1996 2000 2004 2008
Share of migrants with no formal education
Share of migrants with primary education
Share of migrants in total employment
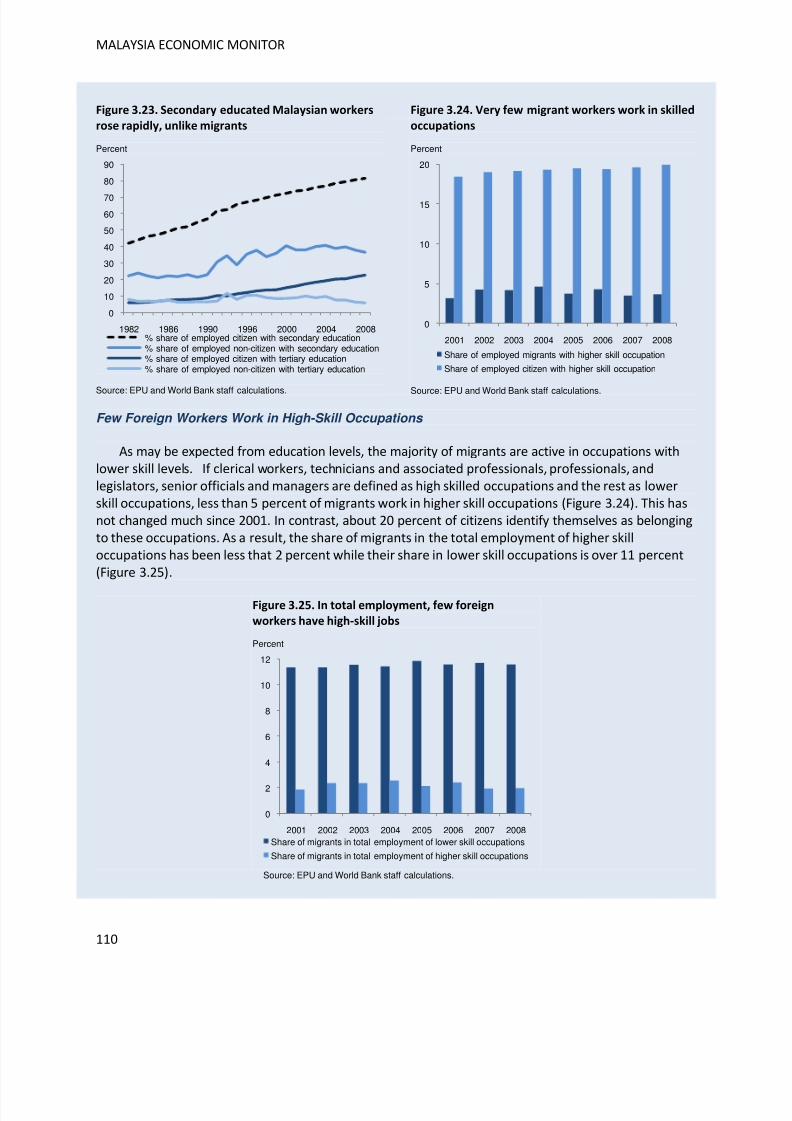
8/6/2019 World Bank Economic Monitor - Malaysia Brain Drain (April 2011)
http://slidepdf.com/reader/full/world-bank-economic-monitor-malaysia-brain-drain-april-2011 110/150
MALAYSIA ECONOMIC MONITOR
110
Figure 3.23. Secondary educated Malaysian workers
rose rapidly, unlike migrants
Percent
Source: EPU and World Bank staff calculations.
Figure 3.24. Very few migrant workers work in skilled
occupations
Percent
Source: EPU and World Bank staff calculations.
Few Foreign Workers Work in High-Skill Occupations
As may be expected from education levels, the majority of migrants are active in occupations withlower skill levels. If clerical workers, technicians and associated professionals, professionals, andlegislators, senior officials and managers are defined as high skilled occupations and the rest as lowerskill occupations, less than 5 percent of migrants work in higher skill occupations (Figure 3.24). This hasnot changed much since 2001. In contrast, about 20 percent of citizens identify themselves as belongingto these occupations. As a result, the share of migrants in the total employment of higher skilloccupations has been less that 2 percent while their share in lower skill occupations is over 11 percent(Figure 3.25).
Figure 3.25. In total employment, few foreign
workers have high-skill jobs
Percent
Source: EPU and World Bank staff calculations.
0
10
20
30
40
50
60
70
80
90
1982 1986 1990 1996 2000 2004 2008% share of employed citizen with secondary education% share of employed non-citizen with secondary education% share of employed citizen with tertiary education% share of employed non-citizen with tertiary education
0
5
10
15
20
2001 2002 2003 2004 2005 2006 2007 2008
Share of employed migrants with higher skill occupation
Share of employed citizen with higher skill occupation
0
2
4
6
8
10
12
2001 2002 2003 2004 2005 2006 2007 2008Share of migrants in total employment of lower skill occupations
Share of migrants in total employment of higher skill occupations
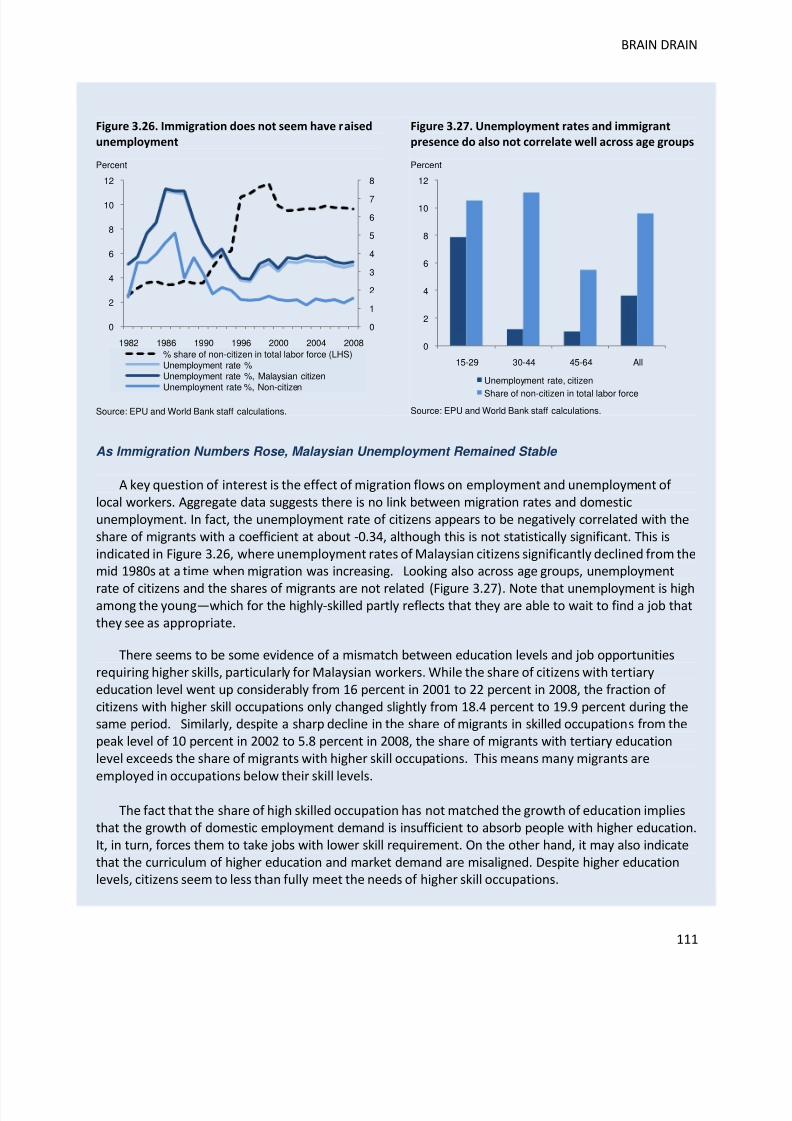
8/6/2019 World Bank Economic Monitor - Malaysia Brain Drain (April 2011)
http://slidepdf.com/reader/full/world-bank-economic-monitor-malaysia-brain-drain-april-2011 111/150
BRAIN DRAIN
111
Figure 3.26. Immigration does not seem have raised
unemployment
Percent
Source: EPU and World Bank staff calculations.
Figure 3.27. Unemployment rates and immigrant
presence do also not correlate well across age groups
Percent
Source: EPU and World Bank staff calculations.
As Immigration Numbers Rose, Malaysian Unemployment Remained Stable
A key question of interest is the effect of migration flows on employment and unemployment of local workers. Aggregate data suggests there is no link between migration rates and domesticunemployment. In fact, the unemployment rate of citizens appears to be negatively correlated with theshare of migrants with a coefficient at about -0.34, although this is not statistically significant. This isindicated in Figure 3.26, where unemployment rates of Malaysian citizens significantly declined from themid 1980s at a time when migration was increasing. Looking also across age groups, unemployment
rate of citizens and the shares of migrants are not related (Figure 3.27). Note that unemployment is highamong the young—which for the highly-skilled partly reflects that they are able to wait to find a job thatthey see as appropriate.
There seems to be some evidence of a mismatch between education levels and job opportunitiesrequiring higher skills, particularly for Malaysian workers. While the share of citizens with tertiaryeducation level went up considerably from 16 percent in 2001 to 22 percent in 2008, the fraction of citizens with higher skill occupations only changed slightly from 18.4 percent to 19.9 percent during thesame period. Similarly, despite a sharp decline in the share of migrants in skilled occupations from thepeak level of 10 percent in 2002 to 5.8 percent in 2008, the share of migrants with tertiary educationlevel exceeds the share of migrants with higher skill occupations. This means many migrants are
employed in occupations below their skill levels.
The fact that the share of high skilled occupation has not matched the growth of education impliesthat the growth of domestic employment demand is insufficient to absorb people with higher education.It, in turn, forces them to take jobs with lower skill requirement. On the other hand, it may also indicatethat the curriculum of higher education and market demand are misaligned. Despite higher educationlevels, citizens seem to less than fully meet the needs of higher skill occupations.
0
1
2
3
4
5
6
7
8
0
2
4
6
8
10
12
1982 1986 1990 1996 2000 2004 2008% share of non-citizen in total labor force (LHS)Unemployment rate %Unemployment rate %, Malaysian citizenUnemployment rate %, Non-citizen
0
2
4
6
8
10
12
15-29 30-44 45-64 All
Unemployment rate, citizen
Share of non-citizen in total labor force
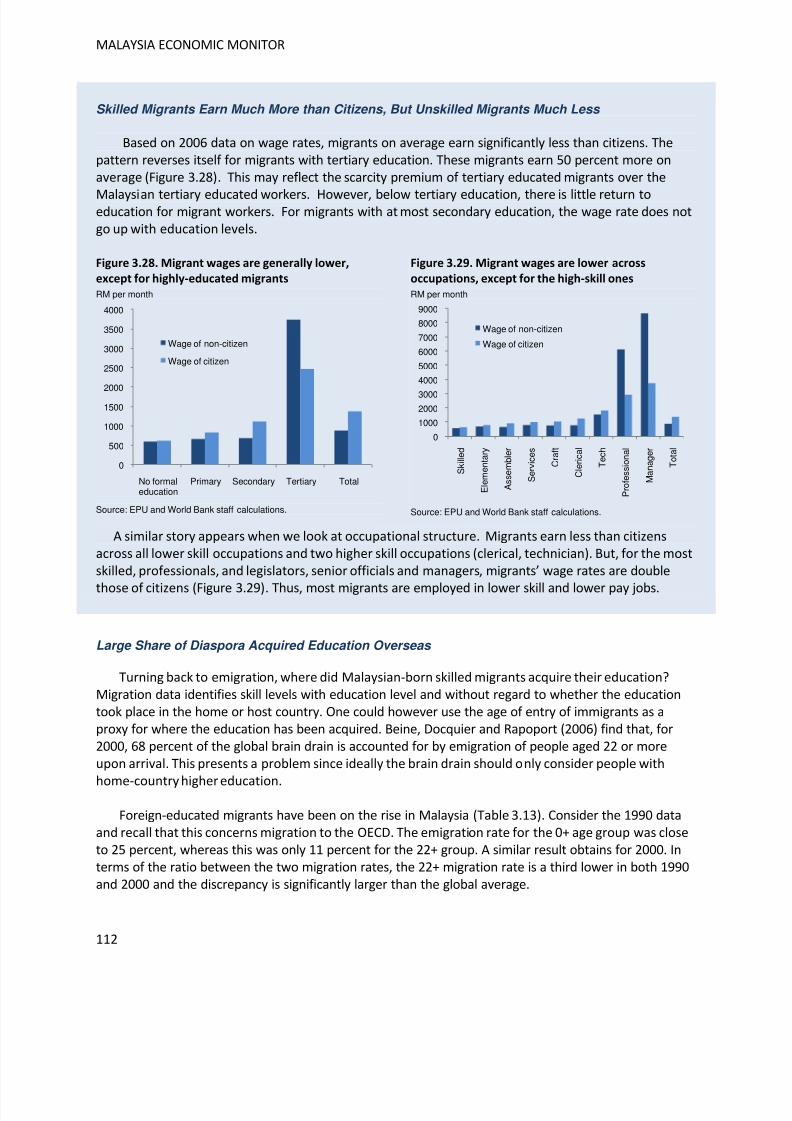
8/6/2019 World Bank Economic Monitor - Malaysia Brain Drain (April 2011)
http://slidepdf.com/reader/full/world-bank-economic-monitor-malaysia-brain-drain-april-2011 112/150
MALAYSIA ECONOMIC MONITOR
112
Skilled Migrants Earn Much More than Citizens, But Unskilled Migrants Much Less
Based on 2006 data on wage rates, migrants on average earn significantly less than citizens. Thepattern reverses itself for migrants with tertiary education. These migrants earn 50 percent more onaverage (Figure 3.28). This may reflect the scarcity premium of tertiary educated migrants over the
Malaysian tertiary educated workers. However, below tertiary education, there is little return toeducation for migrant workers. For migrants with at most secondary education, the wage rate does notgo up with education levels.
Figure 3.28. Migrant wages are generally lower,
except for highly-educated migrants
RM per month
Source: EPU and World Bank staff calculations.
Figure 3.29. Migrant wages are lower across
occupations, except for the high-skill ones
RM per month
Source: EPU and World Bank staff calculations.
A similar story appears when we look at occupational structure. Migrants earn less than citizensacross all lower skill occupations and two higher skill occupations (clerical, technician). But, for the mostskilled, professionals, and legislators, senior officials and managers, migrants’ wage rates are double
those of citizens (Figure 3.29). Thus, most migrants are employed in lower skill and lower pay jobs.
Large Share of Diaspora Acquired Education Overseas
Turning back to emigration, where did Malaysian-born skilled migrants acquire their education?Migration data identifies skill levels with education level and without regard to whether the educationtook place in the home or host country. One could however use the age of entry of immigrants as aproxy for where the education has been acquired. Beine, Docquier and Rapoport (2006) find that, for2000, 68 percent of the global brain drain is accounted for by emigration of people aged 22 or moreupon arrival. This presents a problem since ideally the brain drain should only consider people with
home-country higher education.
Foreign-educated migrants have been on the rise in Malaysia (Table 3.13). Consider the 1990 dataand recall that this concerns migration to the OECD. The emigration rate for the 0+ age group was closeto 25 percent, whereas this was only 11 percent for the 22+ group. A similar result obtains for 2000. Interms of the ratio between the two migration rates, the 22+ migration rate is a third lower in both 1990and 2000 and the discrepancy is significantly larger than the global average.
0
500
1000
15002000
2500
3000
3500
4000
No formaleducation
Primary Secondary Tertiary Total
Wage of non-citizen
Wage of citizen
0
1000
20003000
4000
5000
6000
7000
8000
9000
S k i l l e d
E l e m e n t a r y
A s s e m b l e r
S e r v i c e s
C r a f t
C l e r i c a l
T e c h
P r o f e s s i o n a l
M a n a g e r
T o t a l
Wage of non-citizen
Wage of citizen
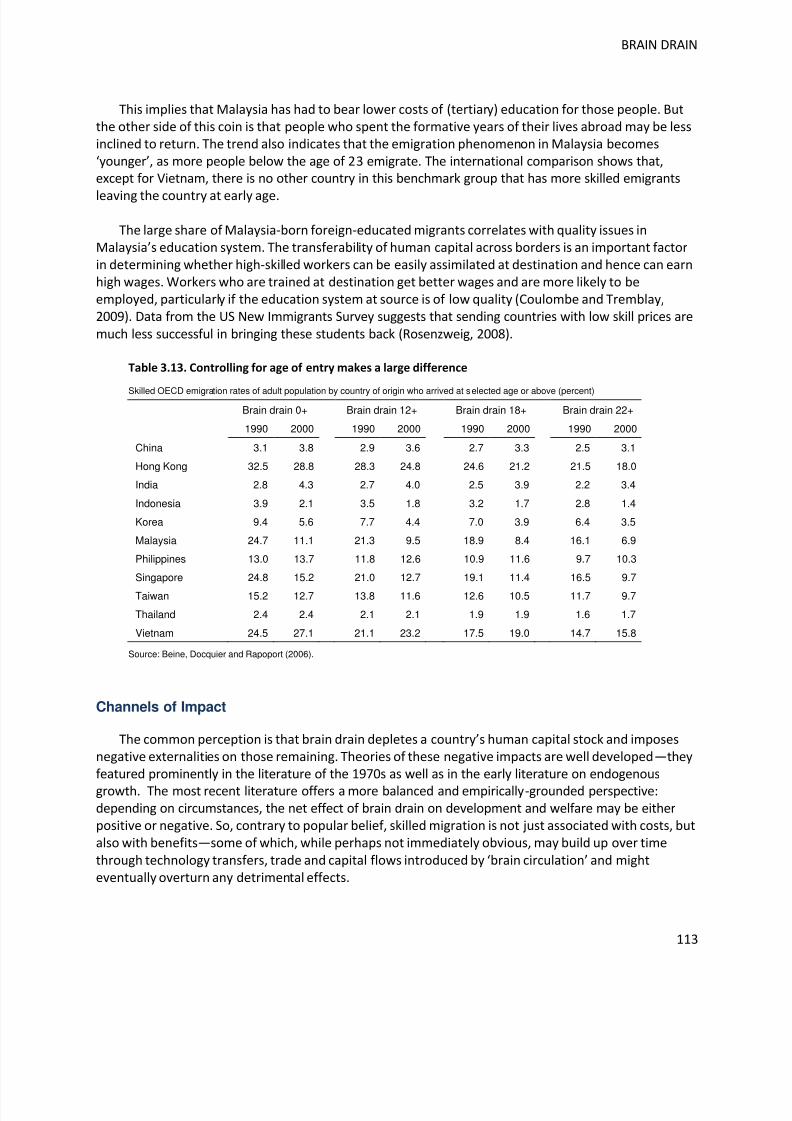
8/6/2019 World Bank Economic Monitor - Malaysia Brain Drain (April 2011)
http://slidepdf.com/reader/full/world-bank-economic-monitor-malaysia-brain-drain-april-2011 113/150
BRAIN DRAIN
113
This implies that Malaysia has had to bear lower costs of (tertiary) education for those people. Butthe other side of this coin is that people who spent the formative years of their lives abroad may be lessinclined to return. The trend also indicates that the emigration phenomenon in Malaysia becomes‘younger’, as more people below the age of 23 emigrate. The international comparison shows that,except for Vietnam, there is no other country in this benchmark group that has more skilled emigrants
leaving the country at early age.
The large share of Malaysia-born foreign-educated migrants correlates with quality issues inMalaysia’s education system. The transferability of human capital across borders is an important factorin determining whether high-skilled workers can be easily assimilated at destination and hence can earnhigh wages. Workers who are trained at destination get better wages and are more likely to beemployed, particularly if the education system at source is of low quality (Coulombe and Tremblay,2009). Data from the US New Immigrants Survey suggests that sending countries with low skill prices are
much less successful in bringing these students back (Rosenzweig, 2008).
Table 3.13. Controlling for age of entry makes a large difference
Skilled OECD emigration rates of adult population by country of origin who arrived at selected age or above (percent)
Brain drain 0+ Brain drain 12+ Brain drain 18+ Brain drain 22+
1990 2000 1990 2000 1990 2000 1990 2000
China 3.1 3.8 2.9 3.6 2.7 3.3 2.5 3.1
Hong Kong 32.5 28.8 28.3 24.8 24.6 21.2 21.5 18.0
India 2.8 4.3 2.7 4.0 2.5 3.9 2.2 3.4
Indonesia 3.9 2.1 3.5 1.8 3.2 1.7 2.8 1.4
Korea 9.4 5.6 7.7 4.4 7.0 3.9 6.4 3.5
Malaysia 24.7 11.1 21.3 9.5 18.9 8.4 16.1 6.9
Philippines 13.0 13.7 11.8 12.6 10.9 11.6 9.7 10.3
Singapore 24.8 15.2 21.0 12.7 19.1 11.4 16.5 9.7
Taiwan 15.2 12.7 13.8 11.6 12.6 10.5 11.7 9.7
Thailand 2.4 2.4 2.1 2.1 1.9 1.9 1.6 1.7
Vietnam 24.5 27.1 21.1 23.2 17.5 19.0 14.7 15.8
Source: Beine, Docquier and Rapoport (2006).
Channels of Impact
The common perception is that brain drain depletes a country’s human capital stock and imposesnegative externalities on those remaining. Theories of these negative impacts are well developed—theyfeatured prominently in the literature of the 1970s as well as in the early literature on endogenous
growth. The most recent literature offers a more balanced and empirically-grounded perspective:depending on circumstances, the net effect of brain drain on development and welfare may be eitherpositive or negative. So, contrary to popular belief, skilled migration is not just associated with costs, butalso with benefits—some of which, while perhaps not immediately obvious, may build up over time
through technology transfers, trade and capital flows introduced by ‘brain circulation’ and mighteventually overturn any detrimental effects.
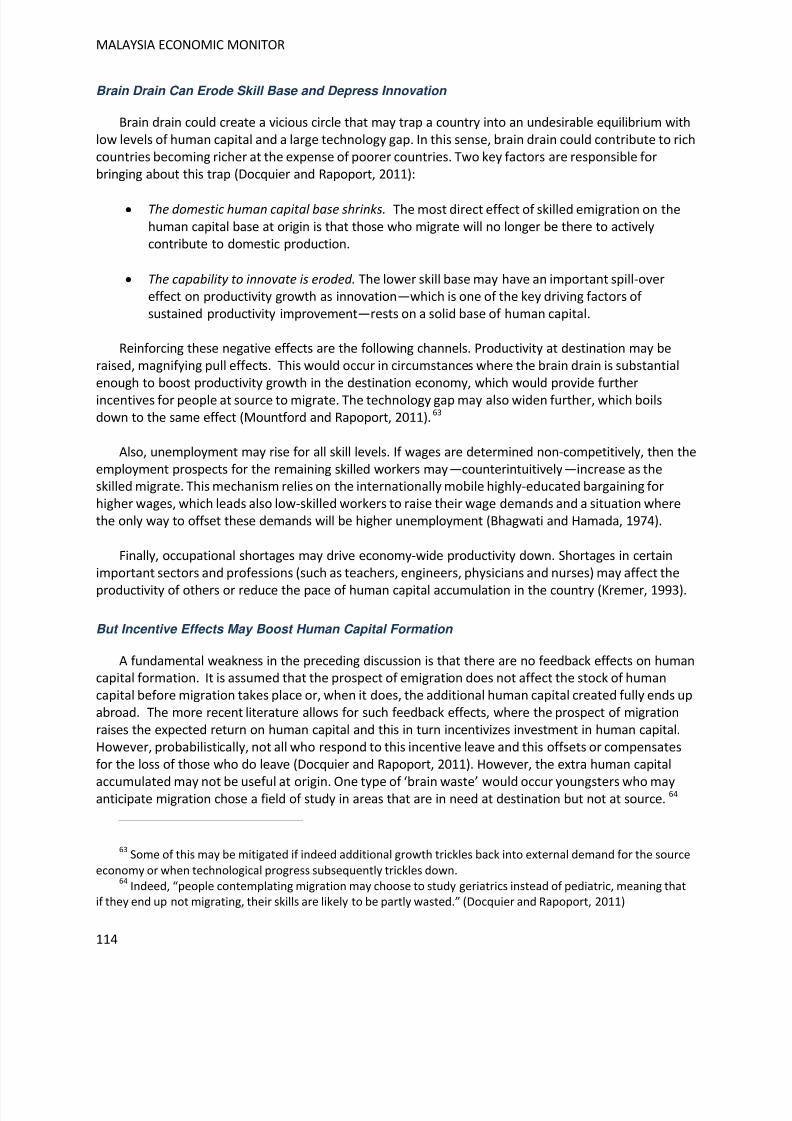
8/6/2019 World Bank Economic Monitor - Malaysia Brain Drain (April 2011)
http://slidepdf.com/reader/full/world-bank-economic-monitor-malaysia-brain-drain-april-2011 114/150
MALAYSIA ECONOMIC MONITOR
114
Brain Drain Can Erode Skill Base and Depress Innovation
Brain drain could create a vicious circle that may trap a country into an undesirable equilibrium withlow levels of human capital and a large technology gap. In this sense, brain drain could contribute to richcountries becoming richer at the expense of poorer countries. Two key factors are responsible forbringing about this trap (Docquier and Rapoport, 2011):
The domestic human capital base shrinks. The most direct effect of skilled emigration on thehuman capital base at origin is that those who migrate will no longer be there to activelycontribute to domestic production.
The capability to innovate is eroded. The lower skill base may have an important spill-overeffect on productivity growth as innovation—which is one of the key driving factors of sustained productivity improvement—rests on a solid base of human capital.
Reinforcing these negative effects are the following channels. Productivity at destination may beraised, magnifying pull effects. This would occur in circumstances where the brain drain is substantialenough to boost productivity growth in the destination economy, which would provide furtherincentives for people at source to migrate. The technology gap may also widen further, which boilsdown to the same effect (Mountford and Rapoport, 2011).63
Also, unemployment may rise for all skill levels. If wages are determined non-competitively, then theemployment prospects for the remaining skilled workers may—counterintuitively—increase as theskilled migrate. This mechanism relies on the internationally mobile highly-educated bargaining forhigher wages, which leads also low-skilled workers to raise their wage demands and a situation wherethe only way to offset these demands will be higher unemployment (Bhagwati and Hamada, 1974).
Finally, occupational shortages may drive economy-wide productivity down. Shortages in certainimportant sectors and professions (such as teachers, engineers, physicians and nurses) may affect the
productivity of others or reduce the pace of human capital accumulation in the country (Kremer, 1993).
But Incentive Effects May Boost Human Capital Formation
A fundamental weakness in the preceding discussion is that there are no feedback effects on humancapital formation. It is assumed that the prospect of emigration does not affect the stock of humancapital before migration takes place or, when it does, the additional human capital created fully ends upabroad. The more recent literature allows for such feedback effects, where the prospect of migrationraises the expected return on human capital and this in turn incentivizes investment in human capital.However, probabilistically, not all who respond to this incentive leave and this offsets or compensatesfor the loss of those who do leave (Docquier and Rapoport, 2011). However, the extra human capital
accumulated may not be useful at origin. One type of ‘brain waste’ would occur youngsters who mayanticipate migration chose a field of study in areas that are in need at destination but not at source. 64
63Some of this may be mitigated if indeed additional growth trickles back into external demand for the source
economy or when technological progress subsequently trickles down.64
Indeed, “people contemplating migration may choose to study geriatrics instead of pediatric, meaning thatif they end up not migrating, their skills are likely to be partly wasted.” (Docquier and Rapoport, 2011)
8/6/2019 World Bank Economic Monitor - Malaysia Brain Drain (April 2011)
http://slidepdf.com/reader/full/world-bank-economic-monitor-malaysia-brain-drain-april-2011 115/150
BRAIN DRAIN
115
Theory suggests that two conditions need to be satisfied for brain drain to have an overall positiveeffect on human capital formation.65 First, the differential in skill prices should be large enough so thatthere is a strong incentive effect. However, at the same time, the differential should not be overly largein that it constraints potential migrants in financing additional years of education. Second, theprobability of skilled migration should be sufficiently low, i.e. a large enough proportion of those whotaken on additional education end up staying.
Other Benefits Accrue From Remittances, Return Migration and Diaspora Effects
In addition the positive incentive effects on human capital formation, there are other potentialbenefits that together may transform what initially was seen as a brain drain into a brain gain.
Remittances may compensate for the loss of talent. Remittances from the highly-skilled thatleft the country may assist at origin in alleviating liquidity constraints, stimulating educationinvestment, as well as reducing poverty.
Return migration may bring additional benefits. Brain drain may lead to brain gain if migrants
who upgraded their skills abroad return to the home country. Return migration may also boostentrepreneurship and innovation, if returning migrants put to good use additional knowledgeand financial capital gained abroad. A net benefit is more likely to be obtained if the fraction of time spent abroad is not too large.
High-skill diasporas could benefit in various ways. Migration may lead to a reduction ininternational transaction costs, facilitating the exchange of goods, factors and knowledgebetween origin and destination countries. Diasporas could contribute to better technologydiffusion, by the creation of scientific and business networks, and stimulate trade and FDI. They
could also contribute to improving institutions in the home country.
Effect on Malaysian Human Capital Base
Brain Drain Does Not Appear to Have Eroded Stock of Tertiary-Educated
Whether the overall effect is positive is ultimately an empirical question. Beine, Docquier andRapoport (2008) estimate the impact for a large set of countries on the basis of a counterfactualexperiment. The authors find that doubling the skilled emigration rate raises human capital formation by5 percent among the overall population (including both residents and emigrants). Based on this result, acounterfactual experiment is constructed, where the high-skill emigration rate is equated to the low-skillemigration rate. The counterfactual human capital stock then consists of the initial stock of humancapital less the increment that would have happened if the high-skill migration rate were to rise from
the counterfactual high-skill migration rate (set at the low-skill migration rate) to the observed high-skillmigration rate using the 5 percent coefficient obtained from cross-country regressions. The differencebetween the observed human capital stock (taking into account emigration and the incentive effect) andthe counterfactual one (removing both these effects) constitutes then the net impact of the brain drain.
65Beneficial brain drain in this context occurs when the positive (ex ante) incentive effect dominates the
negative (ex post) direct emigration effect on the human capital stock that arises when people leave.
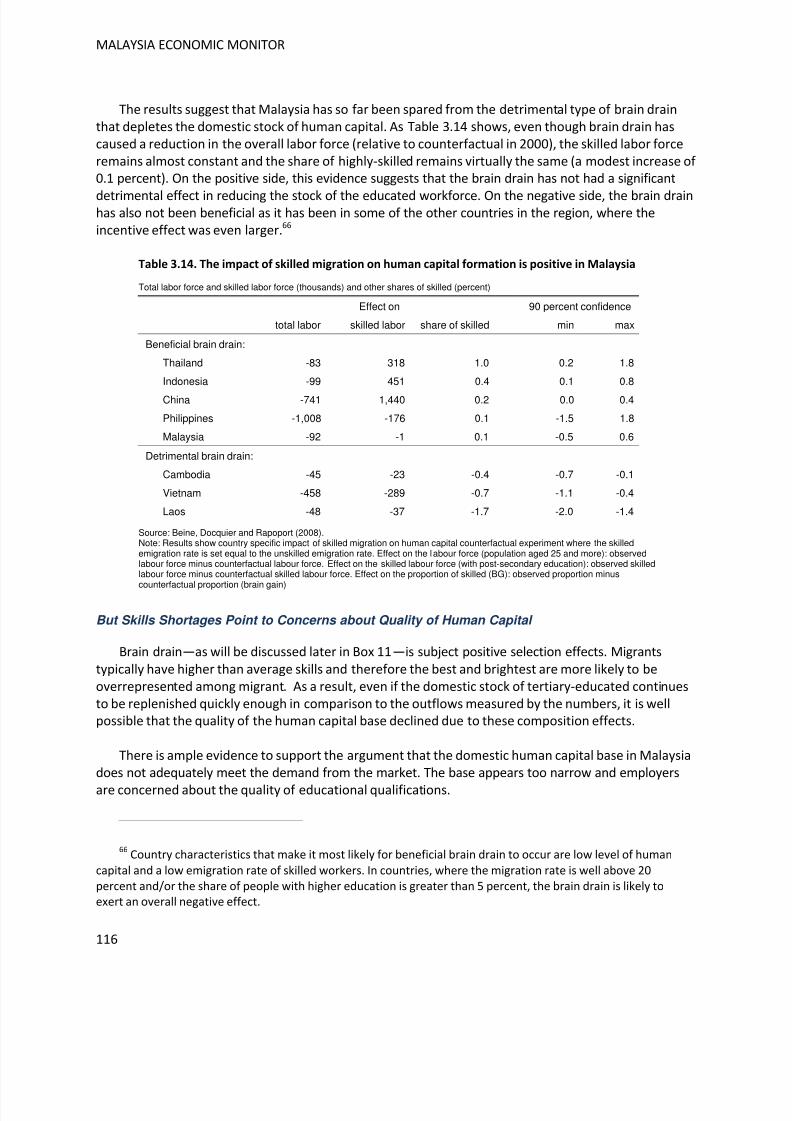
8/6/2019 World Bank Economic Monitor - Malaysia Brain Drain (April 2011)
http://slidepdf.com/reader/full/world-bank-economic-monitor-malaysia-brain-drain-april-2011 116/150
MALAYSIA ECONOMIC MONITOR
116
The results suggest that Malaysia has so far been spared from the detrimental type of brain drainthat depletes the domestic stock of human capital. As Table 3.14 shows, even though brain drain hascaused a reduction in the overall labor force (relative to counterfactual in 2000), the skilled labor forceremains almost constant and the share of highly-skilled remains virtually the same (a modest increase of 0.1 percent). On the positive side, this evidence suggests that the brain drain has not had a significant
detrimental effect in reducing the stock of the educated workforce. On the negative side, the brain drainhas also not been beneficial as it has been in some of the other countries in the region, where theincentive effect was even larger.66
Table 3.14. The impact of skilled migration on human capital formation is positive in Malaysia
Total labor force and skilled labor force (thousands) and other shares of skilled (percent)
Effect on 90 percent confidence
total labor skilled labor share of skilled min max
Beneficial brain drain:
Thailand -83 318 1.0 0.2 1.8
Indonesia -99 451 0.4 0.1 0.8
China -741 1,440 0.2 0.0 0.4
Philippines -1,008 -176 0.1 -1.5 1.8
Malaysia -92 -1 0.1 -0.5 0.6
Detrimental brain drain:
Cambodia -45 -23 -0.4 -0.7 -0.1
Vietnam -458 -289 -0.7 -1.1 -0.4
Laos -48 -37 -1.7 -2.0 -1.4
Source: Beine, Docquier and Rapoport (2008).Note: Results show country specific impact of skilled migration on human capital counterfactual experiment where the skilledemigration rate is set equal to the unskilled emigration rate. Effect on the labour force (population aged 25 and more): observedlabour force minus counterfactual labour force. Effect on the skilled labour force (with post-secondary education): observed skilledlabour force minus counterfactual skilled labour force. Effect on the proportion of skilled (BG): observed proportion minus
counterfactual proportion (brain gain)
But Skills Shortages Point to Concerns about Quality of Human Capital
Brain drain—as will be discussed later in Box 11—is subject positive selection effects. Migrants
typically have higher than average skills and therefore the best and brightest are more likely to beoverrepresented among migrant. As a result, even if the domestic stock of tertiary-educated continuesto be replenished quickly enough in comparison to the outflows measured by the numbers, it is wellpossible that the quality of the human capital base declined due to these composition effects.
There is ample evidence to support the argument that the domestic human capital base in Malaysiadoes not adequately meet the demand from the market. The base appears too narrow and employers
are concerned about the quality of educational qualifications.
66Country characteristics that make it most likely for beneficial brain drain to occur are low level of human
capital and a low emigration rate of skilled workers. In countries, where the migration rate is well above 20
percent and/or the share of people with higher education is greater than 5 percent, the brain drain is likely toexert an overall negative effect.
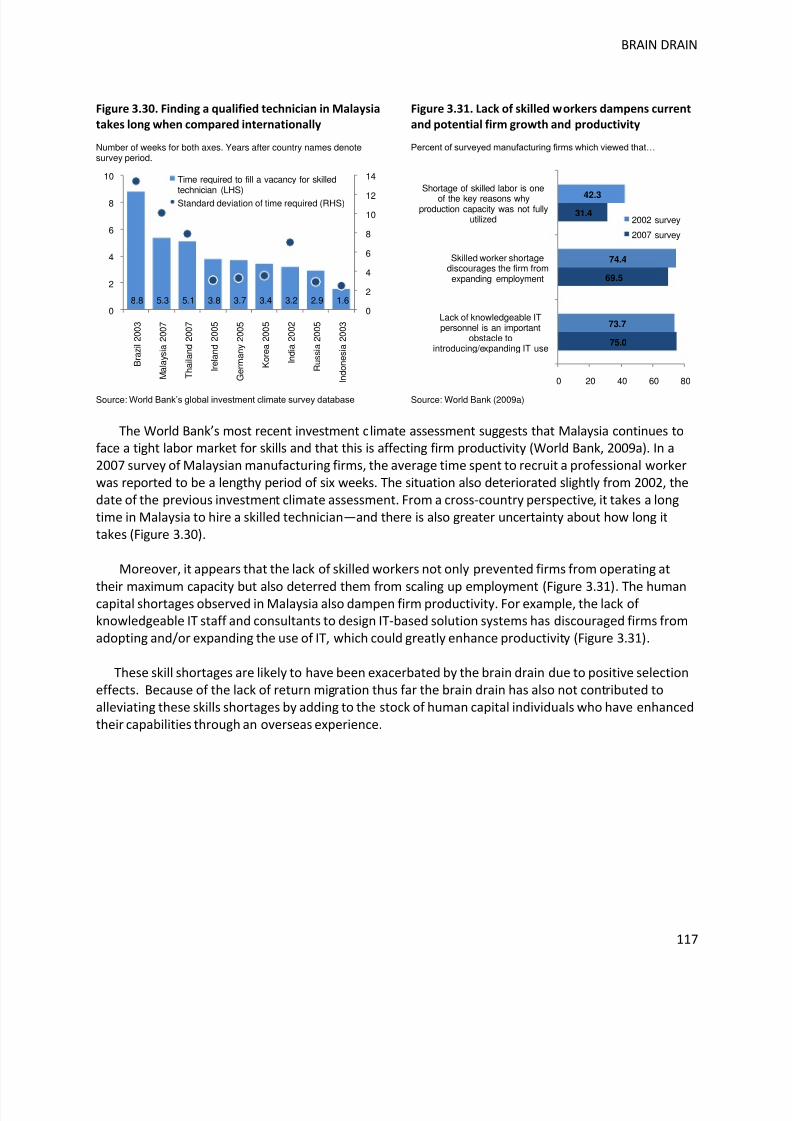
8/6/2019 World Bank Economic Monitor - Malaysia Brain Drain (April 2011)
http://slidepdf.com/reader/full/world-bank-economic-monitor-malaysia-brain-drain-april-2011 117/150
8/6/2019 World Bank Economic Monitor - Malaysia Brain Drain (April 2011)
http://slidepdf.com/reader/full/world-bank-economic-monitor-malaysia-brain-drain-april-2011 118/150
MALAYSIA ECONOMIC MONITOR
118
POLICY APPROACHES TO BRAIN DRAIN
The human capital agenda is of paramount importance as Malaysia embarks upon its journeytowards a high-income nation. This journey will require Malaysia to significantly strengthen thedomestic human capital base, which is too narrow to meet current demand and will likely fall short to aneven greater extent as growth becomes more skill-intensive. Developing human capital domestically will
be one important objective, but so will be the objectives of attracting and retaining talent.
Relative to the presently narrow base of human capital, the brain drain has been intensive.Universities continue to churn out graduates, alleviating the erosion in the number of tertiary-educatedremaining in Malaysia. Yet, the widespread skill shortages continue to point to significant quality issuesin the domestic human capital stocks. Brain drain is likely to have amplified these concerns about thequality of the human capital base. On the one hand, as elsewhere around the world, positive selectioneffects imply the best and brightest leave, causing a decline in average quality. On the other hand,concerns about the quality of the education system constitute a push factor driving migration decisions.
How can policymakers reverse these patterns and realign the migration of talent with the high-income aspiration? This section will first argue that brain drain is a symptom, driven by underlyingfactors, rather than necessarily a problem in itself. This entails three sets of policy implication, which aresubsequently examined. First, the fundamental factors need to be identified that account for the braindrain and incentivize the decisions to migrate. Second, the policy suggestions need to reflect thefundamental factors, not the symptoms. Third, approaches that target the flow of talent directly maycomplement, but cannot not substitute for, comprehensive approaches that address the fundamentaldrivers of brain drain.
Fundamental Drivers of Brain Drain
Brain drain is a symptom of underlying factors. Individuals respond to incentives and to understandwhat is fundamentally driving the brain drain so as to be able respond with policies, one needs to
understand these incentives. In what follows, we follow two complementary approaches to understandthe incentives for Malaysia’s brain drain. The first is a review of the generic push and pull factorsadvocated in the brain drain literature, coupled with an interpretation of how these may play out in theMalaysian context. The second is a presentation of a survey that we conducted among the Malaysiandiaspora, with the objective of getting a ‘qualitative feel’ for the factors that mattered in actualdecisions of migration.
Push and Pull Factors Drive the Migration Decision
To the extent that the brain drain is a global phenomenon, one would presume that the set of underlying drivers of brain drain is similar across countries that experience brain drain (see Box 11). As
suggested by Docquier and Rapoport (2006): “The causes of *the+ growing brain drain are well known.On the supply-side, the globalization of the world economy has strengthened the tendency for humancapital to agglomerate where it is already abundant and contributed to increase positive self-selectionamong migrants. And on the demand side, host countries have gradually introduced quality-selectiveimmigration policies and are now engaged in what appears as an international competition to attractglobal talent.”
8/6/2019 World Bank Economic Monitor - Malaysia Brain Drain (April 2011)
http://slidepdf.com/reader/full/world-bank-economic-monitor-malaysia-brain-drain-april-2011 119/150
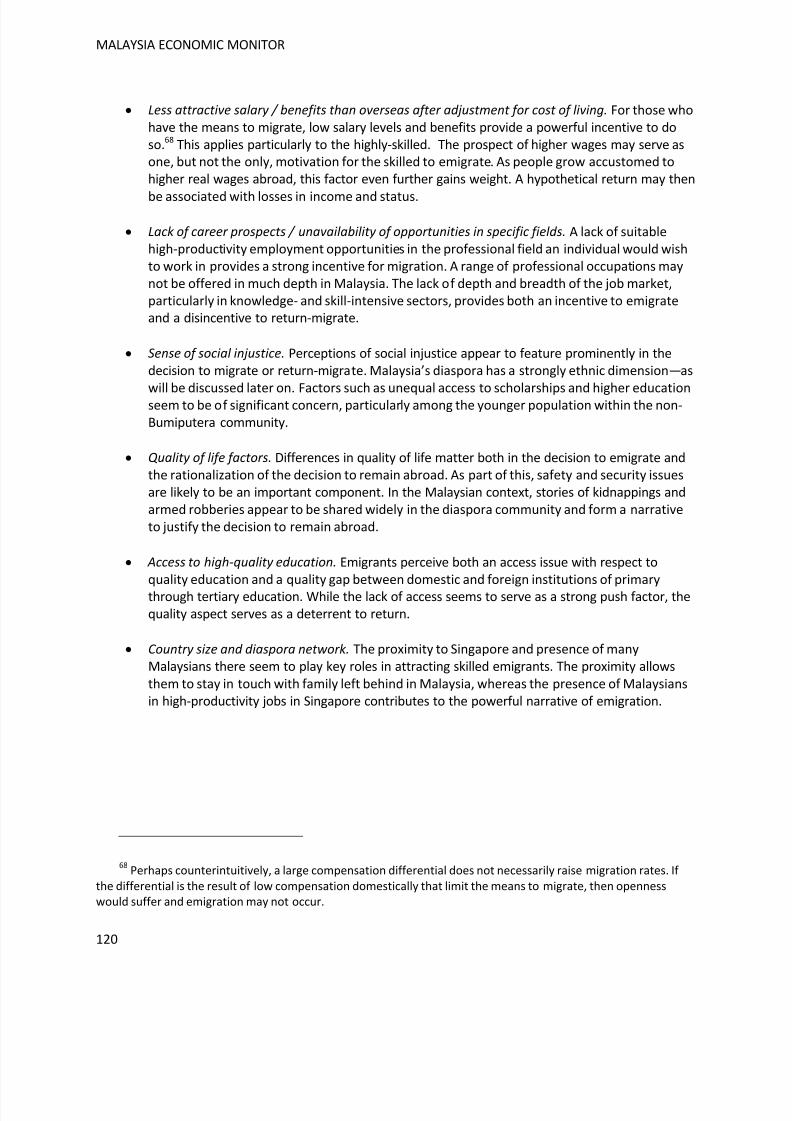
8/6/2019 World Bank Economic Monitor - Malaysia Brain Drain (April 2011)
http://slidepdf.com/reader/full/world-bank-economic-monitor-malaysia-brain-drain-april-2011 120/150
MALAYSIA ECONOMIC MONITOR
120
Less attractive salary / benefits than overseas after adjustment for cost of living. For those whohave the means to migrate, low salary levels and benefits provide a powerful incentive to doso.68 This applies particularly to the highly-skilled. The prospect of higher wages may serve asone, but not the only, motivation for the skilled to emigrate. As people grow accustomed tohigher real wages abroad, this factor even further gains weight. A hypothetical return may then
be associated with losses in income and status.
Lack of career prospects / unavailability of opportunities in specific fields. A lack of suitablehigh-productivity employment opportunities in the professional field an individual would wishto work in provides a strong incentive for migration. A range of professional occupations maynot be offered in much depth in Malaysia. The lack of depth and breadth of the job market,particularly in knowledge- and skill-intensive sectors, provides both an incentive to emigrateand a disincentive to return-migrate.
Sense of social injustice. Perceptions of social injustice appear to feature prominently in thedecision to migrate or return-migrate. Malaysia’s diaspora has a strongly ethnic dimension—as
will be discussed later on. Factors such as unequal access to scholarships and higher educationseem to be of significant concern, particularly among the younger population within the non-Bumiputera community.
Quality of life factors. Differences in quality of life matter both in the decision to emigrate andthe rationalization of the decision to remain abroad. As part of this, safety and security issuesare likely to be an important component. In the Malaysian context, stories of kidnappings andarmed robberies appear to be shared widely in the diaspora community and form a narrativeto justify the decision to remain abroad.
Access to high-quality education. Emigrants perceive both an access issue with respect toquality education and a quality gap between domestic and foreign institutions of primarythrough tertiary education. While the lack of access seems to serve as a strong push factor, thequality aspect serves as a deterrent to return.
Country size and diaspora network. The proximity to Singapore and presence of manyMalaysians there seem to play key roles in attracting skilled emigrants. The proximity allows
them to stay in touch with family left behind in Malaysia, whereas the presence of Malaysiansin high-productivity jobs in Singapore contributes to the powerful narrative of emigration.
68Perhaps counterintuitively, a large compensation differential does not necessarily raise migration rates. If
the differential is the result of low compensation domestically that limit the means to migrate, then opennesswould suffer and emigration may not occur.
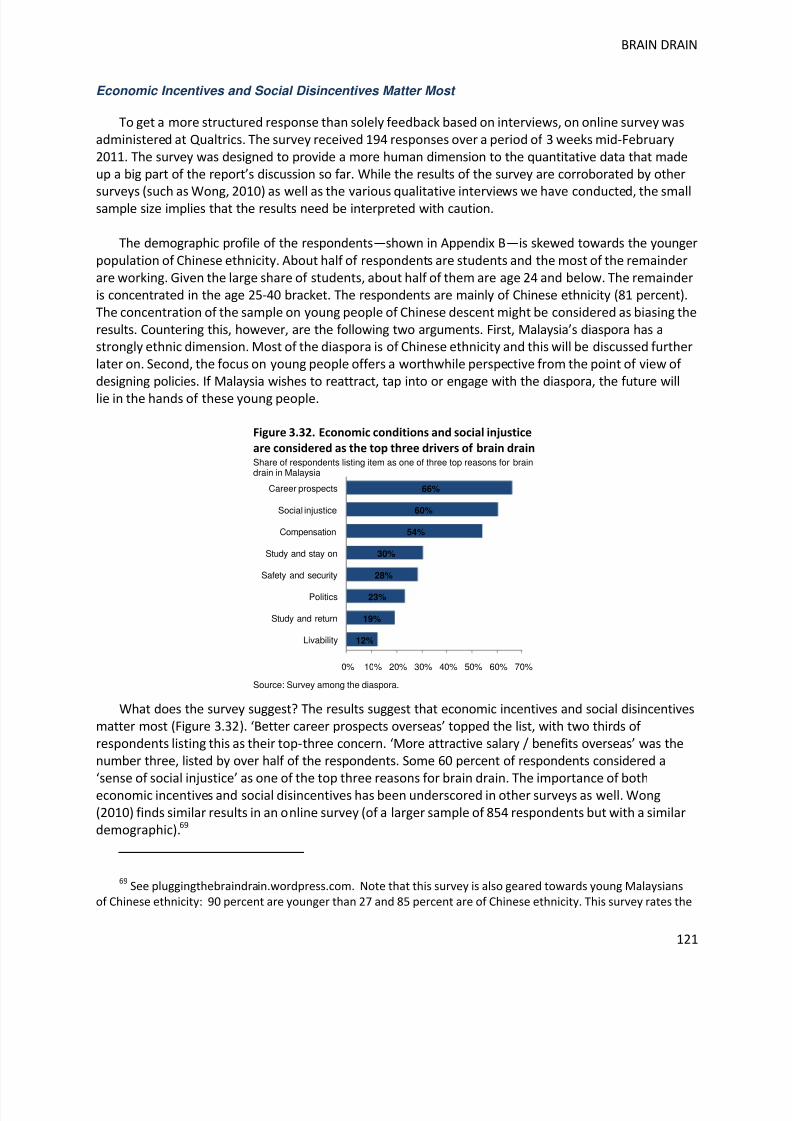
8/6/2019 World Bank Economic Monitor - Malaysia Brain Drain (April 2011)
http://slidepdf.com/reader/full/world-bank-economic-monitor-malaysia-brain-drain-april-2011 121/150
BRAIN DRAIN
121
Economic Incentives and Social Disincentives Matter Most
To get a more structured response than solely feedback based on interviews, on online survey wasadministered at Qualtrics. The survey received 194 responses over a period of 3 weeks mid-February2011. The survey was designed to provide a more human dimension to the quantitative data that madeup a big part of the report’s discussion so far. While the results of the survey are corroborated by other
surveys (such as Wong, 2010) as well as the various qualitative interviews we have conducted, the smallsample size implies that the results need be interpreted with caution.
The demographic profile of the respondents—shown in Appendix B—is skewed towards the younger
population of Chinese ethnicity. About half of respondents are students and the most of the remainderare working. Given the large share of students, about half of them are age 24 and below. The remainderis concentrated in the age 25-40 bracket. The respondents are mainly of Chinese ethnicity (81 percent).The concentration of the sample on young people of Chinese descent might be considered as biasing theresults. Countering this, however, are the following two arguments. First, Malaysia’s diaspora has astrongly ethnic dimension. Most of the diaspora is of Chinese ethnicity and this will be discussed furtherlater on. Second, the focus on young people offers a worthwhile perspective from the point of view of designing policies. If Malaysia wishes to reattract, tap into or engage with the diaspora, the future will
lie in the hands of these young people.
Figure 3.32. Economic conditions and social injustice
are considered as the top three drivers of brain drain
Share of respondents listing item as one of three top reasons for braindrain in Malaysia
Source: Survey among the diaspora.
What does the survey suggest? The results suggest that economic incentives and social disincentivesmatter most (Figure 3.32). ‘Better career prospects overseas’ topped the list, with two thirds of respondents listing this as their top-three concern. ‘More attractive salary / benefits overseas’ was thenumber three, listed by over half of the respondents. Some 60 percent of respondents considered a‘sense of social injustice’ as one of the top three reasons for brain drain. The importance of botheconomic incentives and social disincentives has been underscored in other surveys as well. Wong(2010) finds similar results in an online survey (of a larger sample of 854 respondents but with a similardemographic).69
69See pluggingthebraindrain.wordpress.com. Note that this survey is also geared towards young Malaysians
of Chinese ethnicity: 90 percent are younger than 27 and 85 percent are of Chinese ethnicity. This survey rates the
12%
19%
23%
28%
30%
54%
60%
66%
0% 10% 20% 30% 40% 50% 60% 70%
Livability
Study and return
Politics
Safety and security
Study and stay on
Compensation
Social injustice
Career prospects
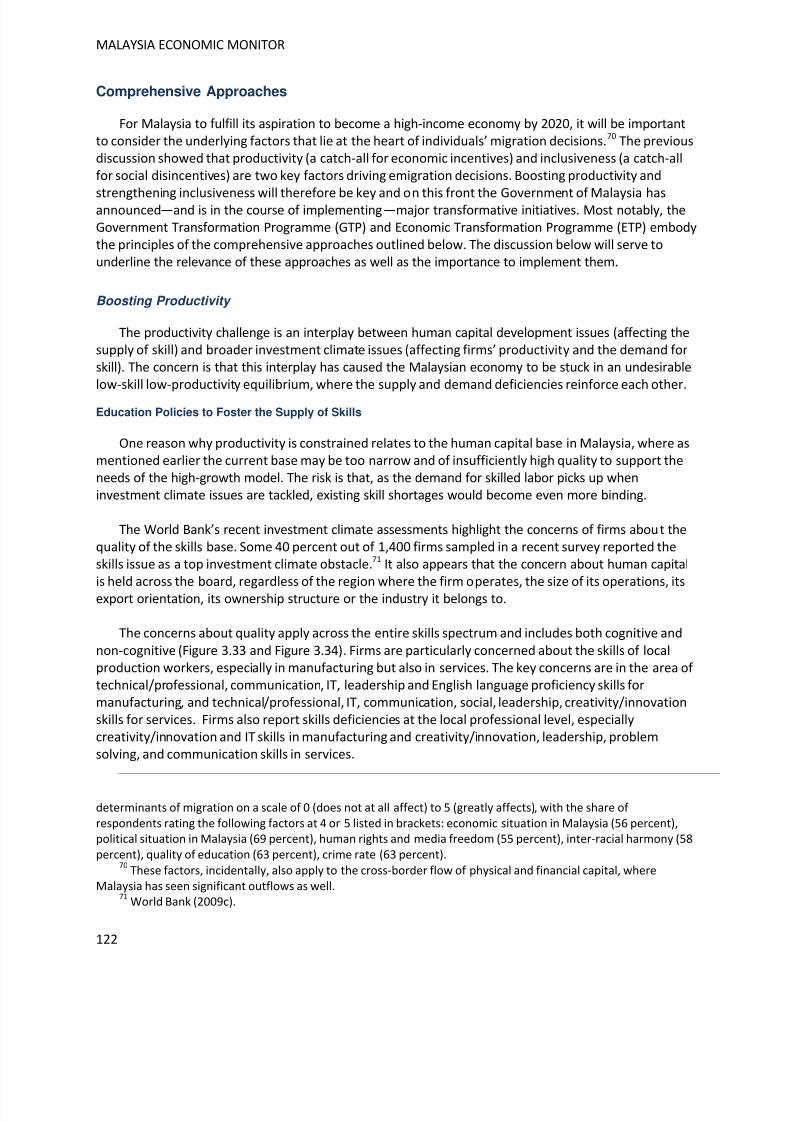
8/6/2019 World Bank Economic Monitor - Malaysia Brain Drain (April 2011)
http://slidepdf.com/reader/full/world-bank-economic-monitor-malaysia-brain-drain-april-2011 122/150
MALAYSIA ECONOMIC MONITOR
122
Comprehensive Approaches
For Malaysia to fulfill its aspiration to become a high-income economy by 2020, it will be importantto consider the underlying factors that lie at the heart of individuals’ migration decisions.70 The previousdiscussion showed that productivity (a catch-all for economic incentives) and inclusiveness (a catch-allfor social disincentives) are two key factors driving emigration decisions. Boosting productivity and
strengthening inclusiveness will therefore be key and on this front the Government of Malaysia hasannounced—and is in the course of implementing—major transformative initiatives. Most notably, theGovernment Transformation Programme (GTP) and Economic Transformation Programme (ETP) embodythe principles of the comprehensive approaches outlined below. The discussion below will serve tounderline the relevance of these approaches as well as the importance to implement them.
Boosting Productivity
The productivity challenge is an interplay between human capital development issues (affecting thesupply of skill) and broader investment climate issues (affecting firms’ productivity and the demand forskill). The concern is that this interplay has caused the Malaysian economy to be stuck in an undesirablelow-skill low-productivity equilibrium, where the supply and demand deficiencies reinforce each other.
Education Policies to Foster the Supply of Skills
One reason why productivity is constrained relates to the human capital base in Malaysia, where asmentioned earlier the current base may be too narrow and of insufficiently high quality to support theneeds of the high-growth model. The risk is that, as the demand for skilled labor picks up wheninvestment climate issues are tackled, existing skill shortages would become even more binding.
The World Bank’s recent investment climate assessments highlight the concerns of firms about thequality of the skills base. Some 40 percent out of 1,400 firms sampled in a recent survey reported theskills issue as a top investment climate obstacle.71 It also appears that the concern about human capitalis held across the board, regardless of the region where the firm operates, the size of its operations, itsexport orientation, its ownership structure or the industry it belongs to.
The concerns about quality apply across the entire skills spectrum and includes both cognitive and
non-cognitive (Figure 3.33 and Figure 3.34). Firms are particularly concerned about the skills of localproduction workers, especially in manufacturing but also in services. The key concerns are in the area of technical/professional, communication, IT, leadership and English language proficiency skills formanufacturing, and technical/professional, IT, communication, social, leadership, creativity/innovationskills for services. Firms also report skills deficiencies at the local professional level, especiallycreativity/innovation and IT skills in manufacturing and creativity/innovation, leadership, problemsolving, and communication skills in services.
determinants of migration on a scale of 0 (does not at all affect) to 5 (greatly affects), with the share of
respondents rating the following factors at 4 or 5 listed in brackets: economic situation in Malaysia (56 percent),political situation in Malaysia (69 percent), human rights and media freedom (55 percent), inter-racial harmony (58
percent), quality of education (63 percent), crime rate (63 percent).70
These factors, incidentally, also apply to the cross-border flow of physical and financial capital, where
Malaysia has seen significant outflows as well.71
World Bank (2009c).
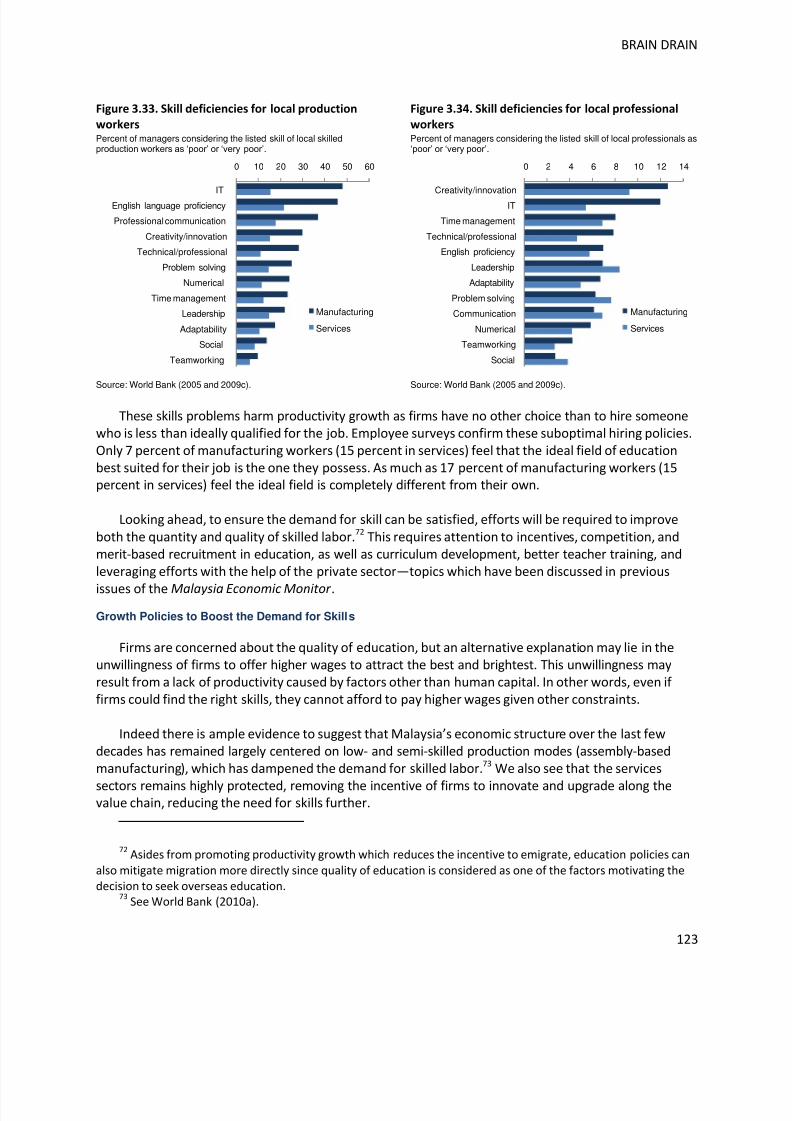
8/6/2019 World Bank Economic Monitor - Malaysia Brain Drain (April 2011)
http://slidepdf.com/reader/full/world-bank-economic-monitor-malaysia-brain-drain-april-2011 123/150
BRAIN DRAIN
123
Figure 3.33. Skill deficiencies for local production
workersPercent of managers considering the listed skill of local skilledproduction workers as ‘poor’ or ‘very poor’.
Source: World Bank (2005 and 2009c).
Figure 3.34. Skill deficiencies for local professional
workers
Percent of managers considering the listed skill of local professionals as‘poor’ or ‘very poor’.
Source: World Bank (2005 and 2009c).
These skills problems harm productivity growth as firms have no other choice than to hire someonewho is less than ideally qualified for the job. Employee surveys confirm these suboptimal hiring policies.Only 7 percent of manufacturing workers (15 percent in services) feel that the ideal field of educationbest suited for their job is the one they possess. As much as 17 percent of manufacturing workers (15percent in services) feel the ideal field is completely different from their own.
Looking ahead, to ensure the demand for skill can be satisfied, efforts will be required to improve
both the quantity and quality of skilled labor.72 This requires attention to incentives, competition, andmerit-based recruitment in education, as well as curriculum development, better teacher training, andleveraging efforts with the help of the private sector—topics which have been discussed in previous
issues of the Malaysia Economic Monitor .
Growth Policies to Boost the Demand for Skills
Firms are concerned about the quality of education, but an alternative explanation may lie in theunwillingness of firms to offer higher wages to attract the best and brightest. This unwillingness mayresult from a lack of productivity caused by factors other than human capital. In other words, even if firms could find the right skills, they cannot afford to pay higher wages given other constraints.
Indeed there is ample evidence to suggest that Malaysia’s economic structure over the last fewdecades has remained largely centered on low- and semi-skilled production modes (assembly-basedmanufacturing), which has dampened the demand for skilled labor.73 We also see that the services
sectors remains highly protected, removing the incentive of firms to innovate and upgrade along thevalue chain, reducing the need for skills further.
72Asides from promoting productivity growth which reduces the incentive to emigrate, education policies can
also mitigate migration more directly since quality of education is considered as one of the factors motivating the
decision to seek overseas education.73
See World Bank (2010a).
0 10 20 30 40 50 60
IT
English language proficiency
Professional communication
Creativity/innovation
Technical/professional
Problem solving
Numerical
Time management
Leadership
Adaptability
Social
Teamworking
Manufacturing
Services
0 2 4 6 8 10 12 14
Creativity/innovation
IT
Time management
Technical/professional
English proficiency
Leadership
Adaptability
Problem solving
Communication
Numerical
Teamworking
Social
Manufacturing
Services
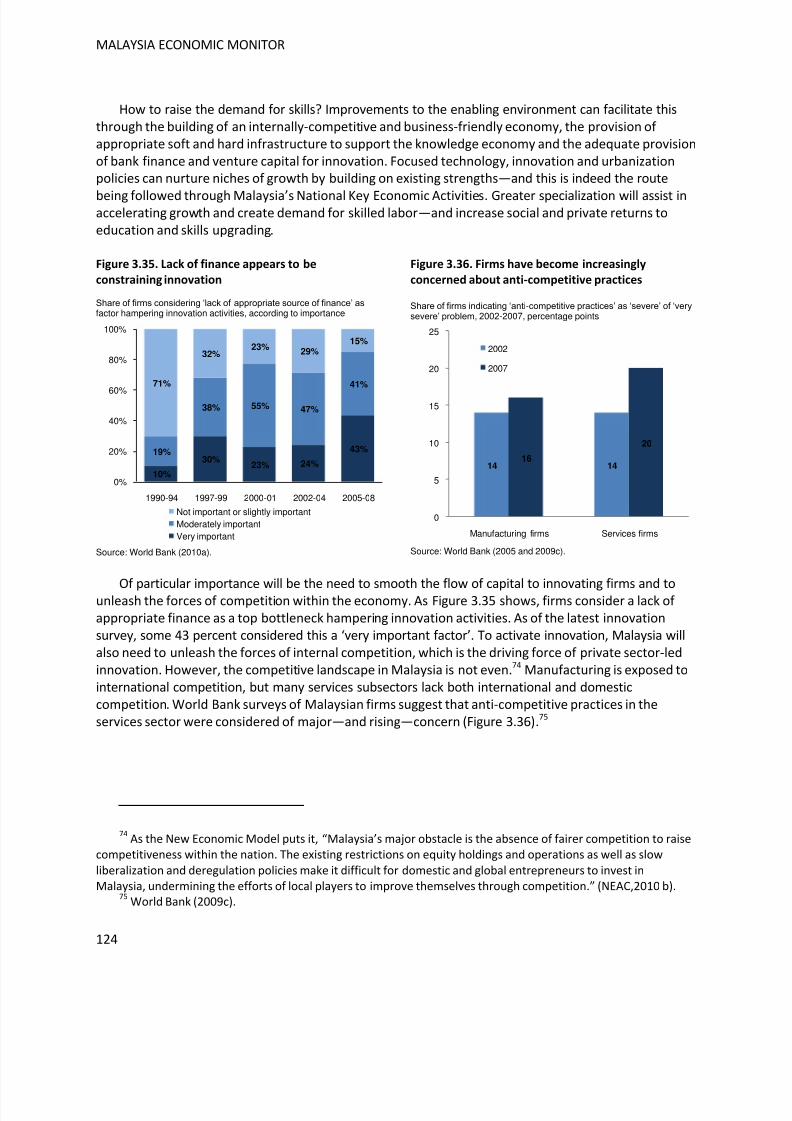
8/6/2019 World Bank Economic Monitor - Malaysia Brain Drain (April 2011)
http://slidepdf.com/reader/full/world-bank-economic-monitor-malaysia-brain-drain-april-2011 124/150
MALAYSIA ECONOMIC MONITOR
124
How to raise the demand for skills? Improvements to the enabling environment can facilitate thisthrough the building of an internally-competitive and business-friendly economy, the provision of appropriate soft and hard infrastructure to support the knowledge economy and the adequate provisionof bank finance and venture capital for innovation. Focused technology, innovation and urbanizationpolicies can nurture niches of growth by building on existing strengths—and this is indeed the route
being followed through Malaysia’s National Key Economic Activities. Greater specialization will assist inaccelerating growth and create demand for skilled labor—and increase social and private returns toeducation and skills upgrading.
Figure 3.35. Lack of finance appears to be
constraining innovation
Share of firms considering ‘lack of appropriate source of finance’ asfactor hampering innovation activities, according to importance
Source: World Bank (2010a).
Figure 3.36. Firms have become increasingly
concerned about anti-competitive practices
Share of firms indicating ‘anti-competitive practices’ as ‘severe’ of ‘verysevere’ problem, 2002-2007, percentage points
Source: World Bank (2005 and 2009c).
Of particular importance will be the need to smooth the flow of capital to innovating firms and tounleash the forces of competition within the economy. As Figure 3.35 shows, firms consider a lack of appropriate finance as a top bottleneck hampering innovation activities. As of the latest innovationsurvey, some 43 percent considered this a ‘very important factor’. To activate innovation, Malaysia willalso need to unleash the forces of internal competition, which is the driving force of private sector-ledinnovation. However, the competitive landscape in Malaysia is not even.74 Manufacturing is exposed tointernational competition, but many services subsectors lack both international and domesticcompetition. World Bank surveys of Malaysian firms suggest that anti-competitive practices in theservices sector were considered of major—and rising—concern (Figure 3.36).75
74 As the New Economic Model puts it, “Malaysia’s major obstacle is the absence of fairer competition to raise
competitiveness within the nation. The existing restrictions on equity holdings and operations as well as slow
liberalization and deregulation policies make it difficult for domestic and global entrepreneurs to invest in
Malaysia, undermining the efforts of local players to improve themselves through competition.” (NEAC,2010b).75
World Bank (2009c).
10%
30%23% 24%
43%19%
38% 55% 47%
41%71%
32%23%
29%15%
0%
20%
40%
60%
80%
100%
1990-94 1997-99 2000-01 2002-04 2005-08
Not important or slightly importantModerately importantVery important
14 1416
20
0
5
10
15
20
25
Manufacturing firms Services firms
2002
2007
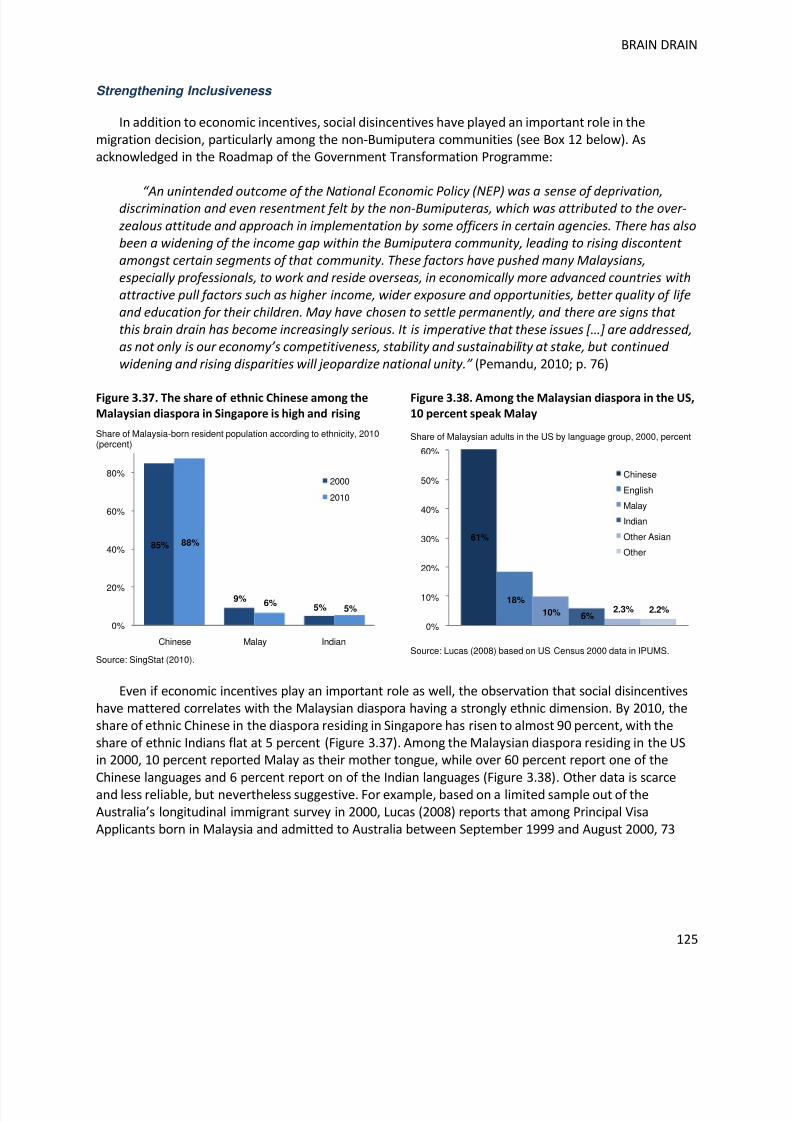
8/6/2019 World Bank Economic Monitor - Malaysia Brain Drain (April 2011)
http://slidepdf.com/reader/full/world-bank-economic-monitor-malaysia-brain-drain-april-2011 125/150
BRAIN DRAIN
125
Strengthening Inclusiveness
In addition to economic incentives, social disincentives have played an important role in themigration decision, particularly among the non-Bumiputera communities (see Box 12 below). Asacknowledged in the Roadmap of the Government Transformation Programme:
“An unintended outcome of the National Economic Policy (NEP) was a sense of deprivation,discrimination and even resentment felt by the non-Bumiputeras, which was attributed to the over-
zealous attitude and approach in implementation by some officers in certain agencies. There has also
been a widening of the income gap within the Bumiputera community, leading to rising discontent
amongst certain segments of that community. These factors have pushed many Malaysians,
especially professionals, to work and reside overseas, in economically more advanced countries with
attractive pull factors such as higher income, wider exposure and opportunities, better quality of life
and education for their children. May have chosen to settle permanently, and there are signs that
this brain drain has become increasingly serious. It is imperative that these issues […] are addressed,
as not only is our economy’s competitiveness, stability and sustainability at stake, but continued
widening and rising disparities will jeopardize national unity.” (Pemandu, 2010; p. 76)
Figure 3.37. The share of ethnic Chinese among the
Malaysian diaspora in Singapore is high and rising
Share of Malaysia-born resident population according to ethnicity, 2010(percent)
Source: SingStat (2010).
Figure 3.38. Among the Malaysian diaspora in the US,
10 percent speak Malay
Share of Malaysian adults in the US by language group, 2000, percent
Source: Lucas (2008) based on US Census 2000 data in IPUMS.
Even if economic incentives play an important role as well, the observation that social disincentiveshave mattered correlates with the Malaysian diaspora having a strongly ethnic dimension. By 2010, theshare of ethnic Chinese in the diaspora residing in Singapore has risen to almost 90 percent, with theshare of ethnic Indians flat at 5 percent (Figure 3.37). Among the Malaysian diaspora residing in the USin 2000, 10 percent reported Malay as their mother tongue, while over 60 percent report one of the
Chinese languages and 6 percent report on of the Indian languages (Figure 3.38). Other data is scarceand less reliable, but nevertheless suggestive. For example, based on a limited sample out of theAustralia’s longitudinal immigrant survey in 2000, Lucas (2008) reports that among Principal VisaApplicants born in Malaysia and admitted to Australia between September 1999 and August 2000, 73
85%
9%5%
88%
6%5%
0%
20%
40%
60%
80%
Chinese Malay Indian
2000
2010
61%
18%
10% 6%2.3% 2.2%
0%
10%
20%
30%
40%
50%
60%
Chinese
English
Malay
Indian
Other Asian
Other
8/6/2019 World Bank Economic Monitor - Malaysia Brain Drain (April 2011)
http://slidepdf.com/reader/full/world-bank-economic-monitor-malaysia-brain-drain-april-2011 126/150
MALAYSIA ECONOMIC MONITOR
126
percent were ethnic Chinese and 15 percent ethnic Indian.76 These numbers suggest that the non-Bumiputera are highly overrepresented in the diaspora relative to their population shares (26 percentfor the Chinese ethnicity and 7.7 percent for the Indian ethnicity).
Strengthening inclusiveness is an important policy priority in the Government of Malaysia’s reformagenda. The objective of unity in diversity and inclusiveness, while ensuring fairness for all, lies at the
heart of the 1Malaysia principle and is also anchored in the Federal Constitution of Malaysia. As PrimeMinister Dato’ Sri Najib Razak has recently remarked:
“It is important that we first acknowledge the tremendous progr ess that we, as a nation, have
made in creating a more united and inclusive Malaysia. Nevertheless more needs to be done, and it
is my belief that Malaysians have reached the level of maturity necessary to discuss some of the
tougher issues that we face. These issues often do not have a solution and represent polarities that
require compromises to be made by all parties.” (Pemandu, 2010; p. 64).
The need for change is echoed in a quote of former Deputy Prime Minister Tun Musa Hitam:
“We must now begin to pay heed to questions as to whether our redistributive economic policies
are indeed holding us back competitively compared with the rest of the world. Race-based economic
policies do not sit well with the realities of globalization and free trade. Malaysia must find a way to
create race-neutral space within itself and find the correct formulae to harness the qualities
necessary to compete on a global level” (Pemandu, 2010; p. 76).
The need to update Malaysia’s inclusiveness strategies reflects both new realities and newchallenges. The new reality is that poverty is no longer the key issue when thinking about inclusivegrowth. Poverty still exists—and pockets of poverty remain deep, concentrated and geographicallybiased—but inequality is now in the spotlight and is presenting a tremendous challenge. The other new
reality is that inequality is no longer what it was four decades ago. Nowadays over 90 percent of thelevel of inequality is explained by differences within ethnic groups rather than differences between
these groups (World Bank, 2010b). Individual socio-economic characteristics, such as activity status,sector of employment, urban versus rural stratum, and educational attainment are now the capitalexplanatory factors, no longer ethnicity.
Malaysia’s high-income aspiration is also raising a whole new set of challenges. High-incomeeconomies tilt the demand for labor in favor of the skilled, sharpening income inequality across the skillsspectrum. They tend to specialize in product niches and concentrate activity in narrow geographicalclusters, raising challenges to retrain people and move them around to where the new jobs are. Theyare also open to competitive forces, creating challenges for those who are unable to compete or unluckyas a result of such competition.
76The stratified sample consists of only 64, so these results should be interpreted with extreme caution. The
longitudinal survey is available from Dept. of Immigration and Citizenship Australia (2000).
8/6/2019 World Bank Economic Monitor - Malaysia Brain Drain (April 2011)
http://slidepdf.com/reader/full/world-bank-economic-monitor-malaysia-brain-drain-april-2011 127/150
BRAIN DRAIN
127
What could an updated inclusiveness strategy consist of? The previous issue of the Malaysia
Economic Monitor proposed a three-pillar approach (World Bank, 2010b):
Increasing economy-wide income-earning opportunities. Malaysia’s steady growth hasbenefitted many. However, there are those who are being excluded because growth has nottranslated into steady employment or has not turned self-employment from a desperate last
resort to an opportunity to become an independent and creative entrepreneur. In this respectpolicies would be welcome to reduce the costs of and barriers to labor mobility, increasecompetitiveness in the labor market to push up wages, and reduce the rigidities in labor marketregulations. Together, these measures would help to raise the level of employment, strengthenthe labor market matching process, and reduce the degree of informality.
Promoting investment in human capital. Many Malaysians cannot take advantage of income-earning opportunities because they lack the skills to do so. Some never got them in the first
place, despite the massive investments that Malaysia has made in its education system. In thecase of others, the skill needs of the Malaysian economy have changed more quickly than theeducational and training opportunities that are available to them. Policies could address these
challenges by reducing disparities in the availability of quality basic education among states andbetween rural and urban areas, restructuring the vocational training system, and ensuring thatthe skills being produced match the needs of the market.
Providing social protection for the poor and vulnerable. Some Malaysians will not be able toavail themselves of opportunities to increase their incomes or their human capital because of
disability, old age, or other factors. Others may require temporary support because of factorsbeyond their control such as natural disasters or the financial crisis. In this respect policieswould ensure that benefits get to the right people and provide sufficient protection to allowthem to take the prudent risks needed to participate fully in today’s global economy.
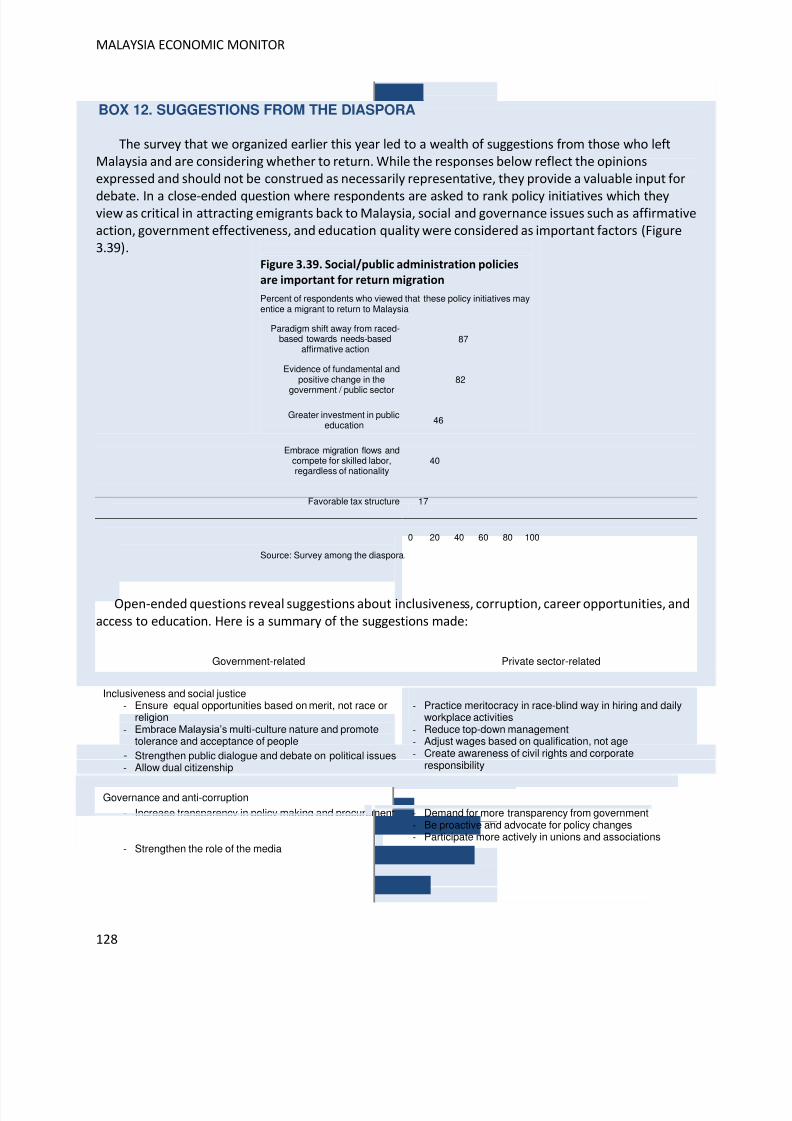
8/6/2019 World Bank Economic Monitor - Malaysia Brain Drain (April 2011)
http://slidepdf.com/reader/full/world-bank-economic-monitor-malaysia-brain-drain-april-2011 128/150
MALAYSIA ECONOMIC MONITOR
128
BOX 12. SUGGESTIONS FROM THE DIASPORA
The survey that we organized earlier this year led to a wealth of suggestions from those who leftMalaysia and are considering whether to return. While the responses below reflect the opinionsexpressed and should not be construed as necessarily representative, they provide a valuable input for
debate. In a close-ended question where respondents are asked to rank policy initiatives which theyview as critical in attracting emigrants back to Malaysia, social and governance issues such as affirmativeaction, government effectiveness, and education quality were considered as important factors (Figure3.39).
Figure 3.39. Social/public administration policies
are important for return migration
Percent of respondents who viewed that these policy initiatives mayentice a migrant to return to Malaysia
Source: Survey among the diaspora.
Open-ended questions reveal suggestions about inclusiveness, corruption, career opportunities, and
access to education. Here is a summary of the suggestions made:
Government-related Private sector-related
Inclusiveness and social justice- Ensure equal opportunities based on merit, not race or
religion- Embrace Malaysia’s multi-culture nature and promote
tolerance and acceptance of people- Strengthen public dialogue and debate on political issues - Allow dual citizenship
- Practice meritocracy in race-blind way in hiring and dailyworkplace activities
- Reduce top-down management- Adjust wages based on qualification, not age- Create awareness of civil rights and corporate
responsibility
Governance and anti-corruption
- Increase transparency in policy making and procurementthrough open tenders, clear selection criteria
- Reduce corruption especially in enforcing agencies- Strengthen the role of the media
- Demand for more transparency from government- Be proactive and advocate for policy changes- Participate more actively in unions and associations
17
40
46
82
87
0 20 40 60 80 100
Favorable tax structure
Embrace migration flows andcompete for skilled labor,regardless of nationality
Greater investment in publiceducation
Evidence of fundamental andpositive change in the
government / public sector
Paradigm shift away from raced-based towards needs-based
affirmative action
8/6/2019 World Bank Economic Monitor - Malaysia Brain Drain (April 2011)
http://slidepdf.com/reader/full/world-bank-economic-monitor-malaysia-brain-drain-april-2011 129/150
BRAIN DRAIN
129
Economic management and career prospects
- Reduce government intervention in the economy- Open up services sectors such as legal services to
foreign firms- Improve labor regulations- Promote the creation of high-paid, high-productivity job
opportunities
- Ensure wage increases to keep up with rising cost ofliving
- Improve physical public infrastructure, e.g. electricity andbroadband
- Let the ringgit appreciate more strongly
- Adopt systems of international standards in pay andbenefits
- Recruit Malaysians studying overseas to return withcompetitive remuneration packages, internship, training,career advancement opportunities, and work-life balance
- Create global business competitions linked to scholarship
awards- Create partnerships to allow foreign-educated Malaysian
students to work with foreign partners for a few years priorto returning to Malaysia to serve out their contracts
- Encourage environment for creativity and collaboration
Education - Disconnect racial issues from tertiary education- Open up the opportunities for non-Bumiputera students
to join the local university based on meritocracy- Strengthen teaching and research quality of personnel at
tertiary education institutions
Living conditions - Ensure safer communities through stronger law
enforcement- Promote affordable housing and public transportation- Improve healthcare service quality- Improve natural resources management to preserve
nature
Targeted Approaches
While comprehensive approaches to boost productivity and inclusiveness are necessary, they maynot be sufficient. For Malaysia to retain, attract or re-attract the best and brightest in support of thehigh-income objective it also needs to proactively participate in the global competition for talent. In
addition, Malaysia can also engage with the diaspora in other ways than influencing the flow of talent.
Competing for Talent
Participating in today’s global competition for talent requires developing Malaysia into a location of choice, where people want to live, work, raise a family and retire. Given the expanded set of optionsavailable in today’s globalized world, talented individuals may be choosing a location first before theychoose a job. As a result, the source of competitiveness of a region has become increasingly tied toquality of life considerations and the ability of the region to attract on this basis talented individuals.77
77A key factor here is to transform urban areas, where economic activity tends to be concentrated, into sticky
places that spur creativity and innovation. These sticky places serve as magnets for creative and high-skilled
individuals. This must go beyond addressing bads such as crime and congestion, but transform the cityfundamentally into a livable and sustainable space.
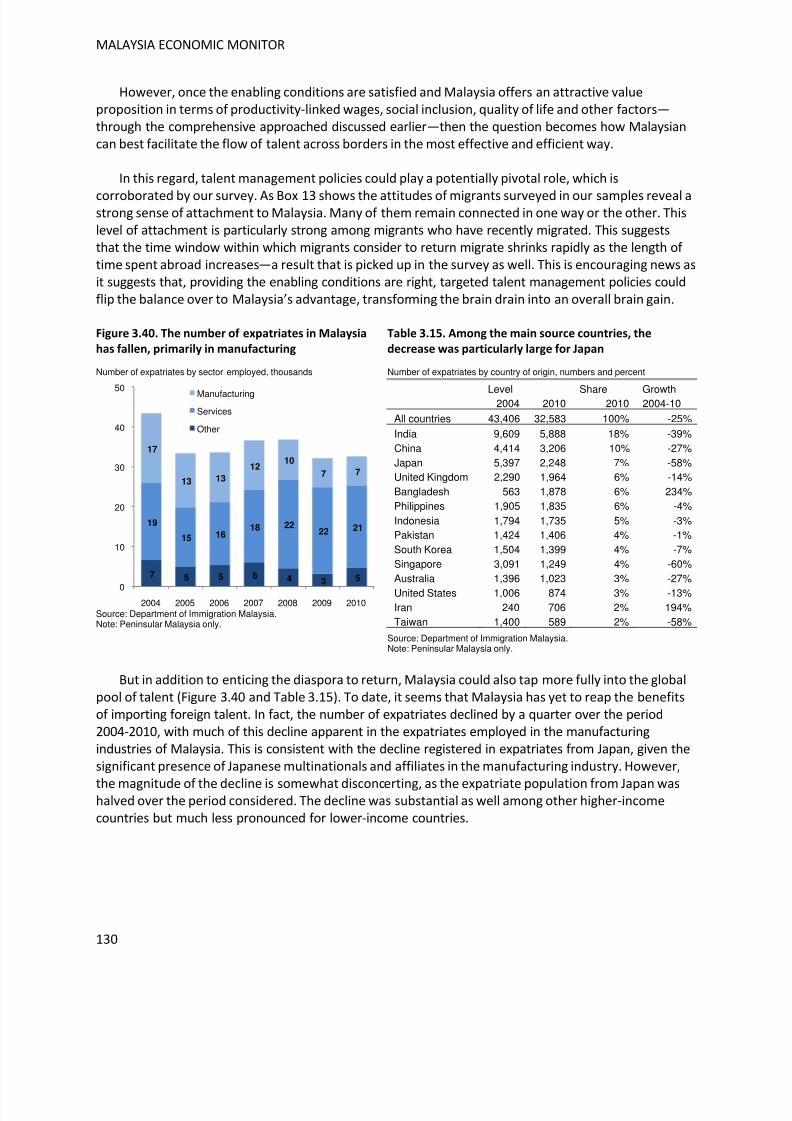
8/6/2019 World Bank Economic Monitor - Malaysia Brain Drain (April 2011)
http://slidepdf.com/reader/full/world-bank-economic-monitor-malaysia-brain-drain-april-2011 130/150
MALAYSIA ECONOMIC MONITOR
130
However, once the enabling conditions are satisfied and Malaysia offers an attractive valueproposition in terms of productivity-linked wages, social inclusion, quality of life and other factors—through the comprehensive approached discussed earlier—then the question becomes how Malaysiancan best facilitate the flow of talent across borders in the most effective and efficient way.
In this regard, talent management policies could play a potentially pivotal role, which is
corroborated by our survey. As Box 13 shows the attitudes of migrants surveyed in our samples reveal astrong sense of attachment to Malaysia. Many of them remain connected in one way or the other. Thislevel of attachment is particularly strong among migrants who have recently migrated. This suggeststhat the time window within which migrants consider to return migrate shrinks rapidly as the length of time spent abroad increases—a result that is picked up in the survey as well. This is encouraging news asit suggests that, providing the enabling conditions are right, targeted talent management policies couldflip the balance over to Malaysia’s advantage, transforming the brain drain into an overall brain gain.
Figure 3.40. The number of expatriates in Malaysia
has fallen, primarily in manufacturing
Number of expatriates by sector employed, thousands
Source: Department of Immigration Malaysia.Note: Peninsular Malaysia only.
Table 3.15. Among the main source countries, the
decrease was particularly large for Japan
Number of expatriates by country of origin, numbers and percent
Level Share Growth2004 2010 2010 2004-10
All countries 43,406 32,583 100% -25%
India 9,609 5,888 18% -39%China 4,414 3,206 10% -27%Japan 5,397 2,248 7% -58%United Kingdom 2,290 1,964 6% -14%Bangladesh 563 1,878 6% 234%Philippines 1,905 1,835 6% -4%Indonesia 1,794 1,735 5% -3%Pakistan 1,424 1,406 4% -1%South Korea 1,504 1,399 4% -7%Singapore 3,091 1,249 4% -60%Australia 1,396 1,023 3% -27%
United States 1,006 874 3% -13%Iran 240 706 2% 194%Taiwan 1,400 589 2% -58%
Source: Department of Immigration Malaysia.Note: Peninsular Malaysia only.
But in addition to enticing the diaspora to return, Malaysia could also tap more fully into the globalpool of talent (Figure 3.40 and Table 3.15). To date, it seems that Malaysia has yet to reap the benefitsof importing foreign talent. In fact, the number of expatriates declined by a quarter over the period2004-2010, with much of this decline apparent in the expatriates employed in the manufacturingindustries of Malaysia. This is consistent with the decline registered in expatriates from Japan, given thesignificant presence of Japanese multinationals and affiliates in the manufacturing industry. However,
the magnitude of the decline is somewhat disconcerting, as the expatriate population from Japan washalved over the period considered. The decline was substantial as well among other higher-incomecountries but much less pronounced for lower-income countries.
7 5 5 6 4 3 5
19
15 1618 22
22 21
17
13 13
1210
7 7
0
10
20
30
40
50
2004 2005 2006 2007 2008 2009 2010
Manufacturing
Services
Other
8/6/2019 World Bank Economic Monitor - Malaysia Brain Drain (April 2011)
http://slidepdf.com/reader/full/world-bank-economic-monitor-malaysia-brain-drain-april-2011 131/150
BRAIN DRAIN
131
A few qualifications are in order before we can interpret the decline in expatriate statistics.Expatriates are defined as professional or skilled foreign workers that stay or remain temporarily inMalaysia for the purpose of employment. They are issued an Employment Pass or Work Pass (in the caseof Sabah) for a minimum period of two years and entitled to a salary of not less than RM1,200 permonth. However, the minimum salary requirement has been changed to RM5,000 starting from 2008.However, following this change, some sectors, such as in ICT, health (nurses), education (international
school teachers), could not afford to hire expatriates at this salary level, where other, such as in oil andgas, could not comply with the period of two years (in some cases, their contract lasts for only 6 month).To address such cases, the Immigration Department issued a Temporary Visit Pass. The statistics showncomprise of both categories. However, they only consist of the expatriate population on the peninsula.
How to interpret the decline in the expatriate population resident in Malaysia? Clearly, one factorhas been the global economic crisis, which affected not only the movement of capital across borders(particularly FDI) but also that of professional workers. Indeed, following an initial decline after 2004,
the numbers were growing steadily, a process that was interrupted in 2009. The Malaysian authoritiesalso report that the decline may be a result of stricter enforcement by the expatriate committee (JKPD)to minimize fraudulent cases. At the same time rigid conditions and criteria in applying for anEmployment Pass may have played a role as well. 78
Looking ahead, as skills demand in the Malaysian economy is expected to rise, it will be important toreverse these trends. In this respect, it is important to discard the idea that foreign and Malaysian skilledworkers are perfect substitutes. On the contrary, they are strong complements. Knowledge workersinteract with one another in ways that lead to exponential benefits and increase the productivity of all(rather like the internet—the more the number of users, the more powerful is the web).
Visa and restrictive employment requirements on foreign skilled workers are proving to be a criticaland binding constraint preventing companies from accessing the skills needed to move up the value
chain. Therefore, it is helpful to introduce a fast-track procedure for work permits for high-tech andhigh-skilled businesses and individuals, and for work in research and universities. At this moment the
tardiness of getting for example foreign lecturers approved means that by the time they are given theapproval they have picked another job elsewhere.
Returning migrants are most likely to be attracted by programs which welcome them and theirfamilies to stay, provide security through granting permanent residency, and offer them an environmentin which they can innovate and build a new business. Overregulation of the services sector, in particular,is a major barrier for returning migrants. Qualifications obtained abroad are not recognized domesticallyand criteria other than quality may be applied. All pharmacists getting a license to work in Malaysiamust first work for the government for three years. Such measures discourage those who have goneabroad from coming home.
78Based on feedback received from Department of Immigration and Economic Planning Unit. Note that the
rigidities with respect to the Employment Pass are now being addressed—see a bit further in the text.
8/6/2019 World Bank Economic Monitor - Malaysia Brain Drain (April 2011)
http://slidepdf.com/reader/full/world-bank-economic-monitor-malaysia-brain-drain-april-2011 132/150
MALAYSIA ECONOMIC MONITOR
132
Malaysia could also allow for the greater inflow of foreign students in universities, which canprovide a welcome source of revenue and also deepen linkages with local providers of services to theuniversity. Elite universities can be important exporters of services and can be significant revenuegenerators for the local economy. Also important are the potential spillover effects. University teachingand research in the life sciences has the potential to generate synergies with the hospital sector, whereMalaysia is a growing exporter of medical services. Finally, once foreign students graduate they could be
offered the opportunity to put their skills to good use in Malaysia.
Malaysia has recently established the Talent Corporation, which has been tasked to coordinateefforts in these areas. Two recent initiatives target expatriate and returning migrants respectively:
- Residence Pass (RP). RP holders can work and live in Malaysia up to ten years and canchange employers without having to renew the pass. Any foreign talent who has been livingand working in Malaysia for at least 3 years on a continuous basis. Preference would be
given though to experts in areas relating to the National Key Economic Activities (NKEAs), aswell as ICT, aeronautics and biotech.79 The RP would allow foreigners who are posted inMalaysia with a multinational to have the option to stay longer at the end of their tour of duty. The RP would also provide an option to come back to those who may no longer beMalaysian, such as children of Malaysians who have moved overseas for education.
- Returning Experts Programme (REP). Malaysian professionals working abroad are offered aflat income tax rate of 15 percent for five years. The low tax rate would ensure greatercompetitiveness with respect to other countries, which have lower marginal tax rates (butalso different tax brackets) such as Hong Kong and Singapore. Diploma holders with at least10 years of overseas work experience would qualify for the REP if they have the relevantindustry experience in any of the NKEAs. In the past these efforts were managed under theExpert Scheme introduced in 2001, which up till the end of 2010 managed to attract 750
people with expertise in various fields.
79The NKEAs consist of 11 economic sectors (oil, gas and energy; palm oil; financial services; tourism; business
services; electronics and electrical; wholesale and retail; education; healthcare; communications content andinfrastructure; agriculture) and 1 geographical sector (greater Kuala Lumpur and Klang Valley).
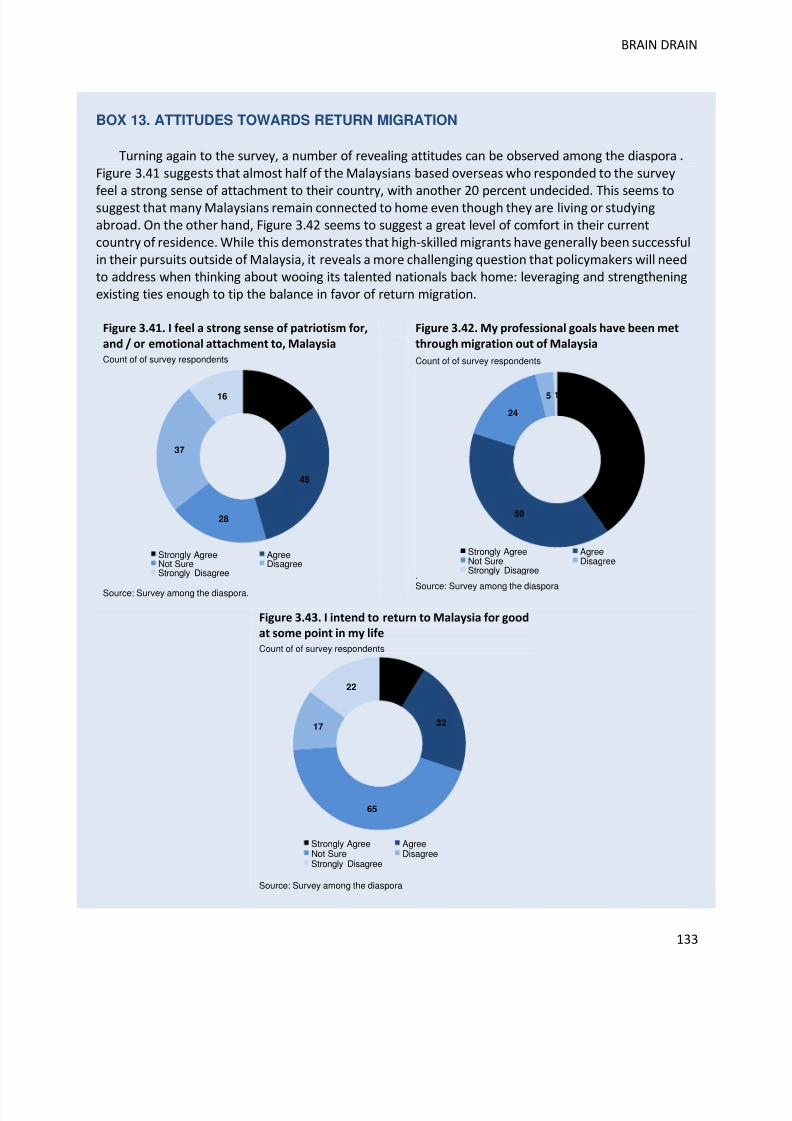
8/6/2019 World Bank Economic Monitor - Malaysia Brain Drain (April 2011)
http://slidepdf.com/reader/full/world-bank-economic-monitor-malaysia-brain-drain-april-2011 133/150
BRAIN DRAIN
133
BOX 13. ATTITUDES TOWARDS RETURN MIGRATION
Turning again to the survey, a number of revealing attitudes can be observed among the diaspora .Figure 3.41 suggests that almost half of the Malaysians based overseas who responded to the survey
feel a strong sense of attachment to their country, with another 20 percent undecided. This seems tosuggest that many Malaysians remain connected to home even though they are living or studyingabroad. On the other hand, Figure 3.42 seems to suggest a great level of comfort in their currentcountry of residence. While this demonstrates that high-skilled migrants have generally been successfulin their pursuits outside of Malaysia, it reveals a more challenging question that policymakers will needto address when thinking about wooing its talented nationals back home: leveraging and strengtheningexisting ties enough to tip the balance in favor of return migration.
Figure 3.41. I feel a strong sense of patriotism for,
and / or emotional attachment to, Malaysia
Count of of survey respondents
Source: Survey among the diaspora.
Figure 3.42. My professional goals have been met
through migration out of Malaysia
Count of of survey respondents
.
Source: Survey among the diaspora
Figure 3.43. I intend to return to Malaysia for good
at some point in my life
Count of of survey respondents
Source: Survey among the diaspora
23
45
28
37
16
Strongly Agree AgreeNot Sure DisagreeStrongly Disagree
60
59
24
5 1
Strongly Agree AgreeNot Sure DisagreeStrongly Disagree
13
32
65
17
22
Strongly Agree AgreeNot Sure DisagreeStrongly Disagree
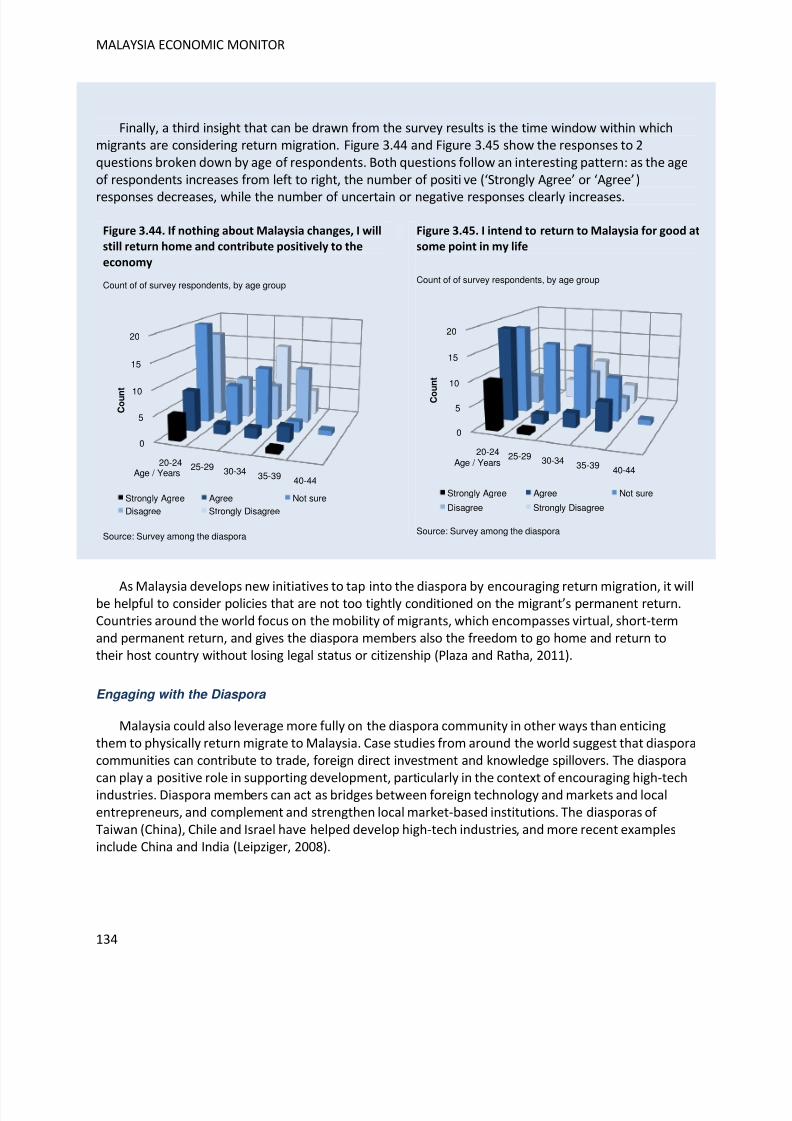
8/6/2019 World Bank Economic Monitor - Malaysia Brain Drain (April 2011)
http://slidepdf.com/reader/full/world-bank-economic-monitor-malaysia-brain-drain-april-2011 134/150
MALAYSIA ECONOMIC MONITOR
134
Finally, a third insight that can be drawn from the survey results is the time window within whichmigrants are considering return migration. Figure 3.44 and Figure 3.45 show the responses to 2questions broken down by age of respondents. Both questions follow an interesting pattern: as the ageof respondents increases from left to right, the number of positive (‘Strongly Agree’ or ‘Agree’)
responses decreases, while the number of uncertain or negative responses clearly increases.
Figure 3.44. If nothing about Malaysia changes, I will
still return home and contribute positively to the
economy
Count of of survey respondents, by age group
Source: Survey among the diaspora
Figure 3.45. I intend to return to Malaysia for good at
some point in my life
Count of of survey respondents, by age group
Source: Survey among the diaspora
As Malaysia develops new initiatives to tap into the diaspora by encouraging return migration, it willbe helpful to consider policies that are not too tightly conditioned on the migrant’s permanent return.Countries around the world focus on the mobility of migrants, which encompasses virtual, short-termand permanent return, and gives the diaspora members also the freedom to go home and return totheir host country without losing legal status or citizenship (Plaza and Ratha, 2011).
Engaging with the Diaspora
Malaysia could also leverage more fully on the diaspora community in other ways than enticingthem to physically return migrate to Malaysia. Case studies from around the world suggest that diasporacommunities can contribute to trade, foreign direct investment and knowledge spillovers. The diasporacan play a positive role in supporting development, particularly in the context of encouraging high-techindustries. Diaspora members can act as bridges between foreign technology and markets and localentrepreneurs, and complement and strengthen local market-based institutions. The diasporas of Taiwan (China), Chile and Israel have helped develop high-tech industries, and more recent examplesinclude China and India (Leipziger, 2008).
0
5
10
15
20
20-24 25-29 30-34 35-39 40-44
C o u n
t
Age / Years
Strongly Agree Agree Not sure
Disagree Strongly Disagree
0
5
10
15
20
20-24 25-29 30-34 35-39 40-44
C o
u n t
Age / Years
Strongly Agree Agree Not sure
Disagree Strongly Disagree
8/6/2019 World Bank Economic Monitor - Malaysia Brain Drain (April 2011)
http://slidepdf.com/reader/full/world-bank-economic-monitor-malaysia-brain-drain-april-2011 135/150
BRAIN DRAIN
135
The diaspora can contribute significantly to developing trade. At one level, this is reflected in thedemand from diaspora members for ‘nostalgic products’—i.e., Malaysia-specific products that are notproduced overseas—even though the impact of this might be limited since these products would havebeen consumed as well if no migration had taken place. At another level, diaspora members can assistexporters from Malaysia to find buyers, improve their knowledge of the market, and comply withgovernment requirements and standards. Activities around the world have included: the creation of
Diaspora Trade Councils and participation in trade missions and business networks (Plaza and Ratha,2011).
Members of the diapora are also sought after to facilitate foreign multinationals and other firms toinvest in Malaysia. Diaspora members can provide context and resolve uncertainty as foreignmultinationals approach them. Diaspora members themselves can also invest directly in Malaysia—andthey might be willing to take more risk doing so for their home country as they are also better placed toevaluate opportunities and possess contacts to facilitate the process (Lucas, 2001). Business forums
could be established overseas and investment promotion agencies could engage more actively with thediaspora.
Malaysia could also engage by developing direct and indirect financial linkages. An example of thelatter is the creation of the diaspora investment funds, where the diaspora could actively contribute inthe development of particular domestic sectors. An example of the former would be to engage withforeign venture capital firms. There are various firms in, for example, Silicon Valley who focus onexporting entrepreneurial ecosystems and providing seed-, early- and growth-stage capital forinnovative ventures coupled with local entrepreneurial talent.80
The ability to hold dual or multiple citizenship provides an essential link between the diaspora andthe home country. Citizenship and residency rights are important determinants of a diaspora’sparticipation in trade, investment and technology transfer with the origin country (Cheran, 2004). Some
origin countries do not allow dual citizenship but offer identity card schemes in destination countries,which could also help. Similarly, the granting of voting rights could also help strengthen links with the
diaspora. Some countries even reserve a specific number of seats in parliament for diasporarepresentatives (Plaza and Ratha, 2011).
The diaspora can thus act as ‘global search networks’ for developing local industries. For example,key members of the Taiwanese government and leading overseas engineers in Silicon Valley played sucha role in the establishment of a successful venture capital industry in Taiwan (China). However,harnessing the enthusiasm, commitment and resources of the diaspora can be challenging. Creation of arobust diaspora network requires time, patience and institutional capabilities. Furthermore, it can bechallenging to turn ‘discussions’ (e.g. through conferences, websites and online communications) into‘projects’. (Kuznetsov and Sabel, 2008).
80In the context of an ongoing World Bank study on how Malaysia can move up the value chain in its
manufacturing industries, we have met with a group of Arab-American venture capitalists, who intend to expandtheir operations around the world—including Malaysia.
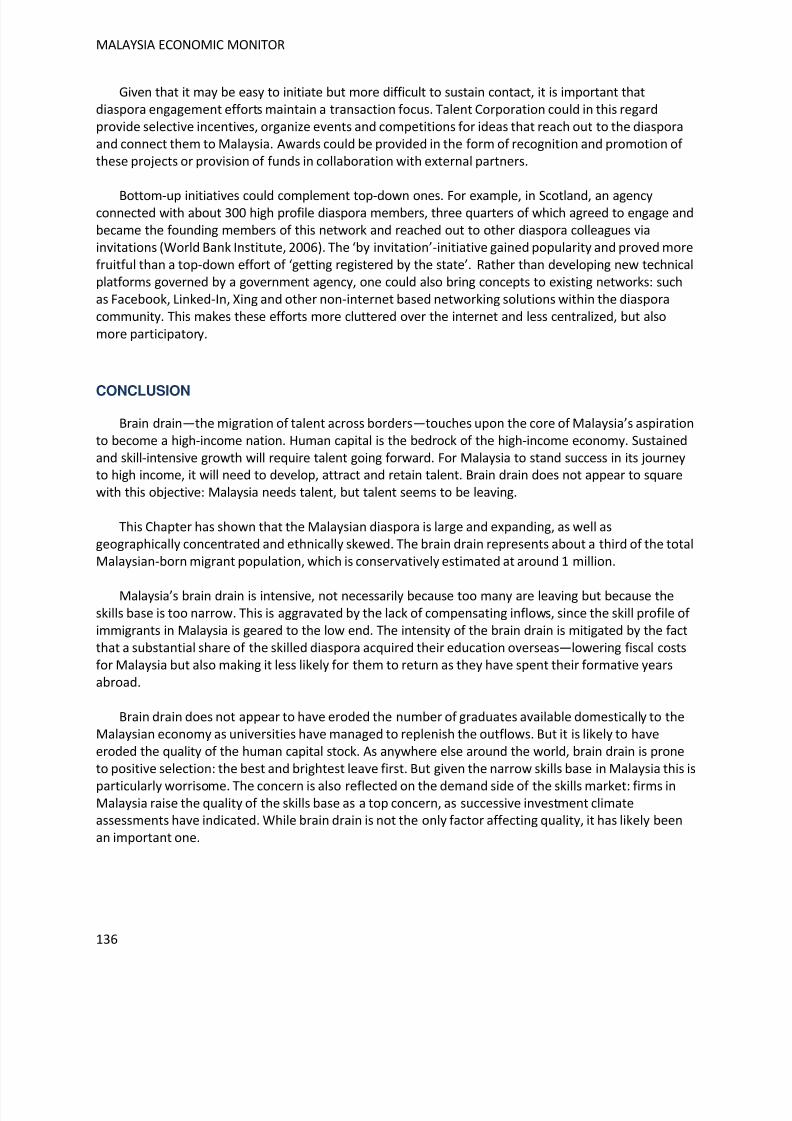
8/6/2019 World Bank Economic Monitor - Malaysia Brain Drain (April 2011)
http://slidepdf.com/reader/full/world-bank-economic-monitor-malaysia-brain-drain-april-2011 136/150
MALAYSIA ECONOMIC MONITOR
136
Given that it may be easy to initiate but more difficult to sustain contact, it is important thatdiaspora engagement efforts maintain a transaction focus. Talent Corporation could in this regardprovide selective incentives, organize events and competitions for ideas that reach out to the diasporaand connect them to Malaysia. Awards could be provided in the form of recognition and promotion of these projects or provision of funds in collaboration with external partners.
Bottom-up initiatives could complement top-down ones. For example, in Scotland, an agencyconnected with about 300 high profile diaspora members, three quarters of which agreed to engage andbecame the founding members of this network and reached out to other diaspora colleagues viainvitations (World Bank Institute, 2006). The ‘by invitation’-initiative gained popularity and proved morefruitful than a top-down effort of ‘getting registered by the state’. Rather than developing new technicalplatforms governed by a government agency, one could also bring concepts to existing networks: suchas Facebook, Linked-In, Xing and other non-internet based networking solutions within the diasporacommunity. This makes these efforts more cluttered over the internet and less centralized, but also
more participatory.
CONCLUSION
Brain drain—the migration of talent across borders—touches upon the core of Malaysia’s aspirationto become a high-income nation. Human capital is the bedrock of the high-income economy. Sustainedand skill-intensive growth will require talent going forward. For Malaysia to stand success in its journeyto high income, it will need to develop, attract and retain talent. Brain drain does not appear to squarewith this objective: Malaysia needs talent, but talent seems to be leaving.
This Chapter has shown that the Malaysian diaspora is large and expanding, as well asgeographically concentrated and ethnically skewed. The brain drain represents about a third of the totalMalaysian-born migrant population, which is conservatively estimated at around 1 million.
Malaysia’s brain drain is intensive, not necessarily because too many are leaving but because theskills base is too narrow. This is aggravated by the lack of compensating inflows, since the skill profile of immigrants in Malaysia is geared to the low end. The intensity of the brain drain is mitigated by the factthat a substantial share of the skilled diaspora acquired their education overseas—lowering fiscal costsfor Malaysia but also making it less likely for them to return as they have spent their formative yearsabroad.
Brain drain does not appear to have eroded the number of graduates available domestically to theMalaysian economy as universities have managed to replenish the outflows. But it is likely to haveeroded the quality of the human capital stock. As anywhere else around the world, brain drain is proneto positive selection: the best and brightest leave first. But given the narrow skills base in Malaysia this is
particularly worrisome. The concern is also reflected on the demand side of the skills market: firms inMalaysia raise the quality of the skills base as a top concern, as successive investment climateassessments have indicated. While brain drain is not the only factor affecting quality, it has likely beenan important one.
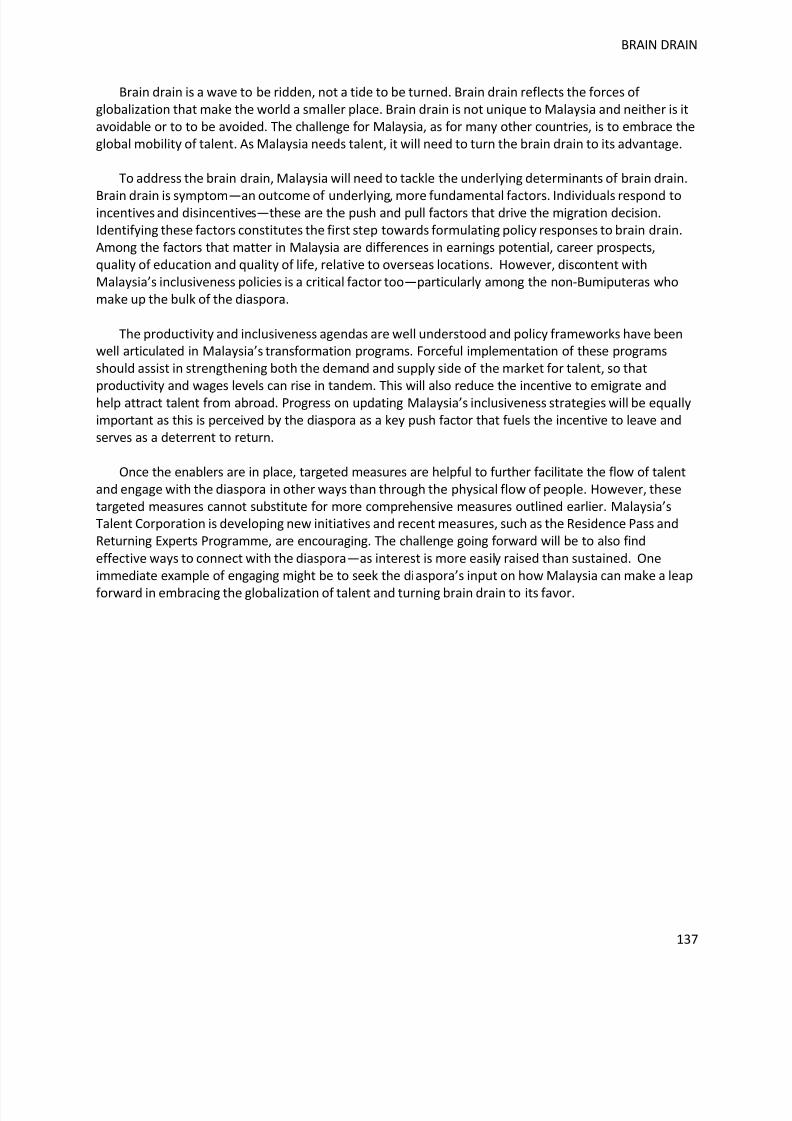
8/6/2019 World Bank Economic Monitor - Malaysia Brain Drain (April 2011)
http://slidepdf.com/reader/full/world-bank-economic-monitor-malaysia-brain-drain-april-2011 137/150
BRAIN DRAIN
137
Brain drain is a wave to be ridden, not a tide to be turned. Brain drain reflects the forces of globalization that make the world a smaller place. Brain drain is not unique to Malaysia and neither is itavoidable or to to be avoided. The challenge for Malaysia, as for many other countries, is to embrace theglobal mobility of talent. As Malaysia needs talent, it will need to turn the brain drain to its advantage.
To address the brain drain, Malaysia will need to tackle the underlying determinants of brain drain.
Brain drain is symptom—an outcome of underlying, more fundamental factors. Individuals respond toincentives and disincentives—these are the push and pull factors that drive the migration decision.Identifying these factors constitutes the first step towards formulating policy responses to brain drain.Among the factors that matter in Malaysia are differences in earnings potential, career prospects,quality of education and quality of life, relative to overseas locations. However, discontent withMalaysia’s inclusiveness policies is a critical factor too—particularly among the non-Bumiputeras whomake up the bulk of the diaspora.
The productivity and inclusiveness agendas are well understood and policy frameworks have beenwell articulated in Malaysia’s transformation programs. Forceful implementation of these programsshould assist in strengthening both the demand and supply side of the market for talent, so thatproductivity and wages levels can rise in tandem. This will also reduce the incentive to emigrate andhelp attract talent from abroad. Progress on updating Malaysia’s inclusiveness strategies will be equallyimportant as this is perceived by the diaspora as a key push factor that fuels the incentive to leave andserves as a deterrent to return.
Once the enablers are in place, targeted measures are helpful to further facilitate the flow of talentand engage with the diaspora in other ways than through the physical flow of people. However, thesetargeted measures cannot substitute for more comprehensive measures outlined earlier. Malaysia’sTalent Corporation is developing new initiatives and recent measures, such as the Residence Pass andReturning Experts Programme, are encouraging. The challenge going forward will be to also find
effective ways to connect with the diaspora—as interest is more easily raised than sustained. Oneimmediate example of engaging might be to seek the diaspora’s input on how Malaysia can make a leap
forward in embracing the globalization of talent and turning brain drain to its favor.
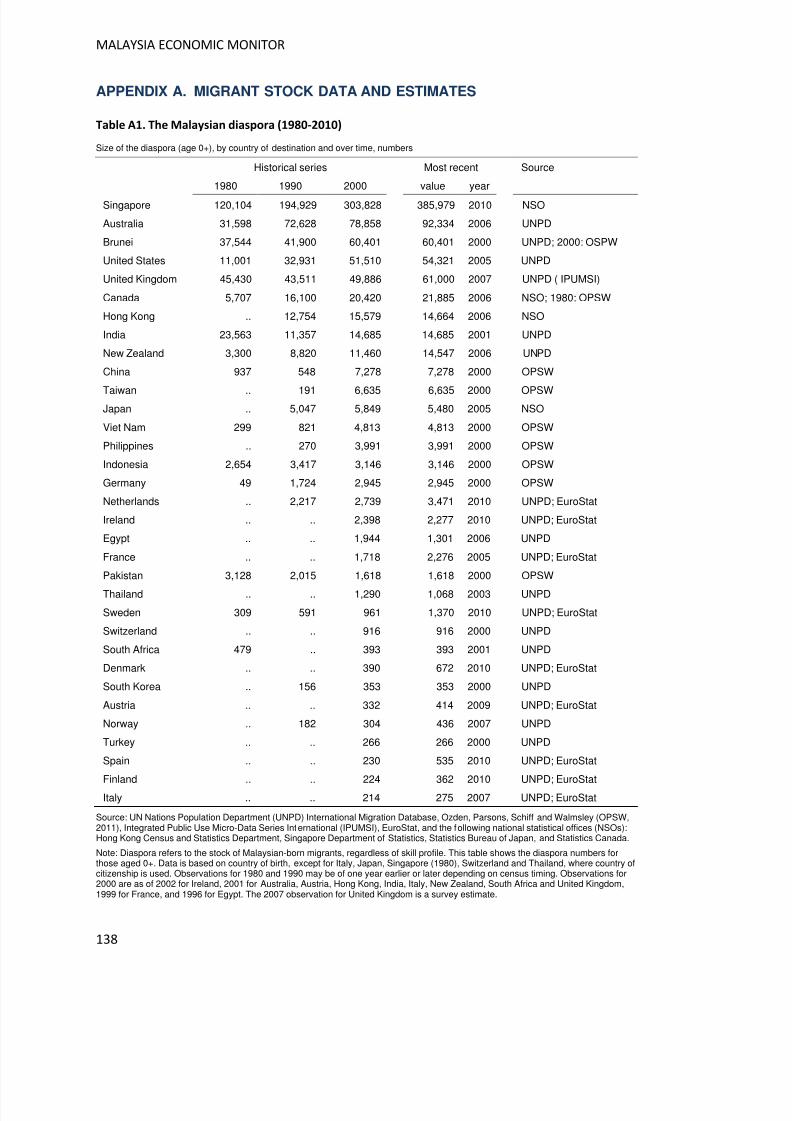
8/6/2019 World Bank Economic Monitor - Malaysia Brain Drain (April 2011)
http://slidepdf.com/reader/full/world-bank-economic-monitor-malaysia-brain-drain-april-2011 138/150
MALAYSIA ECONOMIC MONITOR
138
APPENDIX A. MIGRANT STOCK DATA AND ESTIMATES
Table A1. The Malaysian diaspora (1980-2010)
Size of the diaspora (age 0+), by country of destination and over time, numbers
Historical series Most recent Source
1980 1990 2000 value year
Singapore 120,104 194,929 303,828 385,979 2010 NSO
Australia 31,598 72,628 78,858 92,334 2006 UNPD
Brunei 37,544 41,900 60,401 60,401 2000 UNPD; 2000: OSPW
United States 11,001 32,931 51,510 54,321 2005 UNPD
United Kingdom 45,430 43,511 49,886 61,000 2007 UNPD ( IPUMSI)
Canada 5,707 16,100 20,420 21,885 2006 NSO; 1980: OPSW
Hong Kong .. 12,754 15,579 14,664 2006 NSO
India 23,563 11,357 14,685 14,685 2001 UNPD
New Zealand 3,300 8,820 11,460 14,547 2006 UNPD
China 937 548 7,278 7,278 2000 OPSW
Taiwan .. 191 6,635 6,635 2000 OPSWJapan .. 5,047 5,849 5,480 2005 NSO
Viet Nam 299 821 4,813 4,813 2000 OPSW
Philippines .. 270 3,991 3,991 2000 OPSW
Indonesia 2,654 3,417 3,146 3,146 2000 OPSW
Germany 49 1,724 2,945 2,945 2000 OPSW
Netherlands .. 2,217 2,739 3,471 2010 UNPD; EuroStat
Ireland .. .. 2,398 2,277 2010 UNPD; EuroStat
Egypt .. .. 1,944 1,301 2006 UNPD
France .. .. 1,718 2,276 2005 UNPD; EuroStat
Pakistan 3,128 2,015 1,618 1,618 2000 OPSW
Thailand .. .. 1,290 1,068 2003 UNPD
Sweden 309 591 961 1,370 2010 UNPD; EuroStat
Switzerland .. .. 916 916 2000 UNPD
South Africa 479 .. 393 393 2001 UNPD
Denmark .. .. 390 672 2010 UNPD; EuroStat
South Korea .. 156 353 353 2000 UNPD
Austria .. .. 332 414 2009 UNPD; EuroStat
Norway .. 182 304 436 2007 UNPD
Turkey .. .. 266 266 2000 UNPD
Spain .. .. 230 535 2010 UNPD; EuroStat
Finland .. .. 224 362 2010 UNPD; EuroStat
Italy .. .. 214 275 2007 UNPD; EuroStat
Source: UN Nations Population Department (UNPD) International Migration Database, Ozden, Parsons, Schiff and Walmsley (OPSW,2011), Integrated Public Use Micro-Data Series International (IPUMSI), EuroStat, and the following national statistical offices (NSOs):Hong Kong Census and Statistics Department, Singapore Department of Statistics, Statistics Bureau of Japan, and Statistics Canada.
Note: Diaspora refers to the stock of Malaysian-born migrants, regardless of skill profile. This table shows the diaspora numbers forthose aged 0+. Data is based on country of birth, except for Italy, Japan, Singapore (1980), Switzerland and Thailand, where country ofcitizenship is used. Observations for 1980 and 1990 may be of one year earlier or later depending on census timing. Observations for2000 are as of 2002 for Ireland, 2001 for Australia, Austria, Hong Kong, India, Italy, New Zealand, South Africa and United Kingdom,1999 for France, and 1996 for Egypt. The 2007 observation for United Kingdom is a survey estimate.
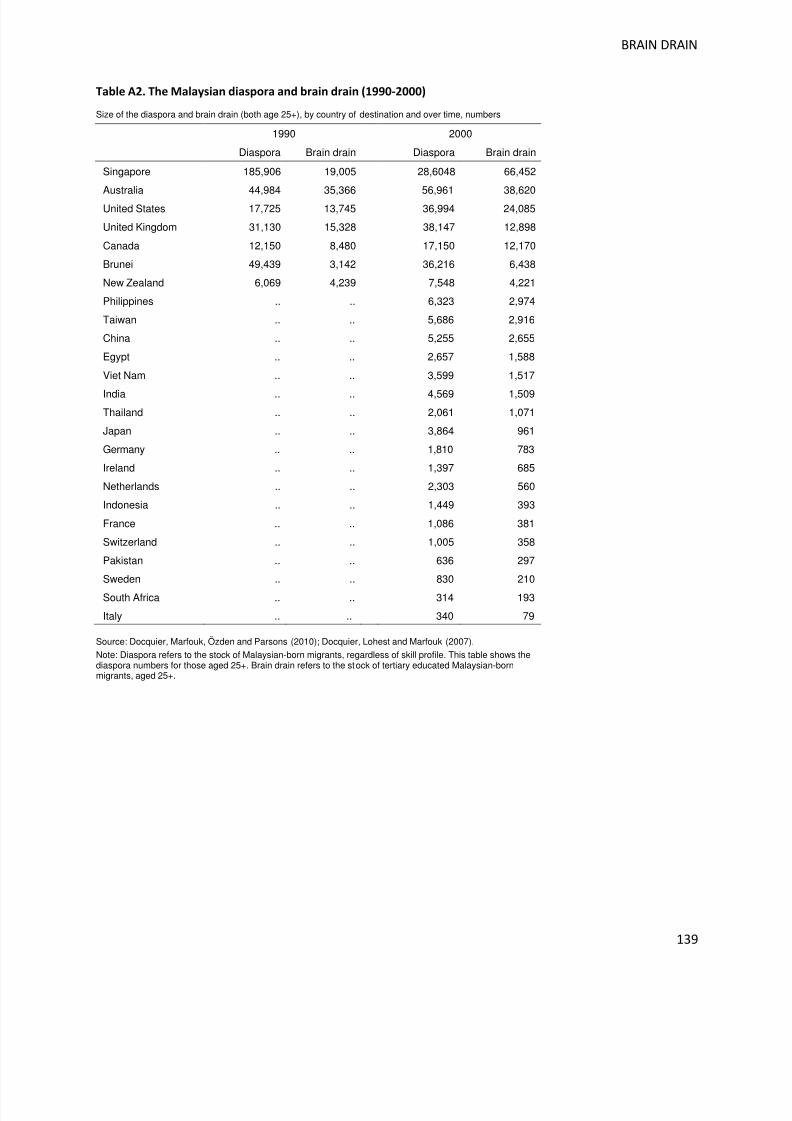
8/6/2019 World Bank Economic Monitor - Malaysia Brain Drain (April 2011)
http://slidepdf.com/reader/full/world-bank-economic-monitor-malaysia-brain-drain-april-2011 139/150
BRAIN DRAIN
139
Table A2. The Malaysian diaspora and brain drain (1990-2000)
Size of the diaspora and brain drain (both age 25+), by country of destination and over time, numbers
1990 2000
Diaspora Brain drain Diaspora Brain drain
Singapore 185,906 19,005 28,6048 66,452
Australia 44,984 35,366 56,961 38,620
United States 17,725 13,745 36,994 24,085
United Kingdom 31,130 15,328 38,147 12,898
Canada 12,150 8,480 17,150 12,170
Brunei 49,439 3,142 36,216 6,438
New Zealand 6,069 4,239 7,548 4,221
Philippines .. .. 6,323 2,974
Taiwan .. .. 5,686 2,916
China .. .. 5,255 2,655
Egypt .. .. 2,657 1,588
Viet Nam .. .. 3,599 1,517
India .. .. 4,569 1,509Thailand .. .. 2,061 1,071
Japan .. .. 3,864 961
Germany .. .. 1,810 783
Ireland .. .. 1,397 685
Netherlands .. .. 2,303 560
Indonesia .. .. 1,449 393
France .. .. 1,086 381
Switzerland .. .. 1,005 358
Pakistan .. .. 636 297
Sweden .. .. 830 210
South Africa .. .. 314 193
Italy .. .. 340 79
Source: Docquier, Marfouk, Özden and Parsons (2010); Docquier, Lohest and Marfouk (2007).
Note: Diaspora refers to the stock of Malaysian-born migrants, regardless of skill profile. This table shows thediaspora numbers for those aged 25+. Brain drain refers to the stock of tertiary educated Malaysian-bornmigrants, aged 25+.
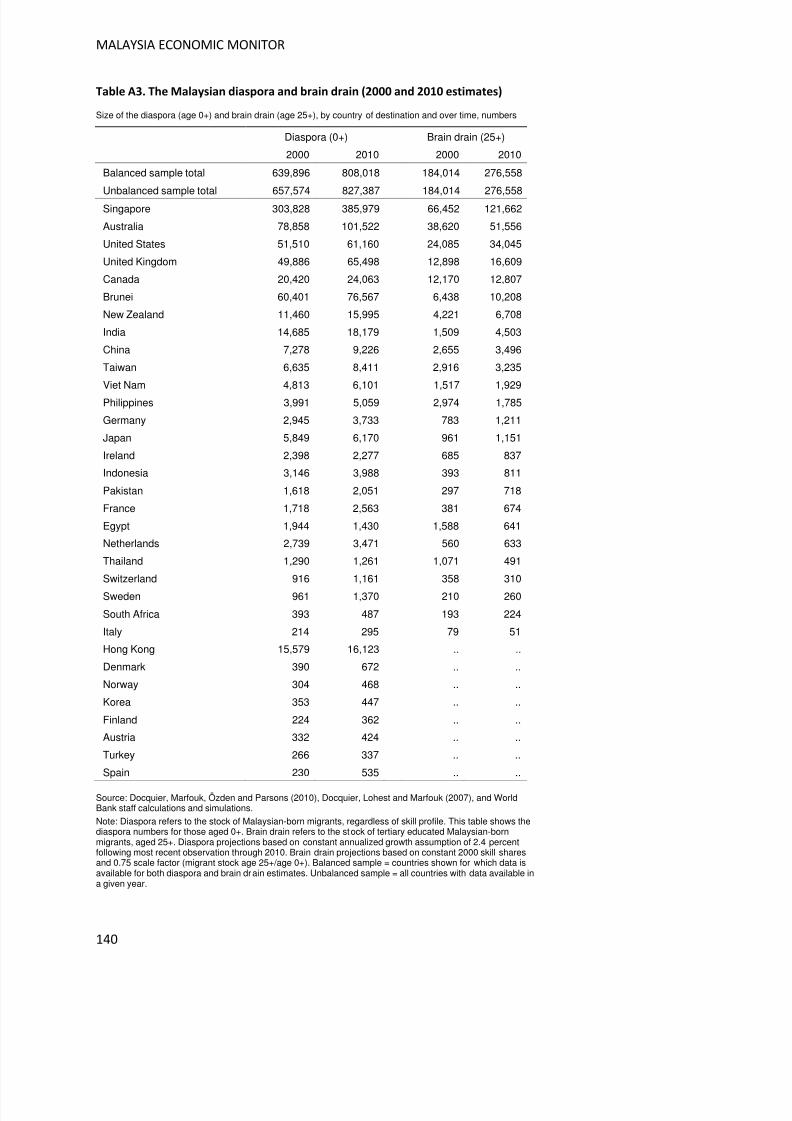
8/6/2019 World Bank Economic Monitor - Malaysia Brain Drain (April 2011)
http://slidepdf.com/reader/full/world-bank-economic-monitor-malaysia-brain-drain-april-2011 140/150
MALAYSIA ECONOMIC MONITOR
140
Table A3. The Malaysian diaspora and brain drain (2000 and 2010 estimates)
Size of the diaspora (age 0+) and brain drain (age 25+), by country of destination and over time, numbers
Diaspora (0+) Brain drain (25+)
2000 2010 2000 2010
Balanced sample total 639,896 808,018 184,014 276,558
Unbalanced sample total 657,574 827,387 184,014 276,558Singapore 303,828 385,979 66,452 121,662
Australia 78,858 101,522 38,620 51,556
United States 51,510 61,160 24,085 34,045
United Kingdom 49,886 65,498 12,898 16,609
Canada 20,420 24,063 12,170 12,807
Brunei 60,401 76,567 6,438 10,208
New Zealand 11,460 15,995 4,221 6,708
India 14,685 18,179 1,509 4,503
China 7,278 9,226 2,655 3,496
Taiwan 6,635 8,411 2,916 3,235
Viet Nam 4,813 6,101 1,517 1,929
Philippines 3,991 5,059 2,974 1,785
Germany 2,945 3,733 783 1,211
Japan 5,849 6,170 961 1,151
Ireland 2,398 2,277 685 837
Indonesia 3,146 3,988 393 811
Pakistan 1,618 2,051 297 718
France 1,718 2,563 381 674
Egypt 1,944 1,430 1,588 641
Netherlands 2,739 3,471 560 633
Thailand 1,290 1,261 1,071 491
Switzerland 916 1,161 358 310
Sweden 961 1,370 210 260
South Africa 393 487 193 224
Italy 214 295 79 51
Hong Kong 15,579 16,123 .. ..
Denmark 390 672 .. ..
Norway 304 468 .. ..
Korea 353 447 .. ..
Finland 224 362 .. ..
Austria 332 424 .. ..
Turkey 266 337 .. ..
Spain 230 535 .. ..
Source: Docquier, Marfouk, Özden and Parsons (2010), Docquier, Lohest and Marfouk (2007), and WorldBank staff calculations and simulations.
Note: Diaspora refers to the stock of Malaysian-born migrants, regardless of skill profile. This table shows thediaspora numbers for those aged 0+. Brain drain refers to the stock of tertiary educated Malaysian-bornmigrants, aged 25+. Diaspora projections based on constant annualized growth assumption of 2.4 percentfollowing most recent observation through 2010. Brain drain projections based on constant 2000 skill sharesand 0.75 scale factor (migrant stock age 25+/age 0+). Balanced sample = countries shown for which data isavailable for both diaspora and brain drain estimates. Unbalanced sample = all countries with data available ina given year.
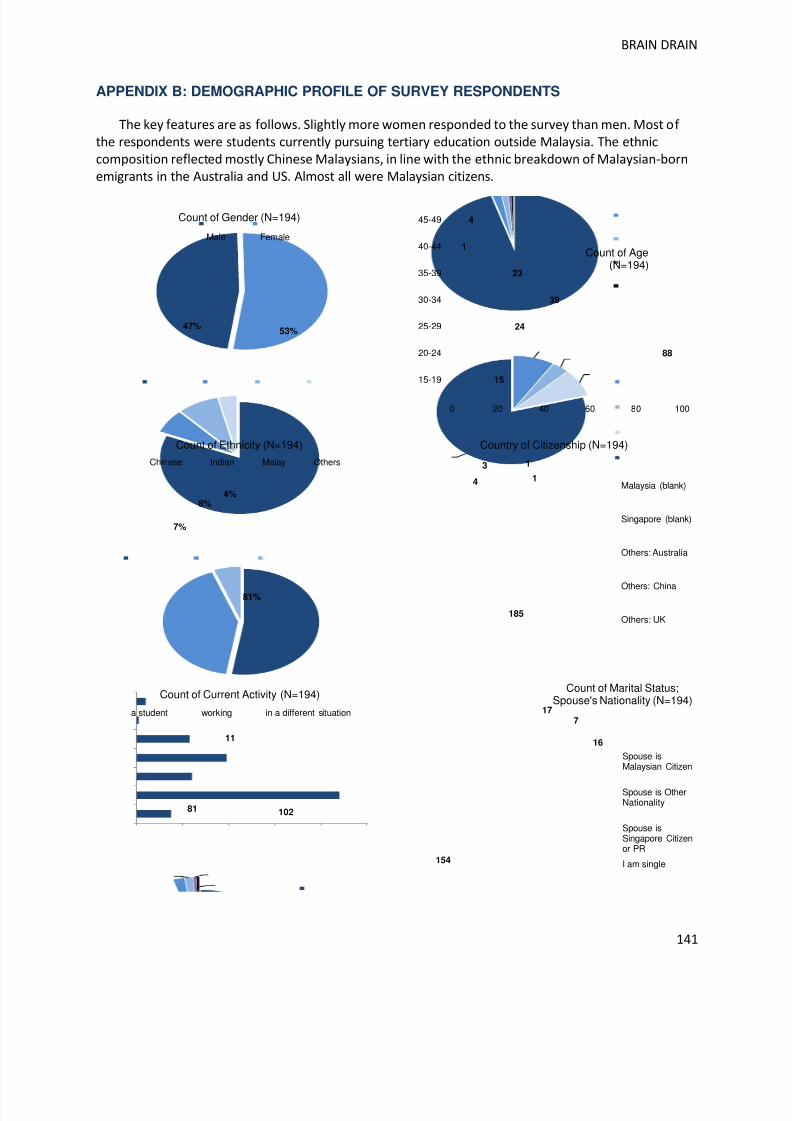
8/6/2019 World Bank Economic Monitor - Malaysia Brain Drain (April 2011)
http://slidepdf.com/reader/full/world-bank-economic-monitor-malaysia-brain-drain-april-2011 141/150
BRAIN DRAIN
141
APPENDIX B: DEMOGRAPHIC PROFILE OF SURVEY RESPONDENTS
The key features are as follows. Slightly more women responded to the survey than men. Most of the respondents were students currently pursuing tertiary education outside Malaysia. The ethniccomposition reflected mostly Chinese Malaysians, in line with the ethnic breakdown of Malaysian-bornemigrants in the Australia and US. Almost all were Malaysian citizens.
47%53%
Count of Gender (N=194)
Male Female
15
88
24
39
23
1
4
0 20 40 60 80 100
15-19
20-24
25-29
30-34
35-39
40-44
45-49
Count of Age(N=194)
81%
7%
8%4%
Count of Ethnicity (N=194)
Chinese Indian Malay Others
185
4
3 1
1
Country of Citizenship (N=194)
Malaysia (blank)
Singapore (blank)
Others: Australia
Others: China
Others: UK
10281
11
Count of Current Activity (N=194)
a student working in a different situation 177
16
154
Count of Marital Status;Spouse's Nationality (N=194)
Spouse isMalaysian Citizen
Spouse is OtherNationality
Spouse isSingapore Citizenor PR
I am single
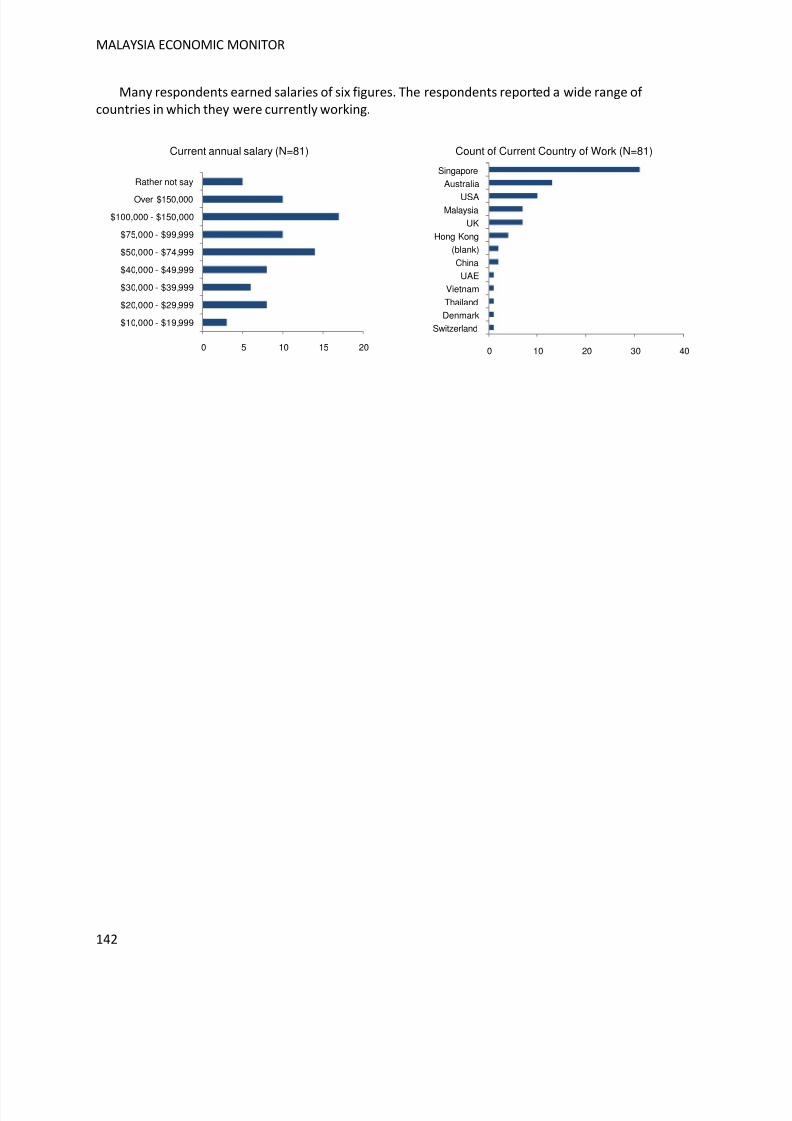
8/6/2019 World Bank Economic Monitor - Malaysia Brain Drain (April 2011)
http://slidepdf.com/reader/full/world-bank-economic-monitor-malaysia-brain-drain-april-2011 142/150
MALAYSIA ECONOMIC MONITOR
142
Many respondents earned salaries of six figures. The respondents reported a wide range of countries in which they were currently working.
0 5 10 15 20
$10,000 - $19,999
$20,000 - $29,999
$30,000 - $39,999
$40,000 - $49,999
$50,000 - $74,999
$75,000 - $99,999
$100,000 - $150,000
Over $150,000
Rather not say
Current annual salary (N=81)
0 10 20 30 40
Switzerland
Denmark
Thailand
Vietnam
UAE
China
(blank)
Hong Kong
UK
MalaysiaUSA
Australia
Singapore
Count of Current Country of Work (N=81)
8/6/2019 World Bank Economic Monitor - Malaysia Brain Drain (April 2011)
http://slidepdf.com/reader/full/world-bank-economic-monitor-malaysia-brain-drain-april-2011 143/150
REFERENCES
Asian Development Bank (2011). Asian Development Outlook: South-South Economic Links. Asian
Development Bank, Manila, April.
Athukorala, Prema-Chandra and Wing Thye Woo (2011). Malaysia in the Middle Income Trap. Paperpresented at the Asian Economic Panel Conference.
Australia Department of Immigration and Citizenship (2000). The Longitudinal Survey of Immigrants to
Australia.
Barro, Robert and Jong-Wha Lee (2010). A New Data Set of Educational Attainment in the World, 1950-
2010. NBER Working Paper No. 15902.
Bhagwati, Jagdish and Koichi Hamada (1974). The Brain Drain, International Integration of Markets for Professionals and Unemployment , Journal of Development Economics, 1(1), 19-42.
Beine, Michel, Frédéric Docquier and Çaglar Özden (2011). Diasporas, Journal of DevelopmentEconomics, 95(1), 30-41.
Beine, Michel, Frederic Docquier, Hillel Rapoport (2008). Brain Drain and Human Capital Formation in
Developing Countries: Winners and Losers, Economic Journal, 118, 631-652.
Belot, Michéle V.K. and Timothy J. Hatton(2008). Immigrant Selection in the OECD. CEPR Discussion
Paper No 6675, February.
Carrington, William J. and Enrica Detragiache (1998). How Big is the Brain Drain? IMF Working PaperWP/98/102. International Monetary Fund, Washington D.C.
CIMB (2011a). Monetary Policy: Rate Hikes Remain On The Cards, Economic Update, March.
CIMB (2011b). Oil Prices: Will Rising Oil Prices Derail Malaysia’s Growth?, Economic Focus, March.
Cheran, Rudrhramoorthy (2004). Diaspora Circulation and Transnationalism as Agents for Change in the
Post-Conflict Zones of Sri Lanka. Policy paper submitted to the Bergh of Foundation for ConflictManagement, Berlin.
Chiquiar, Daniel and Gordon H. Hanson (2005). International Migration, Self-Selection, and theDistribution of Wages: Evidence from Mexico and the United States, Journal of Political Economy, University of Chicago Press, 113(2), 239-281.
Coulombe, Serge and Jean-François Tremblay (2009). Migration and Skills Disparities Across the
Canadian Provinces, Regional Studies, 43 (1).
8/6/2019 World Bank Economic Monitor - Malaysia Brain Drain (April 2011)
http://slidepdf.com/reader/full/world-bank-economic-monitor-malaysia-brain-drain-april-2011 144/150
MALAYSIA ECONOMIC MONITOR
144
Credit Suisse (2011). Malaysia: Rising Commodity Prices - Boon Or Bane? , February.
Defoort, Cécily (2008). Tendances de Long Terme des Migrations Internationales: Analyse à Partir des Six
Principauxpays Receveurs, Population, 63e Année, No. 2, pp. 317-351.
Docquier, Frédéric, Olivier Lohest and Abdeslam Marfouk (2007). Brain Drain In Developing Countries,
World Bank Economic Review, 21(2), 193-218.
Docquier, Frédéric, B. Lindsay Lowell and Abdeslam Marfouk (2009). A Gendered Assessment Of The
Brain Drain, Population and Development Review, 35(2), 297-321.
Docquier, Frédéric and Abdeslam Marfouk (2006). International Migration By Educational Attainment
(1990-2000), in C. Ozden and M. Schiff (eds). International Migration, Remittances andDevelopment, Palgrave Macmillan: New York.
Docquier, Frédéric and Hillel Rapoport (2004). Skilled Migration: The Perspective of Developing
Countries, World Bank Policy Research Working Paper No. 3382.
Docquier, Frédéric and Hillel Rapoport (2006). Brain Drain. Palgrave. October.
Docquier, Frédéric, Abdeslam Marfouk, Özden Çaglar, and Christopher Parsons (2010). Geographic,
Gender and Skill Structure of International Migration. Mimeo. November.
Docquier, Frédéric and Hillel Rapoport (2011). Globalization, Brain Drain and Development , Journal of Economic Literature. Forthcoming.
Dumont, Jean-Christophe, Gilles Spielvogel and Sarah Widmaier (2010). International Migrants in
Developed, Emerging and Developing Countries: An Extended Profile, OECD Social, Employmentand Migration Working Papers No.11. Available at: www.oecd.org/els/workingpapers.
Dustmann, Christian and Yoram Weiss (2007). Return Migration: Theory and Empirical Evidence From
The U.K., British Journal of Industrial Relations, 45(2), 236-56.
Gibson, John and David McKenzie (2011). Eight Questions About Brain Drain, Journal of EconomicPerspectives. Forthcoming.
Gooch, Liz (2010). Loss of Young Talent Thwarts Malaysia’s Growth. New York Times. October 1, 2010.Available at: www.nytimes.com/2010/10/02/business/global/02brain.html
Grogger, Jeffrey and Gordon H. Hanson (2011). Income Maximization and the Selection and Sorting of
International Migrants, Journal of Development Economic, 95 (1).
International Monetary Fund (2011). World Economic Outlook: Tensions from the Two-Speed Recovery,
Unemployment, Commodities, and Capital Flows. International Monetary Fund, Washington D.C.,April.
8/6/2019 World Bank Economic Monitor - Malaysia Brain Drain (April 2011)
http://slidepdf.com/reader/full/world-bank-economic-monitor-malaysia-brain-drain-april-2011 145/150
REFERENCES
145
Kok, Melissa (2011). Singapore to Apply Tighter Criteria for Work-Pass Applicants. Straits Times. 10March 2011. Available at: www.thejakartaglobe.com/home/singapore-to-apply-tighter-criteria-for-work-pass-applicants/427931
Kremer, Michael (1993). The O-Ring Theory Of Economic Development , Quarterly Journal of Economics,108(3), 551-75.
Kuznetsov, Yevgeny and Charles Sabel (2008). Global Mobility of Talent from a Perspective of New
Industrial Policy: Open Migration Chains and Diaspora Networks in Andres Soliman, ed., TheInternational Mobility of Talent: Types, Causes and Development Impacts. Oxford UniversityPress.
Lee, Everett (1966). A Theory of Migration, Demography, 3(1), pp. 47-57.
Leipziger, Danny (2008). Brain Drain and the Global Mobility of Skilled Talent . PREM Notes 123.Washington, D.C.: The World Bank. September.
Lucas, Robert (2001). Diaspora and Development: Highly Skilled Migrants from East Asia. The Institutefor Economic Development Working Papers Series 120. Massachusetts: Boston University.
Lucas, Robert (2008). The Malaysian Diaspora. Mimeo. Massachusetts: Boston University.
Mohandas, Vimita (2011). CHIJ St. Nicholas Girls' Does It Again, Singapore News, 10 January 2011.Available at: www.channelnewsasia.com/stories/singaporelocalnews/view/1103728/1/.html.
Mountford, Andrew and Hillel Rapoport (2011). The Brain Drain and the World Distribution of Income,Journal of Development Economics, 95(1), 4-17.
McKenzie, David and Hillel Rapoport (2007). Network Effects And The Dynamics Of Migration And
Inequality: Theory And Evidence From Mexico, Journal of Development Economics, 84, 1: 1-27.
National Economic Advisory Council (2010a). New Economic Model for Malaysia Part 1. Putrajaya,Malaysia: NEAC.
National Economic Advisory Council (2010b). New Economic Model for Malaysia Concluding Part .Putrajaya, Malaysia: NEAC.
Ozden, Caglar, Christopher R. Parsons, Maurice Schiff and Terrie L. Walmsley (2011). Where on Earth is
Everybody? The Evolution of Global Bilateral Migration 1960-2000, World Bank Economic Review.Forthcoming.
Parsons, Christopher R., Ronald Skeldon, Terrie L. Walmsley, and Alan L. Winters (2007). Quantifying
International Migration: A Database of Bilateral Migrant Stocks, World Bank Policy ResearchWorking Paper 4165, Washington, D.C.
Pemandu (2010). Government Transformation Programme Roadmap. Performance Management andDelivery Unit. Prime Minister’s Department. Malaysia.
8/6/2019 World Bank Economic Monitor - Malaysia Brain Drain (April 2011)
http://slidepdf.com/reader/full/world-bank-economic-monitor-malaysia-brain-drain-april-2011 146/150
MALAYSIA ECONOMIC MONITOR
146
Plaza, Sonia and Dilip Ratha (2011). Harnessing Diaspora Resources for Africa, in Diaspora for
Development , edited by Plaza and Ratha. Chapter 4, Forthcoming.
Ratha, Dilip and William Shaw (2007). South-South Migration and Remittances, World Bank WorkingPaper Number 102, Washington, D.C.
Rosenzweig, Mark (2008). Higher Education and International Migration in Asia: Brain Circulation, in F.Bourguignon, ed. ABCDE World Bank Conference. Oxford University Press.
Singapore Department of Statistics (2010). Census of Population 2010. Advance Census Release.
Singapore Ministry of Manpower (2008). Employment of Singapore Citizens, Permanent Residents and
Foreigners, 1997 to 2006.
Talent Corporation (2011). Malaysia's Got Talent . Interview with The Star. February 12.
Tham, Siew Yean (2010). Institutions and Governance Regime: Managing Foreign Workers in Malaysia.Mimeo.
UNCTAD (2011). Global and Regional FDI Trends in 2010. Global Investments Trends Monitor 5. January17, 2011. Available at: www.unctad.org/en/docs//webdiaeia20111_en.pdf
US Census (2000). Table FBP-1. Profile of Selected Demographic and Social Characteristics: 2000,Population: Malaysia.
World Bank (2008). Measuring the Contribution to GDP and Productivity of the Malaysian Services
Sector , Washington D.C.: The World Bank.
World Bank (2009a). Malaysia Productivity and Investment Climate Assessment Update, Poverty
Reduction and Economic Management Sector Unit, East Asia and Pacific Region Report No.49137-MY. Washington, D.C.: The World Bank.
World Bank (2009b). Malaysia Economic Monitor —Repositioning for Growth. Washington, D.C.: TheWorld Bank. November. Available at: http://www.worldbank.org/my
World Bank (2010a). Malaysia Economic Monitor —Growth Through Innovation. Washington, D.C.: TheWorld Bank. April. Available at: http://www.worldbank.org/my
World Bank (2010b). Malaysia Economic Monitor —Inclusive Growth. Washington, D.C.: The World Bank.April. Available at: http://www.worldbank.org/my
World Bank (2010c). Stepping Up Skills for More Jobs and Higher Productivity . Washington D.C.: TheWorld Bank.
World Bank (2010d). Investing Across Borders 2010: Indicators of Foreign Direct Investment Regulation
in 87 Economies, Washington, D.C.: The World Bank.
8/6/2019 World Bank Economic Monitor - Malaysia Brain Drain (April 2011)
http://slidepdf.com/reader/full/world-bank-economic-monitor-malaysia-brain-drain-april-2011 147/150
REFERENCES
147
World Bank (2011a). Global Economic Prospects, Washington, D.C., January. : The World Bank.
World Bank (2011b). East Asia and Pacific Update, Washington D.C., March.: The World Bank.
World Bank (2011c). Migration and Remittances Factbook 2011. Second Edition. Washington, D.C.: TheWorld Bank.
World Bank Institute (2006). Diaspora Networks and the International Migration of Skills, edited byYvgeny Kuznetsov. WBI Development Studies. Washington, D.C.: The World Bank.
Wong, Evelyn (2010). Will You Come Back to Malaysia? Results of An Online Survey . Available at:pluggingthebraindrain.wordpress.com
Yeoh, Brenda (2003). Migration, International Labour and Multicultural Policies in Singapore. National
University of Singapore. Mimeo. November. Available at:www.ihakka.net/hakka2003/Big5/word/01.doc
Yeoh, Brenda (2007). Singapore: Hungry for Foreign Workers at All Skill Levels, Migration Policy Institutewebsite. Mimeo. Available at: www.migrationinformation.org/Profiles/display.cfm?ID=570
Yusuf, Shahid and Kaoru Nabeshima (2009). Tiger Economies Under Threat. A Comparative Analysis of
Malaysia’s Industrial Prospects and Policy Options, Washington, D.C.: The World Bank.

8/6/2019 World Bank Economic Monitor - Malaysia Brain Drain (April 2011)
http://slidepdf.com/reader/full/world-bank-economic-monitor-malaysia-brain-drain-april-2011 148/150

8/6/2019 World Bank Economic Monitor - Malaysia Brain Drain (April 2011)
http://slidepdf.com/reader/full/world-bank-economic-monitor-malaysia-brain-drain-april-2011 149/150

8/6/2019 World Bank Economic Monitor - Malaysia Brain Drain (April 2011)
http://slidepdf.com/reader/full/world-bank-economic-monitor-malaysia-brain-drain-april-2011 150/150