Embed Size (px)
Citation preview

Policy Research Working Paper 5817
Senegal’s Infrastructure
A Continental Perspective
Clemencia TorresCecilia M. Briceño-Garmendia
Carolina Dominguez
The World BankAfrica RegionSustainable Development UnitSeptember 2011
WPS5817P
ublic
Dis
clos
ure
Aut
horiz
edP
ublic
Dis
clos
ure
Aut
horiz
edP
ublic
Dis
clos
ure
Aut
horiz
edP
ublic
Dis
clos
ure
Aut
horiz
edP
ublic
Dis
clos
ure
Aut
horiz
edP
ublic
Dis
clos
ure
Aut
horiz
edP
ublic
Dis
clos
ure
Aut
horiz
edP
ublic
Dis
clos
ure
Aut
horiz
ed

Produced by the Research Support Team
Abstract
The Policy Research Working Paper Series disseminates the findings of work in progress to encourage the exchange of ideas about development issues. An objective of the series is to get the findings out quickly, even if the presentations are less than fully polished. The papers carry the names of the authors and should be cited accordingly. The findings, interpretations, and conclusions expressed in this paper are entirely those of the authors. They do not necessarily represent the views of the International Bank for Reconstruction and Development/World Bank and its affiliated organizations, or those of the Executive Directors of the World Bank or the governments they represent.
Policy Research Working Paper 5817
Infrastructure contributed 1 percentage point to Senegal’s improved per capita growth performance between 2000 and 2005, placing it in the middle of the distribution among West African countries. Raising the country’s infrastructure endowment to that of the region’s middle-income countries (MICs) could boost annual growth by about 2.7 percentage points. Senegal has made significant progress in some areas of its infrastructure, including the transport, electricity, water, and information-and-communication-technology (ICT) sectors. But looking ahead, the country faces
This paper is a product of the Sustainable Development Unit, the Africa Region. It is part of a larger effort by the World Bank to provide open access to its research and make a contribution to development policy discussions around the world. Policy Research Working Papers are also posted on the Web at http://econ.worldbank.org. The author may be contacted at [email protected].
important infrastructure challenges, including improving road conditions, boosting air and rail traffic, updating electricity infrastructure, and boosting the pace of expansion of the water-and-sanitation network. Senegal currently spends around $911 million per year on infrastructure, with $312 million lost annually to inefficiencies. Comparing spending needs with existing spending and potential efficiency gains leaves an annual funding gap of $578 million per year. Senegal has the potential close this gap by bringing in more private-sector investment.

Senegal’s Infrastructure: A Continental Perspective
Clemencia Torres, Cecilia M. Briceño-Garmendia, and Carolina Dominguez

Acknowledgments
This paper draws up contributions from sector specialists from the Africa Infrastructure Country
Diagnostic team: notably, Heinrich Bofinger on air transport, Alberto Nogales on roads, Rupa
Ranganathan on power, Michael Minges on information and communication technologies, Nataliya
Pushak on public expenditure, and Alvaro Federico Barra on spatial analysis.
The paper is based on data collected by local consultants and from feedback provided by colleagues
in the Senegal country team: notably, Moctar Thiam; Alain D’hoore; Mamadou Ndione; Jean Philippe
Tre and Manievel Sene (irrigation); Stephan Garnier and Philippe Durand (energy); Pierre Pozzo di
Borgo, Lucien Andre Aegerter, Ibou Diouf, and Christian Diou (transport); and Matar Fall and Pierre
Boulanger (water).

iii
Contents
List of figures iii
List of tables iv
Synopsis 1
The continental perspective 2
Why infrastructure matters 2
The state of Senegal’s infrastructure 4
Roads 9 Rail 13 Ports 15 Air transport 17 Water supply and sanitation 20 Power 26 Information and communication technologies 30
Financing Senegal’s infrastructure 34
How much more can be done within the existing resource envelope? 38 Annual funding gap 42 What else can be done? 42
References and bibliography 46
List of figures
Figure 1. Infrastructure has contributed much to economic growth—but could contribute much more 3 Figure 2. Infrastructure deficits constrain firms’ productivity 4 Figure 3. Senegal’s population, natural resources, and poverty distribution 6 Figure 4. Senegal’s infrastructure 7 Figure 5. Road standards in Senegal (as of 2006) 10 Figure 6. Senegal’s Logistics Performance Index is the highest in West Africa 10 Figure 7. Senegal’s expenditure is not enough to catch up with its road rehabilitation backlog 12 Figure 8. Evolution of traffic and vessels moving through the Port of Dakar 17 Figure 9. Senegal is an emerging hub for West Africa 18 Figure 10. Evolution of seats and city pairs in Senegal, 2001–07 19 Figure 11. Rates of expansion of access to safe water and improved sanitation are above the African average 23 Figure 12. The hidden costs of the urban water utility SDE 24 Figure 13. Hidden costs of select water utilities, as a percentage of revenues 25 Figure 14. Power prices and costs in Sub-Saharan Africa 27 Figure 15. Prevailing tariffs in line with operational costs, but embedded is an important subsidy of capital costs 29 Figure 16. The most significant inefficiency is underpricing 30 Figure 17. Hidden costs of power utilities in select West African countries, as percentage of revenues 30 Figure 18. Efficient market gap for mobile telephone services in West Africa 32 Figure 19. Expansion of the Internet market in Senegal 33 Figure 20. Senegal’s infrastructure spending needs are substantial relative to its GDP 36 Figure 21. Senegal’s existing infrastructure spending is particularly high 37 Figure 22. Senegal’s pattern of capital investment in infrastructure, benchmarked against comparator countries 38 Figure 23. Underpricing of water a more serious issue in Senegal than elsewhere 39 Figure 24. Consumption of infrastructure services in Senegal varies by income quintile 39 Figure 25. Electricity and water subsidies that reach the poor 40

iv
Figure 26. Affordability in Senegal is much better than in other low-income countries 41 Figure 27. Senegal’s utilities are comparatively efficient 41 Figure 28. Senegal has been a destination for private sector investment in West Africa 43 Figure 29. Africa attracts relatively less private sector investment in infrastructure compared with other regions 44
List of tables
Table 1. Economic indicators in Senegal and Sub-Saharan Africa .................................................................................................. 3 Table 2. The achievements and challenges of Senegal’s infrastructure sectors .............................................................................. 8 Table 3. Senegal’s road indicators .................................................................................................................................................... 9 Table 4. Senegal is on the right track to secure road maintenance resources ............................................................................... 11 Table 5. Railway indicators for Senegal and select other countries, 2005–09 ............................................................................... 15 Table 6. Costs of exporting and importing ...................................................................................................................................... 16 Table 7. Port indicators for Senegal compared against those of select ports in Africa, 2006 ......................................................... 17 Table 8. Benchmarking air transport indicators for Senegal and other select countries ................................................................. 19 Table 9. Benchmarking water and sanitation indicators ................................................................................................................. 22 Table 10. Evolution of operational indicators associated with the urban water utility SDE ............................................................. 23 Table 11. Rural and urban access to improved water and sanitation in Senegal ........................................................................... 25 Table 12. Benchmarking Senegal’s power indicators ..................................................................................................................... 26 Table 13. Performance of the electricity sector in West African countries ...................................................................................... 28 Table 14. Evolution of hidden costs associated with SENELEC ..................................................................................................... 29 Table 15. Benchmarking ICT indicators .......................................................................................................................................... 31 Table 16. Senegal’s skyrocketing mobile teledensity ..................................................................................................................... 32 Table 17. Intraroaming networks in ECOWAS ................................................................................................................................ 34 Table 18. International call charges ................................................................................................................................................ 34 Table 19. Illustrative investment targets for infrastructure in Senegal ............................................................................................ 35 Table 20. Indicative infrastructure spending needs in Senegal, 2006–15 ...................................................................................... 35 Table 21. Financial flows to Senegal’s infrastructure, annual averages over the period 2001–06 ................................................. 36 Table 22. Potential gains from greater operational efficiency ......................................................................................................... 38 Table 23. Funding gaps by sector ................................................................................................................................................... 42 Table 24. Total investment commitments in infrastructure projects with private participation ........................................................ 43

Synopsis
Between 2000 and 2005 infrastructure made a contribution of 1 percentage point to Senegal’s
improved per capita growth performance, placing it in the middle of the distribution among West African
countries during the period. Raising the country’s infrastructure endowment to that of the region’s
middle-income countries (MICs) could boost annual growth by about 2.7 percentage points.
Senegal has made significant progress in some areas of its infrastructure. In the transport sector, road
standards are adequate and their quality average. Senegal has also strengthened the road institutional
framework with the creation of the Second Generation Road Fund (FERA) and the Road Maintenance
Executing Agency. It has also managed to have a toll road concession granted for the Dakar-Diamniadio
Toll Highway. The tariffs in the railway sector are internationally competitive, and there has been
improvement in the financial viability of ports. After Nigeria, the country stands as an emerging hub and
a major player in air transport.
Also, Senegal has managed to introduce private participation in electricity generation, and the
unbundling of the electricity sector is likely to get under way soon, even as the country actively
participates in the regional power market. The country is on track to meet the Millennium Development
Goals (MDGs) in improved water. In the information and communication technology (ICT) sector there
has been an impressive expansion of the mobile and Internet markets.
Looking ahead, the country faces important infrastructure challenges. To increase the efficiency of
moving goods to and from Senegal, the overall condition of the road corridors needs to be improved. The
poor condition of the classified road network points to a need for more regular maintenance. Traffic along
Senegal’s railways and through its airports needs to be boosted. In the power sector the country is both
economically and financially exposed to a deteriorating stock of infrastructure that it can no longer afford
to maintain; inefficient and unreliable power supplies are also taking their toll. In the water and sanitation
sector, the country needs to boost the pace of expansion to improve drinking water and sanitation, and
close the increasing rural-urban gap in access to improved sanitation. Expanding the Internet market and
enhancing the participation of the private sector are the main challenges in the ICT sector.
Addressing Senegal’s infrastructure challenges will require sustained expenditure of $1.792 billion
every year over the next decade, with heavy emphasis on capital expenditure. More than half of the total
relates to the power sector. At 20 percent of Senegal’s 2005 gross domestic product (GDP), this effort is
greater than the average for Sub-Saharan Africa at 14.5 percent of GDP.
Senegal already spends around $911 million per year on infrastructure, equivalent to about 11 percent
of its GDP. Almost $312 million a year is lost to inefficiencies of various kinds, associated mainly with
underpricing in the power and water sectors, poor financial management of utilities, and inefficient
allocation of resources across sectors. If Senegal could raise tariffs to cost-recovery levels and reduce
operational inefficiencies in line with reasonable developing-country benchmarks, it could substantially
boost its infrastructure sector.
Comparing spending needs with existing spending and potential efficiency gains (and assuming that
the inefficiencies are fully captured) leaves an annual funding gap of $578 million per year. By far the

SENEGAL’S INFRASTRUCTURE: A CONTINENTAL PERSPECTIVE
2
largest share of the gap can be traced to the power sector, followed by the ICT sector. Senegal has the
potential to close this gap by bringing in more private sector investment and emphasizing projects in
infrastructure with a regional dimension, taking advantage of its unique geographical location in the
region.
The continental perspective
The Africa Infrastructure Country Diagnostic (AICD) has gathered and analyzed extensive data on
infrastructure across almost all African countries, including Senegal. The results have been presented in
reports covering various areas of infrastructure—ICT, power, transport, and water and sanitation—and
different policy areas, including investment needs, fiscal costs, and sector performance.
This report presents the key AICD findings for Senegal, allowing the country’s infrastructure
situation to be benchmarked against that of its African peers. Two sets of African benchmarks will be
used to evaluate Senegal’s situation: nonfragile, low-income countries, and middle-income countries.
Detailed comparisons will also be made with immediate regional neighbors in West Africa.
Several methodological issues should be borne in mind. First, because of the cross-country nature of
the data collection, a time lag is inevitable. The period covered by the AICD runs from 2001 to 2008.
Most technical data presented are for 2006 (or the most recent year available), while financial data are
typically averaged over the available period to smooth out the effect of short-term fluctuations. Second, to
make comparisons across countries, we had to standardize the indicators and analysis so that everything
was done on a consistent basis. This means that some of the indicators presented here may be slightly
different from those that are routinely reported and discussed at the country level.
Why infrastructure matters
In common with the rest of the continent, Senegal’s growth performance improved markedly between
the 1990s and 2000s. The overall improvement in per capita growth rates has been estimated at 1.03
percentage points, mainly from the ICT revolution (1.26 percentage points), while deficient power
infrastructure held growth back (by -0.23 percentage points, figure 1a).

SENEGAL’S INFRASTRUCTURE: A CONTINENTAL PERSPECTIVE
3
Figure 1. Infrastructure has contributed much to economic growth—but could contribute much more
a. Infrastructure’s contribution to annual per capita economic growth in West African countries, in percentage points, 2001–05
b. Potential contribution of infrastructure to annual per capita economic growth in West African countries, in percentage points
Source: Calderón 2009.
It is in this context that Senegal’s sustained growth has been driven not only by groundnut and fish
exports and tourism and trade, but also by transport and primarily the development of telecommunication
services (World Bank 2007a). Despite its weaker performance in 2006, between 1996 and 2006 Senegal’s
economy grew at an average annual rate of 4.7 percent, above the average of Sub-Saharan Africa
(table 1), but still short of the sustained 7 percent mark per year needed to make important progress in
reducing poverty.
Table 1. Economic indicators in Senegal and Sub-Saharan Africa
GDP growth
(1995–2005)
Inflation rate
(1995–2005)
Fiscal primary deficit, % of GDP
(2000–04) Gini Index Aid ($) per capita
(1994–2004)
Senegal 4.7 2.5 2.2 41.3 56.4
Sub-Saharan Africa 3.8 7.0 5.4(*) 47.1 26.6
Source: World Bank 2007a.
Note: (*) West African Economic and Monetary Union (WAEMU) average. GDP = gross domestic product.
The rate of growth of the Senegalese economy, if the growth fundamentals were to be raised to the
level of the leader in the region, Mauritania, would be 2.7 percentage points (figure 1b)—a marked
increase from the current infrastructure contribution of 1.03 percentage points. Two-thirds of this would
potentially come from improvement in the power generation, transmission, and distribution networks.
While in many aspects Senegal compares favorably with its neighbors in West Africa, poor
infrastructure services have had a severe impact on the economy. Inadequate supply of key infrastructure
services has contributed to low productivity in the private sector, coupled by rising transportation and
electricity costs (World Bank 2007a). Evidence from enterprise surveys suggests that infrastructure
constraints are responsible for about 58 percent of the productivity handicap faced by Senegalese firms
-2
-1
0
1
2
3
4
5
Ben
in
Cot
e d'
Ivoi
re
Mau
ritiu
s
Gui
nea
Bur
kina
Fas
o
Sen
egal
Gha
na
Mau
ritan
ia
Tog
o
Nig
eria
Sou
th A
fric
a
Gam
bia
Nig
er
Sie
rra
Leon
e
Gui
nea-
Bis
sau
Per
cen
tag
e P
oin
ts
Roads Electricity Telecom
-2
-1
0
1
2
3
4
5
Nig
er
Tog
o
Nig
eria
Bur
kina
Fas
o
Gui
nea-
Bis
sau
Sie
rra
Leon
e
Ben
in
Mau
ritan
ia
Gam
bia
Sen
egal
Gha
na
Gui
nea
Cot
e d'
Ivoi
re
Sou
th A
fric
a
Mau
ritiu
s
Per
cen
tag
e P
oin
ts
Roads Electricity Telecom

SENEGAL’S INFRASTRUCTURE: A CONTINENTAL PERSPECTIVE
4
(figure 2a)—among the highest in the region—with the remainder due to poor governance, red tape, and
financing constraints. Poor transportation is the infrastructure constraint that weighs most heavily on the
productivity of Senegal’s firms, with electricity a close second (figure 2b).
Figure 2. Infrastructure deficits constrain firms’ productivity
a. Weight of infrastructure deficits among all factors that sap business productivity (percent)
b. Weight of various sectors in productivity deficit attributable to infrastructure (percent)
Source: Escribano, Guasch, and Pena 2010.
The state of Senegal’s infrastructure
Senegal has had a privileged position compared to its neighbors with regard to transit, trade, external
markets, and political stability. With an economy heavily focused on international markets—in particular
trade and tourism—Senegal is highly competitive compared to other African countries. The costs of
exporting and importing are considerably lower than in other coastal countries in the region, but
significant progress is still needed to achieve the average international competitiveness of developing
countries in general.
Most of Senegal’s population is concentrated in the Dakar area. The remaining part of the country, by
contrast, is sparsely populated and characterized by fragmentary infrastructure coverage. Density varies
from about 77 inhabitants per square kilometer (inhabitants/km2, 199 inhabitants/square miles) in the
west-central region to 2 inhabitants/km2 (5 inhabitants/square miles) in the eastern section (figure 3a).
The rapid pace of urbanization—6 out of 10 people are forecasted to live in urban areas by 2015
(World Bank 2007a)—has made it difficult to balance the provision of infrastructure between urban and
rural areas in Senegal. Population growth averaged 2.7 percent annually over the period 2000–08, above
the average of other low-income countries (2.3 percent per year).
Despite the good economic performance of the past decade, Senegal still remains a poor country. The
highest incidence of poverty remains in rural areas (figure 3b). The poorest regions (Ziguichor and Kolda
in the south, and Kaolack and Diourbel in the central region) are also those with the lowest access to
0% 50% 100%
Niger
Burkina Faso
Mauritania
Mali
Senegal
Benin
percent of productivity deficit attributable to sectors
Infrastructure Others
0% 20% 40% 60% 80% 100%
Benin
Burkina Faso
Niger
Mauritania
Senegal
Mali
percent of productivity deficit attributable to sectors
Electricity Customs clearance Transportation ICT Water

SENEGAL’S INFRASTRUCTURE: A CONTINENTAL PERSPECTIVE
5
water, sanitation, and electricity services, making evident the correlation between poverty and access to
basic infrastructure services. Most of the infrastructure is found in the north of the country.
Senegal plays an important role in regional integration and is a key exit to international markets for
the subregion. Senegal’s main road corridor runs from Dakar to Bamako, bordering Mauritania (figure
4a). This corridor is one of the three international trade corridors in this subregion and became
particularly important after the security situation deteriorated in Côte d’Ivoire, forcing a major shift in
transit patterns to other subregional corridors. The modernization of the country’s one main port and
airport, both at Dakar (figure 4a), has improved the subregion’s access to international markets. The
railway line, shared by Senegal and Mali, runs from Dakar to Bamako, mainly through the southern parts
of the country. The deteriorated state of the rail network and equipment, however, has curtailed its
capacity to respond to increasing demand. A major power line connects the northern part of the country
(figure 4b), and projects are under way to bring power to the south. A fixed transmission network covers
the northern and southern parts of Senegal, but there are no major developments in the central part. The
country has connected to international networks through satellites and the South Atlantic 3 (SAT-3)
submarine cable (figure 4c). Most of the irrigated land is located in the north (figure 4d).
This report begins by reviewing the main achievements and challenges observed in each of Senegal’s
major infrastructure sectors, with the key findings summarized in table 2. Thereafter, attention will turn to
the problem of financing Senegal’s outstanding infrastructure needs.

SENEGAL’S INFRASTRUCTURE: A CONTINENTAL PERSPECTIVE
6
Figure 3. Senegal’s population, natural resources, and poverty distribution
a. Population b. Poverty
c. Topography d. Natural resources
Source: AICD Interactive Infrastructure Atlas for Senegal (www.infrastructureafrica.org/aicd/tools/maps).

SENEGAL’S INFRASTRUCTURE: A CONTINENTAL PERSPECTIVE
7
Figure 4. Senegal’s infrastructure
a. Roads b. Power
c. ICT d. Water
Source: AICD Interactive Infrastructure Atlas for Senegal (www.infrastructureafrica.org/aicd/tools/maps).

SENEGAL’S INFRASTRUCTURE: A CONTINENTAL PERSPECTIVE
8
Table 2. The achievements and challenges of Senegal’s infrastructure sectors
Achievements Challenges
Roads Institutional strengthening with the creation of the second-generation road fund (FERA) and the road maintenance executing agency (Agence Autonome des Travaux Routiers, AATT).
Adequate selection of road standards (at least until 2006).
Good average perceived transport quality.
First toll road concession granted for the Dakar-Diamniadio toll highway.
Improvements in road safety.
Providing high maintenance resources for a highly deteriorated and deteriorating classified road network.
Enforcing regulations pertaining overload on the Dakar-Bamako regional corridor.
Improving quality of selection and prioritization of projects for use of public funds.
Fostering increased private participation in the sector, which could be an alternative source of financing for transport infrastructure.
Increasing rural accessibility, especially beyond centers close to the main trunk network and coastal lines.
Railways Improvements in productivity under private concession compared to past performance as a state-owned enterprise.
Freight tariffs are internationally competitive.
Rehabilitating tracks and modernizing rolling stocks are urgent to improve the service quality and unreliability.
Revising the proposed emergency investment plan is urgent as it falls short of needs.
Improving financial situation of SITARAIL.
Increasing traffic level beyond break-even point (or about 600 millions of tonne-km/year). This I sonly possible, tough, if tracks and rolling stocks are updated.
Ports Traffic volumes at the Port of Dakar increased significantly, making corridors Bamako-Dakar and Ouagadougou-Dakar key corridors in West Africa, after the crisis in Côte d’Ivoire.
A new 25-year concession contract granted after which a significant investment program has been set in place and financial position of the port has improved importantly.
Introducing a multimodal transport strategy to improve links between port, roads and railways.
Air transport Emerging hub and a major player in air transport after Nigeria.
Airport security at the airport certified by the ICAO and FAA/IASA was rated satisfactory. Only airport in West Africa with such certification.
Improving access to air transport within the country for passengers and freight could help reach remote areas.
Water and sanitation
On track to meet the MDGs in improved water.
Rural-urban gap closing for access to improved water.
SDE is an example of a best-practice PPP (affermage) among Sub-Saharan African countries.
Access to improved sanitation services has been slower.
Rural-urban gap for access to improved sanitation has widened.
Revising water tariff structure and levels.
ICT Impressive growth of the mobile and Internet markets. Achieving universal access to GSM.
Power Relatively high access to electricity, particularly in urban areas.
Introduction of private participation in electricity generation.
Active participation in the regional power market through the OMVS.
Tackling the growing generation capacity deficit.
Improving SENELEC’s financial and operational position by promoting regular tariff adjustments, increasing predictability of budgetary transfers, enhancing operational performance and corporate governance issues.
Source: Authors’ elaboration based on findings of this report. Note: FAA = U.S. Federal Aviation Administration; GSM = global system for mobile communications; IASA = International Aviation Safety Assessment; ICAO = International Civil Aviation Organization; MDGs = Millennium Development Goals; MW = megawatts; OMVS = Organisation pour la Mise en valeur du Fleuve Sénégal; PPP = public-private partnership.

SENEGAL’S INFRASTRUCTURE: A CONTINENTAL PERSPECTIVE
9
Roads
Achievements
The existing network of 18,063 km of roads is adequate to provide basic regional, national, and
international connectivity, linking Dakar to international border crossings and provincial capitals in the
interior. This is generally true even if Senegal’s road density indicators, both for classified and total
network, are lower than African averages for low- and middle-income countries (table 3). This reflects an
efficient network design that has given priority to connecting Dakar and other relatively large cities (with
a population of 50,000 or more) to major ports as well as provincial capitals and cities (with populations
of over 25,000).
Table 3. Senegal’s road indicators
Unit Low-income
countries Senegal
Middle-income countries
Total road network density km/1,000 km2 of arable land 132.1 93.8 318.4
Classified road network density
km/1,000 km2 of arable land 88.2 81.4 278.4
Rural Accessibility Index—HH survey
% of rural population within 2 km of all-season road 34.1 29.0 62.7
GIS rural accessibility % of rural population within 2 km of all-season road 23.1 25.7 31.5
Paved road traffic AADT 1,341.1 944.9 3,797.7
Unpaved road traffic AADT 38.5 30.8 74.7
Paved network condition* % in good or fair condition 86.2 61.0 82.0
Unpaved network condition* % in good or fair condition 55.8 37 57.6
Perceived transport quality % firms identifying roads as major business constraint
27.6 27.4 18.2
Overengineering % of main road network paved relatively to low traffic 29.6 19.3 18.4
Underengineering % of main road network paved relatively to high traffic
13.5 0 20
Source: Gwilliam and others 2008. Derived from the AICD national database (www.infrastructureafrica.org/aicd/tools/data). Note: *2009 data (AL).GIS = geographic information system; AADT = average annual daily traffic.
Good connectivity has been matched by a good selection of road standards in Senegal. Decisions
related to whether a road should be paved or not seem to be rooted in observed traffic patterns. In fact,
contrary to most African countries, there is no indication of underengineering of roads in Senegal and not
even 20 percent of the roads can be classified as overengineered (this is well below the road
overengineering levels observed across African countries and cited as typical examples of fiscal
mismanagement) (figure 5).1
1 Overengineered roads are paved although traffic levels are below 300 vehicles per day—the threshold level that
justifies paving. Underengineered roads are not paved although traffic levels are higher than 300 vehicles per day.

SENEGAL’S INFRASTRUCTURE: A CONTINENTAL PERSPECTIVE
10
Figure 5. Road standards in Senegal (as of 2006)
Source: Gwilliam and others 2008. Derived from the AICD national database (www.infrastructureafrica.org/aicd/tools/data) using RONET.
The combination of good connectivity
and adequate standard selection is well
received by users. Therefore, despite the
relatively poor conditions of the road
network due to deferred maintenance, less
than one-third of Senegal’s firms identify
transport services as a major constraint for
doing business—a rating that is within the
average observed among low-income
countries. Moreover, according to a recent
survey on trade logistics that captures
indicators including the availability and
quality of the roads, Senegal’s Logistics
Performance Index (LPI), at 2.86, is above
the regional average of 2.46 (figure 6). The
LPI is based on a worldwide survey of
operators on the ground (global freight forwarders and express carriers), providing feedback on the
logistics ―friendliness‖ of the countries in which they operate and those with which they trade. Such
operators combine in-depth knowledge of the countries in which they operate with informed qualitative
assessments of other countries with which they trade as well as the experience of a global logistics
environment. By this ranking, Senegal’s capacity to move goods and connect manufacturers and
consumers with international markets is the highest in West Africa.
But there is only so much a well-designed network can do, if it is not properly maintained over time.
Road conditions are eroding due to the poor allocation of resources to maintenance and periodic
rehabilitation (based on the roads’ natural life cycles), and this hinders Senegal’s connectivity. The
0%
10%
20%
30%
40%
50%
60%
70%
80%
90%
100%
Nig
eria
Ben
in
Sou
th A
fric
a
Rw
anda
Uga
nda
Cha
d
Eth
iopi
a
Sen
egal
Tan
zani
a
Gha
na
Mal
awi
Cot
e d'
Ivoi
re
Cam
eroo
n
Bur
kina
Fas
o
Ken
ya
Nig
er
Leso
tho
Moz
ambi
que
Mad
agas
car
Nam
ibia
Zam
bia
Ave
rage
Under-engineered Correctly engineered Over-engineered
Figure 6. Senegal’s Logistics Performance Index is the highest in West Africa
Source: World Bank 2010d Note: SSA = Sub-Saharan Africa.
0
0.5
1
1.5
2
2.5
3
Sen
egal
Ben
in
Gui
nea
Tog
o
Nig
eria
Nig
er
Cot
e d'
Ivoi
re
Gam
bia,
The
Gha
na
Libe
ria
Mal
i
Bur
kina
Fas
o
Gui
nea-
Bis
sau
Sie
rra
Leon
e
SS
ALo
gis
tics
Per
form
ance
Ind
ex

SENEGAL’S INFRASTRUCTURE: A CONTINENTAL PERSPECTIVE
11
government of Senegal is fully aware of this issue and, as part of its strategy to modernize transport
infrastructure and diversify financing sources for the road sector, has started to promote private
participation in the road sector. In March 2009 a 30-year concession was granted for the Dakar-
Diamniado toll highway, to build a 20.4 km (Pikine-Diamniadio) road and to manage and maintain the
highway toll road from Patte d’Oie to Diamniadio (including a 4.2-km road between Patte d’Oie and
Pikine).
There has also been a consistent effort to improve the institutional capacity to deal with road
maintenance, a major issue in the sector. In 2008 Senegal established a sound system for funding road
maintenance by adopting a second-generation road fund, FERA,2 and creating the AATT
3 (road
maintenance executing agency). Given the evidence from other African countries, putting such
institutions in place usually increases the likelihood that maintenance funding will be better protected and
mobilized (table 4).
Table 4. Senegal is on the right track to secure road maintenance resources
Percentage of main road network in good or fair condition, by country grouping
Country category Institutions Geography Financing
Middle-income 81 Road fund and agency 82 Flat and arid 77 High fuel levy 79
Low-income, aid 75 Road fund only 70 Rolling and humid 70 Low fuel levy 70
Low-income, oil producer 70 Road agency only 62 No fuel levy 75
Source: Gwilliam and others 2008.
Finally, the country has made important progress in road safety. The number of accidents has
declined from 4,074 in 2003 to 3,446 in 2005 (World Bank 2008), thanks to the stricter enforcement of
licenses and registration and the inclusion of standards for signaling, marking, and lightening of roads in
the road safety code.
Challenges
Once in relatively good shape, Senegal’s road infrastructure has been deteriorating since the early 1990s.
In 2007 the government, supported by donors, set in place the Program Sectoriel des Transports II
(PTST2) to revamp the road network. After a couple of years of visible improvements, 40 percent of the
paved network and 60–63 percent of the unpaved network still remains in poor condition (World Bank
2010c).
Part of the problem of deteriorating road conditions is that Senegal has not been able to fully procure
and protect resources for road maintenance, despite the great strides toward institutional reform made by
creating the FERA and AATT. Over the period 2005–09, Senegal’s spending on network segments that
could be maintained was short of estimated maintenance requirements by 78 percent, while spending on
the whole network was about 11 percent short of estimated maintenance and rehabilitation requirements.
2 Fonds d’Entretien Routier Autonome.
3 Agence Autonome des Travaux Routiers.

SENEGAL’S INFRASTRUCTURE: A CONTINENTAL PERSPECTIVE
12
Moreover, studies conducted under the PST2 have identified a backlog in road rehabilitation needs of
$400 million.4
Assuming that the backlog for rehabilitation is financed overnight directly by the government with
support from donors and that the network is in good or fair (that is, maintainable) condition, funding
routine maintenance will require around $100 million–$10 million per year based on a 40-year life cycle
for roads. These calculations lead to an optimal fuel levy of $24.8 cents per liter—10 times higher than
the actual fuel levy of $2.6 cents per liter, as of 2009 (figure 7a).
The road fund has been funded primarily by transfers from the budget and by donor contributions to
finance road maintenance. The level of the fuel levy has been a critical element of the sector’s policy
agenda. In fact, in 2011, the tax on gasoline was essentially doubled (decree 2011-336 of March 16,
2011). This measure is expected to substantially reduce the funding gap that must be covered by the
government and donors. Yet results remain to be seen. According to the estimates described above, the
fuel levy may still fall short of covering all maintenance needs. In 2009, taking into account internal and
external contributions, the total amount spent on maintenance was equivalent to 0.44 percent of GDP (of
which budget allocations were 0.33 percent of GDP) about 60 percent short of the needs (figure 7b).
Figure 7. Senegal’s expenditure is not enough to catch up with its road rehabilitation backlog
a. Actual and optimal fuel levy b. Deviation from the norms
Source: Gwilliam and others 2008.
Other efforts to diversify funding sources for maintenance and rehabilitation are noticeable,
particularly those involving the private sector. Yet, there is an overdependence on public funds and an
inadequate allocation of resources while financing transport infrastructure. Private sector financing of
transport infrastructure is still quite limited, except for the recently approved Dakar-Diamniadio toll
highway (World Bank 2010c). At the same time, there is no clear optimization of resource allocation to
different projects in this sector. The need for greater selectivity and efficient prioritization of projects for
4 Some sector experts suggest that this is a conservative estimate and that rehabilitation needs are on the order of
$1.4 billion.
0
5
10
15
20
25
30
35
US
cen
ts p
er li
ter
Existing Optimal for maintenance
-100
-80
-60
-40
-20
0
20
40
60
80
spen
din
g a
s %
of
req
uir
emen
ts
maintenance rehabilitation

SENEGAL’S INFRASTRUCTURE: A CONTINENTAL PERSPECTIVE
13
use of government funds is all the more important now in the context of the financial crisis and
subsequent scarcity of public funds.
The binding unavailability of resources for road works has been made more conspicuous by the
ongoing overloading of trucks, which has contributed significantly to road deterioration, especially along
the regional transport corridor from Dakar to Bamako. This situation was exacerbated as international
freight traffic increased when the political turmoil in Côte d’Ivoire forced transport operators to look for
alternative routes. The lack of enforcement of weight controls along the road and the absence of formal
agreements among the countries that utilize these corridors make it very difficult to distribute the costs of
road rehabilitation and maintenance between national taxpayers and international truck operators.
Achieving a consensus on how to distribute the costs and benefits of using this regional transport corridor
is another critical element of the sector’s policy agenda that has yet to be addressed.5
Finally, contrary to the good record of the road network in providing national and regional
connectivity, Senegal has complex issues to tackle regarding the provision of rural road accessibility.
Overall, about one-third of Senegal’s population lives within 2 km of an all-weather road—the same level
as for all low-income countries (or somewhat more, depending on the indicator used) and below the level
found in middle-income countries (see table 3). But beyond the trunk network, accessibility falls off. The
clustering of Senegal’s population along the coast makes it comparatively difficult to achieve significant
increases in rural accessibility by improving the quality of the existing rural network beyond this narrow
band. Even though population density may be low in the remaining zones of the country, extending the
rural road network remains a strong priority for the government because road density is one of the main
determinants of cash income from agricultural sales in Senegal, along with agriculture yield, high-value
crops, and direct selling to the market. Improving accessibility to roads in the more isolated rural regions
is also important to strengthen their integration with the rest of the country.
Rail
Senegal has a binational railway line (between Dakar and Bamako), jointly owned with Mali, which
is part of one of the main West African transport corridors. The Dakar-Bamako railway, which was the
prime mode of transport during colonial times, could easily compete as a more economical means of
transport than road. Senegal’s rail transport, if successfully rehabilitated, could offer the best long-haul
transport to and from Bamako.
Achievements
Efforts have been made to improve the functioning and capacity of Senegal’s rail system and to bring
fresh capital to an investment-starved system. In October 2003, through an international competitive
process, a 25-year concession was granted to TRANSRAIL S.A., a privately owned company. Until then,
the 1,228 km Dakar-Bamako railway was run by two parastatal companies: the Société Nationale des
Chemins de Fer du Senegal (SNCS) operated the Senegalese part (644 km) and the Régie Nationale du
Chemin de Fer du Mali (RCFM) operated the Malian part (584 km) (World Bank 2007b).
5 A reference framework adopted by the United Nations (Delphi Agreements) could be used as a starting point for
these countries to reach an agreement.

SENEGAL’S INFRASTRUCTURE: A CONTINENTAL PERSPECTIVE
14
Though TRANSRAIL productivity is on par or higher than most state-owned railways on the
continent, it still has room for improvement as its performance is significantly below that of other African
railway concessions such as SITARAIL and Camrail (table 5). With an average of 7 cents/tonne-km,
however, TRANSRAIL’s freight tariffs are regionally competitive. By comparison to its preconcession
status, TRANSRAIL has improved both its operational and financial performance although it has yet to
reach financial sustainability. Since its concessioning in 2003, TRANSRAIL’s annual turnover has
increased by 27 percent from $29.7 million to $37.8 million in 2009. But despite this improvement the
company accumulated net losses between 2003 and 2009 of $25 million, leaving it without any margin
for major investments in rolling stock and/or infrastructure rehabilitation.
Challenges
The dilapidated tracks and outdated rolling stock together with the critical financing situation of
TRANSRAIL are the two major problems that need to be urgently addressed in Senegal’s railway sector.
TRANSRAIL’s traffic volume for the years 2005 to 2009 is low—only half the volume of
SITARAIL, the other West African railway concession with a very similar type of binational network—
despite its having access to a greater hinterland demand. The main reason for this is a lack of financing,
dilapidated tracks, and outdated rolling stock. The relatively high rate of derailments (0.45 derailments
per million traffic units, TU) and the low locomotive reliability (15 mainline locomotive breakdowns per
100,000 km) are significant indicators of these problems. These numbers should not come as a surprise,
however, as TRANSRAIL’s assets are old—over 70 years for some portion of the track and more than 30
years on average for locomotives. The segment between Tambacounda and Dioubeba in Senegal
(approximately 464 km), close to the border with Mali, is in poor condition and significantly hampers
Mali’s trade to the Port of Dakar.
Actions along key four axes are needed to improve the situation of the company and the delivery of
services: (i) an increase in production beyond the break-even point (or about 600 million tonne-km/year),
which means securing in excess of $200 million in new investment in both tracks and rolling stock; (ii)
the further reduction of the workforce and the training of new employees to counteract the depletion of
personnel skills; (iii) more balanced intermodal competitive (road/rail) environment in host countries; and
(iv) funding of a short- and medium-term cash deficit through an increase in working capital as part of a
broad restructuring of both the concession agreement and current shareholder structure.
TRANSRAIL’s short-term prospects are grim unless tracks and rolling stock are rehabilitated and its
concession contract restructured. TRANSRAIL recently proposed an emergency investment plan that is
deemed to be insufficient given its operational needs. The railway faces critical cash flow and insolvency
issues; the company is almost bankrupt, with significant public service obligations and a build-up of
arrears. The precarious operational situation is leading to unpredictable performance.
Senegal’s rail transport, if successfully rehabilitated, could offer the best long-haul transport to and
from Dakar. The role of the Dakar-Bamako railway, which was the prime mode of transport during
colonial times, ought to be revitalized since it is a more economical means of transport than road. The
management concession to a private operating company has shown that years of mismanagement and
neglect can be offset; but to achieve long-lasting improvements, a major investment program, larger than
the one already in place, would need to be funded and implemented.

SENEGAL’S INFRASTRUCTURE: A CONTINENTAL PERSPECTIVE
15
Table 5. Railway indicators for Senegal and select other countries, 2005–09
TRANSRAIL
(Senegal–Mali)
SITARAIL
(Côte d’Ivoire—Burkina Faso)
Camrail
(Cameroon)
Madarail (Madagascar)
Concessioned (1)/ state run (0) 1 1 1 1
Freight traffic volume (million tonne-km) 393 794 1,061 113
Passenger traffic volume (million passenger-km) 91 210 377 3
Total traffic volume (million TU)* 429 878 1,212 114
Efficiency
Staff: 1,000 TU per staff 247 558 547 118
Derailments per million TU 0.45 0.01 0.15 2.31
Mainline locomotive breakdowns per 100,000 km 15 6 9 6
Tariffs
Average unit tariff, freight, US cents/tonne-km 7.0 6.3 8.1 6.0
Source: Bullock 2009. Derived from the AICD rail operator database (www.infrastructureafrica.org/aicd/tools/data).
Note: *2.5 passenger-km equivalent to 1 TU, 1 tonne-km equivalent to 1 TU. TU = traffic unit.
Ports
Achievements
The overall safety of maritime traffic improved significantly in the early 2000s, with the adoption of
an updated maritime code and improvements in navigation and signaling equipment at the ports of Dakar,
Kaolack, and Ziguinchor. The Port of Dakar is by far the most important port in Senegal and one of the
most important ports in West Africa. Its traffic increased by over 300 percent between 1995 and 2005,
going from 87,000 twenty-foot equivalent units (TEUs) in 1995 to over 363,000 TEUs in 2006.
The Dakar port has transit traffic arrangements with Mauritania; in fact 25 percent of that country’s
import volume is moved by road from Dakar, in large part because Mauritania’s port at Nouakchott
cannot meet the sizable demand of the country’s potential container transshipment traffic. In recent years,
traffic volumes at the Port of Dakar have increased as the unfortunate crisis in Côte d’Ivoire has forced
Mali and Burkina Faso to shift trade traffic from Abidjan to Dakar, now emerging as a key alternative
corridor in West Africa. To put things in perspective, until 2000 Abidjan captured about 80 percent of all
transit traffic to and from Mali. By 2003 that figure had dropped to just 14 percent, as traffic was diverted
to Dakar in Senegal, Lomé in Togo, and Tema in Ghana. Dakar soon became the most important port for
Mali, capturing one-third of its traffic.
The Dakar port is predominately a hybrid tool port: its infrastructure and most of its operations—
including some frontline operations—remain in public hands. The container port was given in concession
to Bollore; when this concession expired in 2008, a new 25-year concession contract was granted to
Dubai Ports World. This concession includes the development and operation of the existing container
terminal as well as the building and operation of a new container terminal at Port du Futur. The new
operator has already started operations and has launched a significant investment program. The
continuous involvement of the private sector in frontline activities is a step forward vis-à-vis the service
ports model that predominates in SSA.

SENEGAL’S INFRASTRUCTURE: A CONTINENTAL PERSPECTIVE
16
The involvement of the private sector
has improved the financial viability of the
Port of Dakar—handling costs have fallen
substantially, particularly due to the
reduction of dwell times in the port. Time
to export and import is just one-third of the
level of other Sub-Saharan African
countries and about the level of the
Organisation for Economic Co-operation
and Development (OECD) countries. Costs
of importing to Senegal are lower than the
regional average, but 1.6 times the costs of
importing to an OECD country, whereas costs of exporting from Senegal are now 25 percent lower than
the Sub-Saharan African average and at the same level as those faced by OECD countries (table 6).
The sector has also benefited from greater levels of traffic between the Port of Dakar and Port of
Ziguinchor. Passenger and freight services increased from two times per week in 2000 to three times per
week in 2008. Over the same period, the number of passengers increased from 500,000 to 504,000 and
tonnes of freight from 100,000 to 300, 000.
Challenges
Transportation services within the Port of Dakar—from the ships to the warehouses—present a mixed
performance record. On the one hand, the average container dwell time was 7 days as of 2006—the
lowest among African competitors—and the average truck turnaround time, at 5 hours, was second only
to Lomé, Togo. On the other hand, general-cargo performance indicators (vessel stay, preberth waiting
time, and handling charges) rank very poorly when compared with neighboring ports (table 7).
Moreover, multimodal coordination remains an issue of concern, and the lack of a multimodal
strategy for transportation in Senegal has seriously hindered the capacity of the port to realize its potential
as a regional trade hub. The port has failed to fully capitalize on the consequences of the political crisis
and instability in Côte d’Ivoire (whose vessels have needed alternate routes to deliver their freight in the
region).
Table 6. Costs of exporting and importing
Indicator Senegal SSA OECD
Cost to export ($ per container) 1,098 1,942 1,090
Cost to import ($ per container) 1,940 2,365 1,146
Time to export (days) 11 34 11
Time to import (days) 14 39 11
Documents to export (number) 6 8 4
Documents to import (number) 5 9 5
Source: World Bank 2011a. Note: SSA= Sub-Saharan Africa; OECD = Organisation for Economic Co-operation and Development

SENEGAL’S INFRASTRUCTURE: A CONTINENTAL PERSPECTIVE
17
Table 7. Port indicators for Senegal compared against those of select ports in Africa, 2006
Port Dakar, Senegal
Cotonou, Benin
Abidjan, Côte d'Ivoire
Tema, Ghana
Apapa, Nigeria
Harcourt, Nigeria
Lome, Togo
Container dwell time—average (days) 7 12 12 25 42 13
Truck processing time for receipt and delivery of cargo (turnaround time)—average (hours)
5 6 2.5 8 6 4
General-cargo vessel preberth waiting time—average (hours)
24 48 2.9 9.6 36 38.4
General-cargo vessel stay time (turnaround time)—average (hours)
60 48 2.2 48 40.8 45.6
Container cargo—total handled (TEU, annual) 331,191 158,201 500,119 420,000 336,308 7,900 460,000
Container-cargo-handling charge (ship to gate)—average ($ per TEU)
160 180 260 168 155 220
General-cargo-handling charge (ship to gate)—average ($ per tonne)
15 8.5 13.5 10 8 8 9
Bulk dry-handling charge (ship to gate or rail)—average ($ per tonne)
5 5 5 3 5
Source: Derived from the AICD port operator database (www.infrastructureafrica.org/aicd/tools/data).
Note: *Concession for building and operating container terminals, not the whole port.
TEU = 20-foot equivalent unit.
Figure 8. Evolution of traffic and vessels moving through the Port of Dakar
a. Traffic, 2005–09 b. Vessels, 2003–09
Source: Port Autonomme de Dakar 2010.
Air transport
Achievements
Senegal is an emerging hub and a major player in air transportation in West Africa (table 8, figure 9),
ranking only second to Nigeria. Senegal’s air transport sector accounts for more than 2.6 million seats per
year across all traffic categories and has experienced rapid growth over the past few years. The
Senegalese market grew more than 50 percent between 2001 and 2007, as the number of seats available
0
100000
200000
300000
400000
500000
600000
700000
800000
900000
2005 2006 2007 2008 2009
Global transit Transit to Mali
Imports Exports
0
500
1000
1500
2000
2500
3000
2003 2004 2005 2006 2007 2008 2009
Vessels Container shipsCarriers TankersOthers

SENEGAL’S INFRASTRUCTURE: A CONTINENTAL PERSPECTIVE
18
increased from 1.67 million to 2.6 million (figure 10a). The bulk of Senegal’s air transport market is
international (around 85 percent of total seats), excluding flights to Sub-Saharan and North Africa. Traffic
in Dakar Airport increased from 1.1 million passengers in 2000 to 1.7 million in 2006 (World Bank
2008).
Figure 9. Senegal is an emerging hub for West Africa
Source: AICD 2010.
Senegal’s position in the international air transport market has been strengthened recently as security
at the airport was certified by the International Civil Aviation Organization (ICAO) and rated satisfactory
by the U.S. Federal Aviation Administration/ International Aviation Safety Assessment (FAA/IASA). The
FAA rating has led to additional traffic from the United States, since Dakar Airport is the only West
African airport to have acquired such certification. Also, safety has improved following the
modernization of the National Department of Meteorology, which provides weather updates for the entire
transport sector. Foreign airlines (that is, South African Airlines, Brussels Airlines, and Delta Airlines)
are now operating passenger and freight services from Léopold Sédar Senghor International Airport.
Between 2000 and 2006, take-offs and landings increased by 17 percent and passenger traffic by 43
percent as tourism increased—and promises to continue doing so (World Bank 2008).

SENEGAL’S INFRASTRUCTURE: A CONTINENTAL PERSPECTIVE
19
Table 8. Benchmarking air transport indicators for Senegal and other select countries
Country Senegal Côte d’Ivoire Ghana Nigeria
Traffic (2007)
Domestic seats (seats per year) 130,000 — 144,183 1,199,572
Seats for international travel within Africa (seats per year)
1,260,000 851,003 909,819 1,373,745
Seats for intercontinental travel (seats per year) 1,230,000 297,891 832,895 2,437,702
Seats available per capita 0.23 0.06 0.08 0.09
Herfindahl-Hirschmann Index—air transport market (%) 11.64 9.75 6.28 11.28
Quality
Percent of seat-km in newer aircraft 98 90.9 96.8 71.42
Percent of seat-km in medium or smaller aircraft 39.3 52.3 15.7 29.6
Percent of carriers passing IATA/IOSA audit 50.0 0 0 28.6
FAA/IASA audit status No audit Fail Fail No audit
Source: Bofinger 2009. Derived from the AICD national database (www.infrastructureafrica.org/aicd/tools/data).
Note: Herfindhal-Hirschmann Index (HHI) is a commonly accepted measure of market concentration. It is calculated by squaring the market share of each firm competing in the market and then summing the resulting numbers. All data as of 2007 are based on estimations and computations of scheduled advertised seats, as published by the Seabury Aviation Data Group. This captures 98 percent of worldwide traffic, but a percentage of African traffic is not captured by these data. FAA = U.S. Federal Aviation Administration; IASA = International Aviation Safety Assessment; IATA = International Air Transport Association; IOSA = IATA International Safety Audit. — = Not available.
On par with this growth trend, Senegal’s international connectivity has been progressively increasing,
while domestic connectivity has remained constant. Intercontinental city pairs went up from 13 in 2004 to
18 in 2007, and international city pairs went from 20 to 24 during the same period (figure 10b).
International services are competitive with a Herfindahl-Hirschmann Index of only 10 percent (table 8).
Figure 10. Evolution of seats and city pairs in Senegal, 2001–07
a. Seats b. City pairs
Source: Bofinger 2009. Derived from the AICD national database (www.infrastructureafrica.org/aicd/tools/data).
Note: As reported to international reservation systems.
-
500,000
1,000,000
1,500,000
2,000,000
2,500,000
3,000,000
2001 2004 2007
Nu
mb
er o
f se
ats
Total International Intercontinental Domestic
0
5
10
15
20
25
30
35
40
45
50
2001 2004 2007
Cit
y P
airs
Total International Intercontinental Domestic

SENEGAL’S INFRASTRUCTURE: A CONTINENTAL PERSPECTIVE
20
The aircraft fleet serving Senegal was renewed in recent years, as the share of recently manufactured
aircraft rose from 84 percent in 2001 to 98 percent in 2007 (table 8). Also, as of 2007, about 39.3 percent
of aircraft serving Senegal were in the small- or medium-sized category, making its fleet among the
smallest in the region. The renovation and scale-down of aircraft size promises to facilitate route
consolidation toward a hub-and-spoke system.
Challenges
Senegal has a very thin domestic air transport market with only 127,244 domestic seats. While
Senegal has strongly developed its international services for air transport, the domestic market is barely
developed; as of 2007 there were only four domestic routes available that were being served by a single
carrier (figure 10a). While the financial viability of this market segment may not equal that of
international services, improving access to air transport within the country for passengers and freight
could help reach remote areas such as Casamance or expand options for tourism to new locations. An
assessment of the benefits of deepening the domestic air transport market would need to consider a
multimodal transport strategy.
With respect to air transportation services, Senegal once had one of the most active airlines in Africa:
SONATRA Air Senegal (SAS). In 2001 the government sold 51 percent of the shares of the state-owned
SAS to Royal Air Maroc (RAM) and changed its name to Air Senegal International (ASI). Prior to its sale
SAS had stopped operations for two years. RAM was given exclusive rights to all domestic flights for a
period of 10 years through a concession contract and was allowed to operate flights to neighboring
countries with the same rights as those enjoyed by Air Afrique and other companies. Furthermore, ASI
was given unrestricted authority to determine its own company strategy. Between 2001 and 2005, ASI
increased its traffic and labor force by fourfold, expanding its fleet from two to five airplanes and
augmenting its revenues sevenfold. In February 2009 the airline suspended all its operations. Senegal
Airlines replaced ASI and began operations in early 2010. As of January 2011 the airline was serving
Burkina Faso, the Gambia, Côte d’Ivoire, Guinea, Guinea-Bissau, Mali, and Mauritania with two A-320s,
but a full-fledged recovery of the market is still in progress. The region’s air market still has a vacuum
that needs to be filled, and if Senegal Airlines plays its cards correctly, it could thrive.
Finally, Senegal’s safety oversight is at the level of the global average. Though this may compare
favorably to surrounding African nations, by the ICAO’s definition it is not good enough; today Senegal
would not pass an FAA/IASA audit. There is still room for improvement.
Water supply and sanitation
Achievements
Since 1995 Senegal has undertaken important institutional reforms and significant steps to reach the
MDGs. The existing public enterprise SONEES was replaced by SONES,6 an asset holder, and an
affermage contract was granted to SDE,7 a private operator, for the provision of water services in Dakar
as well as in secondary and tertiary cities, covering 35 percent of the country’s population. Under this
6 Societé nationale des Eaux du Senegal.
7 Senegalaise des Eaux

SENEGAL’S INFRASTRUCTURE: A CONTINENTAL PERSPECTIVE
21
arrangement, SONES focuses on infrastructure development and financial management while SDE is in
charge of the operations and maintenance and, to some extent, the rehabilitation and extension of the
distribution network. On the sanitation side, the public company ONAS operates under an affermage
contract with SONES.
The institutional reforms sent a robust signal to the markets. Between 1996 and 2006 close to $420
million was invested in the urban water sector, with only 20 percent being passed on to SONES as grants
or capital contributions. The remaining 80 percent was made available by external financiers.
Achievements during the past 10–15 years have been remarkable. Nowadays, Senegal has one of the
highest levels of access to piped and stand-post water on the African continent. About 60 percent of the
population has access to some form of utility water, which compares very favorably against even the 70
percent utility-water access found in middle-income countries. In urban areas, access to piped water is
now almost universal—a marked improvement from the mid-1990s, when it was about 80 percent. This
rate of success is due to a combination of reforms to the utility along with the implementation of social
connection programs that have granted 70 percent of current SDE customers with low-cost water
connections (customers pay a $36 deposit rather than the full connection cost of $150).
Senegal stands as one of the countries with the lowest levels of surface water usage, at 3.3 percent of
the population— substantially below not only the level of other low-income countries but also of middle-
income countries (table 9). Around 2 percent of the population has been gaining access to piped water
every year—well above the Sub-Saharan African average (figure11a). In urban areas an estimated 1.7
million people gained access to piped water between 1999 and 2005. Over time fewer people are using
boreholes due to contamination and pollution problems and 1 percent of the population that once used
boreholes has transitioned to other sources of water.
Equitable access programs have also been put in place in the sanitation sector, allowing customers to
pay only 25 percent of the construction costs of on-site sanitation facilities. As a consequence, the
population served by flush toilets more than tripled from 11 percent to 35 percent over the period 1995–
2005; around 3.5 percent of the population gained access to flush toilets every year (figure 11b), a figure
well above other African country levels. Similarly, the percentage of population practicing open
defecation was cut by almost half, from 41 percent to 25 percent, and around 1 percent of the population
is leaving open defecation as a mode of sanitation every year. Very interestingly, these impressive
achievements came from improving the quality of sanitation services from improved and traditional
latrines to flush toilets (septic tanks) (table 9).

SENEGAL’S INFRASTRUCTURE: A CONTINENTAL PERSPECTIVE
22
Table 9. Benchmarking water and sanitation indicators
Unit
Low-income
countries Senegal
Middle-income
countries
Mid-2000s Late 1990s Mid-2000s Mid-2000s
Access to piped water % pop 10.5 30.1 40.9 52.1
Access to stand posts % pop 16.2 18.3 19.7 18.9
Access to protected wells/boreholes % pop 38.3 10.5 7.0 6.0
Access to nonprotected wells/boreholes % pop 33.5 28.8
Access to surface water % pop 37.4 2.3 3.3 13.0
Access to flush toilets % pop 4.9 11.2 34.7 40.8
Access to improved latrines % pop 9.9 34.6 24.6 1.4
Access to traditional latrines % pop 50.1 18.6 14.9 30.4
Open defecation % pop 40.3 41.0 25.2 14.3
Urban water assets in need of rehabilitation % 35.5 — 25.0 25.0
Domestic water consumption Liter/capita/day 72.4 49.1 54.5(*) 165.9
Revenue collection % sales 92.7 88.8 96.73 100.0
Distribution losses % production 34.3 25.5 20.94 26.8
Cost recovery % total costs 56.0 59 98 80.6
Operating cost recovery % operating costs 65 95 144 145
Labor costs Connections per employee 158.6 225.6 284.0(*) 368.7
Total hidden costs as % of revenue % 109 94.27 13.08 167
Source: Demographic and Health Surveys (DHS) and AICD water and sanitation utilities database (www.infrastructureafrica.org/aicd/tools/data).
Note: DHS figures on access are as of 1997 and 2005 and utility numbers are as of 2000 and 2008, except when indicated. (*) Figures as of 2005.
— = Not available.
Senegal’s urban water utility, SDE, has set an example among Sub-Saharan African countries with its
good bill-collection record and reduced water losses. Together SONES and SDE provide a model of a
strong public-private partnership. Water has been made available 24/7 in large urban areas and several
smaller towns. Distribution losses have been kept around 21 percent, compared with 34 percent in other
African low-income countries, and even well below of what is observed in African middle-income
countries (table 9). SDE captures 95 percent of the revenue stream that it needs to operate effectively, a
comparatively good performance by regional standards. Also, the utility’s collection ratio is 97 percent of
its sales (table 10). Labor productivity doubled between 1996 and 2006, going from 5.8 employees per
1,000 connections to 2.8.
SDE’s continuous improvements in most efficiency indicators translate into relatively small hidden
costs associated with operational inefficiencies (box 1). In the early 2000s hidden costs represented the
equivalent of 94 percent of the utility’s revenues, but since then there has been a systematic improvement;
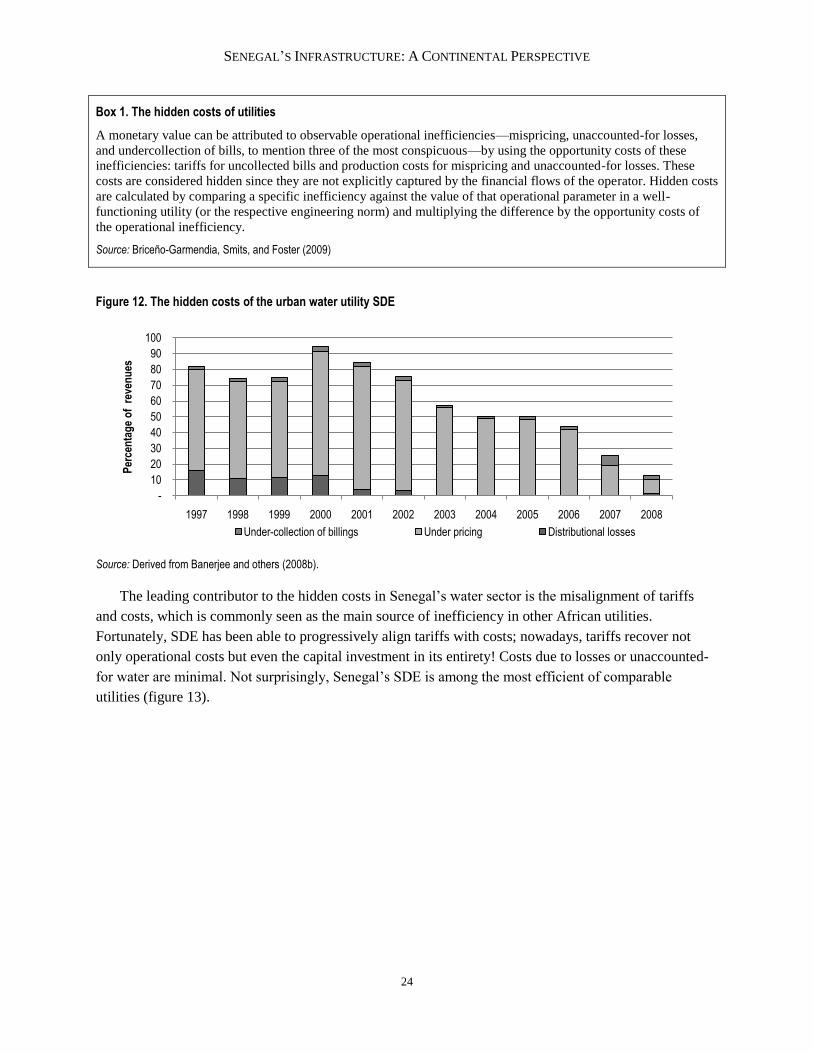
as of 2008 hidden costs represented a mere 13 percent of revenues (figure 12).

SENEGAL’S INFRASTRUCTURE: A CONTINENTAL PERSPECTIVE
23
Figure 11. Rates of expansion of access to safe water and improved sanitation are above the African average
a. Water b. Sanitation
Source: World Health Organization (2010a and 2010b) from Demographic and Health Surveys for 1993, 1999, and 2005. Note: SSA = Sub-Saharan Africa.
Table 10. Evolution of operational indicators associated with the urban water utility SDE
Year
Water delivered (million
m3/year)
System losses
(%)
Collection ratio
(%)
Average cost
($/m3)
Average effective tariff
($/m3)
Total hidden costs
($ million/year)
Total hidden costs
(% revenues )
2000 78.86 26.10 97.00 1.05 0.57 46 94.27
2001 84.00 21.90 97.20 1.05 0.56 44 84.66
2002 87.86 21.60 97.71 1.04 0.59 42 75.32
2003 90.90 20.10 98.17 1.20 0.74 43 57.41
2004 95.09 19.90 98.30 1.25 0.82 42 50.28
2005 99.90 19.90 97.86 1.25 0.82 44 50.45
2006 103.63 19.80 98.20 1.25 0.86 42 43.70
2007 108.71 19.70 93.73 1.25 1.03 30 25.35
2008 109.17 20.94 96.73 1.25 1.14 17 13.08
Source: Derived from Briceño-Garmendia, Smits, and Foster (2009).
-2.0
-1.0
0.0
1.0
2.0
3.0
4.0
Pip
ed w
ater
Sta
nd p
osts
Wel
l/bor
ehol
es
Sur
face
wat
er
% p
op
ula
tio
n g
etti
ng
acc
ess
ever
y ye
ar
Senegal SSA
-2.00
-1.00
0.00
1.00
2.00
3.00
4.00
Flu
sh T
oile
ts
Impr
oved
latr
ines
Tra
ditio
nal l
atrin
es
Ope
n de
feca
tion
% p
op
ula
tio
n g
etti
ng
acc
ess
ever
y ye
arSenegal SSA
SENEGAL’S INFRASTRUCTURE: A CONTINENTAL PERSPECTIVE
24
Box 1. The hidden costs of utilities
A monetary value can be attributed to observable operational inefficiencies—mispricing, unaccounted-for losses,
and undercollection of bills, to mention three of the most conspicuous—by using the opportunity costs of these
inefficiencies: tariffs for uncollected bills and production costs for mispricing and unaccounted-for losses. These
costs are considered hidden since they are not explicitly captured by the financial flows of the operator. Hidden costs
are calculated by comparing a specific inefficiency against the value of that operational parameter in a well-
functioning utility (or the respective engineering norm) and multiplying the difference by the opportunity costs of
the operational inefficiency.
Source: Briceño-Garmendia, Smits, and Foster (2009)
Figure 12. The hidden costs of the urban water utility SDE
Source: Derived from Banerjee and others (2008b).
The leading contributor to the hidden costs in Senegal’s water sector is the misalignment of tariffs
and costs, which is commonly seen as the main source of inefficiency in other African utilities.
Fortunately, SDE has been able to progressively align tariffs with costs; nowadays, tariffs recover not
only operational costs but even the capital investment in its entirety! Costs due to losses or unaccounted-
for water are minimal. Not surprisingly, Senegal’s SDE is among the most efficient of comparable
utilities (figure 13).
-
10
20
30
40
50
60
70
80
90
100
1997 1998 1999 2000 2001 2002 2003 2004 2005 2006 2007 2008
Per
cen
tag
e o
f r
even
ues
Under-collection of billings Under pricing Distributional losses

SENEGAL’S INFRASTRUCTURE: A CONTINENTAL PERSPECTIVE
25
Figure 13. Hidden costs of select water utilities, as a percentage of revenues
Source: Derived from Briceño-Garmendia, Smits, and Foster (2009).
Challenges
In both rural and urban areas, access to improved water and sanitation has improved substantially since
the early 1990s, but there are still important access gaps between rural and urban areas as well as between
Dakar and other urban areas (table 11). As of 2005, 89 percent of the population living in cities had
access to tap water, compared to only 41 percent in rural areas. Among urban areas, the Dakar area has
almost universal coverage while in other urban centers up to two-thirds of the population has access to
utility water. Among rural areas, too, there are wide disparities in access to piped-water systems ranging
from 22.7 percent in the Kolda region to 73 percent in the Fatick region.
Table 11. Rural and urban access to improved water and sanitation in Senegal
1986 1993 1997 2005 2009
Improved water Rural 29.2 43.9 46.2 64 73.6
Urban 55.1 90.6 89.9 92 97.0
Improved sanitation Rural 25.9 24.9 24.0 26.2 28.9
Urban 79.5 77.1 78.3 — —
ß Source: WHO Joint Monitoring Program 2010a and 2010b, from the Demographic and Health Surveys for 1986, 1993, 1997, and 2005.
Note: Improved water defined as piped water, stand posts, and safe wells/boreholes; improved sanitation defined as flush toilets, septic tanks, and improved latrines, accordingly to the JMP methodology.
— = Not available.
In terms of sanitation, 25 percent of the population still practices open defecation. This figure, while
much better than that of other African low-income countries, is twice as high as what is seen in middle-
income countries and a source of concern in itself.
In general, progress on the sanitation front has been much more modest than in the water sector, due
to the enormous and widening gap in access to improved water supply between rural and urban areas. As
of 2008 access to sanitation in urban areas was estimated at 63.6 percent; in rural areas it was as low as
28.3 percent.
0
20
40
60
80
100
120
140
Mali Liberia Niger Cote d'Ivoire Ghana Benin Senegal Burkina Faso
Per
cen
tag
e o
f re
ven
ues
Collection Inefficiencies Underpricing Losses

SENEGAL’S INFRASTRUCTURE: A CONTINENTAL PERSPECTIVE
26
Power
Achievements
In terms of access to electricity, Senegal is almost at the level of African middle-income countries and
well above other low-income, nonfragile countries. About 47 percent of the population has access to
electricity, and this figure reaches over 80 percent in urban areas (table 12). The relative success in
expanding access is undoubtedly linked to well-planned reforms in the sector.
Table 12. Benchmarking Senegal’s power indicators
Unit
Low-income, nonfragile countries
Senegal Middle-income
countries Late 1990s Early 2000s Mid-2000s
National access to electricity % population 32.8 36.2 — 47.1 49.5
Urban access to electricity % population 72.8 72.8 — 80.4 74.4
Rural access to electricity % population 12.7 7.8 — 15.8 26.3
Population gaining access annually % population/year 4.4 — 2.7 12.1
Mid-2000s Late 2000s
Installed power generation capacity MW/million people 20 25 799
Power consumption (residential) kWh/capita 107 179 4,479
Power outages Day/year 124.5 — 141 70.6
Firms’ reliance on own generator % consumption 21 6.7 24.7 11
Firms’ value lost due to power outages % sales 6 4.3 5.0 2
Delay in obtaining an electrical connection Days 41 9.4 — 12
Collection ratio % billings 93 — 98.8 100 100
System losses % production 24 — 21.5 22.5 20
Cost-recovery ratio % total cost 89 — 58.3 74 85
Total hidden costs as % of revenue % 68 — 90 52 6
Effective power tariffs () Senegal
Predominantly hydro generation
Predominantly thermal generation
Other developing
regions
Residential at 100 kWh/month US cents/kWh 23.8 10.7 15.7
5.0– 10.0 Commercial at 900 kWh/month US cents/kWh 22.8 12.9 19.0
Industrial at 100 kVA US cents/kWh 15.8 9.3 13.0
Average tariff US cents/kWh 22.7 — 17.0
Source: Eberhard and others 2008. Other sources include access data coming from the Demographic and Health Surveys 1996 and 2001; utility data from the AICD electricity database (www.infrastructureafrica.org/aicd/tools/data) Note: kWh = kilowatt-hour; MW = megawatts; kVA = kilovolt ampere. — = Not available.
Senegal has been moving from a unique vertical integrated provider (SENELEC)—which generates,
transmits, and distributes electricity—to a model where generation, transmission, and retail distribution is
liberalized and there is room for promising alliances with the private sector.
Senegal has had already a long history of private sector participation in the sector, under various
kinds of contracts and with differing results. The first concession for SENELEC was granted in 1999 but

SENEGAL’S INFRASTRUCTURE: A CONTINENTAL PERSPECTIVE
27
cancelled in 2000. More recently, in 2009, a 25-MW build-operate-run-transfer (BORT) was granted to
ONE (Morocco) for the rural electrification of 550 villages along the Saint Louis–Dagana–Podor axis.
Rights to serve rural communities are also being awarded to small-scale providers under concession
arrangements with a public subsidy. For power generation, a build-operate-transfer (BOT) agreement was
signed in 1997 for a 56-MW combined-cycle power plan, and one signed in 2005 for a 65.7-MW heavy-
fuel diesel plan (for an independent power producer [IPP] at Kounoune). Under a different contractual
arrangement, there was a rental agreement signed in 2005 for the 40-MW Aggreko Dakar Temporary
Station to supply temporary power to SENELEC for two years.
Figure 14. Power prices and costs in Sub-Saharan Africa
a. Average tariff
b. Costs
Source: Power price: Briceño-Garmendia and Shkaratan 2010; Power costs: Eberhard and others 2008. Note: DRC = Democratic Republic of Congo.
Also Senegal has systematically increased its participation in regional initiatives. The country is
active in the Senegal River Basin Organization,8 and it is also interconnected to the West African Power
Pool (WAPP). Its increased participation in the regional electricity market is an important step toward
addressing the lack of sufficient electricity supply to the economy, which may be helped by importing
hydroelectricity, mainly from Guinée through the OMVG9, and also gas-fueled electricity from Côte
d’Ivoire.
8 Organisation pour la Mise en valeur du Fleuve Sénégal (OMVS).
9 Gambia River Basin Development Organisation.
0
10
20
30
40
50
Libe
ria
Cha
d
Cap
e …
Sen
egal
Bur
kina
…
Mal
i
Uga
nda
Ken
ya
DR
C
Rw
anda
Ben
in
Nig
er
Cot
e …
Nam
ibia
Mad
agas
…
Cam
eroo
n
Gha
na
Bot
swan
a
Moz
ambi
…
Leso
tho
Tan
zani
a
Sou
th …
Eth
iopi
a
Zim
babw
e
Nig
eria
Mal
awi
DR
C
Zam
bia
US
cen
ts p
er K
Wh
05
1015202530354045
Mal
i
Nig
er
Con
go
Ben
in
Cap
e V
erde
Cam
eroo
n
Rw
anda
Bur
kina
Fas
o
Mad
agas
car
Ken
ya
Tan
zani
a
Bot
swan
a
Cha
d
Gha
na
Sen
egal
Nam
ibia
Cot
e d'
Ivoi
re
Leso
tho
Uga
nda
Nig
eria
Mal
awi
Moz
ambi
que
Eth
iopi
a
DR
C
Zam
bia
Sou
th A
fric
a
US
cen
ts p
er K
wH
Operating Costs Capital Costs

SENEGAL’S INFRASTRUCTURE: A CONTINENTAL PERSPECTIVE
28
Challenges
Senegal’s power supply is insufficient to meet the existing and rapidly growing demand. Between 2005
and 2009, generation capacity grew from 365 MW to 510 MW,10
but demand kept growing at a rate of
25–30 MW per year. An equilibrium between supply and demand has never been reached. As an
example, in August–September 2009, an interruption of fuel supply linked to SENELEC’s liquidity issues
put about 10 units out of operation and caused major outages over several days. Frequent disruptions
highlighted the structural problems and capacity shortages.
The country’s installed generation capacity was only about 25 MW per million people (table 12),
making it an unreliable system—a problem widespread throughout the African countries. The number of
outages in a typical month in Senegal is almost 12, which is aligned with the averages found in other Sub-
Saharan countries. By comparison, a typical power security standard in the United States is 1 day in 10
years. The percentage of firms relying on their own generator in Senegal is at 55.4 percent, above the
Sub-Saharan African average of 43.1 percent. Not surprisingly, one-fourth of the electricity consumed in
Senegal comes from private generation (table 13).
Table 13. Performance of the electricity sector in West African countries
Burkina
Faso (2009)
Cape Verde (2006)
Côte d’Ivoire (2009)
Ghana (2007)
Mali (2007)
Mauritania (2006)
Niger (2006)
Nigeria (2007)
Senegal (2007)
Simple average
Number of power outages in a typical month 10.8 12.5 4.5 9.7 4.4 3.7 20.7 26.8 11.8 14.4
Average duration of outages (hours) 3.3 5.3 4.6 12.6 3.9 2.9 0.5 8.2 6.2 6.6
Loss due to outages (% of sales) 5.8 8.9 5 6 1.8 1.6 2.5 8.9 5 6.4
% of firms owning/sharing generator 11.6 39.8 6.5 26.6 23.8 28.6 24.8 85.7 55.4 43.1
Electricity from own generator (%) 10.9 4.6 15.1 29.5 16 9.2 10.5 60.9 24.7 30.6
Source: World Bank 2011b.
Note: Year of the survey in brackets.
SENELEC, Senegal’s power utility, faces major financial problems. Power tariffs are admittedly
relatively high when compared to other countries in the region, reflecting the fact that the cost of
generation is high due to the percentage of thermal power (371 MW out of the 489 MW from
SENELEC’s plants are thermal, and the rest 66 MW are hydropower) (figure 9a). While tariffs somehow
allow for recovering operational costs, they still are below the long-run marginal cost of the power sector,
implying that a capital subsidy of close to 25 percent of total costs is tacitly in place (figure 15).
10
The installed capacity is 549.1 MW but, given the age of some of the equipment, the real generation capacity
accounted for only 510 MW as of 2009. Sixty-five percent of this corresponds to SENELEC’s production and the
remaining 35 percent to private production.

SENEGAL’S INFRASTRUCTURE: A CONTINENTAL PERSPECTIVE
29
The gap between tariffs and the
current cost of electricity is one of the
causes of SENELEC’s financial problems
and of the sector’s as a whole. An increase
in tariffs from 17.2 cents in June 2007 to
22.7 cents in 2009 (table 14) was
insufficient to bridge this gap. In January
2009 tariffs dropped by 12 percent and in
July 2009 they went up 8 percent.
Moreover, although SENELEC’s financial
gap is expected to be met by the public
sector, government transfers are
insufficient and always late. As a result,
the revenue gap for 2009 reached FCFA 8
billion as transfers fell short by FCFA 36
billion of the expected total of FCFA 43 billion for the year. The delays also created additional financial
fees for the company, as electricity generation, transmission, and distribution facilities further deteriorated
due to a lack of maintenance and renewal.
Table 14. Evolution of hidden costs associated with SENELEC
Electricity produced
(GWh/year) System losses
(%) Collection ratio
(%) Average total cost ($/kWh)
Average effective tariff
($/kWh)
Total hidden costs ($
million/year)
Total hidden costs (%
revenues)
2003 1,826 21.5 98.8 0.24 0.14 182.4 90.1
2004 1,952 21.1 99.6 0.24 0.15 176.4 74.9
2005 2,171 21.2 99.7 0.24 0.15 202.3 79.3
2006 2,192 20.6 100.0 0.29 0.17 273.4 88
2007 2,306 22.5 100.0 0.29 0.21 204.3 52
Source: Eberhard and others 2008; Briceño-Garmendia and Shkaratan 2010.
Note: GWh = gigawatt-hour; kWh = kilowatt-hour.
SENELEC’s financial health is also severely impacted by persistent operational inefficiencies. Losses
in transmission and distribution have amounted to about 20 percent of produced electricity during the past
decade; the accepted engineering norm is 10 percent of electricity produced. When combined with the
implicit cost-tariff deviation, the hidden costs of SENELEC amount to 60 percent of its revenues (box 1,
figure 16).
Figure 15. Prevailing tariffs in line with operational costs, but embedded is an important subsidy of capital costs
Source: Briceño-Garmendia and Shkaratan 2010.
Note: Light gray area represents capital subsidy.
Capital Subsidy
0
5
10
15
20
25
30
35
Existing costs Existing operating
Costs
Average tariff Average revenue
Existing capital costs
US
$ ce
nts
per
kW
h

SENEGAL’S INFRASTRUCTURE: A CONTINENTAL PERSPECTIVE
30
The hidden cost of SENELEC’s
inefficiencies, while moderate in
comparison to other countries in the
region, are significant and continue to
penalize the financial performance of
the operator (figure 17). Around three-
fourth of the hidden costs are the result
of underpricing, and transmission and
distributional losses, at 21 percent of
production, are responsible for the
remaining one-fourth. In the case of
SENELEC, these hidden costs
underestimate the magnitude of the
operator’s financial problems, as they do not include the total cost of serving the debt but only the
payment of interest and other fees (leaving aside the repayment of the principal).
Figure 17. Hidden costs of power utilities in select West African countries, as percentage of revenues
Source: Derived from Banerjee and others (2008b) and Briceño-Garmendia, Smits, and Foster (2009).
Information and communication technologies
Achievements
Telecommunications has been a driving force behind Senegal’s growth over the past decade, which is
reflected in the strong contribution of this sector to the country’s GDP—around 65 percent in 2007. The
market reforms of the 2000s go a long way toward explaining this progress in the ICT sector. The reforms
started with the partial divestiture of SONATEL11 in 1997, with France Telecom as the strategic partner
(later on Orange), followed by the granting of a 20-year mobile license to Milicom Senegal in 1998 and a
11
Societé Nationale des Telecommunications du Sénégal.
0
20
40
60
80
100
120
140
160
180
Liberia Niger Mali Ghana Burkina Faso Cote d'Ivoire Senegal
Per
cen
tag
e o
f re
ven
ues
Collection Inefficiencies Underpricing Losses
Figure 16. The most significant inefficiency is underpricing
Source: Derived from Briceño-Garmendia, Smits, and Foster (2009).
0.0
20.0
40.0
60.0
80.0
100.0
2003 2004 2005 2006 2007
Per
cen
tag
e o
f th
e re
ven
ues
Losses Under pricing Collection inefficiencies

SENEGAL’S INFRASTRUCTURE: A CONTINENTAL PERSPECTIVE
31
unified license (fixed, mobile, and Internet) to Sudatel Senegal in 2007.12 Consequently, as of 2007, there
were three companies providing cellular telephone services: Orange, with two-thirds of the market; Tigol,
which was rapidly gaining market share; and Sudatel. The Internet market was served by SONATEL and
Sudatel. In addition, an independent regulatory agency for the sector—the Agency for
Telecommunications and Postal Regulation (ARTP)—was created in early 2002.
Table 15. Benchmarking ICT indicators
Unit
Low-income, nonfragile countries Senegal
Middle-income countries
2005 2005 (2007–08) 2005
GSM coverage % of population under signal
48 82 85 97
International bandwidth Mbps/capita 6 68.7 237.5 30
Internet Subscribers/100 people 0 0.2 0.4 2
Landline Subscribers/100 people 1 2.4 1.9 9
Mobile phone Subscribers/100 people 15 15.3 44.1 87
Senegal
2007
Countries without
submarine cable
Countres with submarine
cable
Other developing
regions
Price of monthly mobile basket US dollars 15.5 11.1 11.1 9.9
Price of monthly fixed-line basket US dollars 21.6 13.6 13.6 n.a.
Price of 20-hour Internet package US dollars 27.7 68.0 47.28 11.0
Price of a call to the United States per minute US dollars 1.0 0.86 0.48 0.66
Price of an inter-Africa call per minute US dollars 0.3 1.34 0.57 n.a.
Source: Senegal 2005 data together with benchmarks are taken from the AICD database.
Note: Numbers reported in the table as of 2007. GSM = global system for mobile communications; Mbps = megabits per second.
n.a. = Not applicable.
Growth in telecommunications has resulted in a countrywide expansion of these services. Currently,
82.7 percent of the population has access to a GSM signal, and it is estimated that up to 97 percent of the
population could gain access to it on a commercial basis without the need for any government subsidy
(figure 18).
In the mobile market, existing subscriptions went from 0.9 subscribers per 100 people in 2000 to 44.1
in 2007 (table 15). This translated into an average growth of 44 percent per year (table 16), a level
comparable to its neighbors. In 2008 Senegal’s mobile service penetration, excluding that of Nigeria, was
the highest in West Africa; GSM coverage was almost double that of other low-income countries (table
15), though below the levels of middle-income countries.
12
SONATEL began to be privatized in 2006, when Senegal’s government sold a 51 percent stake to Maroc
Telecom. As of 2009, the government was selling a further 20 percent of SONATEL’s capital in a public offering
and an additional 6 percent was expected to be sold to employees.

SENEGAL’S INFRASTRUCTURE: A CONTINENTAL PERSPECTIVE
32
Figure 18. Efficient market gap for mobile telephone services in West Africa
Source: Mayer and others (2009) using GSM coverage figures for 2005.
Note: Existing access represents the percentage of the population covered by voice infrastructure in the third quarter of 2006. Efficient market gap represents the percentage of the population for whom voice telecommunications services are commercially viable given efficient and competitive markets. The coverage gap represents the percentage of the population for whom services are not viable without a subsidy.
SSA = Sub-Saharan Africa.
Table 16. Senegal’s skyrocketing mobile teledensity
Subscribers/100 people 2005 2006 2007 2008 Average annual
growth (%)
Benin 14.10 19.20 23.7 27.7 25.50
Burkina Faso 5.00 7.60 11.5 14.4 42.84
Ghana 12.10 19.30 29.4 34.6 43.17
Mali 6.70 12.90 21.1 35.4 74.63
Niger 2.70 4.40 6.7 8.5 47.37
Nigeria 14.40 24.40 34.7 44.2 46.35
Senegal 15.3 25.8 30.5 44.1 43.68
Togo 8.10 10.70 13.2 15.6 24.55
Source: Republique du Mali 2010.
Internet penetration in Senegal has increased substantially. In 1999 the number of Internet users per
100 people was almost zero; this had increased to almost 9 per 100 people in 2008. This movement was
accompanied by improvement in quality, expressed as bits per second per person (bps/person). In 1999
connections were very slow at 0.4 bps/person; as of 2008 the figure has reached 237 bps/person,
following investments in access to the submarine cable SAT-3 (figure 19a). Senegal is ahead of other
West African countries in terms of Internet users per 100 people and international Internet bandwidth
(figure 19b).
0%
10%
20%
30%
40%
50%
60%
70%
80%
90%
100%
Per
cen
t of
po
pu
lati
on
Existing access Efficient market gap Coverage gap

SENEGAL’S INFRASTRUCTURE: A CONTINENTAL PERSPECTIVE
33
Figure 19. Expansion of the Internet market in Senegal
a. Internet service trends, 2000–08 b. Internet service, ECOWAS, 2008
Source: World Bank, including the Information and Communications for Development database.
Note: ECOWAS = Economic Community of West African States.
Prices for telephony remain modest, particularly via the Internet; end-user prices are below those of
countries both with and without access to the submarine cable (table 16). Such prices are a result of the
advanced roaming arrangements for mobile services that exist in the Economic Community of West
African States (ECOWAS) area. The West African region, by comparison with the rest of Africa, has
made significant progress in promoting preferential intraoperator roaming arrangements. Subscribers who
belong to one of these networks can use their mobile handsets in other countries, where they do not pay
for incoming calls and are charged local rates for outgoing calls. Prepaid users can also recharge their
phones in the country that they are roaming. Two factors explain the relatively advanced state of
ECOWAS’s regional integration with regard to mobile roaming arrangements. One is the existence of a
proactive regional regulatory association for ICT—the West Africa Telecommunications Regulators
Association (WATRA)—the other, the existence of many large mobile operators with a presence across
multiple ECOWAS countries. Seven large mobile groups with a multicountry presence dominate the
regional telecommunications market.13 These multicountry networks have provided the basis for the
regional roaming arrangements that essentially collapse into three roaming areas: Orange Zone, Zain One,
and One World (table 17). Within these areas, roaming charges are very modest.
13
Etisalat, France Telecom, Maroc Telecom, Millicom, MTC (Zain), MTN, and Comium.
0
2
4
6
8
10
12
14
16
18
20
0.0
0.1
0.2
0.3
0.4
0.5
0.6
0.7
0.8
0.9
2000 2001 2002 2003 2004 2005 2006 2007In
tern
atio
nal
inte
rnet
ban
dw
idth
Inte
rnet
use
rs
Internet users (per 100 people)International Internet bandwidth (bits per second per person)
0
50
100
150
200
250
300
350
0
2
4
6
8
10
12
14
Sie
rra
Leon
e
Libe
ria
Nig
er
Gui
nea-
Bis
sau
Mal
i
Bur
kina
Fas
o
Mau
ritan
ia
Gam
bia
Sen
egal
Ben
in
Gha
na
Cot
e d'
Ivoi
re
Cap
e V
erde
Tog
o
Nig
eria
Inte
rnat
ion
al in
tern
et b
and
wid
th
Inte
rnet
use
rsInternet users (per 100 people)International Internet bandwidth (bits per second per person)

SENEGAL’S INFRASTRUCTURE: A CONTINENTAL PERSPECTIVE
34
Table 17. Intraroaming networks in ECOWAS
Source: Derived from Ampah and others (2009).
Table 18. International call charges
US$ Call within region
Call to the United States
Internet dial-up Internet ADSL
Without submarine cable 1.34 0.86 68 283
With submarine cable 0.57 0.48 47 111
Monopoly on international gateway 0.70 0.72 37 120
Competitive international gateway 0.48 0.23 37 98
Source: AICD
Note: ADSL = asymmetric digital subscriber line.
Access to submarine cables generally reduces costs, particularly if there is competition at the gateway
(table 18). Therefore, the fiber-optic infrastructure that Senegal has put in place will serve it will in the
long run.
Challenges
The main challenge in the telecommunications sector remains the need for more vigorous competition
in the domestic markets. As modern ICT services develop, it is necessary for the regulator to ensure
broadband access to independent service providers in addition to the three established carriers.
Furthermore, Senegal has access to international gateways but only SONATEL/Orange has access to the
existing submarine cables, even though Sudatel or Millicom could build their own cables. Prices of the
international capacity/bandwidth sold by SONATEL have been relatively high compared to other SAT-3
members. New cables are unlikely to change the situation since neither Sudatel or Millicom would have
access to these planned cables. Effective regulatory oversight is therefore needed to enforce open access
to the submarine cable.
Financing Senegal’s infrastructure
To meet its most pressing infrastructure needs and to catch up with developing countries in other parts of
the world, Senegal needs to expand its infrastructure assets in key areas (table 19). The targets outlined in
table 19 are purely illustrative, but they represent a level of aspiration that is not unreasonable. Developed
in a standardized way across African countries, they allow for cross-country comparisons of the
affordability of meeting targets, which can be modified or delayed as needed to achieve financial balance.
Network Countries
Orange Zone Available for subscribers in Côte d’Ivoire, Guinea, Guinea-Bissau, Mali, Niger, and Senegal
Zain One Available for subscribers in Burkina Faso, Ghana, Niger, Nigeria, and Sierra Leone
One World of MTN Available for subscribers in Benin, Côte d’Ivoire, Ghana, Guinea, Guinea-Bissau, and Nigeria.

SENEGAL’S INFRASTRUCTURE: A CONTINENTAL PERSPECTIVE
35
Table 19. Illustrative investment targets for infrastructure in Senegal
Economic target Social target
ICT Strengthen connectivity with main economic partners in the region through the installation of fiber-optic links to neighboring capitals and submarine cables.
Provide universal access to the GSM signal and modern communication services with public broadband facilities.
Power Increase electricity available to the economy—258 MW of new generation capacity and 487 MW interconnectors.
Expand electrification to 51 percent (100 percent urban and 10 percent rural).
Transport Achieve regional (national) connectivity with good-quality 2-lane (1-lane) paved road.
Provide rural road access to 30 percent of the highest-value agricultural land, and urban road access within 500 meters.
WSS n.a. Achieve Millennium Development Goals and clear sector rehabilitation backlog.
Source: Mayer and others 2009; Rosnes and Vennemo 2009; Carruthers, Krishnamani, and Murray 2009; You and others 2009. Note: WSS = water supply and sanitation; ICT = information and communication technology; GSM = global system for mobile communications.
n.a. = Not applicable.
Meeting these illustrative infrastructure targets for Senegal would cost $1.8 billion per year over a
decade, with capital expenditure accounting for 57 percent of this requirement. The highest spending
needs are associated with the power sector, which will require an estimated $1.1 billion per year to install
258 MW of new generation capacity and expand electrification to meet the growing demand. The water
and sanitation sector has the second-highest spending needs: almost $0.3 billion will be needed each year
to meet the MDGs, with capital expenditure accounting for 60 percent of the total. While less than the
amounts needed for power and water and sanitation, requirements for the ICT and transport sectors are
also high in absolute terms, amounting to $0.25 billion and $0.14 billion, respectively (table 20).
Table 20. Indicative infrastructure spending needs in Senegal, 2006–15
$ million per year
Sector Capital expenditure Operations and maintenance Total needs
ICT 229 20 248
Power 507 555 1,062
Transport 87 54 141
WSS 204 138 342
Total 1,026 766 1,792
Source: Mayer and others 2009; Rosnes and Vennemo 2009; Carruthers, Krishnamani, and Murray 2009; You and others 2009. Derived from models that are available online at www.infrastructureafrica.org/aicd/tools/models.
Note: WSS = water supply and sanitation; ICT = information and communication technology.

SENEGAL’S INFRASTRUCTURE: A CONTINENTAL PERSPECTIVE
36
Figure 20. Senegal’s infrastructure spending needs are substantial relative to its GDP
As percentage of GDP
Source: Foster and Briceño-Garmendia 2009.
Note: LIC = low-income countries; MIC = middle-income countries; ECOWAS = Economic Community of West African States; SSA = Sub-Saharan Africa; GDP = gross domestic product; O&M = operations and maintenance; CAPEX = capital expenditure.
Senegal’s infrastructure spending needs look particularly high relative to the country’s GDP, since
they would absorb 20 percent of its GDP. Investment alone would absorb around 12 percent of GDP, not
far from the 15 percent China invested in infrastructure during the mid-2000s. These high numbers are on
par with the average GDP share that other low-income, nonfragile African countries would need to spend,
which amount to 22 percent of GDP (figure 20).
Senegal already spends a sizable amount ($0.91 billion per year) to meet its infrastructure needs (table
21). About 70 percent of the total is allocated to capital expenditure and 30 percent to operating
expenditures. Operating expenditure is entirely covered from budgetary resources and payments by
infrastructure users. Public and private investment account for around 33 and 35 percent of capital
funding respectively, followed by official development assistance (ODA) (16 percent). Non-OECD
finance and household self-financing of the sanitation sector also play a smaller but nonetheless
significant role, amounting to 8 percent of capital funding each.
Table 21. Financial flows to Senegal’s infrastructure, annual averages over the period 2001–06
$ millions per year
O&M Capital expenditure
Total spending
Public sector and users’
tariffs
Public sector
ODA Non-OECD financiers
PPI HH self-financed
Total CAPEX
ICT 1 1 2 3 205 0 211 212
Power 257 93 18 12 16 0 138 396
Transport 9 51 47 23 5 0 125 133
WSS 4 65 37 14 0 49 117 121
Total 270 210 103 53 225 49 640 911
0 5 10 15 20 25 30 35 40
Cape Verde
Burkina Faso
Nigeria
Cote d'Ivoire
Benin
Ghana
Mali
Niger
Senegal
MIC
Resource-Rich
ECOWAS
LIC- Nonfragile
LIC-Fragile
SSA
% of GDP
Capex O&M

SENEGAL’S INFRASTRUCTURE: A CONTINENTAL PERSPECTIVE
37
Figure 21. Senegal’s existing infrastructure spending is particularly high
As percentage of GDP
Source: Derived from Foster and Briceño-Garmendia (2009).
Note: LIC = low-income countries; MIC = middle-income countries; ECOWAS = Economic Community of West African States; SSA = Sub-Saharan Africa; GDP = gross domestic product; O&M= operations and maintenance; CAPEX = capital expenditure.
Senegal’s existing spending amounts to 11 percent of its GDP (figure 21). This is close to the average
for low-income, nonfragile states, even if it is substantially higher than some of its West African
neighbors such as Côte d’Ivoire and Nigeria. Relative to its peer group, Senegal is relatively more reliant
on the public budget for power and water investments, and relatively less reliant on ODA for transport,
power, and water needs (figure 21). In the case of ICT, Senegal predominantly relies on the private sector
for financing. The largest share of infrastructure spending goes to power (39 percent) followed by ICT
(21 percent) and power (23 percent). The transport and water sectors receive 11 to 13 percent of total
funding each (figure 22).
0 2 4 6 8 10 12 14
Cape VerdeCote d'Ivoire
Burkina FasoNigeria
BeninLiberiaGhana
MaliNiger
Senegal
MICResource-Rich
ECOWASLIC-Nonfragile
LIC-Fragile
SSA
% of GDP
Capex O&M

SENEGAL’S INFRASTRUCTURE: A CONTINENTAL PERSPECTIVE
38
Figure 22. Senegal’s pattern of capital investment in infrastructure, benchmarked against comparator countries
Investment in infrastructure sectors as percentage of GDP, by source
Source: Derived from Briceño-Garmendia, Smits, and Foster (2009).
Note: Private investment includes self-financing by households. ODA = official development assistance; OECD = Organisation for Economic Co-operation and Development; ICT = information and communication technology; GDP = gross domestic product; WSS = water supply and sanitation; LIC = low-income countries.
How much more can be done within the existing resource envelope?
Around $312 million of additional resources could be recovered each year by improving efficiency (table
22). By far the largest area of inefficiency lies in the underrecovery of costs, which accounts for 66
percent of the total ($206 million). Reducing distribution losses to a reasonable benchmark in the power
and water sectors could save up to $73 million each year. Potential efficiency gains of about $17 million
and $14 million per year are possible from improving budget execution (that is, the share of budgeted
funds actually spent) and optimizing staffing levels, respectively. Increasing collection rates do not seem
to be an issue in Senegal, except in the water and sanitation sector. Looking across sectors, the power
sector is by far the most problematic and presents the largest potential for efficiency dividends ($206
million).
Table 22. Potential gains from greater operational efficiency
ICT Power Transport WSS Total
Underrecovery of costs — 133 n.a. 73 206
Overstaffing n.a. 14 — n.a. 14
Distribution losses — 71 — 2 73
Undercollection — 0 n.a. 2 2
Low budget execution 0 1 14 2 17
Total 0 219 14 78 312
Source: Derived from Foster and Briceño-Garmendia (2009). Note: WSS = water supply and sanitation; ICT = information and communication technology.
— = Not available.
n.a. = Not applicable.
Undercharging for power services costs Senegal about $133 million each year. In the power sector,
the estimated average total cost of power was $0.29 per kilowatt-hour (kWh) in 2007, while the average
effective tariff was $0.21/kWh, which hardly covered the operating and maintenance costs of $0.23/kWh.
Senegal LIC-nonfragile
0.0
0.5
1.0
1.5
2.0
2.5
3.0
ICT Power Transport WSS ICT Power Transport WSS
% o
f G
DP
Public ODA Non-OECD Private

SENEGAL’S INFRASTRUCTURE: A CONTINENTAL PERSPECTIVE
39
As a result, SENELEC covered only 72 percent of its costs, leaving capital investment largely unfunded.
The associated financial burden was approximately 1.5 percent of GDP.
In the water sector, it is
estimated that the average total
cost of producing utility water is
$1.25 per cubic meters (m3),
while the average effective tariff
was only $1.13 in 2008, which
meant that the main utilities in the
sector covered 91 percent of their
cost through the tariff (actual
numbers will depend on billing
and collection rates). The
associated financial burden was
approximately 0.8 percent of GDP
(figure 23).
Access to utility services in Senegal is relatively high by African standards. Nevertheless, access
patterns remain regressive, though in the case of power a significant minority of lower-income
households do have access (figures 24).
Figure 24. Consumption of infrastructure services in Senegal varies by income quintile
a. Mode of water supply, by income quintile b. Prevalence of connection to power grid among population, by income quintile
Source: Banerjee and others 2008b
Note: Q1—first budget quintile, Q2—second budget quintile, and so on.
Because of inequitable access to power services in Senegal, subsidized tariffs are necessarily quite
regressive. This has been confirmed by recent empirical analysis showing that poor households capture
far less than their fair share of power and water subsidies in Senegal. In the case of power, poor
households capture less than half of the subsidy that should reach them based solely on their share of the
overall population; in the case of water, however, poor households capture close to 80 percent of the
0%
10%
20%
30%
40%
50%
60%
70%
80%
90%
100%
Q1 Q2 Q3 Q4 Q5
Per
cen
age
of
po
pu
lati
on
Piped water Stand posts
Wells/boreholes Surface water
0%
10%
20%
30%
40%
50%
60%
70%
80%
90%
100%
Q1 Q2 Q3 Q4 Q5
Per
cen
atag
e o
f p
op
ula
tio
n
Power
Figure 23. Underpricing of water a more serious issue in Senegal than elsewhere
Financial burden of underpricing in 2007, as percentage of GDP
Source: Derived from Briceño-Garmendia, Smits, and Foster (2009). Note: GDP = gross domestic product; LIC = low-income countries
0.0
0.5
1.0
1.5
2.0
Power Water%
GD
P
Senegal Nonfragile

SENEGAL’S INFRASTRUCTURE: A CONTINENTAL PERSPECTIVE
40
subsidy. While it is typical for utility subsidies to be regressive in African countries, the distributional
performance of Senegal’s subsidies is average in the case of power, and relatively good in the case of
water (figure 25).
Figure 25. Electricity and water subsidies that reach the poor
a. Electricity b. Water
Source: Banerjee and others 2008b. Note: Omega is a measure of distributional incidence that measures the share of subsidies received by the poor as a percentage of their share in the population. The higher the value of omega, the better the distributional performance of the subsidy. Values of omega below one denote a regressive subsidy; and values above one denote a progressive subsidy. CAR = Central African Republic; DRC = Democratic Republic of the Congo.
How expensive would utility bills become if cost-reflective tariffs were applied? With a power cost-
recovery tariff of $0.29 per kWh and a monthly subsistence consumption of 50 kWh, the associated utility
bill would come to $14.5 per month. Based on the distribution of household budgets in Senegal, monthly
utility bills at these levels would be affordable by close to 100 percent of the population (figure 26).
Indeed, the share of the population that could afford the service is much higher than the share of the
population that already has the service, suggesting that Senegal has scope to increase coverage before
affordability could become a serious impediment. A more limited level of subsistence consumption of 25
kWh/month for power and 4 m3/month for water—which is capable of meeting the most basic needs—
would cost $7.3 and $4.5 per month, respectively, and would be affordable to most of the population.
0 0.2 0.4 0.6 0.8 1
Rwanda
Uganda
Malawi
Chad
Burkina
Burundi
Guinea
CAR
Ghana
Mozambique
Cameroon
Senegal
Sao Tome
Togo
Cape Verde
Côte d'ivoire
Congo
Gabon
Nigeria
Omega0 0.2 0.4 0.6 0.8 1
Rwanda
Burkina
Malawi Lilongwe
Uganda
Guinea
Ghana
Malawi Blantyre
Burundi
Cape Verde
Chad
Niger
Côte d'ivoire
Cameroon
Nigeria FCT
DRC
Togo
Nigeria Kaduna
Congo
Gabon
CAR
Senegal
Omega

SENEGAL’S INFRASTRUCTURE: A CONTINENTAL PERSPECTIVE
41
Figure 26. Affordability in Senegal is much better than in other low-income countries
Source: Banerjee and others 2008b Note: LIC = low-income countries; kWh = kilowatt-hour; m3 = cubic meters.
Operational inefficiencies of power and water utilities cost Senegal a further $89 million a year, close
to 1 percent of GDP. The annual value of inefficiencies in the power sector ($85 million) is substantially
higher than for the water sector ($4 million). The burden of utility inefficiencies in Senegal’s water sector
is lower than for the benchmark countries (figure 27), though distribution losses in power are higher than
in comparator countries. Senegal had distribution losses of 22.2 percent in 2008 relative to a best-practice
benchmark of around 10 percent, while in the water sector, SDE had distribution losses of 21 percent in
2009 relative to a best-practice benchmark of 20 percent.
Figure 27. Senegal’s utilities are comparatively efficient
Uncollected bills and unaccounted losses as percentage of GDP
a. Power sector b. Water sector
Source: Derived from Briceño-Garmendia, Smits, and Foster (2009).
0
20
40
60
80
100
2 4 6 8 10 12 14 16
Sha
re o
f urb
an h
ouse
hold
s w
hose
util
ity b
ill w
ould
be
less
than
5 p
erce
nt o
f the
mon
thly
hou
seho
ld b
udge
t
Monthly utility bill (US$)Senegal
LIC
Average cost of power is $6/month per 25 kwh or $12/month per 50 kwh subsistence consumption
Average cost of water is $5/month per 4 m3 or $12.5/month per 10 m3 subsistence consumption
Power cost-recovery tariff is $0.24/kwh
Water cost-recovery tariff is $1.25/m3
0.0
0.2
0.4
0.6
0.8
1.0
Senegal Nonfragile
Per
cen
tag
e o
f G
DP
Collection inefficiencies Unaccounted losses
0.0
0.1
0.1
0.2
0.2
Senegal Nonfragile
Per
cen
tag
e o
f G
DP
Collection inefficiencies Unaccounted losses

SENEGAL’S INFRASTRUCTURE: A CONTINENTAL PERSPECTIVE
42
Annual funding gap
Senegal’s infrastructure funding gap amounts to $578 million per year, or about 7 percent of GDP, once
efficiencies are captured. The largest gap by far is in the power sector, with water and transport presenting
much smaller annual funding gaps (table 23). Last, the funding gap in transport is insignificant compared
to the other sectors, emphasizing the potential gains from improving efficiencies, due to the fact that
investments in roads were large to start with and also because of the larger spending needs of road
maintenance compared to that of other sectors.
Table 23. Funding gaps by sector
$ millions
ICT Power Transport WSS Total
Spending needs (248) (1,062) (141) (342) (1,792)
Existing spending* 212 396 95 170 873
Reallocation potential within sectors 0 0 38 0 38
Efficiency gains 0 219 15 78 313
Funding gap (36) (447) No gap (94) (578)
Source: Derived from Foster and Briceño-Garmendia (2009). Note: Potential overspending across sectors is not included in the calculation of the funding gap, because it cannot be assumed that it would be applied toward other infrastructure sectors. WSS = water supply and sanitation; ICT = information and communication technology. * traced to needs. — = Not available.
What else can be done?
The funding gap can be addressed only by raising additional finance or, alternatively, using lower-cost
technologies and/or adopting less ambitious targets for infrastructure development.
In the case of Senegal, the country could very likely increase the flow of resources and technical and
managerial expertise by attracting private sector investment in the various infrastructure sectors, and by
continuing to emphasize infrastructural projects with a regional dimension that facilitate access to larger,
regional markets through Senegal’s unique geographical location.
Senegal already has a long history of private participation in infrastructure (PPI), and among the West
African countries, it has been one of the main destinations of private sector participation. One of the first
projects was the concession of the Port of Dakar awarded to Bollore in 1987, and since 1990, total
investment commitment in private infrastructure projects has amounted to more than $2.6 billion. Most of
this, $2 billion, was directed to telecommunications (figure 28).

SENEGAL’S INFRASTRUCTURE: A CONTINENTAL PERSPECTIVE
43
Figure 28. Senegal has been a destination for private sector investment in West Africa
Average annual investment as a percentage of GDP, 2008
Source: World Bank 2010a. Note: GDP = gross domestic product; ICT = information and communication technology.
Private participation has been implemented in all kinds of infrastructure services with relative
success: energy, water, transport, and ICT. All types of contracts have been experimented with: lease,
rental, concession, BOT, and divestiture (table 24). Over the years, 14 infrastructure projects with private
participation have reached financial closure (this total includes the renewals). Eleven of them are still
operational, including one electricity distribution project, three electricity generation projects, one railway
project, one seaport project, one toll road project, one water supply project, and three telecommunications
projects.
Table 24. Total investment commitments in infrastructure projects with private participation
Average between 2000 and 2009
Sector Number of arrangements and value (US$ millions) by type
Concession BOT/BOO Marchand Location Partial privatization Affermage
Energy 2 ($88) 2 ($146) 1 ($6)
ICT 2 ($408) 1 ($1,536)
Transport 4 ($720 *)
WSS 2 ($20)
Source: World Bank 2010a.
Note: (*) 2009 preliminary data reported. BOT = build operate transfer; BOO = build operate own; ICT = information and communication technology; WSS = water supply and sanitation.
But while Senegal is among the countries in the region to have already attracted the private sector’s
investment in infrastructure, a comparative assessment of Sub-Saharan Africa shows that these private
flows remain modest in comparison to countries in other regions (figure 29a, b). Increasing private sector
participation in infrastructure, however, is not an easy task, especially in an environment where
investment resources are scarce and private investors highly selective. In the case of Senegal, it will be
important for the government, based on sector needs over the next 5 to 10 years, to carefully prioritize
projects. The government could then identify a pipeline of projects in which the private sector could play
a major role in either bringing in investment resources or, equally important, bringing in technical and
0
0.5
1
1.5
2
2.5
3
3.5
4
Per
cen
tag
e o
f G
DP
Transport ICT Electricity

SENEGAL’S INFRASTRUCTURE: A CONTINENTAL PERSPECTIVE
44
managerial expertise that would allow for the realization of the large potential efficiency gains that have
been identified. Promoting competition within the markets, and developing a coherent framework for
promoting private participation with standard bidding documents and clearly defined competitive bidding
procedures will also be essential to ensure that the benefits of increased private participation will result in
more cost-efficient services for a larger share of the population.
Figure 29. Africa attracts relatively less private sector investment in infrastructure compared with other regions
a. 2008 $ billion b. Number of projects
Source: World Bank 2010a.
The benefits of further pursuing regional integration are most evident in the power and transport
sectors. First, the cost of meeting Senegal’s power needs would be reduced if regional power trading
developed further in the WAPP. These savings would reduce the annual infrastructure funding gap by as
much as 12 percent a year. Second, continuing the emphasis placed on developing and maintaining
regional transport corridors (road and railways) and integrating these corridors with gateways to
worldwide markets (ports and airports), a multimodal vision of the transport sector could provide a major
boost to Senegal’s international competitiveness.
If Senegal were completely unable to raise additional finance or reduce infrastructure costs, the only
way to meet the targets identified here would be to take a longer period of time than the decade
contemplated at the outset of this exercise. If the country were to make efficiency gains overnight while
holding spending at current levels, it could in fact meet the identified infrastructure targets within a 15-
year period. Without tackling inefficiencies, those targets could take more than 80 years to achieve. These
simulations underscore the importance of making progress on the efficiency agenda, which can put the
country more than 60 years ahead in meeting its infrastructure targets.
Within the overall funding envelope, it will be very important to carefully prioritize infrastructure
investments. Given the magnitude of the country’s funding gap, it will not be feasible to resolve all
pending infrastructure issues at once—thus the need to identify priorities. The foregoing analysis of
0
50
100
150
200
250
300
Energy Telecom Transport Water and Sewerage
0
100
200
300
400
500
600
700
800
900
Energy Telecom Transport Water and Sewerage

SENEGAL’S INFRASTRUCTURE: A CONTINENTAL PERSPECTIVE
45
achievements and challenges suggests the importance of prioritizing key infrastructure interventions for
the economy. These are notable in power, where acute shortages call for immediate measures to increase
the capacity in the system; in the water and sanitation sector, to improve sanitation in general and in rural
areas in particular; and in the transport sector, to address the pressing need for better maintenance and
rehabilitation of both roads and railways.

SENEGAL’S INFRASTRUCTURE: A CONTINENTAL PERSPECTIVE
46
References and bibliography
This country report draws upon a wide range of papers, databases, models, and maps that were created as
part of the Africa Infrastructure Country Diagnostic (AICD). All of these can be downloaded from the
project Web site: www.infrastructureafrica.org. For papers go to the document page
(www.infrastructureafrica.org/aicd/documents), for databases to the data page
(www.infrastructureafrica.org/aicd/tools/data), for models go to the models page
(www.infrastructureafrica.org/aicd/tools/models) and for maps to the map page
(www.infrastructureafrica.org/aicd/tools/maps ). The references for the papers that were used to compile
this country report are provided in the table below.
General
AICD (Africa Infrastructure Country Diagnostic). Africa’s Infrastructure: A Time for Transformation.
www.infrastructureafrica.org.
———. 2010. ECOWAS’s Infrastructure: A Regional Perspective. http://www.infrastructureafrica.org.
EIU (Economist Intelligence Unit). 2010. Senegal Country Report. London, UK: EIU.
Foster, Vivien, and Cecilia Briceño-Garmendia, eds. 2009. Africa’s Infrastructure: A Time for
Transformation. Paris and Washington, DC: Agence Française de Développement and World
Bank.
World Bank. 2007a. Country Assistance Strategy for the Republic of Senegal for the period FY08–FY11.
Washington, DC: World Bank.
———. 2010a. ―PPIAF-PPI Project Database.‖ www.ppi.worldbank.org/.
———. 2011a. Doing Business 2011: Making a Difference for Entrepreneurs. Washington, DC: World
Bank.
———. 2011b. ―Enterprise Surveys’ Database.‖ www.enterprisesurveys.org/.
Financing
Briceño-Garmendia, Cecilia, Karlis Smits, and Vivien Foster. 2009. ―Financing Public Infrastructure in
Sub-Saharan Africa: Patterns and Emerging Issues.‖ AICD Background Paper 15, Africa Region,
World Bank, Washington, DC.
Growth
Calderón, César. 2009. ―Infrastructure and Growth in Africa.‖ Policy Research Working Paper 4914,
World Bank, Washington, DC.
Escribano, Alvaro, J. Luis Guasch, and Jorge Pena. 2010. ―Assessing the Impact of Infrastructure Quality
on Firm Productivity in Africa.‖ Policy Research Working Paper 5191, World Bank, Washington,
DC.

SENEGAL’S INFRASTRUCTURE: A CONTINENTAL PERSPECTIVE
47
Yepes, Tito, Justin Pierce, and Vivien Foster. 2009. ―Making Sense of Africa’s Infrastructure
Endowment: A Benchmarking Approach.‖ Policy Research Working Paper 4912, World Bank,
Washington, DC.
Information and communication technologies
Ampah, Mavis, Daniel Camos, Cecilia Briceño-Garmendia, Michael Minges, Maria Shkaratan, and Mark
Williams. 2009. ―Information and Communications Technology in Sub-Saharan Africa: A Sector
Review.‖ AICD Background Paper 10, Africa Region, World Bank, Washington, DC.
Mayer, Rebecca, Ken Figueredo, Mike Jensen, Tim Kelly, Richard Green, and Alvaro Federico Barra.
2009. ―Connecting the Continent: Costing the Needs for Spending on ICT Infrastructure in
Africa.‖ AICD Background Paper 3, Africa Region, World Bank, Washington, DC.
Republique du Mali. 2010. Note sur le Secteur des Télécommunications au Mali: Etude des situations de
concurrence sur le marché des Télécommunications au Mali. Technical assistance report.
Bamako, Mali.
Irrigation
FAO (Food and Agriculture Organization). 2004. ―Aquastata: Senegal Country Profile.‖
www.fao.org/nr/water/aquastat/main/index.stm.
Svendsen, Mark, Mandy Ewing, and Siwa Msangi. 2008. ―Watermarks: Indicators of Irrigation Sector
Performance in Africa.‖ AICD Background Paper 4, Africa Region, World Bank, Washington,
DC.
You, L., C. Ringler, G. Nelson, U. Wood-Sichra, R. Robertson, S. Wood, G. Zhe, T. Zhu, and Y. Sun.
2009. ―Torrents and Trickles: Irrigation Spending Needs in Africa.‖ AICD Background Paper 9,
Africa Region, World Bank, Washington, DC.
Power
Briceño-Garmendia, Cecilia, and Maria Shkaratan. 2010. ―Power Tariffs: Caught between Cost Recovery
and Affordability.‖ Working Paper, First draft, February 2010.
Eberhard, Anton, Vivien Foster, Cecilia Briceño-Garmendia, Fatimata Ouedraogo, Daniel Camos, and
Maria Shkaratan. 2008. ―Underpowered: The State of the Power Sector in Sub-Saharan Africa.‖
AICD Background Paper 6, Africa Region, World Bank, Washington, DC.
Foster, Vivien, and Jevgenijs Steinbuks. 2009. ―Paying the Price for Unreliable Power Supplies: In-House
Generation of Electricity by Firms in Africa.‖ Policy Research Working Paper 4913, World Bank,
Washington, DC.
Rosnes, Orvika, and Haakon Vennemo. 2009. ―Powering Up: Costing Power Infrastructure Spending
Needs in Sub-Saharan Africa.‖ AICD Background Paper 5, Africa Region, World Bank,
SENEGAL’S INFRASTRUCTURE: A CONTINENTAL PERSPECTIVE
48
World Bank. 2011c. ―Getting Electricity-Database.‖ www.doingbusiness.org/data/exploretopics/getting-
electricity.
Transport
Bofinger, Heinrich C. 2009. ―An Unsteady Course: Growth and Challenges in Africa’s Air Transport
Industry.‖ AICD Background Paper 16, Africa Region, World Bank, Washington, DC.
Bullock, Richard. 2009. ―Off Track: Sub-Saharan African Railways.‖ AICD Background Paper 17, Africa
Region, World Bank, Washington, DC.
Carruthers, Robin, Ranga Rajan Krishnamani, and Siobhan Murray. 2009. ―Improving Connectivity:
Investing in Transport Infrastructure in Sub-Saharan Africa.‖ AICD Background Paper 7, Africa
Region, World Bank, Washington, DC.
Gökgür, Nilgün, and Leroy Jones. 2006. ―Impact of Privatization in Africa: Air Senegal International.‖
Boston Institute for Developing Economies (BIDE) and Investment Climate Department and
Africa Private Sector and Infrastructure Department, World Bank, Washington, DC.
Gwilliam, Ken, Vivien Foster, Rodrigo Archondo-Callao, Cecilia Briceño-Garmendia, Alberto Nogales,
and Kavita Sethi. 2008. ―The Burden of Maintenance: Roads in Sub-Saharan Africa.‖ AICD
Background Paper 14, Africa Region, World Bank, Washington, DC.
Kumar, Ajay, and Fanny Barrett. 2008. ―Stuck in Traffic: Urban Transport in Africa.‖ AICD Background
Paper 1, Africa Region, World Bank, Washington, DC.
Ocean Shipping Consultants, Inc. 2009. ―Beyond the Bottlenecks: Ports in Africa.‖ AICD Background
Paper 8, Africa Region, World Bank, Washington, DC.
Port Autonomme de Dakar. 2010. www.portdakar.sn/spip.php?article8.
World Bank. 2007b. Project Appraisal Document on a Proposed Credit in the Amount of SDR59.5
Million ($90 Million Equivalent) to the Republic of Mali for a Second Transport Sector Project.
Washington, DC: World Bank.
———. 2008. Implementation Completion and Results Report (IDA-31830 IDA-3183A) on a Credit in
the Amount of 64.3 SDR Million ($90 Million Equivalent) to the Republic of Senegal for a Second
Transport Sector Project. Washington, DC: World Bank.
———. 2010b. Project Information Document, Concept Stage. Report AB3075, World Bank,
Washington, DC, May 27.
———. 2010c. Project Appraisal Document Transport and Urban Mobility Project. Report 53774-SN,
World Bank, Washington, DC, May 3.
———. 2010d. ―International LPI: ranking‖.
www.worldbank.org/PREM/LPI/tradesurvey/mode1b.asp#ranking]
———. 2010b. ―Senegal Estimates for the Use of Improved Sanitation Facilities.‖
www.wssinfo.org/resources/documents.html.

SENEGAL’S INFRASTRUCTURE: A CONTINENTAL PERSPECTIVE
49
Water supply and sanitation
Banerjee, Sudeshna, Vivien Foster, Yvonne Ying, Heather Skilling, and Quentin Wodon. 2008a. ―Cost
Recovery, Equity, and Efficiency in Water Tariffs: Evidence from African Utilities.‖ AICD
Working Paper 7, Africa Region, World Bank, Washington, DC.
Banerjee, Sudeshna, Heather Skilling, Vivien Foster, Cecilia Briceño-Garmendia, Elvira Morella, and
Tarik Chfadi. 2008b. ―Ebbing Water, Surging Deficits: Urban Water Supply in Sub-Saharan
Africa.‖ AICD Background Paper 12, Africa Region, World Bank, Washington, DC.
IBNET (The International Benchmarking Network for Water and Sanitation Utilities). 2009. www.ib-
net.org/.
Gulyani, Sumila, Debabrata Talukdar, and Darby Jack. 2009. ―Poverty, Living Conditions, and
Infrastructure Access: A Comparison of Slums in Dakar, Johannesburg, and Nairobi.‖ AICD
Working Paper 10, Africa Region, World Bank, Washington, DC.
Keener, Sarah, Manuel Luengo, and Sudeshna Banerjee. 2009. ―Provision of Water to the Poor in Africa:
Experience with Water Standposts and the Informal Water Sector.‖ AICD Working Paper 13,
Africa Region, World Bank, Washington, DC.
Morella, Elvira, Vivien Foster, and Sudeshna Ghosh Banerjee. 2008. ―Climbing the Ladder: The State of
Sanitation in Sub-Saharan Africa.‖ AICD Background Paper 13, Africa Region, World Bank,
Washington, DC.
WHO (World Health Organization) Joint Monitoring Programme (JMP). 2010a. ―Senegal Estimates for
the Use of Improved Drinking-Water Sources.‖ www.wssinfo.org/resources/documents.html.

About AICD and its country reports
This study is a product of the Africa Infrastructure Country Diagnostic (AICD), a project designed to
expand the world’s knowledge of physical infrastructure in Africa. The AICD provides a baseline against
which future improvements in infrastructure services can be measured, making it possible to monitor the
results achieved from donor support. It also offers a solid empirical foundation for prioritizing
investments and designing policy reforms in Africa’s infrastructure sectors.
The AICD is based on an unprecedented effort to collect detailed economic and technical data on African
infrastructure. The project has produced a series of original reports on public expenditure, spending
needs, and sector performance in each of the main infrastructure sectors, including energy, information
and communication technologies, irrigation, transport, and water and sanitation. Africa’s Infrastructure—
A Time for Transformation, published by the World Bank and the Agence Française de Développement
(AFD) in November 2009, synthesized the most significant findings of those reports.
The focus of the AICD country reports is on benchmarking sector performance and quantifying the main
financing and efficiency gaps at the country level. These reports are particularly relevant to national
policy makers and development partners working on specific countries.
The AICD was commissioned by the Infrastructure Consortium for Africa following the 2005 G8 (Group
of Eight) summit at Gleneagles, Scotland, which flagged the importance of scaling up donor finance for
infrastructure in support of Africa’s development.
The first phase of the AICD focused on 24 countries that together account for 85 percent of the gross
domestic product, population, and infrastructure aid flows of Sub-Saharan Africa. The countries are:
Benin, Burkina Faso, Cape Verde, Cameroon, Chad, Côte d’Ivoire, the Democratic Republic of Congo,
Ethiopia, Ghana, Kenya, Lesotho, Madagascar, Malawi, Mozambique, Namibia, Niger, Nigeria, Rwanda,
Senegal, South Africa, Sudan, Tanzania, Uganda, and Zambia. Under a second phase of the project,
coverage was expanded to include as many of the remaining African countries as possible.
Consistent with the genesis of the project, the main focus is on the 48 countries south of the Sahara that
face the most severe infrastructure challenges. Some components of the study also cover North African
countries so as to provide a broader point of reference. Unless otherwise stated, therefore, the term Africa
is used throughout this report as a shorthand for Sub-Saharan Africa.
The World Bank has implemented the AICD with the guidance of a steering committee that represents the
African Union (AU), the New Partnership for Africa’s Development (NEPAD), Africa’s regional

economic communities, the African Development Bank (AfDB), the Development Bank of Southern
Africa (DBSA), and major infrastructure donors.
Financing for the AICD is provided by a multidonor trust fund to which the main contributors are the
United Kingdom’s Department for International Development (DFID), the Public-Private Infrastructure
Advisory Facility (PPIAF), Agence Française de Développement (AFD), the European Commission, and
Germany’s Entwicklungsbank (KfW). A group of distinguished peer reviewers from policy-making and
academic circles in Africa and beyond reviewed all of the major outputs of the study to ensure the
technical quality of the work. The Sub-Saharan Africa Transport Policy Program and the Water and
Sanitation Program provided technical support on data collection and analysis pertaining to their
respective sectors.
The data underlying AICD’s reports, as well as the reports themselves, are available to the public through
an interactive Web site, www.infrastructureafrica.org, that allows users to download customized data
reports and perform various simulations. Many AICD outputs will appear in the World Bank’s Policy
Research Working Papers series.
Inquiries concerning the availability of data sets should be directed to the volume editors at the World
Bank in Washington, DC.