Embed Size (px)
Citation preview

Policy Research Working Paper 9225
How Does the World Bank Influence the Development Policy Priorities of Low-Income
and Lower-Middle Income Countries?Stephen Knack
Bradley C. ParksAni Harutyunyan
Matthew DiLorenzo
Development Economics Development Research GroupApril 2020
Pub
lic D
iscl
osur
e A
utho
rized
Pub
lic D
iscl
osur
e A
utho
rized
Pub
lic D
iscl
osur
e A
utho
rized
Pub
lic D
iscl
osur
e A
utho
rized
Produced by the Research Support Team
Abstract
The Policy Research Working Paper Series disseminates the findings of work in progress to encourage the exchange of ideas about development issues. An objective of the series is to get the findings out quickly, even if the presentations are less than fully polished. The papers carry the names of the authors and should be cited accordingly. The findings, interpretations, and conclusions expressed in this paper are entirely those of the authors. They do not necessarily represent the views of the International Bank for Reconstruction and Development/World Bank and its affiliated organizations, or those of the Executive Directors of the World Bank or the governments they represent.
Policy Research Working Paper 9225
This study investigates the World Bank’s use of lending and non-lending instruments to affect the policy priori-ties of developing countries. In a typical year, the World Bank lends more than $30 billion to its client countries. It also spends approximately $200 million on the provision of analytical and advisory products each year. However, insufficiently granular data on the nature, timing, and dis-tribution of these analytical and advisory products and the policy priorities of client countries has made it difficult for policymakers and scholars to understand which World
Bank instruments are most useful for effectuating change in the direction of government policy. With new data on the delivery of analytical and advisory products and micro-level survey data from 1,244 public sector officials in 121 developing countries, this study demonstrates that the orga-nization’s non-lending instruments are more effective than its lending instruments at influencing the policy priorities of client countries. The World Bank’s analytical and advi-sory products not only affect the direction of government policy, but also its design and implementation.
This paper is a product of the Development Research Group, Development Economics. It is part of a larger effort by the World Bank to provide open access to its research and make a contribution to development policy discussions around the world. Policy Research Working Papers are also posted on the Web at http://www.worldbank.org/prwp. The authors may be contacted at [email protected].

How Does the World Bank Influence the DevelopmentPolicy Priorities of Low-Income and Lower-Middle
Income Countries?
Stephen Knack∗ Ani Harutyunyan‡Bradley C. Parks†
Matthew DiLorenzo§
Keywords: foreign aid, reform, conditionality, policy evaluation, survey methods
JEL Classification: C81, C83, D04, F34, F35, F55, O19, O20
∗Development Research Group, World Bank†AidData, Global Research Institute, The College of William and Mary; and Center for Global Develop-
ment; email: [email protected].‡Sunwater Institute; email: [email protected].§Department of Political Science and Geography, Old Dominion University; email: [email protected].

Acknowledgements: We thank the National Opinion Research Center (NORC) at the Uni-versity of Chicago—in particular, Renee Hendley, Kate Hobson, David Kordus, Elise Le,Aparna Ramakrishnan, Alex Rigaux, Bhanuj Soni, and Stacy Stonich—for their survey de-sign and data collection assistance. We also owe a debt of gratitude to the 6,731 developmentpolicymakers and practitioners from 126 countries who participated in the 2014 Reform Ef-forts Survey. Were it not for their willingness to graciously share of their experiences andinsights, this study would not have been possible. Finally, this study was made possiblethrough generous financial support from the Development Research Group of the WorldBank, the John Templeton Foundation, the Smith Richardson Foundation, and the Williamand Flora Hewlett Foundation.

Introduction
As low-income and middle-income countries have reduced their reliance on official de-
velopment assistance (ODA) and assumed greater responsibility for direct service delivery
activities, many aid agencies and development banks have refocused their efforts on helping
partner countries reform laws, institutions, regulations, and customary practices in ways
that they hope will promote economic development and effective governance in the long-run
(Andrews 2011; World Bank 2012, 2013a; USAID 2015; Buntaine et al. 2017).
However, there is a growing gap between the stated objectives of international devel-
opment organizations and the metrics of success that they use to judge their own perfor-
mance. Easily observable output and outcome measures—such as the amount of economic
output generated, the number of children vaccinated, and the number of kilometers of roads
constructed—are useful for measuring the success of direct service delivery activities (World
Bank 2013a; Glennie and Sumner 2014). But most aid agencies and development banks
lack credible ways of measuring their influence on the policy priorities of partner countries
(Custer et al. 2015; Kremer and Clemens 2016).
The World Bank is a uniquely important case in point. In a typical year, it lends more
than $30 billion to its client countries. It also spends approximately $200 million on the
provision of analytical and advisory (AAA) products to client countries each year.1 The
organization uses both of these instruments—lending and non-lending services—to influence
the development policy priorities of low-income and middle-income countries. However,
insufficiently granular data on the nature, timing, and distribution of AAA products and
the policy priorities of client countries has made it difficult for policymakers and scholars
to understand which World Bank instruments are most useful for effectuating development
policy change.
In the absence of strong empirical evidence, policymakers have offered conjectures about
1These summary statistics are drawn from https://www.worldbank.org/en/about/annual-report/
fiscal-year-data and the World Bank’s Business Intelligence Database.
1

the value of World Bank advice, analysis, and assistance. Robert Zoellick, who served as
the President of the World Bank from 2007 to 2012, characterized his organization as a
“unique and special institution of knowledge and learning” and argued that “[d]elivering,
expanding, and testing this learning—in tandem with financing or separately—is the most
important part of our work” (World Bank 2007, emphasis added). James Wolfensohn, who
served as the President of the World Bank from 1995 to 2005, promoted a slightly different
version of this argument: “that [the] knowledge and advisory services [of the World Bank]
are far more powerful in leveraging policy and institutional change when underpinned by
a lending relationship” (Wolfensohn 2000). Others have expressed skepticism. Prior to his
appointment as the President of the World Bank in 2019, David Malpass told the U.S.
Congress that the principal beneficiaries of the World Bank were “the people who fly in on
a first-class ticket to give advice to governments” (Baker 2019).
Nor do scholars agree about whether, when, and how the World Bank promotes policy
change within developing countries (Dollar and Svensson 2000; Easterly 2005; Edwards 2007;
Helmke and McLean 2014; Smets and Knack 2016, 2018; Masaki and Parks 2019; Carnegie
and Samii 2019). Gavin and Rodrik (1995: 332) argue that “the [World] Bank is the single
most important external source of ideas and advice to developing-country policymakers”
(Gavin and Rodrik 1995: 332). Others in this camp point to highly influential World Bank
publications like the Doing Business Report (Besley 2015; Doshi et al. 2019) and the or-
ganization’s role in the global diffusion of policy innovations, such as pension reforms and
conditional cash transfer schemes (Brooks 2007, 2015; Fiszbein and Schady 2009; Borges
Sugiyama 2011; Handa and Davis 2006; Kremer and Clemens 2016). However, another
group of economists and political scientists argue that international financial institutions
(IFIs) like the World Bank are relatively impotent and their analysis, advice, and assistance
has little if any influence on the policy priorities of developing countries (Remmer 1998;
Callaghy 1984; Easterly 2006; Harrigan and El-Said 2006; Samuel 2014).2
2Hunter and Brown (2000: 115) review public policies related to human capital investment in 13 LatinAmerican countries and conclude that “powerful domestic forces tend to override World Bank [policy] di-
2

To better understand whether, when, and how the World Bank effectuates development
policy change, we leverage new data on the organization’s lending and non-lending operations
as well as a unique survey of 1,328 public officials that measures the policy influence of the
World Bank in 24 issue areas and 113 developing countries. We hypothesize that the World
Bank’s non-lending instruments are more effective than its lending instruments at influencing
the policy priorities of client countries. Our empirical results not only provide support for
this hypothesis, but also demonstrate that World Bank AAA products influence the design
and implementation of government policy.
Theory and Hypotheses
Role of Incentives
The World Bank is a lending institution that depends on governments who are willing
to borrow funds and repay their debts. These borrowers have access to two different types
of loans: investment loans for stand-alone projects and development policy loans (DPLs)
that do not support stand-alone projects but instead provide budget support in exchange
for policy reform.3 The conventional wisdom is that if the World Bank has any influence
on the nature, speed, sequencing, and extent of policy reform in developing countries, it is
primarily through its DPL program (Smets and Knack 2016, 2018; Giordano and Pagano
2017). A key feature of this program is the fact that financial disbursements are linked to
the adoption of specific policy conditions. The World Bank refers to these conditions as
“prior actions” (PAs), and its ability to withhold disbursements—or threaten to withhold
disbursements—from borrower governments is a major source of bargaining power.
rectives.” Similarly, in a review of health care and pension reforms undertaken in Latin America duringthe 1980s and 1990s, Weyland (2006: 10) finds that “the IFIs most powerful instrument of coercion, loanconditionality, has proven to be a blunt weapon in the enactment of complex institutional reforms. Reformsof social security and health systems involve a wide range of actors. This multiplicity of veto players and theresulting need for political negotiations make it difficult for external actors that lack democratic legitimationto exert much influence.”
3During the 1980s and 1990s, DPLs were known as structural adjustment loans (SALs).
3

At the same time, there are reasons to question the efficacy of this aid-for-policy pro-
gram. The World Bank might pick policy conditions that do not reflect local needs and
priorities, demand too many conditions, or set arbitrary deadlines that short-circuit the
domestic political processes needed to secure the buy-in of various parties with disparate in-
terests (Boughton and Mourmouras 2004; Koeberle et al. 2006). It might also face internal
and external pressures—for example, to reward the allies or punish the enemies of powerful
shareholders, or to “push money out the door” to achieve professional prestige and budget
maximization goals—that undermine the credibility of its policy conditionality (Collier 1997;
Dollar and Svensson 2000; Easterly 2005; Kilby 2009).
Notwithstanding these concerns, there is some evidence that DPLs may instigate changes
in development policy. After accounting for self-selection bias, Smets and Knack (2016) and
Moll and Smets (2018) demonstrate that the cumulative number of World Bank economic
policy DPLs contracted by a borrower government is strongly and positively correlated with
the quality of its economic policies.4 Similarly, Giordano and Pagano (2017) provide econo-
metric evidence that DPLs positively correlate with the adoption of business environment
reforms in World Bank borrower countries. Rather than focusing on DPLs, Smets and Knack
(2018) examine the effects of the PAs that are nested within World Bank DPLs and find
evidence of a concave relationship between the cumulative number of PAs and the adoption
of public sector governance reforms in World Bank borrower countries: low to moderate
levels of conditionality hasten the adoption of public sector governance reforms, while high
levels of conditionality have the opposite effect. There are also several studies that suggest
World Bank policy lending and conditionality might be more effective in conjunction with
the provision of analytical and advisory services (Deininger et al. 1998; Wane 2004; World
Bank 2004; IEG 2008a: 40; Fardoust and Flanagan 2011).5
4Self-selection bias—the fact that an unobserved factor or set of factors might influence a government’spropensity to pursue DPL-related policy changes—is a major impediment to causal inference. World Bankborrowers might contract DPLs to justify policy changes or insulate themselves from the consequences ofpolicy changes that they would have pursued in the absence of the DPLs (Vreeland 2003; Chwieroth 2007;Parks and Davis 2019).
5In a 1998 study entitled Assessing Aid: What Works, What Doesn’t, and Why, Dollar and Pritchett
4

Most of these studies rest on the theoretical assumption that the World Bank effectu-
ates policy change by altering the incentives of public sector decision-makers in developing
countries. The standard theoretical model is one in which there are two actors—an IFI and
a borrower government—that are engaged in a bargaining process. These two actors have
well-defined interests and they bargain over financial concessions and policy concessions.
The IFI wants to maximize the domestic policy concessions that it can extract from the
borrower at the lowest possible cost, and the borrower wants to preserve its domestic policy
autonomy while maximizing the financial concessions that it can extract from the IFI (Kre-
mer and Clemens 2016; Girod and Tobin 2016; Masaki and Parks 2019). The IFI’s ability
to alter the cost-benefit calculation of the borrower is a function of whether the expected
benefits of reform exceed the expected costs. Given that reform often produces near-term
costs that are concentrated and long-term benefits that are diffuse, those who stand to lose
are typically well-prepared to organize themselves in political opposition to change and those
who stand to gain face significant collective action problems and demonstrate low levels of
political organization (Acemoglu and Robinson 2000; Alesina and Drazen 1991; Rajan 2004).
Consequently, the amount, nature, and timing of the funding that the IFI can offer to the
borrower are key determinants of whether an aid-for-policy bargain can be reached (Mosley
et al. 1995; Masaki et al. 2020). When the IFI increases the level of discretionary funding
that is available to the borrower for near-term use, the borrower can more easily compensate
the expected losers of distributionally consequential reforms (Robinson 2007; IOB 2012).
Therefore, the IFI’s ability to convince the borrower that the benefits of reform will exceed
the costs is a function of its willingness to provide flexible and fast-disbursing funding.
At the World Bank, DPL funding is easier to disburse and more flexible than funding
from investment loans. It is thus considered to be the primary instrument through which
(1998: 5, 13) argued that “[t]he key role of development projects should be to support institutional andpolicy changes that improve public service delivery. [. . . ] Development assistance is more about supportinggood institutions and policies than providing capital. Money is important, of course, but effective aid shouldbring a package of finance and ideas and one of the keys is finding the right combination of the two toaddress different situations and problems.”
5

the World Bank can effectuate policy change in borrower countries. By way of illustration,
consider Indonesia’s fuel subsidy reform in 2013 and the apparent role that a World Bank
DPL played in its design and implementation. In its written request for a $400 million DPL,
the Indonesian government assured the World Bank that it had put in place a “compensation
package [. . . ] [in order] to partly help shield poor households from the impact of higher fuel
prices” (Basri and Rajasa 2013). World Bank staff then brought the proposed loan to the
Board of Directors for consideration and made the case for approving this large and highly
flexible source of funding to the Indonesian authorities on the following basis: “[the Indone-
sian government will pursue] an expansion of targeted social assistance measures for the poor
following an increase in the price of subsidized fuel prices, from 8.5 million households to 15.5
million poor and vulnerable beneficiary households” (World Bank 2013). Therefore, World
Bank staff tacitly acknowledged that, by approving the provision of highly flexible financial
resources through a DPL, the Board of Directors would enable the Indonesian authorities to
pay for the “adjustment costs” of pursuing a fuel subsidy reform.
Role of Ideas
However, the World Bank is not only a lending institution. It also produces and dissem-
inates analysis and advice about development policy, which has led some observers to call it
a “knowledge bank” (Gilbert et al 1999; Ravallion 2013).
Theories of bargaining power call attention to the financial incentives that IFIs can bring
to bear to increase the likelihood that borrowers will challenge the domestic policy status
quo, but they do not leave room for the World Bank’s causal and principled beliefs about
development policy to directly and independently influence the policy priorities of borrower
countries. At best, in a setting where the World Bank has provided a financial package to a
borrower that is sufficiently attractive to convince the local authorities that the benefits of
reform will exceed the costs, the World Bank’s ideas about development policy might improve
the design of its DPL and thus increase the odds that the DPL will achieve its stated policy
objectives (Malesa and Silarszky 2005; Smets et al. 2013; Saavedra et al. 2015).
6

This blind spot in the literature has prompted some theorization about the conditions
under which—and the mechanisms through which—ideas might matter (Meseguer 2006;
Macpherson 2006; Kogut and Macpherson 2011; Chwieroth 2012; Weymouth and Macpher-
son 2012; Smets et al. 2013; Parks and Davis 2019). Social constructivists have proposed
that IFIs like the World Bank seek to ally themselves with a small number of reform cham-
pions in the executive branch with whom they share causal and principled development
policy beliefs. They argue that the presence of “sympathetic interlocutors” helps to align
expectations about the appropriateness and likely impact of a given policy choice, thereby fa-
cilitating cooperation between IFIs and governments in developing countries (Momani 2005;
Chwieroth 2007, 2009, 2010, 2012; Kahler 1992; Corrales 2006; Nelson 2014; Bazbauers
2019).6
This argument enjoys some empirical support. In a wide-ranging review of conditional
contracts between IFIs and developing countries, Kahler (1992: 127) finds that “close align-
ment between a cadre of national economic technocrats and the IFIs seems to have been a
prerequisite for [a reform] agreement.” Similarly, Chwieroth (2009: 2) provides econometric
evidence that the prospects for policy change in developing countries correlate positively
with the ability of IFI staff to “find and work with sympathetic domestic interlocutors who
embrace their policy goals.”
However, existing theory focuses on the recipients of policy ideas: those government
officials in borrower countries who are willing to promote policy priorities that are consistent
with the preferences of the IFIs. It does not shed light on the mechanisms that the IFIs use
to introduce and promote status-quo-altering ideas about development policy.
6By way of illustration, consider Salam Fayyad, who served as Prime Minister of the Palestinian NationalAuthority (PNA) from 2007 to 2013. His appointment in 2007 signaled a turning point in the PNA’srelations with the international community (Thrall 2010). Fayyad earned his Ph.D. in Economics from theUniversity of Texas at Austin, worked for the World Bank between 1987 and 1995, and became the IMFResident Representative in the West Bank and Gaza Strip from 1996 to 2001. According to a former IsraeliAmbassador to the U.S., Fayyad “[was] the Palestinian figure with the most prestige in the West; theyconsider[ed] him to be someone who can speak their language” (Ravid 2007). The World Bank also founda kindred spirit and enthusiastic collaborator in Fayyad, which substantially increased the organization’sinfluence over PNA’s public sector reform priorities between 2007 and 2013 (World Bank 2012: 20).
7

Herein lies the principal contribution of our study. The IFIs have codified a specific set of
tools to facilitate the transmission of policy ideas to developing countries over time (Arezki
et al. 2012; Parks et al. 2015; Fayad et al. 2020; other citations). The World Bank has
a particularly wide-ranging set of so-called analytical and advisory (AAA) services. These
non-lending services include economic and social work (ESW) and technical assistance (TA).
ESW is geared towards informing and influencing the direction and design of policy in client
countries, while TA is focused on the implementation of policy (Edwards 1997; Gilbert et
al. 1999; World Bank 2004, 2006; IEG 2008b).7
We are principally interested in understanding the first-order question of whether, when
and how the World Bank influences the direction and design of development policy in its
client countries, so we focus here on ESW. The World Bank has five “core [ESW] diagnostic
products” that it routinely generates to inform and influence its policy dialogue with borrower
countries: Country Economic Memoranda (CEMs) or Development Policy Reviews (DPRs);
Country Financial Accountability Assessments (CFAs); Country Procurement Assessment
Reviews (CPARs); Poverty Assessments (PAs); and Public Expenditure Reviews (PERs)
(IEG 2008b: 14).8
There are several reasons why these analytical and advisory products (or other types of
7The World Bank defines TA as those activities that are “(a) aimed at enabling an external client toimplement reforms or strengthen its institutions; (b) free-standing, not an essential part of another activitysuch as lending or ESW; and (c) linked to a Bank unit with clear accountability for the service provided”(World Bank 2006).
8According to World Bank (2004: 86), “[t]he CEM and DPR analyze key aspects of a country’s economicdevelopment, such as growth, fiscal reform, public administration, foreign trade, financial sector development,and labor markets. They are flexible analytic instruments whose structure and content are largely dependenton country circumstances. Their aim is to provide an integrated view of a country’s development prioritiesand a framework for designing development strategies. [. . . ] The CFA evaluates the overall quality of acountry’s public financial management system, covering budgeting, accounting, reporting and auditing, andexternal scrutiny of public finances [. . . ] [and one of its objectives is to] improve a country’s public financialmanagement by developing and following up action plans agreed with the government. [. . . ] The CPARdiagnoses the health of the country’s procurement system and practices and [aims] to generate a dialoguewith governments on needed reforms. [. . . ] The PA provides information on the causes and consequencesof poverty in a country and examines how public policies, expenditures, and institutions affect poor people.[. . . ] The PER examines government resource allocations within and among sectors and assesses the equity,efficiency, and effectiveness of those allocations in the context of the macroeconomic framework and sectorpriorities. In addition, it identifies the reforms needed in budget processes and administration to improvethe efficiency of public spending.”
8

ESW) could influence the policy priorities of borrower countries, irrespective of any lending
relationships that may exist with the World Bank. In the absence of financial leverage, the
World Bank “has to begin by [. . . ] persuading existing [political] leaders that specific reforms
should be undertaken” (Woods 2006: 72). These leaders are usually motivated by a desire
to stay in power, so uncertainty about the distribution of winners and losers that might
result from a reform can reduce their willingness to challenge the status quo (Fernandez and
Rodrik 1991). The World Bank can therefore use its analytical and advisory products to
provide information about the likely distribution of gains and losses and thereby reduce the
uncertainty that political leaders face about the likely consequences of reform (Smets 2020).
Another important feature of the World Bank’s analytical and advisory products is that
they are often undertaken in collaboration with government officials in the host country.
Involving the governing authorities in the process of diagnosing policy problems and formu-
lating policy recommendations may be consequential if it makes political leaders less likely to
question the quality and reliability of the analysis and advice that they receive (Masaki and
Parks 2019). Indeed, IFIs like the World Bank often lack contextual knowledge about the
countries that they are responsible for analyzing and advising and fail to adequately consult
with the governing authorities who possess significant informational advantages (Andrews
2013). Therefore, sourcing contextual information from public officials in the country that is
being analyzed and advised may reduce perceptions that the diagnostic and advisory content
of the World Bank’s ESW is biased or otherwise unreliable (Lombardi and Woods 2008). It
may also increase the resonance of the findings and recommendations that the World Bank
produces for public sector decision-makers in client countries.
To the extent that World Bank ESW gives policymakers in the client country a greater
sense of ownership in the policy changes that are being implicitly or explicitly advocated,
it may also give them a useful tool for (a) building broader domestic coalitions of support
for reform, or (b) neutralizing actors who might oppose reform (Besley and Persson 2011;
9
Kelley and Simmons 2019; Parks and Davis 2019).9 Previous research suggests that reform
is more likely when it becomes “the business of a wider range of insiders” (Jacoby 2006: 638)
and when the general public places pressure on the authorities to follow through on their
initial commitments (Abiad and Mody 2005). Therefore, the World Bank’s sympathetic
interlocutors in client countries might try to make the diagnostic and advisory content in
World Bank ESW a “focal point” that can stabilize expectations and lower bargaining costs
among the domestic political actors that make and shape government policy (Schelling 1960;
Tama 2013).10
Based upon these considerations, we will test the following hypothesis:
H1: The provision of ESW increases the World Bank’s ability to influence the policy priorities
of its client countries.
Data and Methods
Among social scientists, there is a growing recognition that if a central part of the World
Bank’s raison d’etre is to improve the quality of policy in developing countries, those who
wish to evaluate the organization’s effectiveness need to use outcome measures that can cap-
ture changes in government policy—rather than traditional development outcome measures
like economic growth and infant mortality (Smets and Knack 2016; Masaki et al. 2020).
9Indeed, sympathetic interlocutors can serve as policy brokers who not only introduce and promoteforeign ideas that challenge the status quo, but also ensure that these ideas are politically acceptable andfeasible by building coalitions with domestic political allies and neutralizing domestic political opponents.Amalia Anaya is a case in point (Grindle 2004). She served as the head of Bolivia’s Technical Support Teamfor Education Reform (ETARE) from 1992 to 1994 and played a crucial role in redefining the country’spolicy priorities and co-opting those who could potentially derail the new set of policy priorities. Despiteinauspicious conditions for change, Anaya succeeded in redefining the Bolivian government’s educationalquality reform agenda during the 1990s, and she did so in part by leveraging analysis and advice from theWorld Bank and the Inter-American Development Bank. She also pre-empted would-be opponents of thegovernment’s new policy priorities by hiring “politically prominent individuals [to staff her reform team] whocould establish a bridge to political parties in the country” (Grindle 2004: 97).
10Tama (2013: 153) defines a focal point as “a proposal or idea around which public debate revolves ina given policy area” and explains that “[o]ne common problem is that negotiations in situations of multipleequilibria sometimes only succeed if someone is able to create a focal point by publicizing an option thatbecomes the most salient choice.”
10

Elaborating on this point, Kremer and Clemens (2016: 71) note “[i]f one believes that the
primary impact of the [World] Bank comes from its specific investments, then one might rea-
sonably evaluate the Bank by assessing what proportion of its investments yield, for example,
a 7 percent annual rate of return. If one believes, as we and many other observers do, that
the biggest effects of the World Bank arise through its role in influencing developing country
policy, then one’s assessment of the overall impact of the [World] Bank will hinge primarily
on one’s beliefs about the effects of these types of policies. A regular bank hopes to obtain a
positive return on the vast majority of its investments. In contrast, the [World] Bank could
potentially achieve a high social rate of return through a few big wins [. . . ]. Clearly, if one
believes that the [World] Bank has reduced poverty primarily by using its financial resources
as part of a bargaining process to promote a few important policy reforms, measuring the
Bank’s impact becomes difficult. Running a regression with country-level outcomes as the
dependent variable and World Bank lending as a key explanatory variable will miss the
point if a substantial share of the Bank’s impact came from the spread of conditional cash
transfers, or reforms inspired by the Doing Business reports, or the impact of former Bank
officials on Indian economic reforms in the 1990s.”
To help close this evidence gap, we designed and implemented the 2014 Reform Efforts
Survey in the summer of 2014 in partnership with the National Opinion Research Center
(NORC) at the University of Chicago. It provides a unique source of micro-level survey
data on the policy influence of nearly 150 other aid agencies and development banks, as
observed and experienced by the local counterparts of these institutions in 126 low-income
and middle-income countries.11
Unlike traditional elite surveys that are based on convenience sampling (where a popu-
lation of interest is not identified and sample representativeness cannot be evaluated), we
first identified our populations of interest in 126 low-income and middle-income countries
and carefully constructed sampling frames for each of these countries in a consistent and
11The questionnaire is available in the online appendix of Parks et al. (2015).
11

comparable manner, which allows us to evaluate the representativeness of our sample and
employ inverse probability weights to adjust for sample selection (i.e., non-response) bias.12
The process by which we constructed the country-specific sampling frames that were used to
facilitate the survey is described in Section B of the Appendix. The master sampling frame
consists of 54,990 host government officials, development partner staff, civil society lead-
ers, private sector representatives, and independent experts from 126 low- and lower-middle
income countries and semi-autonomous territories.13
Altogether, 6,731 individuals participated in the survey. However, for the purposes of this
study, we are interested in a specific subsample of respondents: the 1,244 host government
officials from 121 low- and middle-income countries who (a) participated in the survey, (b)
reported having direct interactions with the World Bank, and (c) subsequently evaluated the
agenda-setting influence of the World Bank. Each of these respondents was asked to evaluate
the level of influence that the World Bank exerted on the host government’s decision to pursue
specific reforms over a specific time frame (during the respondent’s tenure in a self-identified
public sector position and institution) and in a specific policy area (the respondent’s self-
identified area of policy expertise).14 These respondents evaluated the influence of the World
Bank on a scale of 0 (no agenda-setting influence) to 5 (maximum agenda-setting influence).
Given that our sample may not be representative of the population of interest (i.e., the
sampling frame), we employ inverse-probability weights to account for unit non-response.
The data from the 2014 Reform Efforts Survey are valuable in that they capture the
experiences and observations of public sector officials from the governments that the World
12For each low- and lower-middle income country, we defined our population of interest as those individualswith direct knowledge of how government policies and programs were prioritized, designed, and implementedbetween 2004 and 2013. See Section 2 of the Appendix for more details.
13The specific inclusion criteria and procedures employed to develop the sampling frame are described indetail in Parks et al. (2015).
14These specific reforms were identified by respondents themselves in a prior survey question that askedthem to identify up to three specific problems that government reforms (in the respondent’s area of policyexpertise) sought to address. In an earlier set of survey questions, each respondent was asked to select his orher primary policy area of focus (from a fixed list 23 different policy areas) and anchor on a specific publicsector job and institution (with a defined start year and end year) in a given country between 2004 and 2013.Respondents were then asked to evaluate the influence of specific donors from the vantage point of his orher policy area of focus and country in that particular position and time period.
12

Bank sought to influence during our period of study (2004-2013). We cannot be certain that
all survey respondents provided answers on the basis of policy decisions that they themselves
made or directly witnessed, but the types of respondents who participated in the survey are
substantially more proximate to the empirical phenomena of interest—World Bank influence
on the policy priorities of its client countries—than any other population.15 A public opinion
survey or a survey of experts would have been far less useful, as these populations generally
know little about the inner-workings of government (Hoffmann-Lange 2007; Tansey 2007;
Parks and Masaki 2019).
Another attractive feature of the 2014 Reform Efforts Survey is that it provides rich data
on the individual characteristics of policymakers. The survey asked each government official
a battery of questions about his or her position (rank), primary area of policy expertise, job
responsibilities, educational background, length of government service, reform orientation,
personal communications and interactions with donor agencies and international organiza-
tions, etc. We can therefore control for characteristics of policymakers that may affect the
ways in which they perceive or report the influence of the World Bank. The fact that the
survey asked respondents to evaluate the influence of the World Bank in a specific country,
policy domain, and time period also enables us to model with fixed effects at the level of
country-policy cluster pairs.16 We are thus able to expunge the potentially confounding
15A key strength of the survey is the fact that it includes attributional responses from policymakers withfirsthand knowledge of the domestic and external factors that influenced the policy priorities and reformefforts of their governments. However, given that individual respondents evaluated the influence of theWorld Bank based on their own personal observations and experiences, a natural question that arises iswhether these evaluations correlate with independently-generated measures of development policy change.Masaki and Parks (2019) provide evidence that suggests the construct validity of our dependent variableis strong. With data from the 2014 Reform Efforts Survey, they demonstrate that our measure of theWorld Bank’s agenda-setting influence is a strong predictor of improvements on the World Bank’s distanceto frontier (DTF) measure of the ease of doing business. The DTF measure varies on a scale of 0 to 100,with higher scores indicating greater ease of doing business. Masaki and Parks (2019) find that a one unitincrease in respondent ratings of the World Bank’s policy influence—within the business environment policydomain—is associated with a 1 percent increase in DTF values over time.
16To ensure that we have sufficient variation within pairs, we cross-walked the 24 different policy domainsin the 2014 Reform Efforts Survey to five broad policy clusters that the World Bank uses to categorize its ownactivities: macroeconomic and structural policy (MSP), human development (HD), sustainable development(SD), governance (GOV), and other. See Table A1 in the appendix for a description of how we map surveyrespondents’ 24 different policy domains to these five different policy clusters.
13

effects of observable and unobservable characteristics at the level of country-policy cluster
pairs and isolate the within-pair variation that is explained by the receipt of World Bank
lending and non-lending services.17
Model
Our baseline statistical model is an ordered probit model summarized in Equation (1).
Influence Ratingi = β0 + β1Assistancei + α1>X1i + α2
>X2i +
N×k∑n=1
δnrn + εi (1)
In Equation (1), i denotes a survey respondent. Our primary outcome variable—Influence
Rating, which represents an individual respondent’s assessment of the World Bank’s influence
on his or her government’s decision to pursue reforms in a specific policy domain and time
period (the respondent’s self-identified area of policy expertise during his or her period of
service in a self-identified public sector position and institution)—is drawn from the 2014
Reform Efforts Survey. This variable takes integer values from 0 to 5.18 β0 is the intercept.
β1 is the coefficient for a given form of Assistance. α1 is a vector of partial effects for
a matrix of respondent-country-year-level control variables denoted by X1i. While these
control variables do not vary within respondents (since there is only one observation per
respondent who evaluated the World Bank), they do vary within countries based on the time
periods in which respondents held their public sector positions. These measures also vary
within country-policy-cluster pairs (i.e., specific policy areas within countries) whenever there
17By way of illustration, assume that there are two respondents in a given country-policy cluster pair (e.g.Madagascar-Human Development) and the first respondent reports that the World Bank had a high level ofinfluence on the host government’s policy priorities and the second respondent reports that the World Bankhad a low level of influence on the host government’s policy priorities. If the first respondent worked during aperiod of time (say, 2004-2007) when the World Bank provided a higher level of assistance, analysis or adviceto the human development sector and the second respondent worked during a period of time (say, 2008-2011)when the World Bank provided a lower level of assistance, analysis, or advice to the human developmentsector, a model that uses country-policy cluster pair fixed effects would make it possible to isolate this sourceof variation. Therefore, our approach allows to isolate variation in the timing of treatment and variationin the timing of when respondents evaluated the policy influence of the World Bank within country-policycluster pairs.
180 denotes no influence. 5 denotes maximum influence.
14

is more than one respondent in a given country-policy-cluster pair and these respondents
did not hold their respective public sector positions during the same period of time.19 α2 is
a vector of coefficients for our respondent-level controls contained in X2i. Here δn denotes
unmeasured time-invariant determinants of the World Bank’s policy influence in country-
policy-cluster n and rn is a country-policy-cluster indicator dummy, with N representing
the total number of countries and k representing the total number of policy-clusters in the
sample. The term εi is an error term that denotes all unmeasured idiosyncratic factors that
affect the World Bank’s reported level of policy influence at the individual respondent level.
In order to measure exposure to the World Bank’s lending and non-lending services,
we extract information on the timing, policy focus, and cross-country distribution of ESW
products, DPLs, PAs, and investment loans from the organization’s Business Intelligence
Database and Development Policy Actions Database. The number of World Bank ESW
products received by a country in a given policy cluster and year is our primary variable
of interest (n esw m 1p) and test of H1. The World Bank assigns each of its ESW prod-
ucts to one of four policy clusters: Macroeconomic and Structural Policy (MSP), Human
Development (HD), Sustainable Development (SD), and Governance (GOV). Therefore, we
cross-walk these policy cluster-categorized ESW data to the 24 policy domains to which 2014
Reform Efforts Survey respondents anchored their evaluations of the World Bank (see Table
A1 in the Appendix). This approach allows to define exposure to the World Bank ESW
“treatment” at the country-policy-cluster-year level, so if a respondent worked in a specific
country and policy cluster that received ESW from the World Bank during a year in which
he or she evaluated the policy influence of the World Bank, we identify the respondent as
having experienced exposure to the World Bank ESW “treatment.”
Given that the World Bank provides a bundle of lending and non-lending services to its
client countries and virtually all of these services have policy objectives, we also construct
four additional variables that measure the World Bank’s lending services. In order to capture
19In general, they could vary for any pair that meets these criteria.
15

exposure to development policy lending, we use two measures—the number of development
policy loans and the number of prior actions issued by the organization—that are categorized
by the World Bank “policy cluster.” We then follow the same cross-walk procedure (see Table
A1 in the Appendix) that we used to construct n esw m 1p to measure these variables at the
country-policy-cluster-year level. These variables—dpl proj n m 1p and pa m 1p—measure
whether a respondent worked in a specific country and policy cluster that received one or
more DPLs or PAs, respectively, from the World Bank during a year in which he or she
evaluated the policy influence of the World Bank.
We also rely on measures of annual per capita disbursements through development pol-
icy loans (lnaid dpl disb pc 0 m 1p) and annual per capita disbursements through investment
loans (lnaid inv disb pc 0 m 1p). However, the World Bank does not categorize its financial
disbursement data by policy cluster, so these variables are measured at the country-year
level. Also, given that lnaid dpl disb pc 0 m 1p, dpl proj n m 1p, and pa m 1p are strongly
correlated, we never introduce these variables simultaneously to minimize the risk of multi-
collinearity.
For ease of exposition, we refer to these five measures of exposure to World Bank assis-
tance as “treatment” variables (see Table A2). We set all of these variables to the mean
values that they assumed between a respondent’s start year and the prior year since the
receipt of World Bank assistance in the year prior to a respondent’s start year could affect
the World Bank’s reported level of policy influence in the very next year.20
Additionally, in our baseline model, we include six country-level control variables to
account for political and economic attributes of countries that may correlate with the extent
to which the World Bank influences the policy priorities of its client countries. First, to
account for the possibility that a government’s propensity to recalibrate its policy priorities
is a function of its bargaining power vis-a-vis donors and creditors (Girod and Tobin 2016;
Parks and Masaki 2019), we control for net official development assistance as a percentage
20Due to their highly skewed distributions, we log the two treatment variables with monetary values andreplace their missing values with minimum positive values.
16

of gross national income (aid gni 1st). Second, in recognition of the fact that lower levels
of demand for reform in lower income countries may condition the policy influence that
the World Bank can exert (Andrews 2011; Loayza et al. 2012), we include a measure
of gross domestic product per capita (lngdp pc 1st). Third, to account for the possibility
that the relationship between income and demand for reform is non-linear, we introduce the
squared term of gross domestic product per capita (lngdp pc 1st 2 ).21 Fourth, to address the
possibility that small states lack bargaining power and may need to compensate for their own
limited internal administrative and technical capabilities by relying on analysis, advice, and
assistance from the World Bank (Vreeland 2003; Pop-Eleches 2009), we control for the size
of a country’s population (lnpop 1st).22 Fifth, since democratically-elected governments are
generally more motivated to “lock-in” reform commitments and more responsive to external
pressures for reform (Kapstein and Converse 2008), we control for regime type, as captured by
the POLITY rating (polity2 1st). Finally, to account for the possibility that a government’s
political orientation influences the level of effort made by World Bank staff to convince
the authorities of the merits of policy reform (Smets et al. 2013), we introduce a dummy
variable that takes a value of 1 in country-years when the government in power has a left-wing
orientation (left 1st). To measure these control variables in a way that minimizes the risk of
endogeneity, we take the value of each measure during the first year in which a respondent
held his or her public sector position.23
21Previous research suggests that middle-income countries have more “outside options” than low-incomecountries with respect to analytical and advisory service (IEG 2007: 5). Indeed, they often purchase analysisand advice from private sector entities. IEG (2008b: xvi) points to “economic monitoring ESW in [middle-income countries] that had access to such analysis from the private sector or international investors” as aparticularly ineffective form of World Bank AAA, noting that “[t]he Bank’s economic monitoring ESW hadvery little value added in such circumstances.”
22The lnpop 1st, lngdp pc 1st, and lngdp pc 1st 2 variables are logarithmically transformed to correct fortheir highly skewed distributions.
23As robustness checks, we calculate two alternative versions of our country-level controls by (a) using themean of the observed values for the years in which a respondent held his or her public sector position, and(b) setting the values of these variables to those in the year prior to a respondents start year. The rationalefor this approach (a) is to account for potential confounds over the full period of treatment. Imagine, forexample, that GDP per capita increases sharply between a respondent’s start year and end year. If GDPper capita positively correlates with World Bank policy influence, and our control variable does not capturethe fact that GDP per capita increased between the respondent’s start year and end year, we have omittedan important confound. The rationale for approach (b) is to minimize the risk of endogeneity by using
17

We also include a set of variables to account for the potentially confounding effects of
respondent characteristics and biases. Consistent with the approach taken by Masaki and
Parks (2019), we control for sex (sex ), level of education (master and phd), public sector
institutional affiliation (orgtype), the length of time for which a given respondent worked for
the government of the client country (Q1), and his or her area of policy expertise.24 Addi-
tionally, to account for the possibility that a respondent’s beliefs about the level of domestic
support for reform (in his or her area of policy expertise) colored his or her assessment of
the level of influence that the World Bank exerted on host government policy priorities, we
control for the reported level of domestic support for reforms among five groups: the execu-
tive (head support), the legislature (legis support), the judiciary (judi support), the military
(mil support), and civil society (civil support).
Results
Our baseline results are reported in Table 1. In columns (1)-(5), we enter each treatment
variable into the equation on its own but with a standardized set of control variables. These
models, which include country-policy-cluster-fixed effects, account for the confounding effects
of observable and unobservable characteristics at the level of country-policy cluster pairs and
thereby isolate the within-pair variation in the outcome variable that is explained by the
receipt of World Bank lending and non-lending services. Consistent with H1, we find that
our primary treatment variable of interest—the number of analytical and advisory products
(n esw m 1p) issued by the World Bank—registers a positive and statistically significant
effect on the organization’s level of influence over the policy priorities of its client countries.
We find that levels of exposure to development policy lending (lnaid dpl disb pc 0 m 1p)
and investment lending (lnaid inv disb pc 0 m 1p)—in columns (1) and (2)—are negatively
associated with the World Bank’s level of agenda-setting influence, but only the former is
pre-treatment controls. These results are reported in Section 4.24We control for a respondent’s area of policy expertise in two ways. In some model specifications, we
include policy cluster fixed effects. In other model specifications, we use country-policy cluster fixed effects.
18

Table 1: Determinants of the World Bank’s Influence at the Agenda-Setting Stage of thePolicymaking Process
(1) (2) (3) (4) (5) (6) (7) (8) (9) (10)
lnaid dpl disb pc 0 m 1p -0.06** -0.01 -0.03 -0.06**(0.03) (0.02) (0.02) (0.03)
lnaid inv disb pc 0 m 1p -0.01 0.02 -0.11*** -0.07 -0.03 -0.02(0.04) (0.01) (0.04) (0.04) (0.04) (0.04)
n esw m 1p 0.21** 0.08* 0.06 0.21** 0.21** 0.23***(0.08) (0.05) (0.05) (0.09) (0.08) (0.08)
dpl proj n m 1p 0.32* 0.33*(0.18) (0.18)
pa m 1p 0.01 0.03(0.03) (0.03)
lngdp pc 1st -14.18**-10.80*-10.68*-10.27*-10.40* 0.65 -0.28 -16.27***-11.56*-11.92**(5.87) (5.79) (5.60) (5.67) (5.58) (0.79) (4.05) (5.96) (5.93) (5.88)
lngdp pc 1st 2 1.06*** 0.83** 0.85** 0.82** 0.83** -0.06 0.08 1.18*** 0.89** 0.91**(0.38) (0.37) (0.36) (0.37) (0.36) (0.05) (0.27) (0.39) (0.39) (0.38)
lnpop 1st 0.21 -0.30 -0.27 -0.89 -0.62 -0.15*** -0.86 1.25 -0.01 0.31(1.62) (1.70) (1.61) (1.60) (1.58) (0.04) (1.03) (1.77) (1.76) (1.75)
aid gni 1st -0.01 -0.01 -0.01 -0.01 -0.01 -0.00 -0.00 -0.01 -0.00 -0.00(0.01) (0.01) (0.01) (0.01) (0.01) (0.00) (0.00) (0.01) (0.01) (0.01)
polity2 1st -0.01 -0.00 -0.01 0.00 0.00 0.01 -0.02 -0.02 -0.02 -0.02(0.04) (0.04) (0.04) (0.04) (0.04) (0.01) (0.03) (0.04) (0.04) (0.04)
left 1st -0.58* -0.52 -0.66** -0.54* -0.63** -0.16 -0.14 -0.56 -0.41 -0.46(0.33) (0.33) (0.32) (0.31) (0.32) (0.10) (0.22) (0.35) (0.34) (0.34)
Respondent-level controls Yes Yes Yes Yes Yes Yes Yes Yes Yes YesCountry-Policy Cluster Pair FEs Yes Yes Yes Yes Yes No No Yes Yes YesCountry FEs No No No No No No Yes No No NoPolicy Cluster FEs No No No No No Yes No No No No
Observations 686 692 719 719 719 672 787 672 692 692BIC 3500 3480 3610 3621 3625 2636 3400 3322 3465 3495AIC 2290 2327 2401 2408 2412 2366 2755 2208 2312 2324
Notes: All regressions use inverse-probability weights to account for variation in unit non-response rate.* p < 0.1;** p < 0.05;*** p < 0.01.
19

statistically significant at the 95% confidence level. When we use an alternative measure of
exposure to development policy lending in column (4)—the number of DPLs issued by the or-
ganization (dpl proj n m 1p)—the direction of the estimate switches to positive and reaches
a conventional level of statistical significance. However, exposure to policy conditionality—
as measured by pa m 1p—is not a statistically significant predictor of the World Bank’s
agenda-setting influence.
In models (6)-(10), we simultaneously introduce multiple treatment variables to assess
their effects independently of one another. We also vary the fixed-effects structure of the
models across these columns. In models (6) and (7), which respectively control for policy-
cluster-fixed effects and country-fixed effects, we find few statistically significant relation-
ships. However, the n esw m 1p variable remains positive in sign and statistically significant
at the 90% confidence level. It is statistically insignificant in Model 7 but still positive in
sign.
Columns (8)-(10) are our most rigorous model specifications. They simultaneously in-
troduce multiple treatment variables, while also accounting for unobserved factors that are
common to policy clusters within countries. The result that is most consistent across all of
these specifications is that the number of ESW products (n esw m 1p) issued by the World
Bank is a positive and statistically significant predictor of the level of influence that the
World Bank has on the policy priorities of its client countries. The results in Table A10 in
the Appendix report the same models from Table 1 using odds ratios. They demonstrate
that, holding everything else constant, the provision of each additional ESW product makes
the average respondent about 1.24 times as likely to report that the World Bank ranks in
the next highest agenda-setting influence category.25 This effect size is modest, but it is
not negligible in light of the limited variability in the outcome variable itself.26 Also, given
that the cost of achieving this higher level of influence is quite low ($34,376, on average),
25Recall that respondents were asked to evaluate the World Bank with integer values between 0 (noagenda-setting influence) and 5 (maximum agenda-setting influence).
26The standard deviation of the influence measure is 1.33. See Table A2 in the Appendix.
20

our results imply that ESW is a particularly cost-effective way that the World Bank can
influence the policy priorities of its client countries.27
A less consistent pattern emerges when we consider the treatment variables that measure
exposure to development policy lending and investment lending. One’s level of exposure to
development policy lending (lnaid dpl disb pc 0 m 1p) is negatively and significantly associ-
ated with the agenda-setting influence of the World Bank, but the direction and significance
of this estimate changes when we use dpl proj n m 1p an alternative measure of DPL treat-
ment in column (9). Exposure to policy conditionality (pa m 1p) is positive but statistically
insignificant.28
In Table 2, rather than using an outcome measure that captures the World Bank’s in-
fluence on the direction of policy (i.e., agenda-setting influence), we use a measure from the
2014 Reform Efforts Survey that asked respondents how much influence the World Bank
had over the design of policy. We do so because the stated purpose of World Bank ESW
is to influence both the direction and the design of government policy in client countries
(World Bank 2004, 2006). The fixed-effects structure of the models in Table 2 is the same
as in Table 1. The results demonstrate that the n esw m 1p variable still registers a positive
and statistically significant effect.
In Table 3, we replicate the same models but with another outcome measure from the
2014 Reform Efforts Survey : respondent evaluations of the World Bank’s helpfulness during
27ESW products are relatively inexpensive. In 2012, the World Bank delivered 874 ESW products toits client countries at total cost of $34,266,769. In 2013, it delivered the 772 ESW products to its clientcountries at a total cost of $24,503,120. In 2014, it delivered 1,199 ESW products to its client countries ata total cost of $38,588,088. The average unit cost of an ESW product during this time period (2012-2014)was $34,376. These summary statistics are drawn from the World Bank’s Business Intelligence Database.
28With some exceptions, the results for the control variables are mostly consistent across the columns inTable 1. Our measure of per capita income (lngdp pc 1st) and its squared term (lngdp pc 1st 2 ) togethersuggest that increases in per capita income are negatively associated with the World Bank’s level of agenda-setting influence, but that this effect dampens at higher levels of per capita income. The population sizevariable (lnpop 1st) is negatively signed in all but one model, but only statistically significant in model(6). The aid dependence variable (aid gni 1st) is negative in all model specifications but never statisticallysignificant (and close to zero). We also find no statistically significant relationship between the strength ofdemocratic institutions (polity2 1st) and the World Bank’s level of agenda-setting influence, and the signof the coefficient changes depending on the model specification. We find some evidence that the WorldBank enjoys less policy influence in countries with left-wing governments (left 1st), but this estimate fails toachieve statistical significance in most models.
21

Table 2: Determinants of the World Bank’s Influence at the Design Stage of the PolicymakingProcess
(1) (2) (3) (4) (5) (6) (7) (8) (9) (10)
lnaid dpl disb pc 0 m 1p -0.02 0.01 -0.03 -0.04(0.03) (0.02) (0.02) (0.03)
lnaid inv disb pc 0 m 1p -0.01 0.01 -0.05 0.04 -0.03 -0.02(0.04) (0.01) (0.04) (0.05) (0.04) (0.04)
n esw m 1p 0.17* 0.09** 0.12** 0.18** 0.18** 0.20**(0.09) (0.05) (0.05) (0.09) (0.09) (0.09)
dpl proj n m 1p 0.37* 0.39**(0.19) (0.19)
pa m 1p 0.03 0.04(0.03) (0.03)
lngdp pc 1st -22.79*** -22.63*** -19.09*** -19.27*** -19.58*** 1.16 -5.79 -28.17*** -22.77*** -22.98***(7.34) (7.53) (6.98) (7.08) (7.02) (0.84) (4.66) (7.83) (7.61) (7.56)
lngdp pc 1st 2 1.52*** 1.48*** 1.27*** 1.28*** 1.30*** -0.10* 0.35 1.87*** 1.50*** 1.51***(0.48) (0.49) (0.46) (0.46) (0.46) (0.06) (0.31) (0.51) (0.50) (0.49)
lnpop 1st -0.06 0.13 -0.31 -0.86 -0.54 -0.16*** -0.76 1.18 0.22 0.59(1.92) (2.03) (1.91) (1.90) (1.88) (0.04) (1.11) (2.07) (2.09) (2.08)
aid gni 1st -0.00 -0.00 -0.00 -0.00 -0.00 -0.00 -0.00 -0.00 -0.00 -0.00(0.01) (0.01) (0.01) (0.01) (0.01) (0.00) (0.00) (0.01) (0.01) (0.01)
polity2 1st -0.07* -0.06 -0.07* -0.07* -0.06 -0.00 -0.04 -0.08** -0.08* -0.08*(0.04) (0.04) (0.04) (0.04) (0.04) (0.01) (0.03) (0.04) (0.04) (0.04)
left 1st -0.09 -0.06 -0.17 -0.03 -0.10 -0.02 -0.07 -0.11 0.08 0.04(0.35) (0.37) (0.35) (0.34) (0.35) (0.10) (0.22) (0.38) (0.37) (0.38)
Respondent-level controls Yes Yes Yes Yes Yes Yes Yes Yes Yes YesCountry-Policy Cluster Pair FEs Yes Yes Yes Yes Yes No No Yes Yes YesCountry FEs No No No No No No Yes No No NoPolicy Cluster FEs No No No No No Yes No No No No
Observations 670 675 702 702 702 656 769 656 675 675BIC 3322 3365 3500 3507 3485 2617 3341 3249 3345 3336AIC 2209 2245 2334 2337 2333 2352 2690 2155 2230 2230
Notes: All regressions use inverse-probability weights to account for variation in unit non-response rate.* p < 0.1; ** p < 0.05; *** p < 0.01.
22

Table 3: Determinants of the World Bank’s Helpfulness at the Implementation Stage of thePolicymaking Process
(1) (2) (3) (4) (5) (6) (7) (8) (9) (10)
lnaid dpl disb pc 0 m 1p -0.01 -0.00 -0.06*** -0.04(0.04) (0.02) (0.02) (0.04)
lnaid inv disb pc 0 m 1p -0.01 0.02 0.01 -0.01 -0.01 -0.01(0.03) (0.01) (0.04) (0.04) (0.03) (0.03)
n esw m 1p 0.24** 0.02 0.02 0.21** 0.22** 0.22**(0.10) (0.04) (0.05) (0.09) (0.10) (0.10)
dpl proj n m 1p 0.10 0.04(0.19) (0.19)
pa m 1p 0.01 0.01(0.03) (0.04)
lngdp pc 1st -9.01 -10.44* -9.31 -8.32 -8.61 -0.07 -8.09** -12.76** -11.36* -11.55*(5.75) (6.08) (5.75) (5.71) (5.66) (0.76) (3.77) (6.26) (6.25) (6.21)
lngdp pc 1st 2 0.58 0.70* 0.59 0.53 0.55 -0.01 0.61** 0.84** 0.76* 0.77*(0.37) (0.40) (0.37) (0.37) (0.37) (0.05) (0.25) (0.41) (0.40) (0.40)
lnpop 1st 3.55** 2.81 4.43** 3.50* 3.61** -0.08* -1.28 3.79** 3.64* 3.70*(1.80) (1.87) (1.89) (1.87) (1.84) (0.04) (1.08) (1.89) (1.96) (1.92)
aid gni 1st 0.01 0.00 0.01 0.01 0.01 -0.00 -0.00 0.00 0.01 0.01(0.01) (0.01) (0.01) (0.01) (0.01) (0.00) (0.00) (0.01) (0.01) (0.01)
polity2 1st 0.06 0.07 0.05 0.07 0.07 -0.00 0.04 0.05 0.06 0.05(0.05) (0.06) (0.05) (0.05) (0.05) (0.01) (0.03) (0.06) (0.06) (0.06)
left 1st -0.57 -0.58 -0.63* -0.54 -0.54 -0.03 -0.25 -0.65* -0.63 -0.61(0.37) (0.37) (0.36) (0.36) (0.36) (0.12) (0.21) (0.38) (0.39) (0.39)
Respondent-level controls Yes Yes Yes Yes Yes Yes Yes Yes Yes YesCountry-Policy Cluster Pair FEs Yes Yes Yes Yes Yes No No Yes Yes YesCountry FEs No No No No No No Yes No No NoPolicy Cluster FEs No No No No No Yes No No No No
Observations 634 635 657 657 657 621 732 621 635 635BIC 2944 2901 3011 3078 3046 2319 3036 2833 2900 2913AIC 1916 1886 1957 1983 1973 2057 2406 1840 1881 1884
Notes: All regressions use inverse-probability weights to account for variation in unit non-response rate.* p < 0.1; ** p < 0.05; *** p < 0.01.
policy implementation. Here again, the n esw m 1p results mirror those reported in Tables
1 and 2, which suggests that ESW products are not only influential at upstream stages of
the policymaking process, but also helpful during downstream policy implementation.
Robustness Checks
In this section, we undertake a battery of robustness checks and summarize the results
reported in the Appendix. First, in Tables A2-A4, we alter the measurement of our treatment
and (country-level) control variables by taking their mean values over the duration of a
23

respondent’s tenure in his or her public sector position.29 We do so to account for the
possibility of “late” (and “early”) treatment. That is to say, if the receipt of World Bank
assistance occurred towards the end of the period of time in which a respondent evaluated
the World Bank’s level of policy influence (i.e., one of the last years when his/her job required
interacting with the World Bank), then one would need to measure treatment exposure over
the entire course of the treatment period.30 When we replicate our baseline models with
these alternative treatment and control variables, we obtain similar results. Although some
of the estimates are no longer statistically significant, the n esw mean remains positive in
sign and statistically significant in the most rigorous model specification reported in Table
A3.
Second, we test whether our results are sensitive to the inclusion of controls that measure
a potentially significant confound: client country demand for reform assistance. If the World
Bank finds and works with “sympathetic interlocutors” in client countries who share their
policy preferences, then it is possible that these government officials would have implemented
the World Bank’s policy ideas in the absence of ESW. To address this potential threat to
inference, we exploit two unique features of the 2014 Reform Efforts Survey : a question that
asked each respondent to report how frequently he or she interacted with the World Bank
officials via phone, email, video, or face-to-face communications during his or her period of
public service,31 and a question that asked each respondent to reveal the intensity of his or
her preferences for status-quo challenging reform.32 We use the first variable (freq comm)
29We calculate these mean values by using all observations between and including the respondent’s startyear and end year.
30We also set our (country-level) control values to their mean values of the duration of a respondent’stenure in his or her public sector position to account for potential confounds over the full period of treatment.By way of illustration, consider the possibility that GDP per capita increased sharply between a respondent’sstart year and end year. We know that GDP per capita negatively correlates with World Bank policyinfluence, so if our control variable does not capture the fact that GDP per capita increased between therespondent’s start year and end year, we will have omitted a potentially important confound. The twoprincipal disadvantages of this approach are endogeneity and measurement error (if respondent assessmentsof the World Bank’s policy influence are based on actions taken by the World Bank early in their tenurewhile the measurements of the treatments and controls take into account data from later years).
31Respondents were allowed to select from one of six response options: once a year or less, 2 or 3 times ayear, about once a month, 2 or 3 times a month, about once a week, or daily.
32Respondents were asked to indicate if they thought that their governments pursued “too much reform,”
24

as a proxy for the willingness of respondents to engage in policy dialogue with the World
Bank. We also use the product of (freq comm) and (demand reform advice) as a more direct
measure of the respondent’s demand for reform advice from the World Bank. Tables A6 and
A7 demonstrate that our core finding related to the effect of World Bank ESW is robust to
the inclusion of these additional control variables.
Third, we consider the possibility that our results are biased by a selection effect. Par-
ticipants in the 2014 Reform Efforts Survey first identified the bilateral and multilateral
development institutions with whom they directly engaged during their period of public ser-
vice, and then evaluated the policy influence of only these institutions. We therefore only
observe responses about the level of the World Bank’s policy influence from those survey
participants who worked directly with the World Bank, which implies that our results could
be driven by self-selection bias (if respondents who are more inclined to work with the World
Bank are also more inclined to assess its policy influence favorably). The Heckman model
accounts for self-selection bias—i.e., the presence of potential confounders that may have
affected the propensity of participants to interact with the World Bank (Heckman 1979). In
the first (selection) stage of the analysis, we estimate a Probit model (using the full sample)
to explain the probability of respondent participation in the outcome stage. Then, in the
second (outcome) stage of the analysis, we estimate a standard linear OLS model to predict
the World Bank’s level of agenda-setting influence. To employ the Heckman model, a vari-
able should be identified that only affects respondents’ propensity to interact with the World
Bank (included in the selection stage) and does not affect their evaluation of the influence of
the World Bank (excluded from the outcome stage) (Sartori 2003). For this purpose, we use
a variable that measures the number of bilateral and multilateral development institutions
with whom a participant interacted during his or her period of public service (number org).
This variable captures the general propensity of survey respondents to interact with aid
agencies and development banks, including the World Bank, but we do not have any strong
“too little reform,” or “about the right amount” within their respective areas of policy expertise and betweentheir start dates and end dates in specific public sector positions.
25

theoretical reasons to believe that it will independently affect how participants evaluate the
World Bank. Indeed, as the selection stage in Table A8 demonstrates, number org is highly
significant and positively correlated with the selection variable. The results of the outcome
stage also show that our key finding—the positive relationship between the provision of
ESW and the World Bank’s level of agenda-setting influence—is robust to this correction
for self-selection bias.
Fourth, we conduct a placebo test using the average agenda-setting influence evaluations
of three other donors—the European Union, the United Nations Development Program, and
United States Agency for International Development—for respondents who evaluated those
donors and the World Bank. We find no relationship between the World Bank’s provision
of ESW and the reported policy influence of these donors (see Table A9).
Fifth, we take advantage of another unique feature of the 2014 Reform Efforts Survey : the
fact that those respondents who indicated familiarity with one or more of the World Bank’s
core ESW products were asked to independently evaluate the agenda-setting influence of
those particular analytical and advisory products (as opposed to the World Bank’s policy
influence on the whole).33 Table A10 demonstrates that our main findings are insensitive to
the use of this alternative dependent variable.
33The World Bank’s core ESW products include Country Economic Memoranda (CEMs), DevelopmentPolicy Reviews (DPRs), Country Financial Accountability Assessments (CFAs), Country Procurement As-sessment Reviews (CPARs), Poverty Assessments (PAs), and Public Expenditure Reviews (PERs). Partici-pants in the 2014 Reform Efforts Survey evaluated four of these ESW products (CEMs, DPRs, CFAs, andPA), so we use only these data. Since this outcome variable is measured at the respondent level, we averageacross the set of core ESW diagnostic products that a respondent evaluated.
26

Concluding Remarks
This study provides evidence that the analytical and advisory products of the World
Bank are effective at influencing the design, direction, and implementation of government
policy. By contrast, we do no find robust evidence that the World Bank’s development policy
lending or investment lending services consistently influence government policy in low-income
and middle-income countries. These results have significant policy implications. For every
dollar that that the World Bank spends on non-lending services (or analytical and advisory
products), it spends approximately $150 dollars on lending services.34 Therefore, if a central
goal of the World Bank is to influence government policy in its client countries, our results
imply that it can achieve better value-for-money through its provision of ESW products.
Our study also highlights the value of collecting granular data on (a) the nature, timing,
and distribution of analysis and advice from aid agencies and development banks, and (b) the
direction, design, and implementation of policies in low-income and middle-income countries.
In the absence of treatment and outcome variables with significant variation across countries,
policy areas, and time, it would not have been possible to benchmark the policy influence
effects of the World Bank’s lending and non-lending services. Our study therefore calls
attention to a broader lesson: relatively inexpensive investments in the collection of data
can help international development organizations that aspire to influence government policy
measure the effectiveness of the instruments that they create for this express purpose.35
34This is a lower-bound estimate based on the conservative assumption that the World Bank allocates$30 billion a year to lending services and $200 million a year to non-lending services.
35It cost approximately $500,000 to design and implement the 2014 Reform Efforts Survey. The Devel-opment Research Group of the World Bank contributed $113,000 to this effort.
27

References
Abiad, A., and A. Mody. 2005. Financial reform: What shakes it? What shapes it?
American Economic Review 95(1): 6688.
Acemoglu, D., and J.A. Robinson. 2000. Political losers as a barrier to economic develop-
ment. American Economic Review 90: 126130.
Alesina, A., and A. Drazen. 1991. Why are stabilizations delayed? American Economic
Review 81(5): 11701188.
Andrews, Matthew. 2013. The limits of institutional reform in development: changing rules
for realistic solutions. Cambridge: Cambridge University Press.
Arezki, Rabah, Marc Quintyn, and Frederik Toscani. 2012. Structural Reforms, IMF Pro-
grams, and Capacity Building: An Empirical Investigation. IMF Working Paper 12/232.
Washington DC: International Monetary Fund.
Baker, Peter. 2019. Trump to Nominate David Malpass to Lead the World Bank. 4 February
2019. New York Times.
Bazbauers, Adrian Robert. 2019. World Bank technical assistance: Locating and cultivating
sympathetic interlocutors. Development Policy Review 37 (5): 638-656.
Basri, Muhamad Chatib and Hatta Rajasa. 2013. Letter of Development Policy to Mr. Jim
Yong Kim. 30 September 2013.
Besley, T., and T. Persson. 2011. Pillars of Prosperity. Princeton: Princeton University
Press
Besley, Timothy. 2015. Law, regulation, and the business climate: The nature and influence
of the World Bank doing business project. Journal of Economic Perspectives 29(3): 99120.
Borges Sugiyama, Natasha. 2011. The Diffusion of Conditional Cash Transfer Programs in
the Americas. Global Social Policy 11(23): 25078.
28

Boughton, James M. and Alex Mourmouras. 2004. “Whose Programme Is It? Policy
Ownership and Conditional Lending” in The IMF and Its Critics: Reform of Global Financial
Architecture, edited by D. Vines & C. L. Gilbert. New York: Cambridge University Press.
Brooks, Sarah M. 2007. When Does Diffusion Matter? Explaining the Spread of Structural
Pension Reforms Across Nations. The Journal of Politics 69 (3): 701-715.
Brooks, Sarah M. 2015. Social Protection for the Poorest: The Adoption of Conditional
Cash Transfers in the Global South. Politics & Society 43 (3) 551-582.
Buntaine, Mark T., Bradley C. Parks and Benjamin P. Buch. 2017. Aiming at the wrong
targets: the domestic consequences of international efforts to build institutions. International
Studies Quarterly 61(2): 471488.
Callaghy, Tom. 1984. Africa’s Debt Crisis. Journal of International Affairs 38(1): 6373.
Carnegie, Allison and Cyrus Samii. 2019. International Institutions and Political Liberal-
ization: Evidence from the World Bank Loans Program. British Journal of Political Science
49 (4): 1357- 1379.
Corrales, Javier. 2006. “Political Obstacles to Expanding and Improving Schooling in De-
veloping Countries.” In Global Educational Expansion: Historical Legacies and Political
Obstacles, edited by Aaron Benavot, Julia Resnik and Javier Corrales. Cambridge, MA:
Academy of Arts and Sciences. Pp. 91-148.
Chwieroth, Jeffrey M. 2007. Neoliberal Economists and Capital Account Liberalization in
Emerging Markets. International Organization 61 (2): 443-463.
Chwieroth, Jeffrey M. 2009. Capital Ideas: The IMF and the Rise of Financial Liberalization.
Princeton: Princeton University Press.
Chwieroth, Jeff. 2010. “Shrinking the State: Neoliberal Economists and Social Spending in
Latin America,” in Constructing the International Economy. Rawi. Abdelal, Mark Blyth,
and Craig Parsons (Eds) Ithaca, NY: Cornell University Press. pp. 23-46.
29

Chwieroth, Jeffrey. 2012. “The silent revolution”: how the staff exercise informal governance
over IMF lending. Review of International Organizations 8 (2): 265-290.
Collier, Paul. 1997. “The Failure of Conditionality. In Perspectives on Aid and Development.
Edited by C. Gwin and J. Nelson. Washington, DC: Overseas Development Council.
Custer, Samantha, Zachary Rice, Takaaki Masaki, Rebecca Latourell, and Bradley Parks.
2015. Listening to Leaders: Which Development Partners Do They Prefer and Why?
Williamsburg, VA: AidData.
Deininger, Klaus, Lyn Squire, and Swati Basu. 1998. Does Economic Analysis Improve the
Quality of Foreign Assistance? World Bank Economic Review 12(3): 385-418.
Dollar, David and Lant Pritchett. 1998. Assessing Aid: What Works, What Doesnt and
Why. Oxford: Oxford University Press.
Dollar, David and Jakob Svensson. 2000. What Explains the Success or Failure of Structural
Adjustment Programmes? The Economic Journal 110 (466): 894-917.
Doshi, Rush, Judith G. Kelley and Beth A. Simmons. 2019. The Power of Ranking: The Ease
of Doing Business Indicator and Global Regulatory Behavior. International Organization 73
(3): 611-643.
Edwards, Sebastian. 1997. Trade Liberalization Reforms and the World Bank. American
Economic Association Papers and Proceedings 43-48.
Glennie, Jonathan, and Andy Sumner. 2014. The $138.5 Billion Question: When Does
Foreign Aid Work (and When Doesnt It)? Center for Global Development Policy Paper 049.
Easterly, William. 2005. What Did Structural Adjustment Adjust? The Association of
Policies and Growth with Repeated IMF and World Bank Adjustment Loans. Journal of
Development Economics 76: 1-22.
Easterly, William. 2006. The White Mans Burden: Why the Wests Efforts to Aid the Rest
Have done So Much Ill and So Little Good. New York: Penguin Press.
30
Fardoust, S. and A. E. Flanagan. 2011. Quality of Knowledge and Quality Financial As-
sistance: A Quantitative Assessment in the Case of the World Bank. Washington, DC:
Development Economics. Mimeo. Washington DC: World Bank.
Fernandez, Raquel and Dani Rodrik. 1991. Resistance to Reform: Status Quo Bias in the
Presence of Individual-Specific Uncertainty. American Economic Review 81(5): 1146-1155.
Fiszbein, Ariel, and Norbert Schady. 2009. Conditional Cash Transfers: Reducing Present
and Future Poverty. A World Bank Policy Research Report. With Francisco H. G. Ferreira,
et al. Washington, DC: World Bank.
Gavin, Michael, and Dani Rodrik. 1995. The World Bank in Historical Perspective. Amer-
ican Economic Review 85(2): 32934.
Gilbert, Christopher, Andrew Powell, and David Vines. 1999. Positioning the World Bank.
Economic Journal 109(459): 598633.
Giordano, R., and P. Pagano. 2017. Does the World Bank Foster Business? World Bank
Policy Research Working Paper No. 8047. Washington DC: World Bank.
Girod, D. M. and Tobin, J. 2016. Take the money and run: The determinants of compliance
with aid agreements. International Organization 70(1): 209239.
Grindle, Merilee. 2004. Despite the Odds: The Contentious Politics of Education Reform.
Princeton, NJ: Princeton University Press.
Handa, Sudhanshu, and Benjamin Davis. 2006. The Experience of Conditional Cash Trans-
fers in Latin America and the Caribbean. Development Policy Review 24(5): 51336
Harrigan, Jane and Hamed El-Said. 2006. The IMF and the World Bank in Jordan: A Case
of Over-Optimism. The Review of International Organizations 1 (3): 263-292.
Heckman, James J. 1979. Sample selection bias as a specification error. Econometrica 47(1):
153-61.
Helmke, Gretchen and Elena V. McLean. 2014. Inducing Independence: A strategic model
31

of World Bank assistance and legal reform. Conflict Management and Peace Science 31(4):
383-405.
Hoffmann-Lange, U. 2007. Methods of elite research. In Oxford Handbook of Political Be-
havior, edited by R. J. Dalton and H.-D. Klingemann. Oxford: Oxford University Press.
pp. 910927
Hunter, W. and D. S. Brown. 2000. World Bank directives, domestic interests, and the
politics of human capital investment in Latin America. Comparative Political Studies 33
(1): 113-143.
Independent Evaluation Group (IEG). 2007. Development Results in Middle-Income Coun-
tries: An Evaluation of the World Banks Support. Washington DC: World Bank.
Independent Evaluation Group (IEG). 2008a. Public Sector Reform: What Works and Why?
An IEG Evaluation of World Bank Support. Washington, DC: World Bank.
Independent Evaluation Group (IEG). 2008b. Using Knowledge to Improve Development
Effectiveness: An Evaluation of World Bank Economic and Sector Work and Technical
Assistance, 20002006. Washington, DC: World Bank.
IOB. 2012. Budget Support: Conditional Results. Review of an Instrument (2000-2011).
IOB Evaluation No. 369. Policy and Operations Evaluation Department (IOB). Netherlands:
Ministry of Foreign Affairs.
Fayad, Ghada Chengyu Huang, Yoko Shibuya, and Peng Zhao. 2020. How Do Member
Countries’ Receive IMF Policy Advice: Results from a State-of- the-art Sentiment Index.
IMF Working Paper WP/20/7. Washington DC: IMF.
Jacoby, Wade. 2006. Inspiration, coalition, and substitution: External influences on post-
communist transformations. World Politics 58(4): 623651.
Kahler, Miles. 1992. “External Influence, Conditionality, and the Politics of Adjustment. in
The Politics of Economic Adjustment, edited by Stephan Haggard and Robert R. Kaufman.
Princeton, NJ: Princeton University Press. Pp. 89-133.
32

Kapstein, Ethan B. and Nathan Converse. 2008. The Fate of Young Democracies. Cam-
bridge, UK: Cambridge University Press.
Kelley, Judith G. and Beth A. Simmons. 2019. Introduction: The Power of Global Perfor-
mance Indicators. International Organization 73 (3): 491-510.
Kilby, Christopher. 2009. The Political Economy of Conditionality: An Empirical Analysis
of World Bank Loan Disbursements. Journal of Development Economics 89 (1): 51-61.
Koeberle, S, Stavreski, Z, and Walliser, J., eds. 2006. Budget Support as More Effective
Aid? Recent Experiences and Emerging Lessons. Washington, DC: The World Bank.
Kogut, B., and J. M. Macpherson. 2011. The Mobility of Economists and the Diffusion
of Policy Ideas: The Influence of Economics on National Policies. Research Policy 40:
13071320.
Kremer, Michael and Michael Clemens. 2016. The New Role for the World Bank. Journal
of Economic Perspectives 30 (1): 5376.
Loayza, N., J. Rigolini, and G. Llorente, G. 2012. Do middle classes bring institutional
reforms? World Bank Policy Research Working Paper 6015. Washington DC: World Bank.
Lombardi, D., and N. Woods. 2008. The politics of influence: An analysis of IMF surveil-
lance. Review of International Political Economy 15(5): 709737.
Malesa, Thaddeus and Peter Silarszky. 2005. “Does World Bank Effort Matter for Success
of Adjustment Operations? In Conditionality Revisited: Concepts, Experiences, and Lessons,
edited by Stefan Koeberle, Harold Bedoya, Peter Silarsky, and Gero Verheyen. Washington,
DC: The World Bank.
Masaki, Takaaki and Bradley Parks. 2019. When Do Performance Assessments Influence
Policy Behavior? Micro-Evidence from the 2014 Reform Efforts Survey. The Review of
International Organizations [forthcoming]
Masaki, Takaaki, Bradley Parks, Jorg Faust, Stefan Leiderer, and Matthew DiLorenzo. 2020.
33
Aid Management, Trust, and Development Policy Influence: New Evidence from a Survey
of Public Sector Officials in Low-Income and Middle-Income Countries. Mimeo.
Meseguer, Covadonga. 2006. Learning and economic policy choices. European Journal of
Political Economy 22 (1): 156-178.
Moll, P., and L. Smets. 2018. Is It the Journey That Matters? A Fresh Look at the Impact
of World Bank Policy Lending. World Bank Policy Research Working Paper No. 8645.
Washington, DC: World Bank.
Momani, Bessma. 2005. Recruiting and Diversifying IMF Technocrats. Global Society 19(2):
167-187.
Mosley, Paul, Jane Harrigan, and John Toye. 1995. Aid and Power: the World Bank and
Policy Based Lending, Vol. 1. New York: Routledge.
Nelson, Stephen. 2014. Playing Favorites: How Shared Beliefs Shape the IMFs Lending
Decisions. International Organization 68 (2): 297-328.
Parks, Bradley C., Zachary Rice, and Samantha Custer. 2015. The Marketplace of Ideas
for Policy Change: Who do developing world leaders listen to and why? Williamsburg, VA:
AidData at William Mary.
Parks, Bradley and Caroline Davis. 2019. When do governments trade domestic reforms for
external rewards? Explaining policy responses to the Millennium Challenge Corporation’s
eligibility standards. Governance 32 (2): 349-367.
Pop-Eleches, Grigore. 2009. From Economic Crisis to Reform: IMF Programs in Latin
American and Eastern Europe. Princeton, NJ; Princeton University Press.
Rajan, R. 2004. Why are structural reforms so difficult? Finance and Development 41(2):
5657
Ravallion, Martin. 2013. Knowledgeable bankers? The demand for research in World Bank
operations. Journal of Development Effectiveness 5 (1): 1-29.
34

Ravid,Barak. 2007. Salam Fayyad: Everyones favorite Palestinian. Haaretz. April 1,2007.
Remmer, Karen. 1998. The Politics of Neoliberal Economic Reform in South America,
1980-1994. Studies in Comparative International Development 33(2): 3-29.
Robinson, Mark. 2007. The Politics of Successful Governance Reforms: Lessons of Design
and Implementation. Commonwealth and Comparative Politics 45 (4): 521-548.
Saavedra, Pablo, Patricia Geli, and Peter Moll. 2015. Correlates of success in World Bank
development policy lending. World Bank Policy Research Working Paper Series.
Samuel, Boris. 2014. Economic Calculations, Instability and (In)formalization of the State
in Mauritania, 2003-2011. Canadian Journal of Development Studies 31 (1): 7796.
Sartori, Anne E. 2003, An estimator for some binary-outcome selection models without
exclusion restrictions. Political Analysi, 11(2): 111-138.
Schelling, Thomas C. 1960. The Strategy of Conflict. Cambridge, MA: Harvard University
Press
Smets, Lodewijk. 2020. Supporting Policy Reform from the Outside. The World Bank
Research Observer 35 (1): 1943.
Smets, Lodewijk, Stephen Knack, and Nadia Molenaers. 2013. Political Ideology, Quality
at Entry and the Success of Economic Reform Programs. The Review of International
Organizations 8: 447-476.
Smets, Lodewijk and Stephen Knack. 2016. World Bank Lending and the Quality of Eco-
nomic Policy. The Journal of Development Studies 52 (1): 72-91.
Smets, Lodewijk and Stephen Knack. 2018. World Bank Policy Lending and the Quality of
Public Sector Governance. Economic Development and Cultural Change 67 (1): 29-54.
Tama, Jordan. 2013. Crises, commissions, and reform: the impact of blue-ribbon panels.
Political Research Quarterly 67(1):152-164.
35

Tansey, O. 2007. Process tracing and elite interviewing: A case for non-probability sampling.
PS: Political Science and Politics 40(4): 765772.
Thrall, Nathan. 2010. Our Man in Palestine. The New York Review of Books.
USAID. 2015. Vision for Ending Extreme Poverty. Washington DC: USAID. Vreeland,
James Raymond. 2003. The IMF and Economic Development. Cambridge, UK: Cambridge
University Press.
Wane, Waly. 2004. The Quality of Foreign Aid Country Selectivity or Donors Incentives?
World Bank Policy Research Working Paper 3325. Washington DC: World Bank.
Weyland Kurt. 2006. Bounded Rationality and Policy Diffusion: Social Sector Reform in
Latin America. Princeton, NJ: Princeton University Press.
Weymouth, Stephen and J. Muir Macpherson. 2012. The Social Construction of Policy
Reform: Economists and Trade Liberalization around the World. International Interactions
38 (5): 670-702.
Wolfensohn, James. 2008. Letter to the Meltzer Commission. 28 February 2000. Woods,
Ngaire. 2006. The Globalisers: The IMF, The World Bank, and Their Borrowers. Ithaca,
NY: Cornell University Press.
World Bank. 2004. Annual Review of Development Effectiveness 2003: The Effectiveness of
Bank Support for Policy Reform. Washington, DC: World Bank.
World Bank. 2006. The World Bank’s Economic and Sector Work and Technical Assistance:
An Independent Evaluation Group (IEG) Review. Approach Paper. November 16, 2006.
Washington DC: World Bank.
World Bank. 2007. Catalyzing the Future: An Inclusive and Sustainable Globalization. An-
nual Meeting Remarks by Robert B. Zoellick. 10 October 2007. Accessed at https://www.
worldbank.org/en/news/speech/2007/10/10/an-inclusive-sustainable-globalization
World Bank. 2012. Public Financial Management Reforms in Post-Conflict Countries:
36

Synthesis Report. Washington DC: World Bank.
World Bank. 2013a. Financing for Development Post-2015. Washington DC: World Bank.
World Bank. 2013b. Program Document for a Proposed Second Institutional Strengthen-
ing for Social Inclusion (Second Institutional, Tax Administration, Social, and Investment)
Development Policy Loan in the Amount of US$400 Million. Washington DC: World Bank.
37

Supplementary Information for “How Does the World
Bank Influence the Development Policy Priorities of
Low-Income and Lower-Middle Income Countries?”
Contents
Appendix A Supplementary tables 2
Appendix B Description of the Sampling Frame Construction and the Ap-
plication of Inverse-Probability Weights 13
1
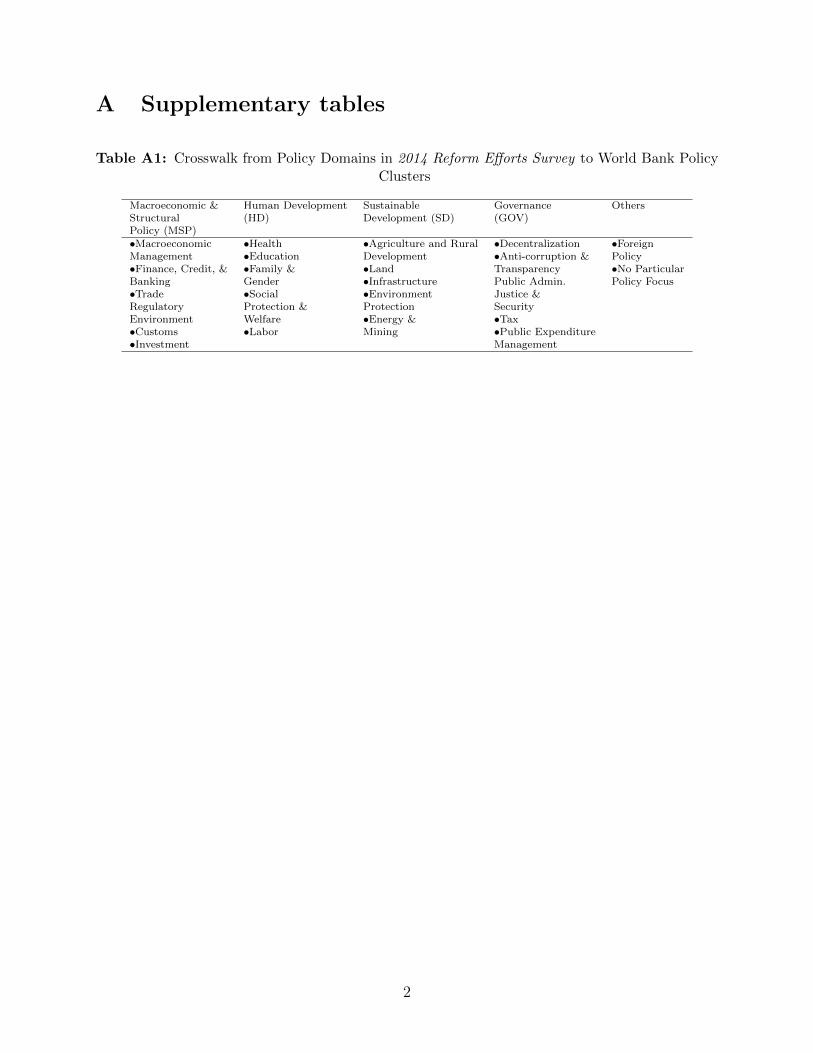
A Supplementary tables
Table A1: Crosswalk from Policy Domains in 2014 Reform Efforts Survey to World Bank PolicyClusters
Macroeconomic & Human Development Sustainable Governance OthersStructural (HD) Development (SD) (GOV)Policy (MSP)•Macroeconomic •Health •Agriculture and Rural •Decentralization •ForeignManagement •Education Development •Anti-corruption & Policy•Finance, Credit, & •Family & •Land Transparency •No ParticularBanking Gender •Infrastructure Public Admin. Policy Focus•Trade •Social •Environment Justice &Regulatory Protection & Protection SecurityEnvironment Welfare •Energy & •Tax•Customs •Labor Mining •Public Expenditure•Investment Management
2

Table A2: Variable Descriptions
Variable Name Variable Description N Mean Std.dev Min Max
Outcome variables
Influence Respondent evaluation of the WB’s agenda-setting influence 1244 3.5 1.33 0.0 5.0
Influence2 Respondent evaluation of the WB’s policy design influence 1193 3.4 1.36 0.0 5.0
Helpfulness Respondent evaluation of the WB’s helpfulness during policy implementation 1099 3.7 1.09 0.0 5.0
Treatment variables
lnaid dpl disb pc 0 m 1p Development policy loan (DPL) disbursements per capita (ln) 2314 -1.1 3.23 -5.4 4.2
lnaid inv disb pc 0 m 1p Investment loan disbursements per capita (ln) 2402 -0.3 5.74 -18.7 3.7
n esw m 1p Number of economic and sector work (ESW) products 2612 0.7 1.01 0.0 12.0
dpl proj n m 1p Number of development policy loans (DPLs) 2612 0.3 0.46 0.0 2.5
pa m 1p Number of policy and institutional actions (prior actions) 2612 1.2 2.55 0.0 23.5
Country-level control variables
lngdp pc 1st GDP per capita (ln) 2478 7.3 0.99 5.4 9.8
lngdp pc 1st 2 GDP per capita (squared and ln) 2478 54.5 14.59 28.8 96.1
lnpop 1st Population (ln) 2506 16.1 1.81 9.2 21.0
aid gni 1st Net ODA as percent of GNI 2445 11.3 21.08 -0.2 192.0
polity2 1st Political regime type 2211 3.7 5.05 -10.0 10.0
left 1st Dummy for left-wing government 2245 0.3 0.44 0.0 1.0
3
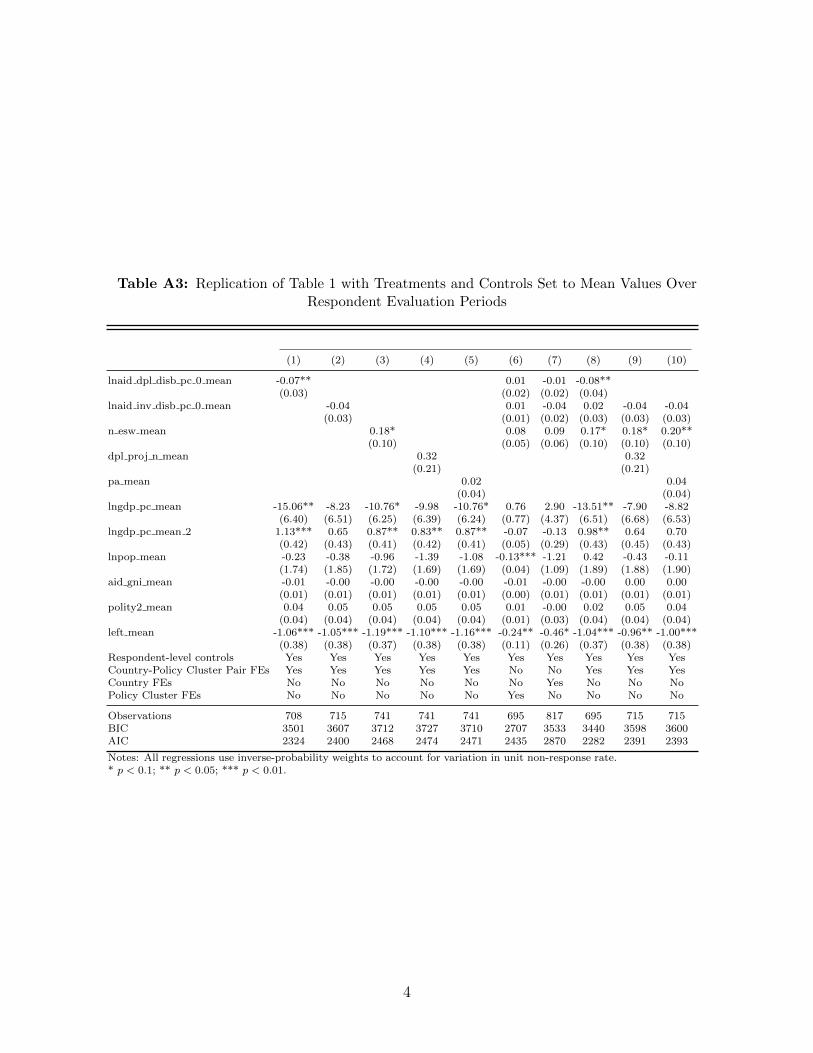
Table A3: Replication of Table 1 with Treatments and Controls Set to Mean Values OverRespondent Evaluation Periods
(1) (2) (3) (4) (5) (6) (7) (8) (9) (10)
lnaid dpl disb pc 0 mean -0.07** 0.01 -0.01 -0.08**(0.03) (0.02) (0.02) (0.04)
lnaid inv disb pc 0 mean -0.04 0.01 -0.04 0.02 -0.04 -0.04(0.03) (0.01) (0.02) (0.03) (0.03) (0.03)
n esw mean 0.18* 0.08 0.09 0.17* 0.18* 0.20**(0.10) (0.05) (0.06) (0.10) (0.10) (0.10)
dpl proj n mean 0.32 0.32(0.21) (0.21)
pa mean 0.02 0.04(0.04) (0.04)
lngdp pc mean -15.06** -8.23 -10.76* -9.98 -10.76* 0.76 2.90 -13.51** -7.90 -8.82(6.40) (6.51) (6.25) (6.39) (6.24) (0.77) (4.37) (6.51) (6.68) (6.53)
lngdp pc mean 2 1.13*** 0.65 0.87** 0.83** 0.87** -0.07 -0.13 0.98** 0.64 0.70(0.42) (0.43) (0.41) (0.42) (0.41) (0.05) (0.29) (0.43) (0.45) (0.43)
lnpop mean -0.23 -0.38 -0.96 -1.39 -1.08 -0.13*** -1.21 0.42 -0.43 -0.11(1.74) (1.85) (1.72) (1.69) (1.69) (0.04) (1.09) (1.89) (1.88) (1.90)
aid gni mean -0.01 -0.00 -0.00 -0.00 -0.00 -0.01 -0.00 -0.00 0.00 0.00(0.01) (0.01) (0.01) (0.01) (0.01) (0.00) (0.01) (0.01) (0.01) (0.01)
polity2 mean 0.04 0.05 0.05 0.05 0.05 0.01 -0.00 0.02 0.05 0.04(0.04) (0.04) (0.04) (0.04) (0.04) (0.01) (0.03) (0.04) (0.04) (0.04)
left mean -1.06*** -1.05*** -1.19*** -1.10*** -1.16*** -0.24** -0.46* -1.04*** -0.96** -1.00***(0.38) (0.38) (0.37) (0.38) (0.38) (0.11) (0.26) (0.37) (0.38) (0.38)
Respondent-level controls Yes Yes Yes Yes Yes Yes Yes Yes Yes YesCountry-Policy Cluster Pair FEs Yes Yes Yes Yes Yes No No Yes Yes YesCountry FEs No No No No No No Yes No No NoPolicy Cluster FEs No No No No No Yes No No No No
Observations 708 715 741 741 741 695 817 695 715 715BIC 3501 3607 3712 3727 3710 2707 3533 3440 3598 3600AIC 2324 2400 2468 2474 2471 2435 2870 2282 2391 2393
Notes: All regressions use inverse-probability weights to account for variation in unit non-response rate.* p < 0.1; ** p < 0.05; *** p < 0.01.
4

Table A4: Replication of Table 2 with Treatments and Controls Set to Mean Values OverRespondent Evaluation Periods
(1) (2) (3) (4) (5) (6) (7) (8) (9) (10)
lnaid dpl disb pc 0 mean -0.01 0.02 -0.02 -0.03(0.04) (0.02) (0.02) (0.04)
lnaid inv disb pc 0 mean 0.09*** 0.01 0.00 0.11*** 0.08*** 0.08***(0.03) (0.01) (0.03) (0.03) (0.03) (0.03)
n esw mean 0.13 0.08 0.14** 0.14 0.13 0.15(0.11) (0.05) (0.06) (0.11) (0.11) (0.11)
dpl proj n mean 0.27 0.23(0.20) (0.21)
pa mean 0.02 0.02(0.04) (0.04)
lngdp pc mean -12.93 -10.52 -12.60 -12.22 -13.02 1.05 0.77 -12.41 -9.70 -10.36(8.26) (8.91) (8.20) (8.37) (8.20) (0.81) (5.06) (8.75) (8.97) (8.80)
lngdp pc mean 2 0.92* 0.71 0.90 0.88 0.93* -0.09* -0.04 0.83 0.67 0.71(0.55) (0.59) (0.55) (0.56) (0.54) (0.06) (0.33) (0.58) (0.60) (0.59)
lnpop mean -2.14 -2.25 -2.18 -2.49 -2.22 -0.14*** -1.66 -1.73 -2.35 -2.11(1.95) (2.12) (1.95) (1.93) (1.94) (0.04) (1.16) (2.09) (2.13) (2.14)
aid gni mean -0.00 0.00 0.00 0.00 0.00 -0.00 0.00 0.00 0.00 0.00(0.01) (0.01) (0.01) (0.01) (0.01) (0.00) (0.00) (0.01) (0.01) (0.01)
polity2 mean -0.02 -0.03 -0.02 -0.02 -0.02 -0.00 -0.04 -0.04 -0.04 -0.04(0.04) (0.04) (0.04) (0.04) (0.04) (0.01) (0.04) (0.04) (0.04) (0.04)
left mean -0.36 -0.35 -0.53 -0.44 -0.49 -0.09 -0.19 -0.35 -0.27 -0.31(0.37) (0.38) (0.37) (0.38) (0.38) (0.10) (0.26) (0.37) (0.38) (0.38)
Respondent-level controls Yes Yes Yes Yes Yes Yes Yes Yes Yes YesCountry-Policy Cluster Pair FEs Yes Yes Yes Yes Yes No No Yes Yes YesCountry FEs No No No No No No Yes No No NoPolicy Cluster FEs No No No No No Yes No No No No
Observations 689 695 721 721 721 676 796 676 695 695BIC 3426 3468 3616 3623 3631 2684 3454 3368 3476 3470AIC 2279 2309 2407 2409 2413 2418 2794 2230 2308 2307
Notes: All regressions use inverse-probability weights to account for variation in unit non-response rate.* p < 0.1; ** p < 0.05; *** p < 0.01.
5

Table A5: Replication of Table 3 with Treatments and Controls Set to Mean Values OverRespondent Evaluation Periods
(1) (2) (3) (4) (5) (6) (7) (8) (9) (10)
lnaid dpl disb pc 0 mean -0.01 0.02 -0.02 -0.03(0.04) (0.02) (0.03) (0.04)
lnaid inv disb pc 0 mean -0.01 0.02* 0.01 0.01 -0.01 -0.01(0.03) (0.01) (0.03) (0.03) (0.03) (0.03)
n esw mean 0.17* -0.01 0.02 0.13 0.12 0.14(0.10) (0.05) (0.05) (0.10) (0.10) (0.10)
dpl proj n mean 0.42** 0.35*(0.20) (0.21)
pa mean 0.07** 0.07*(0.04) (0.04)
lngdp pc mean -2.20 -1.69 -1.34 0.52 -0.67 0.21 -2.11 -3.46 -0.52 -1.56(5.38) (5.39) (5.42) (5.47) (5.27) (0.77) (3.88) (5.70) (5.75) (5.56)
lngdp pc mean 2 0.22 0.22 0.15 0.06 0.13 -0.03 0.27 0.33 0.15 0.22(0.37) (0.37) (0.37) (0.38) (0.36) (0.05) (0.26) (0.39) (0.40) (0.38)
lnpop mean 2.39 0.93 2.67 1.73 2.15 -0.07 -2.35** 1.42 0.77 1.14(1.84) (1.74) (1.85) (1.85) (1.84) (0.04) (1.12) (1.78) (1.77) (1.74)
aid gni mean 0.02 0.01 0.02 0.02 0.02 -0.00 -0.00 0.01 0.02 0.01(0.01) (0.01) (0.01) (0.01) (0.01) (0.00) (0.01) (0.01) (0.01) (0.01)
polity2 mean 0.08 0.09 0.08 0.09* 0.09 -0.00 0.02 0.07 0.08 0.08(0.05) (0.06) (0.05) (0.05) (0.05) (0.01) (0.04) (0.05) (0.05) (0.05)
left mean -1.02** -0.94** -1.07** -0.91** -0.92** -0.05 -0.22 -0.99** -0.91** -0.92**(0.42) (0.42) (0.42) (0.43) (0.43) (0.12) (0.25) (0.42) (0.42) (0.43)
Respondent-level controls Yes Yes Yes Yes Yes Yes Yes Yes Yes YesCountry-Policy Cluster Pair FEs Yes Yes Yes Yes Yes No No Yes Yes YesCountry FEs No No No No No No Yes No No NoPolicy Cluster FEs No No No No No Yes No No No No
Observations 656 659 679 679 679 645 760 645 659 659BIC 3086 3060 3192 3171 3158 2389 3135 3028 3074 3054AIC 1995 1977 2053 2045 2042 2126 2500 1947 1978 1971
Notes: All regressions use inverse-probability weights to account for variation in unit non-response rate.* p < 0.1; ** p < 0.05; *** p < 0.01.
6

Table A6: Models that Control for Respondent Willingness to Engage in Policy Dialogue withWorld Bank
(1) (2) (3) (4) (5) (6) (7) (8) (9) (10)
lnaid dpl disb pc 0 m 1p -0.06** -0.01 -0.03 -0.06**(0.03) (0.02) (0.02) (0.03)
lnaid inv disb pc 0 m 1p 0.01 0.02 -0.11*** -0.07 -0.01 -0.00(0.04) (0.01) (0.04) (0.04) (0.04) (0.04)
n esw m 1p 0.21** 0.08 0.06 0.22** 0.21** 0.23***(0.09) (0.05) (0.06) (0.09) (0.09) (0.09)
dpl proj n m 1p 0.30 0.30(0.18) (0.18)
pa m 1p 0.01 0.02(0.03) (0.03)
lngdp pc 1st -13.98** -11.76** -11.58** -11.11* -11.23** 0.75 0.17 -16.25*** -12.51** -12.87**(5.89) (5.92) (5.72) (5.81) (5.72) (0.79) (4.05) (6.00) (6.05) (6.00)
lngdp pc 1st 2 1.04*** 0.89** 0.91** 0.87** 0.88** -0.07 0.04 1.18*** 0.95** 0.97**(0.38) (0.38) (0.37) (0.38) (0.37) (0.05) (0.27) (0.39) (0.40) (0.39)
lnpop 1st 0.29 -0.09 -0.01 -0.61 -0.36 -0.14*** -0.77 1.34 0.22 0.50(1.61) (1.70) (1.62) (1.60) (1.59) (0.04) (1.03) (1.76) (1.77) (1.76)
aid gni 1st -0.01 -0.01 -0.01 -0.01 -0.01 -0.00 -0.00 -0.01 -0.01 -0.01(0.01) (0.01) (0.01) (0.01) (0.01) (0.00) (0.00) (0.01) (0.01) (0.01)
polity2 1st -0.01 -0.00 -0.01 -0.00 0.00 0.01 -0.02 -0.02 -0.02 -0.02(0.04) (0.04) (0.04) (0.04) (0.04) (0.01) (0.03) (0.04) (0.04) (0.04)
left 1st -0.59* -0.54 -0.67** -0.56* -0.65** -0.17 -0.17 -0.56 -0.43 -0.49(0.33) (0.33) (0.33) (0.31) (0.32) (0.10) (0.22) (0.35) (0.34) (0.35)
freq comm 0.04 0.05 0.06 0.08 0.08 0.09* 0.09 0.00 0.04 0.03(0.08) (0.08) (0.08) (0.08) (0.08) (0.05) (0.06) (0.08) (0.08) (0.08)
Respondent-level controls Yes Yes Yes Yes Yes Yes Yes Yes Yes YesCountry-Policy Cluster Pair FEs Yes Yes Yes Yes Yes No No Yes Yes YesCountry FEs No No No No No No Yes No No NoPolicy Cluster FEs No No No No No Yes No No No No
Observations 683 688 715 715 715 669 784 669 688 688BIC 3408 3461 3623 3563 3586 2633 3403 3295 3447 3476AIC 2258 2304 2389 2374 2384 2358 2750 2196 2291 2302
Notes: All regressions use inverse-probability weights to account for variation in unit non-response rate.* p < 0.1; ** p < 0.05; *** p < 0.01.
7

Table A7: Models that Control for Respondent Demand for Reform Advice from World Bank
(1) (2) (3) (4) (5) (6) (7) (8) (9) (10)
lnaid dpl disb pc 0 m 1p -0.07** -0.01 -0.03 -0.07**(0.03) (0.02) (0.02) (0.03)
lnaid inv disb pc 0 m 1p 0.02 0.02 -0.10** -0.05 0.01 0.01(0.04) (0.01) (0.04) (0.04) (0.04) (0.04)
n esw m 1p 0.24*** 0.07 0.07 0.24*** 0.24*** 0.25***(0.09) (0.05) (0.06) (0.09) (0.09) (0.09)
dpl proj n m 1p 0.26 0.25(0.19) (0.19)
pa m 1p 0.00 0.02(0.03) (0.03)
lngdp pc 1st -12.58** -10.13* -10.08* -9.44 -9.39 0.77 0.64 -14.96** -11.30* -11.50*(6.02) (6.14) (5.90) (5.98) (5.88) (0.82) (4.21) (6.22) (6.27) (6.22)
lngdp pc 1st 2 0.94** 0.78** 0.80** 0.75* 0.75** -0.07 0.02 1.08*** 0.86** 0.87**(0.39) (0.40) (0.38) (0.39) (0.38) (0.06) (0.28) (0.40) (0.41) (0.40)
lnpop 1st 0.02 -0.44 -0.26 -0.94 -0.74 -0.15*** -1.02 1.18 0.04 0.27(1.62) (1.74) (1.65) (1.63) (1.61) (0.04) (1.05) (1.79) (1.81) (1.80)
aid gni 1st -0.01 -0.00 -0.00 -0.00 -0.00 -0.00 -0.00 -0.01 -0.00 -0.00(0.01) (0.01) (0.01) (0.01) (0.01) (0.00) (0.01) (0.01) (0.01) (0.01)
polity2 1st -0.01 -0.00 -0.01 -0.00 0.00 0.02* -0.03 -0.02 -0.02 -0.02(0.04) (0.04) (0.04) (0.04) (0.04) (0.01) (0.03) (0.04) (0.04) (0.04)
left 1st -0.71** -0.66** -0.71** -0.61* -0.70** -0.15 -0.16 -0.71** -0.58* -0.63*(0.33) (0.33) (0.33) (0.32) (0.32) (0.10) (0.22) (0.35) (0.34) (0.35)
demand reform advice 0.07 0.08 0.07 0.08 0.08 0.05 0.03 0.06 0.07 0.07(0.05) (0.05) (0.05) (0.05) (0.05) (0.03) (0.04) (0.05) (0.05) (0.05)
Respondent-level controls Yes Yes Yes Yes Yes Yes Yes Yes Yes YesCountry-Policy Cluster Pair FEs Yes Yes Yes Yes Yes No No Yes Yes YesCountry FEs No No No No No No Yes No No NoPolicy Cluster FEs No No No No No Yes No No No No
Observations 666 671 697 697 697 652 759 652 671 671BIC 3350 3372 3483 3472 3501 2549 3284 3214 3345 3366AIC 2194 2231 2292 2294 2305 2276 2641 2125 2213 2221
Notes: All regressions use inverse-probability weights to account for variation in unit non-response rate.* p < 0.1; ** p < 0.05; *** p < 0.01.
8

Table A8: Heckman Sample Selection Model
(1)Outcome stage Selection stage
n esw m 1p 0.18∗∗ 0.01(0.07) (0.12)
lngdp pc 1st -7.04 -8.65(4.10) (6.62)
lngdp pc 1st 2 0.59∗ 0.35(0.27) (0.43)
lnpop 1st -0.32 3.64(1.26) (1.88)
aid gni 1st -0.00 -0.01(0.01) (0.01)
polity2 1st -0.01 0.02(0.03) (0.04)
left 1st -0.45 -0.55(0.23) (0.32)
number org 0.24∗∗∗
(0.02)Country-Policy Cluster Pair FEs Yes YesRespondent-level controls Yes Yes
Observations 1164Censored 445Rho 0.02
Notes: All regressions use inverse-probability weights to account for variation in unit non-response rate. * p < 0.1; ** p < 0.05; *** p < 0.01.
9

Table A9: Placebo Tests
(1) (2) (3) (4) (5) (6) (7) (8) (9) (10)
lnaid dpl disb pc 0 m 1p -0.05 -0.00 -0.04 -0.04(0.04) (0.02) (0.03) (0.04)
lnaid inv disb pc 0 m 1p -0.17*** -0.02 -0.10*** -0.15*** -0.17*** -0.17***(0.05) (0.02) (0.03) (0.05) (0.05) (0.05)
n esw m 1p 0.01 -0.01 -0.05 0.02 0.02 0.04(0.12) (0.04) (0.06) (0.12) (0.12) (0.12)
dpl proj n m 1p 0.07 0.13(0.22) (0.23)
pa m 1p 0.03 0.04(0.04) (0.04)
lngdp pc 1st -7.88 -2.78 -4.26 -4.18 -4.33 1.00 -0.49 -6.12 -2.70 -2.87(8.38) (7.33) (7.24) (7.24) (7.14) (0.90) (5.13) (8.40) (7.30) (7.23)
lngdp pc 1st 2 0.47 0.11 0.23 0.23 0.24 -0.08 -0.01 0.34 0.11 0.12(0.57) (0.50) (0.49) (0.49) (0.49) (0.06) (0.34) (0.58) (0.50) (0.49)
lnpop 1st 0.93 0.82 0.36 0.27 0.33 -0.07* 0.76 1.24 0.74 0.91(1.77) (1.72) (1.70) (1.72) (1.69) (0.04) (1.12) (1.81) (1.77) (1.75)
aid gni 1st 0.01** 0.01** 0.01*** 0.01*** 0.01*** 0.00 0.01* 0.01** 0.01** 0.01**(0.00) (0.00) (0.00) (0.00) (0.00) (0.00) (0.00) (0.00) (0.00) (0.00)
polity2 1st 0.07 0.09 0.08 0.08 0.08 0.03** 0.06 0.09 0.09 0.09(0.06) (0.06) (0.06) (0.06) (0.06) (0.01) (0.04) (0.06) (0.06) (0.07)
left 1st -0.62 -0.61 -0.67 -0.65 -0.60 0.03 -0.16 -0.65 -0.57 -0.50(0.51) (0.51) (0.49) (0.49) (0.49) (0.11) (0.28) (0.52) (0.51) (0.52)
Respondent-level controls Yes Yes Yes Yes Yes Yes Yes Yes Yes YesCountry-Policy Cluster Pair FEs Yes Yes Yes Yes Yes No No Yes Yes YesCountry FEs No No No No No No Yes No No NoPolicy Cluster FEs No No No No No Yes No No No No
Observations 545 549 567 567 567 536 635 536 549 549BIC 2862 2610 2910 2936 2910 2313 2994 2584 2622 2614AIC 1946 1864 1995 2003 1994 2056 2383 1834 1868 1865
Notes: All regressions use inverse-probability weights to account for variation in unit non-response rate.* p < 0.1; ** p < 0.05; *** p < 0.01.
10

Table A10: Replication of Table 1 with Dependent Variable that Measures the Agenda-SettingInfluence of the World Bank’s Core ESW Diagnostic Products
(1) (2) (3) (4) (5) (6) (7) (8) (9) (10)
lnaid dpl disb pc 0 m 1p -0.05 0.02 -0.03 -0.04(0.05) (0.02) (0.03) (0.05)
lnaid inv disb pc 0 m 1p 0.02 -0.01 0.10 -0.07 0.01 0.00(0.12) (0.01) (0.08) (0.11) (0.12) (0.12)
n esw m 1p 0.23** 0.04 0.10 0.27** 0.21* 0.22**(0.11) (0.04) (0.07) (0.11) (0.11) (0.11)
dpl proj n m 1p 0.21 0.16(0.24) (0.23)
pa m 1p 0.04 0.05(0.04) (0.04)
lngdp pc 1st -0.59 3.51 -1.41 0.61 0.48 1.29 1.42 1.99 3.07 3.30(6.59) (6.09) (6.54) (6.37) (6.45) (0.88) (4.46) (6.84) (6.52) (6.67)
lngdp pc 1st 2 -0.03 -0.24 0.03 -0.10 -0.10 -0.10 -0.08 -0.13 -0.21 -0.22(0.46) (0.43) (0.45) (0.45) (0.45) (0.06) (0.30) (0.47) (0.46) (0.47)
lnpop 1st -1.19 -3.50 -0.27 -1.55 -1.53 -0.09* -2.02 -2.77 -2.74 -2.77(2.41) (2.47) (2.41) (2.36) (2.36) (0.05) (1.46) (2.57) (2.46) (2.45)
aid gni 1st -0.01 -0.01 -0.01 -0.01 -0.01 0.01** -0.01 -0.01 -0.01 -0.01(0.01) (0.01) (0.01) (0.01) (0.01) (0.00) (0.01) (0.01) (0.01) (0.01)
polity2 1st -0.03 -0.09 -0.05 -0.04 -0.04 -0.02 -0.10* -0.12* -0.11 -0.12(0.06) (0.07) (0.06) (0.06) (0.06) (0.01) (0.05) (0.07) (0.07) (0.07)
left 1st 0.06 0.29 0.19 0.22 0.25 0.03 0.24 0.23 0.35 0.42(0.48) (0.49) (0.48) (0.48) (0.47) (0.11) (0.25) (0.49) (0.49) (0.49)
Respondent-level controls Yes Yes Yes Yes Yes Yes Yes Yes Yes YesCountry-Policy Cluster Pair FEs Yes Yes Yes Yes Yes No No Yes Yes YesCountry FEs No No No No No No Yes No No NoPolicy Cluster FEs No No No No No Yes No No No No
Observations 466 469 486 486 486 456 544 456 469 469BIC 2447 2477 2593 2561 2574 1950 2616 2378 2471 2494AIC 1610 1635 1701 1695 1699 1711 2048 1554 1628 1635
Notes: All regressions use inverse-probability weights to account for variation in unit non-response rate.* p < 0.1; ** p < 0.05; *** p < 0.01.
11

Table A11: Replication of Table 1 with Exponentiated Coefficients Expressed as Odds Ratios
(1) (2) (3) (4) (5) (6) (7) (8) (9) (10)
lnaid dpl disb pc 0 m 1p 0.94** 0.99 0.97 0.94**(0.03) (0.02) (0.02) (0.03)
lnaid inv disb pc 0 m 1p 0.99 1.02 0.90*** 0.94 0.97 0.98(0.04) (0.01) (0.04) (0.04) (0.04) (0.04)
n esw m 1p 1.23** 1.08* 1.06 1.24** 1.24** 1.25***(0.10) (0.05) (0.06) (0.11) (0.10) (0.11)
dpl proj n m 1p 1.38* 1.40*(0.25) (0.26)
pa m 1p 1.01 1.03(0.03) (0.03)
lngdp pc 1st 0.00** 0.00* 0.00* 0.00* 0.00* 1.91 0.76 0.00*** 0.00* 0.00**(0.00) (0.00) (0.00) (0.00) (0.00) (1.51) (3.07) (0.00) (0.00) (0.00)
lngdp pc 1st 2 2.88*** 2.30** 2.35** 2.27** 2.29** 0.94 1.08 3.25*** 2.44** 2.49**(1.09) (0.86) (0.85) (0.84) (0.82) (0.05) (0.29) (1.26) (0.94) (0.95)
lnpop 1st 1.24 0.74 0.76 0.41 0.54 0.86*** 0.42 3.49 0.99 1.36(2.00) (1.26) (1.23) (0.66) (0.85) (0.04) (0.44) (6.17) (1.75) (2.39)
aid gni 1st 0.99 0.99 0.99 0.99 0.99 1.00 1.00 0.99 1.00 1.00(0.01) (0.01) (0.01) (0.01) (0.01) (0.00) (0.00) (0.01) (0.01) (0.01)
polity2 1st 0.99 1.00 0.99 1.00 1.00 1.01 0.98 0.98 0.98 0.98(0.04) (0.04) (0.04) (0.04) (0.04) (0.01) (0.03) (0.04) (0.04) (0.04)
left 1st 0.56* 0.59 0.52** 0.58* 0.53** 0.85 0.87 0.57 0.66 0.63(0.18) (0.20) (0.17) (0.18) (0.17) (0.09) (0.19) (0.20) (0.22) (0.22)
Respondent-level controls Yes Yes Yes Yes Yes Yes Yes Yes Yes YesCountry-Policy Cluster Pair FEs Yes Yes Yes Yes Yes No No Yes Yes YesCountry FEs No No No No No No Yes No No NoPolicy Cluster FEs No No No No No Yes No No No No
Observations 686 692 719 719 719 672 787 672 692 692BIC 3500 3480 3610 3621 3625 2636 3400 3322 3465 3495AIC 2290 2327 2401 2408 2412 2366 2755 2208 2312 2324
Notes: Exponentiated coefficients. All regressions use inverse-probability weights to account for variationin unit non-response rate. * p < 0.1; ** p < 0.05; *** p < 0.01.
12

B Description of the Sampling Frame Construction and
the Application of Inverse-Probability Weights
While the true population of development policymakers and practitioners in low-income
and lower-middle income countries is for all intents and purposes unobservable, we took
painstaking efforts to identify a well-defined and observable population of interest (see Parks
et al. 2015). We define this population of interest as including those individuals with
direct knowledge of how government policies and programs were prioritized, designed, and
implemented in low- and lower-middle income countries between 2004 and 2013.
In recognition of the need for cross-country comparability and the fact that every government
consists of a unique set of institutions and leadership positions, we identified our population of
interest by first mapping country-specific public sector institutions (and leadership positions
within those institutions) back to an ideal-typical developing country government. This
ideal-typical government consisted of 33 institution types, such as a Ministry of Finance, a
Supreme Audit Institution, and a National Statistical Office. We then identified functionally
equivalent leadership positions within these institutions, and the specific individuals who held
these positions between 2004 and 2013. For the four additional stakeholder groups that we
included in our sampling frame (in-country development partners, domestic civil society and
non-governmental organizations, private sector associations, and independent experts), we
undertook a similar process of first mapping country-specific institutions and positions, and
then identifying the individuals who held those positions between 2004 and 2013. Identifying
functional equivalents at the institution- and leadership position-level resulted in a sampling
frame of 54,990 individuals that enables comparison across countries. By clearly defining a
population of interest and constructing a master sampling frame that is stratified by country,
stakeholder group, and institution type, we also managed to overcome one of the most vexing
challenges associated with elite surveys: the absence of detailed demographic data and the
inability to assess the representativeness of findings at various levels.
13

To construct non-response weights, we estimated a multivariate logistic regression to calcu-
late the predicted response rate for each member of the sampling frame. We then took the
following steps to calculate non-response weights for the 6,731 participants in the 2014 Re-
form Efforts Survey. First, to select a set of variables to be included in the model, we followed
other major surveys by eliminating variables that turn out to be insignificant (p > 0.30)and
keeping the variables that significantly improve the model fit. The final set of variables in-
cluded in the logistic regression are sex, institutional type, country, and stakeholder group,
which all turn out to be statistically significant (p < 0.05). Then, we computed the predicted
rate of response based on the estimated logistic regression for each member of the sampling
frame and took its inverse to arrive at non-response weights, which were then re-scaled to
add up to the total number of respondents. To eliminate extreme weights, we followed other
surveys in replacing all weights above 2.5 with 2.5, which affected only 66 respondents out
of 6,731 respondents.
14