Embed Size (px)
Citation preview
TRADE AND POVERTY
REDUCTION:
NEW EVIDENCE OF IMPACTS IN DEVELOPING COUNTRIES
JOINT PUBLICATION BY THE WORLD BANK GROUP AND THE
WORLD TRADE ORGANIZATION
Pub
lic D
iscl
osur
e A
utho
rized
Pub
lic D
iscl
osur
e A
utho
rized
Pub
lic D
iscl
osur
e A
utho
rized
Pub
lic D
iscl
osur
e A
utho
rized
1ii
TRADE AND POVERTY REDUCTION: NEW EVIDENCE OF IMPACTS IN DEVELOPING COUNTRIES
Disclaimer
The designations employed in this publication and the presentation of material therein do not imply the expression of any opinion whatsoever on the part of the World Bank, its Board of Executive Directors, or the governments they represent, or the World Trade Organization concerning the legal status of any country, area or territory or of its authorities, or concerning the delimitation of its frontiers. The responsibility for opinions expressed in this publication rests solely with their authors, and publication does not constitute an endorsement by the World Bank or the World Trade Organization of the opinions expressed. Reference to names of firms and commercial products and processes does not imply their endorsement by the World Bank or the World Trade Organization, and any failure to mention a particular firm, commercial product or process is not a sign of disapproval.
This volume is a co-publication of the World Bank and the World Trade Organization.
Attribution—Please cite the work as follows: World Bank Group and World Trade Organization, 2018. Trade and Poverty Reduction: New Evidence of Impacts in Developing Countries. World Trade Organization: Geneva.
Acknowledgements—This publication has been coordinated by Marcus Bartley Johns (WBG), Paul Brenton (WBG), Roberta Piermartini (WTO), Mustapha Sadni Jallab (WTO) and Robert Teh (WTO). The coordinators would like to thank Sandra Rossier for her assistance in the preparation of the publication. The production of the publication was managed by Anthony Martin and Edmundo Murray. Design and layout of the publication were undertaken by Corporate Visions, Inc.
Copyright © 2018 World Trade Organization
ISBN (paper): 978-92-870-4521-8ISBN (electronic): 978-92-870-4522-5
Cover images: Bigstock and Flickr World Bank
1ii
TRADE AND POVERTY REDUCTION: NEW EVIDENCE OF IMPACTS IN DEVELOPING COUNTRIES
CONTENTS
3
Foreword
4Trade and Poverty Reduction: New Evidence of Impacts in Developing Countries: Introduction and Overview
18Is Tunisian Trade Policy Pro-poor?
36Gender Welfare Effects of Regional Trade Integration on Households in Ghana
58Exporting, Importing and Wages in Africa: Evidence from Matched Employer-Employee Data
84
The Poverty Impact of Modernising Dar es Salaam Port
98
Agricultural Logistics in Lagging Regions: Evidence from Uganda
120Trade Openness and Vulnerability to Poverty in Viet Nam under Doi Moi
148
Glass Barriers: Constraints to Women’s Small-Scale, Cross-Border Trade in Cambodia and Lao PDR
174
Are the “Poor” Getting Globalised?

2
TRADE AND POVERTY REDUCTION: NEW EVIDENCE OF IMPACTS IN DEVELOPING COUNTRIESTRADE AND POVERTY REDUCTION: NEW EVIDENCE OF IMPACTS IN DEVELOPING COUNTRIES
3
2
TRADE AND POVERTY REDUCTION: NEW EVIDENCE OF IMPACTS IN DEVELOPING COUNTRIESTRADE AND POVERTY REDUCTION: NEW EVIDENCE OF IMPACTS IN DEVELOPING COUNTRIES
The Role of Trade in Ending Poverty3
Foreword
Jim Yong Kim
President
World Bank Group
In 2015, the World Bank and the World Trade Organization published a flagship report on the role of trade in the
effort to end poverty by 2030. Over the past three years, the two organizations have collaborated in various ways to
advance that goal, from supporting implementation of the WTO Trade Facilitation Agreement; to assisting the poor,
including women and small-scale traders, to take advantage of trade opportunities; to supporting trade reforms in
the world’s poorest countries.
The latest report in this collaboration comes during an uncertain time for global trade. There is a trend away from
trade openness, and the unstable trade policy environment has developed into one of the key risks facing the global
economy. It is essential that we do not lose sight of the significant implications for the poorest and most vulnerable.
Trade is a key driver of global growth and poverty reduction. An open global economy has created opportunities for
hundreds of millions of people to lift themselves out of extreme poverty.
This new volume brings together contributions from researchers that detail the challenges and opportunities in
maximizing the impact of trade openness for the poor. It shows the need to continue to focus on reducing high trade
transaction costs faced by poor workers and consumers in developing countries, and it explains how the benefits of
trade can vary between rural and urban families, and between women and men. The papers in this collection also
demonstrate the value of different research methods to understand links between trade and poverty, while also
highlighting areas for further research and for testing new analytical methods.
The collected analysis has important implications for policies and future research. It highlights how trade openness
has clear, positive impacts on poverty reduction. For example, trade can benefit the poor by reducing the price of
what they consume and increasing the price of what they sell. As producers, the poor can gain by selling their output
in overseas markets where they can get a better return. Trade can also benefit the poor because it allows producers
of domestic goods to respond to adverse shocks to domestic supply chains by shifting sourcing abroad. Trade can
also help particular groups. For example, one of the case studies in this book finds that exporting firms in Africa tend
to pay women workers more than non-trading firms.
For some sectors and groups, however, the research shows serious challenges. One example is lower incomes due
to import competition. Another is the risk that various “behind the border” barriers – like limited competition in
transport and distribution, weak infrastructure, or a lack of information on new opportunities – will negate the
benefits of export opportunities or lower-cost imports.
Understanding these issues is essential for designing complementary policy reforms to help maximize the overall
positive gains of trade openness for the poor. This requires more policy-relevant research, as well as an effort to
address data constraints in areas such as services trade or the impact of non-tariff measures.
With recent World Bank forecasts indicating that the pace of poverty reduction is slowing, there is an urgent need to
intensify reforms and increase investments that help the extreme poor. Maximizing the benefits of trade openness
for everyone, especially the poorest and most vulnerable, will be critical to driving inclusive, sustainable economic
growth and finally ending extreme poverty on the face of the earth.
Roberto Azevêdo
Director-General
World Trade Organization
54
TRADE AND POVERTY REDUCTION: NEW EVIDENCE OF IMPACTS IN DEVELOPING COUNTRIESTRADE AND POVERTY REDUCTION: NEW EVIDENCE OF IMPACTS IN DEVELOPING COUNTRIES
Trade and Poverty Reduction: New Evidence of Impacts in
Developing Countries: Introduction and Overview
In recent years there has been an intensification of the
long-running debate on the effects of trade integration.
This debate has focused largely on the impact of trade
in advanced economies, which has risked diverting
attention away from the impact of trade on people’s lives
in developing countries, and especially the extreme poor.
This volume brings together new research, using a range
of different analytical approaches, that examines how the
extreme poor have fared following trade liberalization
in various developing countries and regions and the
challenges that poor people face in benefitting from trade.
Trade has been recognized as an engine for inclusive
economic growth and poverty reduction in the 2030
Agenda for Sustainable Development. The 2015 joint
WTO-World Bank publication, The Role of Trade in Ending
Poverty strengthened the evidence that trade has played
a critical role in poverty reduction and that the further
integration of developing countries into an open global
economy will be essential for achieving the goal of ending
extreme poverty by 2030.
That publication (hereafter referred to as the “2015
joint report”) has contributed to focusing the debate on
the challenges that the extreme poor face given their
vulnerability, as well as the strategies that are most
effective in maximizing the positive impact of trade. One of
the main messages of the 2015 joint report was that trade
openness or trade growth alone may not be sufficient
to end extreme poverty. The extreme poor face specific
constraints—due to the fact that they tend to work in rural
areas, in the informal sector, live in fragile states and face
gender inequality—that can limit their ability to benefit
from wider trade-induced economic gains.
The 2015 joint report emphasized that the greatest
impact on poverty reduction will come from a coherent
and multi-pronged approach that addresses these specific
constraints. To this end, the report discussed policy actions
that governments can take individually and collectively to
maximize the gains from trade for the poor:
(i) Lowering trade costs for deeper integration of
markets, tackling policy and infrastructure barriers
to goods and services trade are critical to growth
and poverty reduction;
(ii) Improving the enabling environment including
policies related to human and physical capital,
access to finance, governance and institutions,
and macroeconomic stability;
(iii) Intensifying the poverty impact of integration
policies by bringing a greater focus on tackling
remoteness from markets at the sub-national
level, and facilitating the activities of poor and
small traders;
(iv) Managing and mitigating risks faced by the poor
that limit them from benefiting from trade
opportunities when they arise and build poor
people’s resilience to the effects of adverse
events; and
(v) Improving data and analysis to inform policy to
better understand the trade-related constraints
that the poor in many countries continue to face
including through the use of new technologies for
data generation and analysis, including big data.
54
TRADE AND POVERTY REDUCTION: NEW EVIDENCE OF IMPACTS IN DEVELOPING COUNTRIESTRADE AND POVERTY REDUCTION: NEW EVIDENCE OF IMPACTS IN DEVELOPING COUNTRIES
Trade and Poverty Reduction: New Evidence of Impacts in
Developing Countries: Introduction and Overview
1 The chapters for this report were selected following a call for papers by the WTO and World Bank that provided new empirical work on the trade and poverty nexus. There was an explicit request for papers that addressed issues relating to rural poverty, fragility and conflict, gender and informality. Perhaps reflecting the challenges of data, there were few submissions that addressed trade, poverty and conflict or that had an explicit focus on informality. In selecting papers for inclusion, beyond quality the volume has sought to capture evidence from a range of countries in different regions.
The present volume builds on this, surveying subsequent
research and presenting a series of country-level studies
to complement the global approach taken in the
2015 joint report. It continues to focus on the linkages
between trade and extreme poverty rather than the
broader distributional effects of trade and the agenda
of shared prosperity. It seeks to build understanding of
the challenges surrounding each of the four constraints
that were the focus of the joint report, as well as
identifying ways to overcome them, thereby maximizing
the contribution of trade to poverty reduction. The case
studies included in this volume reinforce the need to
move forward with the above agenda to maximize the
gains from trade for the poor. One of the main objectives
of the current volume is to bring a focus to the country
and regional level, providing insights and examples of
analytical methods that can be drawn upon for work in
other countries and regions.1
The chapters contained in this volume highlight some new
analytical approaches to understanding and addressing
the linkages between trade and poverty, while also
showing the ongoing challenges facing the research and
policy community in this work. Before summarizing each
chapter, this section reviews the recent literature on
trade and poverty, noting where chapters in this volume
contribute to the literature. This overview chapter
concludes by discussing the main policy implications of
the chapters and priorities for future work.
Overview of the recent literature on trade and poverty, including links with the current volume
The economic literature suggests that trade openness
is key to poverty reduction, but must be part of a wider
effort. Trade influences the income of the poor through
various channels: through its effects on economic
growth, relative prices, macroeconomic stability and
on government revenues (Winters, 2002 and Winters
et al., 2004). The impact of trade on poverty then
depends on decisions within the household on how
income is allocated. Trade can itself influence how
such decisions are made, for example by empowering
women within the household. Trade can further affect
long-term development outcomes if it leads declines
in child malnutrition rates, higher school attendance
and performance etc. The effect of trade on the poor
depends on the specific mechanism at play, the nature
of trade policy change (whether it increases import
competition or market access), the specific industry
or firm where the poor work and household decision-
making. In this book we focus on how the effects of trade
depend on informality, geographical location (rural or
urban area) and gender.
Trade can benefit the poor by spurring economic growth.
Sustained economic growth is the most powerful tool
for poverty alleviation. A household’s income is derived
from sale or utilization of its resource endowments
(landholdings, capital, labour or human capital). People
are poor because they have few endowments or
because the rewards received from those endowments
are low. Typically, the poor suffer from both afflictions.
Rapid and sustained economic growth allows the poor
opportunities to increase their initial endowments (save
to accumulate capital, get an education to increase
human capital) and to earn better rewards for supplying
their resources to others, typically through the market.
Another avenue through which trade can spur economic
growth is by increasing the pace of innovation by firms.
First, trade liberalization increases the size of the market
and the incentives to innovate. Second, to the extent
that technical knowhow is embodied in products, trade
liberalization makes possible knowledge spill-overs
through improved access to imports. Third, an increase
in the degree of openness of an economy will typically
enhance product market competition. The increase
in productivity means more output or income can be
obtained by society, and therefore also by the poor, from
a given amount of resources.
Trade can benefit the poor by reducing the price of
what the poor consume and increasing the price of what
the poor sell. Trade opening changes relative prices in
both product and factor markets. These changes affect
the members of the household as both consumers and
76
TRADE AND POVERTY REDUCTION: NEW EVIDENCE OF IMPACTS IN DEVELOPING COUNTRIESTRADE AND POVERTY REDUCTION: NEW EVIDENCE OF IMPACTS IN DEVELOPING COUNTRIES
sellers of goods and factors of production (e.g., labour).
As producers, the poor can gain by selling their output
in overseas markets where they can get a better return.
As producers, the poor are also consumers of inputs.
Trade can allow them to get better access to material and
services inputs and technology that improve productivity
in the production of the goods and services that the
poor produce. As consumers, trade liberalization can
be beneficial to the extent that it reduces the price for
imported goods. As income earners, prices can affect
wages and employment.
As an example of how poor producers can benefit from
trade, there is evidence that the US-Viet Nam FTA has
helped poverty reduction in Viet Nam. Families living in
provinces that benefitted from the largest cuts in the
costs of exporting to the US also saw the largest decline
in poverty (McCaig, 2011). Benefits have also been
extended to people working in the informal sector, as
export opportunities have promoted the reallocation
of workers from micro-enterprises to the formal sector
(McCaig and Pavcnik, 2014).
The challenge for policy, however, is to implement trade
reforms in a way that the increases the likelihood that
the benefits will reach the extreme poor. The benefits
of trade reforms may not reach the poor, if they are not
connected to markets. This can be the case for the rural
poor, who tend to be low skilled and less mobile than
those living in urban areas. A study of Indian liberalization
in the 1990s (Topalova, 2007 and 2010) showed that
although poverty in India declined, it declined less for
households living in rural districts more exposed to
import competition.
The country studies in this volume also highlight the
differentiated impact of trade reform in rural compared
to urban areas. For instance, in Ghana, households in
rural areas that are net producers of agricultural products
experience greater losses in welfare than households in
urban areas. The study on India (Mendoza, Nayyar and
Piermartini) shows that the products of rural households
face an average tariff in overseas markets that is 10.9
percentage points higher than that faced by the products
of urban households. This underlines the need to do more
to address the sources of agricultural trade costs, including
weak internal connectivity as well as market access
barriers, in order to maximize the positive impact of trade
opening for the rural poor. In their study on the potential
pass-through of price changes due to reforms at Dar es
Salaam port in Tanzania, Depetris-Chauvin et al. highlight
the extent to which domestic transport costs and lack of
Trade reforms can create new opportunities, but also involve adjustment costs for the poor. Access to international markets may deliver higher average incomes to farmers who specialize in producing export crops, but may bring greater competition that reduces the demand for poor workers in import competing sectors.
76
TRADE AND POVERTY REDUCTION: NEW EVIDENCE OF IMPACTS IN DEVELOPING COUNTRIESTRADE AND POVERTY REDUCTION: NEW EVIDENCE OF IMPACTS IN DEVELOPING COUNTRIES
competition among intermediaries limit the gains of trade
from being passed on to the poor in rural areas. The study
by Kunaka, drawing on research in Uganda, highlights
the importance of information barriers for agricultural
producers seeking to participate in trade.
Trade reforms can create new opportunities, but
also involve adjustment costs for the poor. Access to
international markets may deliver higher average incomes
to farmers who specialize in producing export crops, but
may bring greater competition that reduces the demand
for poor workers in import competing sectors. Adjusting
to these changes can be costly. Poor workers may require
some retraining or may need to move to another location
to access newly generated jobs. Also specialization into
the production of one or few crops, for example, while
increasing income of the poor when prices are high, it
may reduce their income when prices are low. These costs
are particularly difficult for the poor to bear given their
lack of resources and limited access to finance. This is
compounded by the lack of effective social safety nets in
many poor countries that can support poor people during
periods of transition. Therefore, what should be short-
term adjustment costs from trade can turn out to have
long-term negative outcomes for the poor. The current
volume contributes to understanding the potential for
increased vulnerability of households in trade-exposed
sectors because of trade liberalization, even when
trade contributes to an overall increase in incomes and
reduction in poverty (Magrini and Montalbano).
Existing evidence points to the importance of putting
in place appropriate policies to smooth the costs of
adjustments for the next generation, as well as in the
short-term. For example, by increasing the demand for
skills and when adequate information on this is provided,
trade can contribute to improved educational outcomes.
Jensen (2012) shows that recruitment campaigns in
rural villages in India that provided information about
job opportunities in information technology (IT) in urban
areas were associated with increased schooling of young
girls. However, primary school attendance, especially
for girls, declined in Indian regions more exposed
to international competition (Edmonds, Pavcnik and
Topalova, 2009 and 2010).
Trade benefits the poor, if it is associated with greater
diversification and greater macroeconomic stability.
Macroeconomic volatility is usually bad for the poor
because it can reduce economic growth and adversely
affect the distribution of income and generate
inequalities. The poor have little access to finance to be
able to tackle a period of tightened liquidity, therefore
they are the most affected by macroeconomic volatility.
If domestic shocks are the major source of volatility, trade
can help reduce volatility through export diversification
(Caselli et al., 2012). For example, when a country has
multiple trading partners, a domestic recession or a
recession in any one of the trading partners translates
into a smaller demand shock for its producers than when
trade is more concentrated. Trade allows domestic
goods producers to respond to shocks to the domestic
supply chain by shifting sourcing abroad. Geographical
export diversification may also help reduce the impact
of country-specific external shocks (Jansen, Lennon
and Piermartini, 2015). In fact, a recent study by the
IMF (2014) finds a robust negative correlation between
export diversification and output volatility in low-income
countries.
However, greater trade openness also implies greater
exposure to external shocks—especially in outward-
oriented industries. Countries with closer trade links
tend to have more tightly correlated business cycles
(Frankel and Rosen, 2008) suggesting that trade acts as a
transmission mechanism to propagate a country specific
shock to others. By leading to greater specialization in
output, trade reduces diversification in production and
may make a country more susceptible to idiosyncratic
shocks. Kose and Riezman (2001) find that because a
significant fraction of African countries’ exports are
concentrated in a narrow range of primary commodities,
terms of trade shocks account for 45% of the volatility
in aggregate output. Moreover, adverse trade shocks can
cause prolonged recessions since they induce a significant
decrease in aggregate investment. Koren and Tenreyro
(2007) also suggest that greater volatility in developing
countries arises from their initial specialization in the
most volatile production sectors. Economic development
involves diversifying away from these volatile sectors.
98
TRADE AND POVERTY REDUCTION: NEW EVIDENCE OF IMPACTS IN DEVELOPING COUNTRIESTRADE AND POVERTY REDUCTION: NEW EVIDENCE OF IMPACTS IN DEVELOPING COUNTRIES
Opening up to trade may put the poor at risk, if it reduces
government revenue. The poor benefit from the provision
of public goods and may be helped by government
transfer programmes. What happens to customs
revenues after trade reform can therefore matter greatly
to the poor since the share of trade taxes in government
revenues is typically high in poor countries.
However, connecting to global markets does not
necessarily lead to lower government revenues from
trade. At first glance, trade liberalization will reduce tariff
revenues and this will certainly occur if all trade taxes are
reduced to zero. However, fostering trade may involve
measures that do not affect tariff revenues. This is the
case for reforms that reduce red tape at the border.
Also, liberalization typically stops short of complete tariff
elimination. The “Laffer curve” analysis suggests that
there is a tariff rate that maximizes customs revenues; if
the initial tariff rate is above this rate, tariff liberalization
can actually increase customs collection. Furthermore, to
the extent that quantitative restrictions are replaced by
tariffs, new sources of tariff revenues will be generated
by trade reform. In many countries non-discriminatory
consumption taxes, such as a value-added tax, are also
levied at the border. Hence, while tariff revenues will fall,
revenues from consumption taxes applied to imported
goods will rise and mitigate the overall revenue loss.
Finally, lower customs revenues will be partially or wholly
made up for by greater collection of domestic taxes
(holding tax rates constant), as economic activity and
growth is stimulated by trade opening.
Finally, trade opening can affect the way decisions are
made within the household, which can have an important
impact on poverty. This is particularly the case if trade
empowers women within the household by creating jobs
for women that would not otherwise be available. For
example, cross-border trade in Africa provides income for
hundreds of thousands of poor women. The emergence of
the apparel sector in Bangladesh has created substantial
jobs for women and has contributed to changing social
attitudes towards women and girls. The empowerment
of women within the household is typically associated
with better nutritional and educational outcomes for
children, which in turn leads to higher productivity in the
long-term. Hence, the nexus between trade and gender is
a critical area for attention.
The current volume includes a number of studies that
deepen our understanding of how the impact of trade
reform may not necessarily be the same for women as it
is for men. This is important since in many poor countries
women and female-headed households typically have a
higher propensity to be poor than men and male-headed
households.
The chapter on Ghana (Orkoh) finds female-headed
households are likely to benefit more from the
implementation of the ECOWAS Common External Tariff,
especially in urban and coastal areas, as they are more
likely to be net consumers of products where prices are
expected to decline. The chapter on trading firms in
Africa (Duda-Nyczak and Viegelahn) finds that exporting
firms tend to pay more to women workers than non-
trading firms. Combining qualitative and quantitative
data on small-scale, cross-border traders in Lao PDR
and Cambodia, Seror, Clarke and Record document that
women face both visible and invisible constraints to
participating in cross-border trade, although they might
not be as great as those faced by women traders in Africa.
Their study underlines the importance of adequate border
infrastructure, streamlined border procedures, and
access to finance. The chapter on India (Mendoza, Nayyar
and Piermartini) calculates that women consistently face
higher tariffs in overseas markets than men. On average,
women’s tariffs are 6 percentage points higher than
those that men face, based on the type of work in which
they are employed. These studies reinforce the need to
assess the gender implications of trade reforms and to
identify and address if there are particular challenges
that women face to benefit from the opportunities or
deal with the risks that trade brings.
In sum, the discussion above has stressed that there are
several channels through which international trade affects
poverty. Evidence shows that not all the poor are affected
equally. The effects will depend on where they live (rural
versus urban areas), their individual characteristics (skill,
gender), the type of trade policy change (increased
import competition or export opportunities) and where
they work (industry, firm, formal/informal sector). Since
the effects are context specific, case study analysis of the
type we present in this book is very important to better
understand the variety of channels through which trade
can affect poverty.
98
TRADE AND POVERTY REDUCTION: NEW EVIDENCE OF IMPACTS IN DEVELOPING COUNTRIESTRADE AND POVERTY REDUCTION: NEW EVIDENCE OF IMPACTS IN DEVELOPING COUNTRIES
Description of the chapters in the current volume
In one of a number of papers on African countries,
Martínez, Baghdadi and Kruse examine the relationship
between the reduction of most-favored nation (MFN)
tariffs, the conclusion of several free trade agreements,
and implementation of streamlined trade procedures
from the 1990s to 2005 in Tunisia and the decline in
poverty. The authors estimate that the fall in the prices
of consumer goods from further tariff reduction would
improve the welfare of low-income households by about
1% of expenditure, but would not improve welfare for
richer households (with similar distributional results
across regions). This limited gain reflects a conservative
calculation of the likely pass through of changes in
tariffs to domestic prices; the higher pass through rate
used in similar studies would result in significantly larger
welfare improvements. Lower consumer goods prices
are estimated to benefit rural households more than
urban households, improve average welfare in female-
headed and male-headed households by about the same
amount, and improve welfare for self-employed, poor
workers only slightly more than for more formal workers.
Household welfare also improves because lower tariffs
tend to increase wages. However, wage data are available
only at the industry rather than individual level, and this
estimation is not reliable.
Orkoh assesses the welfare effects of changes in the
domestic prices of commodities as a result of Ghana’s
adoption of the common external tariff of the Economic
Community of West African States (ECOWAS), with special
attention to gender differences. These price changes
would improve the welfare of poor and female-headed
households as consumers, but reduce the welfare of
both poor and rich households as producers, with male-
headed households being the most affected. The net
effect is around zero for poor male-headed households
and negative for the rich, but positive for female-headed
households in the low- and middle-income categories.
While the results also depend on the geographic location
of the household, among other factors, the reform is
thus expected to have pro-poor and pro-female effects.
The study recommends that the government introduces
compensatory policies, such as income transfers that
would target male-headed households that are producers
Evidence shows that not all the poor are affected by international trade equally. The effects will depend on where they live (rural versus urban areas), their individual characteristics (skill, gender), the type of trade policy change (increased import competition or export opportunities) and where they work (industry, firm, formal/informal sector).
1110
TRADE AND POVERTY REDUCTION: NEW EVIDENCE OF IMPACTS IN DEVELOPING COUNTRIESTRADE AND POVERTY REDUCTION: NEW EVIDENCE OF IMPACTS IN DEVELOPING COUNTRIES
and streamline the ongoing Livelihood Empowerment
Against Poverty Programme to help poor, male-headed
households. It could also aim to improve infrastructure
in the regions that will experience a net welfare loss, in
order to make them more competitive.
Duda-Nyczak and Viegelahn study wages in exporting
and importing firms of the manufacturing sector in
Africa, using firm-level data for 47 countries and matched
employer-employee-level data for 16 countries. The
average firm-level and employee-level wage paid by
exporters is higher than that paid by non-exporting
firms. It is gains from economies of scale that explain
the positive wage premium of exporters, rather than
differences in skill utilization, differences in workforce
characteristics, or technology transfers. In contrast,
there is no evidence that importers pay higher wages
than non-importers, at least when comparing firms of
the same age. The wage premium of importing at the
employee-level is estimated to be negative. Finally, there
is no significant differences between female and male
workers’ wages in trading firms, but some evidences of a
gender wage gap between trading and non-trading firms.
Depetris-Chauvin et al. assess the likely welfare and
poverty impact of a project to modernize the port of Dar
es Salaam, Tanzania. They assume that the improvements
would lead to a 5% reduction in border prices for bulk
imports and a 5% increase in the price of exports. The
model allows that reductions in border prices are not
always fully passed through to the domestic economy
because of the lack of competition among importers
and exporters in some sectors. Besides market structure,
the likely impact of the project is reduced by poor
infrastructure and logistics in Tanzania. Transport costs
increase substantially moving away from the port,
contributing to a high degree of geographical market
segmentation in Tanzania. To a large extent, the short-
term positive welfare impacts of improving the port alone
are modest for all groups of households considered. In
particular, the effect is very small for poor households, as
the incidence of international trade in the consumption
basket and as a source of income for the poor is very
low. In the long run, a better functioning port could
reduce rural poverty if other policies and infrastructure
improvements (particularly for inland transport) are put
in place to alleviate the many constraints affecting small
holders’ access to food and cash crop export markets.
Market participation by small scale farmers in Uganda,
particularly those in remote regions, is severely limited
by inadequate transport that raises transport costs
and impairs quality, and by lack of information on
market conditions. The paper by Kunaka explores how
infrastructure investments, cooperation between farmers
and the use of information technology can help farmers
access more efficient transport, reduce their dependence
on intermediaries and increase their incomes. Simulations
using an agent based modelling (ABM) technique
indicate that strategic placement of markets, improving
access to warehouse facilities, encouraging farmers
associations, improving the institutional framework for
contract farming, and facilitating compliance with good
agricultural practices (GAP) standards could reduce
transport costs, raise prices received by smallholders, and
increase their participation in the market.
A number of studies examine the relationship between
trade opening and poverty reduction in Asia. Consistent
with other studies, Magrini and Montalbano find that
1110
TRADE AND POVERTY REDUCTION: NEW EVIDENCE OF IMPACTS IN DEVELOPING COUNTRIESTRADE AND POVERTY REDUCTION: NEW EVIDENCE OF IMPACTS IN DEVELOPING COUNTRIES
the level of poverty and the risk of future poverty fell
sharply in Viet Nam following the Doi Moi reforms,
which included trade liberalization reforms. However,
households engaged in sectors that were more exposed
to trade experienced increased risk, and thus a significant
probability of falling into poverty in the near future. The
greater the exposure to trade of a household’s activities,
the more important was risk in determining variations
in household consumption. After Doi Moi, households
involved in farming were, on average, five times more
likely than households involved in non-farm activities to
fall into poverty. Similarly, rural households faced greater
risk of falling into poverty than did urban households.
These findings underline the importance of helping
farmers exposed to international competition to reduce
their vulnerability to poverty, despite higher average
incomes as a result of trade liberalization. Measures could
include safeguards against excessive price volatility and
assistance with managing risk through increasing savings
(e.g., by increasing the availability of micro-financial
instruments), improving access to credit, and increasing
the availability of insurance (e.g., through community-
based risk-sharing or institutional products targeted to
farmers most involved in tradable cropping).
Seror, Record and Clarke focus on small-scale cross border
trade (SSCBT) and gender in Lao PDR and Cambodia.
They show that such trade can provide significant
earning opportunities for women, yet women appear to
be underrepresented in such activities in Cambodia and
Lao PDR. Physical sexual harassment does not appear
to be a significant problem. Nevertheless, women face
greater constraints in participating in SCCBT than do
men. Inadequate border infrastructure imposes delays
in trading, while women face greater time constraints
due to more household responsibilities. Access to
financing for women traders is more limited due to
greater difficulties in obtaining loans from relatives.
Women have less bargaining power vis-a-vis border
officials, which increases the cost of nontransparent and
arbitrary customs procedures and results in a higher tax
burden. Women pay higher taxes and are more likely to
be controlled by quarantine services, but this is not due
to a greater likelihood of illegal behavior.
Several policy improvements would expand opportunities
for women to profit from SCCBT. Increasing transparency,
simplifying procedures and limiting border officials’
discretion would reduce the time burden women face and
the disadvantages from their smaller bargaining power.
Improving infrastructure would also reduce the time
required at the border. Increasing provision of childcare
services would reduce household responsibilities. Easing
fees and restrictions on motorized transport would
reduce the importance of physical strength in moving
goods across some border posts. Providing training in
gender sensitivity and formulating a Charter for Cross-
Border Traders and Brokers stating the rights and
duties of all parties involved in cross-border trade would
improve women’s experience at the border.
One reason that poor people may not capture the full
benefit from participation in international markets is that
the goods they produce tend to be subject to relatively
high trade barriers. The paper by Mendoza, Nayyar and
Piermartini analyses the average overseas tariffs faced by
different groups of Indian workers, by matching Indian
household survey data collected from July 2011 to June
2012 with information on the industrial classification
of products. Tariffs faced by exporters in international
markets are higher, and non-tariff measures (NTMs) more
numerous, on goods produced by poor workers than on
goods produced by rich workers. Tariffs also are higher on
One reason that poor people may not capture the full
benefit from participation in international markets is that the
goods they produce tend to be subject to relatively high trade
barriers.
1312
TRADE AND POVERTY REDUCTION: NEW EVIDENCE OF IMPACTS IN DEVELOPING COUNTRIESTRADE AND POVERTY REDUCTION: NEW EVIDENCE OF IMPACTS IN DEVELOPING COUNTRIES
goods produced in rural and more remote areas than on
those from urban centers, on goods produced by informal
enterprises than by formal ones, and on goods produced
by women than by men. And the global reduction in tariffs
from 1996 to 2012 failed to ameliorate these differences.
Access to international markets is more difficult for the
poor. How did we get there? Essentially, efforts to protect
poor workers across countries (tariff protection in China
and the United States is higher on goods produced by
poor workers than on goods produced by rich workers)
face a coordination problem. If poor workers produce
the same kinds of goods, then each country’s attempts to
protect its own poor workers by imposing higher tariffs
and more NTMs on such goods will reduce the access of
all poor workers to international markets, and thus limit
the reduction in poverty from trade liberalization.
Conclusions on policy priorities and issues for deeper analysis
The studies presented in this book show that reducing
barriers for the goods that the poor consume, facilitating
access to external markets for the goods that the poor
produce, and connecting the poor to global markets by
overcoming international and domestic trade-related
costs are all central to maximizing the potential benefits
of trade for poverty reduction. Trade can work through
a variety of channels to alleviate poverty including:
creating jobs and increasing job opportunities; making
goods consumed by poor households cheaper; lowering
the pecuniary and non-pecuniary barriers to trade that
fall most heavily on poorer producers; and facilitating
the access to information and technology that can
transform production processes or make them more
efficient. However, this report underlines the importance
of trade policy being accompanied by appropriate and
sound macroeconomic and sectoral policies to ensure
that gains generated from trade are shared as widely as
possible, and that trade does not exacerbate inequalities
or contribute to increased vulnerability. Building on
the joint report and subsequent studies, the papers
included in this volume make substantial contributions to
increasing our understanding of how trade can help drive
poverty reduction and steps that governments can take
to maximize the positive impacts from trade and mitigate
adverse outcomes for the poor. Nevertheless, there is still
much to be done to enhance the benefits for the poor of
increasing integration of markets across borders.
Key policy issues
Beyond the broad areas of complementary policies
identified in the joint report, several specific policy
challenges emerge from the papers in this volume as
requiring more attention as part of trade policy reform
strategies in developing countries and in support under
the Aid for Trade agenda:
• A focus on reducing the high trade transaction
costs faced by poor workers and consumers
in developing countries, to realize potential
gains. Several sources and impacts of these high
transaction costs are noted in contributions to
this volume, including tariff and non-tariff barriers
(Mendoza, Nayyar and Piermartini) transport and
logistics costs (Kunaka and Depetris-Chauvin),
costs associated with accessing information
(Seror, Record and Clarke; Kunaka). The potential
benefits of reducing these costs are demonstrated
in several papers (for example, Orkoh; Martínez,
Baghdadi and Kruse).
• Ensuringcompetitionandefficiencyinprovision
of services along domestic distribution networks,
which can be essential to ensure that the potential
benefits from trade are realized by poor people.
Lack of access to road and rail infrastructure limits
the returns to poor exporters and the benefits
from declining prices of imported final and
intermediate products, especially for the rural poor
(Kunaka). Lack of competition in the transportation
and distribution sector and poor logistics services
mean that the impact of trade reforms can be very
small for poor households (Depetris-Chauvin).
• More attention to mitigating the risks that poor
producers and workers face from increased
import competition. Exposure to import
competition can increase the vulnerability of
people who are below the poverty line or have
recently exited poverty (Magrini and Montalbano).
There is therefore a role for policies that help
address these risks, and make the investments
1312
TRADE AND POVERTY REDUCTION: NEW EVIDENCE OF IMPACTS IN DEVELOPING COUNTRIESTRADE AND POVERTY REDUCTION: NEW EVIDENCE OF IMPACTS IN DEVELOPING COUNTRIES
needed so that trade-driven poverty reduction
results in a sustained transition from poverty to
higher income levels. These include: (i) Improving
access to finance. For the poor to invest to benefit
from new opportunities to export typically requires
access to finance. Access to finance is essential
for the poor to weather temporary periods of
dislocation caused by trade. However, in poor
countries this is often constrained, especially for
women; and (ii) Expanding the social safety net and
insurance. The poor in developing countries often
lack access to formal insurance and a social safety
net. Typically, they rely on family networks for
these services, which may impede mobility across
regions and occupations if there are costs involved
in changing jobs.
Priority issues for research and analysis
One of the benefits of this volume, and of the wider set
of submissions received in response to the call for papers
issued by the WTO and the World Bank, is that they shed
further light on the value of different research methods
employed to understand trade-poverty linkages, while
also highlighting areas for further research and testing
new analytical methods.
In terms of the research methods used, there is no
dominant approach and different methods are required
according to the issues being assessed and the availability
of data. The volume includes a number of papers which
use information from household surveys to trace
through the impact of changes in relative prices due to
trade reforms on welfare. The papers vary in the way in
which they model the impact of trade reform including
detailed partial equilibrium approaches and the use of a
computable general equilibrium (CGE) model to explore
wider inter-sectoral implications. Other papers use
econometric techniques applied to detailed firm level
and employee data to examine the impact of exporting
and importing on wages. Other papers use more novel
research approaches obtaining data from detailed surveys
of small-scale traders at the border and from agent based
modelling to assess detailed issues related to the impacts
of trade that are not possible in more aggregate sector
and economy-wide modelling approaches.
A key issue that a number of papers explore is the degree
of pass-through from changes in border prices to the
changes in relative prices actually faced by poor people.
Typically, it is assumed that there is perfect pass-through
but there is increasing evidence that this does not hold in
reality, especially in regard to the key characteristics of
the poor discussed above and in the joint report: location
in rural areas, informality and fragility. The papers here
show that assumptions about pass-through are critical
in determining estimates of the extent to which poor
people are affected by trade.
The contributions to this volume include both ex ante
and ex post analyses of trade reforms. These in turn
cover a variety of examples, including tariff liberalization,
reduction of non-tariff barriers, trade facilitation, and
regional trade integration. The majority of papers assess
the impact on poverty of potential or previous episodes
of trade liberalization by modelling the change in prices
of particular sectors and linking these with the results of
household surveys.
It is clear that the papers in this volume make a significant
contribution to building an understanding of the value
of existing research methods available to study trade
and poverty linkages, and ways in which these are being
modified and improved. At the same time, the papers also
highlight the gaps in research and analytical methods for
understanding trade and poverty linkages. The following
priorities are suggested for future work.
Data limitations remain a critical constraint to deeper
research and analysis, especially with regard to fragile
andconflictstates, informalityandgender. There is a
need for a more systematic effort to capture the lessons
learned through the use of new methods to gather
relevant data (e.g., through data scraping, mobile phone
surveys) and through use of a wider range of data sources
(e.g., nutritional data; geospatial imagery).
Understanding the potential impact of the reduction
of non-tariff barriers, especially for food and agro-
processed products. There is very little analysis of how
barriers such as quantitative restrictions, differences in
regulations across countries, poor trade facilitation, and a
lack of competition among key value chain players impact

1514
TRADE AND POVERTY REDUCTION: NEW EVIDENCE OF IMPACTS IN DEVELOPING COUNTRIESTRADE AND POVERTY REDUCTION: NEW EVIDENCE OF IMPACTS IN DEVELOPING COUNTRIES
on poverty and different groups of the poor. There is
also limited knowledge of specific policy approaches that
can facilitate their removal. For example, more attention
needs to be given to reducing the costs of compliance
with standards and regulations for poor producers. Of
particular importance are measures related to trade in
agricultural products and compliance with Sanitary and
Phytosanitary (SPS) regulations. It remains extremely
difficult and costly for poor producers of agricultural
products to access markets in richer countries. There is
also enormous potential for trade between developing
countries in food products, which is stymied by restrictive
regulations and onerous inspection procedures,
especially for traded products. There is considerable
potential for the use of new ICT technologies for rapid
testing and certification of traded commodities grown by
smallholder farmers, to reduce the costs of compliance
and of trading across borders.
Facilitating trade in services. Services exports provide
new routes to deliver jobs for the poor, and in particular
for women, who are employed intensively in services
sectors such as tourism, health and education, as well
as improving access to critical services that can drive
development through increased imports.2 Sectors
such as tourism can be an important source of jobs and
incomes for the poor in rural areas and can be a key sector
for fragile states as they emerge from conflict. Access to
information, logistics, education and health services can
increase productivity and allow small producers to access
larger export markets. Yet there is very little analysis of
the constraints to services trade that impact most heavily
on the poor and scant guidance for governments on
how to address these. As with non-tariff measures, this
is compounded by a lack of data on services trade flows
—although innovative, technology-enabled methods to
gather this data are helping address this, as discussed
below.
Exploiting the potential for technology to provide
solutions that help ensure a positive impact of trade
for the extreme poor. Access to the Internet and other
forms of digital technology holds significant promise for
connecting the poor to new or better trade opportunities,
by lowering many of the costs associated with trade
(e.g., information costs). For example, in rural areas of
China the rapid growth of e-commerce for agriculture
has led to significantly higher demand for value-added
niche agricultural goods, like organic produce.3 Access
to information for farmers in countries like India is
addressing information asymmetries, a key source of
trade-related costs for the poor, and the Internet is being
used to lower logistics costs in East Africa in ways that
reduce transaction costs for producers. There is also the
potential for new forms of Internet-enabled trade to
help firms and entrepreneurs overcome the constraints
imposed by informality and small size. This is particularly
applicable for e-commerce in goods, where there are
many examples of platforms that help connect individual
artisans, re-sellers of goods, and farmers to markets.
Across these various applications of technology that could
reduce trade costs facing the extreme poor, there is a
need to more systematically capture the lessons learned
through pilot initiatives, and apply them at greater scale
where feasible.
The relationship between informality and trade. A
number of papers in this volume touch on the issue of
trade and informality but detailed analysis of the links
between trade and informality remain absent. None
of the papers submitted to the call for this volume had
an explicit focus on informality. In part this reflects the
lack of easily available data and that new approaches
are required. For example, participants of the informal
economy are often very reticent to provide information
to what may appear as an official survey. Given very
large numbers of the extreme poor who derive their
income from the informal sector, it is essential to grow
the body of country evidence on the constraints posed
by informality for participation in trade and how trade
can provide opportunities for informal enterprises to
grow and ultimately transition to the formal sector and
so obtain better access to finance, information and skills.
Understanding and addressing the risks associated with
operating in the formal relative to the informal sector
is a key issue. In many cases, operating in the informal
sector is a rational response to the risks and costs of
2 See, for example, see Dihel and Goswami (2016).3 http://www.chinadaily.com.cn/business/2016-12/20/content_27719089.htm and http://www.scmp.com/news/china/article/1662752/chinas-new-farmers-are-using-e-commerce-transform-
agriculture
1514
TRADE AND POVERTY REDUCTION: NEW EVIDENCE OF IMPACTS IN DEVELOPING COUNTRIESTRADE AND POVERTY REDUCTION: NEW EVIDENCE OF IMPACTS IN DEVELOPING COUNTRIES
being formally registered. It may also be that the scale
of operation that is feasible in small domestic economies
limits operation to the informal sector, a constraint that
can be broken by access to larger overseas markets.
Understanding and enhancing second round impacts of
trade reforms. This involves taking analysis beyond the
typical focus on short-term impacts on consumption and
production through changes in prices brought about by
trade reform, to looking at strategies and responses that
maximize the positive impact over time. For example, the
typical approach in assessing the impact of global shocks
that lead to higher food prices on poor households has
been to identify whether the household is a net consumer
or producer of food products. Given the finding that most
poor households are net consumers of food, analyses
using this approach typically conclude that higher food
prices are likely to increase poverty in the short run (see,
for example, Ivanic and Martin (2008, 2014)). However, in
the medium households adjust to higher food prices in
ways that can lead to lower poverty. This could be through
investments, for example in fertilisers and higher yielding
seeds, that increase productivity and output. There
could also be shifts within the household to activities
that generate higher wage income for the household
as demand for unskilled labour in rural areas increases.
Finally, the impact of changing household income on
poverty will depend on intra-household distributional
decisions which are not captured in the net food position
of the household. The latter could include policies that
further support the empowerment of women, which can
have long-term development outcomes in terms of lower
child malnutrition, and higher school participation and
attainment rates.
Conclusion
Trade has made a critical contribution to poverty
reduction to date, and further integration of developing
countries into international markets will be essential for
ending poverty and leaving no one behind. However,
as the 2015 joint WTO-World Bank report emphasized,
the gains from trade integration alone may not be
sufficient to end poverty by 2030. Complementary
efforts are required to tackle the constraints that people
living in poverty face if they are to maximize the gains
of trade. The papers presented in this volume explore
these constraints in more detail at the country level in
several regions, making a significant contribution to the
literature. They showcase various research methods for
exploring trade and poverty linkages, while also making
clear the areas in which research and analytical gaps
exist, for future work to fill. In this way, it is hoped that
this volume contributes not only to the growing body of
work on trade and poverty in developing countries, but
also contributes to further efforts among researchers
and policymakers to address the many gaps that remain
in this field.
Trade has made a critical contribution to poverty reduction to date, and further integration of developing countries into international markets will be essential for ending poverty and leaving no one behind.
1716
TRADE AND POVERTY REDUCTION: NEW EVIDENCE OF IMPACTS IN DEVELOPING COUNTRIESTRADE AND POVERTY REDUCTION: NEW EVIDENCE OF IMPACTS IN DEVELOPING COUNTRIES
ReferencesCaselli, F., M. Koren, M. Lisicky and S. Tenreyro (2015). “Diversification Through Trade”. CEPR Discussion Paper10775.
Dihel, N. and A. Goswami (2016). The Unexplored Potential of Trade in Services in Africa, World Bank, Washington DC.
Edmonds, E., N. Pavcnik and P. Topalova (2009). “Child Labor and Schooling in a Globalizing Economy: Some Evidence from Urban India.” Journal of European Economic Association, Papers and Proceedings 7 (2–3), 498–507.
Edmonds, E., N. Pavcnik and P. Topalova (2010). “Trade Adjustment and Human Capital Investment: Evidence from Indian Tariff Reforms.” American Economic Journal: Applied Economics 2 (4), 42–75.
Frankel, J. A. and H. Rosen (2008). “The Endogeneity of the Optimum Currency Area Criteria,”The Economic Journal 108, 1009-1025.
IMF (2014). “Sustaining Long-Run Growth and Macroeconomic Stability in Low-Income Countries – The Role of Structural Transformation and Diversification – Background Notes,” Washington, DC: IMF.
Ivanic, M. and W. Martin (2008). “Implications of Higher Global Food Prices for Poverty in Low-Income Countries.” Agricultural Economics 39, 405–16.
Ivanic, M. and W. Martin (2014). “Short- and Long-Run Impacts of Food Price Changes on Poverty.” World Bank Policy Research Working Paper No. 7011.
Kose, M.A. and R. Riezman (2001). “Trade Shocks and Macroeconomic Fluctuations in Africa,”Journal of Development Economics 65 (1), 55-80
Jansen, M., C. Lennon and R. Piermartini (2016). “ Income volatility: whom you trade with matters,” Review of World Economics 152, 127–146.
Jensen, Robert. (2012). “Do Labor Market Opportunities Affect Young Women’s Work and Family Decisions? Experimental Evidence from India,” The Quarterly Journal of Economics 127(2), pp. 753–792.
Koren, M. and S. Tenreyro (2007). “Volatility and Development,”Quarterly Journal of Economics 122 (1): 243-287.
McCaig, B. (2011). “Exporting out of poverty: Provincial poverty in Vietnam and U.S. market access.” Journal of International Economics, 85(1), pp. 102–113.
McCaig, B. and N. Pavcnik (2014). “Export Markets and Labor Reallocation in a Low-Income Country.” NBER Working Paper No. 20455.
Topalova, P. (2007). “Trade Liberalization, Poverty and Inequality: Evidence from Indian Districts,” in Harrison, A. (ed). Globalization and Poverty, University of Chicago Press.
Topalova, P. (2010). “Factor Immobility and Regional Impacts of Trade Liberalization: Evidence on Poverty from India.” American Economic Journal: Applied Economics 2(4), 1–41.
Winters, L.A., N. McCulloch and A. McKay (2004). “Trade Liberalization and poverty: the evidence so far.” Journal of Economic Literature 42(1): 72-115.
1716
TRADE AND POVERTY REDUCTION: NEW EVIDENCE OF IMPACTS IN DEVELOPING COUNTRIESTRADE AND POVERTY REDUCTION: NEW EVIDENCE OF IMPACTS IN DEVELOPING COUNTRIES
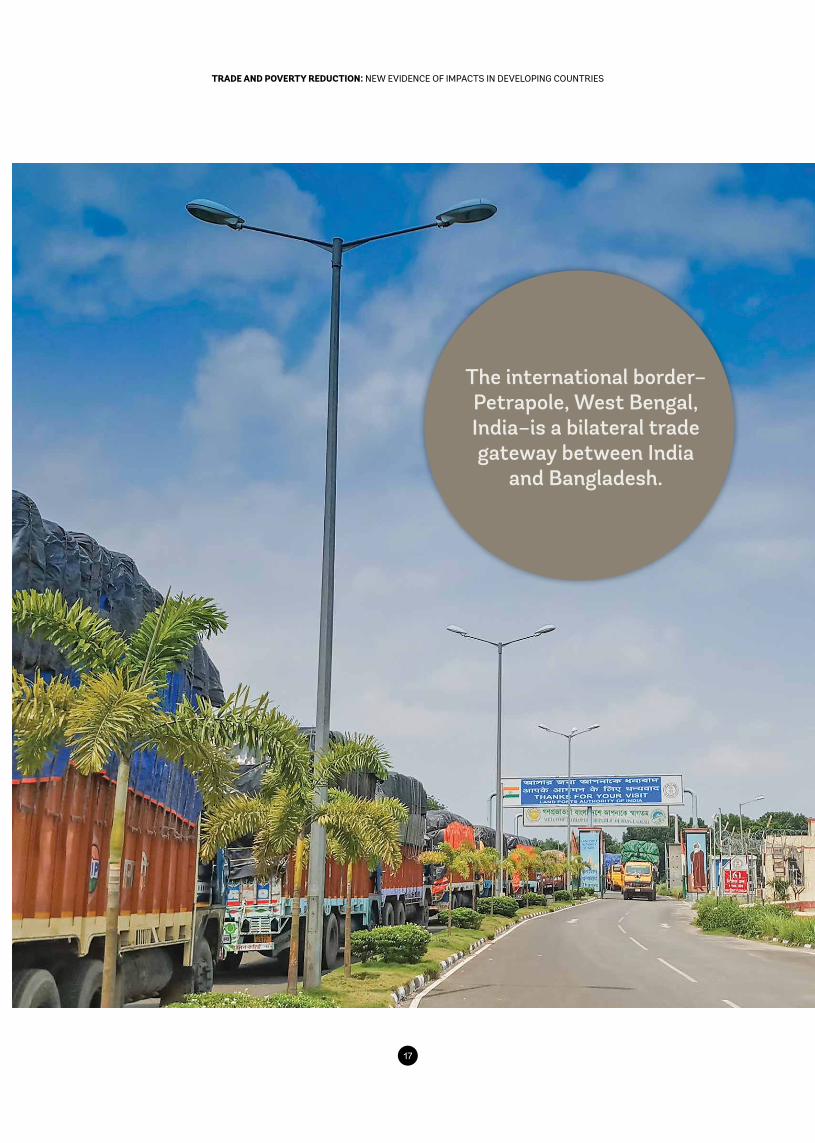
The international border–Petrapole, West Bengal, India–is a bilateral trade gateway between India
and Bangladesh.
1918
TRADE AND POVERTY REDUCTION: NEW EVIDENCE OF IMPACTS IN DEVELOPING COUNTRIESTRADE AND POVERTY REDUCTION: NEW EVIDENCE OF IMPACTS IN DEVELOPING COUNTRIES
Is Tunisian Trade Policy Pro-poor?1
1. Introduction
Trade liberalization policies affect the domestic
economy through their impact on prices of
goods and services. Consequently, these policies
also can affect average productivity and lead to
industrial restructuring. The main goal of this research
is to estimate the distributional effects of trade policy
at the micro level using household survey data, and to
determine whether trade liberalization affected different
groups of poor people differently. To our knowledge this
question has not yet been addressed for Tunisia.
Trade policy in Tunisia has been evolving over time
through a progressive reduction of tariff protection that
has narrowed the gap between most favored nation
(MFN) tariffs and preferential tariffs and increased the
number of free trade agreements (FTAs) signed with
its main trading partners. Most FTAs involve a gradual
elimination of tariffs, at least for non-agricultural products
(WTO, 2005). The maximum tariff rate in 1995 was 43%
for non-agricultural products and 150% for agricultural
products. Tariff reductions to bring the MFN rate close
to the tariff applied to preferential imports have reduced
the average rate from 45% in 2006 to 14% in 2016; and
the maximum rate of 150% was reduced to 36% in 2009.
By 2016, Tunisia had concluded trade agreements with
about 60 countries.
Several other key policy changes in Tunisia’s liberalization
also took place in the 1990s and the 2000s. In particular,
the reform of external trade, established by the law of
1994, launched a first program (2000–2004) that resulted
in an integrated system of electronic management of
external trade procedures, which reduced the time
needed to complete foreign trade operations. The
second program, launched in 2005, put in place a
custom risk management system and more transparent
standards and technical regulations. However, from 2005
to 2015 there were no other significant modernization
steps, and trade policy remained almost unchanged, with
only one FTA signed (with Iran in 2008—WTO, 2016).
Since 2015, all technical import control documents can
be transmitted electronically, but the processing of the
numerous tax incentives still relies on paper documents.
While the reduction in tariff rates and the simplification
of the tariff regime (there are only three tariff rates: zero,
20% and 36%) have reduced distortions, trade remains
subject to extensive controls. State-owned enterprises
and a number of boards (Trade Board, Cereals Board
and Oil Board) exercise considerable control over
international trade. Imports are still subject to many
controls and permits, although the development plan
launched in 2016 is supposed to review the role played
by these entities in the development process.
Inma Martínez-Zarzoso, University of Goettingen and University Jaume ILeila Baghdadi, WTO Chair Holder, Tunis Business School, University of Tunis
Hendrik Wiard Kruse, University of Goettingen
1 We gratefully acknowledge financial and intellectual support from the World Trade Organization Chair at Tunis Business School, University of Tunis, Tunisia and the Economic Research Forum (ERF). I. Martínez-Zarzoso is also grateful for the financial support received from Project ECO2017-83255-C3-3-P (AEI, FEDER, EU). The authors thank participants at the 22nd Annual Conference of the ERF, Caroline Freund and Chahir Zaki for their constructive comments.
1918
TRADE AND POVERTY REDUCTION: NEW EVIDENCE OF IMPACTS IN DEVELOPING COUNTRIESTRADE AND POVERTY REDUCTION: NEW EVIDENCE OF IMPACTS IN DEVELOPING COUNTRIES
Is Tunisian Trade Policy Pro-poor?1
Inma Martínez-Zarzoso, University of Goettingen and University Jaume ILeila Baghdadi, WTO Chair Holder, Tunis Business School, University of Tunis
Hendrik Wiard Kruse, University of Goettingen
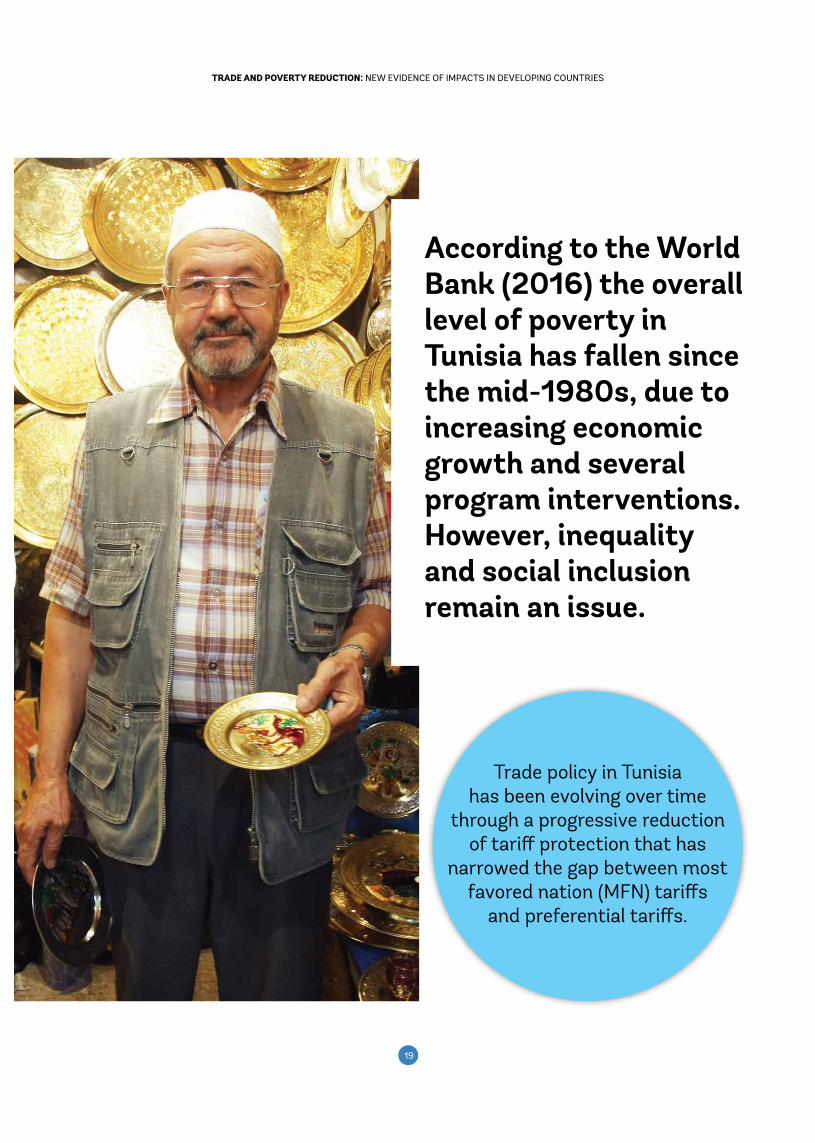
According to the World Bank (2016) the overall level of poverty in Tunisia has fallen since the mid-1980s, due to increasing economic growth and several program interventions. However, inequality and social inclusion remain an issue.
Trade policy in Tunisia has been evolving over time
through a progressive reduction of tariff protection that has
narrowed the gap between most favored nation (MFN) tariffs
and preferential tariffs.
2120
TRADE AND POVERTY REDUCTION: NEW EVIDENCE OF IMPACTS IN DEVELOPING COUNTRIESTRADE AND POVERTY REDUCTION: NEW EVIDENCE OF IMPACTS IN DEVELOPING COUNTRIES
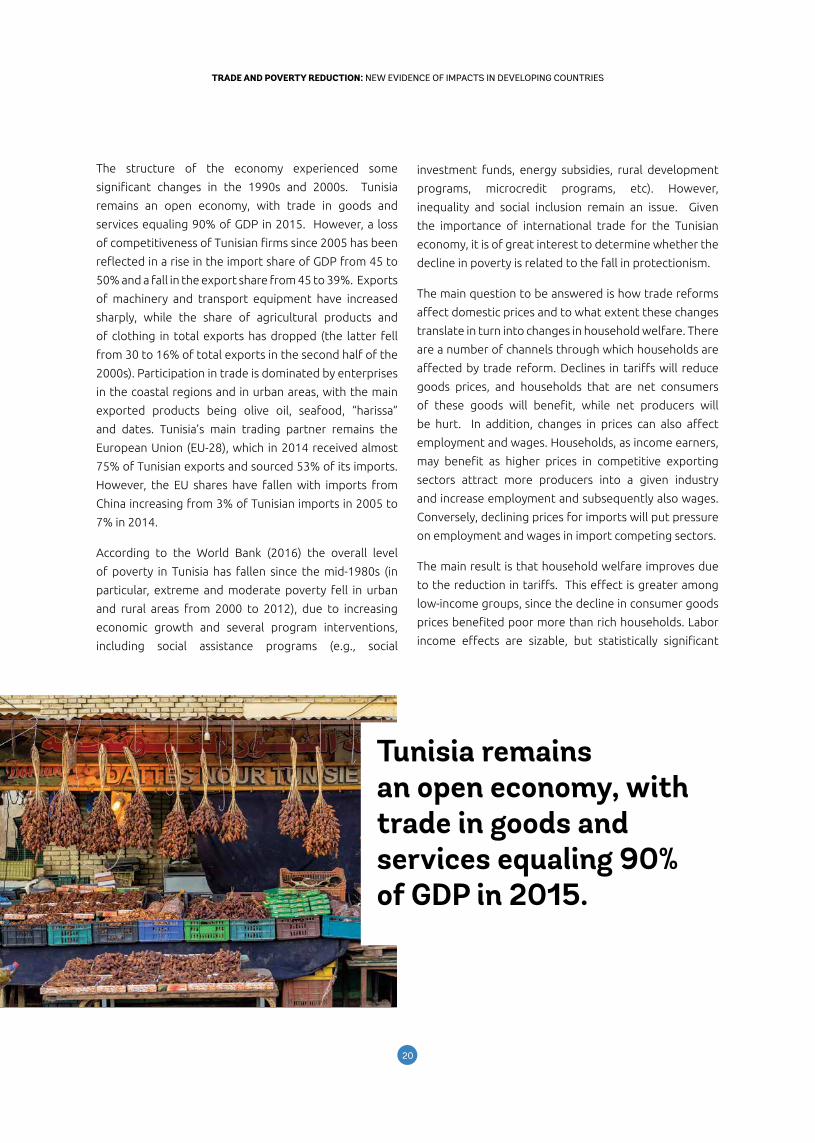
The structure of the economy experienced some
significant changes in the 1990s and 2000s. Tunisia
remains an open economy, with trade in goods and
services equaling 90% of GDP in 2015. However, a loss
of competitiveness of Tunisian firms since 2005 has been
reflected in a rise in the import share of GDP from 45 to
50% and a fall in the export share from 45 to 39%. Exports
of machinery and transport equipment have increased
sharply, while the share of agricultural products and
of clothing in total exports has dropped (the latter fell
from 30 to 16% of total exports in the second half of the
2000s). Participation in trade is dominated by enterprises
in the coastal regions and in urban areas, with the main
exported products being olive oil, seafood, “harissa”
and dates. Tunisia’s main trading partner remains the
European Union (EU-28), which in 2014 received almost
75% of Tunisian exports and sourced 53% of its imports.
However, the EU shares have fallen with imports from
China increasing from 3% of Tunisian imports in 2005 to
7% in 2014.
According to the World Bank (2016) the overall level
of poverty in Tunisia has fallen since the mid-1980s (in
particular, extreme and moderate poverty fell in urban
and rural areas from 2000 to 2012), due to increasing
economic growth and several program interventions,
including social assistance programs (e.g., social
investment funds, energy subsidies, rural development
programs, microcredit programs, etc). However,
inequality and social inclusion remain an issue. Given
the importance of international trade for the Tunisian
economy, it is of great interest to determine whether the
decline in poverty is related to the fall in protectionism.
The main question to be answered is how trade reforms
affect domestic prices and to what extent these changes
translate in turn into changes in household welfare. There
are a number of channels through which households are
affected by trade reform. Declines in tariffs will reduce
goods prices, and households that are net consumers
of these goods will benefit, while net producers will
be hurt. In addition, changes in prices can also affect
employment and wages. Households, as income earners,
may benefit as higher prices in competitive exporting
sectors attract more producers into a given industry
and increase employment and subsequently also wages.
Conversely, declining prices for imports will put pressure
on employment and wages in import competing sectors.
The main result is that household welfare improves due
to the reduction in tariffs. This effect is greater among
low-income groups, since the decline in consumer goods
prices benefited poor more than rich households. Labor
income effects are sizable, but statistically significant
Tunisia remains an open economy, with trade in goods and services equaling 90% of GDP in 2015.
2120
TRADE AND POVERTY REDUCTION: NEW EVIDENCE OF IMPACTS IN DEVELOPING COUNTRIESTRADE AND POVERTY REDUCTION: NEW EVIDENCE OF IMPACTS IN DEVELOPING COUNTRIES
only for the skilled. The rest of the paper is organized
as follows. Section 2 reviews the related literature and
presents some stylized facts. Section 3 outlines the
methodology and describes the data sources, variables
and the model specification. Section 4 presents and
discusses the results, and Section 5 concludes.
2. Review of the literature
Most empirical evidence at the macro level indicates
that trade openness has a positive impact on economic
development in general (Doyle and Martínez-Zarzoso,
2011). However, the benefits are usually unevenly
distributed across households. Recent literature shows
that the impact of tariff liberalization on households,
both as consumers and factory owners, is positive overall.
However, the distribution of gains differs significantly
across income levels and geographic regions within
countries.
Porto (2006) develops a method to estimate the
distributional effects of trade policies using household
survey data and applies it to the case of Argentina.
He finds that the average poor and middle-income
family benefited from the Mercosur agreement. More
specifically, Porto (2006) assumes a unitary pass-through
rate from tariffs to prices, and uses intra-Mercosur and
common external tariffs and import shares to compute
the price changes. Next, he obtains the consumption
effects by multiplying budget shares by the computed
price changes, and uses locally weighted regressions
(Fan, 1992) to analyze the relationship between those
changes along the distribution of per capita household
expenditure. He finds that the resulting welfare impact
increases with income per capita expenditure, indicating
a greater gain for higher-income than low-income
households.
However, when taking into account the positive labor
income effect on household welfare, estimated using a
wage equation and calculating wage-price elasticities,
a net pro-poor effect of the reduction in tariffs due to
Mercosur is observed. The intuition behind this result
is that the reduction in tariffs on traded goods raised
the relative price of goods intensive in unskilled labor
(increase in the price of food and beverages and decline
in price of household equipment), which reduced the
wages of more-skilled workers relative to those of less-
skilled workers. The estimated effects are small, around
6% of initial expenditure. The main policy conclusion
is that poverty in Argentina would have been higher
without the Mercosur agreement.
Several recent studies, including Nicita (2009), Ural
Marchand (2012), Borraz et al. (2013) and Nicita et al.
(2014), have applied a similar methodology, relaxing
some of the strong assumptions made in Porto (2006).
Nicita (2009) allow for less than full pass-through from
changes in border prices of traded goods domestic prices
by using an econometric model proposed by Goldberg
and Knetter (1997). It is estimated that in Mexico only
33% of the tariff reduction for agricultural products and
27% for manufactures were reflected in domestic prices.
Contrary to Porto (2006), richer households gained more
from trade liberalization in Mexico than poor households.
Ural Marchand (2012) estimates similar pass-through
equations and finds that Indian households experienced
gains at all per capita expenditure levels as a result of trade
liberalization, while the average effect was generally
greater for poor households, and varied significantly
across the per capita expenditure spectrum. The main
novelty of Nicita (2009) and Ural Marchand (2012) was to
estimate the extent to which the impact of trade reforms
The main novelty of Nicita (2009) and Ural Marchand (2012) was to estimate the extent to which the impact of trade reforms on prices differed in rural versus urban areas. Indeed, market imperfections
partially isolate households from the effects of tariff changes, and this isolation is more severe in rural areas.
2322
TRADE AND POVERTY REDUCTION: NEW EVIDENCE OF IMPACTS IN DEVELOPING COUNTRIESTRADE AND POVERTY REDUCTION: NEW EVIDENCE OF IMPACTS IN DEVELOPING COUNTRIES
on prices differed in rural versus urban areas. Indeed,
market imperfections partially isolate households from
the effects of tariff changes, and this isolation is more
severe in rural areas. Ural Marchand (2012) estimates that
the pass-through of tariff reductions to domestic prices
was only around 40% in rural areas, compared to around
66% in urban areas.
Borraz et al. (2013) also find that trade liberalization had
a pro-poor effect in Brazil, as poverty fell and inequality
remained unchanged. This result is mainly explained by
the decrease in consumer prices after Brazil entered
Mercosur, as the net impact on household welfare due to
changes in wages was almost zero.
Finally, Nicita et al. (2014) examines the impact of the
structure of trade protection on income distribution
at the household level in six Sub-Saharan African (SSA)
countries. They find that trade policies in SSA tend
to redistribute income from rich to poor households.
The main novelty of this research is that they present
a method to indirectly estimate wages, which are not
available in many countries.
We extend this literature to the case of Tunisia and take
on board the novelties incorporated by recent studies.
For instance, we take the estimated pass-through from
a companion paper (Baghdadi et al., 2016) and estimate
wage equations and welfare effects along the lines
proposed above. We also estimate different average
welfare effects by region, between rural and urban
households, and by gender. We do not expect to find
substantial differences among regions, since Tunisia is a
small country.
This study is the first investigation of the effects of trade
policy on income distribution in Tunisia. Minot et al. (2010)
are to our knowledge the only authors who estimate
the poverty effects of trade policy in Tunisia for given
scenarios, using a computable general equilibrium model
(CGE) calibrated with household data for 1995. Their main
results indicate that poverty will decline slightly, from
8.1% to 7.6%, if all tariffs on imports from all countries
are eliminated. In contrast, we aim to estimate the effect
of trade policy on the entire distribution of income and
taking into account tariffs.
2322
TRADE AND POVERTY REDUCTION: NEW EVIDENCE OF IMPACTS IN DEVELOPING COUNTRIESTRADE AND POVERTY REDUCTION: NEW EVIDENCE OF IMPACTS IN DEVELOPING COUNTRIES
3. Model specification, data and variables
We apply the methodology proposed in Porto (2006)
to recently available household-level data for Tunisia in
order to assess the effect of trade on income distribution.
The model is used to simulate the effects of trade
policy changes on household wellbeing along the entire
distribution of expenditure per capita by extending the
techniques used in Deaton (1989). The latter provides a
non-parametric, empirical methodology to explore the
impact of small changes in prices following trade reform
on household welfare.
The model focuses on the effect of changes in domestic
prices and wages that could be attributed to changes in
trade policy. A change in a tariff translates into a change
in the border price of traded goods which is passed
through to domestic prices (retail and factor prices) to
a variable extent. The magnitude of the pass-through is
determined by country-specific or region-specific factors,
which in turn influence the extent to which trade policies
can affect domestic prices. These factors are, among
others, domestic policies, institutions, geography, market
competitiveness and infrastructures. In Baghdadi et al.
(2016) we show that market concentration and market
power are also crucial factors affecting pass-through for
different sectors in Tunisia.
Based on our estimate of the pass-through, we calculate
the inverse of so-called “compensating variation,” which
measures how much money households would have to
be given in order to be compensated for hypothetical
changes in prices and can be interpreted as a measure
of the change in welfare. Wages are analysed using
Mincerian equations, which link wages to skills, age
(where typically an inverse U-shaped relationship is
found), regions and gender. We augment this framework
to include trade policy variables interacted with the level
of skill. The econometric methodology adopted in this
chapter is presented in detail in Appendix A.
3.1 Data and variables
The estimation of the impact of trade policy changes on
welfare requires the use of various sources of data and a
number of steps to consolidate and merge the data at the
same level of disaggregation. Moreover, concordances
between the different classifications have to be manually
constructed to match the various datasets.2 The main
sources for the data are national surveys, and trade and
protection statistics from national and international
sources (INS, COMTRADE and WITS).
Expenditure shares along the distribution of income
are obtained from the national survey on household
consumption and expenditures compiled periodically
by the National Institute of Statistics and harmonized
by the Economic Research Forum (ERF), which kindly
provided us with the data. The 2005 survey, used in
this paper, is the eighth of its kind. The survey was
launched in early May 2005 and lasted until the end of
April 2006, to take into account seasonal changes in
household consumption. This survey aims to identify the
current standard of living of families through an accurate
estimation of expenditure and food consumption, and
to compare these findings with those of previous years.
The survey collects information on aspects related to the
expenditures and living conditions of families, such as
their access to education and health services.
The 2005 survey includes a representative sample of
13,400 households, distributed among 1,116 counties
(villages, campaigns and cities) of Tunisia. The survey
consists of three axes: (i) household expenditures, (ii)
nutrition, and (iii) social and collective services. The
household expenditure axis includes the whole sample,
whereas the nutrition axis only includes half the number
of households present in the first axis (6,700 households).
The final axis includes one-third of the household
spending axis (4,450 households).
From this survey we derive information on broad
expenditure shares, educational attainment, literacy,
marital status, household size, educational status of head
and spouse, and industry of occupation for head and
spouse, and other individual characteristics such as age,
household head’s sex and geographic indicators (urban or
rural). Information on years of schooling is not included,
but the information on educational attainment reports
whether respondents have completed primary or lower
2 These industry conversions are available from the authors on request.
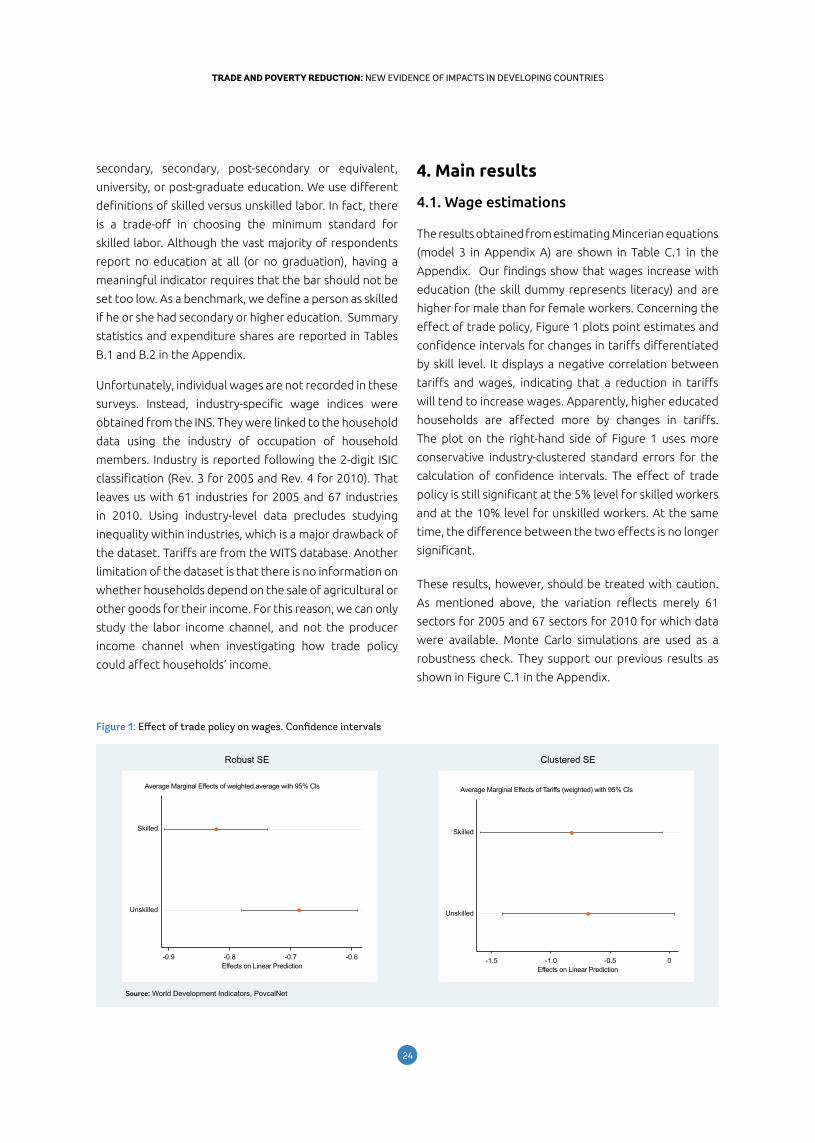
2524
TRADE AND POVERTY REDUCTION: NEW EVIDENCE OF IMPACTS IN DEVELOPING COUNTRIESTRADE AND POVERTY REDUCTION: NEW EVIDENCE OF IMPACTS IN DEVELOPING COUNTRIES
secondary, secondary, post-secondary or equivalent,
university, or post-graduate education. We use different
definitions of skilled versus unskilled labor. In fact, there
is a trade-off in choosing the minimum standard for
skilled labor. Although the vast majority of respondents
report no education at all (or no graduation), having a
meaningful indicator requires that the bar should not be
set too low. As a benchmark, we define a person as skilled
if he or she had secondary or higher education. Summary
statistics and expenditure shares are reported in Tables
B.1 and B.2 in the Appendix.
Unfortunately, individual wages are not recorded in these
surveys. Instead, industry-specific wage indices were
obtained from the INS. They were linked to the household
data using the industry of occupation of household
members. Industry is reported following the 2-digit ISIC
classification (Rev. 3 for 2005 and Rev. 4 for 2010). That
leaves us with 61 industries for 2005 and 67 industries
in 2010. Using industry-level data precludes studying
inequality within industries, which is a major drawback of
the dataset. Tariffs are from the WITS database. Another
limitation of the dataset is that there is no information on
whether households depend on the sale of agricultural or
other goods for their income. For this reason, we can only
study the labor income channel, and not the producer
income channel when investigating how trade policy
could affect households’ income.
4. Main results
4.1. Wage estimations
The results obtained from estimating Mincerian equations
(model 3 in Appendix A) are shown in Table C.1 in the
Appendix. Our findings show that wages increase with
education (the skill dummy represents literacy) and are
higher for male than for female workers. Concerning the
effect of trade policy, Figure 1 plots point estimates and
confidence intervals for changes in tariffs differentiated
by skill level. It displays a negative correlation between
tariffs and wages, indicating that a reduction in tariffs
will tend to increase wages. Apparently, higher educated
households are affected more by changes in tariffs.
The plot on the right-hand side of Figure 1 uses more
conservative industry-clustered standard errors for the
calculation of confidence intervals. The effect of trade
policy is still significant at the 5% level for skilled workers
and at the 10% level for unskilled workers. At the same
time, the difference between the two effects is no longer
significant.
These results, however, should be treated with caution.
As mentioned above, the variation reflects merely 61
sectors for 2005 and 67 sectors for 2010 for which data
were available. Monte Carlo simulations are used as a
robustness check. They support our previous results as
shown in Figure C.1 in the Appendix.
Unskilled
Skilled
Effects on Linear Prediction
Average Marginal Effects of weighted average with 95% Cls
-0.9 -0.8 -0.7 -0.6
Figure 1: Effect of trade policy on wages. Confidence intervals
Source: World Development Indicators, PovcalNet
Unskilled
Skilled
Effects on Linear Prediction
Average Marginal Effects of Tariffs (weighted) with 95% Cls
-1.5 -1.0 -0.5 0
Robust SE Clustered SE
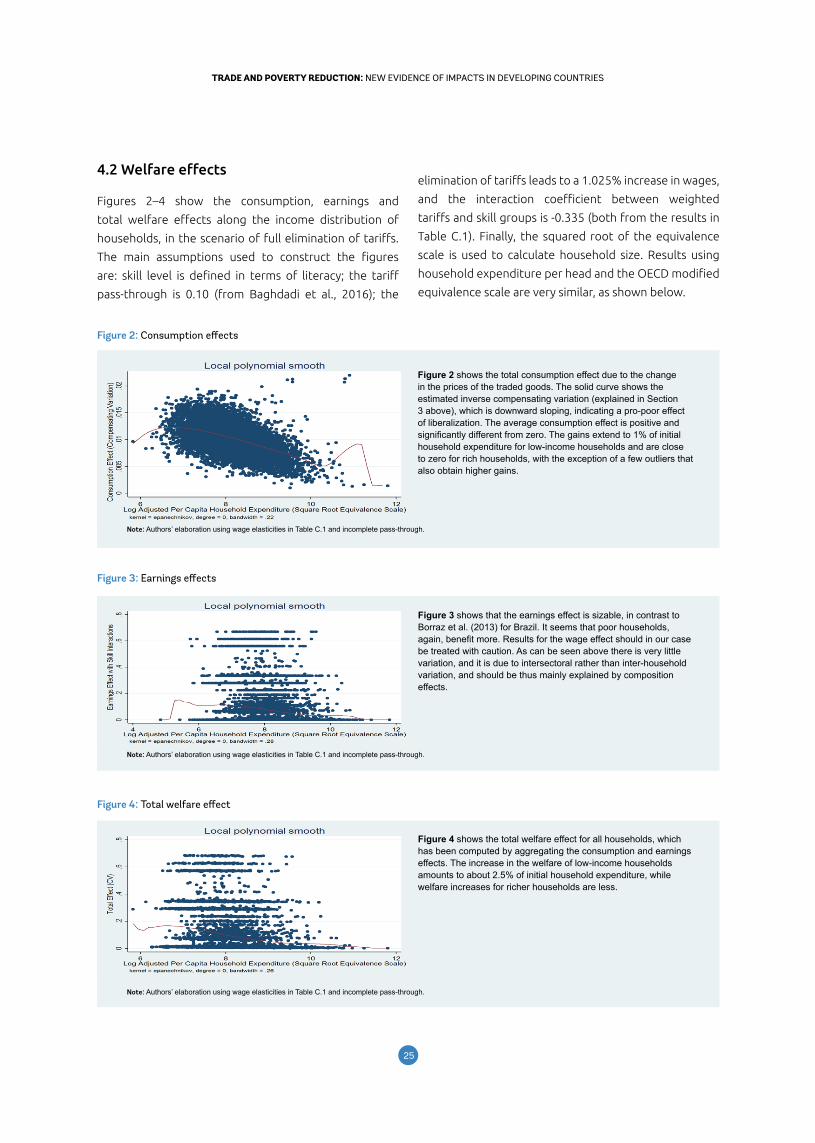
2524
TRADE AND POVERTY REDUCTION: NEW EVIDENCE OF IMPACTS IN DEVELOPING COUNTRIESTRADE AND POVERTY REDUCTION: NEW EVIDENCE OF IMPACTS IN DEVELOPING COUNTRIES
4.2Welfareeffects
Figures 2–4 show the consumption, earnings and
total welfare effects along the income distribution of
households, in the scenario of full elimination of tariffs.
The main assumptions used to construct the figures
are: skill level is defined in terms of literacy; the tariff
pass-through is 0.10 (from Baghdadi et al., 2016); the
elimination of tariffs leads to a 1.025% increase in wages,
and the interaction coefficient between weighted
tariffs and skill groups is -0.335 (both from the results in
Table C.1). Finally, the squared root of the equivalence
scale is used to calculate household size. Results using
household expenditure per head and the OECD modified
equivalence scale are very similar, as shown below.
Figure 2: Consumption effects
Figure 3: Earnings effects
Figure 4: Total welfare effect
Note: Authors’ elaboration using wage elasticities in Table C.1 and incomplete pass-through.
Figure 2 shows the total consumption effect due to the change in the prices of the traded goods. The solid curve shows the estimated inverse compensating variation (explained in Section 3 above), which is downward sloping, indicating a pro-poor effect of liberalization. The average consumption effect is positive and significantly different from zero. The gains extend to 1% of initial household expenditure for low-income households and are close to zero for rich households, with the exception of a few outliers that also obtain higher gains.
Figure 3 shows that the earnings effect is sizable, in contrast to Borraz et al. (2013) for Brazil. It seems that poor households, again, benefit more. Results for the wage effect should in our case be treated with caution. As can be seen above there is very little variation, and it is due to intersectoral rather than inter-household variation, and should be thus mainly explained by composition effects.
Note: Authors’ elaboration using wage elasticities in Table C.1 and incomplete pass-through.
Note: Authors’ elaboration using wage elasticities in Table C.1 and incomplete pass-through.
Figure 4 shows the total welfare effect for all households, which has been computed by aggregating the consumption and earnings effects. The increase in the welfare of low-income households amounts to about 2.5% of initial household expenditure, while welfare increases for richer households are less.
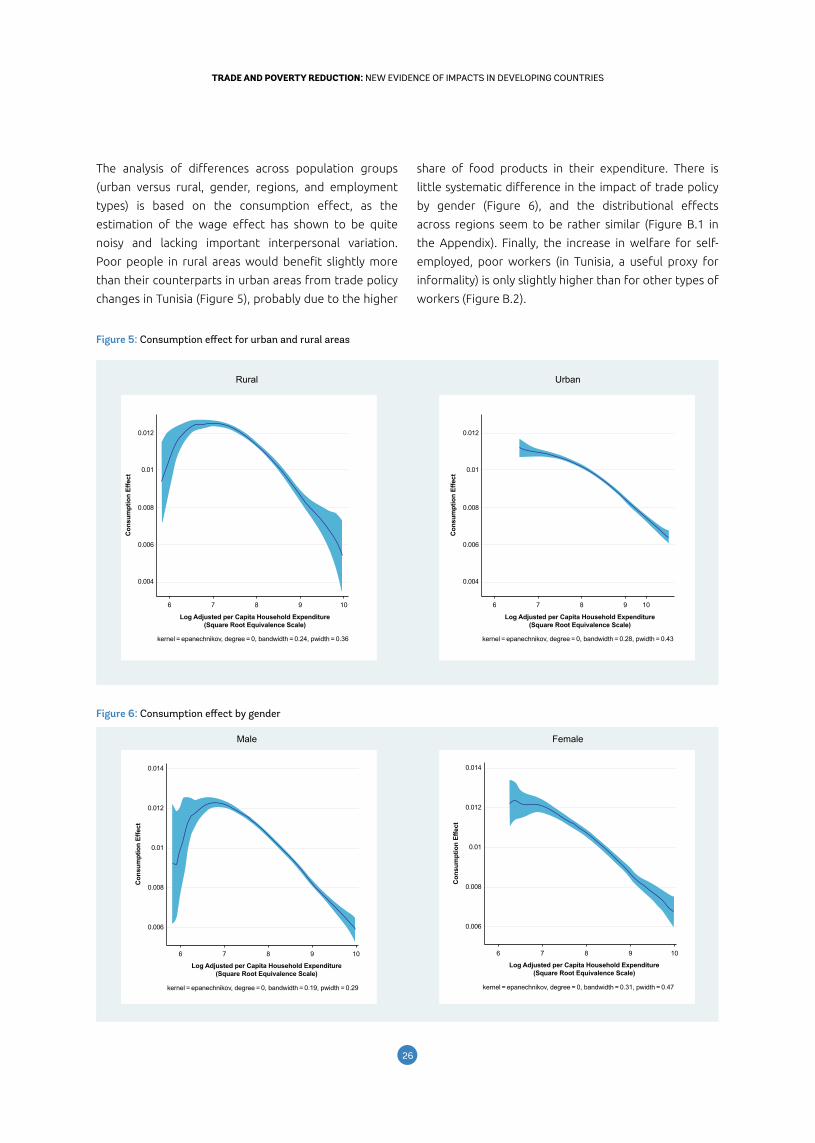
2726
TRADE AND POVERTY REDUCTION: NEW EVIDENCE OF IMPACTS IN DEVELOPING COUNTRIESTRADE AND POVERTY REDUCTION: NEW EVIDENCE OF IMPACTS IN DEVELOPING COUNTRIES
The analysis of differences across population groups
(urban versus rural, gender, regions, and employment
types) is based on the consumption effect, as the
estimation of the wage effect has shown to be quite
noisy and lacking important interpersonal variation.
Poor people in rural areas would benefit slightly more
than their counterparts in urban areas from trade policy
changes in Tunisia (Figure 5), probably due to the higher
0.012
0.01
0.008
0.006
0.004
kernel = epanechnikov, degree = 0, bandwidth = 0.24, pwidth = 0.36
Log Adjusted per Capita Household Expenditure(Square Root Equivalence Scale)
Log Adjusted per Capita Household Expenditure(Square Root Equivalence Scale)
Con
sum
ptio
n Ef
fect
6 7 8 9 10
0.012
0.01
0.008
0.006
0.004
kernel = epanechnikov, degree = 0, bandwidth = 0.28, pwidth = 0.43
Con
sum
ptio
n Ef
fect
6 7 8 9 10
Figure 5: Consumption effect for urban and rural areas
0.012
0.01
0.008
0.006
0.004
kernel = epanechnikov, degree = 0, bandwidth = 0.24, pwidth = 0.36
Log Adjusted per Capita Household Expenditure(Square Root Equivalence Scale)
Log Adjusted per Capita Household Expenditure(Square Root Equivalence Scale)
Con
sum
ptio
n Ef
fect
6 7 8 9 10
0.012
0.01
0.008
0.006
0.004
kernel = epanechnikov, degree = 0, bandwidth = 0.28, pwidth = 0.43
Con
sum
ptio
n Ef
fect
6 7 8 9 10
0.014
0.012
0.01
0.008
0.006
kernel = epanechnikov, degree = 0, bandwidth = 0.19, pwidth = 0.29
Log Adjusted per Capita Household Expenditure(Square Root Equivalence Scale)
Log Adjusted per Capita Household Expenditure(Square Root Equivalence Scale)
Con
sum
ptio
n Ef
fect
6 7 8 9 10
0.014
0.012
0.01
0.008
0.006
kernel = epanechnikov, degree = 0, bandwidth = 0.31, pwidth = 0.47
Con
sum
ptio
n Ef
fect
6 7 8 9 10
Figure 6: Consumption effect by gender
0.014
0.012
0.01
0.008
0.006
kernel = epanechnikov, degree = 0, bandwidth = 0.19, pwidth = 0.29
Log Adjusted per Capita Household Expenditure(Square Root Equivalence Scale)
Log Adjusted per Capita Household Expenditure(Square Root Equivalence Scale)
Con
sum
ptio
n Ef
fect
6 7 8 9 10
0.014
0.012
0.01
0.008
0.006
kernel = epanechnikov, degree = 0, bandwidth = 0.31, pwidth = 0.47
Con
sum
ptio
n Ef
fect
6 7 8 9 10
share of food products in their expenditure. There is
little systematic difference in the impact of trade policy
by gender (Figure 6), and the distributional effects
across regions seem to be rather similar (Figure B.1 in
the Appendix). Finally, the increase in welfare for self-
employed, poor workers (in Tunisia, a useful proxy for
informality) is only slightly higher than for other types of
workers (Figure B.2).
Rural Urban
Male Female
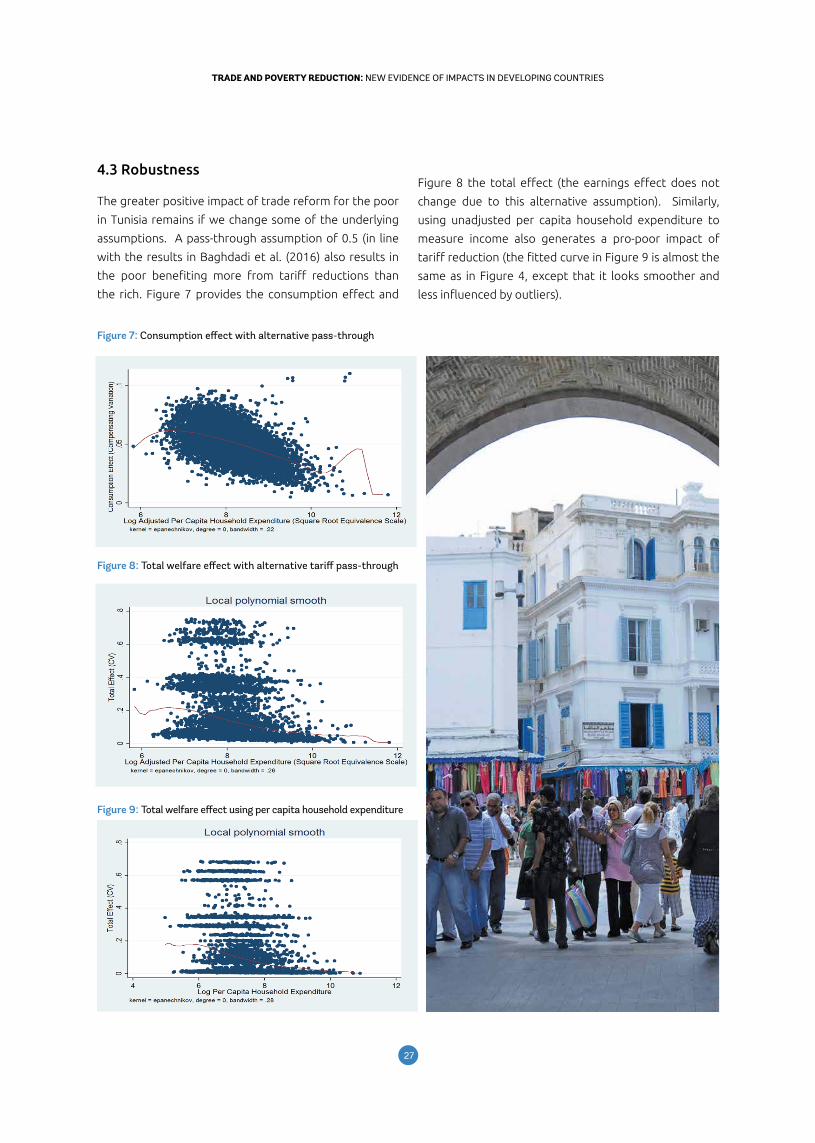
2726
TRADE AND POVERTY REDUCTION: NEW EVIDENCE OF IMPACTS IN DEVELOPING COUNTRIESTRADE AND POVERTY REDUCTION: NEW EVIDENCE OF IMPACTS IN DEVELOPING COUNTRIES
4.3 Robustness
The greater positive impact of trade reform for the poor
in Tunisia remains if we change some of the underlying
assumptions. A pass-through assumption of 0.5 (in line
with the results in Baghdadi et al. (2016) also results in
the poor benefiting more from tariff reductions than
the rich. Figure 7 provides the consumption effect and
Figure 7: Consumption effect with alternative pass-through
Figure 8 the total effect (the earnings effect does not
change due to this alternative assumption). Similarly,
using unadjusted per capita household expenditure to
measure income also generates a pro-poor impact of
tariff reduction (the fitted curve in Figure 9 is almost the
same as in Figure 4, except that it looks smoother and
less influenced by outliers).
Figure 8: Total welfare effect with alternative tariff pass-through
Figure 9: Total welfare effect using per capita household expenditure
2928
TRADE AND POVERTY REDUCTION: NEW EVIDENCE OF IMPACTS IN DEVELOPING COUNTRIESTRADE AND POVERTY REDUCTION: NEW EVIDENCE OF IMPACTS IN DEVELOPING COUNTRIES
In comparison to other studies, the impact of trade reform
on welfare using the estimated 10% pass-through for
Tunisia of around 1% of initial household expenditure, is
similar to the gains found in Borraz et al. (2013) for Brazil,
but lower than the welfare effects found in Ural Marchand
(2012) for India and Porto (2006) for Argentina. However,
when using a pass-through of 50%, the benefits are very
similar—around 6% of initial expenditure—to those
estimated in Porto (2006).3
The main policy conclusion is that trade liberalization in
Tunisia would in fact reduce poverty if it is made through
a reduction of tariff barriers. This result is in line with
the ex-ante analysis conducted by Minot et al. (2010)
(see above). Similar to our findings, they also show that
poverty will decline more in rural than in urban areas.
5. Conclusions
This paper examines how Tunisian households would be
affected by further tariff liberalization. The distributive
impacts from the perspective of both consumers and
workers are considered, as well as the price transmission
mechanism. In particular, the effects of trade
liberalization or, more generally, trade policy reform on
household wellbeing and poverty, are identified and
compared for the analyzed sectors. The overall effect
is decomposed into a consumption and income effect
on wages, and separate results are shown for different
groups of households. We distinguish between rural and
urban households and also show the effects by region, by
gender and by type of employment.
The reduction in the prices of traded goods is found to
improve welfare for all households along the distribution
of income. The increase in welfare due to lower prices
on consumption goods is larger for poor than for rich
households. The welfare increase due to wage effects is
also positive, and greater for poor than for rich workers.
However, wage effects are less accurately estimated than
the consumption gains, because the lack of individual
wage data means we rely on average sectoral wages.
When added to the consumption effect, we find that
the welfare of the poor increases by about 2.5% when
assuming that the tariff pass-through is low (about
10%). This is a conservative estimate, given that the
pass-through could be around 50 to 60%.
A limitation of this study is that the effect of the changes
in the prices of traded goods on the prices of non-traded
goods has been excluded from the analysis. Nevertheless,
these effects are probably small for Tunisia, where non-
traded services are highly regulated and could only
weakly respond to general equilibrium effects. We leave
this issue for further research. Also, the data required to
analyse the income effect on households that sell specific
goods—for instance agricultural—are not available.
Another issue is that this framework only takes static
effects into account. Trade policy could also change the
production structure of the economy, and this in turn
could have an effect on welfare.
Summarizing, the findings suggest that trade
liberalization in Tunisia could have a net positive welfare
effect on households and that the benefit is higher for
poorer households. However, the magnitude of these
effects is estimated to be small in economic terms.
3 Porto (2006) assumed complete pass-through.
Summarizing, the findings suggest that trade liberalization in Tunisia could have a net positive welfare effect on households and that the benefit is higher for poorer households. However,
the magnitude of these effects is estimated to be small in economic terms.
2928
TRADE AND POVERTY REDUCTION: NEW EVIDENCE OF IMPACTS IN DEVELOPING COUNTRIESTRADE AND POVERTY REDUCTION: NEW EVIDENCE OF IMPACTS IN DEVELOPING COUNTRIES
Baghdadi, L., H. Kruse and I. Martinez-Zarzoso, (2016). “Trade policy without trade facilitation: Lessons from tariff pass-through in Tunisia.” In: Teh, R., M. Smeets, M. Sandi Jallab and F. Chaudri (eds.), Trade cost and inclusive growth. Case studies presented by WTO chair-holders. World Trade Organization.
Borraz, F., D. Ferrés and M. Rossi (2013). “Assessment of the Distributive Impact of National Trade Reforms in Brazil,” Journal of Economic Inequality 11, 215-235.
Deaton, A. (1989). “Rice prices and income distribution in Thailand: a non-parametric analysis.” Economic Journal 99, 1–37.
Doyle, E. and I. Martinez-Zarzoso (2011). “Productivity and Trade and Institutional Quality: A Panel Analysis.” Southern Economic Journal 77 (3), 726-752.
Fan, J. (1992). “Design-adaptive nonparametric regression.” Journal of the American Statistical Association 87 (420), 998–1004.
Feenstra, R. and G.H. Hanson (2003). “Global Production Sharing and Rising Inequality: A Survey on Trade and Wages”, in: E. Kwan Choi and J. Harrigan (eds.), Handbook of International Trade, Oxford: Blackwell.
Goldberg, P. and M. Knetter (1997). “Good prices and exchange rates: what have we learned?”, Journal of Economic Literature 35, 1243–1272.
Heckman, J.J., L.J. Lochner and P.E. Todd (2003). “Fifty Years of Mincer Earnings Regressions,” NBER Working Paper 9732.
Mincer, J. (1958). “Investment in Human Capital and Personal Income Distribution,”Journal of Political Economy 66(4), 281-302.
Minot, N., M.A. Chemingui, M.Thomas, R. Dewina and D. Orden (2010). “Trade Liberalization and Poverty in the Middle East and North Africa,” IFPRI Research Monograph, Washington D.C.
Nicita, A. (2009). “The price effect of tariff liberalization: Measuring the impact on household welfare,” Journal of Development Economics 89: 19-27.
Nicita, A., M. Olarreaga and G. Porto (2014). “Pro-poor trade policy in Sub-Saharan Africa,” Journal of International Economics 92(2), 252-265.
Porto, G. G. (2006). “Using survey data to assess the distributional effects of trade policy,” Journal of International Economics 70(1): 140-160.
Ural Marchand, B. P. (2012). “Tariff Pass-Through and the Effect of Trade Liberalization on Household Welfare.” Journal of Development Economics 99 (2), 265-281.
World Bank Group and World Trade Organization (2015). The Role of Trade in Ending Poverty. World Trade Organization: Geneva.
World Bank (2016). Tunisia Poverty Assessment 2015. World Bank, Washington, DC. © World Bank. https://openknowledge.worldbank.org/handle/10986/24410 License: CC BY 3.0 IGO.
World Trade Organization (2005). Trade Policy Review: Tunisia. WTO Secretariat, Geneva.
References
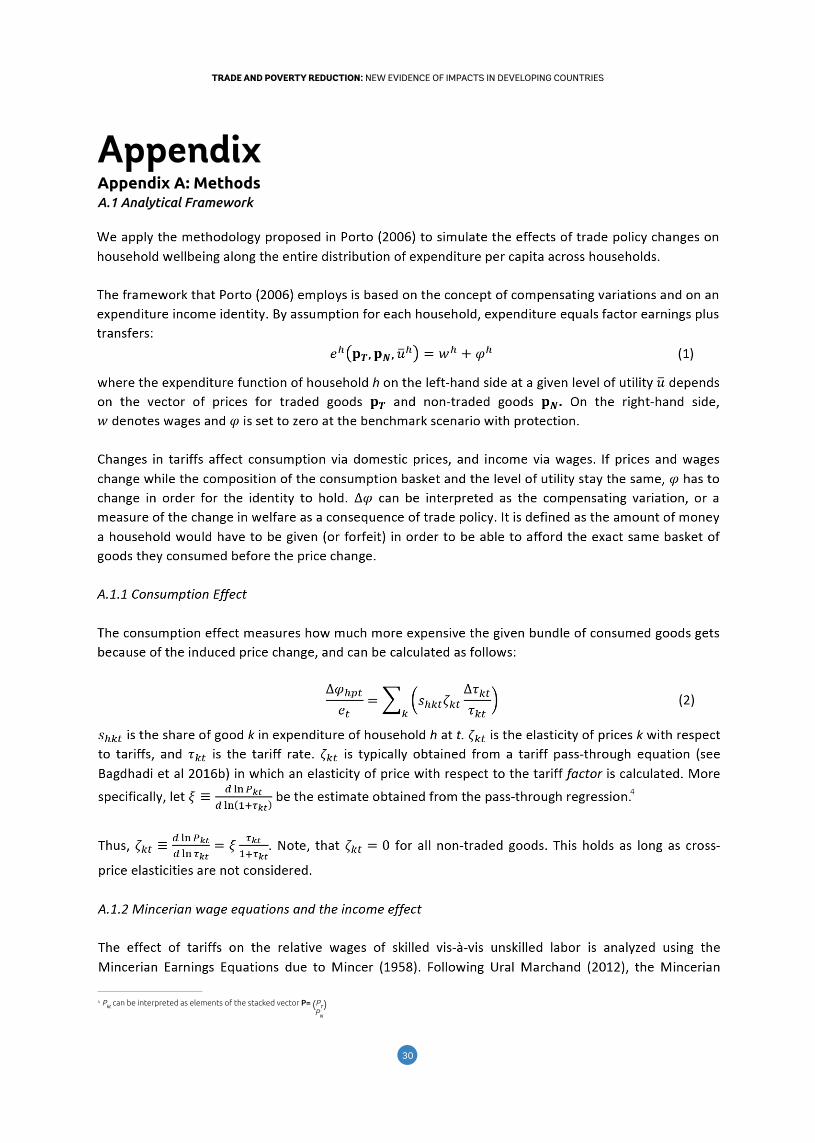
3130
TRADE AND POVERTY REDUCTION: NEW EVIDENCE OF IMPACTS IN DEVELOPING COUNTRIESTRADE AND POVERTY REDUCTION: NEW EVIDENCE OF IMPACTS IN DEVELOPING COUNTRIES
Appendix
4 Pkt can be interpreted as elements of the stacked vector P= (PT ) PN
Appendix A: MethodsA.1 Analytical Framework
4
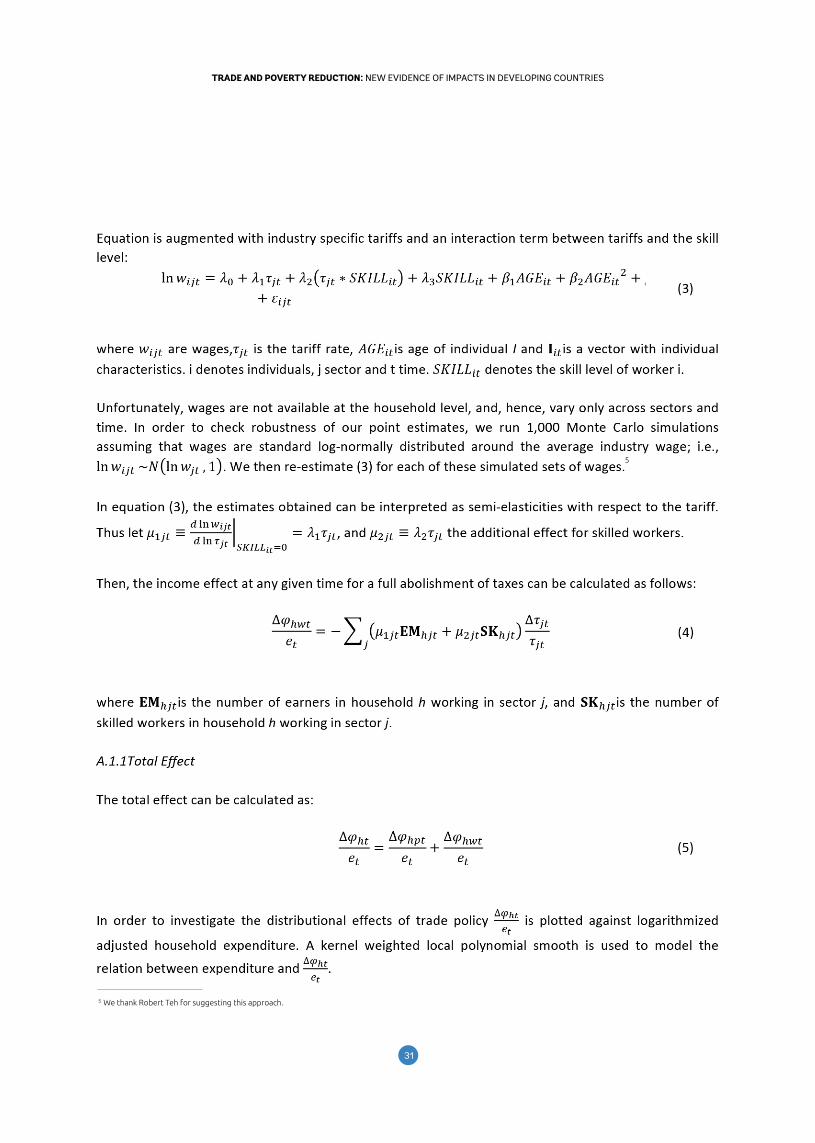
3130
TRADE AND POVERTY REDUCTION: NEW EVIDENCE OF IMPACTS IN DEVELOPING COUNTRIESTRADE AND POVERTY REDUCTION: NEW EVIDENCE OF IMPACTS IN DEVELOPING COUNTRIES
5
5 We thank Robert Teh for suggesting this approach.
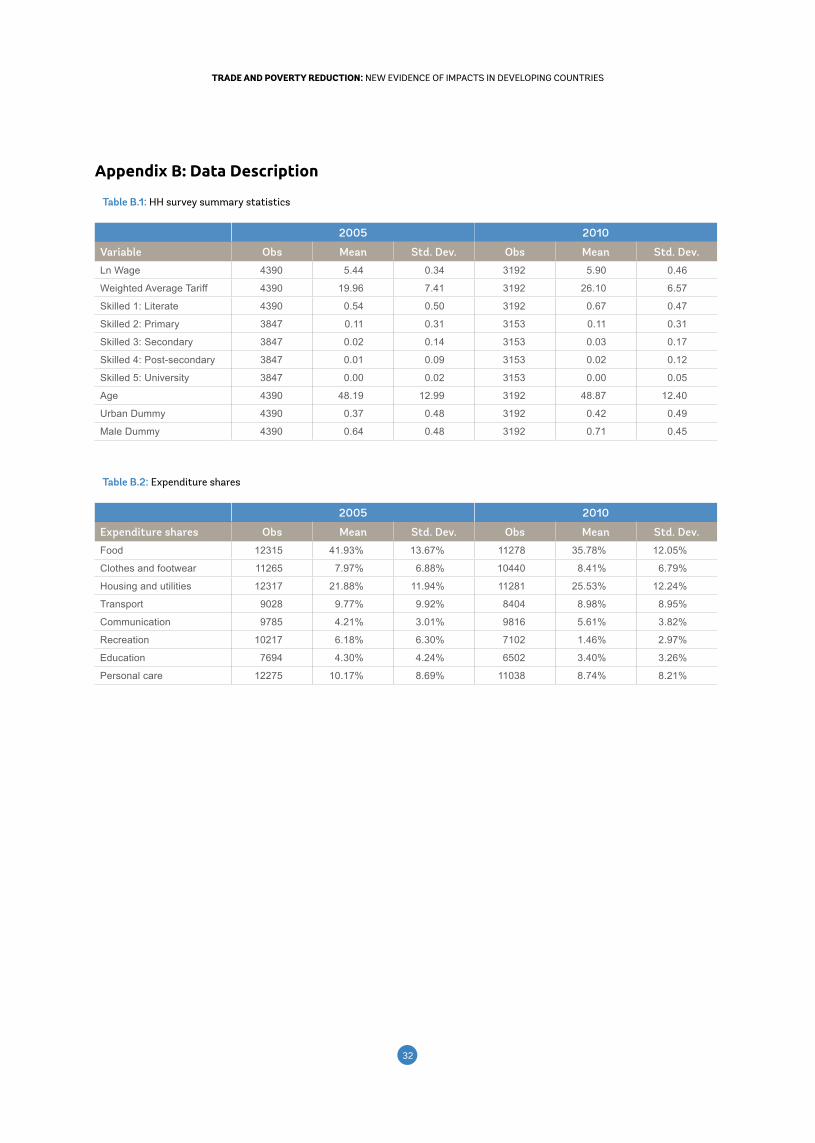
3332
TRADE AND POVERTY REDUCTION: NEW EVIDENCE OF IMPACTS IN DEVELOPING COUNTRIESTRADE AND POVERTY REDUCTION: NEW EVIDENCE OF IMPACTS IN DEVELOPING COUNTRIES
Table B.2: Expenditure shares
2005 2010
Expenditure shares Obs Mean Std. Dev. Obs Mean Std. Dev.Food 12315 41.93% 13.67% 11278 35.78% 12.05%
Clothes and footwear 11265 7.97% 6.88% 10440 8.41% 6.79%
Housing and utilities 12317 21.88% 11.94% 11281 25.53% 12.24%
Transport 9028 9.77% 9.92% 8404 8.98% 8.95%
Communication 9785 4.21% 3.01% 9816 5.61% 3.82%
Recreation 10217 6.18% 6.30% 7102 1.46% 2.97%
Education 7694 4.30% 4.24% 6502 3.40% 3.26%
Personal care 12275 10.17% 8.69% 11038 8.74% 8.21%
Table B.1: HH survey summary statistics
2005 2010
Variable Obs Mean Std. Dev. Obs Mean Std. Dev.Ln Wage 4390 5.44 0.34 3192 5.90 0.46
Weighted Average Tariff 4390 19.96 7.41 3192 26.10 6.57
Skilled 1: Literate 4390 0.54 0.50 3192 0.67 0.47
Skilled 2: Primary 3847 0.11 0.31 3153 0.11 0.31
Skilled 3: Secondary 3847 0.02 0.14 3153 0.03 0.17
Skilled 4: Post-secondary 3847 0.01 0.09 3153 0.02 0.12
Skilled 5: University 3847 0.00 0.02 3153 0.00 0.05
Age 4390 48.19 12.99 3192 48.87 12.40
Urban Dummy 4390 0.37 0.48 3192 0.42 0.49
Male Dummy 4390 0.64 0.48 3192 0.71 0.45
Appendix B: Data Description
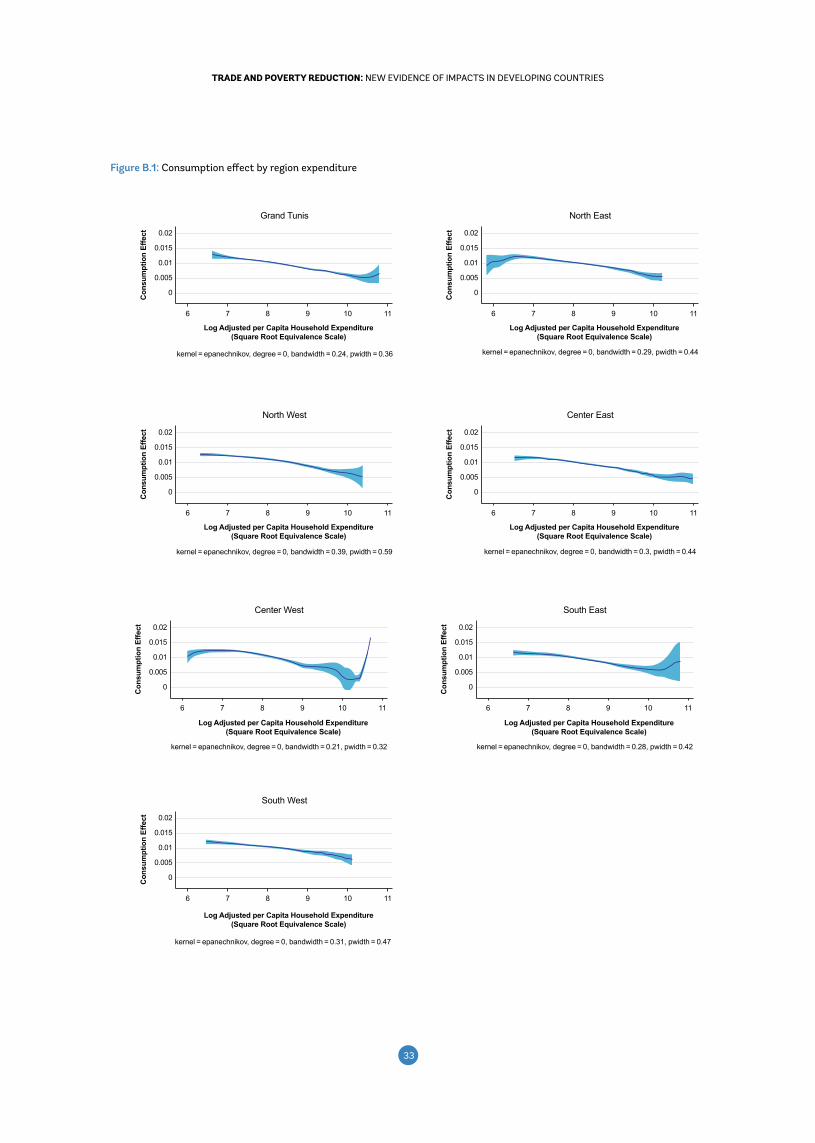
3332
TRADE AND POVERTY REDUCTION: NEW EVIDENCE OF IMPACTS IN DEVELOPING COUNTRIESTRADE AND POVERTY REDUCTION: NEW EVIDENCE OF IMPACTS IN DEVELOPING COUNTRIES
Figure B.1: Consumption effect by region expenditure
0.015
0.02
0.01
0.005
0
kernel = epanechnikov, degree = 0, bandwidth = 0.24, pwidth = 0.36
Log Adjusted per Capita Household Expenditure(Square Root Equivalence Scale)
Con
sum
ptio
n Ef
fect
Grand Tunis
6 7 8 9 10 11
0.015
0.02
0.01
0.005
0
kernel = epanechnikov, degree = 0, bandwidth = 0.29, pwidth = 0.44
Log Adjusted per Capita Household Expenditure(Square Root Equivalence Scale)
Con
sum
ptio
n Ef
fect
North East
6 7 8 9 10 11
0.015
0.02
0.01
0.005
0
kernel = epanechnikov, degree = 0, bandwidth = 0.39, pwidth = 0.59
Log Adjusted per Capita Household Expenditure(Square Root Equivalence Scale)
Con
sum
ptio
n Ef
fect
North West
6 7 8 9 10 11
0.015
0.02
0.01
0.005
0
kernel = epanechnikov, degree = 0, bandwidth = 0.3, pwidth = 0.44
Log Adjusted per Capita Household Expenditure(Square Root Equivalence Scale)
Con
sum
ptio
n Ef
fect
Center East
6 7 8 9 10 11
0.015
0.02
0.01
0.005
0
kernel = epanechnikov, degree = 0, bandwidth = 0.21, pwidth = 0.32
Log Adjusted per Capita Household Expenditure(Square Root Equivalence Scale)
Con
sum
ptio
n Ef
fect
Center West
6 7 8 9 10 11
0.015
0.02
0.01
0.005
0
kernel = epanechnikov, degree = 0, bandwidth = 0.28, pwidth = 0.42
Log Adjusted per Capita Household Expenditure(Square Root Equivalence Scale)
Con
sum
ptio
n Ef
fect
South East
6 7 8 9 10 11
0.015
0.02
0.01
0.005
0
kernel = epanechnikov, degree = 0, bandwidth = 0.31, pwidth = 0.47
Log Adjusted per Capita Household Expenditure(Square Root Equivalence Scale)
Con
sum
ptio
n Ef
fect
South West
6 7 8 9 10 11
0.015
0.02
0.01
0.005
0
kernel = epanechnikov, degree = 0, bandwidth = 0.24, pwidth = 0.36
Log Adjusted per Capita Household Expenditure(Square Root Equivalence Scale)
Con
sum
ptio
n Ef
fect
Grand Tunis
6 7 8 9 10 11
0.015
0.02
0.01
0.005
0
kernel = epanechnikov, degree = 0, bandwidth = 0.29, pwidth = 0.44
Log Adjusted per Capita Household Expenditure(Square Root Equivalence Scale)
Con
sum
ptio
n Ef
fect
North East
6 7 8 9 10 11
0.015
0.02
0.01
0.005
0
kernel = epanechnikov, degree = 0, bandwidth = 0.39, pwidth = 0.59
Log Adjusted per Capita Household Expenditure(Square Root Equivalence Scale)
Con
sum
ptio
n Ef
fect
North West
6 7 8 9 10 11
0.015
0.02
0.01
0.005
0
kernel = epanechnikov, degree = 0, bandwidth = 0.3, pwidth = 0.44
Log Adjusted per Capita Household Expenditure(Square Root Equivalence Scale)
Con
sum
ptio
n Ef
fect
Center East
6 7 8 9 10 11
0.015
0.02
0.01
0.005
0
kernel = epanechnikov, degree = 0, bandwidth = 0.21, pwidth = 0.32
Log Adjusted per Capita Household Expenditure(Square Root Equivalence Scale)
Con
sum
ptio
n Ef
fect
Center West
6 7 8 9 10 11
0.015
0.02
0.01
0.005
0
kernel = epanechnikov, degree = 0, bandwidth = 0.28, pwidth = 0.42
Log Adjusted per Capita Household Expenditure(Square Root Equivalence Scale)
Con
sum
ptio
n Ef
fect
South East
6 7 8 9 10 11
0.015
0.02
0.01
0.005
0
kernel = epanechnikov, degree = 0, bandwidth = 0.31, pwidth = 0.47
Log Adjusted per Capita Household Expenditure(Square Root Equivalence Scale)
Con
sum
ptio
n Ef
fect
South West
6 7 8 9 10 11
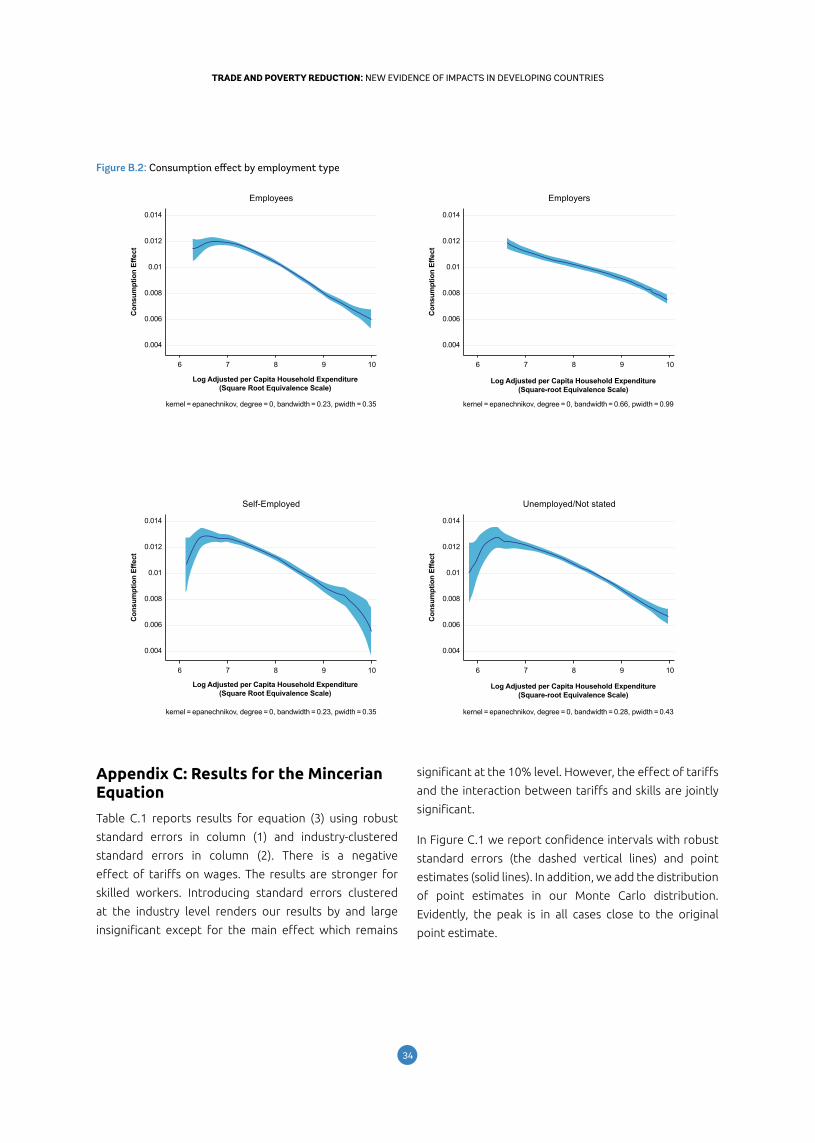
3534
TRADE AND POVERTY REDUCTION: NEW EVIDENCE OF IMPACTS IN DEVELOPING COUNTRIESTRADE AND POVERTY REDUCTION: NEW EVIDENCE OF IMPACTS IN DEVELOPING COUNTRIES
0.014
0.012
0.01
0.008
0.006
0.004
kernel = epanechnikov, degree = 0, bandwidth = 0.23, pwidth = 0.35
Log Adjusted per Capita Household Expenditure(Square Root Equivalence Scale)
Con
sum
ptio
n Ef
fect
Employees
6 7 8 9 10
0.014
0.012
0.01
0.008
0.006
0.004
kernel = epanechnikov, degree = 0, bandwidth = 0.66, pwidth = 0.99
Log Adjusted per Capita Household Expenditure(Square-root Equivalence Scale)
Con
sum
ptio
n Ef
fect
Employers
6 7 8 9 10
0.014
0.012
0.01
0.008
0.006
0.004
kernel = epanechnikov, degree = 0, bandwidth = 0.23, pwidth = 0.35
Log Adjusted per Capita Household Expenditure(Square Root Equivalence Scale)
Con
sum
ptio
n Ef
fect
Self-Employed
6 7 8 9 10
0.014
0.012
0.01
0.008
0.006
0.004
kernel = epanechnikov, degree = 0, bandwidth = 0.28, pwidth = 0.43
Log Adjusted per Capita Household Expenditure(Square-root Equivalence Scale)
Con
sum
ptio
n Ef
fect
Unemployed/Not stated
6 7 8 9 10
Appendix C: Results for the Mincerian Equation
Table C.1 reports results for equation (3) using robust
standard errors in column (1) and industry-clustered
standard errors in column (2). There is a negative
effect of tariffs on wages. The results are stronger for
skilled workers. Introducing standard errors clustered
at the industry level renders our results by and large
insignificant except for the main effect which remains
Figure B.2: Consumption effect by employment type
0.014
0.012
0.01
0.008
0.006
0.004
kernel = epanechnikov, degree = 0, bandwidth = 0.23, pwidth = 0.35
Log Adjusted per Capita Household Expenditure(Square Root Equivalence Scale)
Con
sum
ptio
n Ef
fect
Employees
6 7 8 9 10
0.014
0.012
0.01
0.008
0.006
0.004
kernel = epanechnikov, degree = 0, bandwidth = 0.66, pwidth = 0.99
Log Adjusted per Capita Household Expenditure(Square-root Equivalence Scale)
Con
sum
ptio
n Ef
fect
Employers
6 7 8 9 10
0.014
0.012
0.01
0.008
0.006
0.004
kernel = epanechnikov, degree = 0, bandwidth = 0.23, pwidth = 0.35
Log Adjusted per Capita Household Expenditure(Square Root Equivalence Scale)
Con
sum
ptio
n Ef
fect
Self-Employed
6 7 8 9 10
0.014
0.012
0.01
0.008
0.006
0.004
kernel = epanechnikov, degree = 0, bandwidth = 0.28, pwidth = 0.43
Log Adjusted per Capita Household Expenditure(Square-root Equivalence Scale)
Con
sum
ptio
n Ef
fect
Unemployed/Not stated
6 7 8 9 10
significant at the 10% level. However, the effect of tariffs
and the interaction between tariffs and skills are jointly
significant.
In Figure C.1 we report confidence intervals with robust
standard errors (the dashed vertical lines) and point
estimates (solid lines). In addition, we add the distribution
of point estimates in our Monte Carlo distribution.
Evidently, the peak is in all cases close to the original
point estimate.
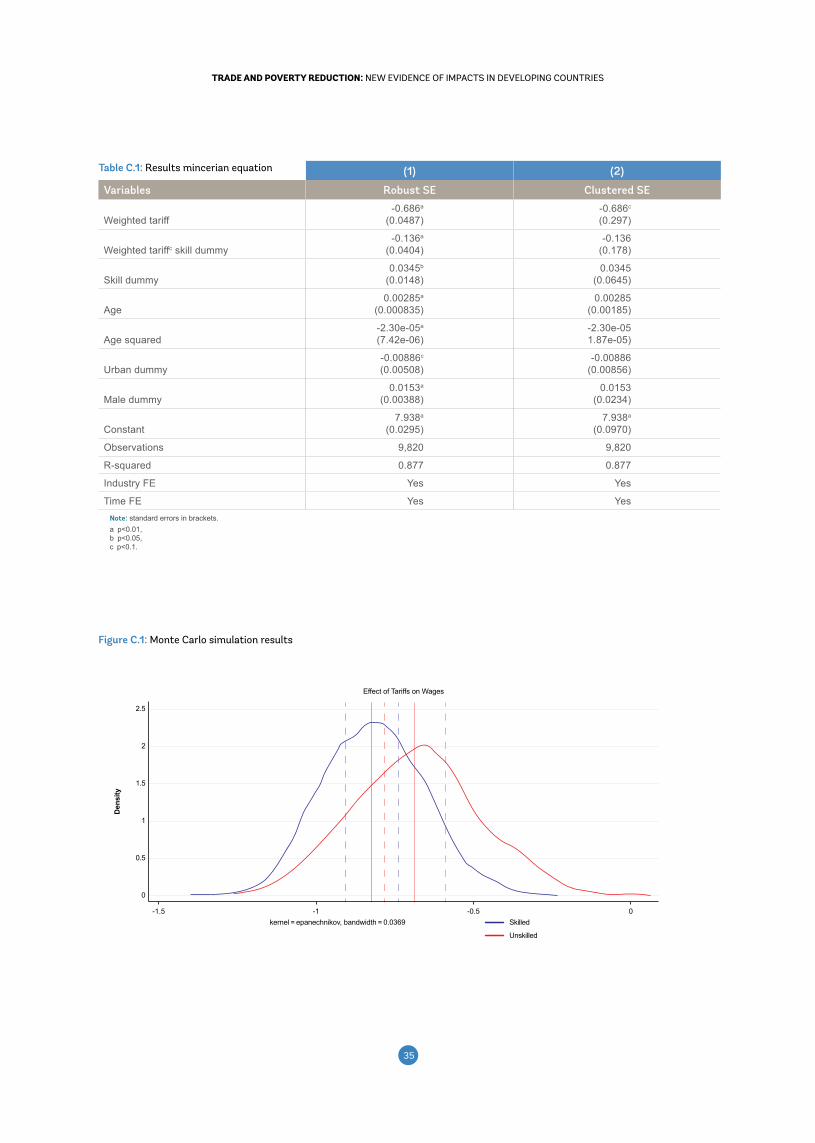
3534
TRADE AND POVERTY REDUCTION: NEW EVIDENCE OF IMPACTS IN DEVELOPING COUNTRIESTRADE AND POVERTY REDUCTION: NEW EVIDENCE OF IMPACTS IN DEVELOPING COUNTRIES
(1) (2)
Variables Robust SE Clustered SE
Weighted tariff -0.686a
(0.0487)-0.686c
(0.297)
Weighted tariffc skill dummy-0.136a
(0.0404)-0.136
(0.178)
Skill dummy0.0345b
(0.0148)0.0345
(0.0645)
Age0.00285a
(0.000835)0.00285
(0.00185)
Age squared-2.30e-05a
(7.42e-06)-2.30e-051.87e-05)
Urban dummy-0.00886c
(0.00508)-0.00886
(0.00856)
Male dummy0.0153a
(0.00388)0.0153
(0.0234)
Constant7.938a
(0.0295)7.938a
(0.0970)
Observations 9,820 9,820
R-squared 0.877 0.877
Industry FE Yes Yes
Time FE Yes YesNote: standard errors in brackets. a p<0.01, b p<0.05, c p<0.1.
Figure C.1: Monte Carlo simulation results
2
2.5
1.5
1
0.5
0
Den
sity
Effect of Tariffs on Wages
-1.5 -1 -0.5 0kernel = epanechnikov, bandwidth = 0.0369 Skilled
Unskilled
Table C.1: Results mincerian equation
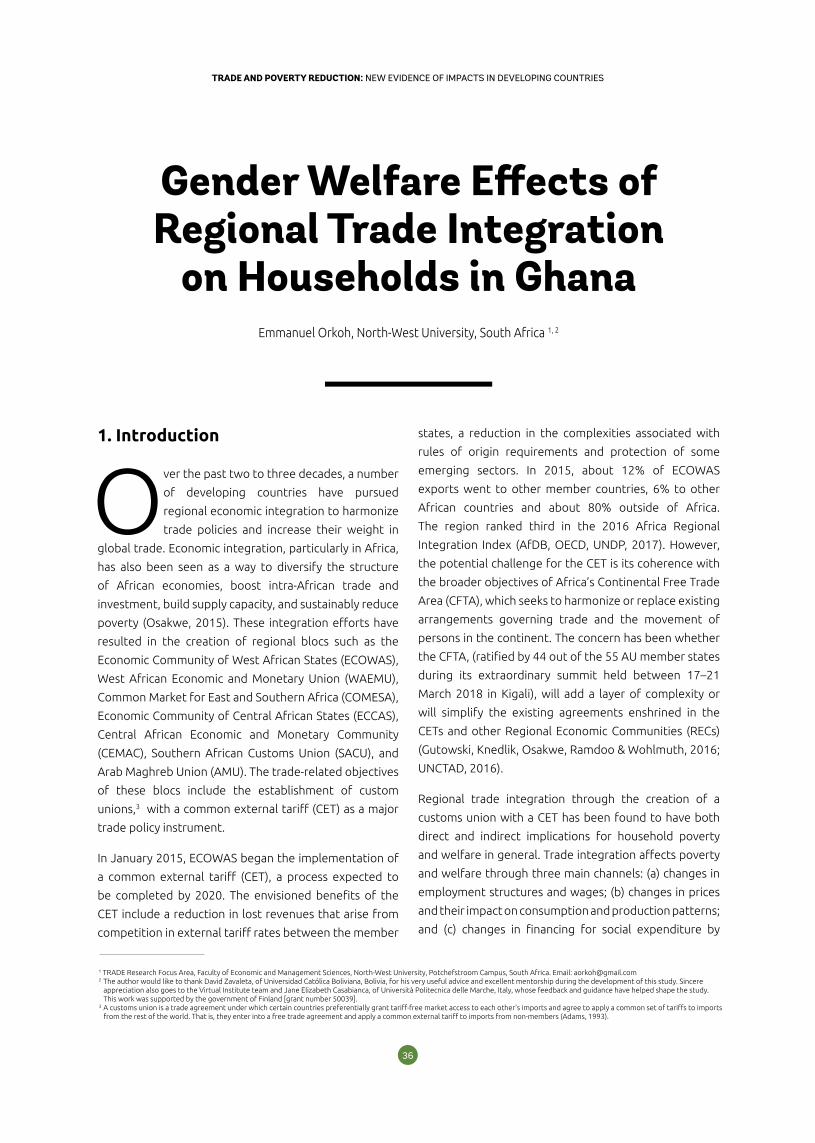
3736
TRADE AND POVERTY REDUCTION: NEW EVIDENCE OF IMPACTS IN DEVELOPING COUNTRIESTRADE AND POVERTY REDUCTION: NEW EVIDENCE OF IMPACTS IN DEVELOPING COUNTRIES
Gender Welfare Effects of Regional Trade Integration
on Households in Ghana
1. Introduction
Over the past two to three decades, a number
of developing countries have pursued
regional economic integration to harmonize
trade policies and increase their weight in
global trade. Economic integration, particularly in Africa,
has also been seen as a way to diversify the structure
of African economies, boost intra-African trade and
investment, build supply capacity, and sustainably reduce
poverty (Osakwe, 2015). These integration efforts have
resulted in the creation of regional blocs such as the
Economic Community of West African States (ECOWAS),
West African Economic and Monetary Union (WAEMU),
Common Market for East and Southern Africa (COMESA),
Economic Community of Central African States (ECCAS),
Central African Economic and Monetary Community
(CEMAC), Southern African Customs Union (SACU), and
Arab Maghreb Union (AMU). The trade-related objectives
of these blocs include the establishment of custom
unions,3 with a common external tariff (CET) as a major
trade policy instrument.
In January 2015, ECOWAS began the implementation of
a common external tariff (CET), a process expected to
be completed by 2020. The envisioned benefits of the
CET include a reduction in lost revenues that arise from
competition in external tariff rates between the member
Emmanuel Orkoh, North-West University, South Africa 1, 2
1 TRADE Research Focus Area, Faculty of Economic and Management Sciences, North-West University, Potchefstroom Campus, South Africa. Email: [email protected] The author would like to thank David Zavaleta, of Universidad Católica Boliviana, Bolivia, for his very useful advice and excellent mentorship during the development of this study. Sincere
appreciation also goes to the Virtual Institute team and Jane Elizabeth Casabianca, of Università Politecnica delle Marche, Italy, whose feedback and guidance have helped shape the study. This work was supported by the government of Finland [grant number 50039].
3 A customs union is a trade agreement under which certain countries preferentially grant tariff-free market access to each other’s imports and agree to apply a common set of tariffs to imports from the rest of the world. That is, they enter into a free trade agreement and apply a common external tariff to imports from non-members (Adams, 1993).
states, a reduction in the complexities associated with
rules of origin requirements and protection of some
emerging sectors. In 2015, about 12% of ECOWAS
exports went to other member countries, 6% to other
African countries and about 80% outside of Africa.
The region ranked third in the 2016 Africa Regional
Integration Index (AfDB, OECD, UNDP, 2017). However,
the potential challenge for the CET is its coherence with
the broader objectives of Africa’s Continental Free Trade
Area (CFTA), which seeks to harmonize or replace existing
arrangements governing trade and the movement of
persons in the continent. The concern has been whether
the CFTA, (ratified by 44 out of the 55 AU member states
during its extraordinary summit held between 17–21
March 2018 in Kigali), will add a layer of complexity or
will simplify the existing agreements enshrined in the
CETs and other Regional Economic Communities (RECs)
(Gutowski, Knedlik, Osakwe, Ramdoo & Wohlmuth, 2016;
UNCTAD, 2016).
Regional trade integration through the creation of a
customs union with a CET has been found to have both
direct and indirect implications for household poverty
and welfare in general. Trade integration affects poverty
and welfare through three main channels: (a) changes in
employment structures and wages; (b) changes in prices
and their impact on consumption and production patterns;
and (c) changes in financing for social expenditure by
3736
TRADE AND POVERTY REDUCTION: NEW EVIDENCE OF IMPACTS IN DEVELOPING COUNTRIESTRADE AND POVERTY REDUCTION: NEW EVIDENCE OF IMPACTS IN DEVELOPING COUNTRIES
Gender Welfare Effects of Regional Trade Integration
on Households in GhanaEmmanuel Orkoh, North-West University, South Africa 1, 2
governments (Winters et al., 2004; Harrison and Tang,
2005). Trade reforms can also affect poverty indirectly
via economic growth. Increased trade openness resulting
from trade reforms can improve access to technology
and hence foster productivity growth, leading to faster
economic growth and reduced poverty (UNCTAD, 2010).
Conversely, increased trade restrictions can impede
productivity growth and slow economic growth, leading
to increased poverty.
Among the various channels of effects, this study analyses
the price channel. The focus on this channel is due to the
fact that most often trade policies such as a CET affect
import tariffs and thus domestic prices of commodities,
which in turn affect the consumption and production
4 According to Article 3.2(d) of the revised ECOWAS treaty, one of the aims of ECOWAS is “the establishment of a common market through: (i) the liberalization of trade by the abolition, among Member States, of customs duties levied on imports and exports, and the abolition, among Member States, of non-tariff barriers in order to establish a free trade area at the Community level; (ii) the adoption of a common external tariff and a common trade policy vis-à-vis third countries; and (iii) the removal, between Member States, of obstacles to the free movement of persons, goods, service and capital, and to the right of residence and establishment.” (see http://www.courtecowas.org/site2012/pdf_files/revised_treaty.pdf#page=4&zoom=auto,-82,12). The member countries of ECOWAS are Benin, Burkina Faso, Cape Verde, Côte d’Ivoire, the Gambia, Ghana, Guinea, Guinea-Bissau, Liberia, Mali, Niger, Nigeria, Sierra Leone, Senegal, and Togo.
decisions of households (Marchand, 2012; Nicita, 2009).
We can therefore consider the price channel as the
mechanism that affects households more directly in the
short term.
Between 2007 and 2015, Ghana alternated between
its own tariff system and the CET of the regional
economic bloc of which it was a member at a given time.
From 2007 to 2011, the country implemented its own
tariffs, but in 2012 it adopted the WAEMU CET, before
switching back to its own tariff system in 2013 and
finally adopting the ECOWAS CET starting in 2015. This
followed negotiations by ECOWAS members in Dakar,
Senegal, on the CET for the region, which concluded in
October 2013 (Roquefeuil et al., 2014).4
3938
TRADE AND POVERTY REDUCTION: NEW EVIDENCE OF IMPACTS IN DEVELOPING COUNTRIESTRADE AND POVERTY REDUCTION: NEW EVIDENCE OF IMPACTS IN DEVELOPING COUNTRIES
Ghana’s implementation of the ECOWAS CET will result
in significant changes in the country’s tariff structure
for both agricultural and non-agricultural products
(World Bank Group, 2015). Some of the tariff rates will
be lower and some will be higher as a result of the CET.
For instance, implementation of the CET will reduce the
number of commodities admitted under zero percent
tariff rates from 725 to 85, but increase the number of
commodities admitted under the 5% band from 375 to
2,146. The changes in tariffs related to implementation of
the CET will affect prices and, consequently, the welfare
of households, depending on their position as either net
producers or consumers of these products.
Given the different roles of men and women in society
and the economy, trade policies such as those enshrined
in the ECOWAS CET have different implications for male-
and female-headed households. This assertion has been
widely supported by findings of several trade-gender
specific studies. For instance, Bird (2004) emphasizes
that changes associated with trade integration may be
positive or negative for women and men depending
on their individual characteristics, including education
and skills, marital status, family size, social group
characteristics such as whether the household is a net
producer or a net consumer of goods whose prices have
changed, urban/rural location, and economic and social
status. In the Ghanaian context, the extent to which this
assertion holds remains an important policy question,
especially in the wake of the country’s recent adoption
and implementation of the ECOWAS CET.
The aim of this study is to measure the effects that
implementation of the CET will have on household
poverty, income, and consumption through the price
channel, with a special focus on gender. A review of the
literature reveals that even though some ex-ante studies
of this nature on Ghana have looked at the poverty and
income effects of trade liberalization (Bhasin and Annim,
2005; Bhasin, 2012), no study has focused on the impact
The aim of this study is to measure the effects that implementation of the CET will have on household poverty, income, and consumption through the price channel, with a special focus on gender.
3938
TRADE AND POVERTY REDUCTION: NEW EVIDENCE OF IMPACTS IN DEVELOPING COUNTRIESTRADE AND POVERTY REDUCTION: NEW EVIDENCE OF IMPACTS IN DEVELOPING COUNTRIES
of the different ECOWAS CET bands on household
welfare and the gender dimensions of this impact. The
aim of this study is to fill these gaps and contribute to
the existing literature on the links between international
trade policy and household welfare.
To assess the implications of the CET, the study applies
a top-down approach by combining a macro computable
general equilibrium (CGE) (top-down) model and a micro
(bottom-up) household model, with the latter using data
at the household level (Bourguignon and Savard, 2008).
Section 2 provides an overview of the evolution of Ghana’s
tariffs and poverty over the years. Section 3 explains the
methodology and Section 4 the data used in the study,
while Section 5 describes the simulations and presents
the results. The final section provides conclusions.
It is hoped that the findings of this study may serve as
input to policy makers and industry in formulating gender-
aware policies to ensure that all population segments and
household categories share appropriately in the gains
and losses associated with the country’s adoption of the
CET. More broadly, it is hoped that the study may help
policy makers in formulating policies to enhance gender
equality and promote human development.
2. Overview of Ghana’s trade reforms and poverty trends
Ghana’s trade policy evolved from being fairly liberal
in the 1950s to a significantly controlled regime in the
1970s, after which the country embarked on major trade
liberalization and other economic reforms in the 1980s.
This approach to trade policy has been greatly influenced
by developments in international trade under the General
Agreement on Trade and Tariffs (GATT) and the World
Trade Organization (WTO). It has also been shaped by
trade agreements between Ghana and its major trading
partners, the country’s economic development policy,
and the structural adjustment programs of the World
Bank and the International Monetary Fund, particularly
in the 1980s and 1990s (Ackah and Aryeetey, 2012).
Significant trade liberalization in Ghana began with the
downward adjustment of tariffs in 1983, from rates of
35%, 60%, and 100% to rates of 10%, 20%, 25%, and
30%. The tariffs were further simplified and lowered to
0%, 25%, and 30% the following year while some import
controls remained in place. Further reductions were
made in 1986, when the higher rates were lowered to 20
and 25% (Ackah and Aryeetey, 2012).
Major trade policy reforms took place between 2007 and
2015, when the most-favored-nation (MFN) tariff applied
by the country was frequently modified. In 2012, the
country adopted the WAEMU CET, which was based on
four tariff bands comprised of a zero duty on social goods
such as medicine and publications, 5% duty on imported
raw materials, 10% duty on intermediate goods, and 20%
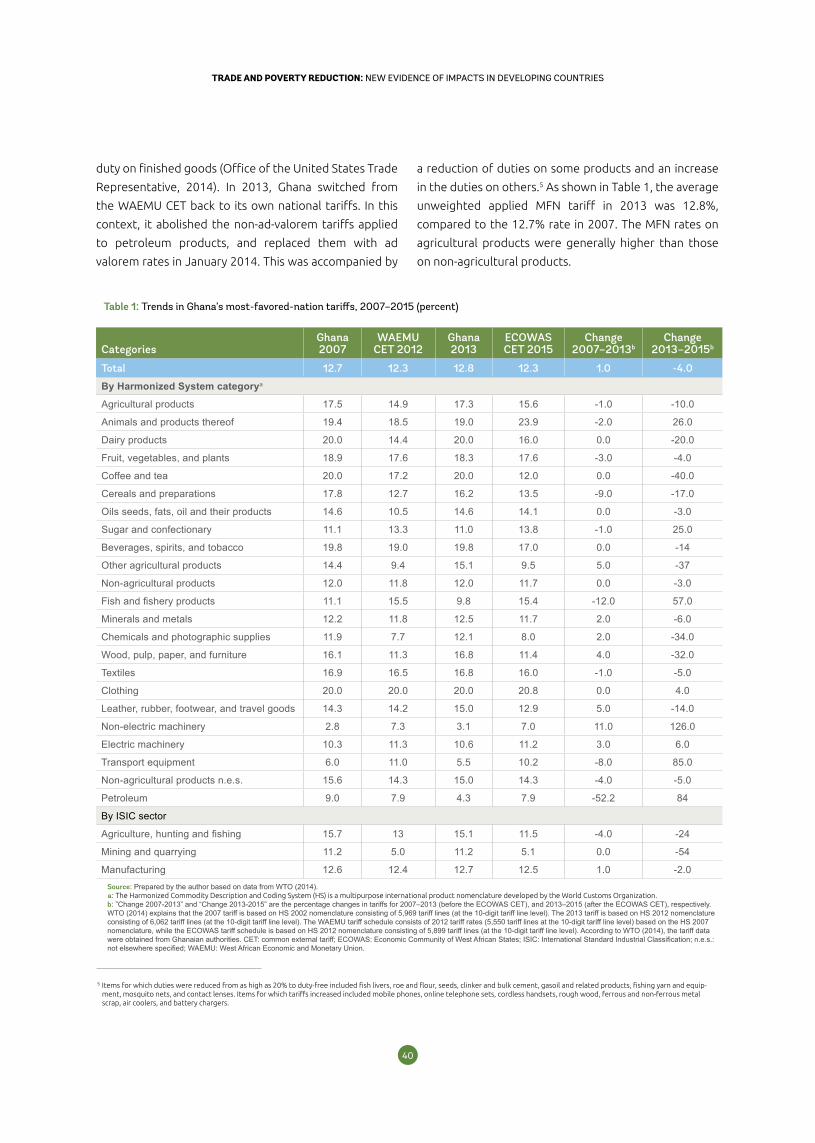
4140
TRADE AND POVERTY REDUCTION: NEW EVIDENCE OF IMPACTS IN DEVELOPING COUNTRIESTRADE AND POVERTY REDUCTION: NEW EVIDENCE OF IMPACTS IN DEVELOPING COUNTRIES
Table 1: Trends in Ghana’s most-favored-nation tariffs, 2007–2015 (percent)
CategoriesGhana2007
WAEMUCET 2012
Ghana2013
ECOWASCET 2015
Change 2007–2013b
Change 2013–2015b
Total 12.7 12.3 12.8 12.3 1.0 -4.0
By Harmonized System categorya
Agricultural products 17.5 14.9 17.3 15.6 -1.0 -10.0
Animals and products thereof 19.4 18.5 19.0 23.9 -2.0 26.0
Dairy products 20.0 14.4 20.0 16.0 0.0 -20.0
Fruit, vegetables, and plants 18.9 17.6 18.3 17.6 -3.0 -4.0
Coffee and tea 20.0 17.2 20.0 12.0 0.0 -40.0
Cereals and preparations 17.8 12.7 16.2 13.5 -9.0 -17.0
Oils seeds, fats, oil and their products 14.6 10.5 14.6 14.1 0.0 -3.0
Sugar and confectionary 11.1 13.3 11.0 13.8 -1.0 25.0
Beverages, spirits, and tobacco 19.8 19.0 19.8 17.0 0.0 -14
Other agricultural products 14.4 9.4 15.1 9.5 5.0 -37
Non-agricultural products 12.0 11.8 12.0 11.7 0.0 -3.0
Fish and fishery products 11.1 15.5 9.8 15.4 -12.0 57.0
Minerals and metals 12.2 11.8 12.5 11.7 2.0 -6.0
Chemicals and photographic supplies 11.9 7.7 12.1 8.0 2.0 -34.0
Wood, pulp, paper, and furniture 16.1 11.3 16.8 11.4 4.0 -32.0
Textiles 16.9 16.5 16.8 16.0 -1.0 -5.0
Clothing 20.0 20.0 20.0 20.8 0.0 4.0
Leather, rubber, footwear, and travel goods 14.3 14.2 15.0 12.9 5.0 -14.0
Non-electric machinery 2.8 7.3 3.1 7.0 11.0 126.0
Electric machinery 10.3 11.3 10.6 11.2 3.0 6.0
Transport equipment 6.0 11.0 5.5 10.2 -8.0 85.0
Non-agricultural products n.e.s. 15.6 14.3 15.0 14.3 -4.0 -5.0
Petroleum 9.0 7.9 4.3 7.9 -52.2 84
By ISIC sector
Agriculture, hunting and fishing 15.7 13 15.1 11.5 -4.0 -24
Mining and quarrying 11.2 5.0 11.2 5.1 0.0 -54
Manufacturing 12.6 12.4 12.7 12.5 1.0 -2.0Source: Prepared by the author based on data from WTO (2014).
a: The Harmonized Commodity Description and Coding System (HS) is a multipurpose international product nomenclature developed by the World Customs Organization.b: ”Change 2007-2013” and “Change 2013-2015” are the percentage changes in tariffs for 2007–2013 (before the ECOWAS CET), and 2013–2015 (after the ECOWAS CET), respectively. WTO (2014) explains that the 2007 tariff is based on HS 2002 nomenclature consisting of 5,969 tariff lines (at the 10-digit tariff line level). The 2013 tariff is based on HS 2012 nomenclature consisting of 6,062 tariff lines (at the 10-digit tariff line level). The WAEMU tariff schedule consists of 2012 tariff rates (5,550 tariff lines at the 10-digit tariff line level) based on the HS 2007 nomenclature, while the ECOWAS tariff schedule is based on HS 2012 nomenclature consisting of 5,899 tariff lines (at the 10-digit tariff line level). According to WTO (2014), the tariff data were obtained from Ghanaian authorities. CET: common external tariff; ECOWAS: Economic Community of West African States; ISIC: International Standard Industrial Classification; n.e.s.: not elsewhere specified; WAEMU: West African Economic and Monetary Union.
duty on finished goods (Office of the United States Trade
Representative, 2014). In 2013, Ghana switched from
the WAEMU CET back to its own national tariffs. In this
context, it abolished the non-ad-valorem tariffs applied
to petroleum products, and replaced them with ad
valorem rates in January 2014. This was accompanied by
a reduction of duties on some products and an increase
in the duties on others.5 As shown in Table 1, the average
unweighted applied MFN tariff in 2013 was 12.8%,
compared to the 12.7% rate in 2007. The MFN rates on
agricultural products were generally higher than those
on non-agricultural products.
5 Items for which duties were reduced from as high as 20% to duty-free included fish livers, roe and flour, seeds, clinker and bulk cement, gasoil and related products, fishing yarn and equip-ment, mosquito nets, and contact lenses. Items for which tariffs increased included mobile phones, online telephone sets, cordless handsets, rough wood, ferrous and non-ferrous metal scrap, air coolers, and battery chargers.
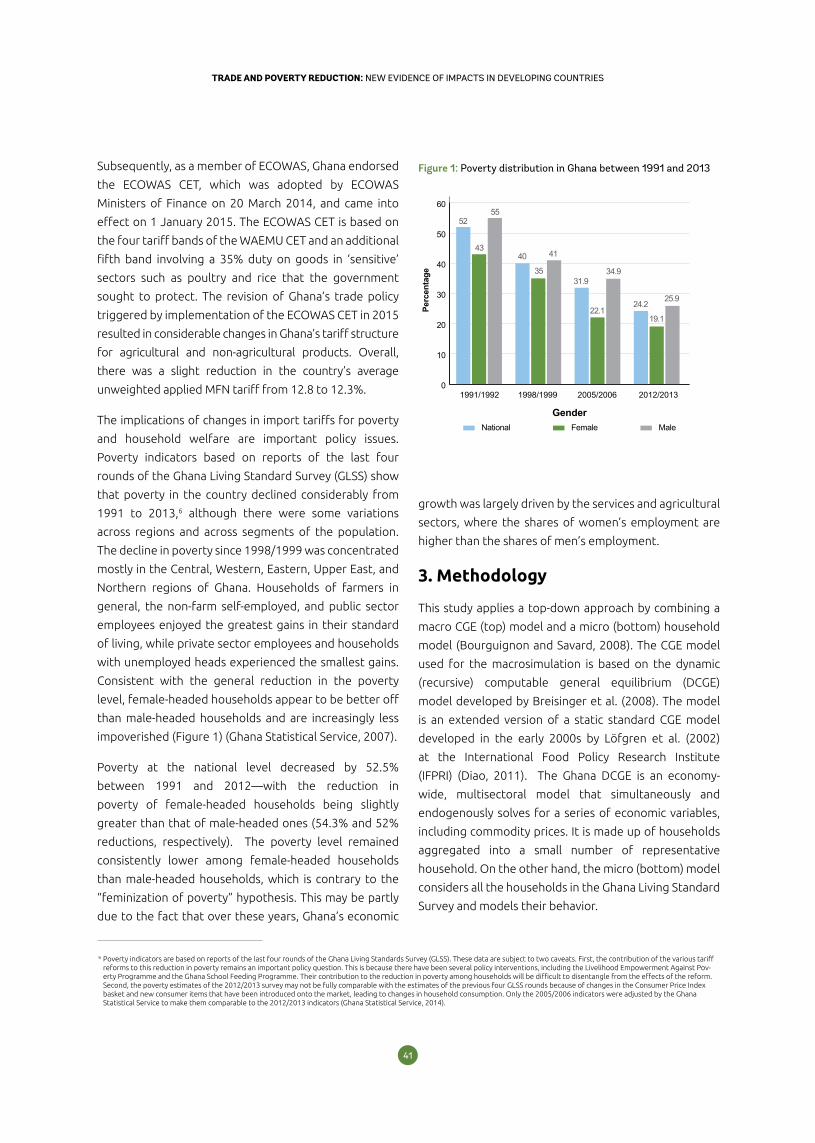
4140
TRADE AND POVERTY REDUCTION: NEW EVIDENCE OF IMPACTS IN DEVELOPING COUNTRIESTRADE AND POVERTY REDUCTION: NEW EVIDENCE OF IMPACTS IN DEVELOPING COUNTRIES
Subsequently, as a member of ECOWAS, Ghana endorsed
the ECOWAS CET, which was adopted by ECOWAS
Ministers of Finance on 20 March 2014, and came into
effect on 1 January 2015. The ECOWAS CET is based on
the four tariff bands of the WAEMU CET and an additional
fifth band involving a 35% duty on goods in ‘sensitive’
sectors such as poultry and rice that the government
sought to protect. The revision of Ghana’s trade policy
triggered by implementation of the ECOWAS CET in 2015
resulted in considerable changes in Ghana’s tariff structure
for agricultural and non-agricultural products. Overall,
there was a slight reduction in the country’s average
unweighted applied MFN tariff from 12.8 to 12.3%.
The implications of changes in import tariffs for poverty
and household welfare are important policy issues.
Poverty indicators based on reports of the last four
rounds of the Ghana Living Standard Survey (GLSS) show
that poverty in the country declined considerably from
1991 to 2013,6 although there were some variations
across regions and across segments of the population.
The decline in poverty since 1998/1999 was concentrated
mostly in the Central, Western, Eastern, Upper East, and
Northern regions of Ghana. Households of farmers in
general, the non-farm self-employed, and public sector
employees enjoyed the greatest gains in their standard
of living, while private sector employees and households
with unemployed heads experienced the smallest gains.
Consistent with the general reduction in the poverty
level, female-headed households appear to be better off
than male-headed households and are increasingly less
impoverished (Figure 1) (Ghana Statistical Service, 2007).
Poverty at the national level decreased by 52.5%
between 1991 and 2012—with the reduction in
poverty of female-headed households being slightly
greater than that of male-headed ones (54.3% and 52%
reductions, respectively). The poverty level remained
consistently lower among female-headed households
than male-headed households, which is contrary to the
“feminization of poverty” hypothesis. This may be partly
due to the fact that over these years, Ghana’s economic
growth was largely driven by the services and agricultural
sectors, where the shares of women’s employment are
higher than the shares of men’s employment.
3. Methodology
This study applies a top-down approach by combining a
macro CGE (top) model and a micro (bottom) household
model (Bourguignon and Savard, 2008). The CGE model
used for the macrosimulation is based on the dynamic
(recursive) computable general equilibrium (DCGE)
model developed by Breisinger et al. (2008). The model
is an extended version of a static standard CGE model
developed in the early 2000s by Löfgren et al. (2002)
at the International Food Policy Research Institute
(IFPRI) (Diao, 2011). The Ghana DCGE is an economy-
wide, multisectoral model that simultaneously and
endogenously solves for a series of economic variables,
including commodity prices. It is made up of households
aggregated into a small number of representative
household. On the other hand, the micro (bottom) model
considers all the households in the Ghana Living Standard
Survey and models their behavior.
0
10
20
30
40
50
60
1991/1992 1998/1999 2005/2006 2012/2013
Perc
enta
geGender
National Female Male
52
43
55
40
35
41
31.9
22.1
34.9
24.2
19.1
25.9
Figure 1: Poverty distribution in Ghana between 1991 and 2013
6 Poverty indicators are based on reports of the last four rounds of the Ghana Living Standards Survey (GLSS). These data are subject to two caveats. First, the contribution of the various tariff reforms to this reduction in poverty remains an important policy question. This is because there have been several policy interventions, including the Livelihood Empowerment Against Pov-erty Programme and the Ghana School Feeding Programme. Their contribution to the reduction in poverty among households will be difficult to disentangle from the effects of the reform. Second, the poverty estimates of the 2012/2013 survey may not be fully comparable with the estimates of the previous four GLSS rounds because of changes in the Consumer Price Index basket and new consumer items that have been introduced onto the market, leading to changes in household consumption. Only the 2005/2006 indicators were adjusted by the Ghana Statistical Service to make them comparable to the 2012/2013 indicators (Ghana Statistical Service, 2014).
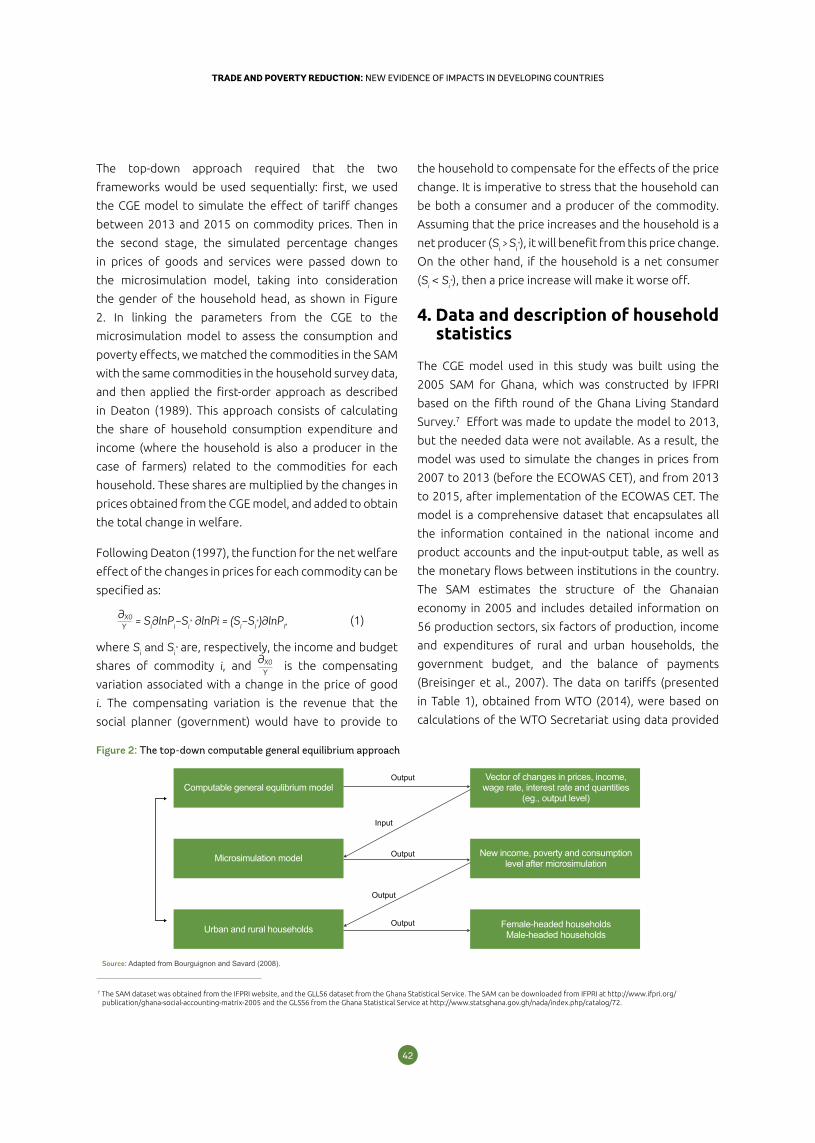
4342
TRADE AND POVERTY REDUCTION: NEW EVIDENCE OF IMPACTS IN DEVELOPING COUNTRIESTRADE AND POVERTY REDUCTION: NEW EVIDENCE OF IMPACTS IN DEVELOPING COUNTRIES
The top-down approach required that the two
frameworks would be used sequentially: first, we used
the CGE model to simulate the effect of tariff changes
between 2013 and 2015 on commodity prices. Then in
the second stage, the simulated percentage changes
in prices of goods and services were passed down to
the microsimulation model, taking into consideration
the gender of the household head, as shown in Figure
2. In linking the parameters from the CGE to the
microsimulation model to assess the consumption and
poverty effects, we matched the commodities in the SAM
with the same commodities in the household survey data,
and then applied the first-order approach as described
in Deaton (1989). This approach consists of calculating
the share of household consumption expenditure and
income (where the household is also a producer in the
case of farmers) related to the commodities for each
household. These shares are multiplied by the changes in
prices obtained from the CGE model, and added to obtain
the total change in welfare.
Following Deaton (1997), the function for the net welfare
effect of the changes in prices for each commodity can be
specified as:
∂X0 = Si∂lnPi–Si* ∂lnPi = (Si–Si*)∂lnPi, (1)
where Si and Si* are, respectively, the income and budget
shares of commodity i, and ∂X0 is the compensating
variation associated with a change in the price of good
i. The compensating variation is the revenue that the
social planner (government) would have to provide to
the household to compensate for the effects of the price
change. It is imperative to stress that the household can
be both a consumer and a producer of the commodity.
Assuming that the price increases and the household is a
net producer (Si > Si*), it will benefit from this price change.
On the other hand, if the household is a net consumer
(Si < Si*), then a price increase will make it worse off.
4. Data and description of household statistics
The CGE model used in this study was built using the
2005 SAM for Ghana, which was constructed by IFPRI
based on the fifth round of the Ghana Living Standard
Survey.7 Effort was made to update the model to 2013,
but the needed data were not available. As a result, the
model was used to simulate the changes in prices from
2007 to 2013 (before the ECOWAS CET), and from 2013
to 2015, after implementation of the ECOWAS CET. The
model is a comprehensive dataset that encapsulates all
the information contained in the national income and
product accounts and the input-output table, as well as
the monetary flows between institutions in the country.
The SAM estimates the structure of the Ghanaian
economy in 2005 and includes detailed information on
56 production sectors, six factors of production, income
and expenditures of rural and urban households, the
government budget, and the balance of payments
(Breisinger et al., 2007). The data on tariffs (presented
in Table 1), obtained from WTO (2014), were based on
calculations of the WTO Secretariat using data provided
Figure 2: The top-down computable general equilibrium approach
Vector of changes in prices, income, wage rate, interest rate and quantities
(eg., output level)
New income, poverty and consumption level after microsimulation
Female-headed households Male-headed households
Computable general equlibrium model
Microsimulation model
Urban and rural households
Output
Output
Output
Output
Input
7 The SAM dataset was obtained from the IFPRI website, and the GLLS6 dataset from the Ghana Statistical Service. The SAM can be downloaded from IFPRI at http://www.ifpri.org/ publication/ghana-social-accounting-matrix-2005 and the GLSS6 from the Ghana Statistical Service at http://www.statsghana.gov.gh/nada/index.php/catalog/72.
Y
Source: Adapted from Bourguignon and Savard (2008).
Y
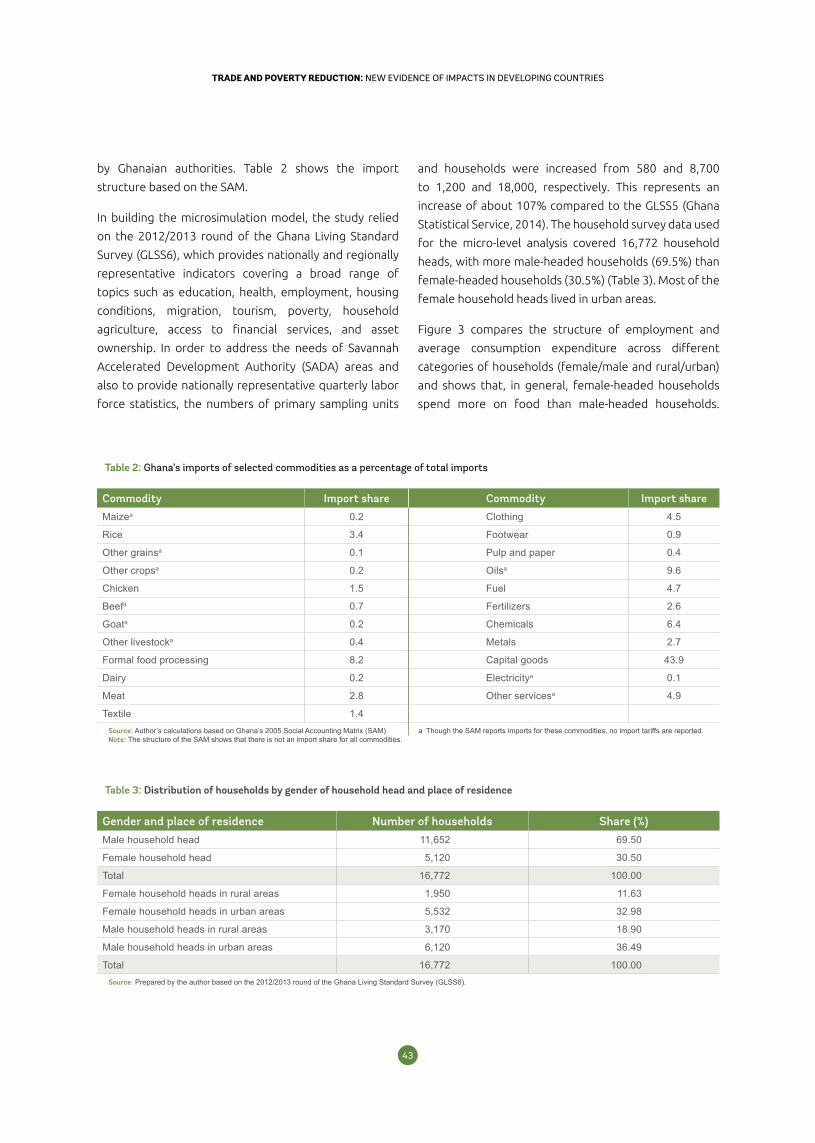
4342
TRADE AND POVERTY REDUCTION: NEW EVIDENCE OF IMPACTS IN DEVELOPING COUNTRIESTRADE AND POVERTY REDUCTION: NEW EVIDENCE OF IMPACTS IN DEVELOPING COUNTRIES
by Ghanaian authorities. Table 2 shows the import
structure based on the SAM.
In building the microsimulation model, the study relied
on the 2012/2013 round of the Ghana Living Standard
Survey (GLSS6), which provides nationally and regionally
representative indicators covering a broad range of
topics such as education, health, employment, housing
conditions, migration, tourism, poverty, household
agriculture, access to financial services, and asset
ownership. In order to address the needs of Savannah
Accelerated Development Authority (SADA) areas and
also to provide nationally representative quarterly labor
force statistics, the numbers of primary sampling units
and households were increased from 580 and 8,700
to 1,200 and 18,000, respectively. This represents an
increase of about 107% compared to the GLSS5 (Ghana
Statistical Service, 2014). The household survey data used
for the micro-level analysis covered 16,772 household
heads, with more male-headed households (69.5%) than
female-headed households (30.5%) (Table 3). Most of the
female household heads lived in urban areas.
Figure 3 compares the structure of employment and
average consumption expenditure across different
categories of households (female/male and rural/urban)
and shows that, in general, female-headed households
spend more on food than male-headed households.
Table 2: Ghana’s imports of selected commodities as a percentage of total imports
Commodity Import share Commodity Import share
Maizea 0.2 Clothing 4.5
Rice 3.4 Footwear 0.9
Other grainsa 0.1 Pulp and paper 0.4
Other cropsa 0.2 Oilsa 9.6
Chicken 1.5 Fuel 4.7
Beefa 0.7 Fertilizers 2.6
Goata 0.2 Chemicals 6.4
Other livestocka 0.4 Metals 2.7
Formal food processing 8.2 Capital goods 43.9
Dairy 0.2 Electricitya 0.1
Meat 2.8 Other servicesa 4.9
Textile 1.4Source: Author’s calculations based on Ghana’s 2005 Social Accounting Matrix (SAM). a Though the SAM reports imports for these commodities, no import tariffs are reported.Note: The structure of the SAM shows that there is not an import share for all commodities.
Table 3: Distribution of households by gender of household head and place of residence
Gender and place of residence Number of households Share (%)Male household head 11,652 69.50
Female household head 5,120 30.50
Total 16,772 100.00
Female household heads in rural areas 1,950 11.63
Female household heads in urban areas 5,532 32.98
Male household heads in rural areas 3,170 18.90
Male household heads in urban areas 6,120 36.49
Total 16,772 100.00Source: Prepared by the author based on the 2012/2013 round of the Ghana Living Standard Survey (GLSS6).
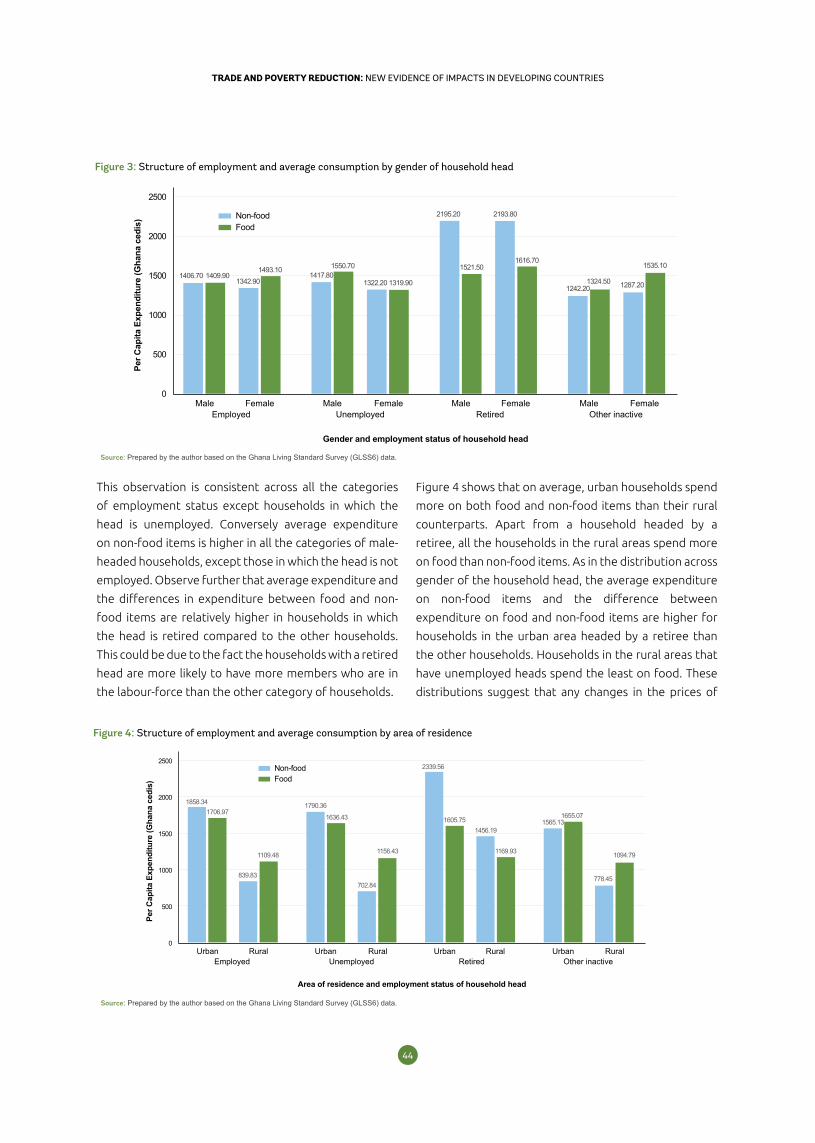
4544
TRADE AND POVERTY REDUCTION: NEW EVIDENCE OF IMPACTS IN DEVELOPING COUNTRIESTRADE AND POVERTY REDUCTION: NEW EVIDENCE OF IMPACTS IN DEVELOPING COUNTRIES
This observation is consistent across all the categories
of employment status except households in which the
head is unemployed. Conversely average expenditure
on non-food items is higher in all the categories of male-
headed households, except those in which the head is not
employed. Observe further that average expenditure and
the differences in expenditure between food and non-
food items are relatively higher in households in which
the head is retired compared to the other households.
This could be due to the fact the households with a retired
head are more likely to have more members who are in
the labour-force than the other category of households.
Figure 4 shows that on average, urban households spend
more on both food and non-food items than their rural
counterparts. Apart from a household headed by a
retiree, all the households in the rural areas spend more
on food than non-food items. As in the distribution across
gender of the household head, the average expenditure
on non-food items and the difference between
expenditure on food and non-food items are higher for
households in the urban area headed by a retiree than
the other households. Households in the rural areas that
have unemployed heads spend the least on food. These
distributions suggest that any changes in the prices of
Figure 4: Structure of employment and average consumption by area of residence
0
500
1000
1500
2000
2500
Urban RuralEmployed Unemployed Retired Other inactive
Urban Rural Urban Rural Urban Rural
Per C
apita
Exp
endi
ture
(Gha
na c
edis
)
Area of residence and employment status of household head
1858.341706.97
839.83
1109.48
1790.36
1636.43
702.84
2339.56
1456.191605.75
1169.93
1565.131655.07
778.45
1094.791156.43
Non-foodFood
Source: Prepared by the author based on the Ghana Living Standard Survey (GLSS6) data.
0
500
1000
1500
2000
2500
Male FemaleEmployed Unemployed Retired Other inactive
Male Female Male Female Male Female
Per C
apita
Exp
endi
ture
(Gha
na c
edis
)
Gender and employment status of household head
Non-foodFood
1406.70 1409.901342.90
1493.101417.80
1550.70
1322.20
2195.20 2193.80
1521.501616.70
1242.201324.50 1287.20
1535.10
1319.90
Figure 3: Structure of employment and average consumption by gender of household head
Source: Prepared by the author based on the Ghana Living Standard Survey (GLSS6) data.
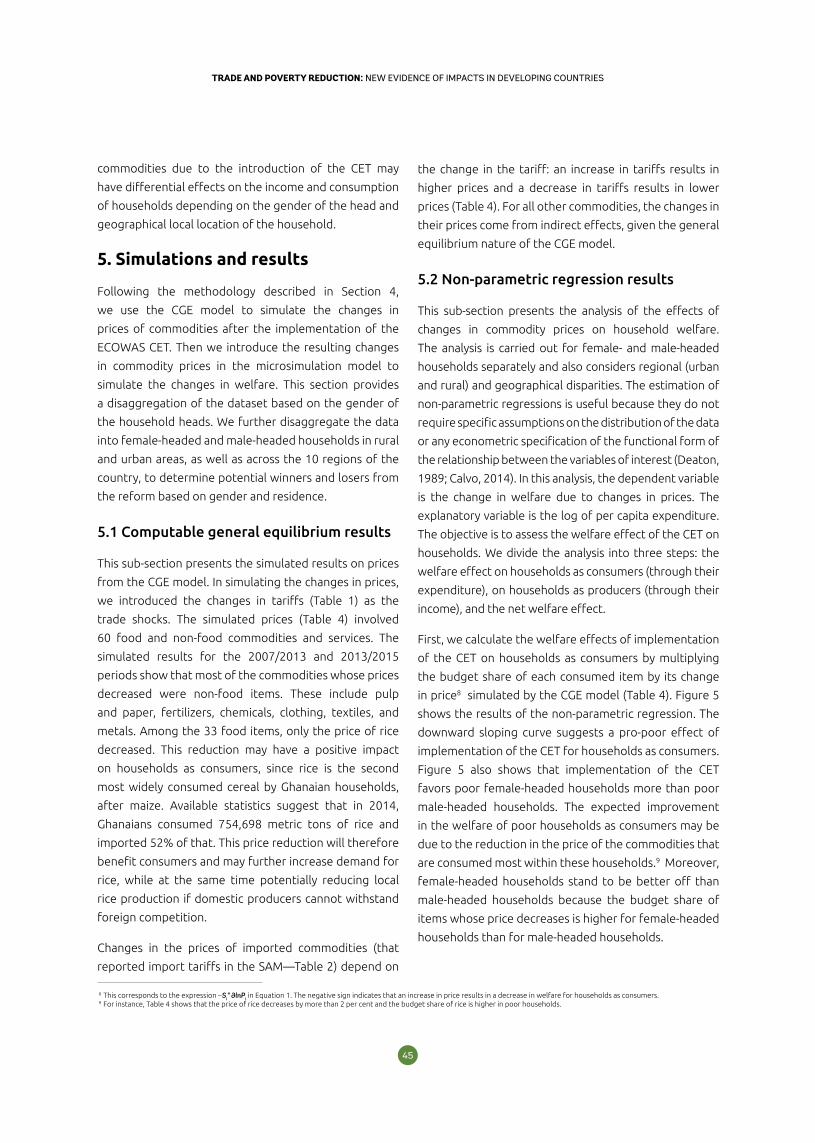
4544
TRADE AND POVERTY REDUCTION: NEW EVIDENCE OF IMPACTS IN DEVELOPING COUNTRIESTRADE AND POVERTY REDUCTION: NEW EVIDENCE OF IMPACTS IN DEVELOPING COUNTRIES
commodities due to the introduction of the CET may
have differential effects on the income and consumption
of households depending on the gender of the head and
geographical local location of the household.
5. Simulations and results
Following the methodology described in Section 4,
we use the CGE model to simulate the changes in
prices of commodities after the implementation of the
ECOWAS CET. Then we introduce the resulting changes
in commodity prices in the microsimulation model to
simulate the changes in welfare. This section provides
a disaggregation of the dataset based on the gender of
the household heads. We further disaggregate the data
into female-headed and male-headed households in rural
and urban areas, as well as across the 10 regions of the
country, to determine potential winners and losers from
the reform based on gender and residence.
5.1 Computable general equilibrium results
This sub-section presents the simulated results on prices
from the CGE model. In simulating the changes in prices,
we introduced the changes in tariffs (Table 1) as the
trade shocks. The simulated prices (Table 4) involved
60 food and non-food commodities and services. The
simulated results for the 2007/2013 and 2013/2015
periods show that most of the commodities whose prices
decreased were non-food items. These include pulp
and paper, fertilizers, chemicals, clothing, textiles, and
metals. Among the 33 food items, only the price of rice
decreased. This reduction may have a positive impact
on households as consumers, since rice is the second
most widely consumed cereal by Ghanaian households,
after maize. Available statistics suggest that in 2014,
Ghanaians consumed 754,698 metric tons of rice and
imported 52% of that. This price reduction will therefore
benefit consumers and may further increase demand for
rice, while at the same time potentially reducing local
rice production if domestic producers cannot withstand
foreign competition.
Changes in the prices of imported commodities (that
reported import tariffs in the SAM—Table 2) depend on
the change in the tariff: an increase in tariffs results in
higher prices and a decrease in tariffs results in lower
prices (Table 4). For all other commodities, the changes in
their prices come from indirect effects, given the general
equilibrium nature of the CGE model.
5.2 Non-parametric regression results
This sub-section presents the analysis of the effects of
changes in commodity prices on household welfare.
The analysis is carried out for female- and male-headed
households separately and also considers regional (urban
and rural) and geographical disparities. The estimation of
non-parametric regressions is useful because they do not
require specific assumptions on the distribution of the data
or any econometric specification of the functional form of
the relationship between the variables of interest (Deaton,
1989; Calvo, 2014). In this analysis, the dependent variable
is the change in welfare due to changes in prices. The
explanatory variable is the log of per capita expenditure.
The objective is to assess the welfare effect of the CET on
households. We divide the analysis into three steps: the
welfare effect on households as consumers (through their
expenditure), on households as producers (through their
income), and the net welfare effect.
First, we calculate the welfare effects of implementation
of the CET on households as consumers by multiplying
the budget share of each consumed item by its change
in price8 simulated by the CGE model (Table 4). Figure 5
shows the results of the non-parametric regression. The
downward sloping curve suggests a pro-poor effect of
implementation of the CET for households as consumers.
Figure 5 also shows that implementation of the CET
favors poor female-headed households more than poor
male-headed households. The expected improvement
in the welfare of poor households as consumers may be
due to the reduction in the price of the commodities that
are consumed most within these households.9 Moreover,
female-headed households stand to be better off than
male-headed households because the budget share of
items whose price decreases is higher for female-headed
households than for male-headed households.
8 This corresponds to the expression –Si* ∂lnPi in Equation 1. The negative sign indicates that an increase in price results in a decrease in welfare for households as consumers. 9 For instance, Table 4 shows that the price of rice decreases by more than 2 per cent and the budget share of rice is higher in poor households.
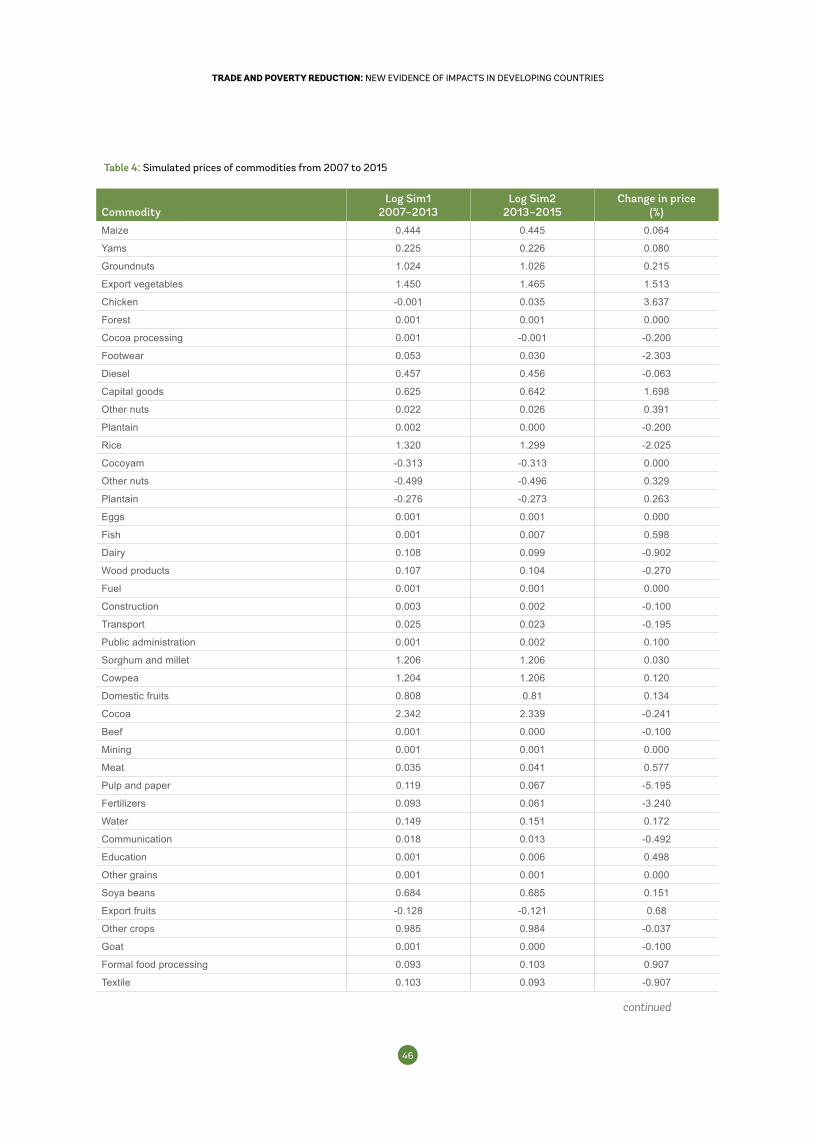
4746
TRADE AND POVERTY REDUCTION: NEW EVIDENCE OF IMPACTS IN DEVELOPING COUNTRIESTRADE AND POVERTY REDUCTION: NEW EVIDENCE OF IMPACTS IN DEVELOPING COUNTRIES
Table 4: Simulated prices of commodities from 2007 to 2015
CommodityLog Sim1
2007–2013Log Sim2
2013–2015Change in price
(%)
Maize 0.444 0.445 0.064
Yams 0.225 0.226 0.080
Groundnuts 1.024 1.026 0.215
Export vegetables 1.450 1.465 1.513
Chicken -0.001 0.035 3.637
Forest 0.001 0.001 0.000
Cocoa processing 0.001 -0.001 -0.200
Footwear 0.053 0.030 -2.303
Diesel 0.457 0.456 -0.063
Capital goods 0.625 0.642 1.698
Other nuts 0.022 0.026 0.391
Plantain 0.002 0.000 -0.200
Rice 1.320 1.299 -2.025
Cocoyam -0.313 -0.313 0.000
Other nuts -0.499 -0.496 0.329
Plantain -0.276 -0.273 0.263
Eggs 0.001 0.001 0.000
Fish 0.001 0.007 0.598
Dairy 0.108 0.099 -0.902
Wood products 0.107 0.104 -0.270
Fuel 0.001 0.001 0.000
Construction 0.003 0.002 -0.100
Transport 0.025 0.023 -0.195
Public administration 0.001 0.002 0.100
Sorghum and millet 1.206 1.206 0.030
Cowpea 1.204 1.206 0.120
Domestic fruits 0.808 0.81 0.134
Cocoa 2.342 2.339 -0.241
Beef 0.001 0.000 -0.100
Mining 0.001 0.001 0.000
Meat 0.035 0.041 0.577
Pulp and paper 0.119 0.067 -5.195
Fertilizers 0.093 0.061 -3.240
Water 0.149 0.151 0.172
Communication 0.018 0.013 -0.492
Education 0.001 0.006 0.498
Other grains 0.001 0.001 0.000
Soya beans 0.684 0.685 0.151
Export fruits -0.128 -0.121 0.68
Other crops 0.985 0.984 -0.037
Goat 0.001 0.000 -0.100
Formal food processing 0.093 0.103 0.907
Textile 0.103 0.093 -0.907
continued
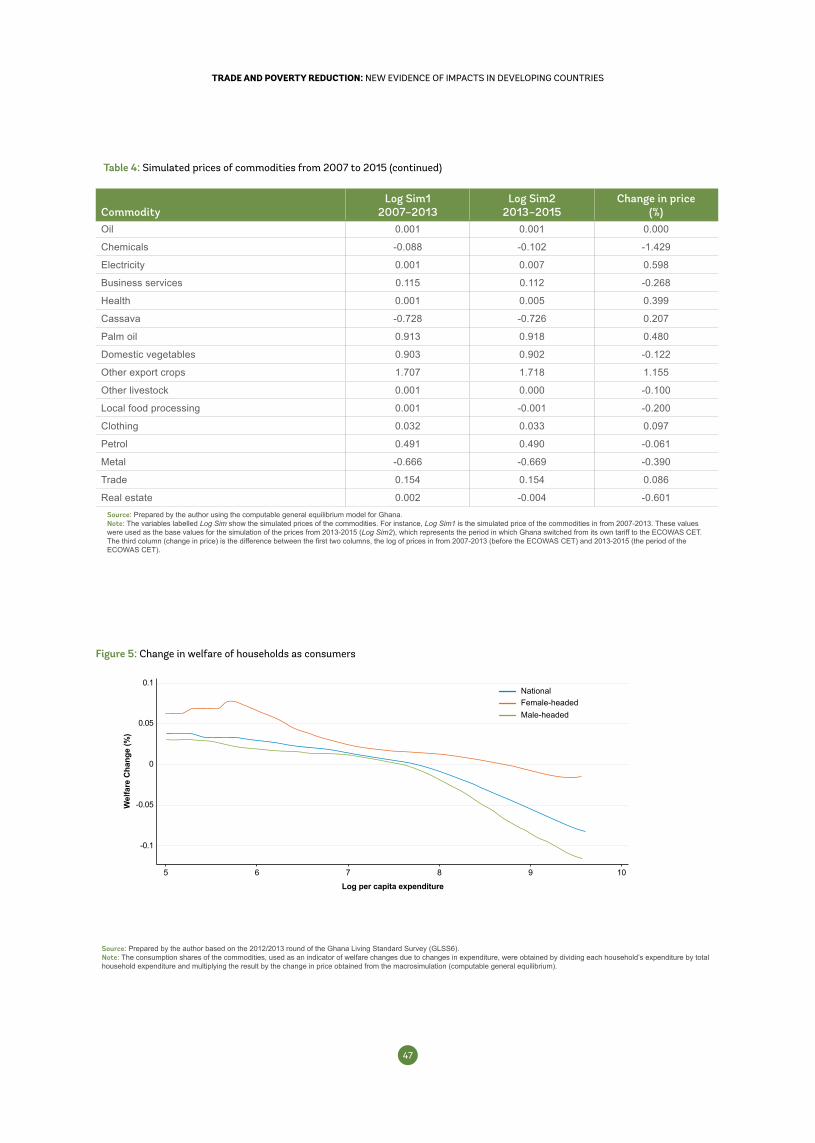
4746
TRADE AND POVERTY REDUCTION: NEW EVIDENCE OF IMPACTS IN DEVELOPING COUNTRIESTRADE AND POVERTY REDUCTION: NEW EVIDENCE OF IMPACTS IN DEVELOPING COUNTRIES
Figure 5: Change in welfare of households as consumers
0.05
0.1
0
-0.05
-0.1
Log per capita expenditure
Wel
fare
Cha
nge
(%)
5 76 8 9 10
Female-headedMale-headed
National
Source: Prepared by the author based on the 2012/2013 round of the Ghana Living Standard Survey (GLSS6). Note: The consumption shares of the commodities, used as an indicator of welfare changes due to changes in expenditure, were obtained by dividing each household’s expenditure by total household expenditure and multiplying the result by the change in price obtained from the macrosimulation (computable general equilibrium).
Table 4: Simulated prices of commodities from 2007 to 2015 (continued)
CommodityLog Sim1
2007–2013Log Sim2
2013–2015Change in price
(%)Oil 0.001 0.001 0.000
Chemicals -0.088 -0.102 -1.429
Electricity 0.001 0.007 0.598
Business services 0.115 0.112 -0.268
Health 0.001 0.005 0.399
Cassava -0.728 -0.726 0.207
Palm oil 0.913 0.918 0.480
Domestic vegetables 0.903 0.902 -0.122
Other export crops 1.707 1.718 1.155
Other livestock 0.001 0.000 -0.100
Local food processing 0.001 -0.001 -0.200
Clothing 0.032 0.033 0.097
Petrol 0.491 0.490 -0.061
Metal -0.666 -0.669 -0.390
Trade 0.154 0.154 0.086
Real estate 0.002 -0.004 -0.601Source: Prepared by the author using the computable general equilibrium model for Ghana.Note: The variables labelled Log Sim show the simulated prices of the commodities. For instance, Log Sim1 is the simulated price of the commodities in from 2007-2013. These values were used as the base values for the simulation of the prices from 2013-2015 (Log Sim2), which represents the period in which Ghana switched from its own tariff to the ECOWAS CET. The third column (change in price) is the difference between the first two columns, the log of prices in from 2007-2013 (before the ECOWAS CET) and 2013-2015 (the period of the ECOWAS CET).
continued
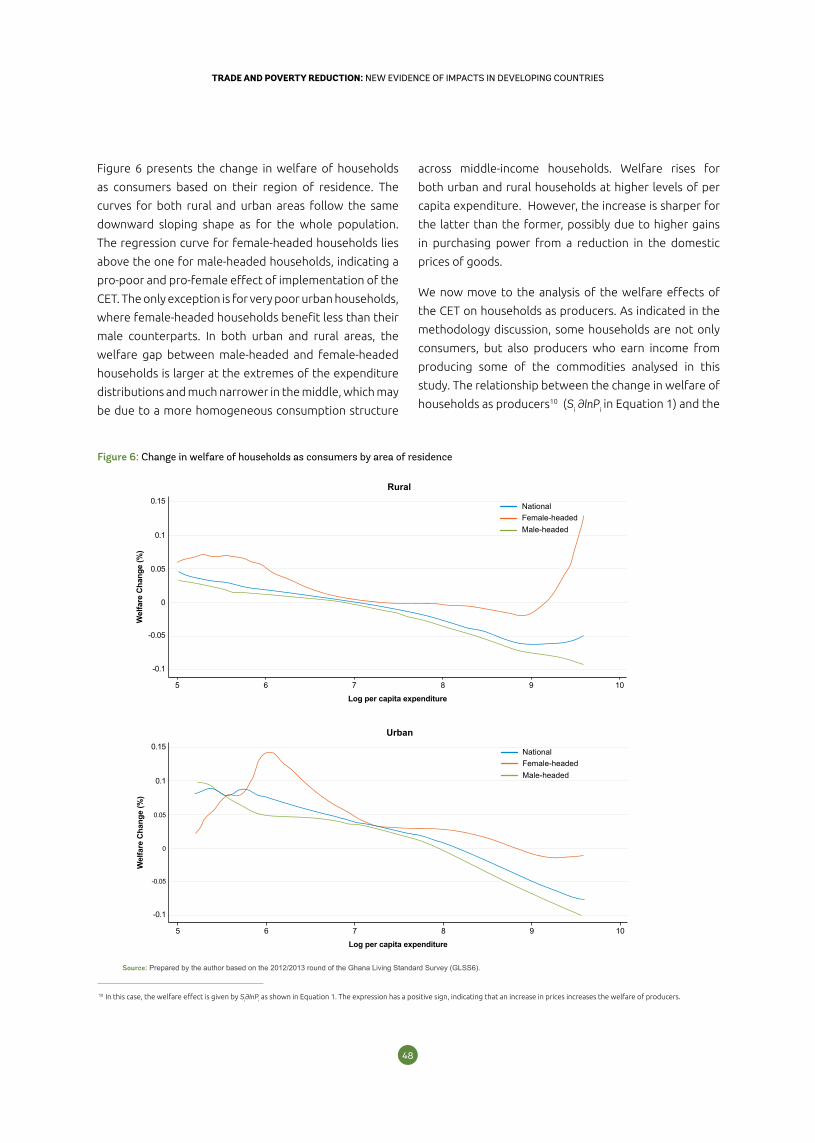
4948
TRADE AND POVERTY REDUCTION: NEW EVIDENCE OF IMPACTS IN DEVELOPING COUNTRIESTRADE AND POVERTY REDUCTION: NEW EVIDENCE OF IMPACTS IN DEVELOPING COUNTRIES
10 In this case, the welfare effect is given by Si∂lnPi as shown in Equation 1. The expression has a positive sign, indicating that an increase in prices increases the welfare of producers.
Figure 6 presents the change in welfare of households
as consumers based on their region of residence. The
curves for both rural and urban areas follow the same
downward sloping shape as for the whole population.
The regression curve for female-headed households lies
above the one for male-headed households, indicating a
pro-poor and pro-female effect of implementation of the
CET. The only exception is for very poor urban households,
where female-headed households benefit less than their
male counterparts. In both urban and rural areas, the
welfare gap between male-headed and female-headed
households is larger at the extremes of the expenditure
distributions and much narrower in the middle, which may
be due to a more homogeneous consumption structure
across middle-income households. Welfare rises for
both urban and rural households at higher levels of per
capita expenditure. However, the increase is sharper for
the latter than the former, possibly due to higher gains
in purchasing power from a reduction in the domestic
prices of goods.
We now move to the analysis of the welfare effects of
the CET on households as producers. As indicated in the
methodology discussion, some households are not only
consumers, but also producers who earn income from
producing some of the commodities analysed in this
study. The relationship between the change in welfare of
households as producers10 (Si ∂lnPi in Equation 1) and the
Figure 6: Change in welfare of households as consumers by area of residence
0.1
0.15
0.05
0
-0.05
-0.1
Log per capita expenditure
Wel
fare
Cha
nge
(%)
Urban
5 76 8 9 10
Female-headedMale-headed
National
0.1
0.15
0.05
0
-0.05
-0.1
Log per capita expenditure
Wel
fare
Cha
nge
(%)
Rural
5 76 8 9 10
Female-headedMale-headed
National
Source: Prepared by the author based on the 2012/2013 round of the Ghana Living Standard Survey (GLSS6).
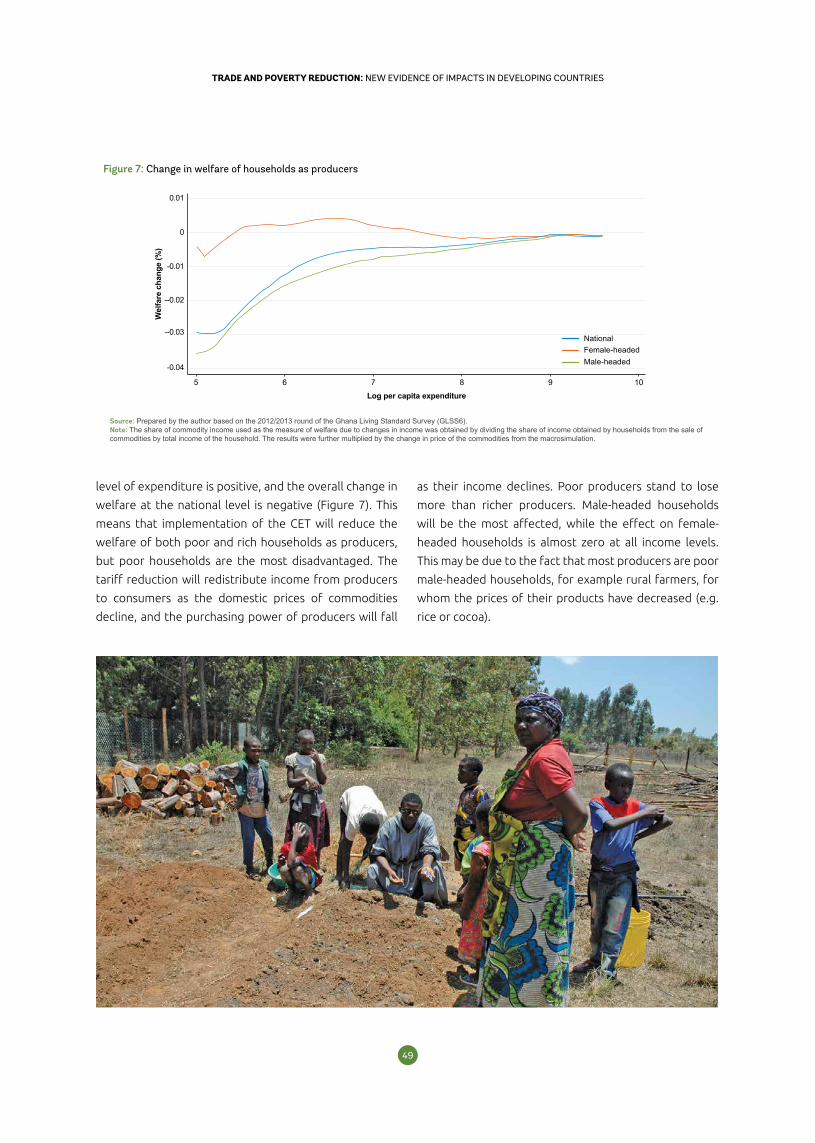
4948
TRADE AND POVERTY REDUCTION: NEW EVIDENCE OF IMPACTS IN DEVELOPING COUNTRIESTRADE AND POVERTY REDUCTION: NEW EVIDENCE OF IMPACTS IN DEVELOPING COUNTRIES
level of expenditure is positive, and the overall change in
welfare at the national level is negative (Figure 7). This
means that implementation of the CET will reduce the
welfare of both poor and rich households as producers,
but poor households are the most disadvantaged. The
tariff reduction will redistribute income from producers
to consumers as the domestic prices of commodities
decline, and the purchasing power of producers will fall
Figure 7: Change in welfare of households as producers
0
0.01
-0.01
--0.03
--0.02
-0.04
Log per capita expenditure
Wel
fare
cha
nge
(%)
5 76 8 9 10
Female-headedMale-headed
National
Source: Prepared by the author based on the 2012/2013 round of the Ghana Living Standard Survey (GLSS6).Note: The share of commodity income used as the measure of welfare due to changes in income was obtained by dividing the share of income obtained by households from the sale of commodities by total income of the household. The results were further multiplied by the change in price of the commodities from the macrosimulation.
as their income declines. Poor producers stand to lose
more than richer producers. Male-headed households
will be the most affected, while the effect on female-
headed households is almost zero at all income levels.
This may be due to the fact that most producers are poor
male-headed households, for example rural farmers, for
whom the prices of their products have decreased (e.g.
rice or cocoa).
5150
TRADE AND POVERTY REDUCTION: NEW EVIDENCE OF IMPACTS IN DEVELOPING COUNTRIESTRADE AND POVERTY REDUCTION: NEW EVIDENCE OF IMPACTS IN DEVELOPING COUNTRIES
Households as producers in rural areas experience
greater losses in welfare than those in urban areas (Figure
8): the average reduction in welfare is 0.028% in rural
areas and 0.014% in urban areas. In both rural and urban
areas, male-headed households are more affected than
female-headed households. These differences in welfare
losses can be partly explained by the greater reliance on
agriculture in rural households than in urban households,
and in male-headed households than in female-headed
households (about 83% of households for which
agriculture is the main occupation are in rural areas,
and they are largely male-headed). About 3.2 million
households, representing 46% of all households, operate
non-farm enterprises, with 52% of them in urban areas.
Almost half (49.5%) of all businesses involve trading,
while the rest involve some kind of manufacturing
activity. Women operate 72% of these businesses (Ghana
Statistical Service, 2014).
We now assess the net welfare effect of the CET on
households by adding the welfare effect on households
as producers and as consumers, as shown in Equation 1.
Figure 9 depicts the relationship between the welfare
effect and household per capita expenditure. The curve
resembles the welfare effect on households as consumers
(Figure 5), because the welfare effect on households as
producers (Figure 7) is much smaller than the one on
households as consumers. The net welfare effect for
male-headed households is around zero for the poor and
negative for the rich. The net welfare effect for female-
headed households is positive for those at the lower and
middle ends of the income categories, but negative for
the rich.
In a nutshell, the main finding of this study is that
implementation of the CET will lead to a decrease in
prices of most items consumed by poor households,
especially female-headed households, resulting in an
improvement in the welfare of these households. At
the same time, it will reduce the welfare of households
that are net producers. This conclusion differs from
the findings of a similar study conducted in Nigeria,
which finds that implementation of the CET produces
net welfare gains due to a reduction in prices of most
agricultural products (Kareem, 2014). This difference in
findings could be due to differences in methodological
approaches, as the author used the pass-through effect
approach which takes into account the combined effect
of wage and prices. Although the results show a pro-poor
and pro-female welfare effect, the variations in welfare
are small (less than 0.1%), perhaps because some prices
increase and some others decrease after implementation
of the CET.
This same analysis was also performed for Ghana’s10
regions (Western, Central, Greater Accra, Volta, Eastern,
Ashanti, Brong Ahafo, Northern, Upper East, and Upper
West) to explore the regional dynamics of the welfare
effects of the CET. The results (Figure A.1 in the Appendix)
reveal the same structure as that for the national level in
some locations (Greater Accra, Volta, Ashanti, and Upper
West). In these cases, therefore, implementation of the
CET is expected to have pro-poor and pro-female effects.
However, the results are different for other regions. For
example, in the Western region, where oil exploitation
has been under way for a little over four years, the
effect is pro-female but not pro-poor, since the net
welfare function first decreases, then increases, and then
decreases again as per capita expenditure increases (a
sort of a U-shaped curve). In the Central region, the effect
of the CET is pro-poor, but not pro-female. In the Brong
Ahafo region, where agriculture is the predominant
occupation, the results indicate a net welfare loss for all
categories of households, regardless of the income status
or the gender of the household head. These variations
in the net welfare effect across the 10 regions could be
explained by the heterogeneity in the production and
consumption structures of households.
The net welfare effect for female-headed households is positive for those at the
lower and middle ends of the income categories, but
negative for the rich.
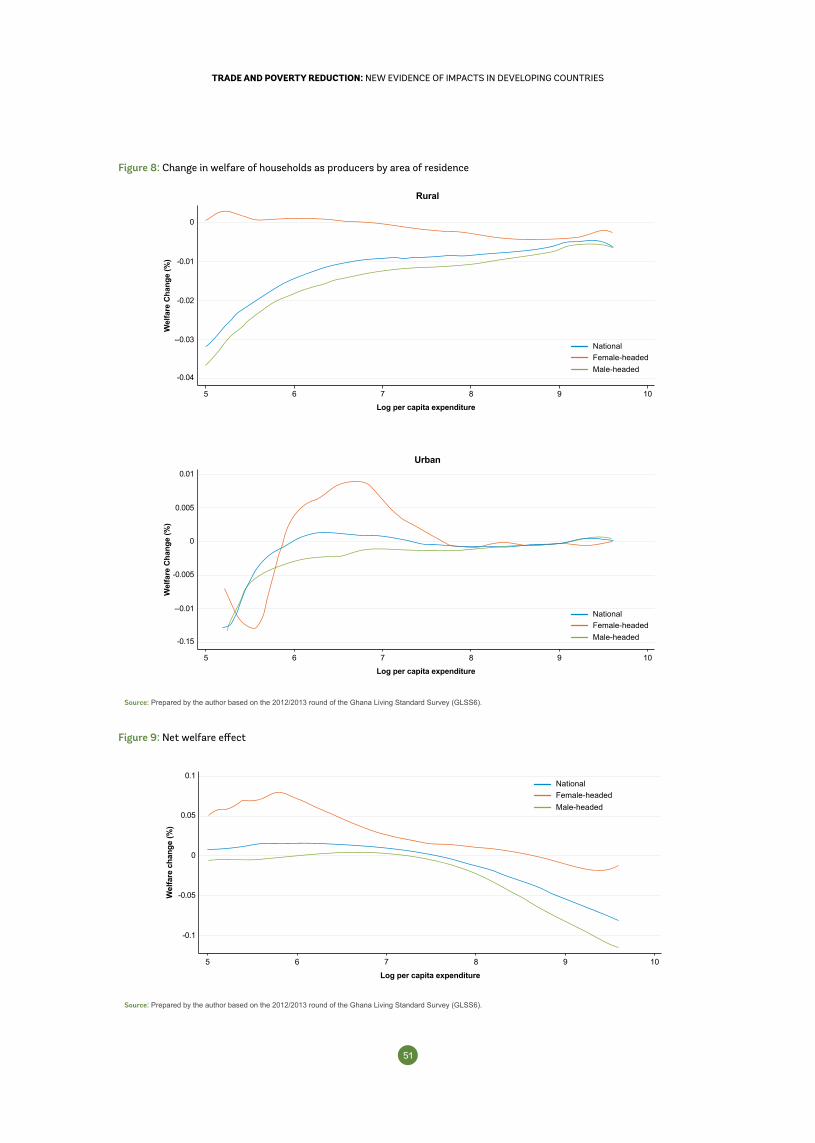
5150
TRADE AND POVERTY REDUCTION: NEW EVIDENCE OF IMPACTS IN DEVELOPING COUNTRIESTRADE AND POVERTY REDUCTION: NEW EVIDENCE OF IMPACTS IN DEVELOPING COUNTRIES
Figure 9: Net welfare effect
0.05
0.1
0
-0.05
-0.1
Log per capita expenditure
Wel
fare
cha
nge
(%)
5 76 8 9 10
Female-headedMale-headed
National
Source: Prepared by the author based on the 2012/2013 round of the Ghana Living Standard Survey (GLSS6).
Figure 8: Change in welfare of households as producers by area of residence
0.01
0.005
0
-0.005
--0.01
-0.15
Log per capita expenditure
Wel
fare
Cha
nge
(%)
Urban
5 76 8 9 10
Female-headedMale-headed
National
0
-0.01
-0.02
--0.03
-0.04
Log per capita expenditure
Wel
fare
Cha
nge
(%)
Rural
5 76 8 9 10
Female-headedMale-headed
National
Source: Prepared by the author based on the 2012/2013 round of the Ghana Living Standard Survey (GLSS6).
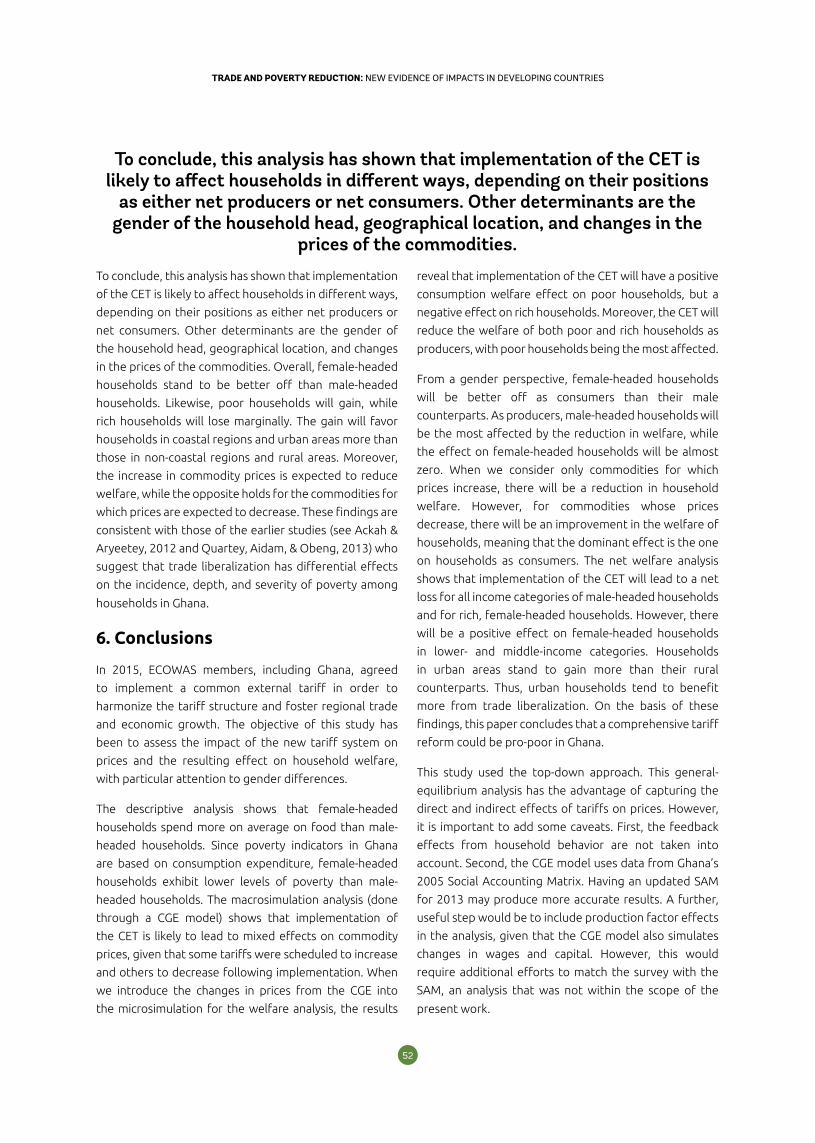
5352
TRADE AND POVERTY REDUCTION: NEW EVIDENCE OF IMPACTS IN DEVELOPING COUNTRIESTRADE AND POVERTY REDUCTION: NEW EVIDENCE OF IMPACTS IN DEVELOPING COUNTRIES
To conclude, this analysis has shown that implementation
of the CET is likely to affect households in different ways,
depending on their positions as either net producers or
net consumers. Other determinants are the gender of
the household head, geographical location, and changes
in the prices of the commodities. Overall, female-headed
households stand to be better off than male-headed
households. Likewise, poor households will gain, while
rich households will lose marginally. The gain will favor
households in coastal regions and urban areas more than
those in non-coastal regions and rural areas. Moreover,
the increase in commodity prices is expected to reduce
welfare, while the opposite holds for the commodities for
which prices are expected to decrease. These findings are
consistent with those of the earlier studies (see Ackah &
Aryeetey, 2012 and Quartey, Aidam, & Obeng, 2013) who
suggest that trade liberalization has differential effects
on the incidence, depth, and severity of poverty among
households in Ghana.
6. Conclusions
In 2015, ECOWAS members, including Ghana, agreed
to implement a common external tariff in order to
harmonize the tariff structure and foster regional trade
and economic growth. The objective of this study has
been to assess the impact of the new tariff system on
prices and the resulting effect on household welfare,
with particular attention to gender differences.
The descriptive analysis shows that female-headed
households spend more on average on food than male-
headed households. Since poverty indicators in Ghana
are based on consumption expenditure, female-headed
households exhibit lower levels of poverty than male-
headed households. The macrosimulation analysis (done
through a CGE model) shows that implementation of
the CET is likely to lead to mixed effects on commodity
prices, given that some tariffs were scheduled to increase
and others to decrease following implementation. When
we introduce the changes in prices from the CGE into
the microsimulation for the welfare analysis, the results
reveal that implementation of the CET will have a positive
consumption welfare effect on poor households, but a
negative effect on rich households. Moreover, the CET will
reduce the welfare of both poor and rich households as
producers, with poor households being the most affected.
From a gender perspective, female-headed households
will be better off as consumers than their male
counterparts. As producers, male-headed households will
be the most affected by the reduction in welfare, while
the effect on female-headed households will be almost
zero. When we consider only commodities for which
prices increase, there will be a reduction in household
welfare. However, for commodities whose prices
decrease, there will be an improvement in the welfare of
households, meaning that the dominant effect is the one
on households as consumers. The net welfare analysis
shows that implementation of the CET will lead to a net
loss for all income categories of male-headed households
and for rich, female-headed households. However, there
will be a positive effect on female-headed households
in lower- and middle-income categories. Households
in urban areas stand to gain more than their rural
counterparts. Thus, urban households tend to benefit
more from trade liberalization. On the basis of these
findings, this paper concludes that a comprehensive tariff
reform could be pro-poor in Ghana.
This study used the top-down approach. This general-
equilibrium analysis has the advantage of capturing the
direct and indirect effects of tariffs on prices. However,
it is important to add some caveats. First, the feedback
effects from household behavior are not taken into
account. Second, the CGE model uses data from Ghana’s
2005 Social Accounting Matrix. Having an updated SAM
for 2013 may produce more accurate results. A further,
useful step would be to include production factor effects
in the analysis, given that the CGE model also simulates
changes in wages and capital. However, this would
require additional efforts to match the survey with the
SAM, an analysis that was not within the scope of the
present work.
To conclude, this analysis has shown that implementation of the CET is likely to affect households in different ways, depending on their positions
as either net producers or net consumers. Other determinants are the gender of the household head, geographical location, and changes in the
prices of the commodities.
5352
TRADE AND POVERTY REDUCTION: NEW EVIDENCE OF IMPACTS IN DEVELOPING COUNTRIESTRADE AND POVERTY REDUCTION: NEW EVIDENCE OF IMPACTS IN DEVELOPING COUNTRIES
Ackah C. and E. Aryeetey (2012). Globalization, trade and poverty in Ghana. International Development Research Centre. Ottawa.
Adams C. (1993). For Good and Evil: The Impact of Taxes on the Course of Civilization. Rowman and Littlefield.
AfDB, OECD and UNDP (2017). African Economic Outlook 2017: entrepreneurship and industrialization. OECD Development Centre, Paris. Available at: www.africaneconomicoutlook.org
Bhasin, V.K. and S. Annim (2005). Impact of elimination of trade taxes on poverty and income distribution in Ghana. Revised Report submitted to the Global Development Network (January).
Bird, K. (2004). A framework to analyse linkages between trade policy, poverty reduction and sustainable development. Paper for the Africa Trade and Poverty Programme of the Department for International Development. London.
Bourguignon, F. and L. Savard (2008). Distributional effects of trade reform: An integrated macro-micro model applied to the Philippines. In: The Impact of Macroeconomic Policies on Poverty and Income Distribution: Macro-micro Evaluation Techniques and Tools, F. Bourguignon, M. Bussolo, and A. Pereira da Silva, eds. Palgrave-Macmillan. Houndmills, United Kingdom.
Breisinger, C., J. Thurlow and M. Duncan (2007). A 2005 social accounting matrix (SAM) for Ghana. International Food Policy Research Institute. Washington, DC.
Breisinger, C., X. Diao, J. Thurlow and R.M. Al-Hassan (2008). Agriculture for development in Ghana: New opportunities and challenges. IFPRI Discussion Paper 00784. International Food Policy Research Institute. Washington, DC.
Calvo, P.A. (2014). Welfare impact of wheat export restrictions in Argentina: Non-parametric analysis on urban households. In: Trade Policies, Household Welfare and Poverty Alleviation: Case Studies from the Virtual Institute Academic Network. UNCTAD/DGS/2014/3. United Nations Conference on Trade and Development. New York and Geneva. Available at: http://vi.unctad.org/tap/docs/chapters/argentina.pdf.
De Melo, J., and A. Laski (2014). Reflections on adapting to the ECOWAS CET. FERDI Policy Brief B-107. Fondation pour les Études et Recherches sur le Développement International. Available at: http://archive-ouverte.unige.ch/unige: 46919.
Deaton, A. (1989). Rice prices and income distribution in Thailand: a non-parametric analysis. The Economic Journal 99: 1–37.
Diao, X. (2011). Economywide impact of Avian influenza in Ghana–A dynamic computable general equilibrium (DCGE) model analysis. International Journal of Livestock Production 2(10): 145–58.
Ghana Statistical Service (2007). Pattern and trends of poverty in Ghana, 1991–2006. Ghana Statistical Service. Accra.
Ghana Statistical Service (2014). Ghana Living Standards Survey round 6 (GLSS 6): Main report. Ghana Statistical Service. Accra.
Gutowski, A., T. Knedlik, P. N. Osakwe, I. Ramdoo and K. Wohlmuth (Eds.). (2016). Africa’s Progress in Regional and Global Economic Integration-Towards Transformative Regional Integration (Vol. 18). LIT Verlag Münster.
Harrison, A. and H. Tang (2005). Trade Liberalization: Why so Much Controversy in Growth in the 1990s: Learning from a Decade of Reforms. Edited by N. Roberto Zagha, World Bank, 2005.
Kareem, O.I. (2014). The welfare impact in Nigeria of the ECOWAS common external tariff: A distributional effects analysis. In: Trade Policies, Household Welfare and Poverty Alleviation: Case Studies from the Virtual Institute Academic Network. UNCTAD/DGS/2014/3. United Nations Conference on Trade and Development. New York and Geneva. Available at: http://vi.unctad.org/tap/docs/chapters/nigeria.pdf.
References
5554
TRADE AND POVERTY REDUCTION: NEW EVIDENCE OF IMPACTS IN DEVELOPING COUNTRIESTRADE AND POVERTY REDUCTION: NEW EVIDENCE OF IMPACTS IN DEVELOPING COUNTRIES
Löfgren, H., R.L. Harris and S. Robinson (2002). A standard computable general equilibrium (CGE) model in GAMS (vol. 5). International Food Policy Research Institute. Washington, DC.
Marchand, B.U. (2012). Tariff pass-through and the distributional effects of trade liberalization. Journal of Development Economics 99(2): 265–81.
Nicita, A. (2009). The price effect of tariff liberalization: Measuring the impact on household welfare. Journal of Development Economics 89(1): 19–27.
Office of the United States Trade Representative (2014). 2014 National trade estimate report on foreign trade barriers.Available at: https://ustr.gov/sites/default/files/2014%20NTE%20Report%20on%20FTB.pdf.
Osakwe, P.N. (2015). Transformative regionalism, trade and the challenge of poverty reduction in Africa. UNCTAD Trade and Poverty Paper Series No. 1. United Nations Conference on Trade and Development. New York and Geneva.
Quartey, P., P. Aidam and C.K. Oben (2013). The impact of trade liberalization on poverty in Ghana. Available at: https://www.gtap.agecon.purdue.edu/resources/download/2665.pdf.
Roquefeuil, Q.D., D. Plunkett and F. Ofei (2014). The impact of closer regional economic integration on food security in West Africa: Focus on the ECOWAS common external tariff. ECDPM Discussion Paper 154. European Centre for Development Policy Management. Maastricht.
UNCTAD (2010). Virtual Institute teaching material on trade and poverty. United Nations Conference on Trade and Development. New York and Geneva.
UNCTAD (2012). Virtual Institute teaching material on contemporary issues in international macroeconomics, trade and finance. UNCTAD/GDS/2011/2. United Nations Conference on Trade and Development. New York and Geneva.
UNCTAD (2016). African Continental Free Trade Area: Policy and negotiation options for trade in goods. United Nations Conference on Trade and Development. New York and Geneva. Available at: http://unctad.org/en/PublicationsLibrary/webditc2016d7_en.pdf.
United Nations (2008). ISIC Revision 4.0. International Standard Industrial Classification of All Economic Activities. Available at: http://unstats.un.org/unsd/cr/registry/isic-4.asp
Winters, L.A., N. McCulloch and A. McKay (2004). Trade liberalization and poverty: the evidence so far. Journal of Economic Literature 42(1): 72–115.
World Bank Group (2015). Assessing the Economic Impact of the ECOWAS CET and Economic Partnership Agreement on Ghana. World Bank, Washington, DC. Available at: https://openknowledge.worldbank.org/handle/10986/23242 License: CC BY 3.0 IGO.”
WTO (2014). Trade policy review report by the secretariat, Ghana. Report No. WT/TPR/S/298. Geneva. World Trade Organization.
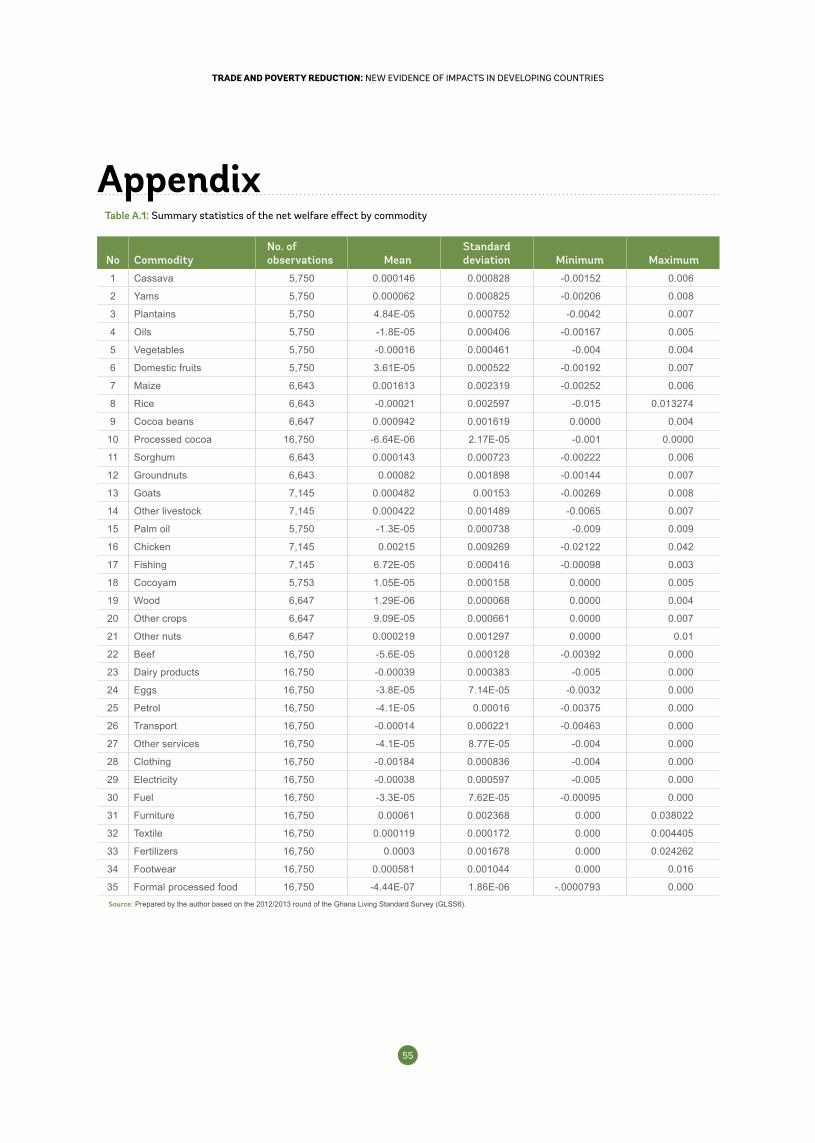
5554
TRADE AND POVERTY REDUCTION: NEW EVIDENCE OF IMPACTS IN DEVELOPING COUNTRIESTRADE AND POVERTY REDUCTION: NEW EVIDENCE OF IMPACTS IN DEVELOPING COUNTRIES
Table A.1: Summary statistics of the net welfare effect by commodity
No CommodityNo. of observations Mean
Standard deviation Minimum Maximum
1 Cassava 5,750 0.000146 0.000828 -0.00152 0.006
2 Yams 5,750 0.000062 0.000825 -0.00206 0.008
3 Plantains 5,750 4.84E-05 0.000752 -0.0042 0.007
4 Oils 5,750 -1.8E-05 0.000406 -0.00167 0.005
5 Vegetables 5,750 -0.00016 0.000461 -0.004 0.004
6 Domestic fruits 5,750 3.61E-05 0.000522 -0.00192 0.007
7 Maize 6,643 0.001613 0.002319 -0.00252 0.006
8 Rice 6,643 -0.00021 0.002597 -0.015 0.013274
9 Cocoa beans 6,647 0.000942 0.001619 0.0000 0.004
10 Processed cocoa 16,750 -6.64E-06 2.17E-05 -0.001 0.0000
11 Sorghum 6,643 0.000143 0.000723 -0.00222 0.006
12 Groundnuts 6,643 0.00082 0.001898 -0.00144 0.007
13 Goats 7,145 0.000482 0.00153 -0.00269 0.008
14 Other livestock 7,145 0.000422 0.001489 -0.0065 0.007
15 Palm oil 5,750 -1.3E-05 0.000738 -0.009 0.009
16 Chicken 7,145 0.00215 0.009269 -0.02122 0.042
17 Fishing 7,145 6.72E-05 0.000416 -0.00098 0.003
18 Cocoyam 5,753 1.05E-05 0.000158 0.0000 0.005
19 Wood 6,647 1.29E-06 0.000068 0.0000 0.004
20 Other crops 6,647 9.09E-05 0.000661 0.0000 0.007
21 Other nuts 6,647 0.000219 0.001297 0.0000 0.01
22 Beef 16,750 -5.6E-05 0.000128 -0.00392 0.000
23 Dairy products 16,750 -0.00039 0.000383 -0.005 0.000
24 Eggs 16,750 -3.8E-05 7.14E-05 -0.0032 0.000
25 Petrol 16,750 -4.1E-05 0.00016 -0.00375 0.000
26 Transport 16,750 -0.00014 0.000221 -0.00463 0.000
27 Other services 16,750 -4.1E-05 8.77E-05 -0.004 0.000
28 Clothing 16,750 -0.00184 0.000836 -0.004 0.000
29 Electricity 16,750 -0.00038 0.000597 -0.005 0.000
30 Fuel 16,750 -3.3E-05 7.62E-05 -0.00095 0.000
31 Furniture 16,750 0.00061 0.002368 0.000 0.038022
32 Textile 16,750 0.000119 0.000172 0.000 0.004405
33 Fertilizers 16,750 0.0003 0.001678 0.000 0.024262
34 Footwear 16,750 0.000581 0.001044 0.000 0.016
35 Formal processed food 16,750 -4.44E-07 1.86E-06 -.0000793 0.000Source: Prepared by the author based on the 2012/2013 round of the Ghana Living Standard Survey (GLSS6).
Appendix
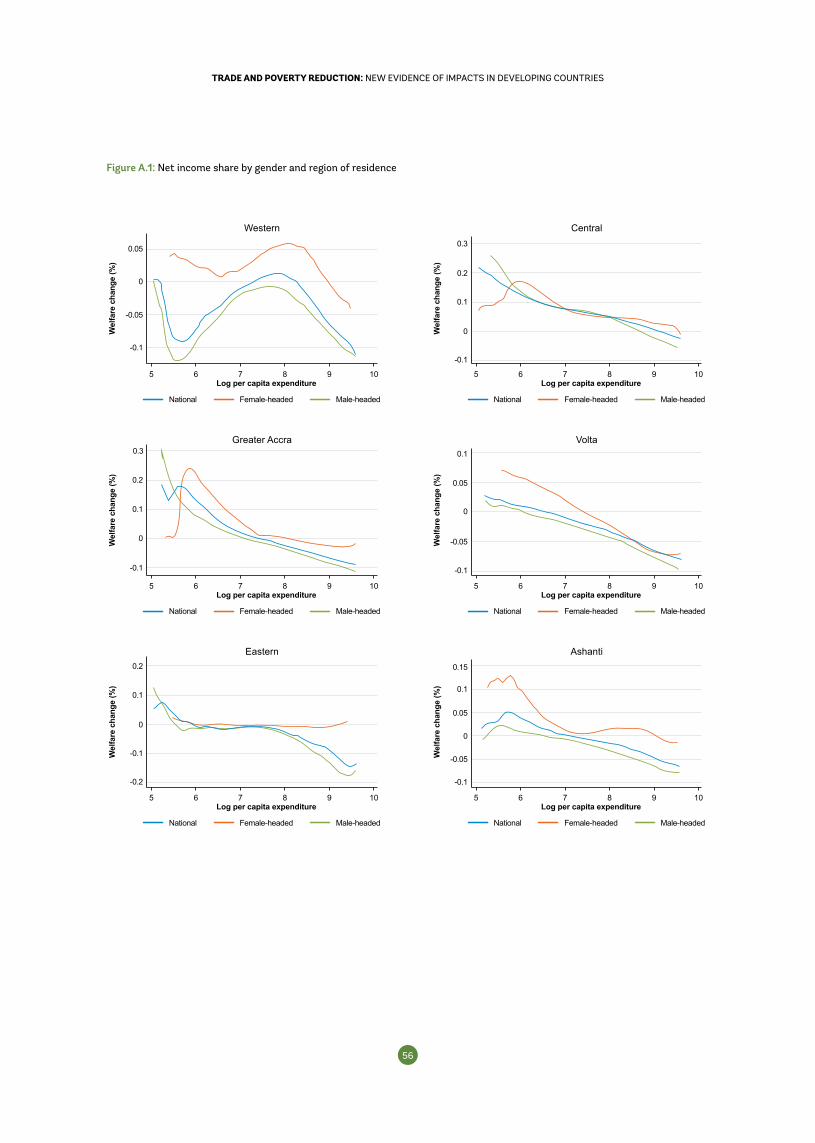
5756
TRADE AND POVERTY REDUCTION: NEW EVIDENCE OF IMPACTS IN DEVELOPING COUNTRIESTRADE AND POVERTY REDUCTION: NEW EVIDENCE OF IMPACTS IN DEVELOPING COUNTRIES
Figure A.1: Net income share by gender and region of residence
0.05
0
-0.05
-0.1
Log per capita expenditure
Wel
fare
cha
nge
(%)
Western
5 6 87 9 10
Female-headed Male-headedNational
0.3
0.2
0.1
-0.1
0
Log per capita expenditure
Wel
fare
cha
nge
(%)
Central
5 6 87 9 10
Female-headed Male-headedNational
0.3
0.2
0
0.1
-0.1
Log per capita expenditure
Wel
fare
cha
nge
(%)
Greater Accra
5 6 87 9 10
Female-headed Male-headedNational
0.1
0.05
0
-0.1
-0.05
Log per capita expenditure
Wel
fare
cha
nge
(%)
Volta
5 6 87 9 10
Female-headed Male-headedNational
0.2
0.1
-0.1
0
-0.2
Log per capita expenditure
Wel
fare
cha
nge
(%)
Eastern
5 6 87 9 10
Female-headed Male-headedNational
0.15
0.1
0
0.05
-0.1
-0.05
Log per capita expenditure
Wel
fare
cha
nge
(%)
Ashanti
5 6 87 9 10
Female-headed Male-headedNational
0
-0.05
-0.1
-0.15
Log per capita expenditure
Wel
fare
cha
nge
(%)
Brong Ahafo
5 6 87 9 10
Female-headed Male-headedNational
0.1
0.05
0
-0.1
-0.05
Log per capita expenditure
Wel
fare
cha
nge
(%)
Northern
5 6 87 9 10
Female-headed Male-headedNational
0.2
0.1
0
-0.2
-0.1
Log per capita expenditure
Wel
fare
cha
nge
( %)
Upper East
5 6 87 9 10
Female-headed Male-headedNational
0.2
0.1
0
-0.2
-0.1
Log per capita expenditure
Wel
fare
cha
nge
(%)
Upper West
5 6 87 9 10
Female-headed Male-headedNational
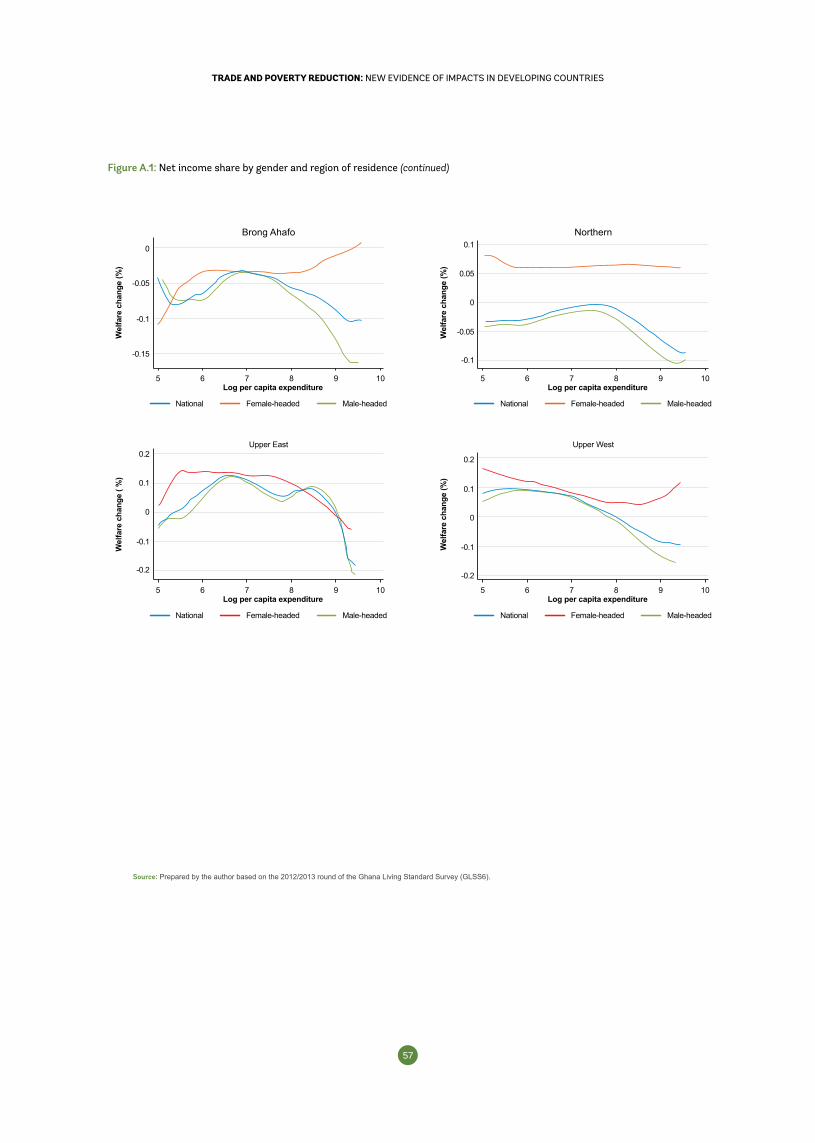
5756
TRADE AND POVERTY REDUCTION: NEW EVIDENCE OF IMPACTS IN DEVELOPING COUNTRIESTRADE AND POVERTY REDUCTION: NEW EVIDENCE OF IMPACTS IN DEVELOPING COUNTRIES
Figure A.1: Net income share by gender and region of residence (continued)
0.05
0
-0.05
-0.1
Log per capita expenditure
Wel
fare
cha
nge
(%)
Western
5 6 87 9 10
Female-headed Male-headedNational
0.3
0.2
0.1
-0.1
0
Log per capita expenditure
Wel
fare
cha
nge
(%)
Central
5 6 87 9 10
Female-headed Male-headedNational
0.3
0.2
0
0.1
-0.1
Log per capita expenditure
Wel
fare
cha
nge
(%)
Greater Accra
5 6 87 9 10
Female-headed Male-headedNational
0.1
0.05
0
-0.1
-0.05
Log per capita expenditure
Wel
fare
cha
nge
(%)
Volta
5 6 87 9 10
Female-headed Male-headedNational
0.2
0.1
-0.1
0
-0.2
Log per capita expenditure
Wel
fare
cha
nge
(%)
Eastern
5 6 87 9 10
Female-headed Male-headedNational
0.15
0.1
0
0.05
-0.1
-0.05
Log per capita expenditure
Wel
fare
cha
nge
(%)
Ashanti
5 6 87 9 10
Female-headed Male-headedNational
0
-0.05
-0.1
-0.15
Log per capita expenditure
Wel
fare
cha
nge
(%)
Brong Ahafo
5 6 87 9 10
Female-headed Male-headedNational
0.1
0.05
0
-0.1
-0.05
Log per capita expenditure
Wel
fare
cha
nge
(%)
Northern
5 6 87 9 10
Female-headed Male-headedNational
0.2
0.1
0
-0.2
-0.1
Log per capita expenditure
Wel
fare
cha
nge
( %)
Upper East
5 6 87 9 10
Female-headed Male-headedNational
0.2
0.1
0
-0.2
-0.1
Log per capita expenditure
Wel
fare
cha
nge
(%)
Upper West
5 6 87 9 10
Female-headed Male-headedNational
Source: Prepared by the author based on the 2012/2013 round of the Ghana Living Standard Survey (GLSS6).
5958
TRADE AND POVERTY REDUCTION: NEW EVIDENCE OF IMPACTS IN DEVELOPING COUNTRIESTRADE AND POVERTY REDUCTION: NEW EVIDENCE OF IMPACTS IN DEVELOPING COUNTRIES
Exporting, Importing and Wages in Africa: Evidence from Matched
Employer-Employee data1
1. Introduction
The economic and social development of the
African continent has been on the agenda of
policy makers and the international community
for decades. With over a billion inhabitants
and the fastest growing population worldwide, the
African market presents an enormous potential. Despite
remarkable economic growth rates, however, many
countries on the continent struggle to translate this
potential into significant improvements in socio-economic
indicators. International trade is considered by many as
one of the main contributors to reductions in poverty and
the improvement of livelihoods (Dollar and Kraay, 2004;
Le Goff and Singh, 2014). This stance has been adopted
in global policy making, with trade forming an integral
part of the 2030 Sustainable Development Agenda
of the United Nations. The Sustainable Development
Goals (SDG) include the objective to double the share
of least developed countries’ (LDC) exports in global
exports by 2020. Thirty-four of the 48 LDCs are located
on the African continent, implying that this endeavor is
particularly relevant for Africa.
International trade is also viewed by a large number of
policy makers in Africa as a potential driver of sustainable
Marta Duda-Nyczak, United Nations Economic Commission for Africa (UNECA)2
Christian Viegelahn, International Labour Organization (ILO)3
1 All views expressed in this paper are those of the authors and do not reflect those of the institutions they are affiliated with. The authors would like to thank colleagues from the International Labour Organization, the African Development Bank, the World Bank and the World Trade Organization for their comments on earlier versions of this paper. In particular, we would like to thank Paul Brenton, Michela Esposito, Marcus Bartley Johns, Linguère Mously Mbaye, Mustapha Sadni Jallab, Bill Shaw and Robert Teh. The authors would also like to thankfully acknowledge comments from participants of the African Economic Conference in Addis Ababa in December 2017.
2 United Nations Economic Commission for Africa (UNECA). Email:[email protected] International Labour Organization (ILO), Research Department. Email: [email protected]
economic and social development. This has found
expression in the rapid shift towards a more integrated
African market in recent years. In particular, trade within
some of the Regional Economic Communities (RECs)
has been liberalized continuously. Current trade policy
focuses on connecting some of the existing free trade
areas to create an even larger internal market, with the
ultimate objective of a customs union that integrates
all countries in Africa. Negotiations for the Tripartite
Free Trade Area, a free trade agreement between
the Common Market for Eastern and Southern Africa,
the East African Community and the Southern Africa
Development Community, consisting of 27 countries,
were launched in 2011. Also, negotiations are underway
to create the Continental Free Trade Area integrating the
trade in goods and services between 54 member states
of the African Union.
These developments are likely to increase the number
of African firms that are able to engage in trade. The
question arises whether this opening up to trade can
benefit workers in terms of higher wages. Wages are
an important form of labor income in many countries.
The share of workers in wage and salaried employment
has been growing rapidly, even in Africa where informal
employment arrangements still tend to dominate.
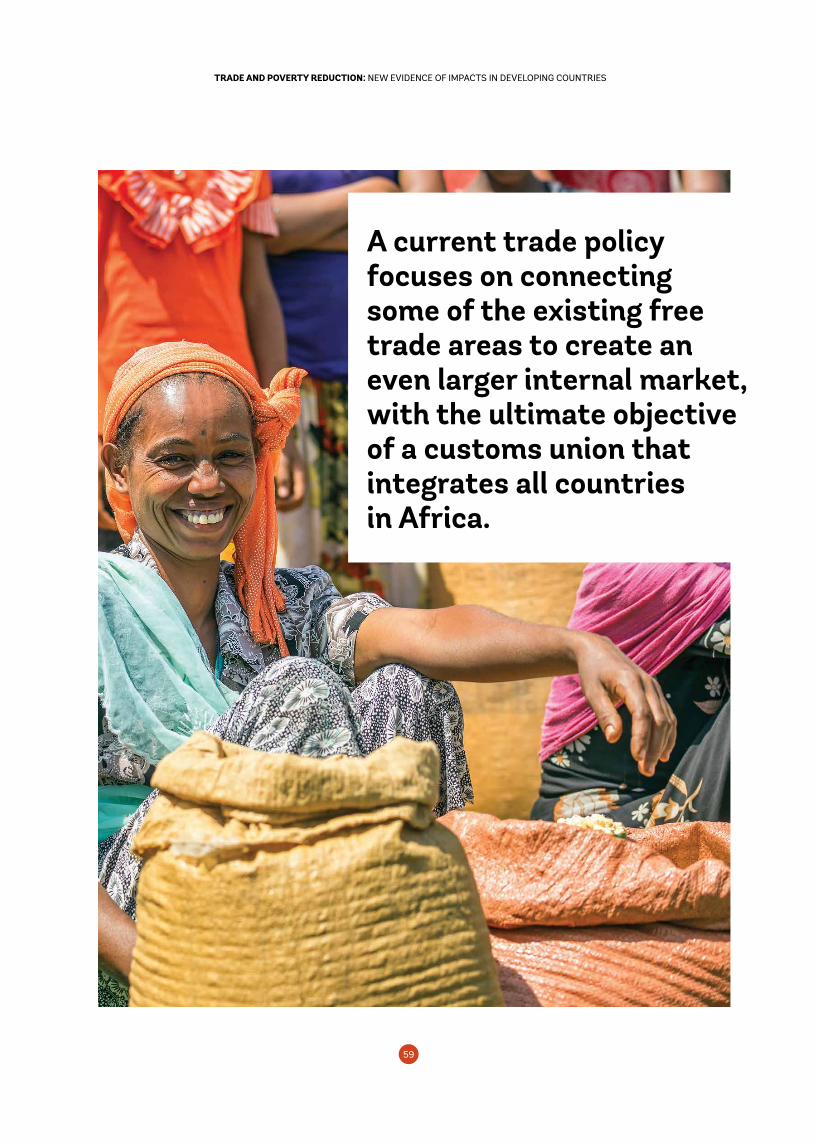
5958
TRADE AND POVERTY REDUCTION: NEW EVIDENCE OF IMPACTS IN DEVELOPING COUNTRIESTRADE AND POVERTY REDUCTION: NEW EVIDENCE OF IMPACTS IN DEVELOPING COUNTRIES
Exporting, Importing and Wages in Africa: Evidence from Matched
Employer-Employee data1
Marta Duda-Nyczak, United Nations Economic Commission for Africa (UNECA)2
Christian Viegelahn, International Labour Organization (ILO)3
A current trade policy focuses on connecting some of the existing free trade areas to create an even larger internal market, with the ultimate objective of a customs union that integrates all countries in Africa.
Photo credit: Bigstock Photo
6160
TRADE AND POVERTY REDUCTION: NEW EVIDENCE OF IMPACTS IN DEVELOPING COUNTRIESTRADE AND POVERTY REDUCTION: NEW EVIDENCE OF IMPACTS IN DEVELOPING COUNTRIES
According to ILO estimates (ILO, 2018), almost one-third
of all workers in Africa were wage earners in 2017, many
of them employed by the private sector. The wage level
determines these workers’ standard of living, and low
wage levels are often directly related to the prevalence
of poverty. Indeed, labor income in Africa is often not
sufficient to lift workers above poverty levels, and about
56% of all African workers lived in either moderate or
extreme poverty, on less than $3.10 PPP a day, in 2017.
This paper uses a novel dataset that includes firm-level
and employee-level data to explore the relationship
between exporting, importing and wages in African
manufacturing firms. This dataset forms part of the
World Bank Enterprise Survey and comprises 65 firm-
level surveys conducted in 47 African countries over
2006–2014, with information on firms’ export and import
status, as well as information on the average wage. For
16 of these firm-level surveys, matched employee data
with information on individual worker wages are available
to complement the firm-level analysis. These data are
comparable across all countries included and enable us
to control for individual worker characteristics, which is
unique for Africa. The data also facilitate analysis of the
relationship between firms’ export and import status,
and wages, by sector and by country.
There is a large body of literature that has looked at the
relationship between trade at the firm level and average
wages that firms pay to their workers, with studies largely
confirming a wage premium of firms engaged in trade.
For manufacturing firms in the United States, it has
been documented that both importers and exporters
pay higher wages on average than non-traders (Bernard,
Jensen, Redding and Schott, 2007, 2012). Based on
employer-employee level data for Germany and Italy, it
has been found that exporters pay higher wages than
non-exporters, after controlling for various firm and
worker characteristics (Schank, Schnabel and Wagner,
2007; Macis and Schivardi, 2016). There is also evidence
of a positive wage premium of exporting for China,
driven by different firm characteristics such as ownership,
export orientation and location (Fu and Wu, 2013). Also
for Mexico, exporting has been found to increase wages,
especially at the upper end of the wage distribution
(Frías, Kaplan and Verhoogen, 2012). Firm-level evidence
from Indonesia suggests that increased access to foreign
inputs through trade liberalization has led to higher
wages, while the impact of a decline in output tariffs is
less pronounced (Amiti and Davis, 2011).
There are various channels through which firms’ export
and import status can affect wages at the firm level. For
a firm to participate in international trade, it is important
to have a high-skilled workforce, which in the presence of
a skill premium on wages then leads to a higher average
firm-level wage. The trading activity of a firm can also
give rise to technology upgrading, induced by technology
transfers from the trading partner, which may increase
workers’ productivity and can therefore lead to higher
wages. Moreover, the extension of a firm’s business to
export markets increases the scale of a firm, allowing
it to benefit from economies of scale, and some of
these benefits may be passed on to workers in terms of
higher wages. Assuming a certain degree of rent sharing
between firms and workers, any standard bargaining
model would predict that the gains in productivity that
are reaped by the firm would at least partially passed
on to workers in terms of higher wages, depending on
workers’ bargaining power.
The wages that firms are able to pay are strongly related
to firm performance. Both exporting and importing
involves fixed costs that only the most productive firms
can afford to pay, which implies that only firms whose
productivity exceeds a certain threshold engage in trade
(Melitz, 2003; Kasahara and Lapham, 2013). At the same
time, firms can learn by exporting, as they have to satisfy
the needs of foreign customers which may be more
demanding in terms of product quality, and also face
competition from foreign producers, which may force
them to become more productive (De Loecker, 2013).
But it is also likely that firms can derive productivity
gains from importing once they have started to import,
for example through learning from new technologies
embedded in foreign inputs, access to a better quality
of inputs, or access to a larger variety of inputs (Ethier,
1982; Markusen, 1989; Grossman and Helpman, 1991).
The empirical literature confirms such a positive impact
of increased access to foreign inputs on firm productivity
(Amiti and Konings, 2007; Stone and Shepherd, 2011;
Halpern, Koren and Szeidl, 2015), while restricted access
6160
TRADE AND POVERTY REDUCTION: NEW EVIDENCE OF IMPACTS IN DEVELOPING COUNTRIESTRADE AND POVERTY REDUCTION: NEW EVIDENCE OF IMPACTS IN DEVELOPING COUNTRIES
to foreign inputs in turn can lead to within-firm input
reallocation with a negative impact on firm performance
(Vandenbussche and Viegelahn, 2016).
There is a vast body of literature that confirms that
wages that women receive are on average lower than
those of men (Blau and Kahn, 2017). The question arises
whether the wage premium of exporting and importing
for women differs from the corresponding premium for
men. Empirical evidence has so far been mixed. Using
employer-employee-level data from Norway, the gender
wage gap has been found to be larger within exporting
firms than within non-exporting firms, provided that
women are perceived by employers to be less committed
workers than men (Boler, Javorcik and Ulltveit-Moe,
2015). Policy measures that decrease these perceived
gender differences in commitment are found to narrow
differences in the gender wage gap. Other studies in
contrast find evidence for a lower gender wage gap in
exporting firms and higher wages for women in exporting
firms (World Bank, 2012).
Labor income in Africa is often not sufficient to lift workers above poverty levels, and about 56% of all African workers lived in either moderate or extreme poverty, on less than $3.10 PPP a day, in 2017.
The number of studies that look into the firm-level
consequences of trade in the African context is limited,
given the scarcity of firm-level databases from this region.
Milner and Tandrayen (2007) investigate the relationship
between exporting and wages, using employer-employee
matched data for manufacturing firms in six countries in
Sub-Saharan Africa. They find a positive overall association
between individual earnings and the export status of the
firm. Yet, they find that the wage premium is positive
only when firms export to African markets, and it turns
negative when exporting to more competitive markets.
In a study with larger country coverage, exporting is
found to have positive spinoffs on employment and
wages across a wide range of developing countries,
including countries on the African continent (Brambilla et
al., 2017). There are to our knowledge no studies in the
African context that focus on importing and its impact on
the labor market.
Other studies focus on the relationship between
exporting and productivity. Based on firm-level data
6362
TRADE AND POVERTY REDUCTION: NEW EVIDENCE OF IMPACTS IN DEVELOPING COUNTRIESTRADE AND POVERTY REDUCTION: NEW EVIDENCE OF IMPACTS IN DEVELOPING COUNTRIES
from Cameroon, Ghana, Kenya and Zimbabwe, there is
evidence for both firm self-selection into exporting and
learning-by-exporting (Bigsten et al., 2004). A causal
relationship between exporting and productivity has also
been found on the basis of firm-level data for Ethiopian
manufacturing firms, with strong evidence in favor of both
the self-selection and learning-by-exporting hypotheses,
demonstrating that exporters pay higher average wages
and employ more workers than non-exporters (Bigsten
and Gebreeyesus, 2009). Mengistae and Pattillo (2004)
show an average total factor productivity premium
and a premium in productivity growth for exporting
manufacturers in Ethiopia, Ghana and Kenya. Some
evidence also has recently been provided on the impact
of increased access to foreign inputs. Bigsten et al. (2016)
analyze firm-level data for Ethiopian manufacturing firms
and show that a reduction in output tariffs has no impact
on firms’ productivity, while reductions in input tariffs
increase firms’ productivity.
This paper contributes to the literature in four ways.
First, this is among the first papers that uses employer-
employee level data in the African context. With these
data, we are able to measure the average firm-level wage
premium of exporting and importing, controlling for a
variety of firm-level characteristics. Similarly, we are able
to determine the average wage premium of individual
workers, after controlling not only for firm-level but
also for individual worker characteristics. Second, this
paper considers the relationship of both exporting and
importing to wages, adding to the literature that has
predominantly, and in the context of wages exclusively,
focused on exporting. Third, this paper investigates the
channels that make trading firms pay wages that are
different from non-trading firms. Finally, this paper adds
to the so far scarce literature on the gender wage gap
and its relation to firms’ exporter and importer status.
The results presented in this paper suggest that firm-level
wages paid by exporters to their workers are on average
higher than in firms not engaged in exporting, even
after controlling for firm characteristics such as capital
intensity, electricity intensity, foreign ownership and
firm age. The average wages paid by importers and non-
importers are statistically not significant from each other,
after adding firm age as a control variable. A positive
exporting premium on wages is confirmed when using
employer-employee data, which allows us to control for
individual worker characteristics. On the basis of these
data, we also do not find any positive wage premium of
importing, in line with the firm-level results. If anything,
workers employed by importers receive lower wages,
when compared to their counterparts in non-importing
firms.
This paper also investigates the channels that are driving
our results. We find that neither productivity gains
through increased skill utilization or the employment of
certain types of workers, nor productivity gains through
technology transfers can fully explain the positive wage
premium of exporting. Instead, it appears that the
positive wage premium of exporters is due to productivity
gains through economies of scale. The paper also finds
indirect evidence for a weaker bargaining power of
workers employed by importers, when compared with
those employed by non-importers. Finally, the paper
shows that there is no significant gender wage gap within
trading firms in the sample. This is different from non-
trading firms, where a statistically significant wage gap
can be identified.
The next section describes in more detail the data that
are used in this paper. Section 3 presents the underlying
empirical methodology to estimate the wage premium of
exporting and importing, both at the firm level and at the
employee level. Section 4 discusses the results. The final
section concludes.
2. Data2.1 Firm-level data
This paper uses firm-level data for manufacturing firms
from the World Bank Enterprise Surveys. The data are
cross-section data, comparable across different surveys.
The database consists in total of over 15,391 observations
for manufacturing firms, comprising data from 65
surveys conducted in 47 African countries between 2006
and 2014. For one country, the Democratic Republic
of Congo, data from three surveys are available. For
16 countries, we have data from two surveys. For the
remaining 30 countries, data have only been collected
once. For different surveys, the sample size varies
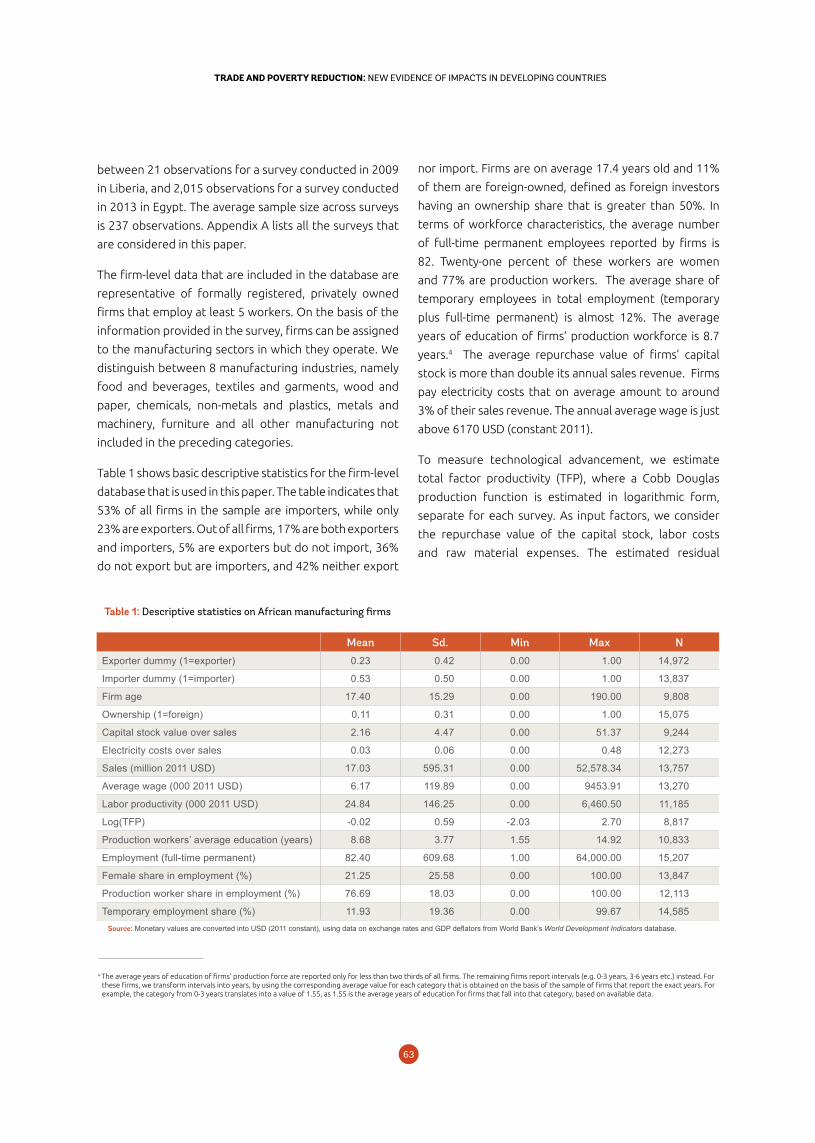
6362
TRADE AND POVERTY REDUCTION: NEW EVIDENCE OF IMPACTS IN DEVELOPING COUNTRIESTRADE AND POVERTY REDUCTION: NEW EVIDENCE OF IMPACTS IN DEVELOPING COUNTRIES
between 21 observations for a survey conducted in 2009
in Liberia, and 2,015 observations for a survey conducted
in 2013 in Egypt. The average sample size across surveys
is 237 observations. Appendix A lists all the surveys that
are considered in this paper.
The firm-level data that are included in the database are
representative of formally registered, privately owned
firms that employ at least 5 workers. On the basis of the
information provided in the survey, firms can be assigned
to the manufacturing sectors in which they operate. We
distinguish between 8 manufacturing industries, namely
food and beverages, textiles and garments, wood and
paper, chemicals, non-metals and plastics, metals and
machinery, furniture and all other manufacturing not
included in the preceding categories.
Table 1 shows basic descriptive statistics for the firm-level
database that is used in this paper. The table indicates that
53% of all firms in the sample are importers, while only
23% are exporters. Out of all firms, 17% are both exporters
and importers, 5% are exporters but do not import, 36%
do not export but are importers, and 42% neither export
Table 1: Descriptive statistics on African manufacturing firms
Mean Sd. Min Max N
Exporter dummy (1=exporter) 0.23 0.42 0.00 1.00 14,972
Importer dummy (1=importer) 0.53 0.50 0.00 1.00 13,837
Firm age 17.40 15.29 0.00 190.00 9,808
Ownership (1=foreign) 0.11 0.31 0.00 1.00 15,075
Capital stock value over sales 2.16 4.47 0.00 51.37 9,244
Electricity costs over sales 0.03 0.06 0.00 0.48 12,273
Sales (million 2011 USD) 17.03 595.31 0.00 52,578.34 13,757
Average wage (000 2011 USD) 6.17 119.89 0.00 9453.91 13,270
Labor productivity (000 2011 USD) 24.84 146.25 0.00 6,460.50 11,185
Log(TFP) -0.02 0.59 -2.03 2.70 8,817
Production workers’ average education (years) 8.68 3.77 1.55 14.92 10,833
Employment (full-time permanent) 82.40 609.68 1.00 64,000.00 15,207
Female share in employment (%) 21.25 25.58 0.00 100.00 13,847
Production worker share in employment (%) 76.69 18.03 0.00 100.00 12,113
Temporary employment share (%) 11.93 19.36 0.00 99.67 14,585Source: Monetary values are converted into USD (2011 constant), using data on exchange rates and GDP deflators from World Bank’s World Development Indicators database.
4 The average years of education of firms’ production force are reported only for less than two thirds of all firms. The remaining firms report intervals (e.g. 0-3 years, 3-6 years etc.) instead. For these firms, we transform intervals into years, by using the corresponding average value for each category that is obtained on the basis of the sample of firms that report the exact years. For example, the category from 0-3 years translates into a value of 1.55, as 1.55 is the average years of education for firms that fall into that category, based on available data.
nor import. Firms are on average 17.4 years old and 11%
of them are foreign-owned, defined as foreign investors
having an ownership share that is greater than 50%. In
terms of workforce characteristics, the average number
of full-time permanent employees reported by firms is
82. Twenty-one percent of these workers are women
and 77% are production workers. The average share of
temporary employees in total employment (temporary
plus full-time permanent) is almost 12%. The average
years of education of firms’ production workforce is 8.7
years.4 The average repurchase value of firms’ capital
stock is more than double its annual sales revenue. Firms
pay electricity costs that on average amount to around
3% of their sales revenue. The annual average wage is just
above 6170 USD (constant 2011).
To measure technological advancement, we estimate
total factor productivity (TFP), where a Cobb Douglas
production function is estimated in logarithmic form,
separate for each survey. As input factors, we consider
the repurchase value of the capital stock, labor costs
and raw material expenses. The estimated residual
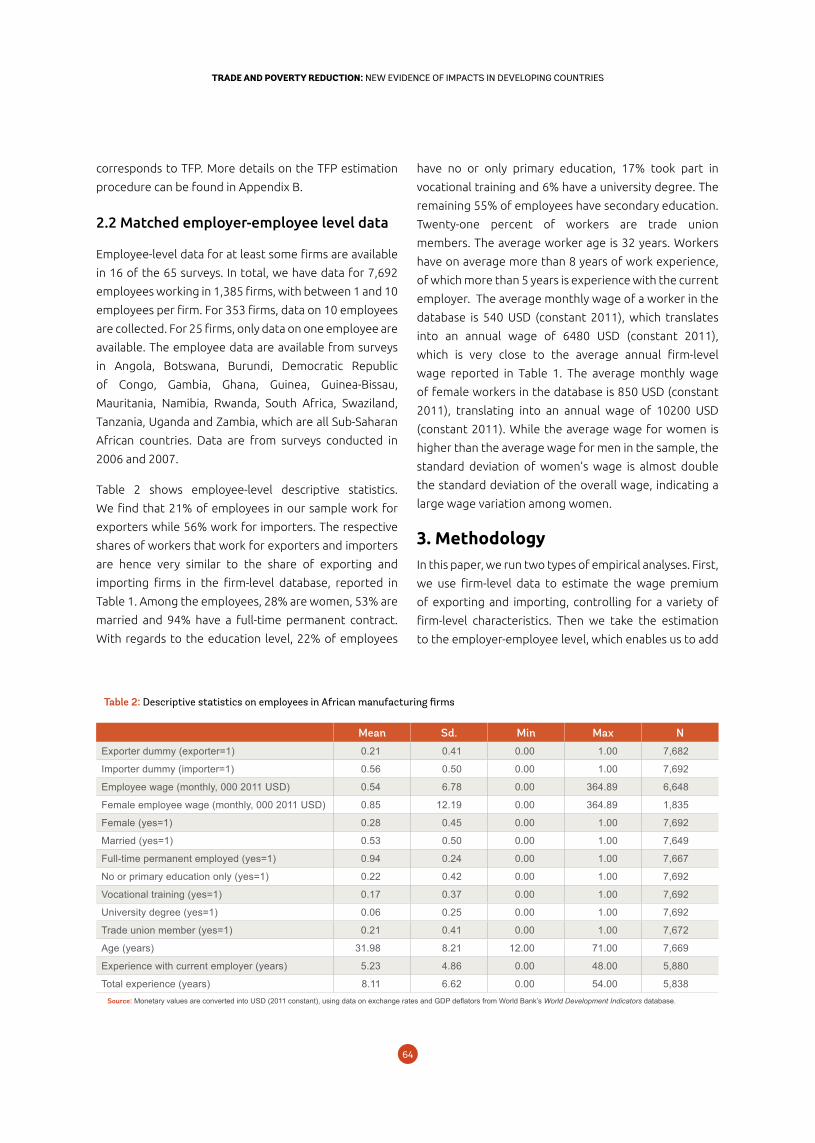
6564
TRADE AND POVERTY REDUCTION: NEW EVIDENCE OF IMPACTS IN DEVELOPING COUNTRIESTRADE AND POVERTY REDUCTION: NEW EVIDENCE OF IMPACTS IN DEVELOPING COUNTRIES
corresponds to TFP. More details on the TFP estimation
procedure can be found in Appendix B.
2.2 Matched employer-employee level data
Employee-level data for at least some firms are available
in 16 of the 65 surveys. In total, we have data for 7,692
employees working in 1,385 firms, with between 1 and 10
employees per firm. For 353 firms, data on 10 employees
are collected. For 25 firms, only data on one employee are
available. The employee data are available from surveys
in Angola, Botswana, Burundi, Democratic Republic
of Congo, Gambia, Ghana, Guinea, Guinea-Bissau,
Mauritania, Namibia, Rwanda, South Africa, Swaziland,
Tanzania, Uganda and Zambia, which are all Sub-Saharan
African countries. Data are from surveys conducted in
2006 and 2007.
Table 2 shows employee-level descriptive statistics.
We find that 21% of employees in our sample work for
exporters while 56% work for importers. The respective
shares of workers that work for exporters and importers
are hence very similar to the share of exporting and
importing firms in the firm-level database, reported in
Table 1. Among the employees, 28% are women, 53% are
married and 94% have a full-time permanent contract.
With regards to the education level, 22% of employees
Table 2: Descriptive statistics on employees in African manufacturing firms
Mean Sd. Min Max N
Exporter dummy (exporter=1) 0.21 0.41 0.00 1.00 7,682
Importer dummy (importer=1) 0.56 0.50 0.00 1.00 7,692
Employee wage (monthly, 000 2011 USD) 0.54 6.78 0.00 364.89 6,648
Female employee wage (monthly, 000 2011 USD) 0.85 12.19 0.00 364.89 1,835
Female (yes=1) 0.28 0.45 0.00 1.00 7,692
Married (yes=1) 0.53 0.50 0.00 1.00 7,649
Full-time permanent employed (yes=1) 0.94 0.24 0.00 1.00 7,667
No or primary education only (yes=1) 0.22 0.42 0.00 1.00 7,692
Vocational training (yes=1) 0.17 0.37 0.00 1.00 7,692
University degree (yes=1) 0.06 0.25 0.00 1.00 7,692
Trade union member (yes=1) 0.21 0.41 0.00 1.00 7,672
Age (years) 31.98 8.21 12.00 71.00 7,669
Experience with current employer (years) 5.23 4.86 0.00 48.00 5,880
Total experience (years) 8.11 6.62 0.00 54.00 5,838Source: Monetary values are converted into USD (2011 constant), using data on exchange rates and GDP deflators from World Bank’s World Development Indicators database.
have no or only primary education, 17% took part in
vocational training and 6% have a university degree. The
remaining 55% of employees have secondary education.
Twenty-one percent of workers are trade union
members. The average worker age is 32 years. Workers
have on average more than 8 years of work experience,
of which more than 5 years is experience with the current
employer. The average monthly wage of a worker in the
database is 540 USD (constant 2011), which translates
into an annual wage of 6480 USD (constant 2011),
which is very close to the average annual firm-level
wage reported in Table 1. The average monthly wage
of female workers in the database is 850 USD (constant
2011), translating into an annual wage of 10200 USD
(constant 2011). While the average wage for women is
higher than the average wage for men in the sample, the
standard deviation of women’s wage is almost double
the standard deviation of the overall wage, indicating a
large wage variation among women.
3. MethodologyIn this paper, we run two types of empirical analyses. First,
we use firm-level data to estimate the wage premium
of exporting and importing, controlling for a variety of
firm-level characteristics. Then we take the estimation
to the employer-employee level, which enables us to add
6564
TRADE AND POVERTY REDUCTION: NEW EVIDENCE OF IMPACTS IN DEVELOPING COUNTRIESTRADE AND POVERTY REDUCTION: NEW EVIDENCE OF IMPACTS IN DEVELOPING COUNTRIES
individual worker characteristics to our set of firm-level
control variables. Reported standard errors are always
robust.
At the firm-level, we estimate the following equations:
where equation (1) is estimated on the full sample
of manufacturing firms, equation (2) is estimated by
manufacturing sector m and equation (3) is estimated by
survey conducted in country c and year t. Index i stands
for a particular firm that belongs to a manufacturing
sector m and is observed in the survey conducted in
country c and year t.
The dependent variable logW stands for the logarithm
of the average wage paid by the firm to its employees,
calculated as total labor costs divided by the number of
full-time permanent employees.5 The exporter dummy
variable EX takes a value of one if the firm exports at least
some of its goods, including direct exports and exports
through an intermediary. Similarly, the importer dummy
variable IM takes a value of one if the firm imports at least
some of its raw material inputs, including both direct
imports and imports through an intermediary. β, βm and
βct are the main coefficients of interest and measure the
overall, sector-specific and survey-specific wage premium
of exporting. γ, γm and γct are the respective coefficients
that measure the wage premium of importing. The wage
premia of exporting and importing should be interpreted
respectively as average premia across export destination
countries and import origin countries.6 εct is a survey fixed
effect, εm is a sector fixed effect and εctmi is the error term.
With regards to firm-level control variables, as summarized
in vector X, we control for the type of economic activity
by including capital intensity—the ratio between the
repurchase value of the capital stock and sales—and
electricity intensity—the ratio between electricity costs
and sales—into the regression. The latter is intended to
control for the type of technology that is used. Electricity
costs are likely to be lower if production mainly occurs
through manual labor than if production is largely
automated. Moreover, we include foreign ownership
status and firm age as variables that might be correlated
with the average wage. Finally, we include the logarithm
of firm age to control for differences in wages between
start-ups and firms that have been longer in the market.
When moving to the employer-employee level, the
estimated equations look as follows:
where equation (4) is estimated on the full sample
of manufacturing firms, equation (5) is estimated by
manufacturing sector m and equation (6) is estimated by
survey conducted in country c and year t. The equations
are similar to (1)–(3), but now include variables that carry
a subscript w that stands for an individual employee. Now
wages are employee-specific and a new vector of control
variables accounts for individual worker characteristics, Y.7
As control variables, we include dummy variables that
respectively take on a value of one when the worker is
a woman, married, full-time permanent employed, or
trade union member. We also consider dummy variables
that indicate workers’ education level, including no or
only primary education, vocational training or a university
degree. We include workers’ age, workers’ total work
experience, and workers’ experience with the current
employer as explanatory variables. Moreover, we account
for the same set of firm characteristics as in the firm-level
regressions, with the exception of firm age, which is only
available in 3 out of the 16 surveys that have employee
data.8
5 This measure for the average wage is a proxy, given that labor costs in the numerator are the costs for all workers, while full-time permanent employment in the denominator does not include all workers. The use of the ratio between labor costs and the sum of full-time permanent and temporary employment as an alternative proxy does not affect any of our main results in this paper.
6 Data on import origin countries are not available. Data on export destination countries are only available for 22% of exporting firms, over half of which declare zero exports to developed countries. Most firms focus their trade on African countries. Some firms declare a mix of export destinations (with a third category of other countries). The non-existent or limited data on import origin countries or export destination countries prevent us from undertaking any analysis along these dimensions.
7 The survey fixed effects in equations (1) and (2) correspond to country-year fixed effects. The survey fixed effects in equations (4) and (5) also correspond to country-year fixed effects, which in this case are equivalent to country fixed effects, given that there is only one survey with employer-employee level data per country.
8 The employee-level data also includes information on whether a worker is foreigner, which could have an impact on the wage level. Still we decided to not use this variable as control variable, as only 5% of all workers in our sample are foreigners. We made sure that the main results of this paper also hold when excluding foreigners from our sample.
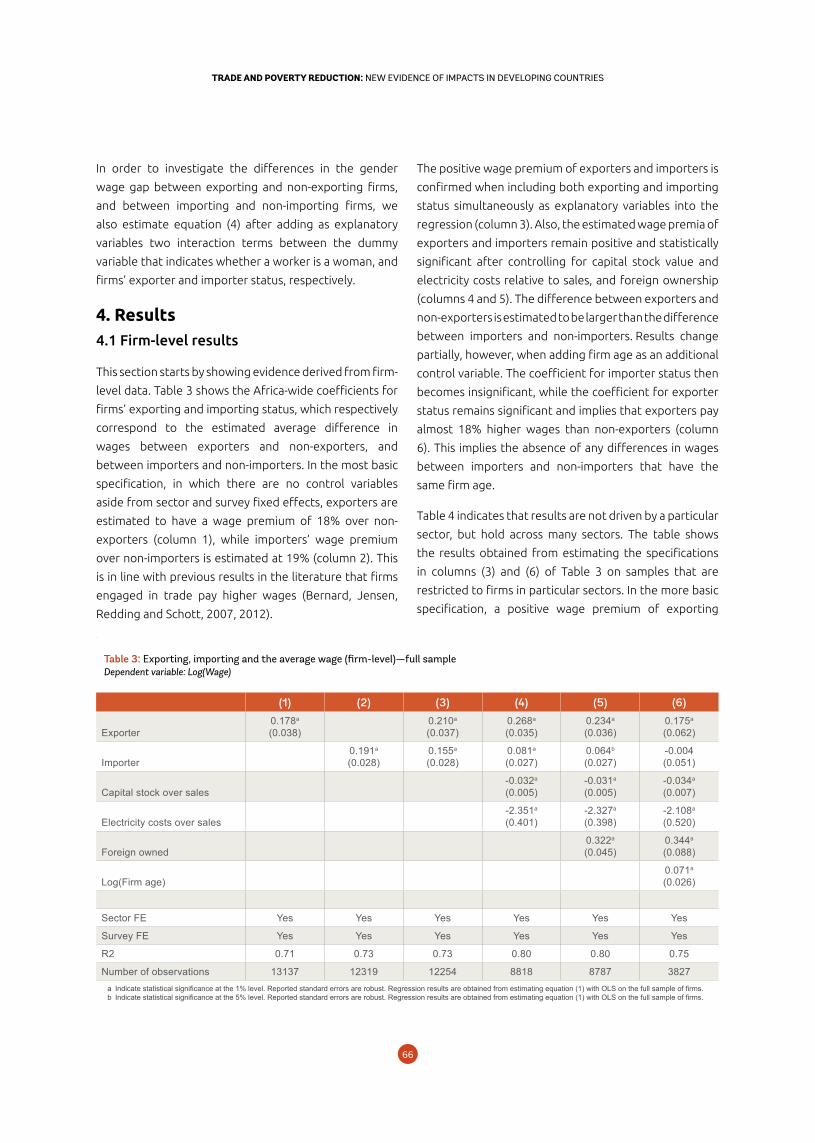
6766
TRADE AND POVERTY REDUCTION: NEW EVIDENCE OF IMPACTS IN DEVELOPING COUNTRIESTRADE AND POVERTY REDUCTION: NEW EVIDENCE OF IMPACTS IN DEVELOPING COUNTRIES
In order to investigate the differences in the gender
wage gap between exporting and non-exporting firms,
and between importing and non-importing firms, we
also estimate equation (4) after adding as explanatory
variables two interaction terms between the dummy
variable that indicates whether a worker is a woman, and
firms’ exporter and importer status, respectively.
4. Results4.1 Firm-level results
This section starts by showing evidence derived from firm-
level data. Table 3 shows the Africa-wide coefficients for
firms’ exporting and importing status, which respectively
correspond to the estimated average difference in
wages between exporters and non-exporters, and
between importers and non-importers. In the most basic
specification, in which there are no control variables
aside from sector and survey fixed effects, exporters are
estimated to have a wage premium of 18% over non-
exporters (column 1), while importers’ wage premium
over non-importers is estimated at 19% (column 2). This
is in line with previous results in the literature that firms
engaged in trade pay higher wages (Bernard, Jensen,
Redding and Schott, 2007, 2012).
The positive wage premium of exporters and importers is
confirmed when including both exporting and importing
status simultaneously as explanatory variables into the
regression (column 3). Also, the estimated wage premia of
exporters and importers remain positive and statistically
significant after controlling for capital stock value and
electricity costs relative to sales, and foreign ownership
(columns 4 and 5). The difference between exporters and
non-exporters is estimated to be larger than the difference
between importers and non-importers. Results change
partially, however, when adding firm age as an additional
control variable. The coefficient for importer status then
becomes insignificant, while the coefficient for exporter
status remains significant and implies that exporters pay
almost 18% higher wages than non-exporters (column
6). This implies the absence of any differences in wages
between importers and non-importers that have the
same firm age.
Table 4 indicates that results are not driven by a particular
sector, but hold across many sectors. The table shows
the results obtained from estimating the specifications
in columns (3) and (6) of Table 3 on samples that are
restricted to firms in particular sectors. In the more basic
specification, a positive wage premium of exporting
Table 3: Exporting, importing and the average wage (firm-level)—full sample Dependent variable: Log(Wage)
(1) (2) (3) (4) (5) (6)
Exporter0.178a
(0.038)0.210a
(0.037)0.268a
(0.035)0.234a
(0.036)0.175a
(0.062)
Importer0.191a
(0.028)0.155a
(0.028)0.081a
(0.027)0.064b
(0.027)-0.004(0.051)
Capital stock over sales-0.032a
(0.005)-0.031a
(0.005)-0.034a
(0.007)
Electricity costs over sales-2.351a
(0.401)-2.327a
(0.398)-2.108a
(0.520)
Foreign owned0.322a
(0.045)0.344a
(0.088)
Log(Firm age)0.071a
(0.026)
Sector FE Yes Yes Yes Yes Yes Yes
Survey FE Yes Yes Yes Yes Yes Yes
R2 0.71 0.73 0.73 0.80 0.80 0.75
Number of observations 13137 12319 12254 8818 8787 3827a Indicate statistical significance at the 1% level. Reported standard errors are robust. Regression results are obtained from estimating equation (1) with OLS on the full sample of firms. b Indicate statistical significance at the 5% level. Reported standard errors are robust. Regression results are obtained from estimating equation (1) with OLS on the full sample of firms.
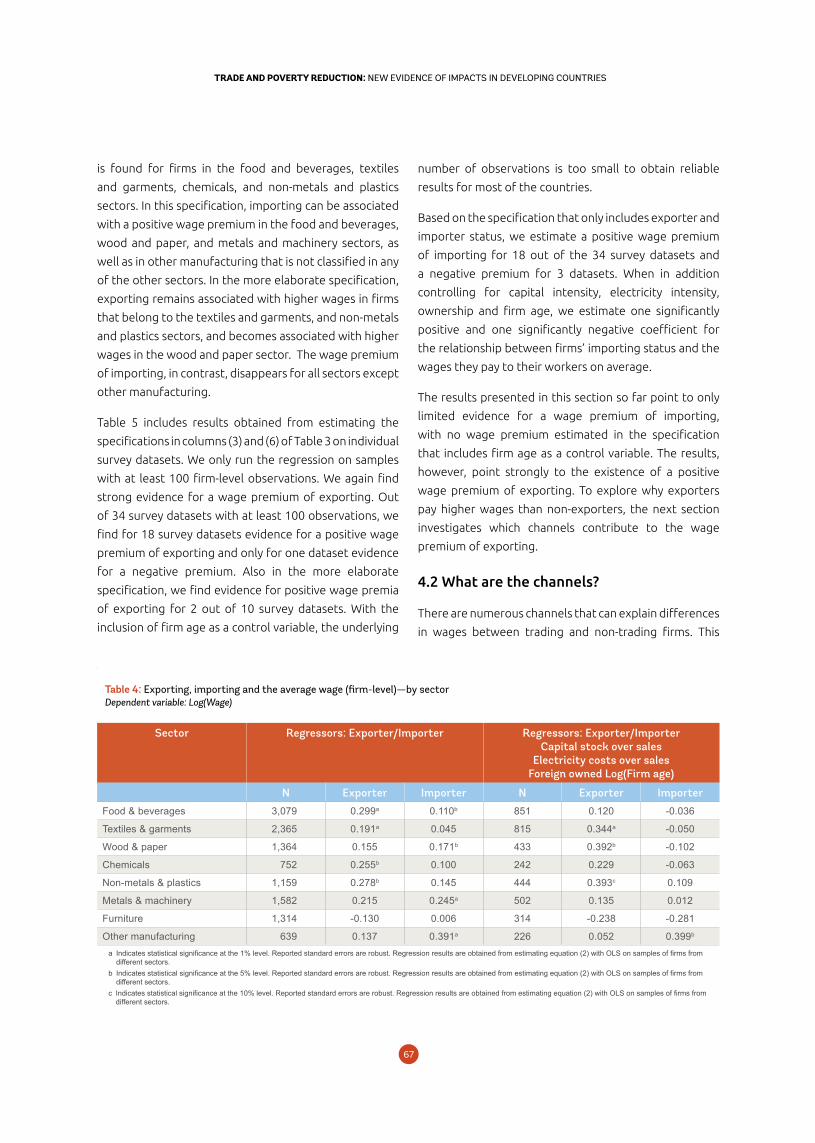
6766
TRADE AND POVERTY REDUCTION: NEW EVIDENCE OF IMPACTS IN DEVELOPING COUNTRIESTRADE AND POVERTY REDUCTION: NEW EVIDENCE OF IMPACTS IN DEVELOPING COUNTRIES
Table 4: Exporting, importing and the average wage (firm-level)—by sector Dependent variable: Log(Wage)
Sector Regressors: Exporter/Importer Regressors: Exporter/ImporterCapital stock over sales
Electricity costs over salesForeign owned Log(Firm age)
N Exporter Importer N Exporter ImporterFood & beverages 3,079 0.299a 0.110b 851 0.120 -0.036
Textiles & garments 2,365 0.191a 0.045 815 0.344a -0.050
Wood & paper 1,364 0.155 0.171b 433 0.392b -0.102
Chemicals 752 0.255b 0.100 242 0.229 -0.063
Non-metals & plastics 1,159 0.278b 0.145 444 0.393c 0.109
Metals & machinery 1,582 0.215 0.245a 502 0.135 0.012
Furniture 1,314 -0.130 0.006 314 -0.238 -0.281
Other manufacturing 639 0.137 0.391a 226 0.052 0.399b
a Indicates statistical significance at the 1% level. Reported standard errors are robust. Regression results are obtained from estimating equation (2) with OLS on samples of firms from different sectors.
b Indicates statistical significance at the 5% level. Reported standard errors are robust. Regression results are obtained from estimating equation (2) with OLS on samples of firms from different sectors.
c Indicates statistical significance at the 10% level. Reported standard errors are robust. Regression results are obtained from estimating equation (2) with OLS on samples of firms from different sectors.
is found for firms in the food and beverages, textiles
and garments, chemicals, and non-metals and plastics
sectors. In this specification, importing can be associated
with a positive wage premium in the food and beverages,
wood and paper, and metals and machinery sectors, as
well as in other manufacturing that is not classified in any
of the other sectors. In the more elaborate specification,
exporting remains associated with higher wages in firms
that belong to the textiles and garments, and non-metals
and plastics sectors, and becomes associated with higher
wages in the wood and paper sector. The wage premium
of importing, in contrast, disappears for all sectors except
other manufacturing.
Table 5 includes results obtained from estimating the
specifications in columns (3) and (6) of Table 3 on individual
survey datasets. We only run the regression on samples
with at least 100 firm-level observations. We again find
strong evidence for a wage premium of exporting. Out
of 34 survey datasets with at least 100 observations, we
find for 18 survey datasets evidence for a positive wage
premium of exporting and only for one dataset evidence
for a negative premium. Also in the more elaborate
specification, we find evidence for positive wage premia
of exporting for 2 out of 10 survey datasets. With the
inclusion of firm age as a control variable, the underlying
number of observations is too small to obtain reliable
results for most of the countries.
Based on the specification that only includes exporter and
importer status, we estimate a positive wage premium
of importing for 18 out of the 34 survey datasets and
a negative premium for 3 datasets. When in addition
controlling for capital intensity, electricity intensity,
ownership and firm age, we estimate one significantly
positive and one significantly negative coefficient for
the relationship between firms’ importing status and the
wages they pay to their workers on average.
The results presented in this section so far point to only
limited evidence for a wage premium of importing,
with no wage premium estimated in the specification
that includes firm age as a control variable. The results,
however, point strongly to the existence of a positive
wage premium of exporting. To explore why exporters
pay higher wages than non-exporters, the next section
investigates which channels contribute to the wage
premium of exporting.
4.2 What are the channels?
There are numerous channels that can explain differences
in wages between trading and non-trading firms. This
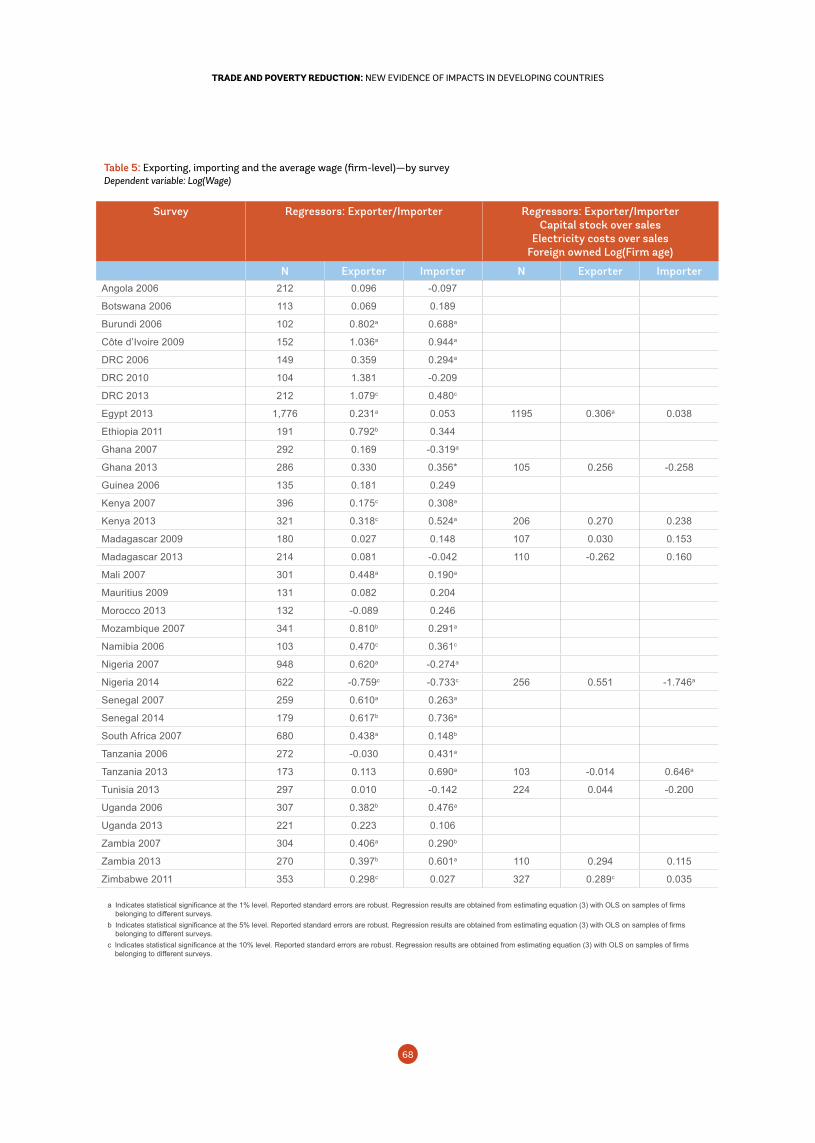
6968
TRADE AND POVERTY REDUCTION: NEW EVIDENCE OF IMPACTS IN DEVELOPING COUNTRIESTRADE AND POVERTY REDUCTION: NEW EVIDENCE OF IMPACTS IN DEVELOPING COUNTRIES
Angola 2006 212 0.096 -0.097
Botswana 2006 113 0.069 0.189
Burundi 2006 102 0.802a 0.688a
Côte d’Ivoire 2009 152 1.036a 0.944a
DRC 2006 149 0.359 0.294a
DRC 2010 104 1.381 -0.209
DRC 2013 212 1.079c 0.480c
Egypt 2013 1,776 0.231a 0.053 1195 0.306a 0.038
Ethiopia 2011 191 0.792b 0.344
Ghana 2007 292 0.169 -0.319a
Ghana 2013 286 0.330 0.356* 105 0.256 -0.258
Guinea 2006 135 0.181 0.249
Kenya 2007 396 0.175c 0.308a
Kenya 2013 321 0.318c 0.524a 206 0.270 0.238
Madagascar 2009 180 0.027 0.148 107 0.030 0.153
Madagascar 2013 214 0.081 -0.042 110 -0.262 0.160
Mali 2007 301 0.448a 0.190a
Mauritius 2009 131 0.082 0.204
Morocco 2013 132 -0.089 0.246
Mozambique 2007 341 0.810b 0.291a
Namibia 2006 103 0.470c 0.361c
Nigeria 2007 948 0.620a -0.274a
Nigeria 2014 622 -0.759c -0.733c 256 0.551 -1.746a
Senegal 2007 259 0.610a 0.263a
Senegal 2014 179 0.617b 0.736a
South Africa 2007 680 0.438a 0.148b
Tanzania 2006 272 -0.030 0.431a
Tanzania 2013 173 0.113 0.690a 103 -0.014 0.646a
Tunisia 2013 297 0.010 -0.142 224 0.044 -0.200
Uganda 2006 307 0.382b 0.476a
Uganda 2013 221 0.223 0.106
Zambia 2007 304 0.406a 0.290b
Zambia 2013 270 0.397b 0.601a 110 0.294 0.115
Zimbabwe 2011 353 0.298c 0.027 327 0.289c 0.035
Table 5: Exporting, importing and the average wage (firm-level)—by survey Dependent variable: Log(Wage)
Survey Regressors: Exporter/Importer Regressors: Exporter/ImporterCapital stock over sales
Electricity costs over salesForeign owned Log(Firm age)
N Exporter Importer N Exporter Importer
a Indicates statistical significance at the 1% level. Reported standard errors are robust. Regression results are obtained from estimating equation (3) with OLS on samples of firms belonging to different surveys.
b Indicates statistical significance at the 5% level. Reported standard errors are robust. Regression results are obtained from estimating equation (3) with OLS on samples of firms belonging to different surveys.
c Indicates statistical significance at the 10% level. Reported standard errors are robust. Regression results are obtained from estimating equation (3) with OLS on samples of firms belonging to different surveys.
6968
TRADE AND POVERTY REDUCTION: NEW EVIDENCE OF IMPACTS IN DEVELOPING COUNTRIESTRADE AND POVERTY REDUCTION: NEW EVIDENCE OF IMPACTS IN DEVELOPING COUNTRIES
section empirically investigates the role of some of the
main channels that have been discussed in the literature
over the recent years.
Discussion of the channels
One channel that can explain differences in wages
between trading and non-trading firms involves
differences in skill utilization across firms (Brambilla,
Lederman and Porto, 2012; Frazer, 2014). Exporters
often need to produce high quality products to compete
successfully in foreign markets, especially if these markets
are in developed economies (Verhoogen, 2008). To
produce high quality products, exporters are likely to have
a large share of high-skilled workers in their workforce.
Importers are likely to require high-skilled workers to
be able to absorb and work with the knowledge and
technology embedded in imported inputs (Kugler and
Verhoogen, 2012). Both exporters and importers rely
on operational services related to logistics, marketing
and finance, tasks that are typically executed by highly-
skilled workers (Matsuyama, 2007). Provided that skills
are remunerated through higher wages, trading firms
would be expected to pay higher average wages, simply
because they have on average a higher-skilled workforce.
There are also other workforce composition effects
that may be a channel for wage differences between
trading and non-trading firms. Trading and non-trading
firms may differ in the share of temporary employees,
female employees and production workers in their
total workforce. This will affect the average wage level,
provided that temporary employees, female employees
and production workers have a wage that differs from
the wage paid to permanent employees, male employees
and non-production workers, respectively.
Recent evidence points to an increased use of temporary
employment among trading firms (Machikita and Sato,
2016). This may be driven by a preference for lower
dismissal costs and more flexibility which come with
temporary employment contracts (Aleksynska and Berg,
2016). It may also be driven by reduced incentives for
firms to employ workers that acquire firm-specific skills,
which typically are permanent rather than temporary
employees. Similarly, there is also evidence for a more
female workforce, especially among exporters (Duda-
Nyczak and Viegelahn, 2016). Also, due to the increased
need of firms for trade-related operational services,
the share of production workers is likely to be lower in
trading firms. All these workforce composition effects
can have an impact on the average wage that is paid at
the firm level.
The trading activity of a firm can also give rise to
technology upgrading, induced by technology transfers
from the trading partner, which may increase workers’
productivity and can therefore lead to higher wages.
Export destination has been shown to play a crucial
role in determining the wage premium in the case of
South Africa (Rankin and Schoer, 2013). Exporters pay
higher wages only when exporting to more-developed
economies, whereas firms exporting to regional less-
developed markets are actually characterized by negative
wage premia. Also, a causal relationship between
exporting to high-income markets and paying higher
wages has been demonstrated globally (Brambilla and
Porto, 2016), indicating that firms and their workers may
benefit from technology upgrades induced by exports to
more developed economies.
Finally, the extension of a firm’s business to export
markets increases the scale of a firm, thus lowering
average costs in the presence of increasing returns to
scale. This will increase workers’ productivity, and hence
potentially their wages. The relevance of international
scale economies for productivity within exporting firms
has empirically been shown for the case of Chinese Taipei
(Hwang, 2003).
Empirical results
Table 6 shows results from regressions at the firm level,
where we investigate in columns 1–4 the role of the
four above-described channels in explaining differences
between trading and non-trading firms. In the following,
we consider four different variables as measures of
the four channels discussed above. To proxy for skills
utilization, we use the average number of production
workers’ years of education. To account for other
workforce characteristics, we respectively use the share
of women and production workers in full-time permanent
employment, and the share of temporary workers in total
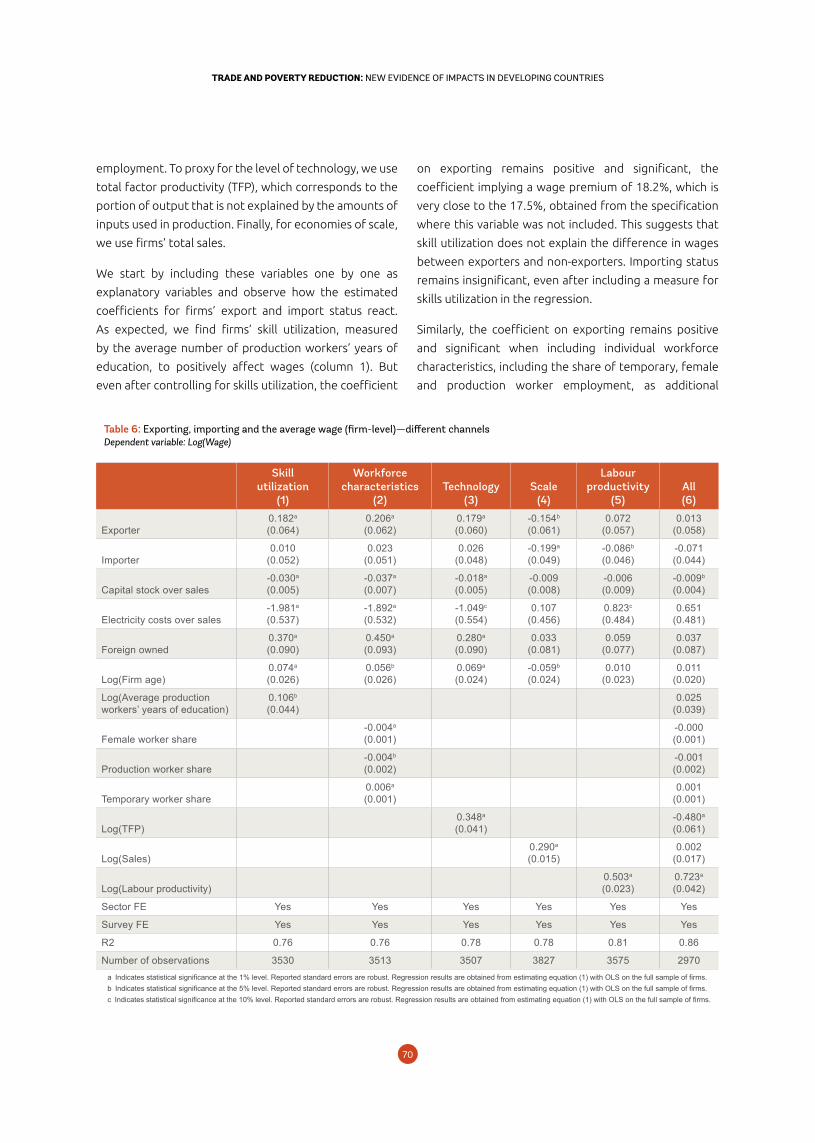
7170
TRADE AND POVERTY REDUCTION: NEW EVIDENCE OF IMPACTS IN DEVELOPING COUNTRIESTRADE AND POVERTY REDUCTION: NEW EVIDENCE OF IMPACTS IN DEVELOPING COUNTRIES
employment. To proxy for the level of technology, we use
total factor productivity (TFP), which corresponds to the
portion of output that is not explained by the amounts of
inputs used in production. Finally, for economies of scale,
we use firms’ total sales.
We start by including these variables one by one as
explanatory variables and observe how the estimated
coefficients for firms’ export and import status react.
As expected, we find firms’ skill utilization, measured
by the average number of production workers’ years of
education, to positively affect wages (column 1). But
even after controlling for skills utilization, the coefficient
on exporting remains positive and significant, the
coefficient implying a wage premium of 18.2%, which is
very close to the 17.5%, obtained from the specification
where this variable was not included. This suggests that
skill utilization does not explain the difference in wages
between exporters and non-exporters. Importing status
remains insignificant, even after including a measure for
skills utilization in the regression.
Similarly, the coefficient on exporting remains positive
and significant when including individual workforce
characteristics, including the share of temporary, female
and production worker employment, as additional
explanatory variables (column 2). The difference
Table 6: Exporting, importing and the average wage (firm-level)—different channels Dependent variable: Log(Wage)
Skillutilization
(1)
Workforce characteristics
(2)Technology
(3)Scale
(4)
Labour productivity
(5)All(6)
Exporter0.182a
(0.064)0.206a
(0.062)0.179a
(0.060)-0.154b
(0.061)0.072
(0.057)0.013
(0.058)
Importer0.010
(0.052)0.023
(0.051)0.026
(0.048)-0.199a
(0.049)-0.086b
(0.046)-0.071(0.044)
Capital stock over sales-0.030a
(0.005)-0.037a
(0.007)-0.018a
(0.005)-0.009(0.008)
-0.006(0.009)
-0.009b
(0.004)
Electricity costs over sales-1.981a
(0.537)-1.892a
(0.532)-1.049c
(0.554)0.107
(0.456)0.823c
(0.484)0.651
(0.481)
Foreign owned0.370a
(0.090)0.450a
(0.093)0.280a
(0.090)0.033
(0.081)0.059
(0.077)0.037
(0.087)
Log(Firm age)0.074a
(0.026)0.056b
(0.026)0.069a
(0.024)-0.059b
(0.024)0.010
(0.023)0.011
(0.020)
Log(Average production workers’ years of education)
0.106b
(0.044)0.025
(0.039)
Female worker share-0.004a
(0.001)-0.000(0.001)
Production worker share-0.004b
(0.002)-0.001(0.002)
Temporary worker share0.006a
(0.001)0.001
(0.001)
Log(TFP)0.348a
(0.041)-0.480a
(0.061)
Log(Sales)0.290a
(0.015)0.002
(0.017)
Log(Labour productivity)0.503a
(0.023)0.723a
(0.042)
Sector FE Yes Yes Yes Yes Yes Yes
Survey FE Yes Yes Yes Yes Yes Yes
R2 0.76 0.76 0.78 0.78 0.81 0.86
Number of observations 3530 3513 3507 3827 3575 2970a Indicates statistical significance at the 1% level. Reported standard errors are robust. Regression results are obtained from estimating equation (1) with OLS on the full sample of firms.b Indicates statistical significance at the 5% level. Reported standard errors are robust. Regression results are obtained from estimating equation (1) with OLS on the full sample of firms.c Indicates statistical significance at the 10% level. Reported standard errors are robust. Regression results are obtained from estimating equation (1) with OLS on the full sample of firms.
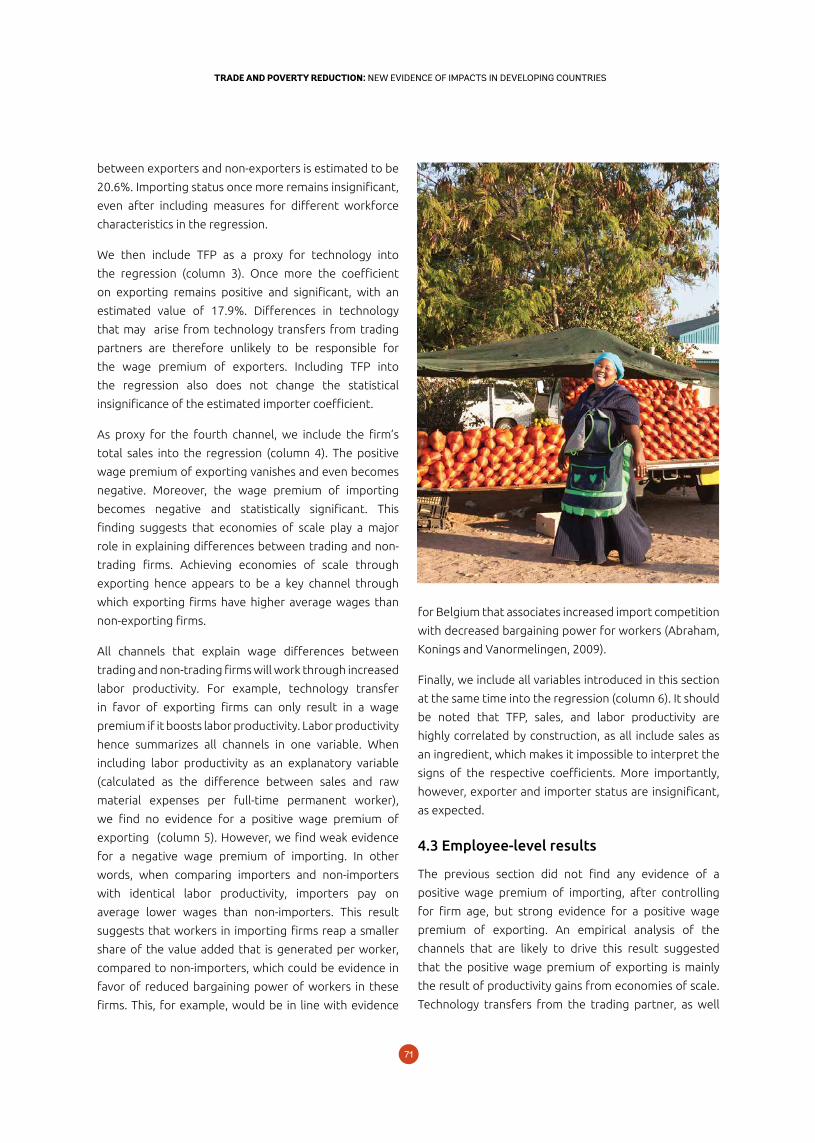
7170
TRADE AND POVERTY REDUCTION: NEW EVIDENCE OF IMPACTS IN DEVELOPING COUNTRIESTRADE AND POVERTY REDUCTION: NEW EVIDENCE OF IMPACTS IN DEVELOPING COUNTRIES
between exporters and non-exporters is estimated to be
20.6%. Importing status once more remains insignificant,
even after including measures for different workforce
characteristics in the regression.
We then include TFP as a proxy for technology into
the regression (column 3). Once more the coefficient
on exporting remains positive and significant, with an
estimated value of 17.9%. Differences in technology
that may arise from technology transfers from trading
partners are therefore unlikely to be responsible for
the wage premium of exporters. Including TFP into
the regression also does not change the statistical
insignificance of the estimated importer coefficient.
As proxy for the fourth channel, we include the firm’s
total sales into the regression (column 4). The positive
wage premium of exporting vanishes and even becomes
negative. Moreover, the wage premium of importing
becomes negative and statistically significant. This
finding suggests that economies of scale play a major
role in explaining differences between trading and non-
trading firms. Achieving economies of scale through
exporting hence appears to be a key channel through
which exporting firms have higher average wages than
non-exporting firms.
All channels that explain wage differences between
trading and non-trading firms will work through increased
labor productivity. For example, technology transfer
in favor of exporting firms can only result in a wage
premium if it boosts labor productivity. Labor productivity
hence summarizes all channels in one variable. When
including labor productivity as an explanatory variable
(calculated as the difference between sales and raw
material expenses per full-time permanent worker),
we find no evidence for a positive wage premium of
exporting (column 5). However, we find weak evidence
for a negative wage premium of importing. In other
words, when comparing importers and non-importers
with identical labor productivity, importers pay on
average lower wages than non-importers. This result
suggests that workers in importing firms reap a smaller
share of the value added that is generated per worker,
compared to non-importers, which could be evidence in
favor of reduced bargaining power of workers in these
firms. This, for example, would be in line with evidence
for Belgium that associates increased import competition
with decreased bargaining power for workers (Abraham,
Konings and Vanormelingen, 2009).
Finally, we include all variables introduced in this section
at the same time into the regression (column 6). It should
be noted that TFP, sales, and labor productivity are
highly correlated by construction, as all include sales as
an ingredient, which makes it impossible to interpret the
signs of the respective coefficients. More importantly,
however, exporter and importer status are insignificant,
as expected.
4.3 Employee-level results
The previous section did not find any evidence of a
positive wage premium of importing, after controlling
for firm age, but strong evidence for a positive wage
premium of exporting. An empirical analysis of the
channels that are likely to drive this result suggested
that the positive wage premium of exporting is mainly
the result of productivity gains from economies of scale.
Technology transfers from the trading partner, as well
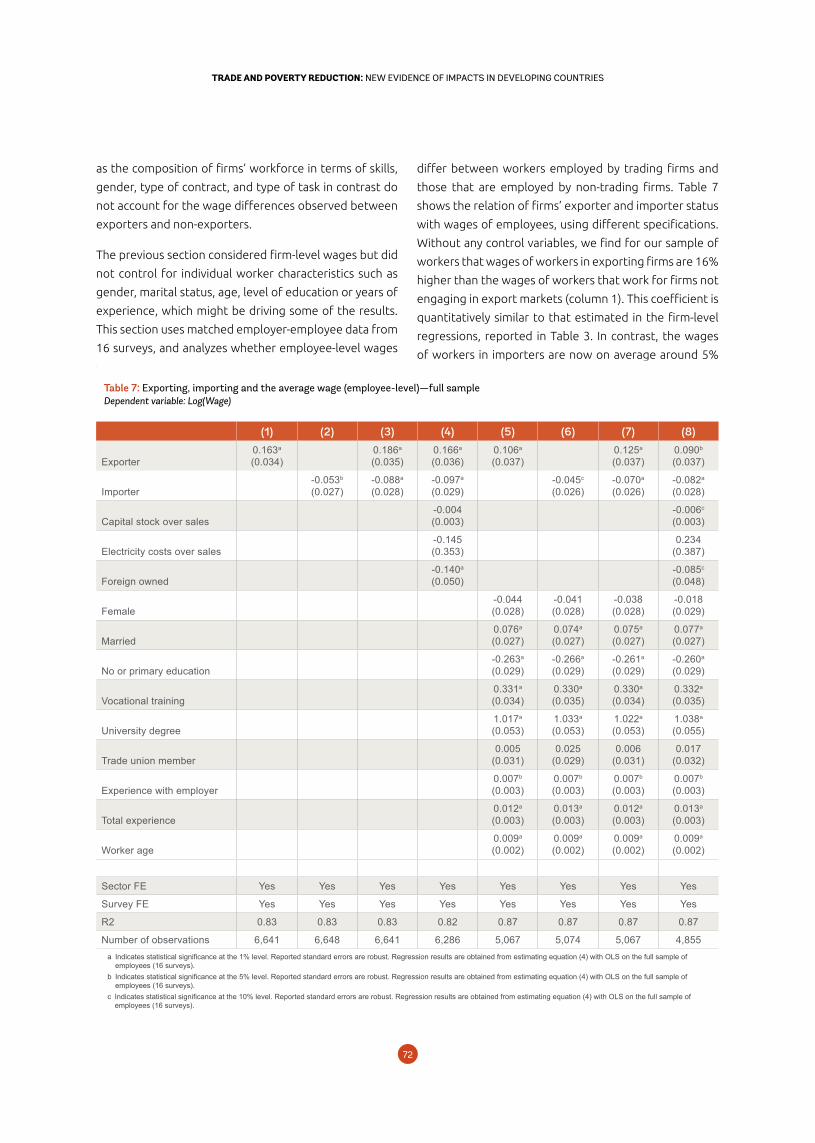
7372
TRADE AND POVERTY REDUCTION: NEW EVIDENCE OF IMPACTS IN DEVELOPING COUNTRIESTRADE AND POVERTY REDUCTION: NEW EVIDENCE OF IMPACTS IN DEVELOPING COUNTRIES
as the composition of firms’ workforce in terms of skills,
gender, type of contract, and type of task in contrast do
not account for the wage differences observed between
exporters and non-exporters.
The previous section considered firm-level wages but did
not control for individual worker characteristics such as
gender, marital status, age, level of education or years of
experience, which might be driving some of the results.
This section uses matched employer-employee data from
16 surveys, and analyzes whether employee-level wages
differ between workers employed by trading firms and
those that are employed by non-trading firms. Table 7
shows the relation of firms’ exporter and importer status
with wages of employees, using different specifications.
Without any control variables, we find for our sample of
workers that wages of workers in exporting firms are 16%
higher than the wages of workers that work for firms not
engaging in export markets (column 1). This coefficient is
quantitatively similar to that estimated in the firm-level
regressions, reported in Table 3. In contrast, the wages
of workers in importers are now on average around 5%
Table 7: Exporting, importing and the average wage (employee-level)—full sample Dependent variable: Log(Wage)
(1) (2) (3) (4) (5) (6) (7) (8)
Exporter0.163a
(0.034)0.186a
(0.035)0.166a
(0.036)0.106a
(0.037)0.125a
(0.037)0.090b
(0.037)
Importer-0.053b
(0.027)-0.088a
(0.028)-0.097a
(0.029)-0.045c
(0.026)-0.070a
(0.026)-0.082a
(0.028)
Capital stock over sales-0.004(0.003)
-0.006c
(0.003)
Electricity costs over sales-0.145(0.353)
0.234(0.387)
Foreign owned-0.140a
(0.050)-0.085c
(0.048)
Female-0.044(0.028)
-0.041(0.028)
-0.038(0.028)
-0.018(0.029)
Married0.076a
(0.027)0.074a
(0.027)0.075a
(0.027)0.077a
(0.027)
No or primary education-0.263a
(0.029)-0.266a
(0.029)-0.261a
(0.029)-0.260a
(0.029)
Vocational training0.331a
(0.034)0.330a
(0.035)0.330a
(0.034)0.332a
(0.035)
University degree1.017a
(0.053)1.033a
(0.053)1.022a
(0.053)1.038a
(0.055)
Trade union member0.005
(0.031)0.025
(0.029)0.006
(0.031)0.017
(0.032)
Experience with employer0.007b
(0.003)0.007b
(0.003)0.007b
(0.003)0.007b
(0.003)
Total experience0.012a
(0.003)0.013a
(0.003)0.012a
(0.003)0.013a
(0.003)
Worker age0.009a
(0.002)0.009a
(0.002)0.009a
(0.002)0.009a
(0.002)
Sector FE Yes Yes Yes Yes Yes Yes Yes Yes
Survey FE Yes Yes Yes Yes Yes Yes Yes Yes
R2 0.83 0.83 0.83 0.82 0.87 0.87 0.87 0.87
Number of observations 6,641 6,648 6,641 6,286 5,067 5,074 5,067 4,855a Indicates statistical significance at the 1% level. Reported standard errors are robust. Regression results are obtained from estimating equation (4) with OLS on the full sample of
employees (16 surveys).b Indicates statistical significance at the 5% level. Reported standard errors are robust. Regression results are obtained from estimating equation (4) with OLS on the full sample of
employees (16 surveys).c Indicates statistical significance at the 10% level. Reported standard errors are robust. Regression results are obtained from estimating equation (4) with OLS on the full sample of
employees (16 surveys).
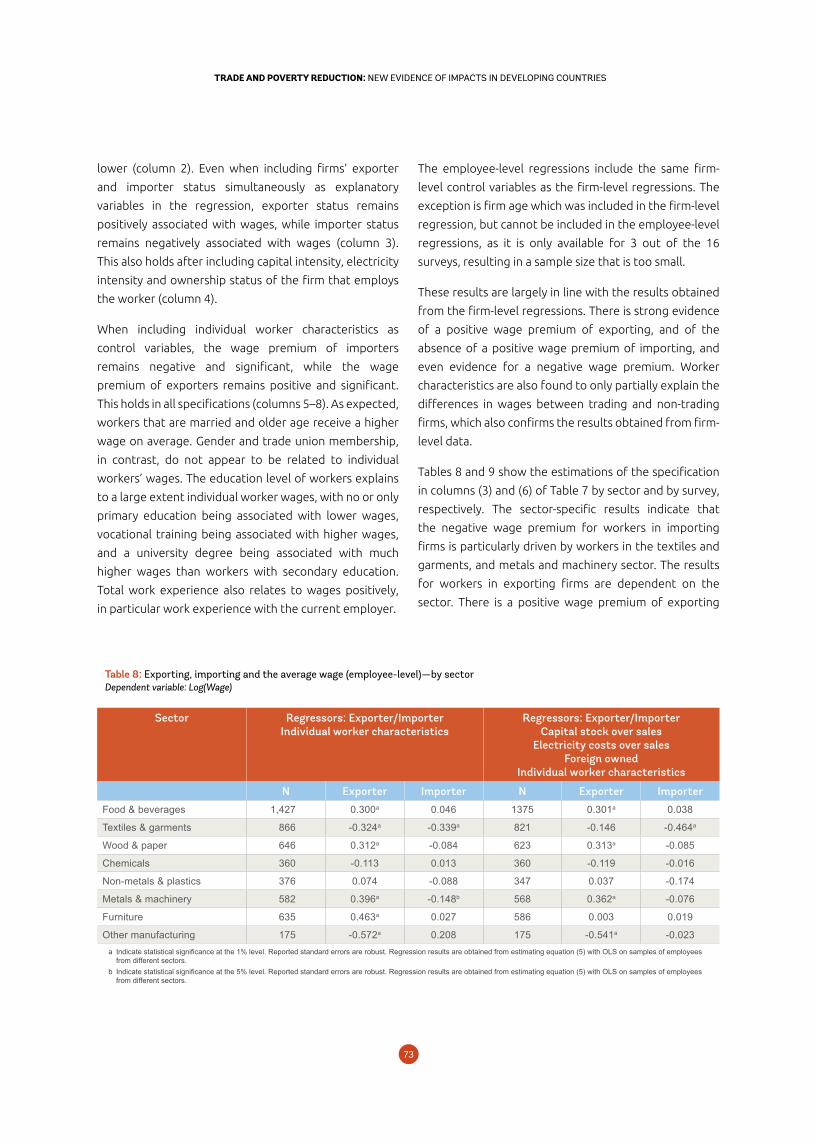
7372
TRADE AND POVERTY REDUCTION: NEW EVIDENCE OF IMPACTS IN DEVELOPING COUNTRIESTRADE AND POVERTY REDUCTION: NEW EVIDENCE OF IMPACTS IN DEVELOPING COUNTRIES
lower (column 2). Even when including firms’ exporter
and importer status simultaneously as explanatory
variables in the regression, exporter status remains
positively associated with wages, while importer status
remains negatively associated with wages (column 3).
This also holds after including capital intensity, electricity
intensity and ownership status of the firm that employs
the worker (column 4).
When including individual worker characteristics as
control variables, the wage premium of importers
remains negative and significant, while the wage
premium of exporters remains positive and significant.
This holds in all specifications (columns 5–8). As expected,
workers that are married and older age receive a higher
wage on average. Gender and trade union membership,
in contrast, do not appear to be related to individual
workers’ wages. The education level of workers explains
to a large extent individual worker wages, with no or only
primary education being associated with lower wages,
vocational training being associated with higher wages,
and a university degree being associated with much
higher wages than workers with secondary education.
Total work experience also relates to wages positively,
in particular work experience with the current employer.
The employee-level regressions include the same firm-
level control variables as the firm-level regressions. The
exception is firm age which was included in the firm-level
regression, but cannot be included in the employee-level
regressions, as it is only available for 3 out of the 16
surveys, resulting in a sample size that is too small.
These results are largely in line with the results obtained
from the firm-level regressions. There is strong evidence
of a positive wage premium of exporting, and of the
absence of a positive wage premium of importing, and
even evidence for a negative wage premium. Worker
characteristics are also found to only partially explain the
differences in wages between trading and non-trading
firms, which also confirms the results obtained from firm-
level data.
Tables 8 and 9 show the estimations of the specification
in columns (3) and (6) of Table 7 by sector and by survey,
respectively. The sector-specific results indicate that
the negative wage premium for workers in importing
firms is particularly driven by workers in the textiles and
garments, and metals and machinery sector. The results
for workers in exporting firms are dependent on the
sector. There is a positive wage premium of exporting
Table 8: Exporting, importing and the average wage (employee-level)—by sector Dependent variable: Log(Wage)
Sector Regressors: Exporter/ImporterIndividual worker characteristics
Regressors: Exporter/ImporterCapital stock over sales
Electricity costs over salesForeign owned
Individual worker characteristics
N Exporter Importer N Exporter ImporterFood & beverages 1,427 0.300a 0.046 1375 0.301a 0.038
Textiles & garments 866 -0.324a -0.339a 821 -0.146 -0.464a
Wood & paper 646 0.312a -0.084 623 0.313a -0.085
Chemicals 360 -0.113 0.013 360 -0.119 -0.016
Non-metals & plastics 376 0.074 -0.088 347 0.037 -0.174
Metals & machinery 582 0.396a -0.148b 568 0.362a -0.076
Furniture 635 0.463a 0.027 586 0.003 0.019
Other manufacturing 175 -0.572a 0.208 175 -0.541a -0.023a Indicate statistical significance at the 1% level. Reported standard errors are robust. Regression results are obtained from estimating equation (5) with OLS on samples of employees
from different sectors.b Indicate statistical significance at the 5% level. Reported standard errors are robust. Regression results are obtained from estimating equation (5) with OLS on samples of employees
from different sectors.
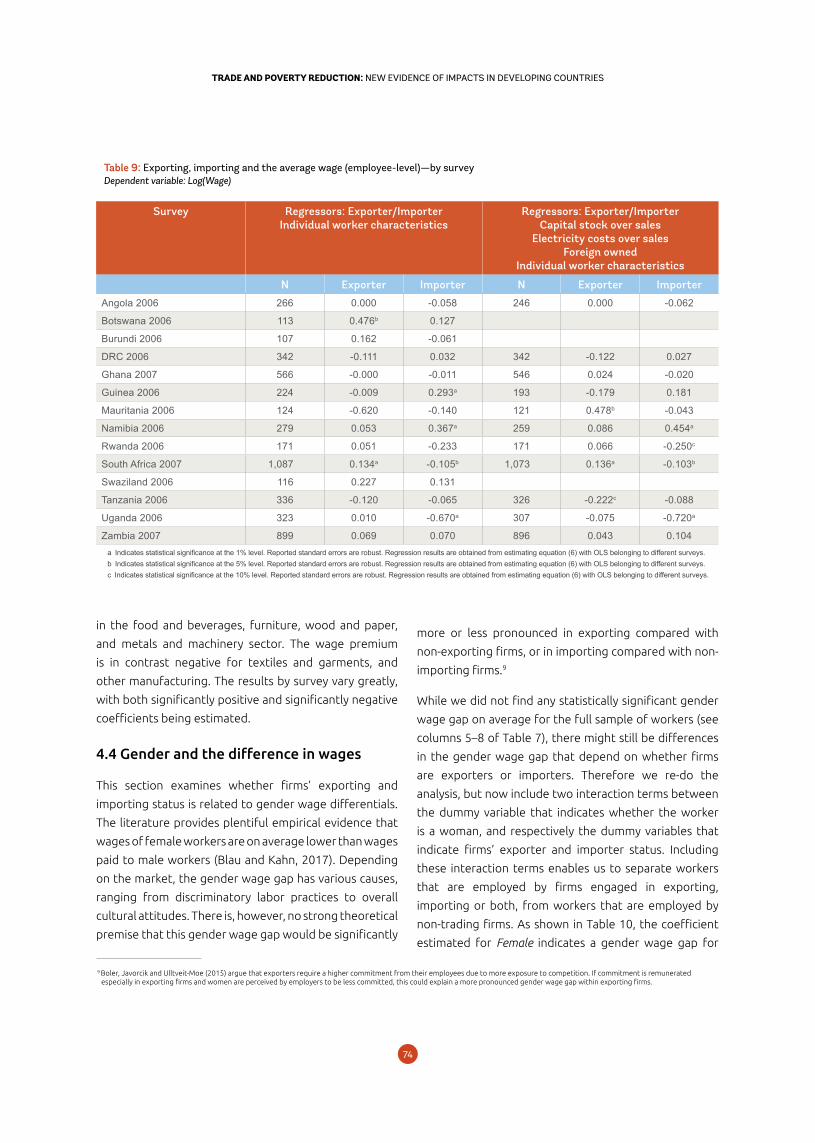
7574
TRADE AND POVERTY REDUCTION: NEW EVIDENCE OF IMPACTS IN DEVELOPING COUNTRIESTRADE AND POVERTY REDUCTION: NEW EVIDENCE OF IMPACTS IN DEVELOPING COUNTRIES
Table 9: Exporting, importing and the average wage (employee-level)—by survey Dependent variable: Log(Wage)
Survey Regressors: Exporter/ImporterIndividual worker characteristics
Regressors: Exporter/ImporterCapital stock over sales
Electricity costs over salesForeign owned
Individual worker characteristics
N Exporter Importer N Exporter ImporterAngola 2006 266 0.000 -0.058 246 0.000 -0.062
Botswana 2006 113 0.476b 0.127
Burundi 2006 107 0.162 -0.061
DRC 2006 342 -0.111 0.032 342 -0.122 0.027
Ghana 2007 566 -0.000 -0.011 546 0.024 -0.020
Guinea 2006 224 -0.009 0.293a 193 -0.179 0.181
Mauritania 2006 124 -0.620 -0.140 121 0.478b -0.043
Namibia 2006 279 0.053 0.367a 259 0.086 0.454a
Rwanda 2006 171 0.051 -0.233 171 0.066 -0.250c
South Africa 2007 1,087 0.134a -0.105b 1,073 0.136a -0.103b
Swaziland 2006 116 0.227 0.131
Tanzania 2006 336 -0.120 -0.065 326 -0.222c -0.088
Uganda 2006 323 0.010 -0.670a 307 -0.075 -0.720a
Zambia 2007 899 0.069 0.070 896 0.043 0.104a Indicates statistical significance at the 1% level. Reported standard errors are robust. Regression results are obtained from estimating equation (6) with OLS belonging to different surveys.b Indicates statistical significance at the 5% level. Reported standard errors are robust. Regression results are obtained from estimating equation (6) with OLS belonging to different surveys.c Indicates statistical significance at the 10% level. Reported standard errors are robust. Regression results are obtained from estimating equation (6) with OLS belonging to different surveys.
in the food and beverages, furniture, wood and paper,
and metals and machinery sector. The wage premium
is in contrast negative for textiles and garments, and
other manufacturing. The results by survey vary greatly,
with both significantly positive and significantly negative
coefficients being estimated.
4.4Genderandthedifferenceinwages
This section examines whether firms’ exporting and
importing status is related to gender wage differentials.
The literature provides plentiful empirical evidence that
wages of female workers are on average lower than wages
paid to male workers (Blau and Kahn, 2017). Depending
on the market, the gender wage gap has various causes,
ranging from discriminatory labor practices to overall
cultural attitudes. There is, however, no strong theoretical
premise that this gender wage gap would be significantly
more or less pronounced in exporting compared with
non-exporting firms, or in importing compared with non-
importing firms.9
While we did not find any statistically significant gender
wage gap on average for the full sample of workers (see
columns 5–8 of Table 7), there might still be differences
in the gender wage gap that depend on whether firms
are exporters or importers. Therefore we re-do the
analysis, but now include two interaction terms between
the dummy variable that indicates whether the worker
is a woman, and respectively the dummy variables that
indicate firms’ exporter and importer status. Including
these interaction terms enables us to separate workers
that are employed by firms engaged in exporting,
importing or both, from workers that are employed by
non-trading firms. As shown in Table 10, the coefficient
estimated for Female indicates a gender wage gap for
9 Boler, Javorcik and Ulltveit-Moe (2015) argue that exporters require a higher commitment from their employees due to more exposure to competition. If commitment is remunerated especially in exporting firms and women are perceived by employers to be less committed, this could explain a more pronounced gender wage gap within exporting firms.
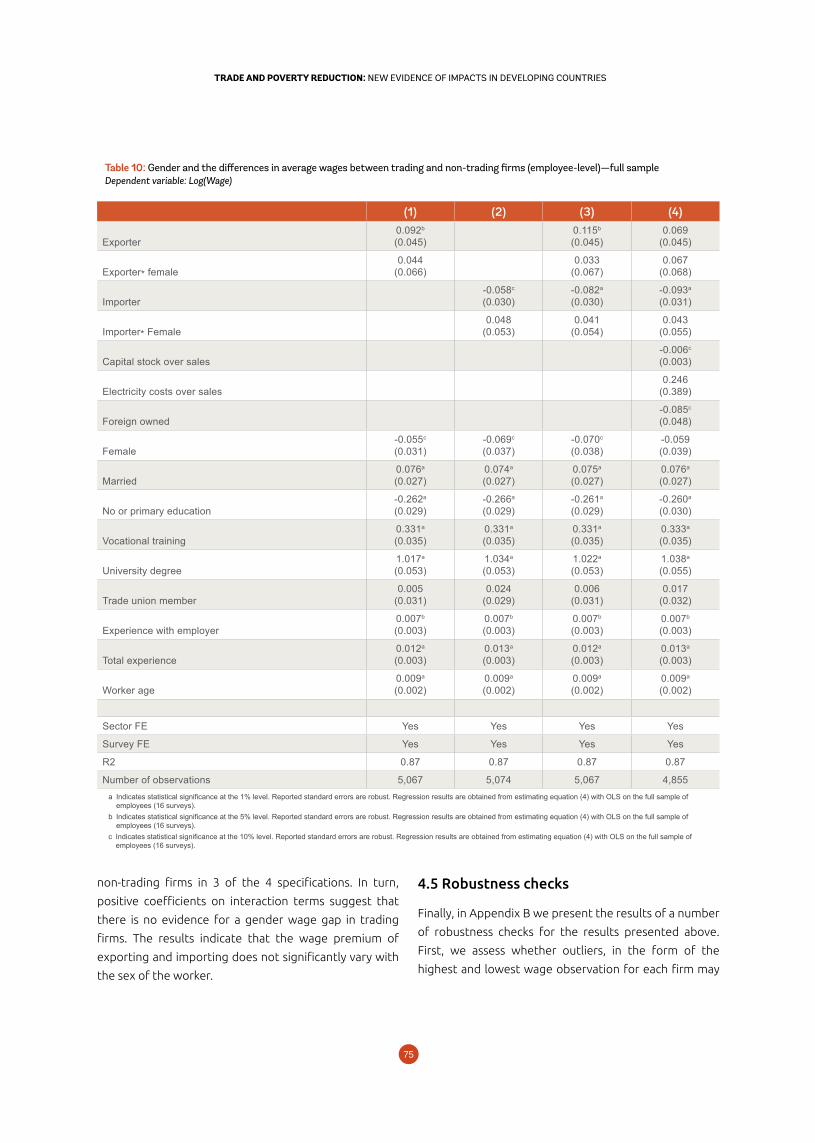
7574
TRADE AND POVERTY REDUCTION: NEW EVIDENCE OF IMPACTS IN DEVELOPING COUNTRIESTRADE AND POVERTY REDUCTION: NEW EVIDENCE OF IMPACTS IN DEVELOPING COUNTRIES
Table 10: Gender and the differences in average wages between trading and non-trading firms (employee-level)—full sample Dependent variable: Log(Wage)
(1) (2) (3) (4)
Exporter0.092b
(0.045)0.115b
(0.045)0.069
(0.045)
Exporter* female0.044
(0.066)0.033
(0.067)0.067
(0.068)
Importer-0.058c
(0.030)-0.082a
(0.030)-0.093a
(0.031)
Importer* Female0.048
(0.053)0.041
(0.054)0.043
(0.055)
Capital stock over sales-0.006c
(0.003)
Electricity costs over sales0.246
(0.389)
Foreign owned-0.085c
(0.048)
Female-0.055c
(0.031)-0.069c
(0.037)-0.070c
(0.038)-0.059(0.039)
Married0.076a
(0.027)0.074a
(0.027)0.075a
(0.027)0.076a
(0.027)
No or primary education-0.262a
(0.029)-0.266a
(0.029)-0.261a
(0.029)-0.260a
(0.030)
Vocational training0.331a
(0.035)0.331a
(0.035)0.331a
(0.035)0.333a
(0.035)
University degree1.017a
(0.053)1.034a
(0.053)1.022a
(0.053)1.038a
(0.055)
Trade union member0.005
(0.031)0.024
(0.029)0.006
(0.031)0.017
(0.032)
Experience with employer0.007b
(0.003)0.007b
(0.003)0.007b
(0.003)0.007b
(0.003)
Total experience0.012a
(0.003)0.013a
(0.003)0.012a
(0.003)0.013a
(0.003)
Worker age0.009a
(0.002)0.009a
(0.002)0.009a
(0.002)0.009a
(0.002)
Sector FE Yes Yes Yes Yes
Survey FE Yes Yes Yes Yes
R2 0.87 0.87 0.87 0.87
Number of observations 5,067 5,074 5,067 4,855a Indicates statistical significance at the 1% level. Reported standard errors are robust. Regression results are obtained from estimating equation (4) with OLS on the full sample of
employees (16 surveys).b Indicates statistical significance at the 5% level. Reported standard errors are robust. Regression results are obtained from estimating equation (4) with OLS on the full sample of
employees (16 surveys).c Indicates statistical significance at the 10% level. Reported standard errors are robust. Regression results are obtained from estimating equation (4) with OLS on the full sample of
employees (16 surveys).
non-trading firms in 3 of the 4 specifications. In turn,
positive coefficients on interaction terms suggest that
there is no evidence for a gender wage gap in trading
firms. The results indicate that the wage premium of
exporting and importing does not significantly vary with
the sex of the worker.
4.5 Robustness checks
Finally, in Appendix B we present the results of a number
of robustness checks for the results presented above.
First, we assess whether outliers, in the form of the
highest and lowest wage observation for each firm may
7776
TRADE AND POVERTY REDUCTION: NEW EVIDENCE OF IMPACTS IN DEVELOPING COUNTRIESTRADE AND POVERTY REDUCTION: NEW EVIDENCE OF IMPACTS IN DEVELOPING COUNTRIES
have overly influenced the results from the employee
level analysis. Second, the results of firm-level regressions
are based on 65 surveys from 47 countries, while the
employee-level regressions are based on 16 surveys
from 16 countries. To check the comparability of these
regressions we run the firm-level regressions on data
from the same 16 surveys for which also employee data
are available. Finally, we further limit the firm-level sample
to include only those firms for which employee data
are available, given that employee data are not available
for all firms that form part of the 16 surveys that collected
employee-level data. In all cases, these robustness checks
confirm the main findings of this analysis.
5. Conclusions
This paper studies the relationship between exporting,
importing and wages in Africa, using firm-level data and
employer-employee-level data from the World Bank
Enterprise Surveys. On the basis of firm-level data, we
find that the average wage paid by exporters to their
workers is higher, even after controlling for such firm
characteristics as capital intensity, electricity intensity,
foreign ownership and firm age. The average wage paid
by importers relative to non-importers is by contrast not
higher, after adding firm age as a control variable. On
the basis of employer-employee data, we can confirm
a positive exporting premium on wages, even after
controlling for individual worker characteristics. Workers
that are employed by importers are found to—if anything
—receive lower wages, when compared to workers
employed by non-importers.
We endeavor to identify the channels that can explain our
findings. Productivity gains through economies of scale
explain the positive wage premium of exporters; neither
productivity gains through increased skill utilization or the
employment of certain types of workers, nor productivity
gains through technology transfers, contribute to
exporters’ wage premium. Workers in importers are
found to have weaker bargaining power than those
employed in non-importers, and are thus able to only
reap smaller shares of the value added that is generated.
These results are somewhat surprising, given that the
trade literature has typically found that both exporting
and importing can be associated with higher wages. The
arguments provided by this literature go beyond a mere
effect of trade on firm performance through higher sales.
The trade literature also associates exports with gains due
to increased foreign competition and skill premia, and
imports with gains due to access to new technologies,
and a better quality and wider variety of inputs. If these
gains exist and are at least partially passed on to workers,
we would expect to find higher wages in exporting and
importing firms.
This paper clearly indicates that there are other factors
that contradict these general findings in the African
context. On the one hand, African exporters are
frequently incapable of competing in terms of product
quality in more sophisticated markets outside of Africa.
Thus, economies of scale resulting in lower prices
remain the only viable channel to enter export markets,
largely at the regional level. The strong price sensitivity
7776
TRADE AND POVERTY REDUCTION: NEW EVIDENCE OF IMPACTS IN DEVELOPING COUNTRIESTRADE AND POVERTY REDUCTION: NEW EVIDENCE OF IMPACTS IN DEVELOPING COUNTRIES
of African customers, generally characterized by low
personal income, reinforces this rationale. This particular
mechanism of competing through quantity as opposed
to quality can thus explain why economies of scale drives
the positive premium on wages of exporters in Africa,
and why other channels, such as skill utilization may play
a smaller role.
On the other hand, the non-existent or even negative
wage premium of importing is likely to be rooted in
the nature of imports on the continent. The limited
diversification of African economies means that some
inputs can only be obtained by importing. This reduces
the potential gains reaped from imported inputs, which
are rather a source of higher costs than a way of having a
comparative advantage over firms sourcing domestically.
In the absence of domestic raw material inputs, the
higher material costs oblige firms to seek savings by
cutting other spending, including wages. In addition,
high unemployment and large shares of informality in
African countries shifts the bargaining power towards
employers, which is confirmed by the negative regression
results when controlling for labor productivity.
The paper also included an analysis of the gender
dimension. The findings indicate that there is no
significant gender wage gap within trading firms in the
sample, while there is some evidence for a gender wage
gap within non-trading firms. These results suggest that
trading firms in the African context appear to contribute
to gender equality, at least based on the data sample that
this paper has worked with.
Matched employer-employee data are only rarely
available, especially for developing countries. In addition
to presenting results about the linkages between trade
and wages, this paper also showed the value of analysis
of employer-employee data to inform policies, pointing
to the benefits of regularly collecting such data and
increasing its quality. Such data are useful not only to
examine the questions addressed in this paper, but also
questions that are related to a wider range of labour
market issues.
Given the ongoing regional and sub-regional integration
efforts of African countries, it is important to better
understand under which conditions firms are able to
benefit from the potential gains of trade, what the
potential bottlenecks to achieving these gains are, and
how the gains can be translated into decent jobs for all
workers. For trade liberalization to be sustainable and
inclusive, it is important to learn about the conditions
under which workers can reap at least some of the gains
that are being made, especially in a continent like Africa.
This paper used available matched employer-employee
data to provide evidence on these mechanisms and
sought to contribute to a better understanding of the
gains from trade and how they are shared with workers
in the African context.
The findings indicate that there is no significant gender wage gap within trading firms in the sample, while there is some evidence for a gender wage gap within non-trading firms. These results suggest that trading firms in the African context appear to contribute to gender equality, at least based on the data sample that this paper has worked with.
7978
TRADE AND POVERTY REDUCTION: NEW EVIDENCE OF IMPACTS IN DEVELOPING COUNTRIESTRADE AND POVERTY REDUCTION: NEW EVIDENCE OF IMPACTS IN DEVELOPING COUNTRIES
Abraham, F., J. Konings, and S. Vanormelingen (2009). “The effect on globalization on union bargaining and price-cost margins of firms,” Review of World Economics, Vol. 145, pp. 13–36.
Aleksynska, M., and J. Berg (2016). “Firms’ demand for temporary labour in developing countries: necessity or strategy?”. Conditions of Work and Employment Series No. 77, INWORK, Geneva: International Labour Office.
Amiti, M., and D.R. Davis (2011). “Trade, firms, and wages: theory and evidence,” Review of Economic Studies, Vol. 79, pp. 1–36.
Amiti, M., and J. Konings (2007). “Trade liberalization, intermediate inputs, and productivity: Evidence from Indonesia,” American Economic Review, Vol. 97, No. 5, pp. 1611–1638.
Bernard, A.B., J.B. Jensen, S.J. Redding, and P.K. Schott (2007). “Firms in international trade,” Journal of Economic Perspectives, Vol. 21, No. 3, pp. 105–130.
______(2012) “The Empirics of Firm Heterogeneity and International Trade,” Annual Review of Economics, Vol. 4, pp. 283–313.
Bigsten, A., and M. Gebreeyesus (2009). “Firm Productivity and Exports: Evidence from Ethiopian Manufacturing,” Journal of Development Studies, Vol. 45, No. 10, pp. 1594–1614.
Bigsten, A., P. Collier, S. Dercon, M. Fafchamps, B. Gauthier, J.W. Gunning, A. Oduro, R. Oostendorp, C. Pattillo, M. Soederbom, F. Teal, and A. Zeufack (2004). “Do African manufacturing firms learn from exporting?” Journal of Development Studies, Vol. 40, No. 3, pp. 115–141.
Bigsten, A., M. Gebreeyesus, and M. Soederbom (2016). “Tariffs and Firm Performance in Ethiopia,” Journal of Development Studies, Vol. 52, No. 7, pp. 986-1001.
Blau, Francine D., and Lawrence M. Kahn (2017) “The Gender-Wage Gap: Extent, Trends, and Explanations,” Journal of Economic Literature, Vol. 55, No. 3, pp. 789-865.
Boler, Esther Ann, Beata Javorcik, and Karen Helene Ulltveit-Moe (2015) “Globalization: A Woman’s Best Friend? Exporters and the Gender Wage Gap.” CEP Discussion Papers 1358, London: Centre for Economic Performance.
Brambilla, I. and G. Porto (2016). “High-income export destinations, quality and wages,” Journal of International Economics, Vol. 98, pp. 21–35.
Brambilla, I., D. Lederman, and G. Porto (2012). “Exports, export destinations, and skills,” American Economic Review, Vol. 102, No. 7, pp. 3406–3438.
Brambilla, I., N. Depetris-Chauvin, and G. Porto (2017). “Examining the export wage premium in developing countries,” Review of International Economics, Vol. 25, No. 3, pp. 447-475.
De Loecker, J. (2013). “Detecting Learning by Exporting,” American Economic Journal: Microeconomics, Vol. 5, No. 3, pp. 1–21.
Dollar, D. and A. Kraay (2004). “Trade, growth and poverty,” The Economic Journal, Vol. 114, pp. F22–F49.
Duda-Nyczak, M. and C. Viegelahn (2016). “Exporters, importers and employment: Firm-level evidence from Africa,” Indian Journal of Labour Economics, Vol. 59, No. 3, pp. 309-341.
Ethier, W. (1982). “National and international returns to scale in the modern theory of international trade,” American Economic Review, Vol. 72, pp. 389–405.
Frías, J., D. Kaplan, and E. Verhoogen (2012). “Exports and Within-Plant Wage Distributions: Evidence from Mexico,” American Economic Review: Papers and Proceedings, Vol. 102, No. 3, pp. 435–440.
Frazer, G. (2014). “Imports, import sources and skill utilization.” Working Paper.
Fu, D. and Y. Wu (2013). “Export wage premium in China’s manufacturing sector: A firm level analysis,” China Economic Review, Vol. 26, pp. 182–196.
References
7978
TRADE AND POVERTY REDUCTION: NEW EVIDENCE OF IMPACTS IN DEVELOPING COUNTRIESTRADE AND POVERTY REDUCTION: NEW EVIDENCE OF IMPACTS IN DEVELOPING COUNTRIES
Grossman, G., and E. Helpman (1991). Innovation and Growth in The Global Economy, Cambridge, Massachusetts: MIT Press.
Halpern, L., M. Koren, and A. Szeidl (2015). “Imported inputs and productivity,” American Economic Review, Vol. 105, No. 12, pp. 3660–3703.
Hwang, A.R. (2003). “Exports, Returns to Scale, and Total Factor Productivity: The Case of Taiwanese Manufacturing Industries,” Review of Development Economics, Vol. 7, No. 2, pp. 204–216.
International Labour Office (2018). World Employment and Social Outlook: Trends 2018, Geneva.
Kasahara, H., and B. Lapham (2013). “Productivity and the decision to import and export: theory and evidence,” Journal of International Economics, Vol. 89, pp. 297–316.
Kugler, M., and E. Verhoogen (2012). “Prices, plant size and product quality,” Review of Economic Studies, Vol. 79, No. 1, pp. 307–339.
Le Goff, M., and R. J. Singh (2014). “Does trade reduce poverty? A view from Africa,” Journal of African Trade, Vol. 1, No. 1, pp. 5–14.
Machikita, T., and H. Sato (2016). “Temporary jobs and globalization.” IDE Discussion Paper No. 585, Chiba: Institute of Developing Economies, Japan External Trade Organization (JETRO).
Macis, M., and F. Schivardi (2016). “Exports and Wages: Rent Sharing, Workforce Composition, or Returns to Skills?” Journal of Labour Economics, Vol. 34, No. 4, pp. 945–978.
Markusen, J.R. (1989). “Trade in producer services and in other specialized intermediate inputs,” American Economic Review, Vol. 79, pp. 85–95.
Matsuyama, K. (2007). “Beyond Icebergs: Towards a Theory of Biased Globalization,” Review of Economic Studies, Vol. 74, No. 1, pp. 237–53.
Melitz, M.J. (2003). “The impact of trade on intra-industry reallocations and aggregate industry productivity,” Econometrica, Vol. 71, No. 6, pp. 1695–1725.
Mengistae, T., and C. Pattillo (2004). “Export Orientation and Productivity in Sub-Saharan Africa,” IMF Staff Papers, Vol. 51, No. 2, pp. 327–353.
Milner, C., and V. Tandrayen (2007). “The Impact of Exporting and Export Destination on Manufacturing Wages: Evidence for Sub-Saharan Africa,” Review of Development Economics, Vol. 11, No. 1, pp. 13–30.
Rankin, N., and V. Schoer (2013). “Export Destination, Product Quality and Wages in a Middle-Income Country. The Case of South Africa,” Review of Development Economics, Vol. 17, No. 1, pp. 64–73.
Saliola, Federica, and Murat Seker (2011). “Total factor productivity across the developing world.” Enterprise Surveys, Enterprise Note Series, Enterprise Note No. 23, Washington DC: World Bank.
Schank, T., C. Schnabel, and J. Wagner (2007). “Do exporters really pay higher wages? First evidence from German linked employer-employee data,” Journal of International Economics, Vol. 72, No. 1, pp. 52–74.
Stone, S., and B. Shepherd (2011). “Dynamic gains from trade: the role of intermediate inputs and equipment imports.” OECD Trade Policy Papers No. 110, Paris: Organization for Economic Co-operation and Development.
Vandenbussche, H., and C. Viegelahn (2016). “Trade protection and input switching.” CEPR Working Paper No. 11395, London: Centre for Economic Policy Research.
Verhoogen, E. (2008). “Trade, Quality Upgrading and Wage Inequality in the Mexican Manufacturing Sector,” The Review of World Economics, Vol. 123, No. 2, pp. 489–530.
World Bank (2012). “Globalization’s impact on gender equality: What’s happened and what’s needed,” Chapter 6 in World Development Report 2012: Gender equality and development , Washington D.C.: World Bank.
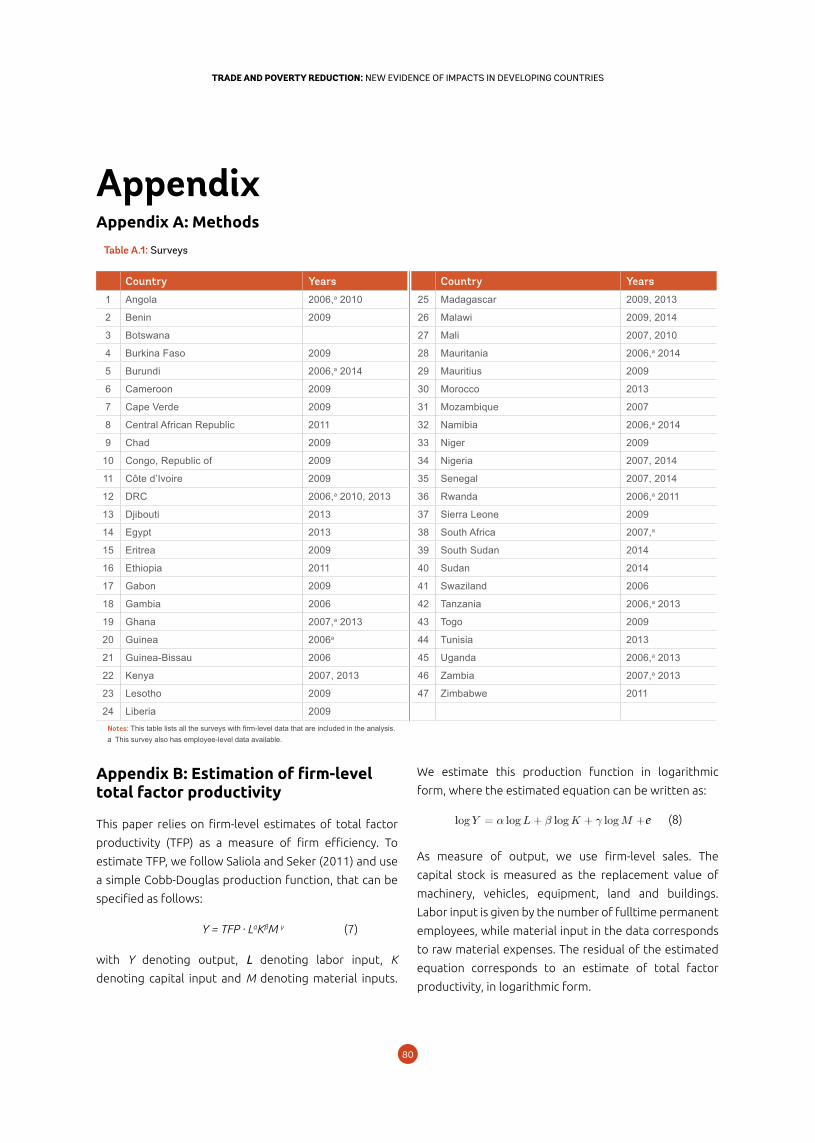
8180
TRADE AND POVERTY REDUCTION: NEW EVIDENCE OF IMPACTS IN DEVELOPING COUNTRIESTRADE AND POVERTY REDUCTION: NEW EVIDENCE OF IMPACTS IN DEVELOPING COUNTRIES
Appendix B: Estimation of firm-level total factor productivity
This paper relies on firm-level estimates of total factor
productivity (TFP) as a measure of firm efficiency. To
estimate TFP, we follow Saliola and Seker (2011) and use
a simple Cobb-Douglas production function, that can be
specified as follows:
Y = TFP · LαKβM γ (7)
with Y denoting output, L denoting labor input, K
denoting capital input and M denoting material inputs.
We estimate this production function in logarithmic
form, where the estimated equation can be written as:
(8)
As measure of output, we use firm-level sales. The
capital stock is measured as the replacement value of
machinery, vehicles, equipment, land and buildings.
Labor input is given by the number of fulltime permanent
employees, while material input in the data corresponds
to raw material expenses. The residual of the estimated
equation corresponds to an estimate of total factor
productivity, in logarithmic form.
AppendixTable A.1: Surveys
Country Years Country Years
1 Angola 2006,a 2010 25 Madagascar 2009, 2013
2 Benin 2009 26 Malawi 2009, 2014
3 Botswana 27 Mali 2007, 2010
4 Burkina Faso 2009 28 Mauritania 2006,a 2014
5 Burundi 2006,a 2014 29 Mauritius 2009
6 Cameroon 2009 30 Morocco 2013
7 Cape Verde 2009 31 Mozambique 2007
8 Central African Republic 2011 32 Namibia 2006,a 2014
9 Chad 2009 33 Niger 2009
10 Congo, Republic of 2009 34 Nigeria 2007, 2014
11 Côte d’Ivoire 2009 35 Senegal 2007, 2014
12 DRC 2006,a 2010, 2013 36 Rwanda 2006,a 2011
13 Djibouti 2013 37 Sierra Leone 2009
14 Egypt 2013 38 South Africa 2007,a
15 Eritrea 2009 39 South Sudan 2014
16 Ethiopia 2011 40 Sudan 2014
17 Gabon 2009 41 Swaziland 2006
18 Gambia 2006 42 Tanzania 2006,a 2013
19 Ghana 2007,a 2013 43 Togo 2009
20 Guinea 2006a 44 Tunisia 2013
21 Guinea-Bissau 2006 45 Uganda 2006,a 2013
22 Kenya 2007, 2013 46 Zambia 2007,a 2013
23 Lesotho 2009 47 Zimbabwe 2011
24 Liberia 2009Notes: This table lists all the surveys with firm-level data that are included in the analysis.a This survey also has employee-level data available.
Appendix A: Methods
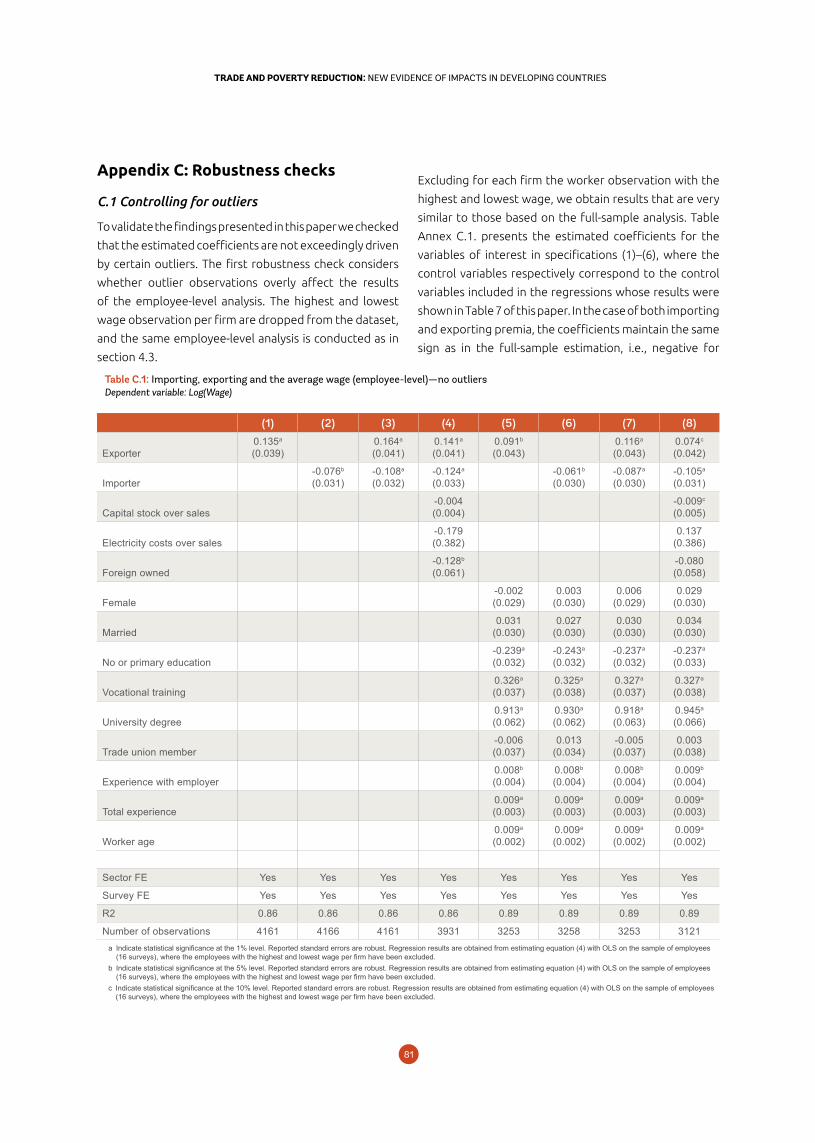
8180
TRADE AND POVERTY REDUCTION: NEW EVIDENCE OF IMPACTS IN DEVELOPING COUNTRIESTRADE AND POVERTY REDUCTION: NEW EVIDENCE OF IMPACTS IN DEVELOPING COUNTRIES
Table C.1: Importing, exporting and the average wage (employee-level)—no outliers Dependent variable: Log(Wage)
(1) (2) (3) (4) (5) (6) (7) (8)
Exporter0.135a
(0.039)0.164a
(0.041)0.141a
(0.041)0.091b
(0.043)0.116a
(0.043)0.074c
(0.042)
Importer-0.076b
(0.031)-0.108a
(0.032)-0.124a
(0.033)-0.061b
(0.030)-0.087a
(0.030)-0.105a
(0.031)
Capital stock over sales-0.004(0.004)
-0.009c
(0.005)
Electricity costs over sales-0.179(0.382)
0.137(0.386)
Foreign owned-0.128b
(0.061)-0.080(0.058)
Female-0.002(0.029)
0.003(0.030)
0.006(0.029)
0.029(0.030)
Married0.031
(0.030)0.027
(0.030)0.030
(0.030)0.034
(0.030)
No or primary education-0.239a
(0.032)-0.243a
(0.032)-0.237a
(0.032)-0.237a
(0.033)
Vocational training0.326a
(0.037)0.325a
(0.038)0.327a
(0.037)0.327a
(0.038)
University degree0.913a
(0.062)0.930a
(0.062)0.918a
(0.063)0.945a
(0.066)
Trade union member-0.006(0.037)
0.013(0.034)
-0.005(0.037)
0.003(0.038)
Experience with employer0.008b
(0.004)0.008b
(0.004)0.008b
(0.004)0.009b
(0.004)
Total experience0.009a
(0.003)0.009a
(0.003)0.009a
(0.003)0.009a
(0.003)
Worker age0.009a
(0.002)0.009a
(0.002)0.009a
(0.002)0.009a
(0.002)
Sector FE Yes Yes Yes Yes Yes Yes Yes Yes
Survey FE Yes Yes Yes Yes Yes Yes Yes Yes
R2 0.86 0.86 0.86 0.86 0.89 0.89 0.89 0.89
Number of observations 4161 4166 4161 3931 3253 3258 3253 3121a Indicate statistical significance at the 1% level. Reported standard errors are robust. Regression results are obtained from estimating equation (4) with OLS on the sample of employees
(16 surveys), where the employees with the highest and lowest wage per firm have been excluded.b Indicate statistical significance at the 5% level. Reported standard errors are robust. Regression results are obtained from estimating equation (4) with OLS on the sample of employees
(16 surveys), where the employees with the highest and lowest wage per firm have been excluded.c Indicate statistical significance at the 10% level. Reported standard errors are robust. Regression results are obtained from estimating equation (4) with OLS on the sample of employees
(16 surveys), where the employees with the highest and lowest wage per firm have been excluded.
Appendix C: Robustness checks
C.1 Controlling for outliers
To validate the findings presented in this paper we checked
that the estimated coefficients are not exceedingly driven
by certain outliers. The first robustness check considers
whether outlier observations overly affect the results
of the employee-level analysis. The highest and lowest
wage observation per firm are dropped from the dataset,
and the same employee-level analysis is conducted as in
section 4.3.
Excluding for each firm the worker observation with the
highest and lowest wage, we obtain results that are very
similar to those based on the full-sample analysis. Table
Annex C.1. presents the estimated coefficients for the
variables of interest in specifications (1)–(6), where the
control variables respectively correspond to the control
variables included in the regressions whose results were
shown in Table 7 of this paper. In the case of both importing
and exporting premia, the coefficients maintain the same
sign as in the full-sample estimation, i.e., negative for
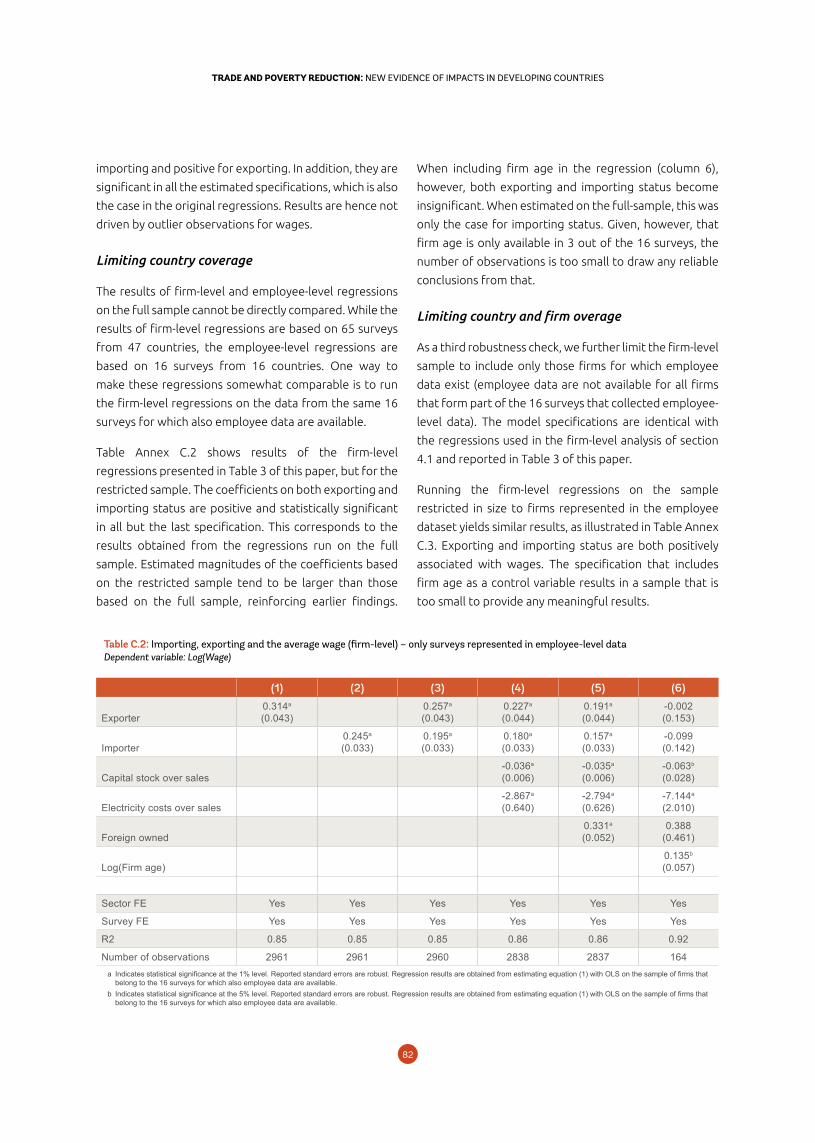
8382
TRADE AND POVERTY REDUCTION: NEW EVIDENCE OF IMPACTS IN DEVELOPING COUNTRIESTRADE AND POVERTY REDUCTION: NEW EVIDENCE OF IMPACTS IN DEVELOPING COUNTRIES
When including firm age in the regression (column 6),
however, both exporting and importing status become
insignificant. When estimated on the full-sample, this was
only the case for importing status. Given, however, that
firm age is only available in 3 out of the 16 surveys, the
number of observations is too small to draw any reliable
conclusions from that.
Limiting country and firm overage
As a third robustness check, we further limit the firm-level
sample to include only those firms for which employee
data exist (employee data are not available for all firms
that form part of the 16 surveys that collected employee-
level data). The model specifications are identical with
the regressions used in the firm-level analysis of section
4.1 and reported in Table 3 of this paper.
Running the firm-level regressions on the sample
restricted in size to firms represented in the employee
dataset yields similar results, as illustrated in Table Annex
C.3. Exporting and importing status are both positively
associated with wages. The specification that includes
firm age as a control variable results in a sample that is
too small to provide any meaningful results.
importing and positive for exporting. In addition, they are
significant in all the estimated specifications, which is also
the case in the original regressions. Results are hence not
driven by outlier observations for wages.
Limiting country coverage
The results of firm-level and employee-level regressions
on the full sample cannot be directly compared. While the
results of firm-level regressions are based on 65 surveys
from 47 countries, the employee-level regressions are
based on 16 surveys from 16 countries. One way to
make these regressions somewhat comparable is to run
the firm-level regressions on the data from the same 16
surveys for which also employee data are available.
Table Annex C.2 shows results of the firm-level
regressions presented in Table 3 of this paper, but for the
restricted sample. The coefficients on both exporting and
importing status are positive and statistically significant
in all but the last specification. This corresponds to the
results obtained from the regressions run on the full
sample. Estimated magnitudes of the coefficients based
on the restricted sample tend to be larger than those
based on the full sample, reinforcing earlier findings.
Table C.2: Importing, exporting and the average wage (firm-level) – only surveys represented in employee-level data Dependent variable: Log(Wage)
(1) (2) (3) (4) (5) (6)
Exporter0.314a
(0.043)0.257a
(0.043)0.227a
(0.044)0.191a
(0.044)-0.002(0.153)
Importer0.245a
(0.033)0.195a
(0.033)0.180a
(0.033)0.157a
(0.033)-0.099(0.142)
Capital stock over sales-0.036a
(0.006)-0.035a
(0.006)-0.063b
(0.028)
Electricity costs over sales-2.867a
(0.640)-2.794a
(0.626)-7.144a
(2.010)
Foreign owned0.331a
(0.052)0.388
(0.461)
Log(Firm age)0.135b
(0.057)
Sector FE Yes Yes Yes Yes Yes Yes
Survey FE Yes Yes Yes Yes Yes Yes
R2 0.85 0.85 0.85 0.86 0.86 0.92
Number of observations 2961 2961 2960 2838 2837 164a Indicates statistical significance at the 1% level. Reported standard errors are robust. Regression results are obtained from estimating equation (1) with OLS on the sample of firms that
belong to the 16 surveys for which also employee data are available.b Indicates statistical significance at the 5% level. Reported standard errors are robust. Regression results are obtained from estimating equation (1) with OLS on the sample of firms that
belong to the 16 surveys for which also employee data are available.
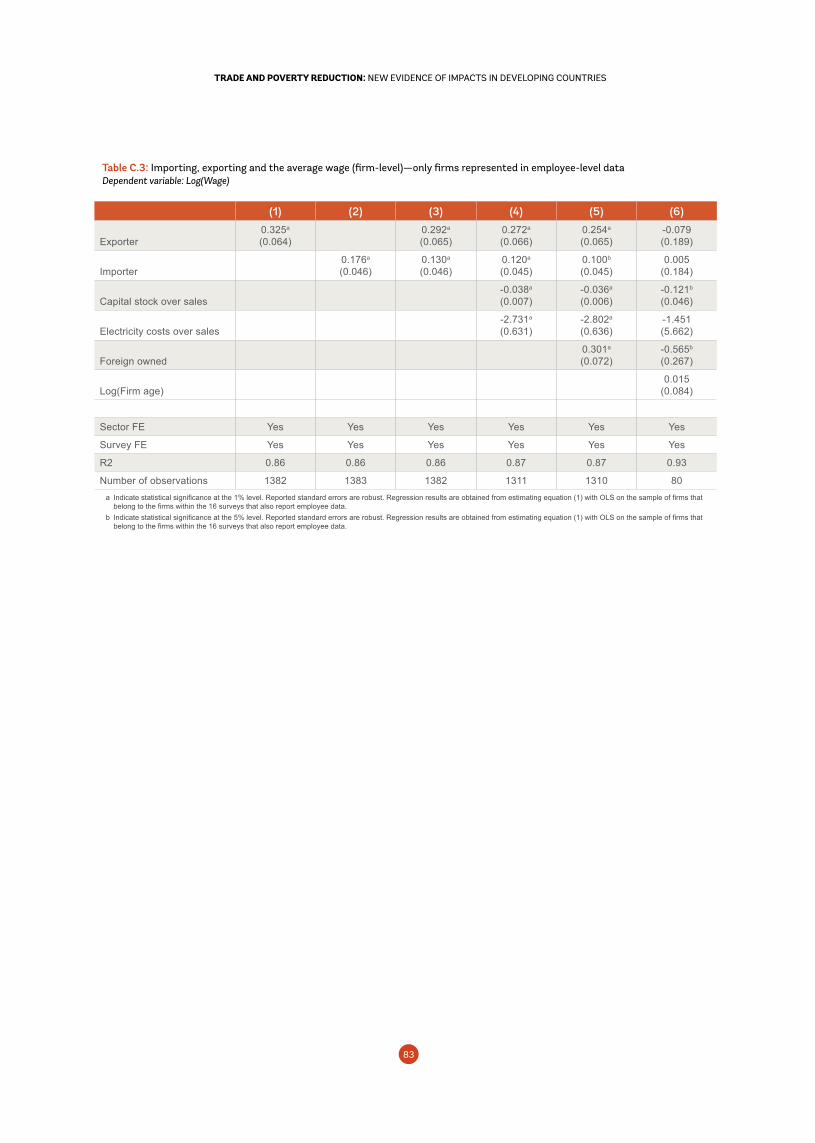
8382
TRADE AND POVERTY REDUCTION: NEW EVIDENCE OF IMPACTS IN DEVELOPING COUNTRIESTRADE AND POVERTY REDUCTION: NEW EVIDENCE OF IMPACTS IN DEVELOPING COUNTRIES
Table C.3: Importing, exporting and the average wage (firm-level)—only firms represented in employee-level data Dependent variable: Log(Wage)
(1) (2) (3) (4) (5) (6)
Exporter0.325a
(0.064)0.292a
(0.065)0.272a
(0.066)0.254a
(0.065)-0.079(0.189)
Importer0.176a
(0.046)0.130a
(0.046)0.120a
(0.045)0.100b
(0.045)0.005
(0.184)
Capital stock over sales-0.038a
(0.007)-0.036a
(0.006)-0.121b
(0.046)
Electricity costs over sales-2.731a
(0.631)-2.802a
(0.636)-1.451(5.662)
Foreign owned0.301a
(0.072)-0.565b
(0.267)
Log(Firm age)0.015
(0.084)
Sector FE Yes Yes Yes Yes Yes Yes
Survey FE Yes Yes Yes Yes Yes Yes
R2 0.86 0.86 0.86 0.87 0.87 0.93
Number of observations 1382 1383 1382 1311 1310 80a Indicate statistical significance at the 1% level. Reported standard errors are robust. Regression results are obtained from estimating equation (1) with OLS on the sample of firms that
belong to the firms within the 16 surveys that also report employee data.b Indicate statistical significance at the 5% level. Reported standard errors are robust. Regression results are obtained from estimating equation (1) with OLS on the sample of firms that
belong to the firms within the 16 surveys that also report employee data.
8584
TRADE AND POVERTY REDUCTION: NEW EVIDENCE OF IMPACTS IN DEVELOPING COUNTRIESTRADE AND POVERTY REDUCTION: NEW EVIDENCE OF IMPACTS IN DEVELOPING COUNTRIES
The Poverty Impact of Modernising Dar es Salaam Port1
1. Introduction
This study assesses the likely impact of the
modernization of the Port of Dar es Salaam
on household welfare and poverty in Tanzania
and neighboring countries. Trade volumes in
Tanzania increased more than 10% per year in the last
decade, and international trade has been one of the
engines of growth in the country. However, the current
state of Dar es Salaam port is a severe constraint on
further growth. Increasing the efficiency of the port is a
key challenge; container vessels have to wait an average
of more than 10 days before berthing, and dwell times
average another 10 days. The costs associated with
the inefficiencies in the port are partially related to
congestion. The situation is more critical for imports
than for exports; the inefficiencies act as an implicit tax
on imports and to a lesser extent as a tax on exports
(Morisset, 2013).
We assume that port modernization would result in a
reduction of 5% in border prices for bulk cargo, and
measure the impact on the economy and on poverty in
the short run. The analysis proceeds in two-steps: first,
the extent of the transmission of border prices to retail
and farm gate prices will be evaluated; second, these
estimated price changes will be used to determine
the welfare effects for different demographic groups,
Nicolás Depetris-Chauvin, Geneva School of Business Administration, HES-SO2 Pablo Depetris-Chauvin, Universidad Torcuato Di Tella3
Francis Mulangu, Millennium Challenge Corporation4
1 This study has been funded by UK aid from the UK Government, however the views expressed do not necessarily reflect the UK Government’s opinions or official polices. We thank Tim Bushell and DFID Tanzania seminar participants for useful comments and discussion. All errors are our responsibility.
2 Geneva School of Business Administration, HES-SO.3 Universidad Torcuato Di Tella.4 Millennium Challenge Corporation.
particularly the impact on urban versus rural households
and on different income levels.
The study is organized as follows. The next section
presents basic information regarding the planned
infrastructure and operational improvements for the
Dar es Salaam Port. Section 3 introduces the trade and
poverty methodology based on the use of micro data,
which enables the identification of the different channels
through which trade may affect poverty. Section 4
describes trade and industrial policy and the structure
of production and trade flows in Tanzania. Based on the
findings of section 4 and on complementary information
on market structure and infrastructure, section 5
estimates the expected impact of the port project on
trade flows and prices. It covers a limited basket of
goods which are a small proportion of the cargo going
through the port, but make up a very large share of the
consumption basket of poor households and are also an
important source of their income. Section 6 presents
a poverty profile for Tanzania. In particular, it describes
consumption and income patterns for different levels
of livelihood, distinguishing between rural and urban
households. Section 7 combines the information on price
changes (section 5) and the household data (section 6)
to provide estimations of the short-term welfare impact.
Section 8 concludes with some recommendations.
8584
TRADE AND POVERTY REDUCTION: NEW EVIDENCE OF IMPACTS IN DEVELOPING COUNTRIESTRADE AND POVERTY REDUCTION: NEW EVIDENCE OF IMPACTS IN DEVELOPING COUNTRIES
The Poverty Impact of Modernising Dar es Salaam Port1
Nicolás Depetris-Chauvin, Geneva School of Business Administration, HES-SO2 Pablo Depetris-Chauvin, Universidad Torcuato Di Tella3
Francis Mulangu, Millennium Challenge Corporation4
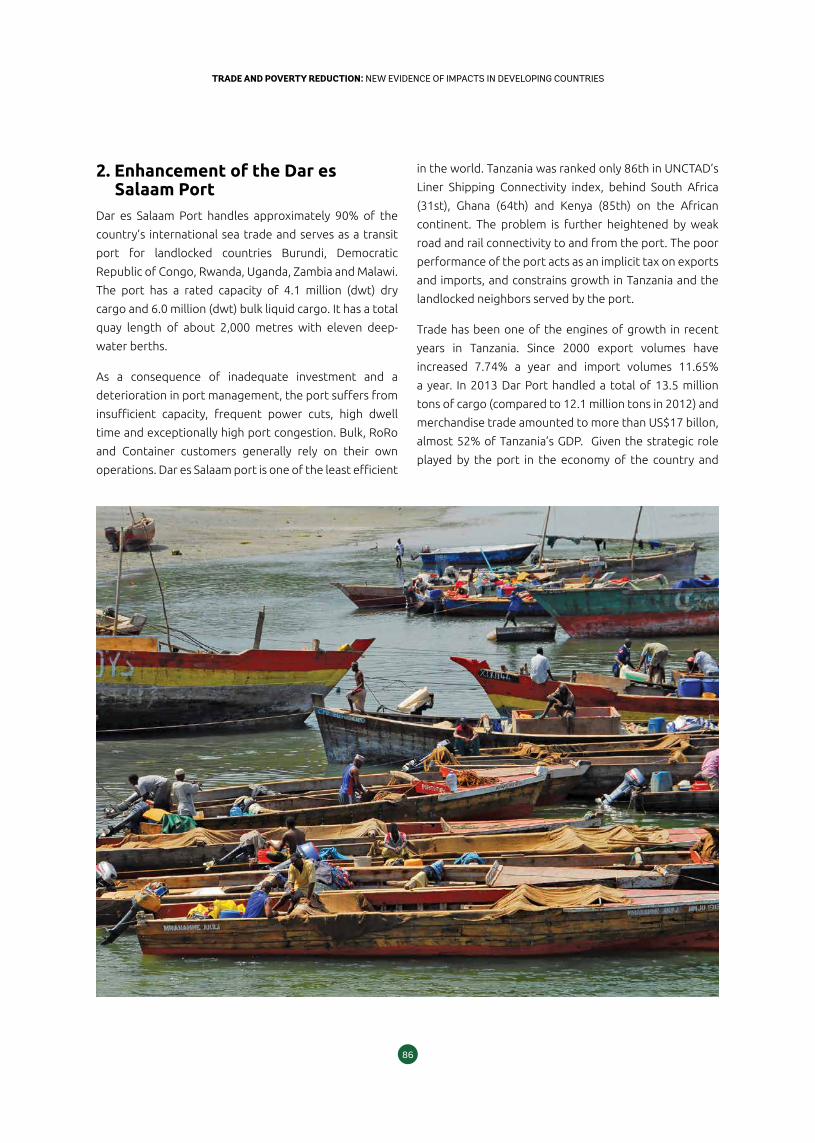
8786
TRADE AND POVERTY REDUCTION: NEW EVIDENCE OF IMPACTS IN DEVELOPING COUNTRIESTRADE AND POVERTY REDUCTION: NEW EVIDENCE OF IMPACTS IN DEVELOPING COUNTRIES
2. Enhancement of the Dar es Salaam Port
Dar es Salaam Port handles approximately 90% of the
country’s international sea trade and serves as a transit
port for landlocked countries Burundi, Democratic
Republic of Congo, Rwanda, Uganda, Zambia and Malawi.
The port has a rated capacity of 4.1 million (dwt) dry
cargo and 6.0 million (dwt) bulk liquid cargo. It has a total
quay length of about 2,000 metres with eleven deep-
water berths.
As a consequence of inadequate investment and a
deterioration in port management, the port suffers from
insufficient capacity, frequent power cuts, high dwell
time and exceptionally high port congestion. Bulk, RoRo
and Container customers generally rely on their own
operations. Dar es Salaam port is one of the least efficient
in the world. Tanzania was ranked only 86th in UNCTAD’s
Liner Shipping Connectivity index, behind South Africa
(31st), Ghana (64th) and Kenya (85th) on the African
continent. The problem is further heightened by weak
road and rail connectivity to and from the port. The poor
performance of the port acts as an implicit tax on exports
and imports, and constrains growth in Tanzania and the
landlocked neighbors served by the port.
Trade has been one of the engines of growth in recent
years in Tanzania. Since 2000 export volumes have
increased 7.74% a year and import volumes 11.65%
a year. In 2013 Dar Port handled a total of 13.5 million
tons of cargo (compared to 12.1 million tons in 2012) and
merchandise trade amounted to more than US$17 billon,
almost 52% of Tanzania’s GDP. Given the strategic role
played by the port in the economy of the country and
8786
TRADE AND POVERTY REDUCTION: NEW EVIDENCE OF IMPACTS IN DEVELOPING COUNTRIESTRADE AND POVERTY REDUCTION: NEW EVIDENCE OF IMPACTS IN DEVELOPING COUNTRIES
the region, and the evident deterioration in its capacity
to deal with increasing trade flows, the Tanzania Ports
Authority, the Ministry of Transport and Trade Mark East
Africa (TMEA) worked together to put forward a support
program. The Government later agreed to partner with
TMEA, the United Kingdom Department for International
Development (DFID) and the World Bank to implement a
series of reforms to increase the efficiency and handling
capacity of Dar Port through improvements in port
infrastructure and cargo clearance procedures so that it
is better able to handle future growth in trade.
While there is a long-standing consensus among
academics and policy-makers on the positive role of port
infrastructure investments in fostering trade and growth,
the link with poverty reduction is weaker. The trade
literature emphasizes the gains from trade, but it also
acknowledges that there are unavoidably winners and
losers from trade. This creates a potential distributional
conflict as well as potential adverse effects on equality.
In what follows the research develops a methodology
to estimate the welfare impact of the proposed
improvement in the Dar es Salaam port, identifying the
winners and losers from increased trade.
3. Trade and poverty methodologyThere is no general framework that predicts the effect
of trade on poverty. Globalization poses both risks
and opportunities for developing countries and poor
citizens of those countries. Access to new markets for
exporting firms in developing countries potentially
creates employment and increases the salary of workers
in those sectors. Local firms can also access better inputs
and technology, helping to close the productivity gap
observed in most developing countries. However, in
the presence of market failures it is not clear that the
gains from trade will be observed. Moreover, trade
could potentially increase unemployment, poverty
and income inequality in the short and medium term,
making it unsustainable socially, economically, and
politically (Artuc et al., 2015; Artuc and Porto, 2016; and
Dix-Carneiro, 2014). This suggests that the relationship
between international trade and poverty is complex.
The overall effect of globalization in a developing
country may depend on the provision of complementary
policies, institutions, and infrastructure, highlighting the
importance of public policies.
Food is often the largest household expenditure for poor
people, while much of their income will come from wages
and, for rural households, from sales of agricultural
produce. The modernization of the port should reduce
delays, wastage and losses, and probably increase the
level of competition in the logistics associated with
trade. This will reduce the prices of imported goods
(though the level of pass-through will depend on other
complementary policies) and increase the level of
competition with local producers. It will also provide
enhanced export opportunities both for local producers
and landlocked neighboring countries. All these changes
will have distributional impacts.
The conceptual framework in this paper is organized
around the two-step approach of the trade and poverty
literature.5 The first step involves an assessment of how
the infrastructure project will affect trade flows and
how these changes in trading opportunities will affect
the prices of goods and production factors. This step
will require an assessment of the effect of the reform
on border prices and how those changes on border
prices would be transmitted to retail and producer prices
and potentially to wages. The extent of pass-through
will depend, among many factors, on the trade and
production structure, the existing trade and industrial
policy, sectoral market structure (level of competition
among importers and exporters) and the degree of
market integration in Tanzania. The second step uses
household surveys to assess the poverty impacts of
those changes in trade. It will follow the standard first
order effects approach, as in Deaton (1989, 1997). Using
microdata from the household surveys, consumption
and income shares derived from the production and
consumption of different goods will be used to evaluate
the consumption, income, and overall impacts of a given
price change.
5 See Chapter 1 of World Bank and World Trade Organization (2015) for the macroeconomic links between growth, trade, and poverty.
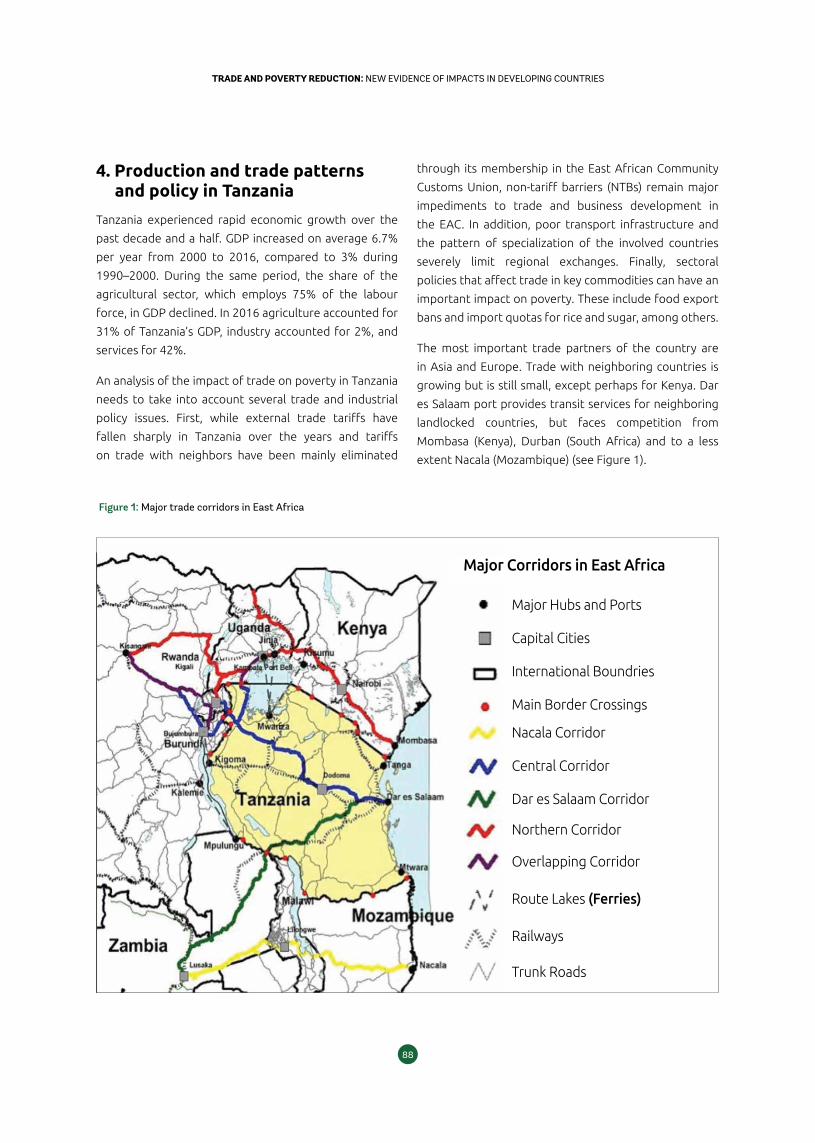
8988
TRADE AND POVERTY REDUCTION: NEW EVIDENCE OF IMPACTS IN DEVELOPING COUNTRIESTRADE AND POVERTY REDUCTION: NEW EVIDENCE OF IMPACTS IN DEVELOPING COUNTRIES
4. Production and trade patterns and policy in Tanzania
Tanzania experienced rapid economic growth over the
past decade and a half. GDP increased on average 6.7%
per year from 2000 to 2016, compared to 3% during
1990–2000. During the same period, the share of the
agricultural sector, which employs 75% of the labour
force, in GDP declined. In 2016 agriculture accounted for
31% of Tanzania’s GDP, industry accounted for 2%, and
services for 42%.
An analysis of the impact of trade on poverty in Tanzania
needs to take into account several trade and industrial
policy issues. First, while external trade tariffs have
fallen sharply in Tanzania over the years and tariffs
on trade with neighbors have been mainly eliminated
through its membership in the East African Community
Customs Union, non-tariff barriers (NTBs) remain major
impediments to trade and business development in
the EAC. In addition, poor transport infrastructure and
the pattern of specialization of the involved countries
severely limit regional exchanges. Finally, sectoral
policies that affect trade in key commodities can have an
important impact on poverty. These include food export
bans and import quotas for rice and sugar, among others.
The most important trade partners of the country are
in Asia and Europe. Trade with neighboring countries is
growing but is still small, except perhaps for Kenya. Dar
es Salaam port provides transit services for neighboring
landlocked countries, but faces competition from
Mombasa (Kenya), Durban (South Africa) and to a less
extent Nacala (Mozambique) (see Figure 1).
Figure 1: Major trade corridors in East Africa
Major Hubs and Ports
Capital Cities
International Boundries
Main Border Crossings
Nacala Corridor
Central Corridor
Dar es Salaam Corridor
Northern Corridor
Overlapping Corridor
Route Lakes (Ferries)
Railways
Trunk Roads
Major Corridors in East Africa
8988
TRADE AND POVERTY REDUCTION: NEW EVIDENCE OF IMPACTS IN DEVELOPING COUNTRIESTRADE AND POVERTY REDUCTION: NEW EVIDENCE OF IMPACTS IN DEVELOPING COUNTRIES
Understanding the agricultural sector is essential for
estimating the poverty impact of the enhancement of the
port of Dar es Salaam, as most families, and in particular
most poor households, are involved in agriculture.
Farming or livestock husbandry is the main occupation for
the majority of the population in all regions except for
Dar es Salaam and Mjini Magharibi. The main activity for
79.4% of the families in rural areas is farming, livestock
husbandry or fishing, compared to 30.5% in urban areas
(Tanzania, 2012).
In the agricultural sector, production is dominated by
food crops and livestock. The main products include meat
(US$783 million), bananas (US$711 million), dry beans
(US$685 million), maize (US$668 million), milk (US$578
million), cassava (US$571 million) and rice (US$482
million). Tobacco, cotton and cashew were the largest
cash crops for the export market (FAOStat, 2015).
Tanzania’s three main import products in terms of
value are wheat, oil palm, and refined sugar. The three
products are mainly imported through Dar es Salaam
port. However, as will be seen in the household data,
these products do not account for a large share of the
consumption basket of households under the national
poverty line (mostly rural households). These products
are more important for urban households, including
those below the international poverty line of US$3 per
day. Cost reductions from port improvements may not
be passed to consumers of these three products, for a
number of reasons. Imports of sugar are controlled by the
Sugar Board of Tanzania, and the price is kept artificially
high to encourage investments by local producers.
Imports of wheat are dominated by one firm (SSB), which
accounts for almost three quarters of the market. Palm
oil competes with other sources of edible oil produced
locally (sunflower, seeds, and cotton).
The main agricultural export products are coffee,
tobacco, and cashew. Food crop exports are very low.
Between 2000 and 2011, the configuration of Tanzania’s
top agricultural export items has not changed. Export
growth has been important in the case of tobacco but
disappointing for coffee and cashews. These are products
that are exported with little domestic processing, and the
required level of technology to produce them has not
changed. The country could potentially increase its share
in global markets for these and other cash crops, and a
more efficient port could contribute to that.
5. The expected impact of the port project on trade flows and prices
This study assumes that the project’s rearrangement
of existing port infrastructure and improvements in
administrative procedures would reduce border prices for
bulk imports, and increase border prices for exports, by
5%. World Bank (2013) finds that the total cumulative
cost of the delays and additional monetary costs for the
Dar es Salaam port are equivalent to a tariff of about 5%
on bulk imports. This figure was obtained by comparing
the performance of Dar es Salaam with the port of
Mombasa. The tariff equivalent was computed as the
sum of the direct monetary costs, the cost of waiting at
anchorage and the inventory cost, based on an average
value of US$1,137 per ton for dry bulk imports. Interviews
with several local stakeholders confirmed that this is a
reasonable figure.
Estimating the impact on exports of port improvements
is complicated. While an improvement in the efficiency
of the port should increase the competitiveness of
Tanzanian exports, producers in Tanzania face many
constraints other than the inefficiencies of the port.
According to the KPMG/World Bank (2013) “Pulse of
the Tanzanian Economy” survey, the state of the port is
a serious constraint for one third of the mid-size firms
surveyed. In addition, 43% of the respondents cited
corruption, followed by tax rates and regulations (29%)
and access to finance (24%) as major constraints.
Moreover, other surveys point to deficiencies in railways
and road infrastructure, as well as unreliable energy
supply, as important constraints on businesses. The
lack of an adequately-educated force is also a severe
constraint. Tanzania is ranked 131st out of 189 countries
in Doing Business 2015 (World Bank), somewhat better
than position 145 in 2014.
To study the transmission of border prices to retail and
farmgate prices, it is important to consider the level
of competition in the value chains for the different
products that are produced and traded in a country (Horn
9190
TRADE AND POVERTY REDUCTION: NEW EVIDENCE OF IMPACTS IN DEVELOPING COUNTRIESTRADE AND POVERTY REDUCTION: NEW EVIDENCE OF IMPACTS IN DEVELOPING COUNTRIES
and Levinshon, 2001; Porto et al., 2011; Swinnen and
Vandeplas, 2010 and 2014). In Tanzania, international
market conditions combine with domestic market
configurations in shaping agriculture growth and poverty
reduction. While the farming sector is composed mostly
of smallholders, the lower layers of the value chains are
usually dominated by a small number of firms. Farmers
may suffer from the non-competitive behavior of other
agents along the chain, or be constrained from selling
output in markets because transport and other services
are not available or are too costly.
This study uses a model developed by Depetris-Chauvin
et al. (2017) to estimate the impact of the enhancement
of the port of Dar es Salaam on poverty. This model
explains the allocation of factors of production to various
cash and food crops and how this allocation depends on
competition along the supply chain and on the constraints
faced by different types of farmers. The model describes
the behavior of farms, exporters and importers in a simple
partial equilibrium setting. There are different versions of
the model to deal with the three basic scenarios that we
face in our empirical work. That is, a first version of the
model explores the case of cash crop production (mostly
for exports). In the case of exported cash crops, farmers
sell products to oligopsonies, which then undertake the
international trading. This version can be used to study
crops such as cotton, coffee, tea, tobacco, cacao, vanilla,
etc. This model is then adapted to deal with the case of a
country that is a net exporter of a food crop. In this case,
there are oligopsonies in charge of exports, but there is
also a domestic residual market of net-consumers of that
crop. Food crop exports can include any relevant crop in a
particular country, namely maize, rice, fish, livestock, etc.
Finally, a different version of the model is developed for
the case of a country that is a net importer of a food crop
whereby excess demand is met via international trade,
and net-consumers must purchase these agricultural
goods from oligopolies. The three versions of the model
share common elements, such as the structure of utility,
the constraints on production and the market structure,
but differ in the way the models are solved to account for
exportable and importable prices.
The model traces how the allocation of factors of
production to various cash and food crops depends
on competition along the supply chain and on the
constraints faced by different types of farmers. Farmers
choose how to allocate their resources (land, labor)
to the production of subsistence food for their own
consumption, production of marketable food surplus, or
production of cash crops for exports.6 These activities
offer different prices and entail different production
costs. In equilibrium, because of risk and food security
issues, all farmers produce for their own consumption.
However, depending on farm-gate prices, costs, and other
constraints (such as infrastructure, transport costs, risks),
some farmers specialize in food production altogether,
while others devote some resources to export products.
We develop a game-theory model of supply chains in cash
crop agriculture, where market structure is characterized
by many smallholders and a few exporters. These
exporters buy raw inputs from the farmers and sell them
(perhaps after some processing) in international markets
at given prices. Firms enjoy oligopsony power internally
and set farm-gate prices.
The oligopsony game delivers the equilibrium farm-
gate prices that the firms offer to farmers. In setting
these prices, each exporter takes into account its own
characteristics, the characteristics of other exporters,
and the endogenous responses of the farmers (which
in turn affect food and cash crop production). Once the
equilibrium of the model is found, it is possible to perform
comparative static exercises to study how farm-gate
prices depend on various parameters of the economy,
including the degree of imperfect competition and
competition policies, household costs and constraints,
and so on. In this study, the model is used to study how
changes in border prices from a reduction in the cost of
using the port affect domestic prices for a given level of
market structure, based on key parameters that capture
various household constraints and institutional access.
A 5% reduction in the implicit tax imposed by the port
inefficiencies will increase the price of exportable crops
(Table 1, first half). Farmers producing cotton receive
9.41% more for their cash crop in the current scenario
6 The agricultural household model is based on the well-known models of Barnum and Squire (1979), Singh, Squire and Strauss (1986), de Janvry, Fafchamps, and Sadoulet (1991), Benjamin
(1992), and Taylor and Adelman (2003).
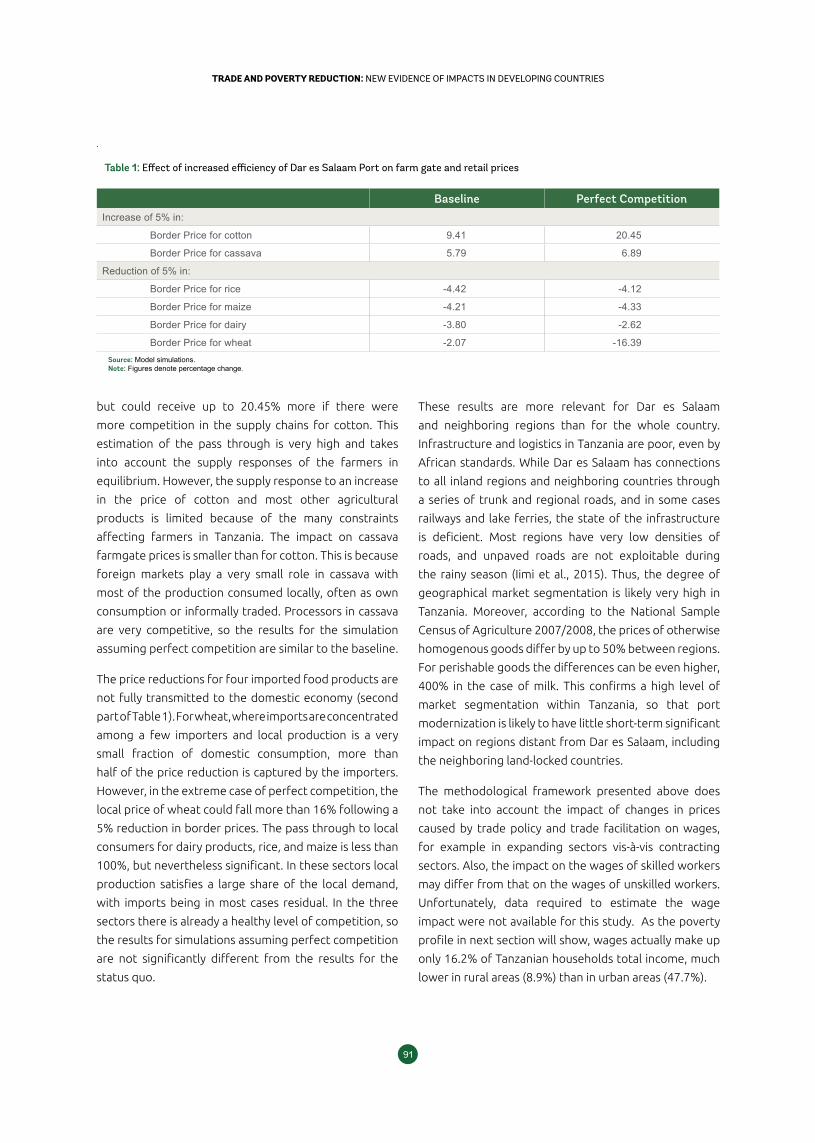
9190
TRADE AND POVERTY REDUCTION: NEW EVIDENCE OF IMPACTS IN DEVELOPING COUNTRIESTRADE AND POVERTY REDUCTION: NEW EVIDENCE OF IMPACTS IN DEVELOPING COUNTRIES
but could receive up to 20.45% more if there were
more competition in the supply chains for cotton. This
estimation of the pass through is very high and takes
into account the supply responses of the farmers in
equilibrium. However, the supply response to an increase
in the price of cotton and most other agricultural
products is limited because of the many constraints
affecting farmers in Tanzania. The impact on cassava
farmgate prices is smaller than for cotton. This is because
foreign markets play a very small role in cassava with
most of the production consumed locally, often as own
consumption or informally traded. Processors in cassava
are very competitive, so the results for the simulation
assuming perfect competition are similar to the baseline.
The price reductions for four imported food products are
not fully transmitted to the domestic economy (second
part of Table 1). For wheat, where imports are concentrated
among a few importers and local production is a very
small fraction of domestic consumption, more than
half of the price reduction is captured by the importers.
However, in the extreme case of perfect competition, the
local price of wheat could fall more than 16% following a
5% reduction in border prices. The pass through to local
consumers for dairy products, rice, and maize is less than
100%, but nevertheless significant. In these sectors local
production satisfies a large share of the local demand,
with imports being in most cases residual. In the three
sectors there is already a healthy level of competition, so
the results for simulations assuming perfect competition
are not significantly different from the results for the
status quo.
These results are more relevant for Dar es Salaam
and neighboring regions than for the whole country.
Infrastructure and logistics in Tanzania are poor, even by
African standards. While Dar es Salaam has connections
to all inland regions and neighboring countries through
a series of trunk and regional roads, and in some cases
railways and lake ferries, the state of the infrastructure
is deficient. Most regions have very low densities of
roads, and unpaved roads are not exploitable during
the rainy season (Iimi et al., 2015). Thus, the degree of
geographical market segmentation is likely very high in
Tanzania. Moreover, according to the National Sample
Census of Agriculture 2007/2008, the prices of otherwise
homogenous goods differ by up to 50% between regions.
For perishable goods the differences can be even higher,
400% in the case of milk. This confirms a high level of
market segmentation within Tanzania, so that port
modernization is likely to have little short-term significant
impact on regions distant from Dar es Salaam, including
the neighboring land-locked countries.
The methodological framework presented above does
not take into account the impact of changes in prices
caused by trade policy and trade facilitation on wages,
for example in expanding sectors vis-à-vis contracting
sectors. Also, the impact on the wages of skilled workers
may differ from that on the wages of unskilled workers.
Unfortunately, data required to estimate the wage
impact were not available for this study. As the poverty
profile in next section will show, wages actually make up
only 16.2% of Tanzanian households total income, much
lower in rural areas (8.9%) than in urban areas (47.7%).
Table 1: Effect of increased efficiency of Dar es Salaam Port on farm gate and retail prices
Baseline Perfect CompetitionIncrease of 5% in:
Border Price for cotton 9.41 20.45
Border Price for cassava 5.79 6.89
Reduction of 5% in:
Border Price for rice -4.42 -4.12
Border Price for maize -4.21 -4.33
Border Price for dairy -3.80 -2.62
Border Price for wheat -2.07 -16.39Source: Model simulations.Note: Figures denote percentage change.
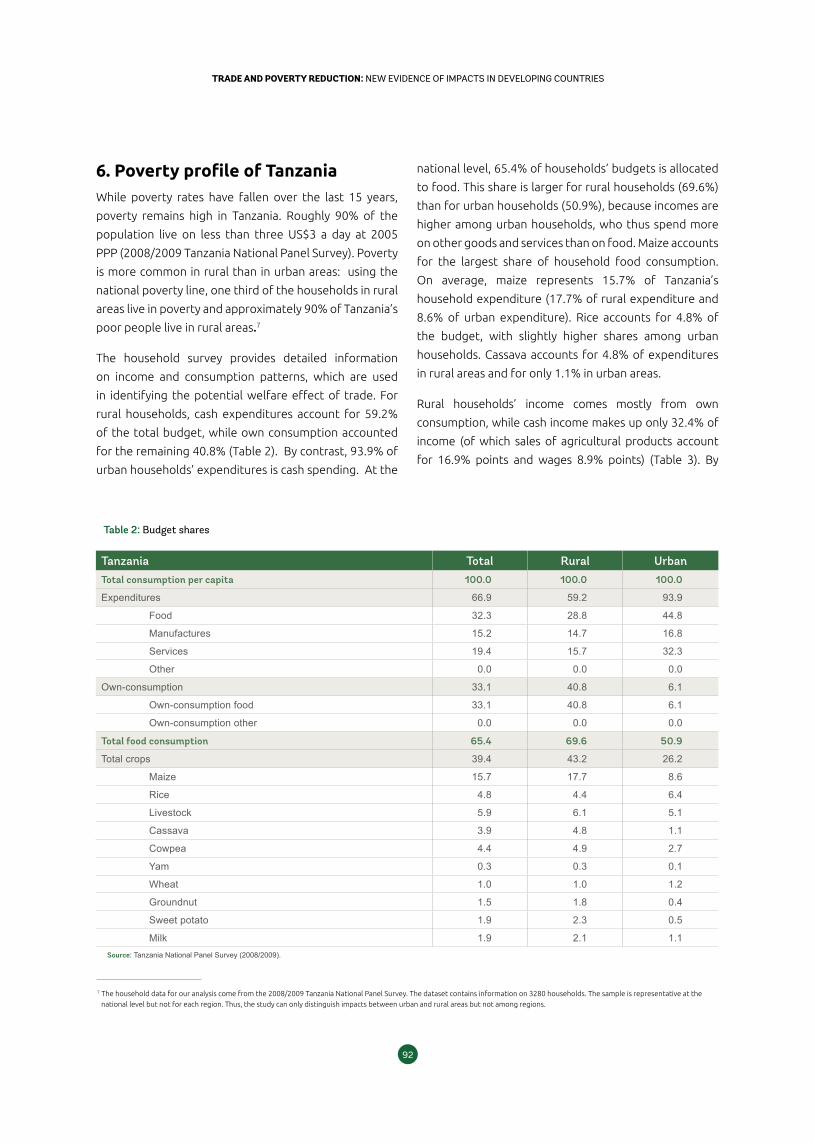
9392
TRADE AND POVERTY REDUCTION: NEW EVIDENCE OF IMPACTS IN DEVELOPING COUNTRIESTRADE AND POVERTY REDUCTION: NEW EVIDENCE OF IMPACTS IN DEVELOPING COUNTRIES
6. Poverty profile of TanzaniaWhile poverty rates have fallen over the last 15 years,
poverty remains high in Tanzania. Roughly 90% of the
population live on less than three US$3 a day at 2005
PPP (2008/2009 Tanzania National Panel Survey). Poverty
is more common in rural than in urban areas: using the
national poverty line, one third of the households in rural
areas live in poverty and approximately 90% of Tanzania’s
poor people live in rural areas.7
The household survey provides detailed information
on income and consumption patterns, which are used
in identifying the potential welfare effect of trade. For
rural households, cash expenditures account for 59.2%
of the total budget, while own consumption accounted
for the remaining 40.8% (Table 2). By contrast, 93.9% of
urban households’ expenditures is cash spending. At the
national level, 65.4% of households’ budgets is allocated
to food. This share is larger for rural households (69.6%)
than for urban households (50.9%), because incomes are
higher among urban households, who thus spend more
on other goods and services than on food. Maize accounts
for the largest share of household food consumption.
On average, maize represents 15.7% of Tanzania’s
household expenditure (17.7% of rural expenditure and
8.6% of urban expenditure). Rice accounts for 4.8% of
the budget, with slightly higher shares among urban
households. Cassava accounts for 4.8% of expenditures
in rural areas and for only 1.1% in urban areas.
Rural households’ income comes mostly from own
consumption, while cash income makes up only 32.4% of
income (of which sales of agricultural products account
for 16.9% points and wages 8.9% points) (Table 3). By
7 The household data for our analysis come from the 2008/2009 Tanzania National Panel Survey. The dataset contains information on 3280 households. The sample is representative at the
national level but not for each region. Thus, the study can only distinguish impacts between urban and rural areas but not among regions.
Table 2: Budget shares
Tanzania Total Rural UrbanTotal consumption per capita 100.0 100.0 100.0
Expenditures 66.9 59.2 93.9
Food 32.3 28.8 44.8
Manufactures 15.2 14.7 16.8
Services 19.4 15.7 32.3
Other 0.0 0.0 0.0
Own-consumption 33.1 40.8 6.1
Own-consumption food 33.1 40.8 6.1
Own-consumption other 0.0 0.0 0.0
Total food consumption 65.4 69.6 50.9
Total crops 39.4 43.2 26.2
Maize 15.7 17.7 8.6
Rice 4.8 4.4 6.4
Livestock 5.9 6.1 5.1
Cassava 3.9 4.8 1.1
Cowpea 4.4 4.9 2.7
Yam 0.3 0.3 0.1
Wheat 1.0 1.0 1.2
Groundnut 1.5 1.8 0.4
Sweet potato 1.9 2.3 0.5
Milk 1.9 2.1 1.1Source: Tanzania National Panel Survey (2008/2009).
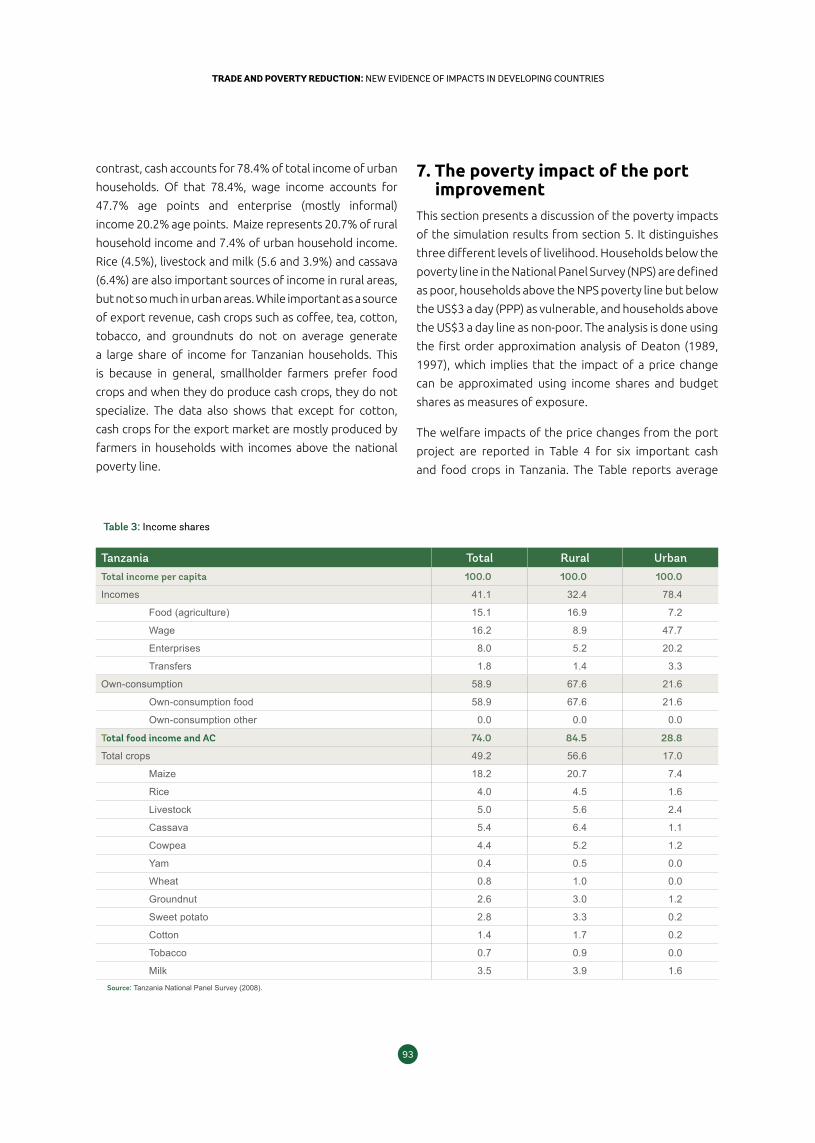
9392
TRADE AND POVERTY REDUCTION: NEW EVIDENCE OF IMPACTS IN DEVELOPING COUNTRIESTRADE AND POVERTY REDUCTION: NEW EVIDENCE OF IMPACTS IN DEVELOPING COUNTRIES
contrast, cash accounts for 78.4% of total income of urban
households. Of that 78.4%, wage income accounts for
47.7% age points and enterprise (mostly informal)
income 20.2% age points. Maize represents 20.7% of rural
household income and 7.4% of urban household income.
Rice (4.5%), livestock and milk (5.6 and 3.9%) and cassava
(6.4%) are also important sources of income in rural areas,
but not so much in urban areas. While important as a source
of export revenue, cash crops such as coffee, tea, cotton,
tobacco, and groundnuts do not on average generate
a large share of income for Tanzanian households. This
is because in general, smallholder farmers prefer food
crops and when they do produce cash crops, they do not
specialize. The data also shows that except for cotton,
cash crops for the export market are mostly produced by
farmers in households with incomes above the national
poverty line.
7. The poverty impact of the port improvement
This section presents a discussion of the poverty impacts
of the simulation results from section 5. It distinguishes
three different levels of livelihood. Households below the
poverty line in the National Panel Survey (NPS) are defined
as poor, households above the NPS poverty line but below
the US$3 a day (PPP) as vulnerable, and households above
the US$3 a day line as non-poor. The analysis is done using
the first order approximation analysis of Deaton (1989,
1997), which implies that the impact of a price change
can be approximated using income shares and budget
shares as measures of exposure.
The welfare impacts of the price changes from the port
project are reported in Table 4 for six important cash
and food crops in Tanzania. The Table reports average
Table 3: Income shares
Tanzania Total Rural UrbanTotal income per capita 100.0 100.0 100.0
Incomes 41.1 32.4 78.4
Food (agriculture) 15.1 16.9 7.2
Wage 16.2 8.9 47.7
Enterprises 8.0 5.2 20.2
Transfers 1.8 1.4 3.3
Own-consumption 58.9 67.6 21.6
Own-consumption food 58.9 67.6 21.6
Own-consumption other 0.0 0.0 0.0
Total food income and AC 74.0 84.5 28.8
Total crops 49.2 56.6 17.0
Maize 18.2 20.7 7.4
Rice 4.0 4.5 1.6
Livestock 5.0 5.6 2.4
Cassava 5.4 6.4 1.1
Cowpea 4.4 5.2 1.2
Yam 0.4 0.5 0.0
Wheat 0.8 1.0 0.0
Groundnut 2.6 3.0 1.2
Sweet potato 2.8 3.3 0.2
Cotton 1.4 1.7 0.2
Tobacco 0.7 0.9 0.0
Milk 3.5 3.9 1.6Source: Tanzania National Panel Survey (2008).
9594
TRADE AND POVERTY REDUCTION: NEW EVIDENCE OF IMPACTS IN DEVELOPING COUNTRIESTRADE AND POVERTY REDUCTION: NEW EVIDENCE OF IMPACTS IN DEVELOPING COUNTRIES
results for the total population, the poor, the vulnerable,
and the non-poor, for rural households and for those
households that are producers of the crop for which the
price changes. The tables show, for each demographic
group, changes in the monetary income, expenditure and
welfare attributed to each crop.
The income effects of price changes as a result of port
modernization vary by commodity. The largest change
in income is generated by the rise in the price of cotton,
as total household income increases by 1.4% and the
income of producer households by 17.1%. One reason
is that raw cotton is only produced and not consumed
directly by households, so affected households can only
benefit from the price rise. By contrast, all income groups
are on average net consumers of rice, maize, cassava,
and wheat, so they will benefit from price reductions
(cheaper imports) and will be hurt by price increases
(more expensive exportable food crops). The opposite
is true for households that are net producers. While on
average households are net consumers of milk, in rural
areas households are net producers.
For most crops, shocks, and affected populations, the
welfare impacts of the simulations are less than 1% of
total household expenditures. The only exception is the
impact on cotton producers. These results are expected,
given the nature of the exercise considered here, and
they are comparable to other results in the literature on
the topic (Lederman and Porto, 2013).
The results also point to the distributional impact of
the port improvements. First, urban households benefit
more than rural households do from cheaper imported
food crops. This is expected, as urban households are
mostly consumers of food while rural households are
both consumers and producers. Moreover, monetary
expenditures on food are typically higher for urban
households, as an important share of the food consumed
in rural areas is home produced, particularly among the
poorest households. While the study does not take into
account explicitly the reduction in cost of containerized
imports, it is likely that this will benefit urban households
more than rural ones, as urban households’ propensity
to consume imported manufactured goods is larger. The
poor and the vulnerable benefit from the decrease in
the prices of maize, rice, dairy and wheat and from the
increase in the price of cotton, and are only hurt by the
increase in the price of cassava. Overall, the poor and
the vulnerable as a whole are likely to benefit from the
improvements in the port. From the simulations it is hard
to predict whether urban or rural poor will benefit most.
However, given the high degree of market segmentation
within Tanzania, it is likely that the poor and vulnerable
households around Dar es Salaam will benefit the most.
Finally, it is not clear whether poor, vulnerable or non-poor
households would benefit more. However, the structure
of Tanzania’s imports and the structure of consumption of
poor and non-poor households suggests that the reform
will favor non-poor or vulnerable households more than
those with incomes below the national poverty line.
Given the high degree of market segmentation within Tanzania, it is likely that the poor and vulnerable households
around Dar es Salaam will benefit the most from port improvements.
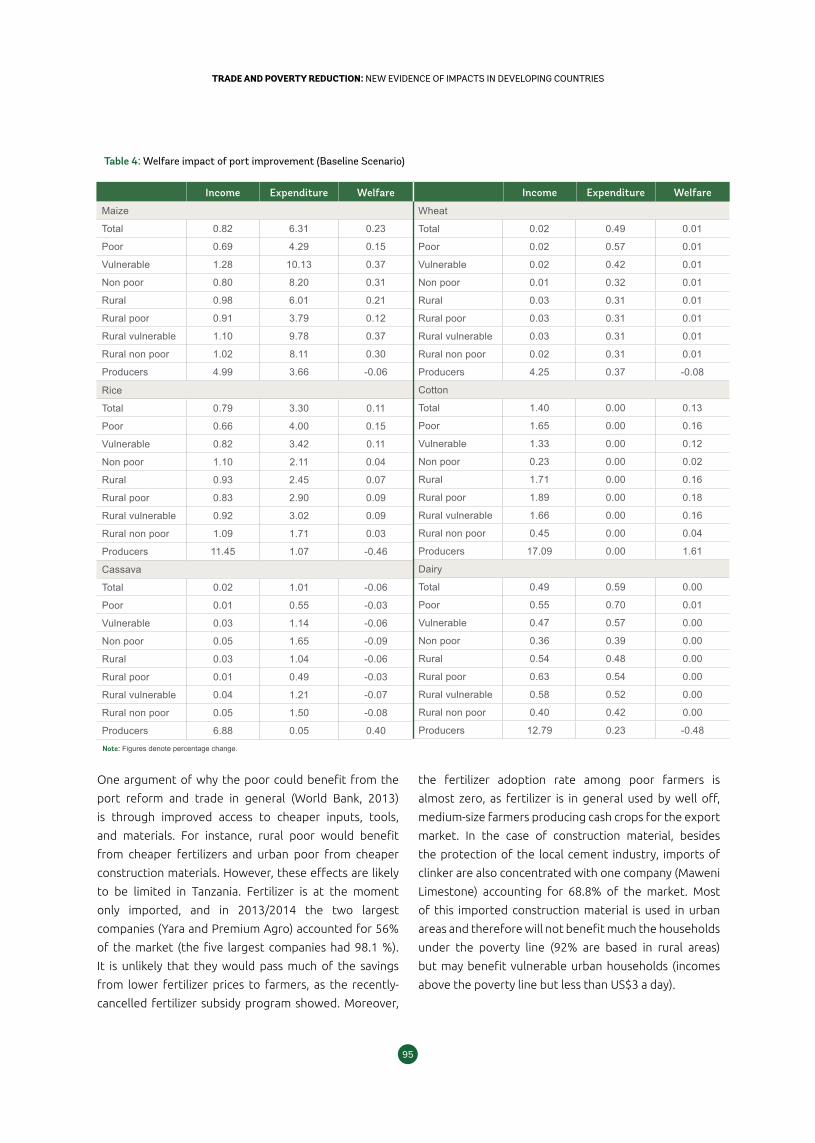
9594
TRADE AND POVERTY REDUCTION: NEW EVIDENCE OF IMPACTS IN DEVELOPING COUNTRIESTRADE AND POVERTY REDUCTION: NEW EVIDENCE OF IMPACTS IN DEVELOPING COUNTRIES
One argument of why the poor could benefit from the
port reform and trade in general (World Bank, 2013)
is through improved access to cheaper inputs, tools,
and materials. For instance, rural poor would benefit
from cheaper fertilizers and urban poor from cheaper
construction materials. However, these effects are likely
to be limited in Tanzania. Fertilizer is at the moment
only imported, and in 2013/2014 the two largest
companies (Yara and Premium Agro) accounted for 56%
of the market (the five largest companies had 98.1 %).
It is unlikely that they would pass much of the savings
from lower fertilizer prices to farmers, as the recently-
cancelled fertilizer subsidy program showed. Moreover,
the fertilizer adoption rate among poor farmers is
almost zero, as fertilizer is in general used by well off,
medium-size farmers producing cash crops for the export
market. In the case of construction material, besides
the protection of the local cement industry, imports of
clinker are also concentrated with one company (Maweni
Limestone) accounting for 68.8% of the market. Most
of this imported construction material is used in urban
areas and therefore will not benefit much the households
under the poverty line (92% are based in rural areas)
but may benefit vulnerable urban households (incomes
above the poverty line but less than US$3 a day).
Note: Figures denote percentage change.
Table 4: Welfare impact of port improvement (Baseline Scenario)
Income Expenditure Welfare
Maize
Total 0.82 6.31 0.23
Poor 0.69 4.29 0.15
Vulnerable 1.28 10.13 0.37
Non poor 0.80 8.20 0.31
Rural 0.98 6.01 0.21
Rural poor 0.91 3.79 0.12
Rural vulnerable 1.10 9.78 0.37
Rural non poor 1.02 8.11 0.30
Producers 4.99 3.66 -0.06
Rice
Total 0.79 3.30 0.11
Poor 0.66 4.00 0.15
Vulnerable 0.82 3.42 0.11
Non poor 1.10 2.11 0.04
Rural 0.93 2.45 0.07
Rural poor 0.83 2.90 0.09
Rural vulnerable 0.92 3.02 0.09
Rural non poor 1.09 1.71 0.03
Producers 11.45 1.07 -0.46
Cassava
Total 0.02 1.01 -0.06
Poor 0.01 0.55 -0.03
Vulnerable 0.03 1.14 -0.06
Non poor 0.05 1.65 -0.09
Rural 0.03 1.04 -0.06
Rural poor 0.01 0.49 -0.03
Rural vulnerable 0.04 1.21 -0.07
Rural non poor 0.05 1.50 -0.08
Producers 6.88 0.05 0.40
Wheat
Total 0.02 0.49 0.01
Poor 0.02 0.57 0.01
Vulnerable 0.02 0.42 0.01
Non poor 0.01 0.32 0.01
Rural 0.03 0.31 0.01
Rural poor 0.03 0.31 0.01
Rural vulnerable 0.03 0.31 0.01
Rural non poor 0.02 0.31 0.01
Producers 4.25 0.37 -0.08
Cotton
Total 1.40 0.00 0.13
Poor 1.65 0.00 0.16
Vulnerable 1.33 0.00 0.12
Non poor 0.23 0.00 0.02
Rural 1.71 0.00 0.16
Rural poor 1.89 0.00 0.18
Rural vulnerable 1.66 0.00 0.16
Rural non poor 0.45 0.00 0.04
Producers 17.09 0.00 1.61
Dairy
Total 0.49 0.59 0.00
Poor 0.55 0.70 0.01
Vulnerable 0.47 0.57 0.00
Non poor 0.36 0.39 0.00
Rural 0.54 0.48 0.00
Rural poor 0.63 0.54 0.00
Rural vulnerable 0.58 0.52 0.00
Rural non poor 0.40 0.42 0.00
Producers 12.79 0.23 -0.48
Income Expenditure Welfare
9796
TRADE AND POVERTY REDUCTION: NEW EVIDENCE OF IMPACTS IN DEVELOPING COUNTRIESTRADE AND POVERTY REDUCTION: NEW EVIDENCE OF IMPACTS IN DEVELOPING COUNTRIES
8. ConclusionsThis contribution assesses the poverty impact of
proposed improvements to the Dar es Salaam Port.
Currently, the port suffers from several infrastructure
and operational deficiencies that increase the cost both
for imported and exported goods. These costs partially
reflect port congestion, where the situation is more
critical for imports than for exports. These inefficiencies
act as an implicit tax on imports and to a lesser extent as a
tax on exports. An improvement in the operations of the
port could reduce border prices up to 5% for bulk cargo.
The simulations of the short-term effect on selected bulk
goods show that the pass through from border prices
to retail and farm gate prices will be less than a 100%,
limiting the potential impact of cheaper imports. This is
due partially to importers’ market power, which enables
them to capture some of the cost saving. The effect of the
port improvement would be geographically concentrated
in Dar es Salaam, as inadequate roads and railways result
in a high level of market segmentation.
The short-term impact on poverty of the port
improvements is positive, albeit small. However, the
reduction in poverty may be accompanied by an increase
in inequality, as non-poor households are expected
to benefit proportionally more than the poor and
vulnerable ones. In the long run, a better functioning
port could more significantly reduce rural poverty and
raise agricultural productivity if complementary policies
and infrastructure improvements (particularly for inland
transport) were adopted to improve access of the poor
to export opportunities and to cheaper imported food,
tools and inputs.
The study does not consider the effect of the port project
on wages. In general, in the short run, increased trade
reduces wages in import-competing sectors and increases
wages in export sectors. The port improvements are
likely to increase imports but have little effect on exports
in the short run. In the long run, cheaper manufactured
imports may negatively affect the development of some
labor-intensive manufactures, and this sector can have
a positive impact on poverty reduction. However, more
work is needed to understand this effect, especially
given the very fast process of urbanization taking place
in Tanzania. Besides the concrete impact on poverty
and inequality, it also would be important to estimate
the efficiency gains from the port improvements, and
develop metrics that allow us to quantify any possible
trade-off between efficiency gains and inequality or
poverty.
Finally, beyond the concrete findings of this study,
it is important to note that international trade has
undoubtedly greatly contributed to the growth
performance of Tanzania in the last ten years. While this
high growth has not translated in drastic reductions in
poverty for many reasons (Atkinson and Lugo, 2010),
trade has contributed to the steady reduction in the
poverty headcount and the poverty gap. The impressive
growth in trade and the inadequate investments to keep
up with this growth are why the port is currently suffering
from severe congestion. Failure to significantly improve
port operations could severely constrain Tanzania’s
exports and imports, jeopardizing one of the engines of
growth and poverty reduction of the country.
9796
TRADE AND POVERTY REDUCTION: NEW EVIDENCE OF IMPACTS IN DEVELOPING COUNTRIESTRADE AND POVERTY REDUCTION: NEW EVIDENCE OF IMPACTS IN DEVELOPING COUNTRIES
Artuc, E., D. Lederman, and G. Porto (2015). “A Mapping of Labor Mobility Costs in the Developing World,” Journal of International Economics 95(1), pp. 28-41.
Artuc, E., and G. Porto (2016). Global Labor Market Frictions and The Dynamics of the Gains from Trade. Work in Progress.
Atkinson, A., and M. Lugo (2010). Growth, poverty and distribution in Tanzania. Working Paper 10/0831. International Growth Centre.
Barnum, H., and L. Squire (1979). “A model of an Agricultural Household. Theory and Evidence,” World Bank Occasional Papers No 27.
Benjamin, D. (1992). “Household Composition, Labor Markets, and Labor Demand: Testing for Separation in Agricultural Household Models,” Econometrica 60, No.2, pp. 287–322.
de Janvry, A., M. Fafchamps, and E. Sadoulet (1991). “Peasant Household Behaviour with Missing Markets: Some Paradoxes Explained,” Economic Journal 101, pp. 1400–1417.
Deaton, A. (1989). Rice Prices and Income Distribution in Thailand: a Non-parametric Analysis. Economic Journal 99 (Supplement), pp. 1-37.
Deaton, A. (1997). The Analysis of Household Surveys - A Microeconometric Approach to Development Policy. Baltimore: Johns Hopkins Press.
Dix-Carneiro, R. (2014). “Trade Liberalization and Labor Market Dynamics,” Econometrics.
Depetris-Chauvin, N., G. Porto, and F. Mulangu (2017). Agricultural Supply Chains, Growth and Poverty in Sub-Saharan Africa: Market Structure, Farm Constraints and Grass-root Institutions. Springer.
Food and Agriculture Organization of the United Nations (2015). FAOSTAT statistics database.
Horn, H. and J. Levinsohn (2001). “Merger Policies and Trade Liberalisation,” Economic Journal 111, pp. 244–277.
Iimi, A., R. Humphreys and S. Melibaeva (2015) Firms? Locational Choice and Infrastructure Development in Tanzania: Instrumental Variable Spatial Autoregressive Model. World Bank Policy Research Working Paper No. 7305.
KPMG/World Bank (2013): “Pulse of the Tanzanian Economy.” Survey.
Lederman, D. and G. Porto (2014). The Price is Not Always Right: On the Impacts of (Commodity) Prices on Households (and Countries). World Bank Policy Research Working Paper No. 6858.
Morisset, J. (2013). Tanzania economic update: opening the gates : how the port of Dar es Salaam can transform Tanzania. Tanzania economic update; issue no. 3. Washington DC ; World Bank.
Porto, G., N. Depetris-Chauvin, and M. Olarreaga (2011). Supply Chains in Export Agriculture, Competition, and Poverty in Sub-Saharan Africa. The World Bank and Centre for Economic Policy Research.
Singh, I., L. Squire, and J. Strauss, eds. (1986). Agricultural Household Models: Extensions, Applications and Policy. Baltimore, Johns Hopkins Press for the World Bank.
Swinnen, J., and A. Vandeplas (2010). “Market Power and Rents in Global Supply Chains,” Agricultural Economics 41, pp. 109–120.
Swinnen, J., and A. Vandeplas (2014). “Price Transmission and Market Power in Modern Agricultural Value Chains,” LICOS Discussion Paper #347/2014.
Tanzania (2012). Population and Housing Census of 2012. National Bureau of Statistics.
Taylor, E. and H. Adelman (2003). “Agricultural Household Models: Genesis, Evolution and Extensions,” Review of Economics of the Household 1(1).
World Bank (2013). Tanzania Economic Update: Opening the Gates - How the Port of Dar es Salaam Can Transform. Tanzania economic update, Issue no. 3. Washington DC. World Bank.
World Bank and World Trade Organization (2015). “The Role of Trade in Ending Poverty”. Washington DC: World Bank.
References
9998
TRADE AND POVERTY REDUCTION: NEW EVIDENCE OF IMPACTS IN DEVELOPING COUNTRIESTRADE AND POVERTY REDUCTION: NEW EVIDENCE OF IMPACTS IN DEVELOPING COUNTRIES
Agricultural Logistics in Lagging Regions:
Evidence from Uganda
1. Introduction
Small scale farmers face many hurdles when
attempting to connect to global markets.
While infrastructure and trade facilitation
improvements are helping to reduce overall
trade costs, the challenges faced by such farmers are
most acute at the local level. Efforts to eradicate poverty
therefore need to start with constraints at the farmgate.
The problems faced are compounded by the general
lack access to proper agricultural inputs, technology and
intermediate services.
However, in the research on market access there has not
been much attention paid to the needs of poor areas
within countries and the constraints faced by small
producers in isolated regions to reach domestic and
international markets. A few studies, such as Raballand et
al. (2010) and Kunaka (2010), applied micro-level analysis
by looking at the relationship between road infrastructure
and road transport and the access of small producers
to markets. The present paper aims to contribute to
this growing knowledge base by exploring measures to
lower costs to market for producers in areas that can
be characterized as lagging.1 It underscores policies and
factors that favor the development of logistic services
and enable small scale producers in remote regions to
improve their access to markets in support of strategies
for inclusive growth, cross-border regional trade in staple
Charles Kunaka, Macroeconomics, Trade and Investment Global Practice, World Bank
1 The approach should be applicable generally to logistics analysis at a sub-national scale in both leading and lagging regions.
foods, and regional cooperation in trade and transport
infrastructure development.
The economies of lagging regions are typically dominated
by trade in agricultural products, which have a high
elasticity to logistics costs. Rural connectivity is defined
as the “degree to which rural dwellers can take advantage
of their access to infrastructure, services, and markets
to pursue economic opportunities” (World Bank, 2014).
It is important to identify options for governments and
the private sector to contribute to reductions in trade
costs, by implementing interventions to broaden access
to logistics services at the sub-national or regional level,
in order to expand the participation of remote regions in
domestic and global supply chains.
Stifel and Minten (2008) claim that the positive
correlation between poverty and isolation is driven by
high transportation costs. In turn, high costs have typically
been linked either to a lack of passable roads and/or lack
of transportation services. Casaburi et al. (2013) find that
improvements to rural roads reduce the market prices of
local crops; the effects are stronger in markets that are
further from major urban centers and in less productive
areas. In addition, Gollin and Rogerson (2010) look at
the link between transport costs and the size of the
quasi-subsistence sector in Uganda and conclude that
the high dispersion of prices across geographic space
reflects underlying transportation costs that prevent any
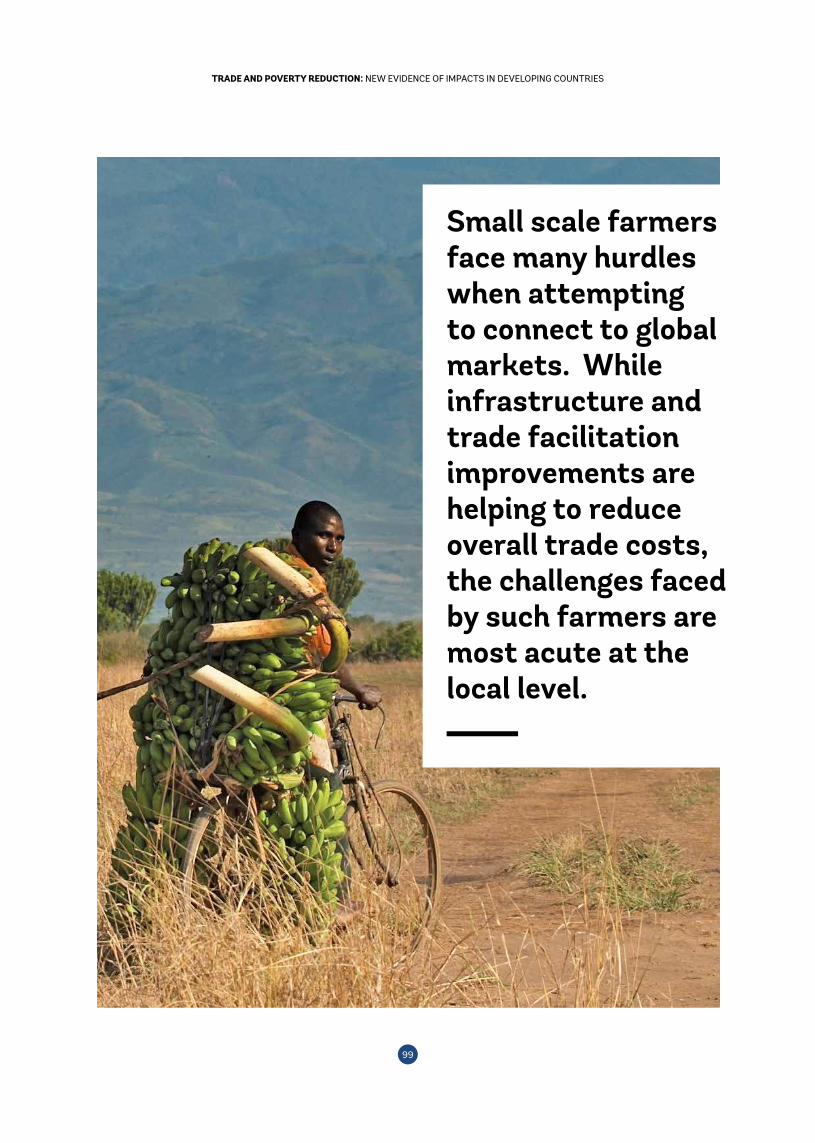
9998
TRADE AND POVERTY REDUCTION: NEW EVIDENCE OF IMPACTS IN DEVELOPING COUNTRIESTRADE AND POVERTY REDUCTION: NEW EVIDENCE OF IMPACTS IN DEVELOPING COUNTRIES
Agricultural Logistics in Lagging Regions:
Evidence from UgandaCharles Kunaka, Macroeconomics, Trade and Investment Global Practice, World Bank
Small scale farmers face many hurdles when attempting to connect to global markets. While infrastructure and trade facilitation improvements are helping to reduce overall trade costs, the challenges faced by such farmers are most acute at the local level.
101100
TRADE AND POVERTY REDUCTION: NEW EVIDENCE OF IMPACTS IN DEVELOPING COUNTRIESTRADE AND POVERTY REDUCTION: NEW EVIDENCE OF IMPACTS IN DEVELOPING COUNTRIES
arbitrage between regions. Also in Uganda, Raballand et
al. (2009) find that after a certain threshold of access to
rural road infrastructure is met, the effects of additional
investments are not only empirically unclear, but also
probably economically unsustainable considering the low
volumes generated by smallholder farming production
systems. Moreover, in order to have affordable road
freight services—where competition is achieved—
consolidation and the use of ICT are probably needed.
Proximity to markets is seemingly a key factor in farming
outcomes. For instance, agricultural production and
proximity to urban markets in Sub-Saharan Africa
are highly correlated (Dorosh, Wang and You, 2008).
Moreover, about 60% of total crop production in Sub-
Saharan Africa, but only about 40% of the population,
is between 2 and 9 hours away from a market. Also, the
adoption of high-input technology, such as modern seeds
and fertilisers, is negatively correlated with travel time to
urban markets.
Minten et al. (2013) find that in Ethiopia transaction and
transportation costs together add between 20% (for
the least remote farmers) and more than 50% (for the
most remote farmers) to the fertilizer prices charged at
the input distribution center. The authors also suggest
that farmers who live about 10 km from the distribution
center face per unit transaction and transportation costs
as large as the costs needed to bring the fertilizer from
the international port to the input distribution center
(about 1,000 km). These effects might partly explain the
low modern input adoption rates in parts of Ethiopia.
Raballand et al. (2009) find that transport of small loads by
truck in Uganda is 10 times more expensive per kilometer
than movement by bicycle or motorcycle. The typical
small-scale farmer in the study produces on average
between 40 kg to 3 tons of agricultural goods per year
and thus are able to transport their product mainly by
bicycle or motorcycle. Transport by truck only becomes
profitable for loads of at least 500 kg of product per trip
that are transported no fewer than 50 km (DFID, 2005).
At the current production levels, a consolidation center
(warehouse) would be needed to collect the production
of at least 600 farmers.
Earlier work by Kunaka (2010), Raballand et al. (2010) and
Farole (2013) point to the importance of consolidating
volumes to reducing unit logistics costs in lagging regions,
which would extend the distances farmers are able to
trade. Typically, costs are highest at the local level (first
mile), as that is where volumes are smallest and costs
per unit highest. As such, supply chains in thin markets
tend to have a cascading pattern of consolidation and
value addition to reduce the ratio of costs to volume
and cost to value. Consequently, products pass through
several logistics nodes, which can add to costs and transit
times, as well as affect overall system reliability. Analysis
of logistics services therefore should consider: (i) the
location and availability of core logistics infrastructure
such as transport, handling and storage facilities that
influence the direction and concentration of trade flows;
(ii) the availability and cost of services linking different
points of production to domestic, regional and global
markets; and (iii) the interactions between logistics
players who intermediate the physical movement of
products.
Based on the evidence, it can be argued that the
performance of logistics systems in lagging regions is a
function of the interaction of different systems, rooted
in various types of networks: physical, social, financial,
and information, among others. However, there is
great coincidence in the social, financial and information
networks such that they can be conveniently combined
into one sub-system of supply chain organization. So,
ultimately, we can view the system as comprised of two
main models: one that represents the physical movement
of goods through physical networks defined by physical
transport and logistics infrastructure and a second one
that represents the relationships between shippers,
logistics actors, processors and exporters of goods. This
paper aims to explore the interactions between the two
and propose measures that may be taken to reduce the
isolation from markets of farmers in lagging regions.
2. Organization of agricultural supply chains in thin markets
To properly account for the distribution of rents in
agricultural supply chains in lagging regions, it is
important to identify the main actors in the chains (Figure
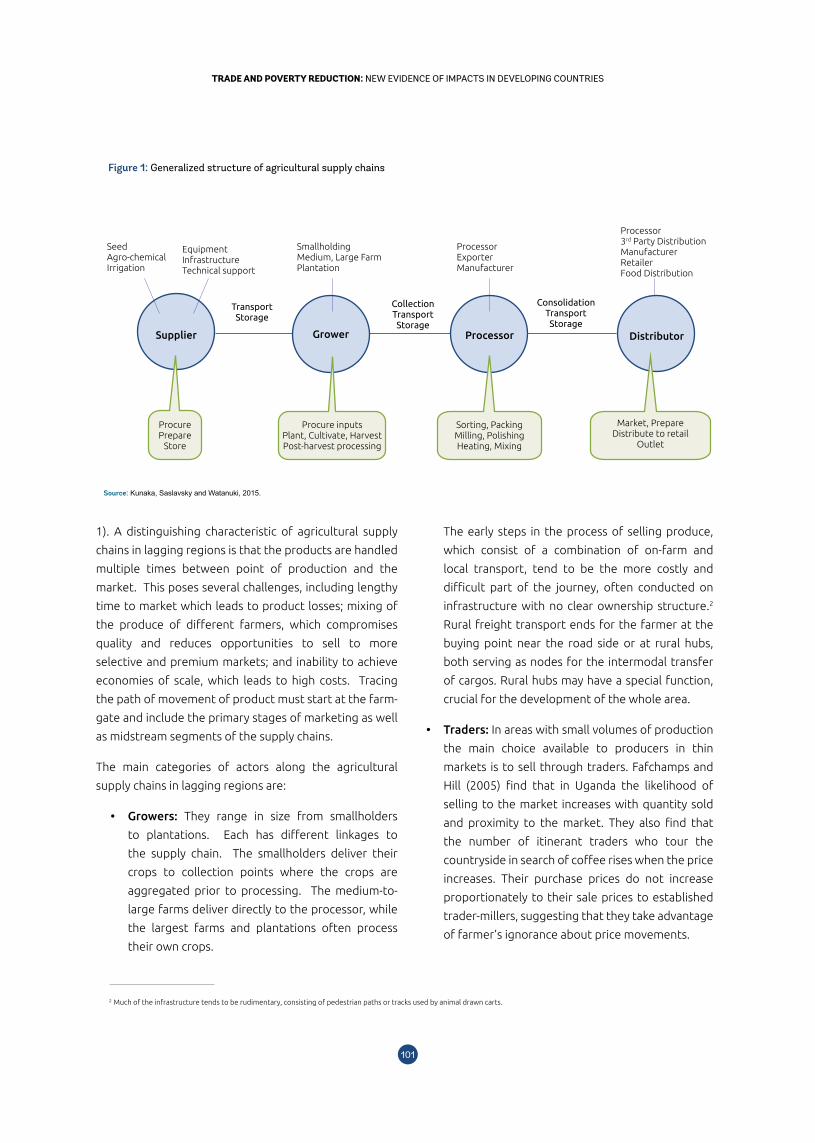
101100
TRADE AND POVERTY REDUCTION: NEW EVIDENCE OF IMPACTS IN DEVELOPING COUNTRIESTRADE AND POVERTY REDUCTION: NEW EVIDENCE OF IMPACTS IN DEVELOPING COUNTRIES
1). A distinguishing characteristic of agricultural supply
chains in lagging regions is that the products are handled
multiple times between point of production and the
market. This poses several challenges, including lengthy
time to market which leads to product losses; mixing of
the produce of different farmers, which compromises
quality and reduces opportunities to sell to more
selective and premium markets; and inability to achieve
economies of scale, which leads to high costs. Tracing
the path of movement of product must start at the farm-
gate and include the primary stages of marketing as well
as midstream segments of the supply chains.
The main categories of actors along the agricultural
supply chains in lagging regions are:
• Growers: They range in size from smallholders
to plantations. Each has different linkages to
the supply chain. The smallholders deliver their
crops to collection points where the crops are
aggregated prior to processing. The medium-to-
large farms deliver directly to the processor, while
the largest farms and plantations often process
their own crops.
Figure 1: Generalized structure of agricultural supply chains
The early steps in the process of selling produce,
which consist of a combination of on-farm and
local transport, tend to be the more costly and
difficult part of the journey, often conducted on
infrastructure with no clear ownership structure.2
Rural freight transport ends for the farmer at the
buying point near the road side or at rural hubs,
both serving as nodes for the intermodal transfer
of cargos. Rural hubs may have a special function,
crucial for the development of the whole area.
• Traders: In areas with small volumes of production
the main choice available to producers in thin
markets is to sell through traders. Fafchamps and
Hill (2005) find that in Uganda the likelihood of
selling to the market increases with quantity sold
and proximity to the market. They also find that
the number of itinerant traders who tour the
countryside in search of coffee rises when the price
increases. Their purchase prices do not increase
proportionately to their sale prices to established
trader-millers, suggesting that they take advantage
of farmer’s ignorance about price movements.
2 Much of the infrastructure tends to be rudimentary, consisting of pedestrian paths or tracks used by animal drawn carts.
Source: Kunaka, Saslavsky and Watanuki, 2015.
Procure inputsPlant, Cultivate, HarvestPost-harvest processing
Market, PrepareDistribute to retailOutlet
Seed Agro-chemicalIrrigation
EquipmentInfrastructureTechnical support
SmallholdingMedium, Large FarmPlantation
ProcessorExporterManufacturer
Processor3rd Party DistributionManufacturerRetailerFood Distribution
ProcurePrepare
Store
Sorting, PackingMilling, PolishingHeating, Mixing
TransportStorage
ConsolidationTransportStorage
CollectionTransportStorage
ProcessorSupplier Grower Distributor
Procure inputs Plant, Cultivate, HarvestPost-harvest processing
Market, PrepareDistribute to retail
Outlet
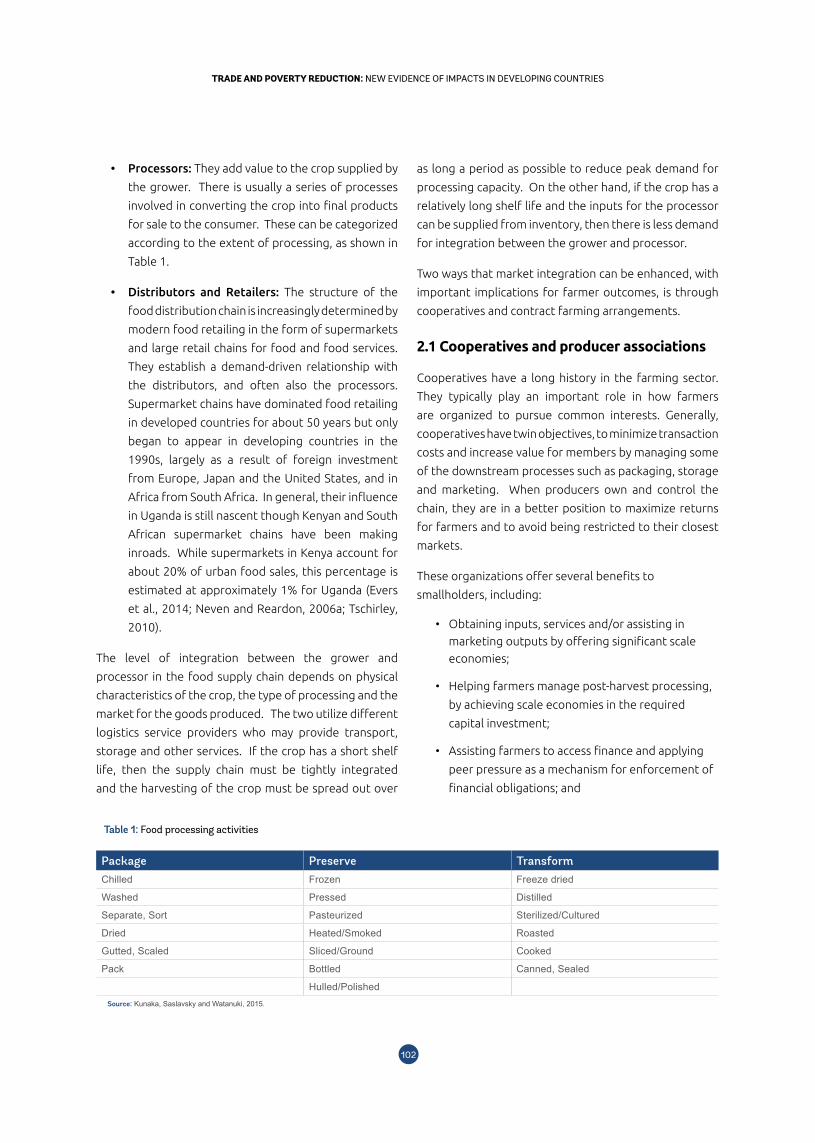
103102
TRADE AND POVERTY REDUCTION: NEW EVIDENCE OF IMPACTS IN DEVELOPING COUNTRIESTRADE AND POVERTY REDUCTION: NEW EVIDENCE OF IMPACTS IN DEVELOPING COUNTRIES
Table 1: Food processing activities
Package Preserve TransformChilled Frozen Freeze dried
Washed Pressed Distilled
Separate, Sort Pasteurized Sterilized/Cultured
Dried Heated/Smoked Roasted
Gutted, Scaled Sliced/Ground Cooked
Pack Bottled Canned, Sealed
Hulled/PolishedSource: Kunaka, Saslavsky and Watanuki, 2015.
• Processors: They add value to the crop supplied by
the grower. There is usually a series of processes
involved in converting the crop into final products
for sale to the consumer. These can be categorized
according to the extent of processing, as shown in
Table 1.
• Distributors and Retailers: The structure of the
food distribution chain is increasingly determined by
modern food retailing in the form of supermarkets
and large retail chains for food and food services.
They establish a demand-driven relationship with
the distributors, and often also the processors.
Supermarket chains have dominated food retailing
in developed countries for about 50 years but only
began to appear in developing countries in the
1990s, largely as a result of foreign investment
from Europe, Japan and the United States, and in
Africa from South Africa. In general, their influence
in Uganda is still nascent though Kenyan and South
African supermarket chains have been making
inroads. While supermarkets in Kenya account for
about 20% of urban food sales, this percentage is
estimated at approximately 1% for Uganda (Evers
et al., 2014; Neven and Reardon, 2006a; Tschirley,
2010).
The level of integration between the grower and
processor in the food supply chain depends on physical
characteristics of the crop, the type of processing and the
market for the goods produced. The two utilize different
logistics service providers who may provide transport,
storage and other services. If the crop has a short shelf
life, then the supply chain must be tightly integrated
and the harvesting of the crop must be spread out over
as long a period as possible to reduce peak demand for
processing capacity. On the other hand, if the crop has a
relatively long shelf life and the inputs for the processor
can be supplied from inventory, then there is less demand
for integration between the grower and processor.
Two ways that market integration can be enhanced, with
important implications for farmer outcomes, is through
cooperatives and contract farming arrangements.
2.1 Cooperatives and producer associations
Cooperatives have a long history in the farming sector.
They typically play an important role in how farmers
are organized to pursue common interests. Generally,
cooperatives have twin objectives, to minimize transaction
costs and increase value for members by managing some
of the downstream processes such as packaging, storage
and marketing. When producers own and control the
chain, they are in a better position to maximize returns
for farmers and to avoid being restricted to their closest
markets.
These organizations offer several benefits to
smallholders, including:
• Obtaining inputs, services and/or assisting in
marketing outputs by offering significant scale
economies;
• Helping farmers manage post-harvest processing,
by achieving scale economies in the required
capital investment;
• Assisting farmers to access finance and applying
peer pressure as a mechanism for enforcement of
financial obligations; and
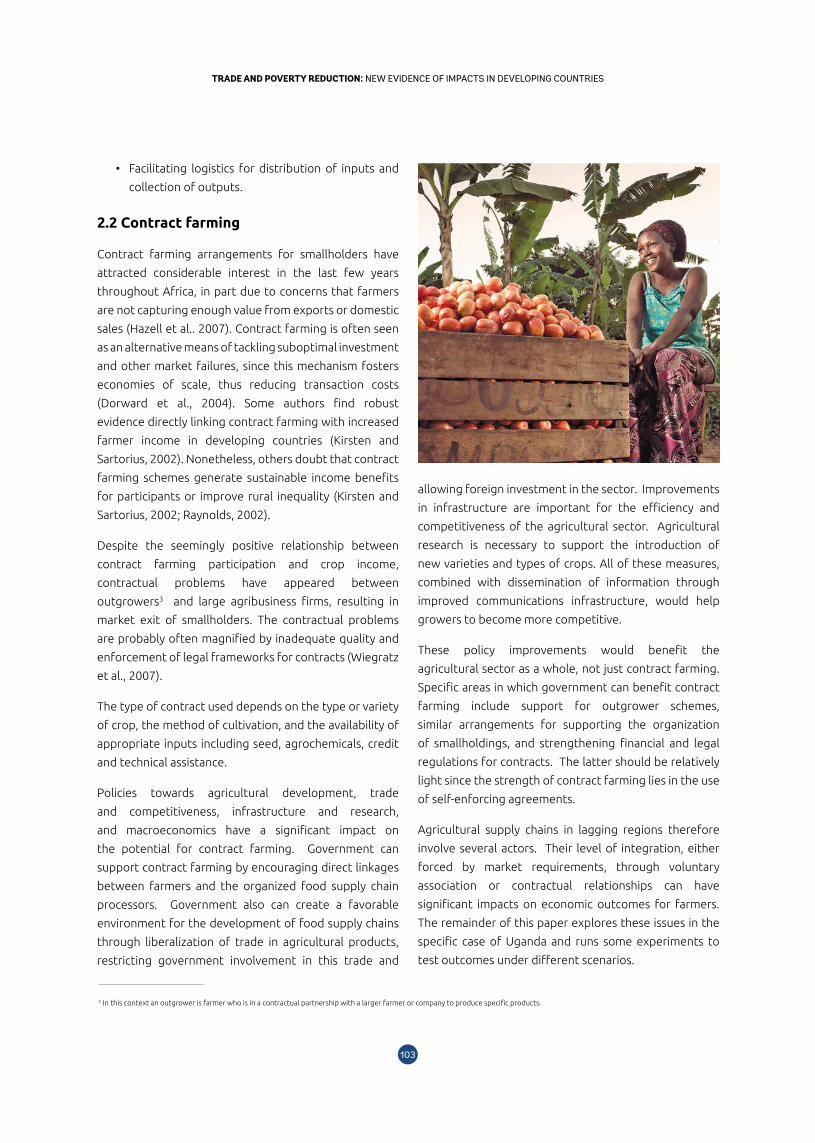
103102
TRADE AND POVERTY REDUCTION: NEW EVIDENCE OF IMPACTS IN DEVELOPING COUNTRIESTRADE AND POVERTY REDUCTION: NEW EVIDENCE OF IMPACTS IN DEVELOPING COUNTRIES
• Facilitating logistics for distribution of inputs and
collection of outputs.
2.2 Contract farming
Contract farming arrangements for smallholders have
attracted considerable interest in the last few years
throughout Africa, in part due to concerns that farmers
are not capturing enough value from exports or domestic
sales (Hazell et al.. 2007). Contract farming is often seen
as an alternative means of tackling suboptimal investment
and other market failures, since this mechanism fosters
economies of scale, thus reducing transaction costs
(Dorward et al., 2004). Some authors find robust
evidence directly linking contract farming with increased
farmer income in developing countries (Kirsten and
Sartorius, 2002). Nonetheless, others doubt that contract
farming schemes generate sustainable income benefits
for participants or improve rural inequality (Kirsten and
Sartorius, 2002; Raynolds, 2002).
Despite the seemingly positive relationship between
contract farming participation and crop income,
contractual problems have appeared between
outgrowers3 and large agribusiness firms, resulting in
market exit of smallholders. The contractual problems
are probably often magnified by inadequate quality and
enforcement of legal frameworks for contracts (Wiegratz
et al., 2007).
The type of contract used depends on the type or variety
of crop, the method of cultivation, and the availability of
appropriate inputs including seed, agrochemicals, credit
and technical assistance.
Policies towards agricultural development, trade
and competitiveness, infrastructure and research,
and macroeconomics have a significant impact on
the potential for contract farming. Government can
support contract farming by encouraging direct linkages
between farmers and the organized food supply chain
processors. Government also can create a favorable
environment for the development of food supply chains
through liberalization of trade in agricultural products,
restricting government involvement in this trade and
allowing foreign investment in the sector. Improvements
in infrastructure are important for the efficiency and
competitiveness of the agricultural sector. Agricultural
research is necessary to support the introduction of
new varieties and types of crops. All of these measures,
combined with dissemination of information through
improved communications infrastructure, would help
growers to become more competitive.
These policy improvements would benefit the
agricultural sector as a whole, not just contract farming.
Specific areas in which government can benefit contract
farming include support for outgrower schemes,
similar arrangements for supporting the organization
of smallholdings, and strengthening financial and legal
regulations for contracts. The latter should be relatively
light since the strength of contract farming lies in the use
of self-enforcing agreements.
Agricultural supply chains in lagging regions therefore
involve several actors. Their level of integration, either
forced by market requirements, through voluntary
association or contractual relationships can have
significant impacts on economic outcomes for farmers.
The remainder of this paper explores these issues in the
specific case of Uganda and runs some experiments to
test outcomes under different scenarios.
3 In this context an outgrower is farmer who is in a contractual partnership with a larger farmer or company to produce specific products.
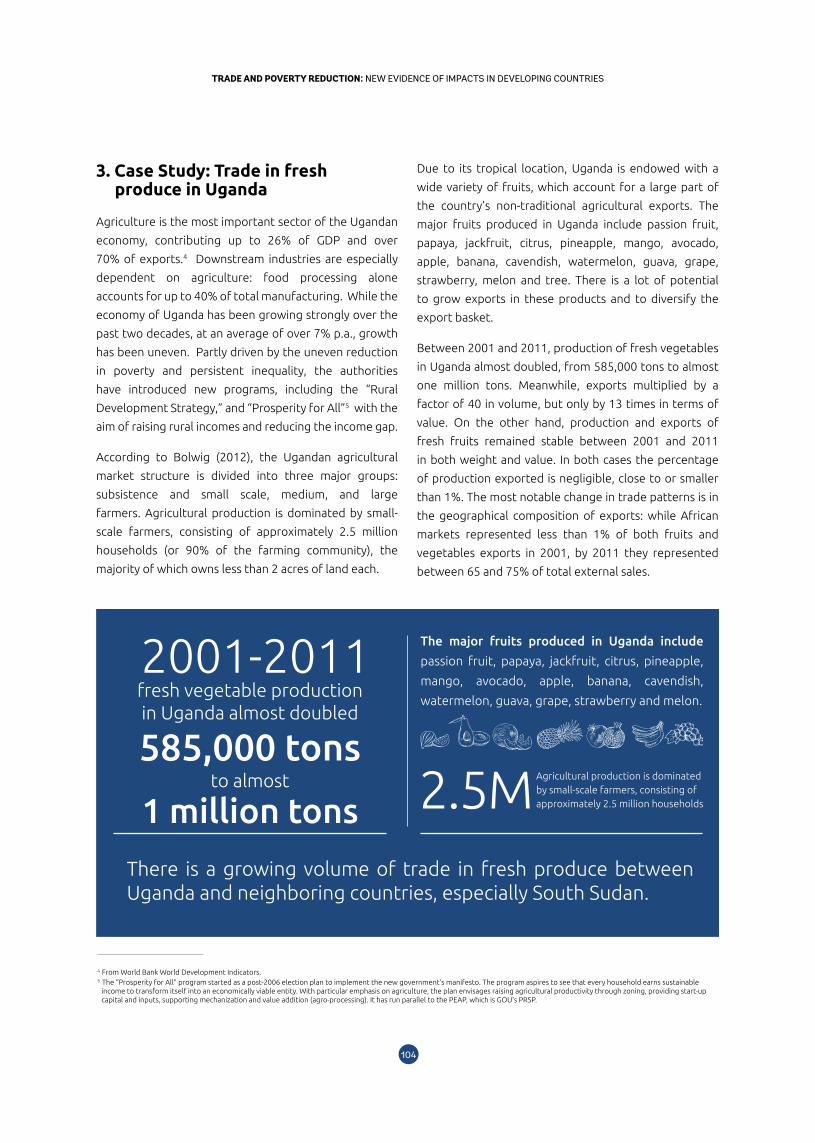
105104
TRADE AND POVERTY REDUCTION: NEW EVIDENCE OF IMPACTS IN DEVELOPING COUNTRIESTRADE AND POVERTY REDUCTION: NEW EVIDENCE OF IMPACTS IN DEVELOPING COUNTRIES
3. Case Study: Trade in fresh produce in Uganda
Agriculture is the most important sector of the Ugandan
economy, contributing up to 26% of GDP and over
70% of exports.4 Downstream industries are especially
dependent on agriculture: food processing alone
accounts for up to 40% of total manufacturing. While the
economy of Uganda has been growing strongly over the
past two decades, at an average of over 7% p.a., growth
has been uneven. Partly driven by the uneven reduction
in poverty and persistent inequality, the authorities
have introduced new programs, including the “Rural
Development Strategy,” and “Prosperity for All”5 with the
aim of raising rural incomes and reducing the income gap.
According to Bolwig (2012), the Ugandan agricultural
market structure is divided into three major groups:
subsistence and small scale, medium, and large
farmers. Agricultural production is dominated by small-
scale farmers, consisting of approximately 2.5 million
households (or 90% of the farming community), the
majority of which owns less than 2 acres of land each.
Due to its tropical location, Uganda is endowed with a
wide variety of fruits, which account for a large part of
the country’s non-traditional agricultural exports. The
major fruits produced in Uganda include passion fruit,
papaya, jackfruit, citrus, pineapple, mango, avocado,
apple, banana, cavendish, watermelon, guava, grape,
strawberry, melon and tree. There is a lot of potential
to grow exports in these products and to diversify the
export basket.
Between 2001 and 2011, production of fresh vegetables
in Uganda almost doubled, from 585,000 tons to almost
one million tons. Meanwhile, exports multiplied by a
factor of 40 in volume, but only by 13 times in terms of
value. On the other hand, production and exports of
fresh fruits remained stable between 2001 and 2011
in both weight and value. In both cases the percentage
of production exported is negligible, close to or smaller
than 1%. The most notable change in trade patterns is in
the geographical composition of exports: while African
markets represented less than 1% of both fruits and
vegetables exports in 2001, by 2011 they represented
between 65 and 75% of total external sales.
4 From World Bank World Development Indicators.5 The “Prosperity for All” program started as a post-2006 election plan to implement the new government’s manifesto. The program aspires to see that every household earns sustainable
income to transform itself into an economically viable entity. With particular emphasis on agriculture, the plan envisages raising agricultural productivity through zoning, providing start-up capital and inputs, supporting mechanization and value addition (agro-processing). It has run parallel to the PEAP, which is GOU’s PRSP.
2001-2011 fresh vegetable production in Uganda almost doubled
585,000 tons
to almost
1 million tons 2.5M Agricultural production is dominated by small-scale farmers, consisting of approximately 2.5 million households
The major fruits produced in Uganda include
passion fruit, papaya, jackfruit, citrus, pineapple,
mango, avocado, apple, banana, cavendish,
watermelon, guava, grape, strawberry and melon.
There is a growing volume of trade in fresh produce between Uganda and neighboring countries, especially South Sudan.
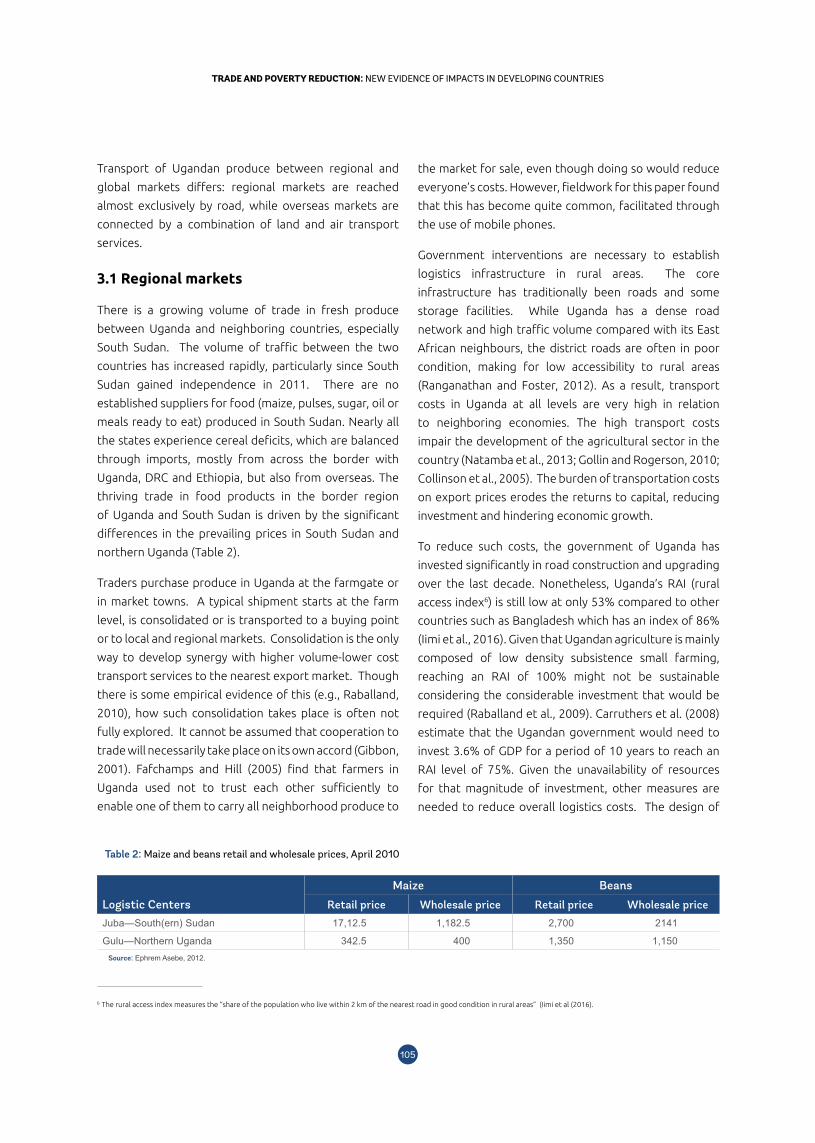
105104
TRADE AND POVERTY REDUCTION: NEW EVIDENCE OF IMPACTS IN DEVELOPING COUNTRIESTRADE AND POVERTY REDUCTION: NEW EVIDENCE OF IMPACTS IN DEVELOPING COUNTRIES
Transport of Ugandan produce between regional and
global markets differs: regional markets are reached
almost exclusively by road, while overseas markets are
connected by a combination of land and air transport
services.
3.1 Regional markets
There is a growing volume of trade in fresh produce
between Uganda and neighboring countries, especially
South Sudan. The volume of traffic between the two
countries has increased rapidly, particularly since South
Sudan gained independence in 2011. There are no
established suppliers for food (maize, pulses, sugar, oil or
meals ready to eat) produced in South Sudan. Nearly all
the states experience cereal deficits, which are balanced
through imports, mostly from across the border with
Uganda, DRC and Ethiopia, but also from overseas. The
thriving trade in food products in the border region
of Uganda and South Sudan is driven by the significant
differences in the prevailing prices in South Sudan and
northern Uganda (Table 2).
Traders purchase produce in Uganda at the farmgate or
in market towns. A typical shipment starts at the farm
level, is consolidated or is transported to a buying point
or to local and regional markets. Consolidation is the only
way to develop synergy with higher volume-lower cost
transport services to the nearest export market. Though
there is some empirical evidence of this (e.g., Raballand,
2010), how such consolidation takes place is often not
fully explored. It cannot be assumed that cooperation to
trade will necessarily take place on its own accord (Gibbon,
2001). Fafchamps and Hill (2005) find that farmers in
Uganda used not to trust each other sufficiently to
enable one of them to carry all neighborhood produce to
the market for sale, even though doing so would reduce
everyone’s costs. However, fieldwork for this paper found
that this has become quite common, facilitated through
the use of mobile phones.
Government interventions are necessary to establish
logistics infrastructure in rural areas. The core
infrastructure has traditionally been roads and some
storage facilities. While Uganda has a dense road
network and high traffic volume compared with its East
African neighbours, the district roads are often in poor
condition, making for low accessibility to rural areas
(Ranganathan and Foster, 2012). As a result, transport
costs in Uganda at all levels are very high in relation
to neighboring economies. The high transport costs
impair the development of the agricultural sector in the
country (Natamba et al., 2013; Gollin and Rogerson, 2010;
Collinson et al., 2005). The burden of transportation costs
on export prices erodes the returns to capital, reducing
investment and hindering economic growth.
To reduce such costs, the government of Uganda has
invested significantly in road construction and upgrading
over the last decade. Nonetheless, Uganda’s RAI (rural
access index6) is still low at only 53% compared to other
countries such as Bangladesh which has an index of 86%
(Iimi et al., 2016). Given that Ugandan agriculture is mainly
composed of low density subsistence small farming,
reaching an RAI of 100% might not be sustainable
considering the considerable investment that would be
required (Raballand et al., 2009). Carruthers et al. (2008)
estimate that the Ugandan government would need to
invest 3.6% of GDP for a period of 10 years to reach an
RAI level of 75%. Given the unavailability of resources
for that magnitude of investment, other measures are
needed to reduce overall logistics costs. The design of
6 The rural access index measures the “share of the population who live within 2 km of the nearest road in good condition in rural areas” (Iimi et al (2016).
Table 2: Maize and beans retail and wholesale prices, April 2010
Logistic Centers
Maize Beans
Retail price Wholesale price Retail price Wholesale price
Juba—South(ern) Sudan 17,12.5 1,182.5 2,700 2141
Gulu—Northern Uganda 342.5 400 1,350 1,150Source: Ephrem Asebe, 2012.
107106
TRADE AND POVERTY REDUCTION: NEW EVIDENCE OF IMPACTS IN DEVELOPING COUNTRIESTRADE AND POVERTY REDUCTION: NEW EVIDENCE OF IMPACTS IN DEVELOPING COUNTRIES
such measures should take into account how farmers
actually reach domestic and regional markets.
In addition to roads, there is an important nexus
between transport and storage infrastructure which is
often ignored in rural projects. The location of storage
facilities, which serve also as consolidation points, is
critical in enabling small scale producers to connect to
regional and global supply chains. As argued above,
a certain level of infrastructure development is often
necessary to provide the foundation for improvements
in the quality of logistics services. When storage is not
available, produce must be harvested a few hours before
it is taken to market, which limits the distance the produce
can be transported and its shelf life. Storage facilities in
Uganda are typically provided by the private sector, but in
a patchy manner.
Grabowksi (1999) emphasizes that without an external
coordination mechanism to bring buyers and sellers
together, farmers may lack the assurance required to
undertake production while customers may be unable to
find suppliers. In this regard, technological innovations
are rapidly transforming marketing practices across East
Africa, including in Uganda. Electronic intermediation
through ubiquitous coverage by mobile telephony in
particular has disrupted rural marketing and led to
virtual integration of supply chains. One of the impacts
has been though improved price discovery. Farmers
and traders often have imperfect or no knowledge of
prevailing market conditions, which may result in them
delivering produce when conditions are not conducive to
high returns. As the products are often bulky and of low
value the farmers can suffer significant losses. Mobile
phones enable farmers to check prices and general
market conditions before deciding when to sell their
produce thereby reducing their exposure to risk of losses.
However, while the use of IT in agro-markets is widespread
in Uganda, the impact on logistics costs is not clear. Each
farmer is put in a position where they can decide which
market to access or when to take their product to the
market. If this is done without coordinating with other
farmers then individual costs can be high, as shipment
volumes will be small resulting in high unit costs. It is in this
context that the World Bank (2012) found ICT effective
in reducing transport and logistics costs with just-in-time
information on consolidation and market trends.
Ready access to information has three primary effects on
producers:
• It reduces information asymmetry and enhances
farmers’ ability to negotiate higher prices, even with
market intermediaries.
• Farmers can decide to delay selling their produce
until market conditions improve, although storage
costs can be high if the right facilities are not
available.
• Farmers can switch to alternative markets, if they
have the necessary transport and are able to change
their destination market.
In addition to facilitating information flows, ICT has
contributed to agricultural efficiency through the
proliferation of payment systems based on mobile
phones. There are a large number of developing and
developed countries that now have such systems in place.
Kunaka (2010) finds also that ICT helps manage payment
processes in lagging regions by enabling all players to
be prepared for market transactions. Otherwise some
studies (e.g., Gong et al., 2007) find that farmers who sell
directly to market without advance information can suffer
payment delays unless they sell to an intermediary but at
a lower price. East Africa has several successful mobile
payment systems, which emulate the first successful7
branchless banking platform, M-Pesa, introduced in
Kenya in 2007.8 These systems make it easier and faster
for farmers to receive payment without having to travel
long distances.
Connectivity to regional markets by small scale farmers
in Uganda utilizes elements of all of the above. Farmers
either sell produce to traders who take products into
neighboring markets or they get together and organize a
7 Morawczynski and Pickens (2009) says that in August 2009 M-Pesa had 7 million customers transferring 150 million KSh (US$2 million) a day in small transactions averaging about 1,500 KSh (US$20). The system had handled over 130 billion KSh (US$1.7 billion) since 2007.
8 It was initially launched in 2003 to allow borrowers to re-pay loans with airtime using the network of Safaricom airtime resellers. Mobile phone customers put it to various other users, and it was re-launched as a branchless bank service with limits on transactions and credit holdings. The second launch was supported by DFID and Vodaphone (40% shareholder of Safaricom) and the telecom consultancy firm Sagentia.
107106
TRADE AND POVERTY REDUCTION: NEW EVIDENCE OF IMPACTS IN DEVELOPING COUNTRIESTRADE AND POVERTY REDUCTION: NEW EVIDENCE OF IMPACTS IN DEVELOPING COUNTRIES
truck to ferry fresh produce of several farmers to markets
in neighboring countries. Only a few farmers travel, while
the rest keep track of sales and prices through mobile
telephony. The regional markets, especially South
Sudan and the eastern part of the Democratic Republic
of Congo, hold great potential for increased trade from
Uganda. They also have the advantage, compared to
markets in the Middle East or Europe, in that they do not
impose strict standards on product quality and handling.
As argued below, strict product standards either increase
costs for farmers or can exclude small scale farmers
completely from some markets should they be unable to
comply with the set standards.
3.2 Overseas markets
Due to its landlocked nature and long distances to
overseas markets, air transport is important for global
connectivity of Uganda producers. In fact, the fresh
produce sector in Uganda is concentrated within 40 km
of Entebbe Airport. Proximity to the airport is quite
important to defining a zone of production of perishables
like flowers, fresh fruits and vegetables, which tend to
have a short shelf life. In 2013, fresh produce was the
third largest export by air in Uganda (22% of export
tonnage), after fish (46%) and flowers (26%). However,
the volume of production is generally not sufficient to
support the regular supply of airlift capacity. In general,
for exports, cargo is nearly equally distributed between
passenger and freighter flights. Still, the belly freight
is less than the worldwide average of 70%. To support
the market some private cargo handlers have developed
facilities at the airport for the temporary storage of the
produce of many farmers and to enable the airlines to
then cater to this market. The airlines provide a cut-off
time of a few hours before a flight for all produce to be
delivered and processed ready for export. This enables
farmers to plan the ideal moments to harvest produce
and deliver it while it is still fresh.
Most of the flights carrying freight out of Entebbe airport
are destined for the Middle East or Europe. Nearly 75%
of air exports leave on flights to these two regions. A
significant proportion of the cargo on flights to the
Middle East is transferred to flights to other destinations,
Europe among them. In fact, Europe is the largest
market for Uganda’s exports by air. About 19% of the
cargo is transported to African airports, where Southern
Africa captures a larger share than does the East African
Community (EAC). Within East Africa, some freight can
be transported by road instead of air transport.
The distribution of Uganda produce in the overseas
markets, particularly in the Middle East, is usually through
supermarkets. As mentioned above, supermarkets
increasingly play an oversized role in the marketing of
produce in both the East Africa region and internationally.
However, the supermarkets have strict requirements in
terms of packaging, quality and other standards as well
as the traceability of products. Compliance with these
requirements often has to start at the farms in countries
like Uganda, through some central processing facilities
where the produce is washed, weighed, bagged and
tagged. As a result, the ability of producers in Uganda
to meet the pressures from supermarkets and to comply
with global standards is influenced in part by, and in turn
is affecting, the topology of fresh fruit and vegetable
supply chains. Whereas in the past the produce of
different farmers might have been mixed in the same
packaging, there is increasing pressure to keep separate
the produce from different farmers so that it can be easily
identified. This can work contrary to the requirements to
reduce unit costs of accessing some of the markets.
In 2013, fresh produce was the third largest export by air in Uganda (22% of export tonnage), after fish (46%) and flowers(26%).
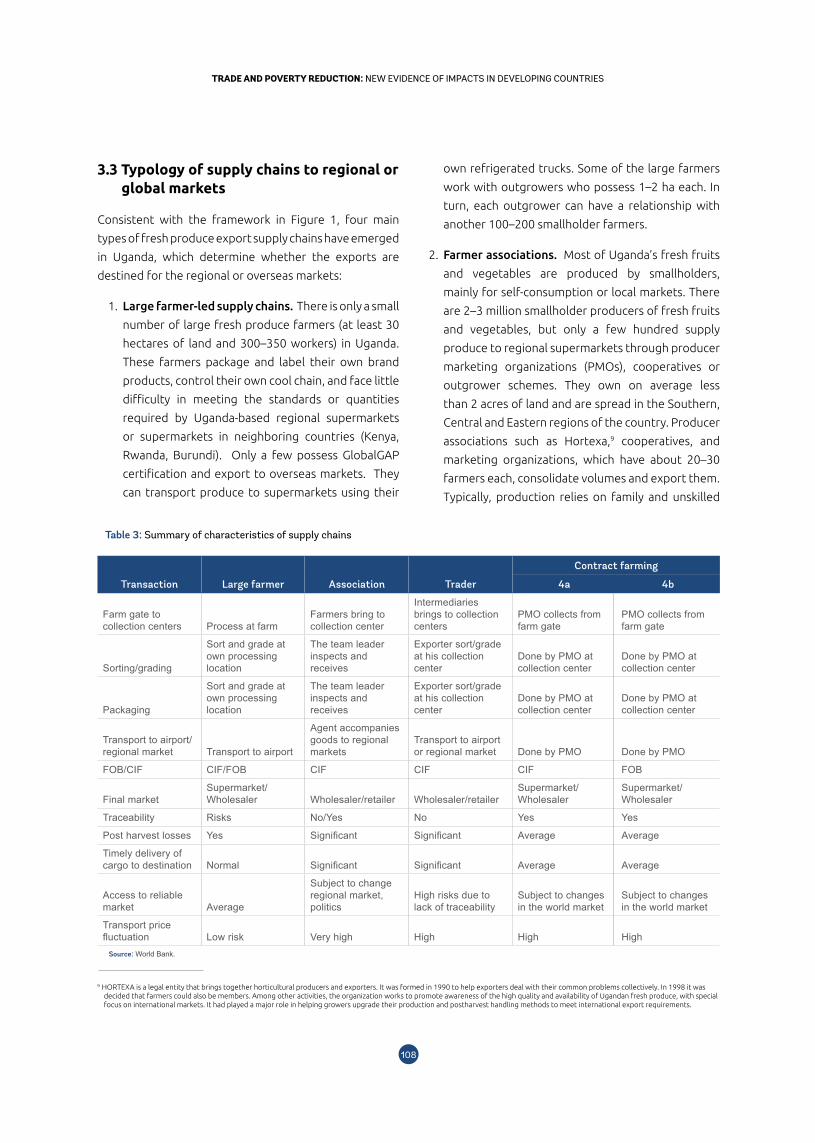
109108
TRADE AND POVERTY REDUCTION: NEW EVIDENCE OF IMPACTS IN DEVELOPING COUNTRIESTRADE AND POVERTY REDUCTION: NEW EVIDENCE OF IMPACTS IN DEVELOPING COUNTRIES
3.3 Typology of supply chains to regional or global markets
Consistent with the framework in Figure 1, four main
types of fresh produce export supply chains have emerged
in Uganda, which determine whether the exports are
destined for the regional or overseas markets:
1. Large farmer-led supply chains. There is only a small
number of large fresh produce farmers (at least 30
hectares of land and 300–350 workers) in Uganda.
These farmers package and label their own brand
products, control their own cool chain, and face little
difficulty in meeting the standards or quantities
required by Uganda-based regional supermarkets
or supermarkets in neighboring countries (Kenya,
Rwanda, Burundi). Only a few possess GlobalGAP
certification and export to overseas markets. They
can transport produce to supermarkets using their
9 HORTEXA is a legal entity that brings together horticultural producers and exporters. It was formed in 1990 to help exporters deal with their common problems collectively. In 1998 it was decided that farmers could also be members. Among other activities, the organization works to promote awareness of the high quality and availability of Ugandan fresh produce, with special focus on international markets. It had played a major role in helping growers upgrade their production and postharvest handling methods to meet international export requirements.
own refrigerated trucks. Some of the large farmers
work with outgrowers who possess 1–2 ha each. In
turn, each outgrower can have a relationship with
another 100–200 smallholder farmers.
2. Farmer associations. Most of Uganda’s fresh fruits
and vegetables are produced by smallholders,
mainly for self-consumption or local markets. There
are 2–3 million smallholder producers of fresh fruits
and vegetables, but only a few hundred supply
produce to regional supermarkets through producer
marketing organizations (PMOs), cooperatives or
outgrower schemes. They own on average less
than 2 acres of land and are spread in the Southern,
Central and Eastern regions of the country. Producer
associations such as Hortexa,9 cooperatives, and
marketing organizations, which have about 20–30
farmers each, consolidate volumes and export them.
Typically, production relies on family and unskilled
Table 3: Summary of characteristics of supply chains
Transaction Large farmer Association Trader
Contract farming
4a 4b
Farm gate to collection centers Process at farm
Farmers bring to collection center
Intermediaries brings to collection centers
PMO collects from farm gate
PMO collects from farm gate
Sorting/grading
Sort and grade at own processing location
The team leader inspects and receives
Exporter sort/grade at his collection center
Done by PMO at collection center
Done by PMO at collection center
Packaging
Sort and grade at own processing location
The team leader inspects and receives
Exporter sort/grade at his collection center
Done by PMO at collection center
Done by PMO at collection center
Transport to airport/regional market Transport to airport
Agent accompanies goods to regional markets
Transport to airport or regional market Done by PMO Done by PMO
FOB/CIF CIF/FOB CIF CIF CIF FOB
Final market Supermarket/ Wholesaler Wholesaler/retailer Wholesaler/retailer
Supermarket/ Wholesaler
Supermarket/ Wholesaler
Traceability Risks No/Yes No Yes Yes
Post harvest losses Yes Significant Significant Average Average
Timely delivery of cargo to destination Normal Significant Significant Average Average
Access to reliable market Average
Subject to change regional market, politics
High risks due to lack of traceability
Subject to changes in the world market
Subject to changes in the world market
Transport price fluctuation Low risk Very high High High High
Source: World Bank.
109108
TRADE AND POVERTY REDUCTION: NEW EVIDENCE OF IMPACTS IN DEVELOPING COUNTRIESTRADE AND POVERTY REDUCTION: NEW EVIDENCE OF IMPACTS IN DEVELOPING COUNTRIES
labor, with limited access to specialized advisory
services. Production is also characterized by low use
of pest and disease control, planting materials or soil
fertility enhancement measures. Most companies or
producer associations have very limited investment
capacity to increase production or explore market
opportunities. Only a very small number sells directly
to European wholesalers (Evers et al., 2014).
3. Traders. It is common for small scale farmers to sell
to traders who then consolidate and export product.
Itinerant traders purchase product from farmers and
either export it or act as local agents for regional
buyers. Generally, farmers who have large quantities
are more likely to take their produce to the market,
often using their own transport, while those who sell
small quantities are likely to sell at the farmgate, to
traders or agents.
4. Contract firms. These are firms that may or may
not grow any product but instead consolidate
product from farmers, carry out quality control and
packaging, and sell to domestic markets, regional
markets (South Sudan, Kenya, DRC, Rwanda, and
Tanzania), and international markets. Such firms
source product when there is demand, consolidate
and market it, typically to national or international
wholesalers and supermarkets.
4. Data collection and analysisGiven these characteristics of the fresh produce sector in
Uganda, we carried out experiments to assess the role of
different dimensions of the logistics systems for access
to market. The experiments were conducted to test four
policy issues:
• What is the impact of further improving transport infrastructure?
• Where should storage facilities be provided?
• What is the impact of associations on logistics costs and farmer participation in product markets?
• What is the impact on farmers of complying with
national and global product standards?
The experiments were based on intensive consultations
with farmer associations, field data collection through
structured surveys and modeling of supply chain actor
interactions. The modeling of the relationships between
supply chain actors employed a relatively new technique,
called agent based modeling (ABM). ABM techniques are
a class of computational models and simulations based on
a large number of acting and interacting agents (Axelrod
and Tesfatsion, 2005; Tesfatsion and Judd, 2006). ABM
models are robust and less demanding than econometric
models with regard to availability of aggregate data,
making them especially attractive for policy analysis
in studies of developing countries. ABM models also
differ from other conventional simulation models that
are grounded in mathematical programming, because
they can capture explicitly the interactions between
actors (farmers and intermediaries, for example), thus
allowing for the study of transaction and information
costs. These models can fully account for the spatial
dimension in agricultural activities, and thus the role of
internal transport costs and the physical features of land.
Consequently, the explanatory power of the models is
suited to policy questions of interest.
The outcome of a simulation using ABM is largely
determined by the agents at the micro level, who are
acting between themselves and the environment in
which they are set. Hence, ABM provides a way to
study the behavior of agents as a result of a set of
different scenarios, and then to test the impact of policy
changes. Compared to conventional modeling, ABM
makes it much easier to model heterogeneous and not
fully rational agents, provides more flexibility to model
farmers’ decision-making processes, and facilitates the
inclusion of non-economic factors, which leads to a
better representation of the regional-spatial variations in
agriculture. ABM can capture not only individual decision
making, but also negotiation processes between supply
chain actors, and incorporates time and geographic
information system (GIS) elements for geographical
placement. The agents’ interactions result in a macro
equilibrium as a consequence of the model’s bottom-up
approach, generating better results than in top-down
modeling (Axelrod and Tesfatsion, 2012). Moreover, ABM
enables constructing and solving problems that are non-
tractable by usual analytical models (Billari et al., 2006;
Romero-Calcerrada et al., 2008). Lastly, ABM is also useful
in the representation of changing behavior, starting with
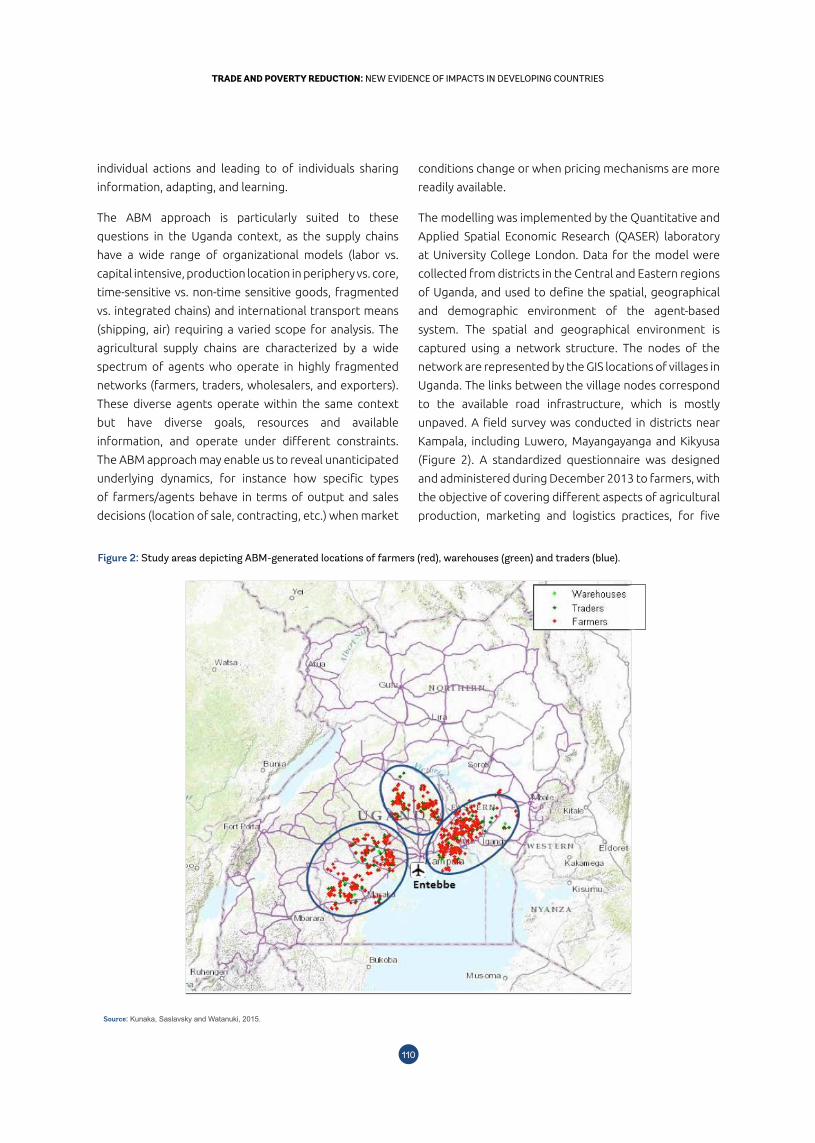
111110
TRADE AND POVERTY REDUCTION: NEW EVIDENCE OF IMPACTS IN DEVELOPING COUNTRIESTRADE AND POVERTY REDUCTION: NEW EVIDENCE OF IMPACTS IN DEVELOPING COUNTRIES
individual actions and leading to of individuals sharing
information, adapting, and learning.
The ABM approach is particularly suited to these
questions in the Uganda context, as the supply chains
have a wide range of organizational models (labor vs.
capital intensive, production location in periphery vs. core,
time-sensitive vs. non-time sensitive goods, fragmented
vs. integrated chains) and international transport means
(shipping, air) requiring a varied scope for analysis. The
agricultural supply chains are characterized by a wide
spectrum of agents who operate in highly fragmented
networks (farmers, traders, wholesalers, and exporters).
These diverse agents operate within the same context
but have diverse goals, resources and available
information, and operate under different constraints.
The ABM approach may enable us to reveal unanticipated
underlying dynamics, for instance how specific types
of farmers/agents behave in terms of output and sales
decisions (location of sale, contracting, etc.) when market
conditions change or when pricing mechanisms are more
readily available.
The modelling was implemented by the Quantitative and
Applied Spatial Economic Research (QASER) laboratory
at University College London. Data for the model were
collected from districts in the Central and Eastern regions
of Uganda, and used to define the spatial, geographical
and demographic environment of the agent-based
system. The spatial and geographical environment is
captured using a network structure. The nodes of the
network are represented by the GIS locations of villages in
Uganda. The links between the village nodes correspond
to the available road infrastructure, which is mostly
unpaved. A field survey was conducted in districts near
Kampala, including Luwero, Mayangayanga and Kikyusa
(Figure 2). A standardized questionnaire was designed
and administered during December 2013 to farmers, with
the objective of covering different aspects of agricultural
production, marketing and logistics practices, for five
Figure 2: Study areas depicting ABM-generated locations of farmers (red), warehouses (green) and traders (blue).
Source: Kunaka, Saslavsky and Watanuki, 2015.
111110
TRADE AND POVERTY REDUCTION: NEW EVIDENCE OF IMPACTS IN DEVELOPING COUNTRIESTRADE AND POVERTY REDUCTION: NEW EVIDENCE OF IMPACTS IN DEVELOPING COUNTRIES
representative products: hot pepper, chillies, matooke,
okra, and sweet potatoes. Farmers were selected using
a stratified sampling method. Interviews were held also
with producer cooperatives and associations.
The results of the experiments are summarized
below.
4.1 Impacts of road infrastructure investments
A typical intervention to try and improve logistics in rural
areas is to upgrade all roads. As mentioned above, this
is implied in the definition of the RAI. The experiment
tested the impact of roads investment in Central and
Eastern regions of Uganda, in the districts of Luwero,
Mpigi, Masaka, Iganga, Mitiyana, Kamuli, and Mukono,
to upgrade all roads to all-weather standards (Figure 2).
Specifically, two possible intervention scenarios were
explored. First, rather than assuming that all roads
are upgraded to achieve 100% RAI in Uganda, road
improvement was targeted to agricultural-oriented
districts. On the second intervention, an improvement
to 100% RAI of all roads around the airport in Entebbe
within a radius of 30 km was considered.
The simulation showed that improving roads in the
agricultural districts would produce a 60% decrease in
travel time. Improving the infrastructure would affect
the micro-economic behavior of farmers, as assumed
in the ABM construct. Agents/farmers are affected
by road quality upgrading through “speed to market”
improvements, which reduces post-harvest losses,
among other things. Moreover, the increase in market
accessibility enables farmers/agents to augment their
capital because of more frequent trade exchanges.
Greater connectivity will mean that farmers will be able
to sell their surplus production, and thus will be less
likely to rely solely on their agriculture product for their
subsistence.
Over the course of one simulated year, we do not observe
long-lasting benefits in terms of trade growth or an
increase in overall productivity and welfare as a result
of these transport improvements. Nonetheless, the
number of farmers participating in market exchanges
is significantly increased as compared to the “existing
conditions” network, which leaves road infrastructure
quality unchanged. Based on this finding, a direct
intervention in Entebbe Airport’s hinterland roads
appears to be more effective than upgrading all roads
in the Central and Eastern regions of Uganda in terms of
increasing participation rates. Although the ABM model
is generally not well suited for identifying individual
factors causing a particular outcome, it was noted that
a considerable amount of smallholder agricultural
production takes place around the Entebbe area. This
finding is consistent with other work, especially by
Raballand, et al. (2009).
Improving access to markets can lead to a shift away from
a supply-based situation of the agriculture sector where
farmers merely sell whatever crop surplus they have, to
a demand-driven agriculture where farmers produce for
the markets. However, this shift is complex, and there
are numerous constraints that still prevent Ugandan
farmers from taking full advantage of participation
in the market. The non-traditional export agriculture
goods market remains underdeveloped, and depending
on the product can fluctuate significantly in terms of
pricing, production volume, export volume, and export
values (Ugandan Bureau of Statistics, 2013), in part due
to erratic weather conditions or to changes in demand.
Penetrating international markets requires concerted
efforts to increase production to a sufficient level, to
develop efficient supply chains, and to establish market
quality and standards.
4.2 Consolidation of agricultural produce
In an effort to look into logistics markets more closely,
we ran a second experiment where we assumed that
the agriculture trader selects the best shipping route
between an origin and a destination to minimize their
transport costs while also satisfying demand. To keep
transport costs low, the trader will offer to buy the
farmer’s crop at the farmgate (origin) and then transport
it to a warehouse (destination). The trader can reduce
costs by consolidating the produce of several farmers
and lowering unit delivery costs. The product price to
be used in these transactions varies from point to point
and is determined by the trader in advance. It is assumed
that the trader must determine prices at each warehouse
113112
TRADE AND POVERTY REDUCTION: NEW EVIDENCE OF IMPACTS IN DEVELOPING COUNTRIESTRADE AND POVERTY REDUCTION: NEW EVIDENCE OF IMPACTS IN DEVELOPING COUNTRIES
destination point for his offer to be acceptable to the
farmer. Moreover, the trader chooses the most suitable
price and tries to maximize his profit. However, the trader
offers a price that also includes shipment costs, so the
price offered to the farmer will depend on the location
of the warehouses.
In the simulation approximately 40 control warehouse
locations were preselected in accordance with the
geographical location of the 7 districts of study. In the
ABM simulations, a trader decides whether the farmer
must pay for transport (by offering a price that reflects
transport costs) in relation to his (the trader’s) own
budget. Our simulation suggest that the outcomes
depend on the number of farmers who decide to sell
to a trader and that the traders are better off selling at
specific consolidation centers. In addition, the cost of
transport will significantly affect the farmer’s decision on
whether or not to sell his crop.
Based on average probabilities of warehouse use
computed in the simulations, 5 warehouses emerged
as potential consolidation centers (see Figure 2). The
centers, or rural hubs, are those that would minimize
transport costs for all the market participants, be they
farmers or traders. Two of the selected sites are in the
Jinja area, and the others in Kabasanga (West of Kampala)
and Luwero (North of Kampala, near the Kampala-Gulu
Highway). In terms of characteristics the rural hubs are
those that have high population density, and agriculture
is the main economic activity. Their main attraction is
that farmers can sell their products quickly and minimize
losses due to produce deterioration. This result confirms
the existence of a hierarchy of markets and the fact that
the more central locations especially those with relatively
large demand can play a role in how rural logistics are
organized. As volumes increase, it would be important
for rural hubs to have improved facilities for storing
produce and to minimize post-harvest losses.
4.3 Farmer coordination strategies
The third experiment explored the effects of farmer
coordination strategies. The ABM enabled us to model
coordination initiatives/association among farmers
through the spread of information that can be of any type
(formal and informal). The model is used to explore the
impact that associating with other farmers would have on
farmers’ market participation, transport cost, crop prices,
and volumes sold to traders. Association between two
farmers implies that they share information, produce and
sell together at the same price, consolidate and transport
together in the same warehouse and at the same logistics
cost, and share revenues in proportion to the amount
produced.
Under the base conditions scenario of the model, it is
assumed that only minimal coordination is taking place.
Farmers are bounded rational agents, and they make
decisions as a function of the information available to
them. Through association the farmers can share the
resources for paying the shipping cost, pass information
to one another and can gain some market power and
influence prices of their products. It is assumed that
association is realized between farmers no farther than
30 kilometers (half a day walking) from each other and
thus benefit from some agglomeration economies within
their local area. Each farmer may start with a network of
farmers known to him, and this network is then shared
every time a new multiplier attachment/coordination
with a new farmer/outgrower is developed. The model
is designed so that the sharing of the network of known
farmers occurs within one calendar year, so the spread
of information is thus across one year to allow for
adjustment and clearing of noise. Since the association
process is very time-consuming from the point of view
of computing, we consider that the coordination process
takes place every 3 months.
The results of the simulation are striking. In the case
of no association, approximately half of the farmers
(agents) cease to participate in the market (Figure 3a).
However, when the farmers associate, participation
rates rise sharply. This result suggests that association
among farmers may be highly significant over the longer-
term. Association results in lower transport costs: the
curve related to the association among farmers lies
conspicuously below the curve representing the case of
no association (Figure 3b).
The farmgate prices under associations of the crops
considered (hot peppers, chillies, matooke, okra, and
sweet potatoes) are always higher than prices of crops
without association. For any crop, the supply chain is
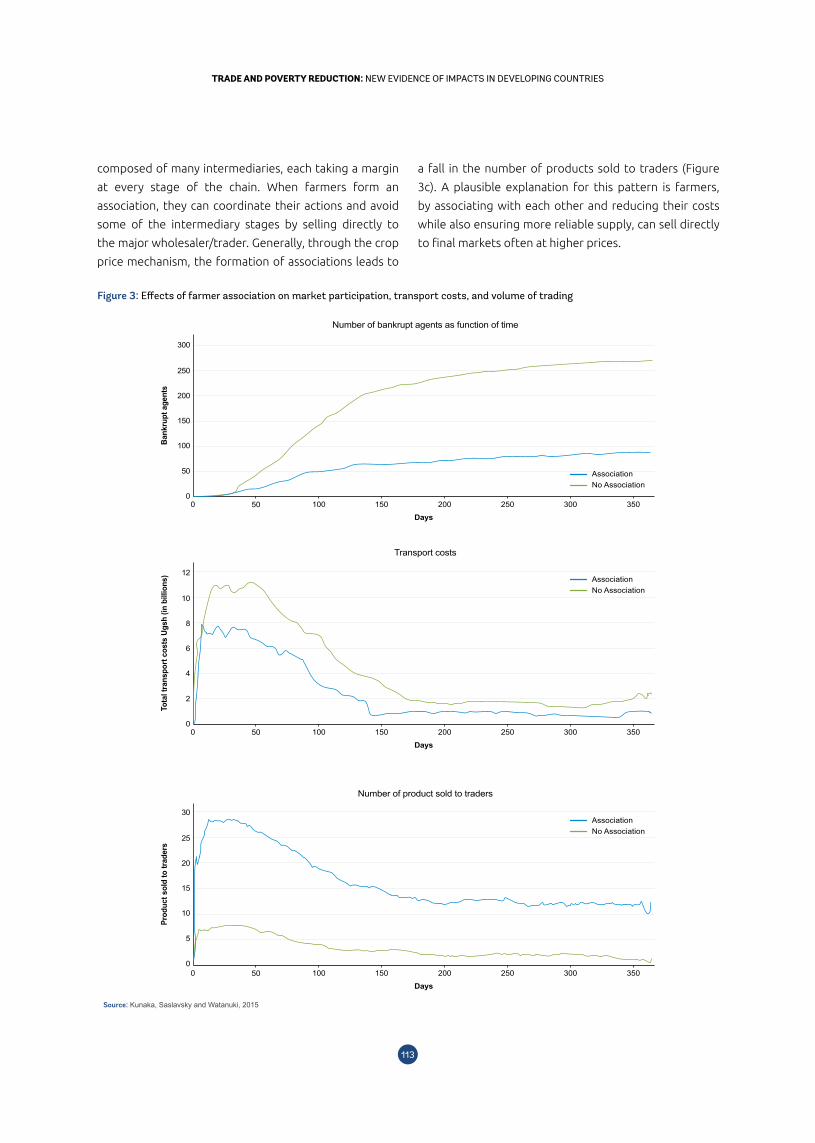
113112
TRADE AND POVERTY REDUCTION: NEW EVIDENCE OF IMPACTS IN DEVELOPING COUNTRIESTRADE AND POVERTY REDUCTION: NEW EVIDENCE OF IMPACTS IN DEVELOPING COUNTRIES
composed of many intermediaries, each taking a margin
at every stage of the chain. When farmers form an
association, they can coordinate their actions and avoid
some of the intermediary stages by selling directly to
the major wholesaler/trader. Generally, through the crop
price mechanism, the formation of associations leads to
a fall in the number of products sold to traders (Figure
3c). A plausible explanation for this pattern is farmers,
by associating with each other and reducing their costs
while also ensuring more reliable supply, can sell directly
to final markets often at higher prices.
Figure 3: Effects of farmer association on market participation, transport costs, and volume of trading
300
250
200
100
50
150
0
Days
Bank
rupt
age
nts
Number of bankrupt agents as function of time
500 150 200100 250 300 350
No AssociationAssociation
12
10
8
4
2
6
0
Days
Tota
l tra
nspo
rt co
sts
Ugsh
(in
billi
ons)
Transport costs
500 150 200100 250 300 350
No AssociationAssociation
30
25
20
10
5
15
0
Days
Prod
uct s
old
to tr
ader
s
Number of product sold to traders
500 150 200100 250 300 350
No AssociationAssociation
Source: Kunaka, Saslavsky and Watanuki, 2015
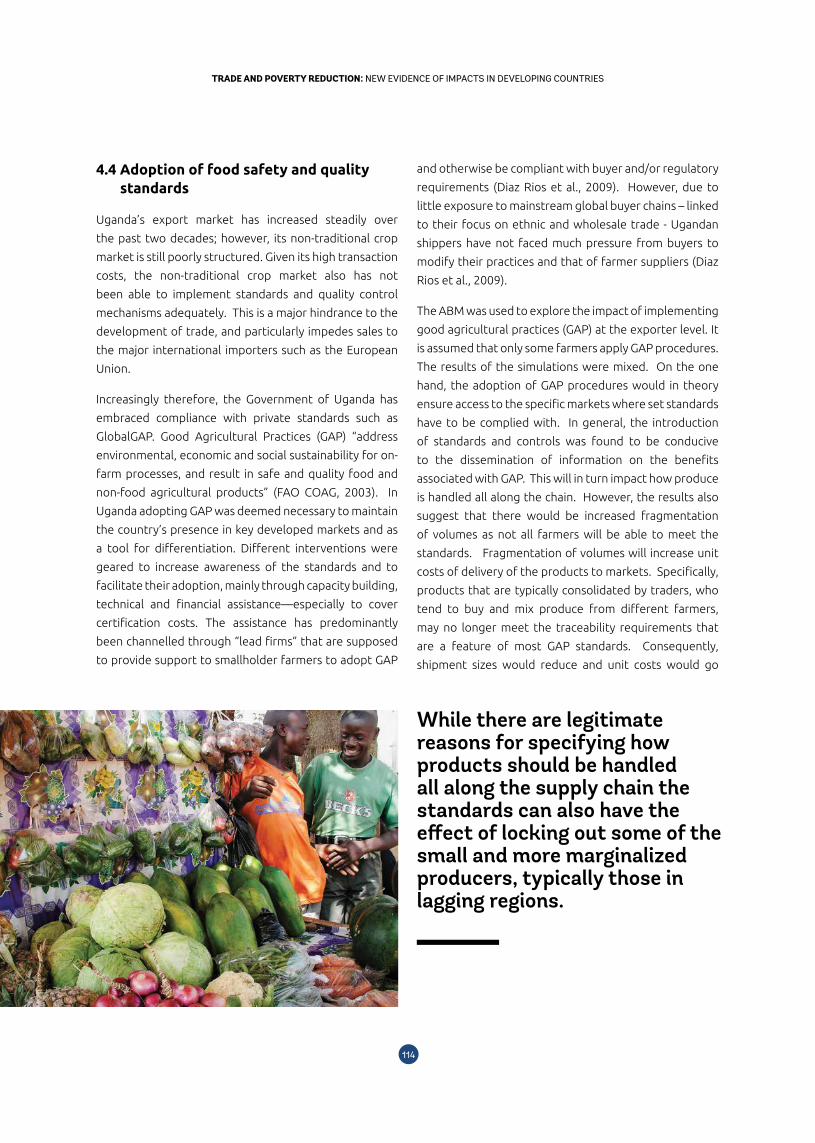
115114
TRADE AND POVERTY REDUCTION: NEW EVIDENCE OF IMPACTS IN DEVELOPING COUNTRIESTRADE AND POVERTY REDUCTION: NEW EVIDENCE OF IMPACTS IN DEVELOPING COUNTRIES
4.4 Adoption of food safety and quality standards
Uganda’s export market has increased steadily over
the past two decades; however, its non-traditional crop
market is still poorly structured. Given its high transaction
costs, the non-traditional crop market also has not
been able to implement standards and quality control
mechanisms adequately. This is a major hindrance to the
development of trade, and particularly impedes sales to
the major international importers such as the European
Union.
Increasingly therefore, the Government of Uganda has
embraced compliance with private standards such as
GlobalGAP. Good Agricultural Practices (GAP) “address
environmental, economic and social sustainability for on-
farm processes, and result in safe and quality food and
non-food agricultural products” (FAO COAG, 2003). In
Uganda adopting GAP was deemed necessary to maintain
the country’s presence in key developed markets and as
a tool for differentiation. Different interventions were
geared to increase awareness of the standards and to
facilitate their adoption, mainly through capacity building,
technical and financial assistance—especially to cover
certification costs. The assistance has predominantly
been channelled through “lead firms” that are supposed
to provide support to smallholder farmers to adopt GAP
and otherwise be compliant with buyer and/or regulatory
requirements (Diaz Rios et al., 2009). However, due to
little exposure to mainstream global buyer chains – linked
to their focus on ethnic and wholesale trade - Ugandan
shippers have not faced much pressure from buyers to
modify their practices and that of farmer suppliers (Diaz
Rios et al., 2009).
The ABM was used to explore the impact of implementing
good agricultural practices (GAP) at the exporter level. It
is assumed that only some farmers apply GAP procedures.
The results of the simulations were mixed. On the one
hand, the adoption of GAP procedures would in theory
ensure access to the specific markets where set standards
have to be complied with. In general, the introduction
of standards and controls was found to be conducive
to the dissemination of information on the benefits
associated with GAP. This will in turn impact how produce
is handled all along the chain. However, the results also
suggest that there would be increased fragmentation
of volumes as not all farmers will be able to meet the
standards. Fragmentation of volumes will increase unit
costs of delivery of the products to markets. Specifically,
products that are typically consolidated by traders, who
tend to buy and mix produce from different farmers,
may no longer meet the traceability requirements that
are a feature of most GAP standards. Consequently,
shipment sizes would reduce and unit costs would go
While there are legitimate reasons for specifying how products should be handled all along the supply chain the standards can also have the effect of locking out some of the small and more marginalized producers, typically those in lagging regions.
115114
TRADE AND POVERTY REDUCTION: NEW EVIDENCE OF IMPACTS IN DEVELOPING COUNTRIESTRADE AND POVERTY REDUCTION: NEW EVIDENCE OF IMPACTS IN DEVELOPING COUNTRIES
up. At the same time, the simulations suggested that
GAP implementation would not have a dramatic impact
on trader prices, although they increase at a slightly
faster rate than without GAP implementation. This latter
phenomenon could be because the reduced volume
is comprised of higher quality produce that meets the
standards and therefore fetches higher prices in the
market.
5. Conclusions
A thread running through the results of the experiments
run in Uganda is that small scale farmers benefit most
from coordinating among themselves in accessing
information, searching for markets, deciding when to go
to market and when adopting new technologies.
One consolidation strategy is physical. The typical
shipment originating in rural areas in developing countries
starts at the farm level, is transported to a storage
facility and from there to buying points or to local and
regional markets. The development of road networks
can have a significant influence over the direction of flow
of agricultural shipments. As products move from the
farmgate to market in lagging regions volumes can be
increased and costs lowered by consolidating flows into
larger and larger vehicles. The larger vehicles require
better roads than are available at the local level and
which lead to central places where markets are larger. In
fact, there are discernible rural freight hubs, serving as
storage and logistics transfer points. In that regard the
placement of rural hubs is quite important to reduce
costs in lagging regions.
A complement of rural hubs is their link with urban areas.
Increasingly modern food retailing is dependent on
supermarkets and large retail chains for food and food
services. Supermarkets are playing a transformative role
in reorganizing and upgrading supply chains for fresh
produce. They require produce of specific standards,
sizes, packaging, freshness, etc., which forces suppliers
to also update their systems if they want access to
growing urban markets. The reconfiguration of supply
chains extends all the way to the farmgate. If small
scale producers want to benefit from urbanization and
globalization then they have to comply and meet these
requirements.
However, as the results of the simulations suggest, the
net effect of adopting high product handling standards
are double edged. While there are legitimate reasons
for specifying how products should be handled all along
the supply chain the standards can also have the effect
of locking out some of the small and more marginalized
producers, typically those in lagging regions. Such
producers are often not able to meet any high standards
at least without suffering the effects of high transport
and logistics costs. The farmers can therefore end up
relying on only the local markets and to a limited extent
regional markets. This can have significant implications
on poverty eradication outcomes.
A second consolidation strategy is virtual, through
the use of ICT. There are several actors in agricultural
logistics flows in rural regions in low income countries.
Among them are various types of intermediaries who
often may retain a large share of the rents from farming
compared to the farmers who do the actual production.
Providing farmers with information on prices or other
market conditions can influence where and when product
is delivered to the market. In markets in lagging regions
there is great uncertainty on how much or when product
should be ready for market. In some agro-supply chains
there have been attempts to minimize this uncertainty by
entering into contract farming arrangements between
producers and downstream processing or marketing
enterprises. A more recent approach has been to exploit
information technology, to facilitate price discovery
and assessment of market conditions and to coordinate
between farmers on when to go to market. The appeal of
these features is reflected in a surge in the development of
farmer applications for mobile phones, especially in Africa.
A third consolidation strategy is one that is several
decades old, in the form of social organizations. Farmer
organizations help individual producers overcome their
immediate disadvantage of small scale production.
Through collaboration farmers can combine their produce
into large volumes, and gain some market power and
high retained incomes. However, as social formations,
many farmer associations fail to transform over time, and
focus on issues that are removed from raison-d’etre and
are not sustainable. Nonetheless, farmer organizations
have a relevant role to play in logistics in lagging regions.
117116
TRADE AND POVERTY REDUCTION: NEW EVIDENCE OF IMPACTS IN DEVELOPING COUNTRIESTRADE AND POVERTY REDUCTION: NEW EVIDENCE OF IMPACTS IN DEVELOPING COUNTRIES
ReferencesAsebe, E. (2012). field survey report for World Bank.
Axelrod, R. (1997). The complexity of cooperation. Princeton University Press (Princeton).
Axelrod, R., and L. Tesfatsion (2005). “A Guide for Newcomers to Agent-Based Modeling in the Social Sciences.” In: Leigh
Tesfatsion and Kenneth L. Judd (Eds.), Handbook of Computational Economics, Vol. 2: Agent-Based Computational
Economics.
Beckmann, M. J. (1976). “Spatial equilibrium in the dispersed city: In: Environment, regional science and interregional
modeling (pp. 132-141). Springer Berlin Heidelberg.
Billari, F. C., T. Fent, A. Prskawetz and J. Scheffran (2006). “Agent-based computational modelling: an introduction.”
In: Agent-Based Computational Modelling (pp. 1-16). Physica-Verlag HD.
Bolwig, S. (2012). Poverty and Gender Effects of Smallholder Organic Contract Farming in Uganda. USSP WORKING
PAPER. IFPRI.
Carruthers, R., and R. R. Krishnamani (2008). “Improving Connectivity: Investing in Transport Infrastructure in Sub-
Saharan Africa.” Background Paper 7 for the Africa Infrastructure Country Diagnostic, World Bank, Washington,
DC.
Casaburi, L., R. Glennerster, and T. Suri (2013). Rural Roads and Intermediated Trade: Regression Discontinuity Evidence
from Sierra Leone. Available at SSRN 2161643.
Collinson, C.D., U. Kleih, D.G. Burnett, A. Muganga, J. Jagwe, and R.S.B. Ferris (2005). Transaction cost analysis for
selected crops with export potential in Uganda, prepared for the Plan for the Modernisation of Agriculture by
the Natural Resources Institute, UK, and the International Institute of Tropical Agriculture, Nigeria. ASARECA/
IITA Monograph 6, IITA, Ibadan, Nigeria. 168 pp.
DFID (2005). “The Value of Time in Least Developed Countries: The African Studies.” Final report for contract R8307,
Department for International Development, London.
Dorosh, P., H. G. Wang, L.You, and E. Schmidt (2010). Crop production and road connectivity in Sub-Saharan Africa: a
spatial analysis. World Bank Policy Research Working Paper Series, Vol.
Dorward, Andrew, Shenggen Fan, Jonathan Kydd, Hans Lofgren, Jamie Morrison, Colin Poulton, Neetha Rao,
Laurence Smith, Hardwick Tchale, Sukhadeo Thorat, Ian Urey and Peter Wobst (2004). “Institutions and Policies
for Pro-poor Agricultural Growth,” Development Policy Review 22, Issue 6, November 2004, pp. 611-622.
Evers, Barbara, Maggie Opondo, Stephanie Barrientos, Aarti Krishnan, Flavia Amoding, and Lindani Ndlovu (2014).
Global and regional supermarkets: implications for producers and workers in Kenyan and Ugandan horticulture,
Capturing the Gains: economic and social upgrading in global production networks. University of Manchester.
Working Paper 39.
Fafchamps, M., and R.V. Hill (2005). “Selling at the farmgate or traveling to market.” American Journal of Agricultural
Economics 87(3), 717-734.
117116
TRADE AND POVERTY REDUCTION: NEW EVIDENCE OF IMPACTS IN DEVELOPING COUNTRIESTRADE AND POVERTY REDUCTION: NEW EVIDENCE OF IMPACTS IN DEVELOPING COUNTRIES
FAO Committee on Agriculture (2003). Development of a Framework for Good Agricultural Practices, Seventeenth
Session. Rome, March 31 – April 4, 2003. Food and Agricultural Organization.
Farole, T. (ed) (2013). The Internal Geography of Trade: Lagging Regions and Global Markets. World Bank. Washington, DC.
Furlong, W. J., and G. A. Slotsve (1983). “ Will That Be Pickup or Delivery?”: An Alternative Spatial Pricing Strategy. The
Bell Journal of Economics, 271-274.
Gibbon, P. (2001). “Upgrading primary production: A GCC approach.” World Development 29 (2), pp. 345–363.
Gollin, D., and R. Rogerson (2010). Agriculture, roads, and economic development in Uganda (No. w15863). National
Bureau of Economic Research.
Gong, W., K. Parton, R. J. Cox, and Z. Zhou (2007). “Transaction costs and cattle farmers’ choice of marketing channels
in China: A Tobit analysis.” Management Research News 30(1), 47-56.
Grabowski, R. (1999). “Coordination Problems, Risk Diversification, and Chance Economic Development and the
Traditional Sector.” Journal of Asian Economics 10 (3): 475–87.
Hazell, P., C. Poulton, S. Wiggins and A. Dorwood (2006). “The Future of Small Farms: Synthesis Paper” Based on Research
Workshop organised by IFPRI, ODI and Imperial College, Wye.
Iimi, A., F. Ahmed, E. C. Anderson, A. S. Diehl, L. Maiyo, T. Peralta-Quirós and K. S. Rao (2016) New Rural Access Index:
Main Determinants and Correlation to Poverty. Washington, DC. World Bank. Policy Research Working Paper
7876.
Kirsten, J. and K. Sartorius (2010). Linking agribusiness and small-scale farmers in developing countries: Is there a new
role for contract farming? Development Southern Africa 19:4, 503-529,
Kunaka, C. (2010). Logistics in Lagging Regions: Overcoming Local Barriers to Global Connectivity. World Bank. Washington, DC.
Kunaka, C., D. Saslavsky and M. Watanuki (2015). Small Payers in Big World, Unpublished paper, World Bank.
Minten, B. and C. Barrett (2008). “Agricultural Technology, Productivity, and Poverty in Madagascar,” World Development
36, issue 5, p. 797-822.
Minten, B., B. Koro and D. Stifel (2013). The last mile (s) in modern input distribution: Evidence from northwestern
Ethiopia. Ethiopia Strategy Support Program-2 Working Paper, 51.
Neven, D. and T. Reardon (2004). “The Rise of Kenyan Supermarkets and the Evolution of their Horticultural Product
Procurement Systems,” Development Policy Review Vol 22 (6), pp.669-699.
Raballand, G., P. Macchi and C. Petracco (2010). Increasing roads investment efficiency in rural Areas. World Bank,
Washington DC.
Raballand, G., P. Macchi, D. Merotto, and C. Petracco (2009). Revising the roads investment strategy in rural areas: an
application for Uganda. World Bank Policy Research Working Paper Series, No. WPS5036. World Bank.
Ranganathan, Rupa and Vivien Foster (2012). Uganda’s infrastructure : a continental perspective (English). Policy
Research working paper; no. WPS 5963. Washington, DC: World Bank.
119118
TRADE AND POVERTY REDUCTION: NEW EVIDENCE OF IMPACTS IN DEVELOPING COUNTRIESTRADE AND POVERTY REDUCTION: NEW EVIDENCE OF IMPACTS IN DEVELOPING COUNTRIES
Diaz Rios, L., S.Jaffee, S.Henson and J. Mugisha (2009). “Not Quite Up to Standard: The Legacy of Two Decades of
Government and Donor Assistance to Uganda’s Horticultural Export Sector.” Agriculture and Rural Development
Discussion Paper, World Bank, Washington, DC.
Romero-Calcerrada, R. and J. Millington (2008). “An Agent-Based Model of Mediterranean Agricultural Land-Use/Cover
Change for Examining Wildfire Risk.” Journal of Artificial Societies and Social Simulation 11(4): 4.
Ronner, E., and K. E. Giller (2013). Background information on agronomy, farming systems and ongoing projects on
grain legumes in Uganda.
Stifel, D. and B. Minten (2008). Isolation and agricultural productivity. Agricultural Economics 39(1), 1-15.
Wiegratz, J., P. Nyabuntu and C. Omagor (2007). “Case Studies of Lead Firm Governance Systems in The Context of
Commercialization of Smallholder Agriculture in Uganda.” Uganda Programme for Trade Opportunities and
Policy, Kampala, Uganda.
World Bank (2009). Not yet up to standard: the legacy of two decades of private, governmental, and donor efforts to
promote Ugandan horticultural exports.
World Bank (2012). The Transformational Use of Information and Communication Technologies in Africa. Washington
D.C: The World Bank. 2012.
World Bank (2014). Review of Smallholder Participation in Transforming Agri-Food Supply Chains in East, Working
Paper.
119118
TRADE AND POVERTY REDUCTION: NEW EVIDENCE OF IMPACTS IN DEVELOPING COUNTRIESTRADE AND POVERTY REDUCTION: NEW EVIDENCE OF IMPACTS IN DEVELOPING COUNTRIES
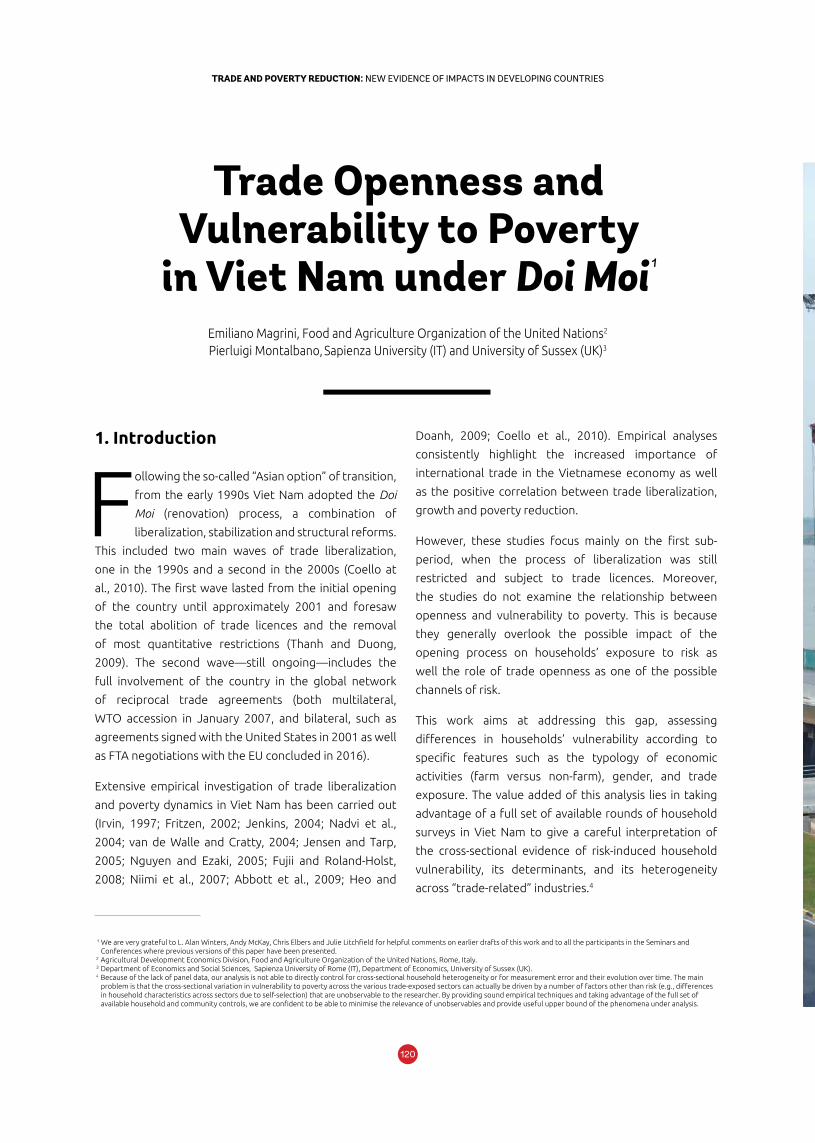
121120
TRADE AND POVERTY REDUCTION: NEW EVIDENCE OF IMPACTS IN DEVELOPING COUNTRIESTRADE AND POVERTY REDUCTION: NEW EVIDENCE OF IMPACTS IN DEVELOPING COUNTRIES
1. Introduction
Following the so-called “Asian option” of transition,
from the early 1990s Viet Nam adopted the Doi
Moi (renovation) process, a combination of
liberalization, stabilization and structural reforms.
This included two main waves of trade liberalization,
one in the 1990s and a second in the 2000s (Coello at
al., 2010). The first wave lasted from the initial opening
of the country until approximately 2001 and foresaw
the total abolition of trade licences and the removal
of most quantitative restrictions (Thanh and Duong,
2009). The second wave—still ongoing—includes the
full involvement of the country in the global network
of reciprocal trade agreements (both multilateral,
WTO accession in January 2007, and bilateral, such as
agreements signed with the United States in 2001 as well
as FTA negotiations with the EU concluded in 2016).
Extensive empirical investigation of trade liberalization
and poverty dynamics in Viet Nam has been carried out
(Irvin, 1997; Fritzen, 2002; Jenkins, 2004; Nadvi et al.,
2004; van de Walle and Cratty, 2004; Jensen and Tarp,
2005; Nguyen and Ezaki, 2005; Fujii and Roland-Holst,
2008; Niimi et al., 2007; Abbott et al., 2009; Heo and
Doanh, 2009; Coello et al., 2010). Empirical analyses
consistently highlight the increased importance of
international trade in the Vietnamese economy as well
as the positive correlation between trade liberalization,
growth and poverty reduction.
However, these studies focus mainly on the first sub-
period, when the process of liberalization was still
restricted and subject to trade licences. Moreover,
the studies do not examine the relationship between
openness and vulnerability to poverty. This is because
they generally overlook the possible impact of the
opening process on households’ exposure to risk as
well the role of trade openness as one of the possible
channels of risk.
This work aims at addressing this gap, assessing
differences in households’ vulnerability according to
specific features such as the typology of economic
activities (farm versus non-farm), gender, and trade
exposure. The value added of this analysis lies in taking
advantage of a full set of available rounds of household
surveys in Viet Nam to give a careful interpretation of
the cross-sectional evidence of risk-induced household
vulnerability, its determinants, and its heterogeneity
across “trade-related” industries.4
Emiliano Magrini, Food and Agriculture Organization of the United Nations2
Pierluigi Montalbano, Sapienza University (IT) and University of Sussex (UK)3
1 We are very grateful to L. Alan Winters, Andy McKay, Chris Elbers and Julie Litchfield for helpful comments on earlier drafts of this work and to all the participants in the Seminars and Conferences where previous versions of this paper have been presented.
2 Agricultural Development Economics Division, Food and Agriculture Organization of the United Nations, Rome, Italy.3 Department of Economics and Social Sciences, Sapienza University of Rome (IT), Department of Economics, University of Sussex (UK).4 Because of the lack of panel data, our analysis is not able to directly control for cross-sectional household heterogeneity or for measurement error and their evolution over time. The main
problem is that the cross-sectional variation in vulnerability to poverty across the various trade-exposed sectors can actually be driven by a number of factors other than risk (e.g., differences in household characteristics across sectors due to self-selection) that are unobservable to the researcher. By providing sound empirical techniques and taking advantage of the full set of available household and community controls, we are confident to be able to minimise the relevance of unobservables and provide useful upper bound of the phenomena under analysis.
Trade Openness and Vulnerability to Poverty
in Viet Nam under Doi Moi 1
121120
TRADE AND POVERTY REDUCTION: NEW EVIDENCE OF IMPACTS IN DEVELOPING COUNTRIESTRADE AND POVERTY REDUCTION: NEW EVIDENCE OF IMPACTS IN DEVELOPING COUNTRIES
Emiliano Magrini, Food and Agriculture Organization of the United Nations2
Pierluigi Montalbano, Sapienza University (IT) and University of Sussex (UK)3
Empirical analyses consistently highlight the increased importance of international trade in the
Vietnamese economy as well as the positive correlation
between trade liberalization, growth and poverty
reduction.
Trade Openness and Vulnerability to Poverty
in Viet Nam under Doi Moi 1
123122
TRADE AND POVERTY REDUCTION: NEW EVIDENCE OF IMPACTS IN DEVELOPING COUNTRIESTRADE AND POVERTY REDUCTION: NEW EVIDENCE OF IMPACTS IN DEVELOPING COUNTRIES
The contribution of this paper is twofold: using six Living
Standards Measurement Surveys in Viet Nam (covering
the period 1992-2008), we first assess the level and
changes over time in the shares of vulnerable people
across economic sectors, organized according to their
relative degree of trade exposure; second, we measure
how much of households’ consumption variation (which
is at the core of vulnerability analysis) can be explained by
its stochastic ex-ante component, namely the variance of
income within trade-exposed groups, as well as by actual
income shocks, defined as the component of income
variation unexplained by observables.
Our main results are the following. Vulnerability to
poverty fell in Viet Nam during the Doi Moi period,
together with an increased share of its stochastic (risk)
determinant. The share of the vulnerable population
in the relatively more trade-exposed sectors fell more
slowly than in non-traded sectors. Even after Doi Moi,
farming households engaged in the production of export
crops and import-competing crops faced higher levels of
vulnerability than those engaged in the production of
non-traded crops or in non-farm activities.
Moreover, the risk of future poverty for households
engaged in activities directly affected by trade
liberalization was driven by high volatility, not from
expected mean consumption below the poverty line. The
above results are key for policymaking. They highlight
a link between trade openness and risk-induced
vulnerability, underlining the need to address vulnerability
to poverty, even in the context of trade liberalization
policies that result in a net reduction in poverty.
The paper is organized as follows: section 2 reviews
the literature and presents the conceptual framework;
section 3 presents the data; section 4 shows the empirical
results; and section 5 concludes and provides key policy
implications.
2. Trade openness and vulnerability to poverty: the conceptual framework
The literature on trade liberalization and poverty
dynamics in Viet Nam has reached consensus on the
following issues: price liberalization has had a great
impact on agricultural households since 1986 (Niimi et al.,
2007), with a substantial poverty reduction for rice net
producers that exceeds that for rice net consumers (Heo
and Doanh, 2009); trade liberalization has been beneficial
to the poor thanks to the highly labor intensive structure
of Vietnamese exports;5 the negative effects of trade
liberalization occurred mainly in coffee production after
1998 (Ha and Shively, 2008).
However, a key issue remains unanswered: has trade
openness magnified households’ exposure to risk and
raised their vulnerability to poverty? The topic is currently
debated by practitioners, whereas it is largely ignored
by the trade literature (Montalbano, 2011). In principle,
trade can change the level of risk faced by households
in two ways: by changing the riskiness of existing
activities, for instance, by altering the weight of foreign
compared with domestic shocks faced by the economy,
or by shifting the composition of household activities, for
example switching from subsistence food crops to cash
crops (McCulloch et al., 2001).
The share of the vulnerable
population in the relatively more trade-exposed
sectors fell more slowly than in
non-traded sectors.
5 Abbott et al. (2009) claim that the poverty impacts of trade reforms in Viet Nam are even larger than those anticipated by existing model predictions, because of the intrinsic limitations of the most common applied methods and because they generally overlook the fact that institutional rather than tariff reforms have been the main driving factor behind recent development in Viet Nam.
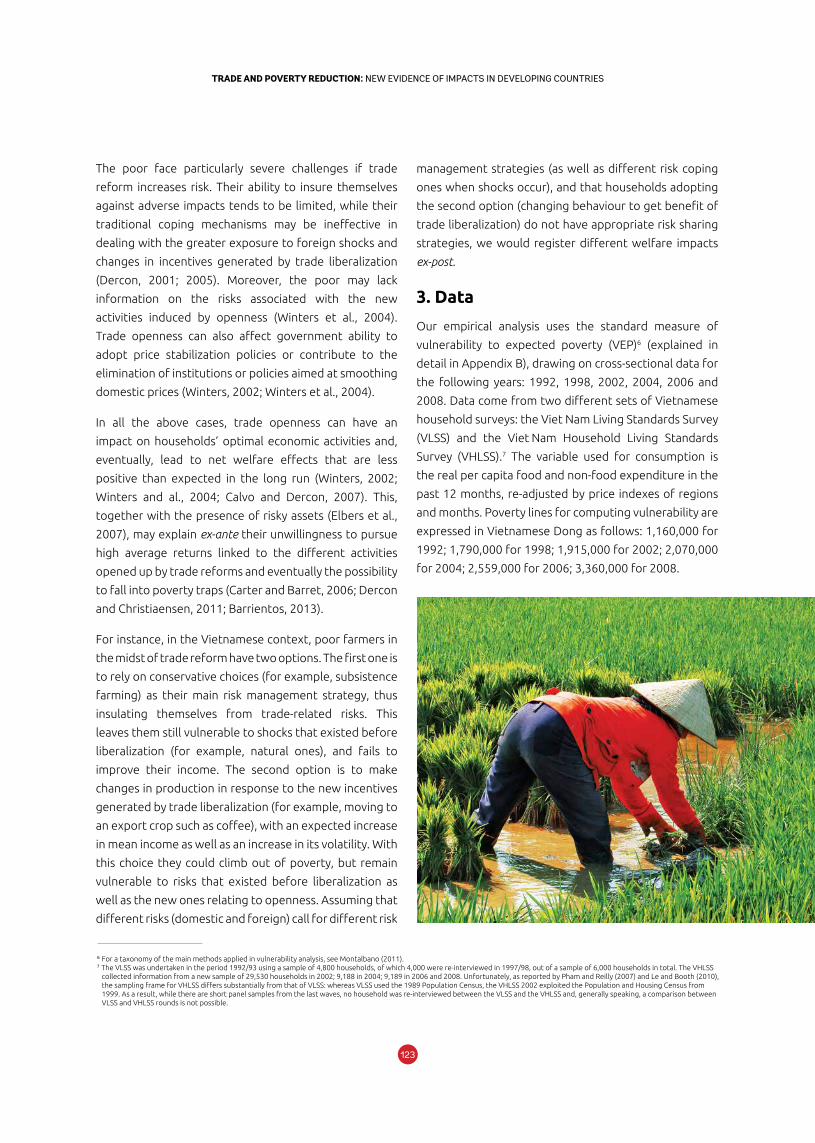
123122
TRADE AND POVERTY REDUCTION: NEW EVIDENCE OF IMPACTS IN DEVELOPING COUNTRIESTRADE AND POVERTY REDUCTION: NEW EVIDENCE OF IMPACTS IN DEVELOPING COUNTRIES
The poor face particularly severe challenges if trade
reform increases risk. Their ability to insure themselves
against adverse impacts tends to be limited, while their
traditional coping mechanisms may be ineffective in
dealing with the greater exposure to foreign shocks and
changes in incentives generated by trade liberalization
(Dercon, 2001; 2005). Moreover, the poor may lack
information on the risks associated with the new
activities induced by openness (Winters et al., 2004).
Trade openness can also affect government ability to
adopt price stabilization policies or contribute to the
elimination of institutions or policies aimed at smoothing
domestic prices (Winters, 2002; Winters et al., 2004).
In all the above cases, trade openness can have an
impact on households’ optimal economic activities and,
eventually, lead to net welfare effects that are less
positive than expected in the long run (Winters, 2002;
Winters and al., 2004; Calvo and Dercon, 2007). This,
together with the presence of risky assets (Elbers et al.,
2007), may explain ex-ante their unwillingness to pursue
high average returns linked to the different activities
opened up by trade reforms and eventually the possibility
to fall into poverty traps (Carter and Barret, 2006; Dercon
and Christiaensen, 2011; Barrientos, 2013).
For instance, in the Vietnamese context, poor farmers in
the midst of trade reform have two options. The first one is
to rely on conservative choices (for example, subsistence
farming) as their main risk management strategy, thus
insulating themselves from trade-related risks. This
leaves them still vulnerable to shocks that existed before
liberalization (for example, natural ones), and fails to
improve their income. The second option is to make
changes in production in response to the new incentives
generated by trade liberalization (for example, moving to
an export crop such as coffee), with an expected increase
in mean income as well as an increase in its volatility. With
this choice they could climb out of poverty, but remain
vulnerable to risks that existed before liberalization as
well as the new ones relating to openness. Assuming that
different risks (domestic and foreign) call for different risk
management strategies (as well as different risk coping
ones when shocks occur), and that households adopting
the second option (changing behaviour to get benefit of
trade liberalization) do not have appropriate risk sharing
strategies, we would register different welfare impacts
ex-post.
3. Data
Our empirical analysis uses the standard measure of
vulnerability to expected poverty (VEP)6 (explained in
detail in Appendix B), drawing on cross-sectional data for
the following years: 1992, 1998, 2002, 2004, 2006 and
2008. Data come from two different sets of Vietnamese
household surveys: the Viet Nam Living Standards Survey
(VLSS) and the Viet Nam Household Living Standards
Survey (VHLSS).7 The variable used for consumption is
the real per capita food and non-food expenditure in the
past 12 months, re-adjusted by price indexes of regions
and months. Poverty lines for computing vulnerability are
expressed in Vietnamese Dong as follows: 1,160,000 for
1992; 1,790,000 for 1998; 1,915,000 for 2002; 2,070,000
for 2004; 2,559,000 for 2006; 3,360,000 for 2008.
6 For a taxonomy of the main methods applied in vulnerability analysis, see Montalbano (2011).7 The VLSS was undertaken in the period 1992/93 using a sample of 4,800 households, of which 4,000 were re-interviewed in 1997/98, out of a sample of 6,000 households in total. The VHLSS
collected information from a new sample of 29,530 households in 2002; 9,188 in 2004; 9,189 in 2006 and 2008. Unfortunately, as reported by Pham and Reilly (2007) and Le and Booth (2010), the sampling frame for VHLSS differs substantially from that of VLSS: whereas VLSS used the 1989 Population Census, the VHLSS 2002 exploited the Population and Housing Census from 1999. As a result, while there are short panel samples from the last waves, no household was re-interviewed between the VLSS and the VHLSS and, generally speaking, a comparison between VLSS and VHLSS rounds is not possible.
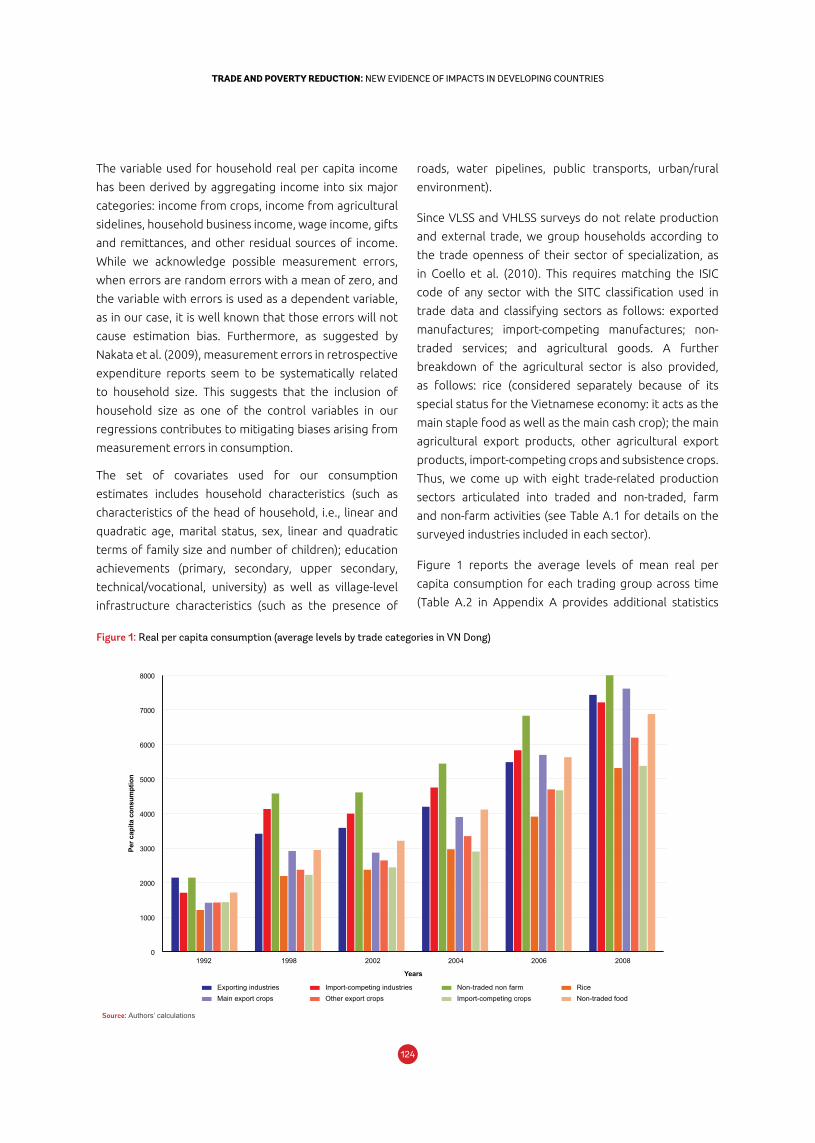
125124
TRADE AND POVERTY REDUCTION: NEW EVIDENCE OF IMPACTS IN DEVELOPING COUNTRIESTRADE AND POVERTY REDUCTION: NEW EVIDENCE OF IMPACTS IN DEVELOPING COUNTRIES
The variable used for household real per capita income
has been derived by aggregating income into six major
categories: income from crops, income from agricultural
sidelines, household business income, wage income, gifts
and remittances, and other residual sources of income.
While we acknowledge possible measurement errors,
when errors are random errors with a mean of zero, and
the variable with errors is used as a dependent variable,
as in our case, it is well known that those errors will not
cause estimation bias. Furthermore, as suggested by
Nakata et al. (2009), measurement errors in retrospective
expenditure reports seem to be systematically related
to household size. This suggests that the inclusion of
household size as one of the control variables in our
regressions contributes to mitigating biases arising from
measurement errors in consumption.
The set of covariates used for our consumption
estimates includes household characteristics (such as
characteristics of the head of household, i.e., linear and
quadratic age, marital status, sex, linear and quadratic
terms of family size and number of children); education
achievements (primary, secondary, upper secondary,
technical/vocational, university) as well as village-level
infrastructure characteristics (such as the presence of
roads, water pipelines, public transports, urban/rural
environment).
Since VLSS and VHLSS surveys do not relate production
and external trade, we group households according to
the trade openness of their sector of specialization, as
in Coello et al. (2010). This requires matching the ISIC
code of any sector with the SITC classification used in
trade data and classifying sectors as follows: exported
manufactures; import-competing manufactures; non-
traded services; and agricultural goods. A further
breakdown of the agricultural sector is also provided,
as follows: rice (considered separately because of its
special status for the Vietnamese economy: it acts as the
main staple food as well as the main cash crop); the main
agricultural export products, other agricultural export
products, import-competing crops and subsistence crops.
Thus, we come up with eight trade-related production
sectors articulated into traded and non-traded, farm
and non-farm activities (see Table A.1 for details on the
surveyed industries included in each sector).
Figure 1 reports the average levels of mean real per
capita consumption for each trading group across time
(Table A.2 in Appendix A provides additional statistics
1992 1998 2002 2004 2006 2008
Per c
apita
con
sum
ptio
n
Years
Exporting industriesMain export crops
Import-competing industriesOther export crops
Non-traded non farmImport-competing crops
RiceNon-traded food
0
1000
2000
3000
4000
5000
6000
7000
8000
Figure 1: Real per capita consumption (average levels by trade categories in VN Dong)
Source: Authors’ calculations
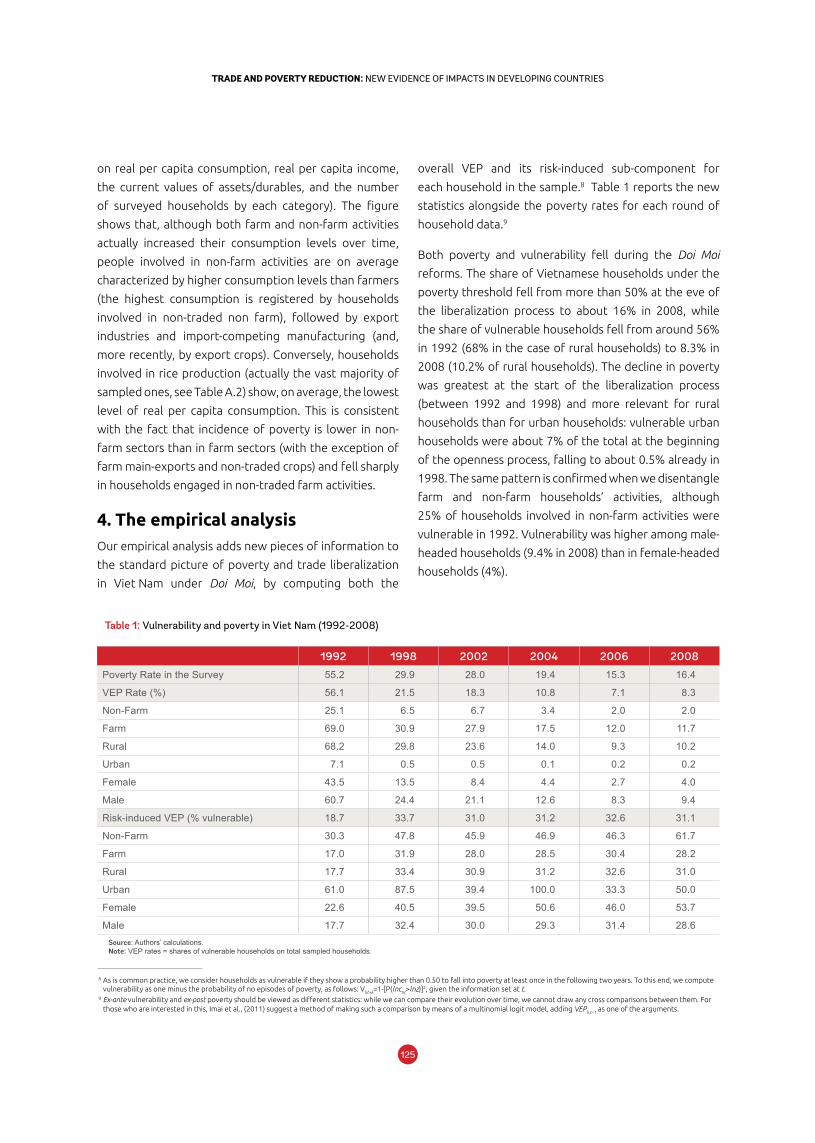
125124
TRADE AND POVERTY REDUCTION: NEW EVIDENCE OF IMPACTS IN DEVELOPING COUNTRIESTRADE AND POVERTY REDUCTION: NEW EVIDENCE OF IMPACTS IN DEVELOPING COUNTRIES
Table 1: Vulnerability and poverty in Viet Nam (1992-2008)
1992 1998 2002 2004 2006 2008
Poverty Rate in the Survey 55.2 29.9 28.0 19.4 15.3 16.4
VEP Rate (%) 56.1 21.5 18.3 10.8 7.1 8.3
Non-Farm 25.1 6.5 6.7 3.4 2.0 2.0
Farm 69.0 30.9 27.9 17.5 12.0 11.7
Rural 68.2 29.8 23.6 14.0 9.3 10.2
Urban 7.1 0.5 0.5 0.1 0.2 0.2
Female 43.5 13.5 8.4 4.4 2.7 4.0
Male 60.7 24.4 21.1 12.6 8.3 9.4
Risk-induced VEP (% vulnerable) 18.7 33.7 31.0 31.2 32.6 31.1
Non-Farm 30.3 47.8 45.9 46.9 46.3 61.7
Farm 17.0 31.9 28.0 28.5 30.4 28.2
Rural 17.7 33.4 30.9 31.2 32.6 31.0
Urban 61.0 87.5 39.4 100.0 33.3 50.0
Female 22.6 40.5 39.5 50.6 46.0 53.7
Male 17.7 32.4 30.0 29.3 31.4 28.6Source: Authors’ calculations.Note: VEP rates = shares of vulnerable households on total sampled households.
8 As is common practice, we consider households as vulnerable if they show a probability higher than 0.50 to fall into poverty at least once in the following two years. To this end, we compute vulnerability as one minus the probability of no episodes of poverty, as follows: Vht+k=1-[P(lncht>lnz)]2, given the information set at t.
9 Ex-ante vulnerability and ex-post poverty should be viewed as different statistics: while we can compare their evolution over time, we cannot draw any cross comparisons between them. For those who are interested in this, Imai et al., (2011) suggest a method of making such a comparison by means of a multinomial logit model, adding VEPh,t−1 as one of the arguments.
overall VEP and its risk-induced sub-component for
each household in the sample.8 Table 1 reports the new
statistics alongside the poverty rates for each round of
household data.9
Both poverty and vulnerability fell during the Doi Moi
reforms. The share of Vietnamese households under the
poverty threshold fell from more than 50% at the eve of
the liberalization process to about 16% in 2008, while
the share of vulnerable households fell from around 56%
in 1992 (68% in the case of rural households) to 8.3% in
2008 (10.2% of rural households). The decline in poverty
was greatest at the start of the liberalization process
(between 1992 and 1998) and more relevant for rural
households than for urban households: vulnerable urban
households were about 7% of the total at the beginning
of the openness process, falling to about 0.5% already in
1998. The same pattern is confirmed when we disentangle
farm and non-farm households’ activities, although
25% of households involved in non-farm activities were
vulnerable in 1992. Vulnerability was higher among male-
headed households (9.4% in 2008) than in female-headed
households (4%).
on real per capita consumption, real per capita income,
the current values of assets/durables, and the number
of surveyed households by each category). The figure
shows that, although both farm and non-farm activities
actually increased their consumption levels over time,
people involved in non-farm activities are on average
characterized by higher consumption levels than farmers
(the highest consumption is registered by households
involved in non-traded non farm), followed by export
industries and import-competing manufacturing (and,
more recently, by export crops). Conversely, households
involved in rice production (actually the vast majority of
sampled ones, see Table A.2) show, on average, the lowest
level of real per capita consumption. This is consistent
with the fact that incidence of poverty is lower in non-
farm sectors than in farm sectors (with the exception of
farm main-exports and non-traded crops) and fell sharply
in households engaged in non-traded farm activities.
4. The empirical analysisOur empirical analysis adds new pieces of information to
the standard picture of poverty and trade liberalization
in Viet Nam under Doi Moi, by computing both the
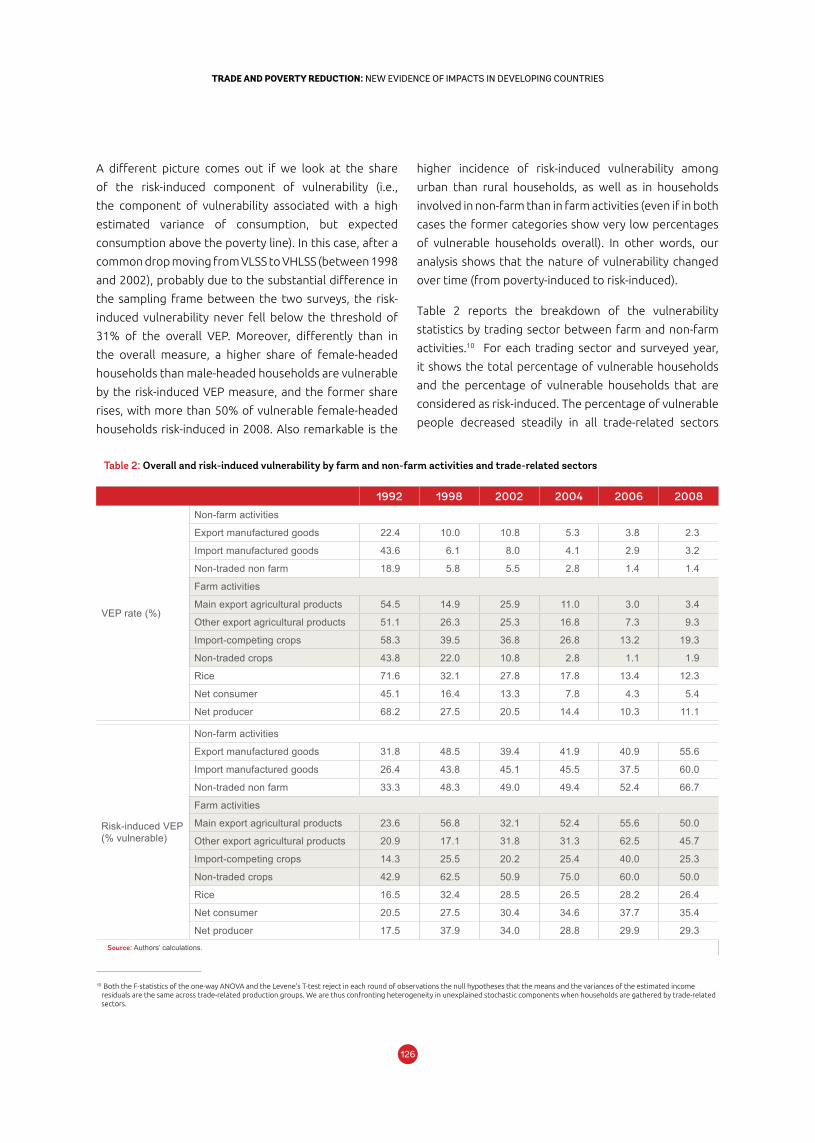
127126
TRADE AND POVERTY REDUCTION: NEW EVIDENCE OF IMPACTS IN DEVELOPING COUNTRIESTRADE AND POVERTY REDUCTION: NEW EVIDENCE OF IMPACTS IN DEVELOPING COUNTRIES
A different picture comes out if we look at the share
of the risk-induced component of vulnerability (i.e.,
the component of vulnerability associated with a high
estimated variance of consumption, but expected
consumption above the poverty line). In this case, after a
common drop moving from VLSS to VHLSS (between 1998
and 2002), probably due to the substantial difference in
the sampling frame between the two surveys, the risk-
induced vulnerability never fell below the threshold of
31% of the overall VEP. Moreover, differently than in
the overall measure, a higher share of female-headed
households than male-headed households are vulnerable
by the risk-induced VEP measure, and the former share
rises, with more than 50% of vulnerable female-headed
households risk-induced in 2008. Also remarkable is the
higher incidence of risk-induced vulnerability among
urban than rural households, as well as in households
involved in non-farm than in farm activities (even if in both
cases the former categories show very low percentages
of vulnerable households overall). In other words, our
analysis shows that the nature of vulnerability changed
over time (from poverty-induced to risk-induced).
Table 2 reports the breakdown of the vulnerability
statistics by trading sector between farm and non-farm
activities.10 For each trading sector and surveyed year,
it shows the total percentage of vulnerable households
and the percentage of vulnerable households that are
considered as risk-induced. The percentage of vulnerable
people decreased steadily in all trade-related sectors
Table 2: Overall and risk-induced vulnerability by farm and non-farm activities and trade-related sectors
1992 1998 2002 2004 2006 2008
VEP rate (%)
Non-farm activities
Export manufactured goods 22.4 10.0 10.8 5.3 3.8 2.3
Import manufactured goods 43.6 6.1 8.0 4.1 2.9 3.2
Non-traded non farm 18.9 5.8 5.5 2.8 1.4 1.4
Farm activities
Main export agricultural products 54.5 14.9 25.9 11.0 3.0 3.4
Other export agricultural products 51.1 26.3 25.3 16.8 7.3 9.3
Import-competing crops 58.3 39.5 36.8 26.8 13.2 19.3
Non-traded crops 43.8 22.0 10.8 2.8 1.1 1.9
Rice 71.6 32.1 27.8 17.8 13.4 12.3
Net consumer 45.1 16.4 13.3 7.8 4.3 5.4
Net producer 68.2 27.5 20.5 14.4 10.3 11.1
Risk-induced VEP (% vulnerable)
Non-farm activities
Export manufactured goods 31.8 48.5 39.4 41.9 40.9 55.6
Import manufactured goods 26.4 43.8 45.1 45.5 37.5 60.0
Non-traded non farm 33.3 48.3 49.0 49.4 52.4 66.7
Farm activities
Main export agricultural products 23.6 56.8 32.1 52.4 55.6 50.0
Other export agricultural products 20.9 17.1 31.8 31.3 62.5 45.7
Import-competing crops 14.3 25.5 20.2 25.4 40.0 25.3
Non-traded crops 42.9 62.5 50.9 75.0 60.0 50.0
Rice 16.5 32.4 28.5 26.5 28.2 26.4
Net consumer 20.5 27.5 30.4 34.6 37.7 35.4
Net producer 17.5 37.9 34.0 28.8 29.9 29.3Source: Authors’ calculations.
10 Both the F-statistics of the one-way ANOVA and the Levene’s T-test reject in each round of observations the null hypotheses that the means and the variances of the estimated income residuals are the same across trade-related production groups. We are thus confronting heterogeneity in unexplained stochastic components when households are gathered by trade-related sectors.
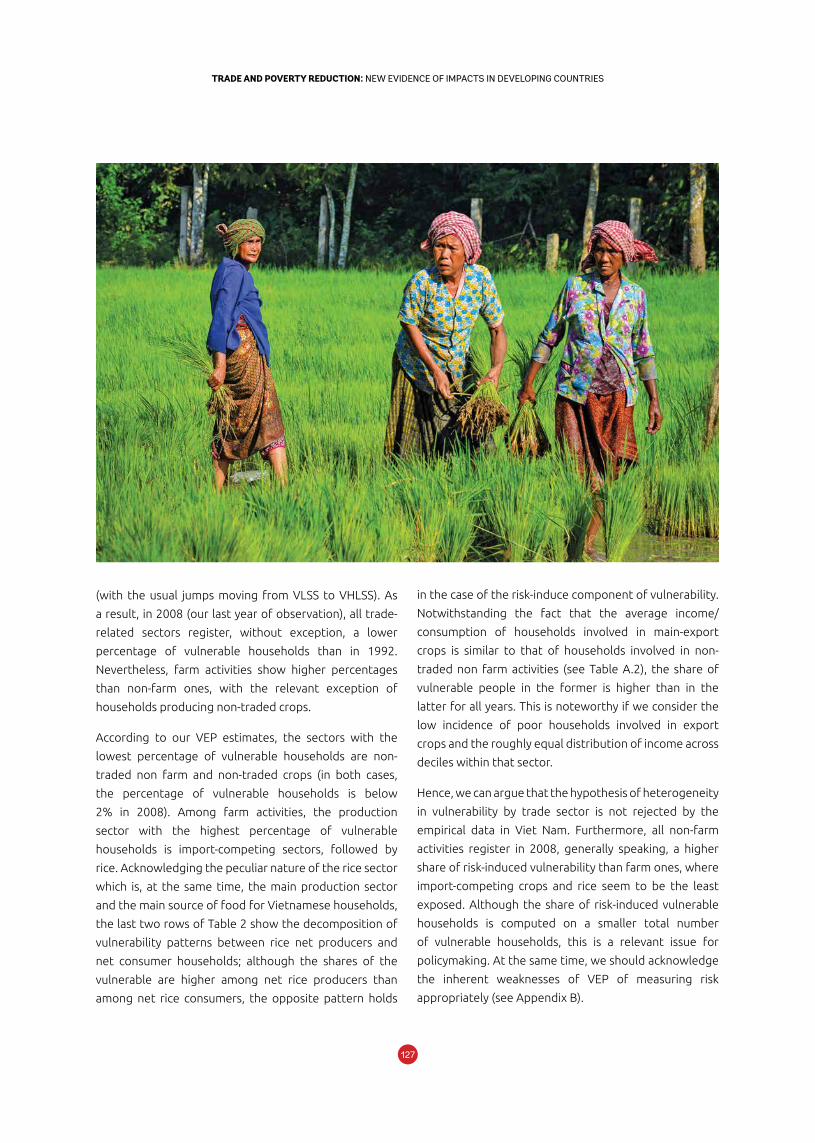
127126
TRADE AND POVERTY REDUCTION: NEW EVIDENCE OF IMPACTS IN DEVELOPING COUNTRIESTRADE AND POVERTY REDUCTION: NEW EVIDENCE OF IMPACTS IN DEVELOPING COUNTRIES
(with the usual jumps moving from VLSS to VHLSS). As
a result, in 2008 (our last year of observation), all trade-
related sectors register, without exception, a lower
percentage of vulnerable households than in 1992.
Nevertheless, farm activities show higher percentages
than non-farm ones, with the relevant exception of
households producing non-traded crops.
According to our VEP estimates, the sectors with the
lowest percentage of vulnerable households are non-
traded non farm and non-traded crops (in both cases,
the percentage of vulnerable households is below
2% in 2008). Among farm activities, the production
sector with the highest percentage of vulnerable
households is import-competing sectors, followed by
rice. Acknowledging the peculiar nature of the rice sector
which is, at the same time, the main production sector
and the main source of food for Vietnamese households,
the last two rows of Table 2 show the decomposition of
vulnerability patterns between rice net producers and
net consumer households; although the shares of the
vulnerable are higher among net rice producers than
among net rice consumers, the opposite pattern holds
in the case of the risk-induce component of vulnerability.
Notwithstanding the fact that the average income/
consumption of households involved in main-export
crops is similar to that of households involved in non-
traded non farm activities (see Table A.2), the share of
vulnerable people in the former is higher than in the
latter for all years. This is noteworthy if we consider the
low incidence of poor households involved in export
crops and the roughly equal distribution of income across
deciles within that sector.
Hence, we can argue that the hypothesis of heterogeneity
in vulnerability by trade sector is not rejected by the
empirical data in Viet Nam. Furthermore, all non-farm
activities register in 2008, generally speaking, a higher
share of risk-induced vulnerability than farm ones, where
import-competing crops and rice seem to be the least
exposed. Although the share of risk-induced vulnerable
households is computed on a smaller total number
of vulnerable households, this is a relevant issue for
policymaking. At the same time, we should acknowledge
the inherent weaknesses of VEP of measuring risk
appropriately (see Appendix B).
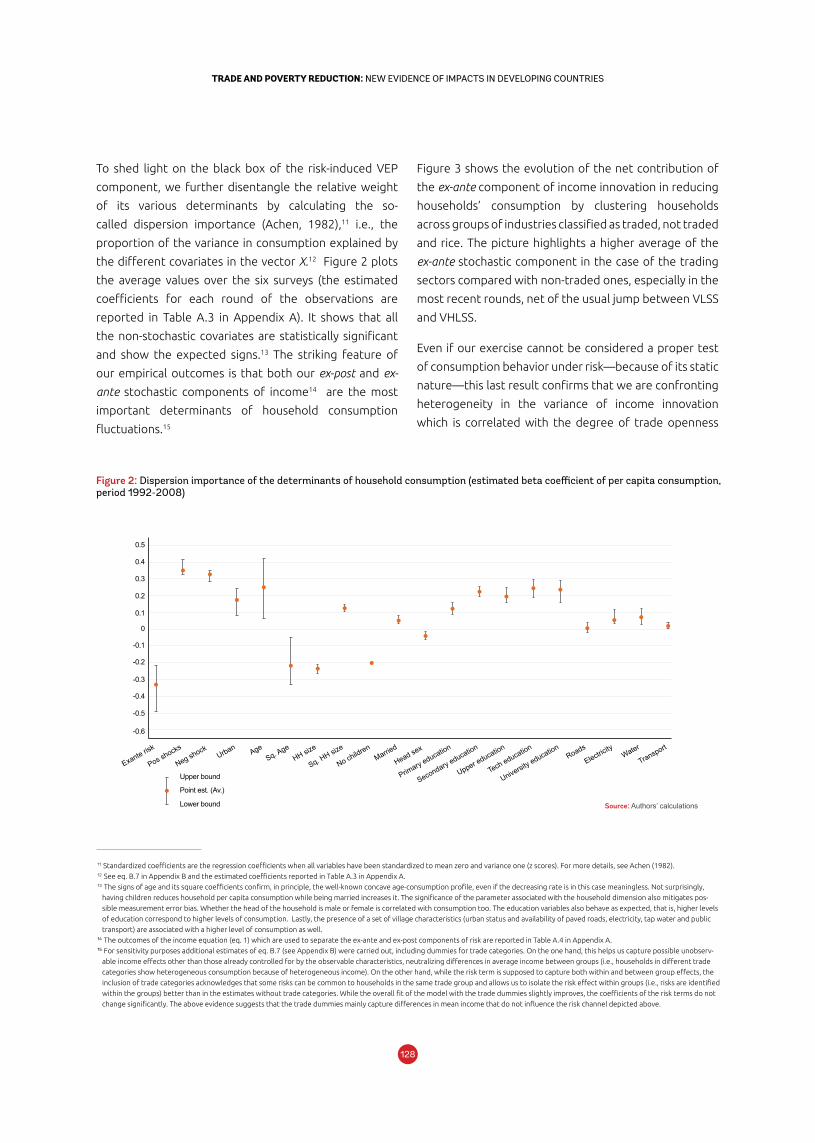
129128
TRADE AND POVERTY REDUCTION: NEW EVIDENCE OF IMPACTS IN DEVELOPING COUNTRIESTRADE AND POVERTY REDUCTION: NEW EVIDENCE OF IMPACTS IN DEVELOPING COUNTRIES
To shed light on the black box of the risk-induced VEP
component, we further disentangle the relative weight
of its various determinants by calculating the so-
called dispersion importance (Achen, 1982),11 i.e., the
proportion of the variance in consumption explained by
the different covariates in the vector X.12 Figure 2 plots
the average values over the six surveys (the estimated
coefficients for each round of the observations are
reported in Table A.3 in Appendix A). It shows that all
the non-stochastic covariates are statistically significant
and show the expected signs.13 The striking feature of
our empirical outcomes is that both our ex-post and ex-
ante stochastic components of income14 are the most
important determinants of household consumption
fluctuations.15
11 Standardized coefficients are the regression coefficients when all variables have been standardized to mean zero and variance one (z scores). For more details, see Achen (1982).12 See eq. B.7 in Appendix B and the estimated coefficients reported in Table A.3 in Appendix A.13 The signs of age and its square coefficients confirm, in principle, the well-known concave age-consumption profile, even if the decreasing rate is in this case meaningless. Not surprisingly,
having children reduces household per capita consumption while being married increases it. The significance of the parameter associated with the household dimension also mitigates pos-
sible measurement error bias. Whether the head of the household is male or female is correlated with consumption too. The education variables also behave as expected, that is, higher levels
of education correspond to higher levels of consumption. Lastly, the presence of a set of village characteristics (urban status and availability of paved roads, electricity, tap water and public
transport) are associated with a higher level of consumption as well.14 The outcomes of the income equation (eq. 1) which are used to separate the ex-ante and ex-post components of risk are reported in Table A.4 in Appendix A.15 For sensitivity purposes additional estimates of eq. B.7 (see Appendix B) were carried out, including dummies for trade categories. On the one hand, this helps us capture possible unobserv-
able income effects other than those already controlled for by the observable characteristics, neutralizing differences in average income between groups (i.e., households in different trade
categories show heterogeneous consumption because of heterogeneous income). On the other hand, while the risk term is supposed to capture both within and between group effects, the
inclusion of trade categories acknowledges that some risks can be common to households in the same trade group and allows us to isolate the risk effect within groups (i.e., risks are identified
within the groups) better than in the estimates without trade categories. While the overall fit of the model with the trade dummies slightly improves, the coefficients of the risk terms do not
change significantly. The above evidence suggests that the trade dummies mainly capture differences in mean income that do not influence the risk channel depicted above.
Figure 3 shows the evolution of the net contribution of
the ex-ante component of income innovation in reducing
households’ consumption by clustering households
across groups of industries classified as traded, not traded
and rice. The picture highlights a higher average of the
ex-ante stochastic component in the case of the trading
sectors compared with non-traded ones, especially in the
most recent rounds, net of the usual jump between VLSS
and VHLSS.
Even if our exercise cannot be considered a proper test
of consumption behavior under risk—because of its static
nature—this last result confirms that we are confronting
heterogeneity in the variance of income innovation
which is correlated with the degree of trade openness
0.3
0.5
0.4
0.1
0
-0.1
0.2
-0.2
-0.4
-0.5
-0.3
-0.6
Exante risk
Pos shocks
Neg shock Urban Age
Sq. AgeHH size
Sq. HH size
No childrenMarrie
d
Head sex
Primary education
Secondary education
Upper education
Tech education
University educationRoads
Electricity
Water
Transport
Upper bound
Lower bound
Point est. (Av.)
Figure 2: Dispersion importance of the determinants of household consumption (estimated beta coefficient of per capita consumption, period 1992-2008)
Source: Authors’ calculations
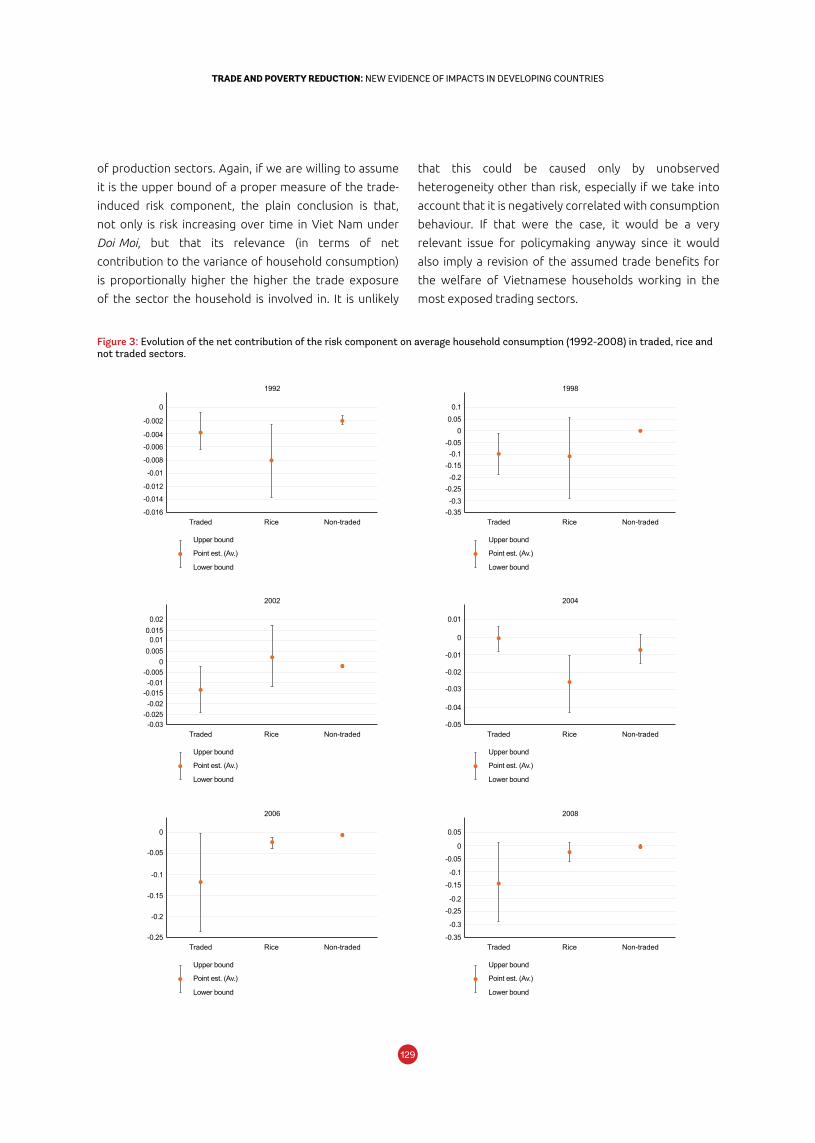
129128
TRADE AND POVERTY REDUCTION: NEW EVIDENCE OF IMPACTS IN DEVELOPING COUNTRIESTRADE AND POVERTY REDUCTION: NEW EVIDENCE OF IMPACTS IN DEVELOPING COUNTRIES
of production sectors. Again, if we are willing to assume
it is the upper bound of a proper measure of the trade-
induced risk component, the plain conclusion is that,
not only is risk increasing over time in Viet Nam under
Doi Moi, but that its relevance (in terms of net
contribution to the variance of household consumption)
is proportionally higher the higher the trade exposure
of the sector the household is involved in. It is unlikely
Figure 3: Evolution of the net contribution of the risk component on average household consumption (1992-2008) in traded, rice and not traded sectors.
that this could be caused only by unobserved
heterogeneity other than risk, especially if we take into
account that it is negatively correlated with consumption
behaviour. If that were the case, it would be a very
relevant issue for policymaking anyway since it would
also imply a revision of the assumed trade benefits for
the welfare of Vietnamese households working in the
most exposed trading sectors.
1992
Non-tradedRice
0.1
0.050
-0.05
-0.15-0.1
-0.2-0.25-0.3
-0.35
1998
Traded Non-tradedRice
Upper bound
Lower bound
Point est. (Av.)
Upper bound
Lower bound
Point est. (Av.)
0
-0.002
-0.004
-0.006
-0.008
-0.01
-0.012
-0.014
-0.016Traded
Upper bound
Lower bound
Point est. (Av.)
0.01
0
-0.01
-0.02
-0.04
-0.03
-0.05
2004
Traded Non-tradedRice
Upper bound
Lower bound
Point est. (Av.)
0.020.0150.01
0.0050
-0.005-0.01
-0.025-0.02
-0.015
-0.03
2002
Traded Non-tradedRice
Upper bound
Lower bound
Point est. (Av.)
0
-0.05
-0.1
-0.15
-0.2
-0.25
2006
Traded Non-tradedRice
Upper bound
Lower bound
Point est. (Av.)
0.05
0
-0.1
-0.15
-0.3
-0.2-0.25
-0.35
-0.05
2008
Traded Non-tradedRice
131130
TRADE AND POVERTY REDUCTION: NEW EVIDENCE OF IMPACTS IN DEVELOPING COUNTRIESTRADE AND POVERTY REDUCTION: NEW EVIDENCE OF IMPACTS IN DEVELOPING COUNTRIES
5. Conclusions
This paper presents a comprehensive analysis of
vulnerability to poverty in Viet Nam during Doi Moi. The
results show a decreasing trend in vulnerability to poverty
along with a decreasing trend in poverty, confirming the
well-known positive impact of the reforms—including
trade liberalization—on the overall performance of the
country. By these measures, the liberalization process
reduced both the observed poverty as well as the risk of
future poverty.
However, a more disaggregated picture on the distribution
of these benefits reveals that the encouraging results
shown at the aggregate level hide the presence of some
subsets of the population who face increased risk and
thus a high probability of falling back into poverty in the
near future. Our analysis tests if this risk depends on the
relative position of a household with respect to some
specific features such as the typology of its economic
activities (non-farm versus farm), trade exposure, and
gender. Despite the fall in the vulnerability level from
56% to 8% over the sampled period, we still observe
that after Doi Moi those employed in farm activities are,
on average, five times more likely to fall into poverty
compared to households engaged in non-farm activities.
The same is true when we look at the distinction
between rural and urban areas, making evident that
farmers in rural areas still deserve special attention by
policymakers interested in limiting an increase of poverty
in the near future. Finally, when we look specifically at
the risk-induced components of vulnerability to poverty,
we detect a relatively higher incidence of vulnerable
households in non-farm activities and in female-headed
households.
Our estimates also show that vulnerability to poverty
varies systematically according to trade exposure of
surveyed households, especially for those involved in
farm activities. In particular, farmers engaged in the
production of export crops and import-competing crops
still registered higher levels of vulnerability after Doi Moi
than those engaged in non-traded crops or non-farm
activities and, in some cases, also a new increase in recent
years. More interestingly, for the categories exposed
to international trade and, therefore, the liberalization
process, the risk of future poverty is mainly driven by
the risk-induced component. This implies that the threat
of falling into poverty does not come from an expected
mean consumption below the poverty line, but from its
high volatility. By further investigating the determinants
of consumption volatility we finally highlight the role of
risk heterogeneity across households according to their
degree of risk exposure.
These results provide some useful insights to
policymakers. First of all, they show that “risk-induced”
vulnerability is relevant and significant even in absence
of ex-post shocks. Second, they demonstrate that the
liberalization process needs to be accompanied by
additional support to households engaged in those farm
activities more exposed to international competition,
since trade openness can magnify risk. This is because
liberalization changes the riskiness of existing activities,
altering the weight of foreign relative to domestic
shocks faced by the economy and, as a consequence,
the households’ optimal economic activities. This is
especially true for the smallholder because of their poor
ability to take advantage of the positive opportunities
created by trade reforms, their weak capabilities to
insure themselves against adverse impacts and, possibly,
the lack of information about the risks associated with
the new activities induced by openness Interventions
to address these issues should primarily target trade-
induced vulnerable households. First, we need to better
protect them from excessive price volatility, in the spirit
of the global trade negotiations on special safeguard
mechanisms. Second, we also need to help them to carry
out progressive choices and take full benefit of trade
reforms. This means fostering their ability to take risks
consciously. This can be done by supporting self-insurance
via savings (through micro-financial instruments), assisting
income risk management by providing access to credit,
sustaining community-based risk-sharing and pushing the
public and private institutions to develop new insurance
products targeted to farmers most involved in tradable
cropping.
131130
TRADE AND POVERTY REDUCTION: NEW EVIDENCE OF IMPACTS IN DEVELOPING COUNTRIESTRADE AND POVERTY REDUCTION: NEW EVIDENCE OF IMPACTS IN DEVELOPING COUNTRIES
ReferencesAbbott, P., J. Bentzen and F. Tarp (2009). Trade and Development: Lessons from Vietnam’s Past Trade Agreements.
World Development 37(2), pp. 341-353.
Achen, H. (1982). Interpreting and using regression. SAGE Publications Ltd., United Kingdom.
Amemiya, T. (1977). The maximum likelihood estimator and the nonlinear three stage least squares estimator in the
general nonlinear simultaneous Equation model. Econometrica 45, pp. 995-968.
Banks, J., R. Blundell and A. Brugiavini (2001). Risk Pooling, Precautionary Saving and Consumption Growth. Review of
Economic Studies, Wiley Blackwell, vol. 68(4), pages 757-79, October.
Barrientos, A. (2013). Does vulnerability create poverty traps? In Chronic Poverty (pp. 85-111). Palgrave Macmillan UK.
Blundell, R., and T. Stoker (1999). Consumption and the timing of in-come risk. European Economic Review, Elsevier, vol.
43(3), pages 475-507, March.
Calvo, C., and S. Dercon (2007). Vulnerability to poverty. CSAE WPS 2007-03, Oxford: University of Oxford.
Carroll, C., and A. Samwick (1997). The nature of precautionary wealth. Journal of Monetary Economics 40(1), pp. 41-71.
Carroll, C. and A. Samwick (1998). How Important Is Precautionary Saving? The Review of Economics and Statistics 80(3),
pp. 410-419.
Carter, M. R. and C. B. Barrett (2006). The economics of poverty traps and persistent poverty: An asset based approach.
Journal of Development Studies 42, 178-199.
Chaudhuri, S. (2003) Assessing vulnerability to poverty: concepts, empirical methods and illustrative examples. New York:
Mimeo, Department of Economics, Columbia University.
Chaudhuri, S. and G. Datt (2001). Assessing Household Vulnerability to Poverty: a Methodology and Estimates for the
Philippines. World Bank Draft.
Chaudhuri, S., J. Jalan and A. Suryahadi (2002). Assessing Household Vulnerability to Poverty from Cross-sectional
Data: A Methodology and Estimates from Indonesia, (mimeo), Department of Economics, Columbia University:
New York.
Christiaensen, L. and K. Subbarao (2005). Towards an Understanding of Household Vulnerability in Rural Kenya. Journal
of African Economies 14(4), pages 520-558.
Coello, B., M. Fall and A. Suwa-Eisenmann (2010). Trade liberalization and poverty dynamics in Vietnam 2002-2006. PSE
Working Papers, HAL.
Dercon, S. (2001). Assessing Vulnerability to Poverty. Oxford: Mimeo, Jesus College and CSAE, Department of Economics,
Oxford University.
Dercon, S. (2005). Risk, Insurance, and Poverty: A Review. In: Dercon, S. (ed.), Insurance against Poverty, Oxford University
Press.
Dercon, S., and L. Christiaensen (2011). Consumption risk, technology adoption and poverty traps: Evidence from
Ethiopia. Journal of Development Economics 96 (2), 159-173.
133132
TRADE AND POVERTY REDUCTION: NEW EVIDENCE OF IMPACTS IN DEVELOPING COUNTRIESTRADE AND POVERTY REDUCTION: NEW EVIDENCE OF IMPACTS IN DEVELOPING COUNTRIES
Elbers, C., J. W. Gunning and B. Kinsey (2007). Growth and Risk: Methodology and Micro Evidence, World Bank Economic
Review, Oxford University Press, 21(1), pp. 1-20.
Foster, J., J. Greer and E. Thorbecke (1984). A class of decomposable poverty measures. Econometrica 52(3), 761-766.
Fritzen, S. (2002). Growth, inequality and the future of poverty reduction in Vietnam. Journal of Asian Economics 13, pp.
653-657.
Fujii, T., and D. Roland-Holst (2008). How Does Vietnam’s Accession to the World Trade Organization Change the Spatial
Incidence of Poverty? In: Globalization and the Poor in Asia (pp. 47-89). Palgrave Macmillan UK.
Giles, J. and K. Yoo (2007). Precautionary Behavior, Migrant Networks, and Household Consumption Decisions: An
Empirical Analysis Using Household Panel Data from Rural China. The Review of Economics and Statistics 89
(3), pp. 534-551.
Gourinchas, P. and J. Parker (2002). Consumption Over the Life Cycle. Econometrica 70(1), pp. 47-89.
Guiso, L., T. Jappelli and D. Terlizzese (1992). Earnings uncertainty and precautionary saving. Journal of Monetary
Economics 30, 307-337.
Gunther, I., and K. Harttgen (2009). Estimating Households Vulnerability to Idiosyncratic and Covariate Shocks: A Novel
Method Applied in Madagascar. World Development 37(7), pp. 1222-1234.
Ha, D., and G. Shively (2008). Coffee Boom, Coffee Bust and Smallholder Response in Vietnam’s Central Highlands.
Review of Development Economics 12(2), pages 312-326.
Heo, Y. and N.K. Doanh (2009). Trade Liberalisation and Poverty Reduction in Vietnam. The World Economy 32(6), pp.
934-964.
Hubbard, R., J. Skinner and S. P. Zeldes (1994) Expanding the Life-Cycle Model: Precautionary Saving and Public Policy,
American Eco¬nomic Review, 84(2), pp. 174-79.
Imai K., R. Gaiha and W. Kang (2011). Vulnerability and poverty dynamics in Vietnam. Applied Economics 43(25),
pp. 3603-3618.
Irvin, G. (1997). Vietnam: Adjustment, Growth and Poverty. Journal of International Development 9 (September),
pp. 783-801.
Jalan, J., and M. Ravallion (2001). Behavioral responses to risk in rural China. Journal of Development Economics, 66(1),
pp. 23-49.
Jenkins, R. (2004). Vietnam in the Global Economy: Trade, Employment and Poverty. Journal of International
Development, 1613-28.
Jensen H.T. and F. Tarp (2005). Trade Liberalization and Spatial Inequality: a Methodological Innovation in a Vietnamese
Perspective. Review of Development Economics 9(1), pp. 69-86.
Kamanou, G. and J. Morduch (2004). Measuring Vulnerability to Poverty. In Dercon, S. (ed.), Insurance against Poverty,
Oxford University Press.
Le, H. and A. Booth (2010). Urban-Rural Living Standard Inequality in Vietnam, 1993-2006. Mimeo.
133132
TRADE AND POVERTY REDUCTION: NEW EVIDENCE OF IMPACTS IN DEVELOPING COUNTRIESTRADE AND POVERTY REDUCTION: NEW EVIDENCE OF IMPACTS IN DEVELOPING COUNTRIES
McCulloch, N., L. A. Winters and X. Cirera (2001). Trade liberalization and poverty: a handbook. London, Centre of
Economic Policy Research
Meghir, C. and L. Pistaferri (2004). Income Variance Dynamics and Heterogeneity. Econometrica, Econometric Society,
72(1), pages 1-32.
Montalbano, P. (2011). Trade Openness and Developing Countries’ Vulnerability: Concepts, Misconceptions, and
Directions for Research. World Development 39(9), pp. 1489-1502.
Nakata, H., Y. Sawada and M. Tanaka (2009). Asking retrospective questions in household surveys: evidence from
Vietnam. Discussion Paper Series 10-E-008. Tokyo: RIETI.
Nadvi, K., J.T. Thoburn, B.T. Thang, N. Ha, N. Hoa, D. Le and E. De Armas (2004). Vietnam in the global garment and
textile value chain: impacts on firms and workers. Journal of International Development 16(1), pages 111-123.
Nguyen, T.D. and M. Ezaki (2005). Regional Economic Integration and its impacts on growth, poverty and income
distribution: the case of Vietnam. Review of Urban & Regional Development Studies 17: 197-215.
Niimi, Y, P.V. Dutta and L. A. Winters (2007). Trade liberalisation and poverty dynamics in Vietnam. Journal of Economic
Integration 22(4), 819-851.
Pham, T. H., and B. Reilly (2007). The gender pay gap in Vietnam, 1993–2002: A quantile regression approach. Journal
of Asian Economics 18(5), 775-808.
Pritchett, L., S. Sumarto and A. Suryahadi (2000). Quantifying Vulnerability to Poverty: A Proposed Measure with
Application to Indonesia, World Bank Policy Research Department Working Paper No.2437, World Bank:
Washington DC.
Skinner, J. (1988). Risky income, life-cycle consumption and precautionary saving. Journal of Monetary Economics 22,
237-255.
Storesletten, K., C. Telmer and Y. Amir (2004). Consumption and risk sharing over the life cycle. Journal of Monetary
Economics Elsevier, vol. 51(3), pages 609-633, April.
Thanh, V. T., and N. A. Duong (2009). Vietnam after two years of WTO accession: What lessons can be learnt?. ASEAN
Economic Bulletin 26(1), 115-135.
van de Walle, D. and D. Cratty (2004). Is the emerging non-farm market economy the route out of poverty in Vietnam?
The Economics of Transition, The European Bank for Reconstruction and Development, 12(2), pp. 237-274.
Winters, L. A. (2002). Trade liberalisation and poverty: what are the links?. The World Economy 25(9), 1339-1367.
Winters, L. A. (2004). Trade liberalisation and economic performance: an overview. The Economic Journal 114, F4-F21.
Winters, L. A., N. McCulloch and A. McKay (2004). Trade liberalization and poverty: the evidence so far. Journal of
Economic Literature 42(1), 72-115.
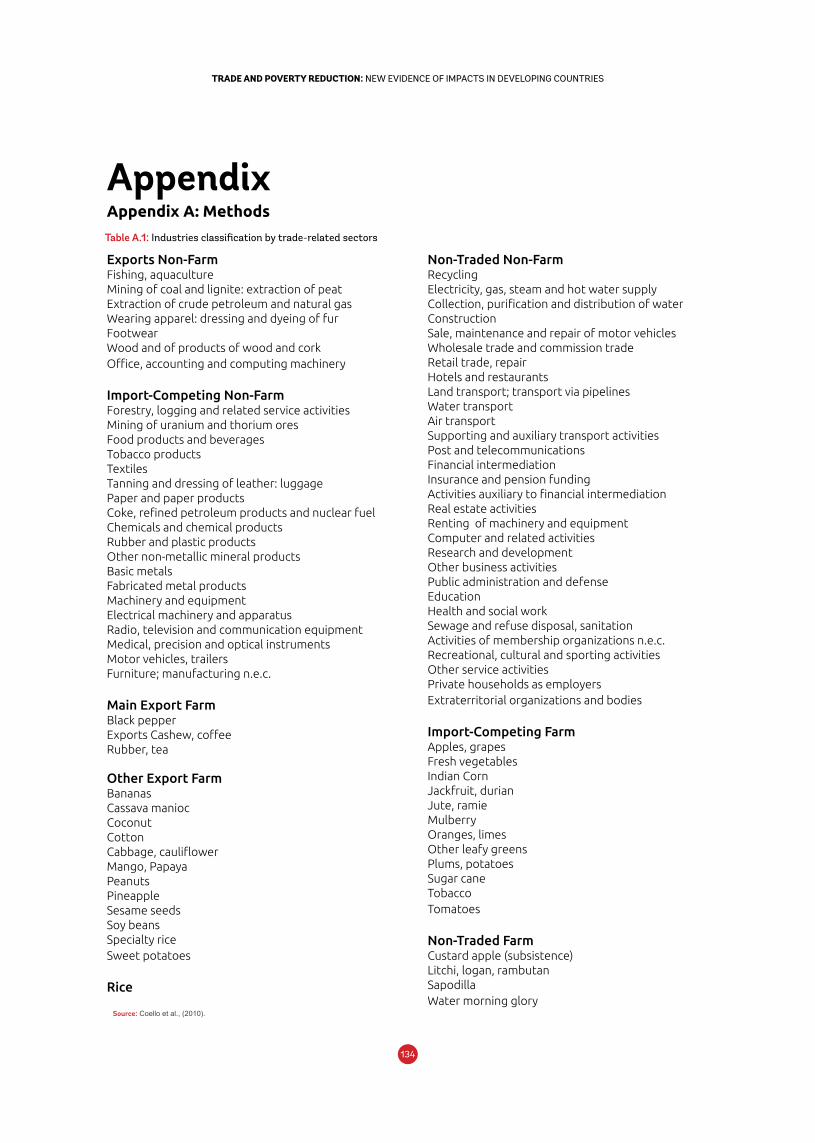
135134
TRADE AND POVERTY REDUCTION: NEW EVIDENCE OF IMPACTS IN DEVELOPING COUNTRIESTRADE AND POVERTY REDUCTION: NEW EVIDENCE OF IMPACTS IN DEVELOPING COUNTRIES
Appendix A: Methods
Table A.1: Industries classification by trade-related sectors
Appendix
Source: Coello et al., (2010).
Exports Non-FarmFishing, aquacultureMining of coal and lignite: extraction of peatExtraction of crude petroleum and natural gasWearing apparel: dressing and dyeing of furFootwearWood and of products of wood and corkOffice, accounting and computing machinery
Import-Competing Non-FarmForestry, logging and related service activitiesMining of uranium and thorium oresFood products and beveragesTobacco productsTextilesTanning and dressing of leather: luggagePaper and paper productsCoke, refined petroleum products and nuclear fuelChemicals and chemical productsRubber and plastic productsOther non-metallic mineral productsBasic metalsFabricated metal productsMachinery and equipmentElectrical machinery and apparatusRadio, television and communication equipmentMedical, precision and optical instrumentsMotor vehicles, trailersFurniture; manufacturing n.e.c.
Main Export FarmBlack pepperExports Cashew, coffeeRubber, tea
Other Export FarmBananasCassava maniocCoconutCottonCabbage, cauliflowerMango, PapayaPeanutsPineappleSesame seedsSoy beansSpecialty riceSweet potatoes
Rice
Non-Traded Non-FarmRecyclingElectricity, gas, steam and hot water supplyCollection, purification and distribution of waterConstructionSale, maintenance and repair of motor vehiclesWholesale trade and commission tradeRetail trade, repairHotels and restaurantsLand transport; transport via pipelinesWater transportAir transportSupporting and auxiliary transport activitiesPost and telecommunicationsFinancial intermediationInsurance and pension fundingActivities auxiliary to financial intermediationReal estate activitiesRenting of machinery and equipmentComputer and related activitiesResearch and developmentOther business activitiesPublic administration and defenseEducationHealth and social workSewage and refuse disposal, sanitationActivities of membership organizations n.e.c.Recreational, cultural and sporting activitiesOther service activitiesPrivate households as employersExtraterritorial organizations and bodies
Import-Competing FarmApples, grapesFresh vegetablesIndian CornJackfruit, durianJute, ramieMulberryOranges, limes Other leafy greensPlums, potatoesSugar caneTobaccoTomatoes
Non-Traded FarmCustard apple (subsistence)Litchi, logan, rambutanSapodillaWater morning glory
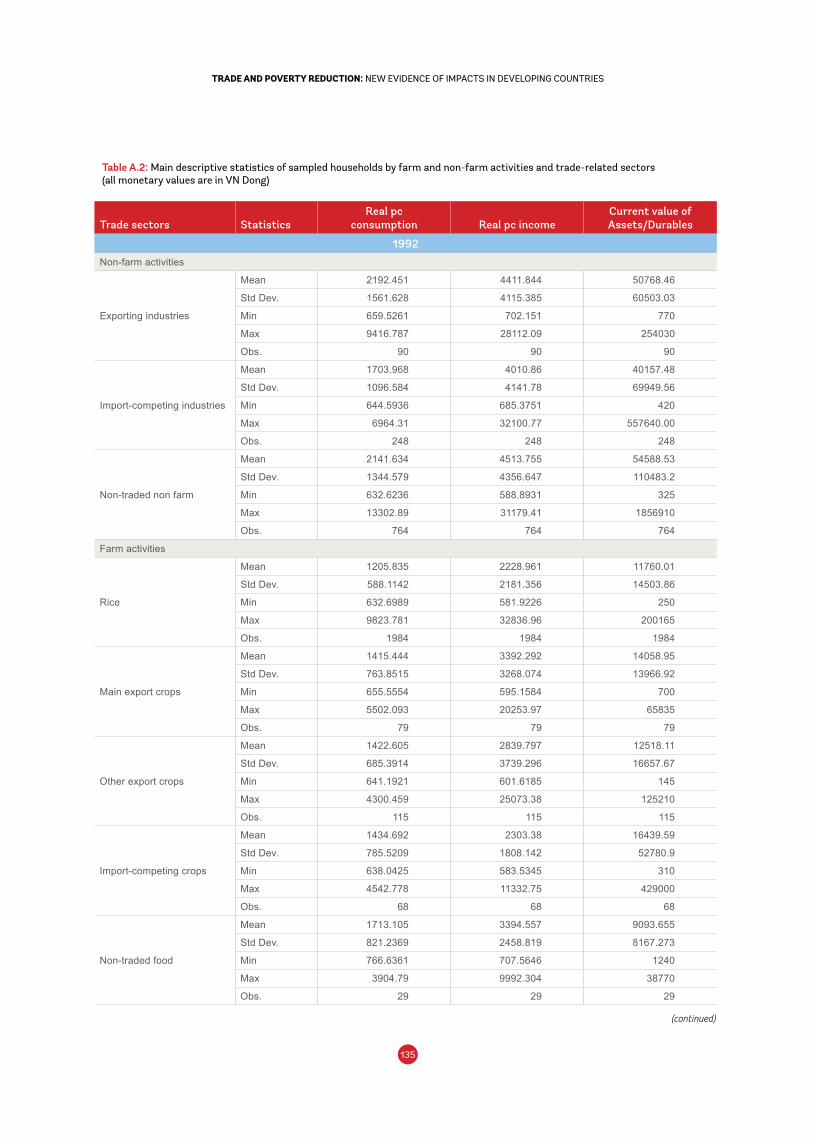
135134
TRADE AND POVERTY REDUCTION: NEW EVIDENCE OF IMPACTS IN DEVELOPING COUNTRIESTRADE AND POVERTY REDUCTION: NEW EVIDENCE OF IMPACTS IN DEVELOPING COUNTRIES
Table A.2: Main descriptive statistics of sampled households by farm and non-farm activities and trade-related sectors (all monetary values are in VN Dong)
Trade sectors StatisticsReal pc
consumption Real pc income Current value of Assets/Durables
1992Non-farm activities
Mean 2192.451 4411.844 50768.46
Std Dev. 1561.628 4115.385 60503.03
Exporting industries Min 659.5261 702.151 770
Max 9416.787 28112.09 254030
Obs. 90 90 90
Mean 1703.968 4010.86 40157.48
Std Dev. 1096.584 4141.78 69949.56
Import-competing industries Min 644.5936 685.3751 420
Max 6964.31 32100.77 557640.00
Obs. 248 248 248
Mean 2141.634 4513.755 54588.53
Std Dev. 1344.579 4356.647 110483.2
Non-traded non farm Min 632.6236 588.8931 325
Max 13302.89 31179.41 1856910
Obs. 764 764 764
Farm activities
Mean 1205.835 2228.961 11760.01
Std Dev. 588.1142 2181.356 14503.86
Rice Min 632.6989 581.9226 250
Max 9823.781 32836.96 200165
Obs. 1984 1984 1984
Mean 1415.444 3392.292 14058.95
Std Dev. 763.8515 3268.074 13966.92
Main export crops Min 655.5554 595.1584 700
Max 5502.093 20253.97 65835
Obs. 79 79 79
Mean 1422.605 2839.797 12518.11
Std Dev. 685.3914 3739.296 16657.67
Other export crops Min 641.1921 601.6185 145
Max 4300.459 25073.38 125210
Obs. 115 115 115
Mean 1434.692 2303.38 16439.59
Std Dev. 785.5209 1808.142 52780.9
Import-competing crops Min 638.0425 583.5345 310
Max 4542.778 11332.75 429000
Obs. 68 68 68
Mean 1713.105 3394.557 9093.655
Std Dev. 821.2369 2458.819 8167.273
Non-traded food Min 766.6361 707.5646 1240
Max 3904.79 9992.304 38770
Obs. 29 29 29
(continued)
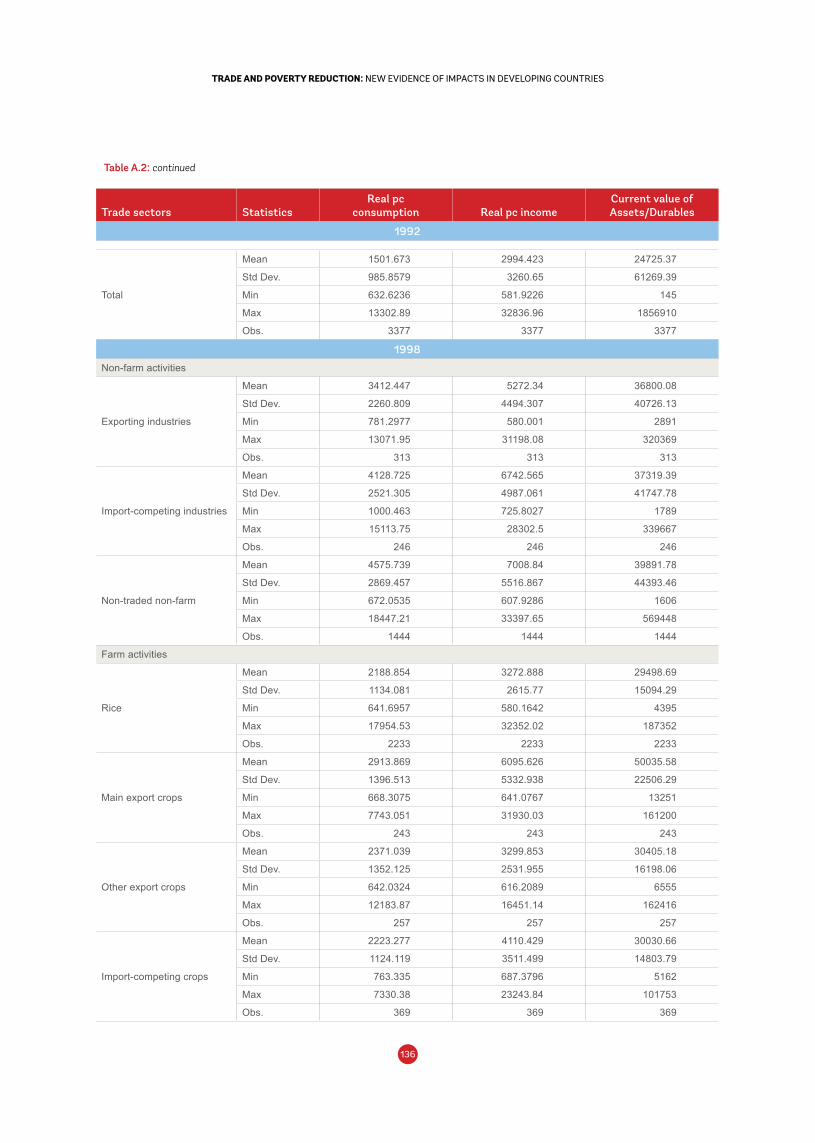
137136
TRADE AND POVERTY REDUCTION: NEW EVIDENCE OF IMPACTS IN DEVELOPING COUNTRIESTRADE AND POVERTY REDUCTION: NEW EVIDENCE OF IMPACTS IN DEVELOPING COUNTRIES
Mean 1501.673 2994.423 24725.37
Std Dev. 985.8579 3260.65 61269.39
Total Min 632.6236 581.9226 145
Max 13302.89 32836.96 1856910
Obs. 3377 3377 3377
1998
Non-farm activities
Mean 3412.447 5272.34 36800.08
Std Dev. 2260.809 4494.307 40726.13
Exporting industries Min 781.2977 580.001 2891
Max 13071.95 31198.08 320369
Obs. 313 313 313
Mean 4128.725 6742.565 37319.39
Std Dev. 2521.305 4987.061 41747.78
Import-competing industries Min 1000.463 725.8027 1789
Max 15113.75 28302.5 339667
Obs. 246 246 246
Mean 4575.739 7008.84 39891.78
Std Dev. 2869.457 5516.867 44393.46
Non-traded non-farm Min 672.0535 607.9286 1606
Max 18447.21 33397.65 569448
Obs. 1444 1444 1444
Farm activities
Mean 2188.854 3272.888 29498.69
Std Dev. 1134.081 2615.77 15094.29
Rice Min 641.6957 580.1642 4395
Max 17954.53 32352.02 187352
Obs. 2233 2233 2233
Mean 2913.869 6095.626 50035.58
Std Dev. 1396.513 5332.938 22506.29
Main export crops Min 668.3075 641.0767 13251
Max 7743.051 31930.03 161200
Obs. 243 243 243
Mean 2371.039 3299.853 30405.18
Std Dev. 1352.125 2531.955 16198.06
Other export crops Min 642.0324 616.2089 6555
Max 12183.87 16451.14 162416
Obs. 257 257 257
Mean 2223.277 4110.429 30030.66
Std Dev. 1124.119 3511.499 14803.79
Import-competing crops Min 763.335 687.3796 5162
Max 7330.38 23243.84 101753
Obs. 369 369 369
Table A.2: continued
Trade sectors StatisticsReal pc
consumption Real pc income Current value of Assets/Durables
1992
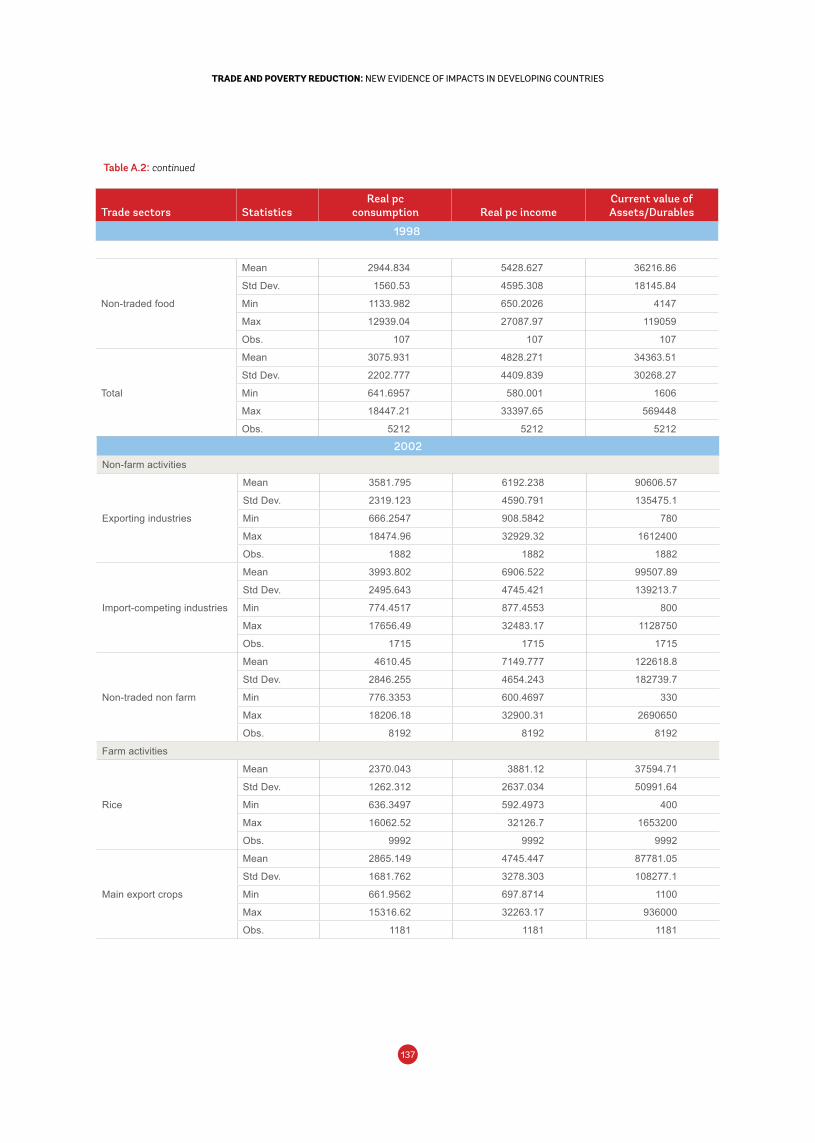
137136
TRADE AND POVERTY REDUCTION: NEW EVIDENCE OF IMPACTS IN DEVELOPING COUNTRIESTRADE AND POVERTY REDUCTION: NEW EVIDENCE OF IMPACTS IN DEVELOPING COUNTRIES
Mean 2944.834 5428.627 36216.86
Std Dev. 1560.53 4595.308 18145.84
Non-traded food Min 1133.982 650.2026 4147
Max 12939.04 27087.97 119059
Obs. 107 107 107
Mean 3075.931 4828.271 34363.51
Std Dev. 2202.777 4409.839 30268.27
Total Min 641.6957 580.001 1606
Max 18447.21 33397.65 569448
Obs. 5212 5212 5212
Table A.2: continued
Trade sectors StatisticsReal pc
consumption Real pc income Current value of Assets/Durables
1998
2002
Non-farm activities
Mean 3581.795 6192.238 90606.57
Std Dev. 2319.123 4590.791 135475.1
Exporting industries Min 666.2547 908.5842 780
Max 18474.96 32929.32 1612400
Obs. 1882 1882 1882
Mean 3993.802 6906.522 99507.89
Std Dev. 2495.643 4745.421 139213.7
Import-competing industries Min 774.4517 877.4553 800
Max 17656.49 32483.17 1128750
Obs. 1715 1715 1715
Mean 4610.45 7149.777 122618.8
Std Dev. 2846.255 4654.243 182739.7
Non-traded non farm Min 776.3353 600.4697 330
Max 18206.18 32900.31 2690650
Obs. 8192 8192 8192
Farm activities
Mean 2370.043 3881.12 37594.71
Std Dev. 1262.312 2637.034 50991.64
Rice Min 636.3497 592.4973 400
Max 16062.52 32126.7 1653200
Obs. 9992 9992 9992
Mean 2865.149 4745.447 87781.05
Std Dev. 1681.762 3278.303 108277.1
Main export crops Min 661.9562 697.8714 1100
Max 15316.62 32263.17 936000
Obs. 1181 1181 1181
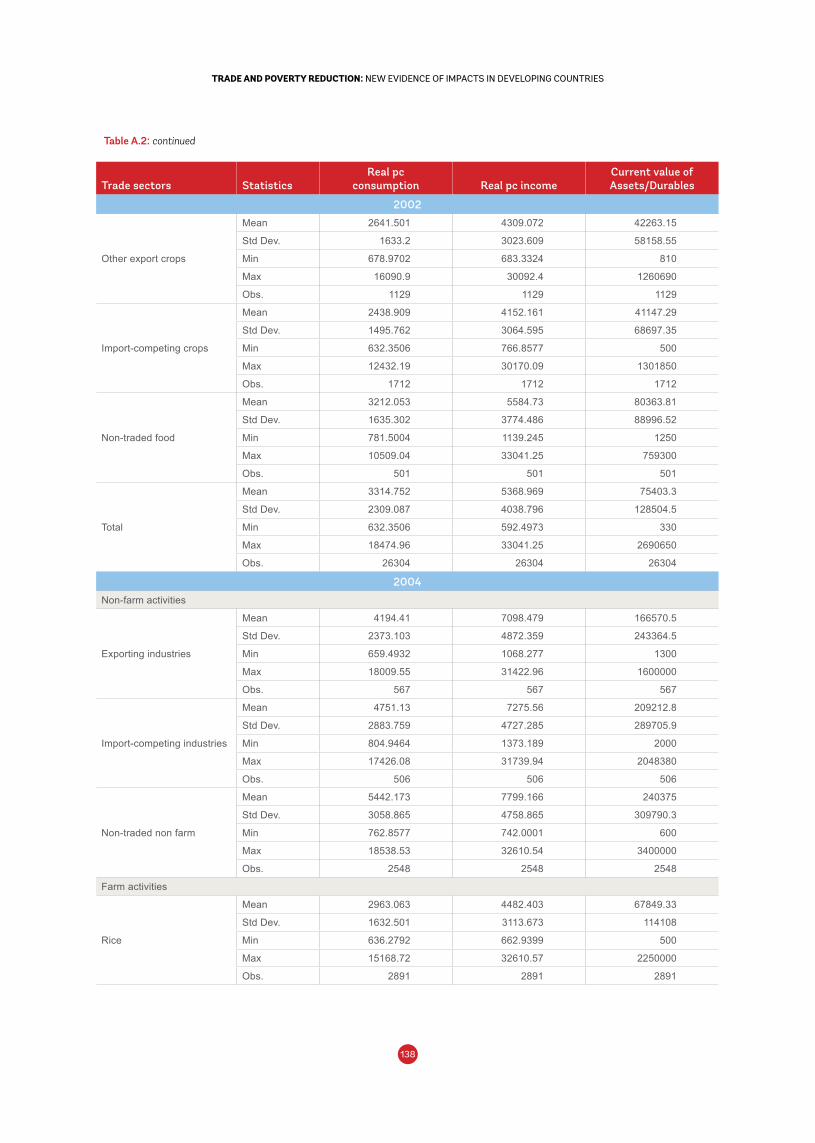
139138
TRADE AND POVERTY REDUCTION: NEW EVIDENCE OF IMPACTS IN DEVELOPING COUNTRIESTRADE AND POVERTY REDUCTION: NEW EVIDENCE OF IMPACTS IN DEVELOPING COUNTRIES
Mean 2641.501 4309.072 42263.15
Std Dev. 1633.2 3023.609 58158.55
Other export crops Min 678.9702 683.3324 810
Max 16090.9 30092.4 1260690
Obs. 1129 1129 1129
Mean 2438.909 4152.161 41147.29
Std Dev. 1495.762 3064.595 68697.35
Import-competing crops Min 632.3506 766.8577 500
Max 12432.19 30170.09 1301850
Obs. 1712 1712 1712
Mean 3212.053 5584.73 80363.81
Std Dev. 1635.302 3774.486 88996.52
Non-traded food Min 781.5004 1139.245 1250
Max 10509.04 33041.25 759300
Obs. 501 501 501
Mean 3314.752 5368.969 75403.3
Std Dev. 2309.087 4038.796 128504.5
Total Min 632.3506 592.4973 330
Max 18474.96 33041.25 2690650
Obs. 26304 26304 26304
2004
Non-farm activities
Mean 4194.41 7098.479 166570.5
Std Dev. 2373.103 4872.359 243364.5
Exporting industries Min 659.4932 1068.277 1300
Max 18009.55 31422.96 1600000
Obs. 567 567 567
Mean 4751.13 7275.56 209212.8
Std Dev. 2883.759 4727.285 289705.9
Import-competing industries Min 804.9464 1373.189 2000
Max 17426.08 31739.94 2048380
Obs. 506 506 506
Mean 5442.173 7799.166 240375
Std Dev. 3058.865 4758.865 309790.3
Non-traded non farm Min 762.8577 742.0001 600
Max 18538.53 32610.54 3400000
Obs. 2548 2548 2548
Farm activities
Mean 2963.063 4482.403 67849.33
Std Dev. 1632.501 3113.673 114108
Rice Min 636.2792 662.9399 500
Max 15168.72 32610.57 2250000
Obs. 2891 2891 2891
Table A.2: continued
Trade sectors StatisticsReal pc
consumption Real pc income Current value of Assets/Durables
2002
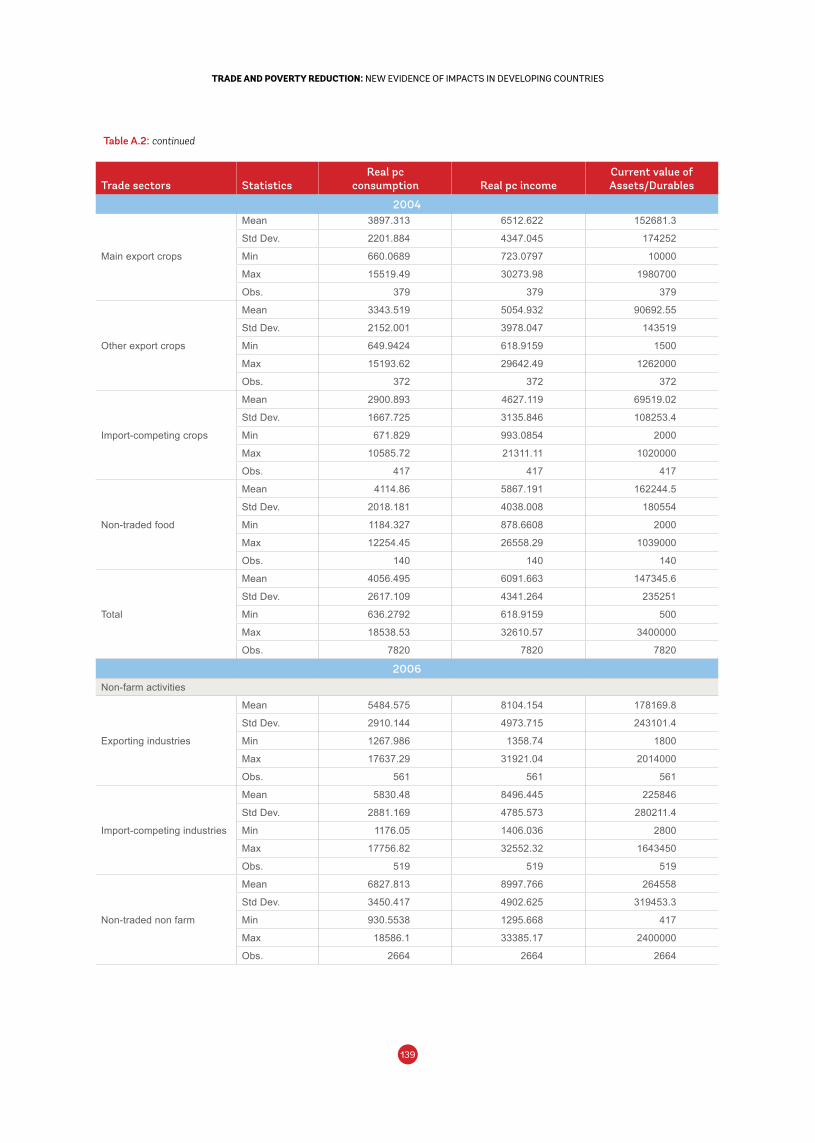
139138
TRADE AND POVERTY REDUCTION: NEW EVIDENCE OF IMPACTS IN DEVELOPING COUNTRIESTRADE AND POVERTY REDUCTION: NEW EVIDENCE OF IMPACTS IN DEVELOPING COUNTRIES
Mean 3897.313 6512.622 152681.3
Std Dev. 2201.884 4347.045 174252
Main export crops Min 660.0689 723.0797 10000
Max 15519.49 30273.98 1980700
Obs. 379 379 379
Mean 3343.519 5054.932 90692.55
Std Dev. 2152.001 3978.047 143519
Other export crops Min 649.9424 618.9159 1500
Max 15193.62 29642.49 1262000
Obs. 372 372 372
Mean 2900.893 4627.119 69519.02
Std Dev. 1667.725 3135.846 108253.4
Import-competing crops Min 671.829 993.0854 2000
Max 10585.72 21311.11 1020000
Obs. 417 417 417
Mean 4114.86 5867.191 162244.5
Std Dev. 2018.181 4038.008 180554
Non-traded food Min 1184.327 878.6608 2000
Max 12254.45 26558.29 1039000
Obs. 140 140 140
Mean 4056.495 6091.663 147345.6
Std Dev. 2617.109 4341.264 235251
Total Min 636.2792 618.9159 500
Max 18538.53 32610.57 3400000
Obs. 7820 7820 7820
2006
Non-farm activities
Mean 5484.575 8104.154 178169.8
Std Dev. 2910.144 4973.715 243101.4
Exporting industries Min 1267.986 1358.74 1800
Max 17637.29 31921.04 2014000
Obs. 561 561 561
Mean 5830.48 8496.445 225846
Std Dev. 2881.169 4785.573 280211.4
Import-competing industries Min 1176.05 1406.036 2800
Max 17756.82 32552.32 1643450
Obs. 519 519 519
Mean 6827.813 8997.766 264558
Std Dev. 3450.417 4902.625 319453.3
Non-traded non farm Min 930.5538 1295.668 417
Max 18586.1 33385.17 2400000
Obs. 2664 2664 2664
Table A.2: continued
Trade sectors StatisticsReal pc
consumption Real pc income Current value of Assets/Durables
2004
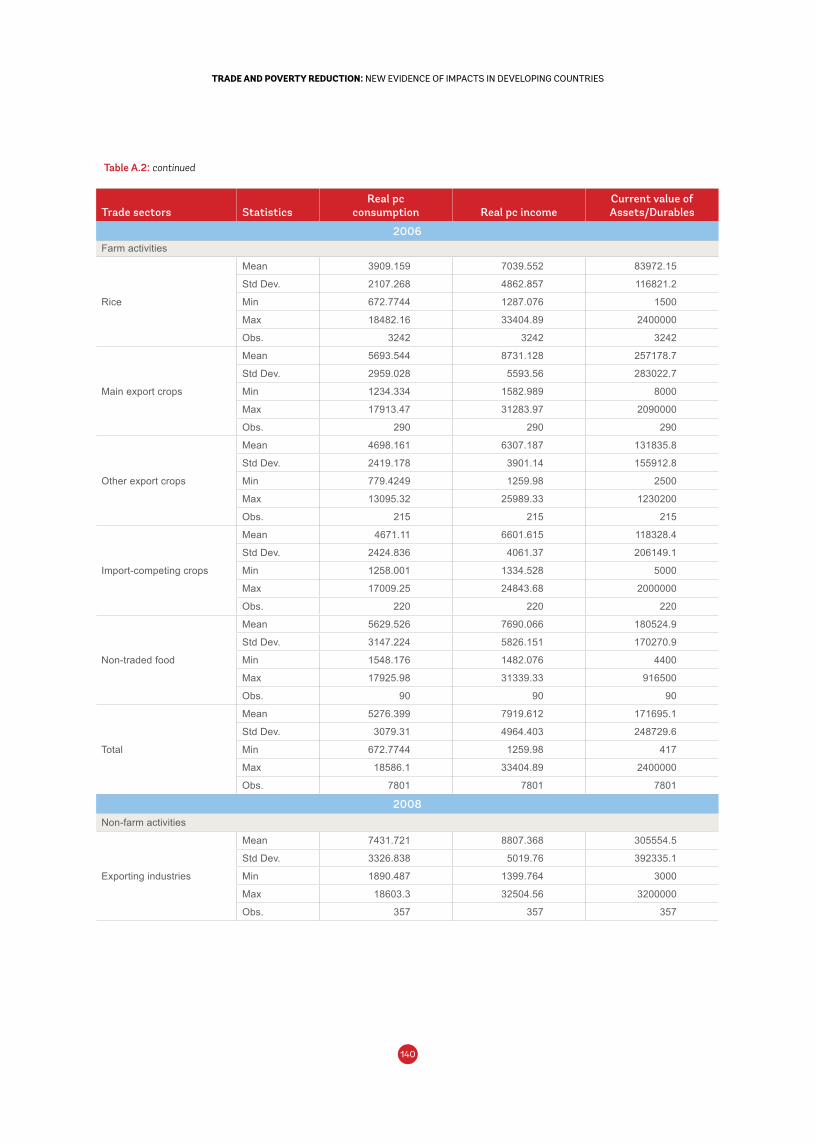
141140
TRADE AND POVERTY REDUCTION: NEW EVIDENCE OF IMPACTS IN DEVELOPING COUNTRIESTRADE AND POVERTY REDUCTION: NEW EVIDENCE OF IMPACTS IN DEVELOPING COUNTRIES
Farm activities
Mean 3909.159 7039.552 83972.15
Std Dev. 2107.268 4862.857 116821.2
Rice Min 672.7744 1287.076 1500
Max 18482.16 33404.89 2400000
Obs. 3242 3242 3242
Mean 5693.544 8731.128 257178.7
Std Dev. 2959.028 5593.56 283022.7
Main export crops Min 1234.334 1582.989 8000
Max 17913.47 31283.97 2090000
Obs. 290 290 290
Mean 4698.161 6307.187 131835.8
Std Dev. 2419.178 3901.14 155912.8
Other export crops Min 779.4249 1259.98 2500
Max 13095.32 25989.33 1230200
Obs. 215 215 215
Mean 4671.11 6601.615 118328.4
Std Dev. 2424.836 4061.37 206149.1
Import-competing crops Min 1258.001 1334.528 5000
Max 17009.25 24843.68 2000000
Obs. 220 220 220
Mean 5629.526 7690.066 180524.9
Std Dev. 3147.224 5826.151 170270.9
Non-traded food Min 1548.176 1482.076 4400
Max 17925.98 31339.33 916500
Obs. 90 90 90
Mean 5276.399 7919.612 171695.1
Std Dev. 3079.31 4964.403 248729.6
Total Min 672.7744 1259.98 417
Max 18586.1 33404.89 2400000
Obs. 7801 7801 7801
2008
Non-farm activities
Mean 7431.721 8807.368 305554.5
Std Dev. 3326.838 5019.76 392335.1
Exporting industries Min 1890.487 1399.764 3000
Max 18603.3 32504.56 3200000
Obs. 357 357 357
Table A.2: continued
Trade sectors StatisticsReal pc
consumption Real pc income Current value of Assets/Durables
2006
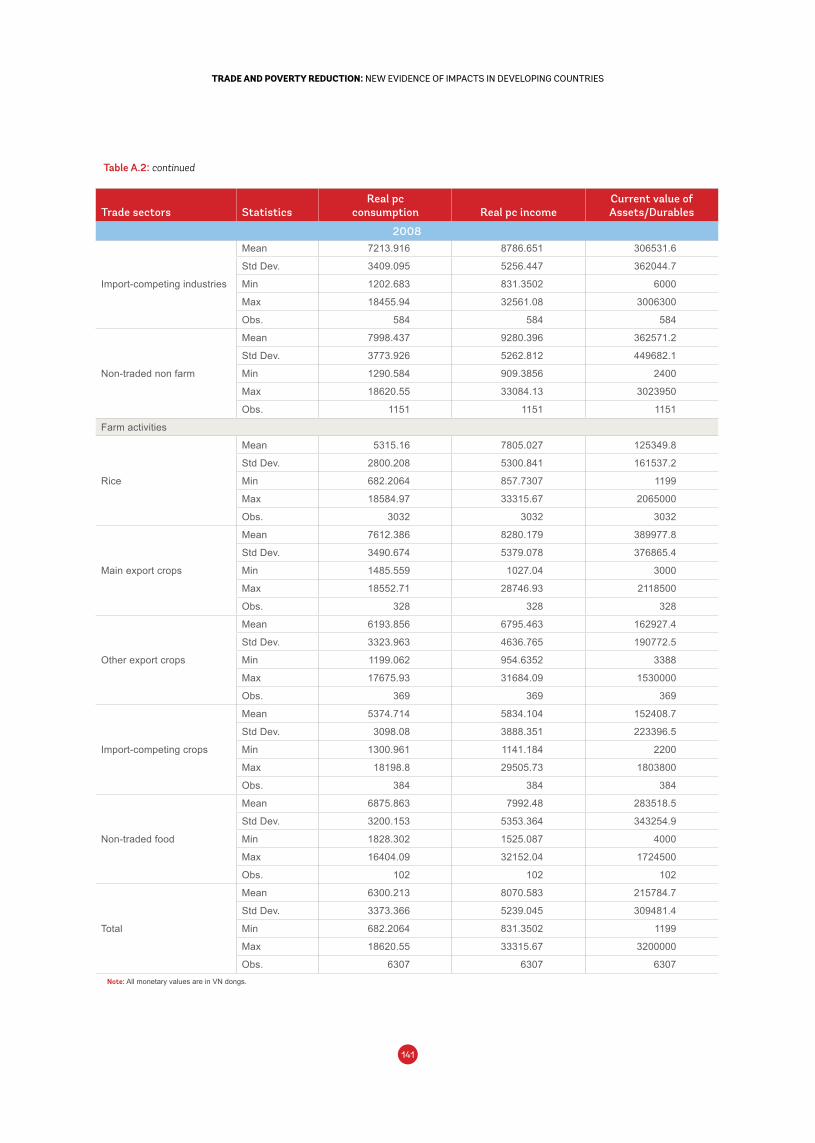
141140
TRADE AND POVERTY REDUCTION: NEW EVIDENCE OF IMPACTS IN DEVELOPING COUNTRIESTRADE AND POVERTY REDUCTION: NEW EVIDENCE OF IMPACTS IN DEVELOPING COUNTRIES
Mean 7213.916 8786.651 306531.6
Std Dev. 3409.095 5256.447 362044.7
Import-competing industries Min 1202.683 831.3502 6000
Max 18455.94 32561.08 3006300
Obs. 584 584 584
Mean 7998.437 9280.396 362571.2
Std Dev. 3773.926 5262.812 449682.1
Non-traded non farm Min 1290.584 909.3856 2400
Max 18620.55 33084.13 3023950
Obs. 1151 1151 1151
Farm activities
Mean 5315.16 7805.027 125349.8
Std Dev. 2800.208 5300.841 161537.2
Rice Min 682.2064 857.7307 1199
Max 18584.97 33315.67 2065000
Obs. 3032 3032 3032
Mean 7612.386 8280.179 389977.8
Std Dev. 3490.674 5379.078 376865.4
Main export crops Min 1485.559 1027.04 3000
Max 18552.71 28746.93 2118500
Obs. 328 328 328
Mean 6193.856 6795.463 162927.4
Std Dev. 3323.963 4636.765 190772.5
Other export crops Min 1199.062 954.6352 3388
Max 17675.93 31684.09 1530000
Obs. 369 369 369
Mean 5374.714 5834.104 152408.7
Std Dev. 3098.08 3888.351 223396.5
Import-competing crops Min 1300.961 1141.184 2200
Max 18198.8 29505.73 1803800
Obs. 384 384 384
Mean 6875.863 7992.48 283518.5
Std Dev. 3200.153 5353.364 343254.9
Non-traded food Min 1828.302 1525.087 4000
Max 16404.09 32152.04 1724500
Obs. 102 102 102
Mean 6300.213 8070.583 215784.7
Std Dev. 3373.366 5239.045 309481.4
Total Min 682.2064 831.3502 1199
Max 18620.55 33315.67 3200000
Obs. 6307 6307 6307Note: All monetary values are in VN dongs.
Table A.2: continued
Trade sectors StatisticsReal pc
consumption Real pc income Current value of Assets/Durables
2008
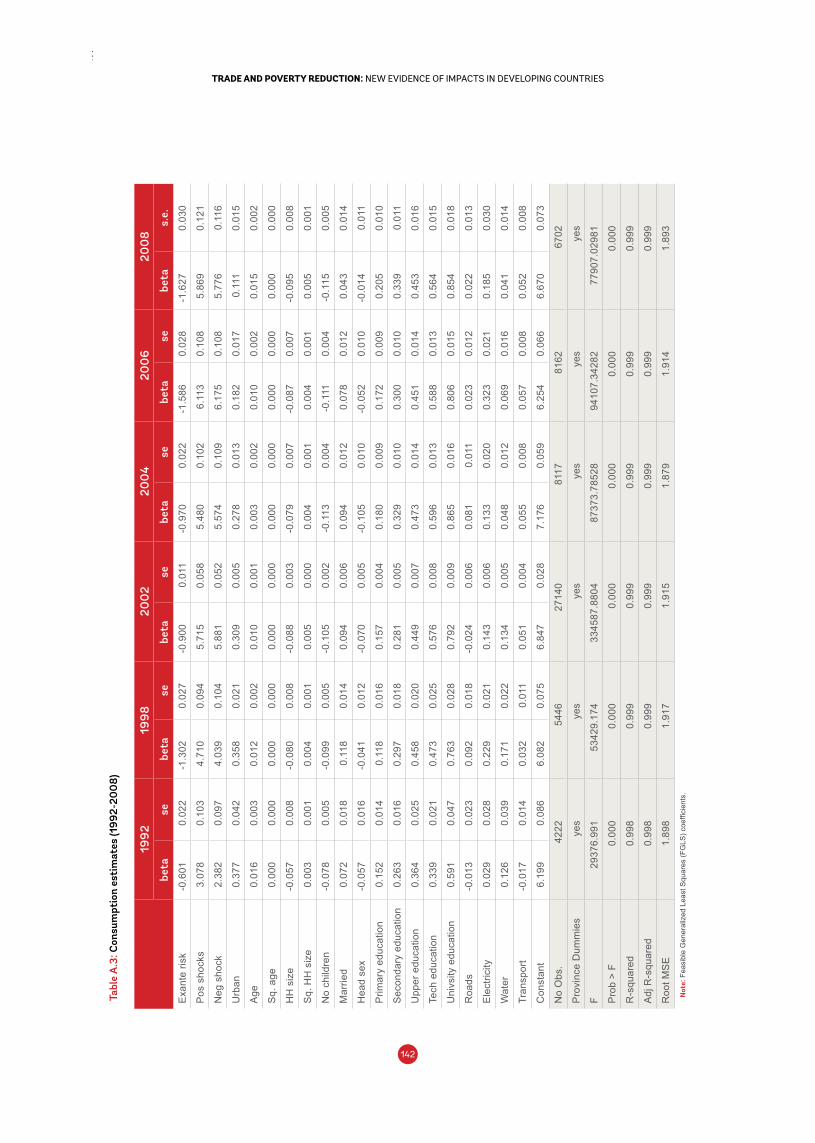
143142
TRADE AND POVERTY REDUCTION: NEW EVIDENCE OF IMPACTS IN DEVELOPING COUNTRIESTRADE AND POVERTY REDUCTION: NEW EVIDENCE OF IMPACTS IN DEVELOPING COUNTRIES
Tabl
e A
.3: C
onsu
mpt
ion
esti
mat
es (1
992-
200
8)
1992
1998
200
220
04
200
620
08
beta
sebe
tase
beta
sebe
tase
beta
sebe
tas.
e.
Exa
nte
risk
-0.6
010.
022
-1.3
020.
027
-0.9
000.
011
-0.9
700.
022
-1.5
860.
028
-1.6
270.
030
Pos
sho
cks
3.07
80.
103
4.71
00.
094
5.71
50.
058
5.48
00.
102
6.11
30.
108
5.86
90.
121
Neg
sho
ck
2.38
20.
097
4.03
90.
104
5.88
10.
052
5.57
40.
109
6.17
50.
108
5.77
60.
116
Urb
an0.
377
0.04
20.
358
0.02
10.
309
0.00
50.
278
0.01
30.
182
0.01
70.
111
0.01
5
Age
0.01
60.
003
0.01
20.
002
0.01
00.
001
0.00
30.
002
0.01
00.
002
0.01
50.
002
Sq.
age
0.00
00.
000
0.00
00.
000
0.00
00.
000
0.00
00.
000
0.00
00.
000
0.00
00.
000
HH
siz
e-0
.057
0.00
8-0
.080
0.00
8-0
.088
0.00
3-0
.079
0.00
7-0
.087
0.00
7-0
.095
0.00
8
Sq.
HH
siz
e0.
003
0.00
10.
004
0.00
10.
005
0.00
00.
004
0.00
10.
004
0.00
10.
005
0.00
1
No
child
ren
-0.0
780.
005
-0.0
990.
005
-0.1
050.
002
-0.1
130.
004
-0.1
110.
004
-0.1
150.
005
Mar
ried
0.07
20.
018
0.11
80.
014
0.09
40.
006
0.09
40.
012
0.07
80.
012
0.04
30.
014
Hea
d se
x -0
.057
0.01
6-0
.041
0.01
2-0
.070
0.00
5-0
.105
0.01
0-0
.052
0.01
0-0
.014
0.01
1
Prim
ary
educ
atio
n0.
152
0.01
40.
118
0.01
60.
157
0.00
40.
180
0.00
90.
172
0.00
90.
205
0.01
0
Sec
onda
ry e
duca
tion
0.26
30.
016
0.29
70.
018
0.28
10.
005
0.32
90.
010
0.30
00.
010
0.33
90.
011
Upp
er e
duca
tion
0.36
40.
025
0.45
80.
020
0.44
90.
007
0.47
30.
014
0.45
10.
014
0.45
30.
016
Tech
edu
catio
n0.
339
0.02
10.
473
0.02
50.
576
0.00
80.
596
0.01
30.
588
0.01
30.
564
0.01
5
Uni
vsity
edu
catio
n0.
591
0.04
70.
763
0.02
80.
792
0.00
90.
865
0.01
60.
806
0.01
50.
854
0.01
8
Roa
ds-0
.013
0.02
30.
092
0.01
8-0
.024
0.00
60.
081
0.01
10.
023
0.01
20.
022
0.01
3
Ele
ctric
ity0.
029
0.02
80.
229
0.02
10.
143
0.00
60.
133
0.02
00.
323
0.02
10.
185
0.03
0
Wat
er0.
126
0.03
90.
171
0.02
20.
134
0.00
50.
048
0.01
20.
069
0.01
60.
041
0.01
4
Tran
spor
t-0
.017
0.01
40.
032
0.01
10.
051
0.00
40.
055
0.00
80.
057
0.00
80.
052
0.00
8
Con
stan
t6.
199
0.08
66.
082
0.07
56.
847
0.02
87.
176
0.05
96.
254
0.06
66.
670
0.07
3
No
Obs
.42
2254
4627
140
8117
8162
6702
Pro
vinc
e D
umm
ies
yes
yes
yes
yes
yes
yes
F29
376.
991
5342
9.17
433
4587
.880
487
373.
7852
894
107.
3428
277
907.
0298
1
Pro
b >
F0.
000
0.00
00.
000
0.00
00.
000
0.00
0
R-s
quar
ed0.
998
0.99
90.
999
0.99
90.
999
0.99
9
Adj
R-s
quar
ed0.
998
0.99
90.
999
0.99
90.
999
0.99
9
Roo
t MS
E1.
898
1.91
71.
915
1.87
91.
914
1.89
3N
ote:
Fea
sibl
e G
ener
aliz
ed L
east
Squ
ares
(FG
LS) c
oeffi
cien
ts.
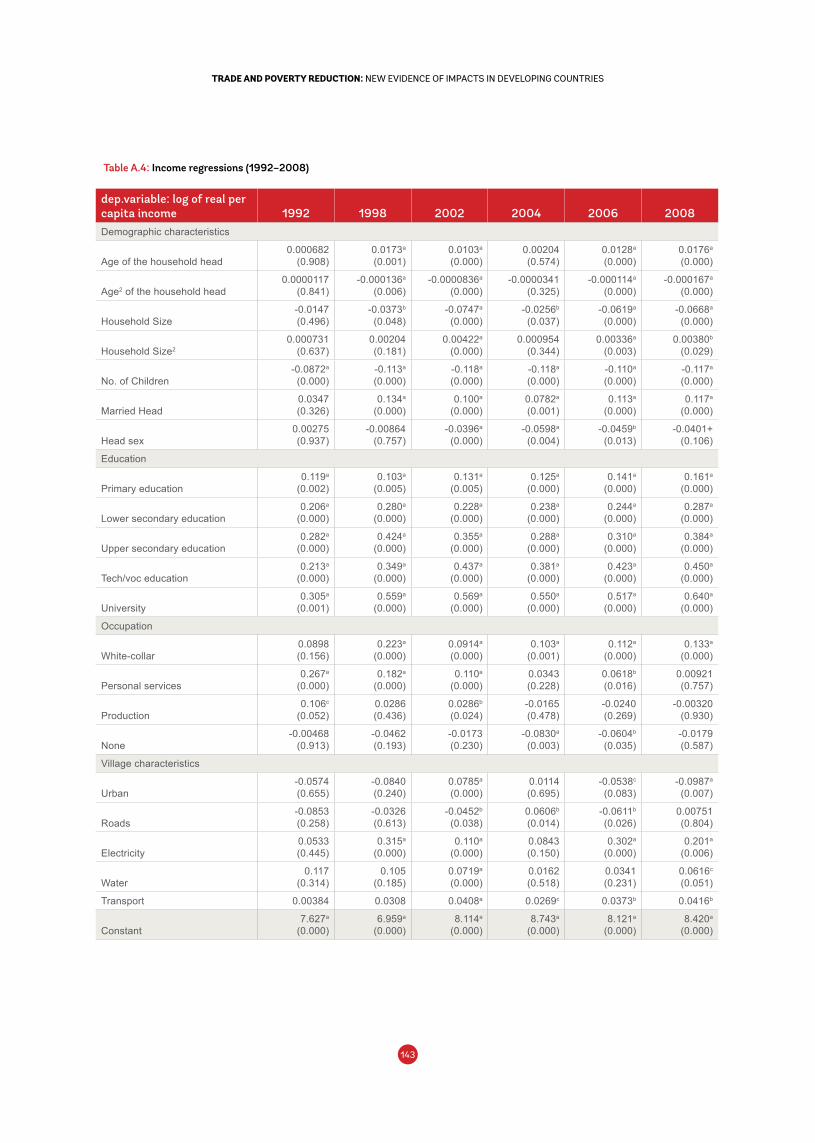
143142
TRADE AND POVERTY REDUCTION: NEW EVIDENCE OF IMPACTS IN DEVELOPING COUNTRIESTRADE AND POVERTY REDUCTION: NEW EVIDENCE OF IMPACTS IN DEVELOPING COUNTRIES
Table A.4: Income regressions (1992–2008)
dep.variable: log of real per capita income 1992 1998 2002 2004 2006 2008Demographic characteristics
Age of the household head0.000682
(0.908)0.0173a
(0.001)0.0103a
(0.000)0.00204(0.574)
0.0128a
(0.000)0.0176a
(0.000)
Age2 of the household head0.0000117
(0.841)-0.000136a
(0.006)-0.0000836a
(0.000)-0.0000341
(0.325)-0.000114a
(0.000)-0.000167a
(0.000)
Household Size-0.0147(0.496)
-0.0373b
(0.048)-0.0747a
(0.000)-0.0256b
(0.037)-0.0619a
(0.000)-0.0668a
(0.000)
Household Size20.000731
(0.637)0.00204(0.181)
0.00422a
(0.000)0.000954
(0.344)0.00336a
(0.003)0.00380b
(0.029)
No. of Children-0.0872a
(0.000)-0.113a
(0.000)-0.118a
(0.000)-0.118a
(0.000)-0.110a
(0.000)-0.117a
(0.000)
Married Head0.0347(0.326)
0.134a
(0.000)0.100a
(0.000)0.0782a
(0.001)0.113a
(0.000)0.117a
(0.000)
Head sex0.00275(0.937)
-0.00864(0.757)
-0.0396a
(0.000)-0.0598a
(0.004)-0.0459b
(0.013)-0.0401+
(0.106)
Education
Primary education0.119a
(0.002)0.103a
(0.005)0.131a
(0.005)0.125a
(0.000)0.141a
(0.000)0.161a
(0.000)
Lower secondary education0.206a
(0.000)0.280a
(0.000)0.228a
(0.000)0.238a
(0.000)0.244a
(0.000)0.287a
(0.000)
Upper secondary education0.282a
(0.000)0.424a
(0.000)0.355a
(0.000)0.288a
(0.000)0.310a
(0.000)0.384a
(0.000)
Tech/voc education0.213a
(0.000)0.349a
(0.000)0.437a
(0.000)0.381a
(0.000)0.423a
(0.000)0.450a
(0.000)
University0.305a
(0.001)0.559a
(0.000)0.569a
(0.000)0.550a
(0.000)0.517a
(0.000)0.640a
(0.000)
Occupation
White-collar0.0898(0.156)
0.223a
(0.000)0.0914a
(0.000)0.103a
(0.001)0.112a
(0.000)0.133a
(0.000)
Personal services0.267a
(0.000)0.182a
(0.000)0.110a
(0.000)0.0343(0.228)
0.0618b
(0.016)0.00921 (0.757)
Production0.106c
(0.052)0.0286(0.436)
0.0286b
(0.024)-0.0165(0.478)
-0.0240(0.269)
-0.00320 (0.930)
None-0.00468
(0.913)-0.0462(0.193)
-0.0173(0.230)
-0.0830a
(0.003)-0.0604b
(0.035)-0.0179 (0.587)
Village characteristics
Urban-0.0574(0.655)
-0.0840(0.240)
0.0785a
(0.000)0.0114(0.695)
-0.0538c
(0.083)-0.0987a
(0.007)
Roads-0.0853(0.258)
-0.0326(0.613)
-0.0452b
(0.038)0.0606b
(0.014)-0.0611b
(0.026)0.00751 (0.804)
Electricity0.0533(0.445)
0.315a
(0.000)0.110a
(0.000)0.0843(0.150)
0.302a
(0.000)0.201a
(0.006)
Water0.117
(0.314)0.105
(0.185)0.0719a
(0.000)0.0162(0.518)
0.0341(0.231)
0.0616c (0.051)
Transport 0.00384 0.0308 0.0408a 0.0269c 0.0373b 0.0416b
Constant7.627a
(0.000)6.959a
(0.000)8.114a
(0.000)8.743a
(0.000)8.121a
(0.000)8.420a
(0.000)
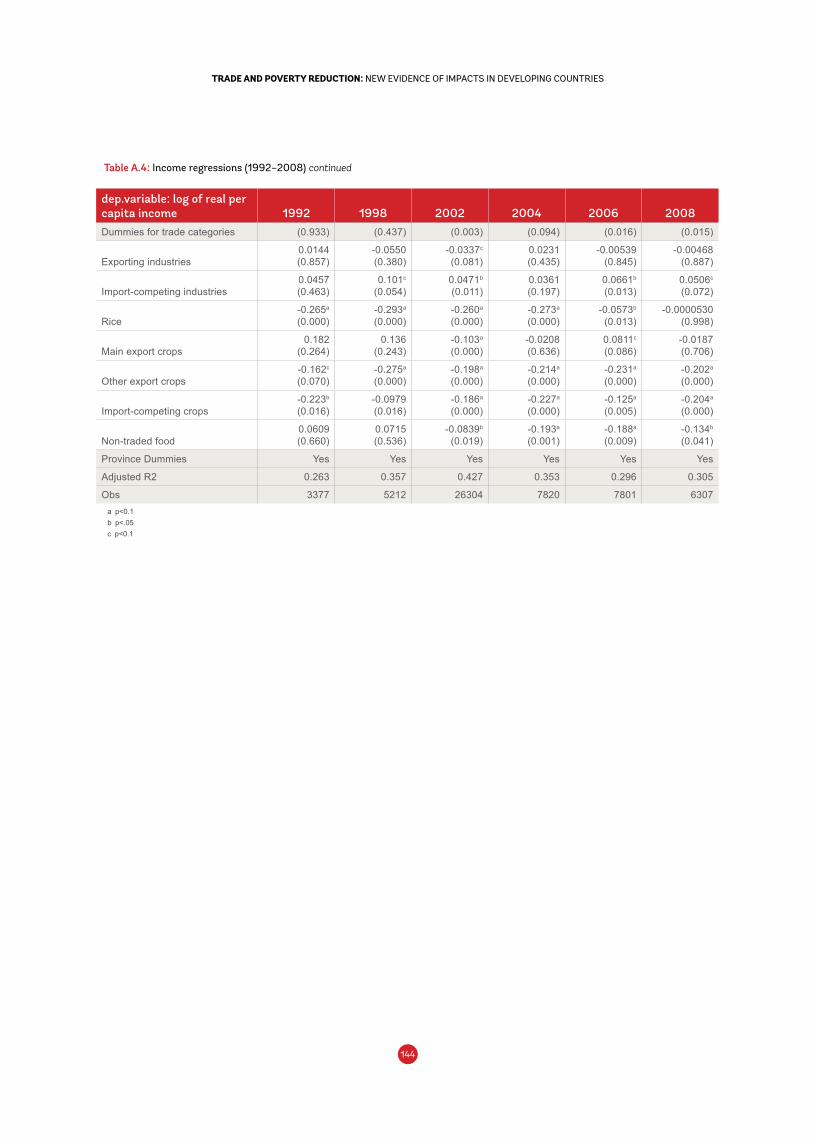
145144
TRADE AND POVERTY REDUCTION: NEW EVIDENCE OF IMPACTS IN DEVELOPING COUNTRIESTRADE AND POVERTY REDUCTION: NEW EVIDENCE OF IMPACTS IN DEVELOPING COUNTRIES
Dummies for trade categories (0.933) (0.437) (0.003) (0.094) (0.016) (0.015)
Exporting industries0.0144(0.857)
-0.0550(0.380)
-0.0337c
(0.081)0.0231(0.435)
-0.00539(0.845)
-0.00468 (0.887)
Import-competing industries0.0457(0.463)
0.101c
(0.054)0.0471b
(0.011)0.0361(0.197)
0.0661b
(0.013)0.0506c (0.072)
Rice-0.265a
(0.000)-0.293a
(0.000)-0.260a
(0.000)-0.273a
(0.000)-0.0573b
(0.013)-0.0000530
(0.998)
Main export crops0.182
(0.264)0.136
(0.243)-0.103a
(0.000)-0.0208(0.636)
0.0811c
(0.086)-0.0187 (0.706)
Other export crops-0.162c
(0.070)-0.275a
(0.000)-0.198a
(0.000)-0.214a
(0.000)-0.231a
(0.000)-0.202a
(0.000)
Import-competing crops-0.223b
(0.016)-0.0979(0.016)
-0.186a
(0.000)-0.227a
(0.000)-0.125a
(0.005)-0.204a
(0.000)
Non-traded food0.0609(0.660)
0.0715(0.536)
-0.0839b
(0.019)-0.193a
(0.001)-0.188a
(0.009)-0.134b
(0.041)
Province Dummies Yes Yes Yes Yes Yes Yes
Adjusted R2 0.263 0.357 0.427 0.353 0.296 0.305
Obs 3377 5212 26304 7820 7801 6307
Table A.4: Income regressions (1992–2008) continued
dep.variable: log of real per capita income 1992 1998 2002 2004 2006 2008
a p<0.1b p<.05c p<0.1
145144
TRADE AND POVERTY REDUCTION: NEW EVIDENCE OF IMPACTS IN DEVELOPING COUNTRIESTRADE AND POVERTY REDUCTION: NEW EVIDENCE OF IMPACTS IN DEVELOPING COUNTRIES
Appendix B: Methodology for empirical analysis
a Further details on the computation of this measure for different time horizons will be provided later on. For additional details see Pritchett et al. (2000); Christiaensen and Subbarao (2005); Chaudhuri and Datt (2001); Chaudhuri et al. (2002) and Chaudhuri (2003); Kamanou and Morduch (2004); Gunther and Harttgen (2009).
b In practice, the stochastic nature of consumption is acknowledged by assuming that there is heterogeneity in consumption volatility around the mean. Thus, it addresses the issue of heter-oskedasticity by using a 3-steps Feasible Generalized Least Squares (FGLS) econometric procedure suggested by Amemiya (1977).
147146
TRADE AND POVERTY REDUCTION: NEW EVIDENCE OF IMPACTS IN DEVELOPING COUNTRIESTRADE AND POVERTY REDUCTION: NEW EVIDENCE OF IMPACTS IN DEVELOPING COUNTRIES
c Note that the lack of panel data prevents us from exploiting the time dimension. Hence, we are assuming the unexplained component of income in cross-section data in Eq. B.3 to proximate
stochastic innovation. This is not unreasonable: while it is true that the unexplained component also contains non-stochastic unobservables as well as measurement error, it is not necessarily
true for the variances of income innovations within sub-samples of households grouped according to their trade openness position. d For identification purposes, the occupation characteristics are assumed to influence consumption behavior only through income.e According to Skinner (1988) and Guiso et al (1992), the exponent of the scaling factor measures the sensitivity to the level of expected wealth exhibited by the reaction to uncertainty. If the
exponent is more than zero, the effect of risk on consumption declines with the household’s resources and the decline is faster the higher the value. Usually, the adopted value is two and this
is why we use the square of that ratio.f The current value in thousand dong of the households’ fixed assets and durable goods has been used as a proxy for wealth in the denominator of the scaling factor. Robustness checks using
alternative proxies for wealth such as the linear combination of the principal component factors or observed consumption have been implemented. They show the same pattern, suggesting
that the negative relationship between ex-ante risk and consumption volatility seems to be robust to alternative empirical proxies for wealth.
147146
TRADE AND POVERTY REDUCTION: NEW EVIDENCE OF IMPACTS IN DEVELOPING COUNTRIESTRADE AND POVERTY REDUCTION: NEW EVIDENCE OF IMPACTS IN DEVELOPING COUNTRIES
149148
TRADE AND POVERTY REDUCTION: NEW EVIDENCE OF IMPACTS IN DEVELOPING COUNTRIESTRADE AND POVERTY REDUCTION: NEW EVIDENCE OF IMPACTS IN DEVELOPING COUNTRIES
1. Introduction
Border checkpoints in developing countries
often teem with traders transporting small
quantities on foot or pushing carts alongside
trucks that sport the insignia of formal
companies. Those small-scale, cross-border traders may
eventually be superseded by larger import-export firms.
But during the process of development, their trade may
be a valuable avenue for poverty alleviation and women’s
empowerment. This chapter focuses on the latter in the
context of small-scale, cross-border trade in Cambodia
and Lao People’s Democratic Republic (Lao PDR). It
analyzes recent survey research undertaken by the
World Bank and draws conclusions about the key policy
implications for facilitating the poverty-reducing impact
of women’s participation in small-scale, cross-border
trade.
Small-scale, cross-border trade (SSCBT) is thought
to provide several benefits to developing countries.
First, the literature emphasizes its importance as a
source of employment and financial resources for poor
smallholders and landless households, particularly on
a country’s geographical (and often socioeconomic)
fringes. Second, SSCBT plays an important role in
reducing price differences and volatility, thus having
a positive welfare impact on poor households beyond
those directly involved in this activity (World Bank, 2011).
Third, trade offers a way for women to earn money
outside the household, which may foster empowerment.
In this context, trade facilitation projects are traditionally
built on the expectation that the automation, streamlining
and simplification of procedures2 will foster economic
activity and eventually reduce poverty. Small-scale cross-
border traders, including informal, female and other
categories of potentially vulnerable traders, may benefit
at the margins of such projects, e.g., from improvements
in transparency. However, they carry small quantities
and may fall under customs declaration thresholds.
They are poorly educated and thus cannot cope with the
administrative tasks demanded of formal firms, and their
profit margins may be so thin that compliance with the
same customs duties and other border procedures facing
firms would prevent them from trading at all (Lesser
and Moisé-Leeman, 2009). Trade policy in developing
countries thus tends to focus on large, formal firms and
firms that might consider going formal, even though
many traders are unlikely to formalize in the medium run.
In Cambodia and Lao PDR, the two countries on which
this chapter focuses, women tend to be overrepresented
in unpaid family labor, while wage-earning jobs are mostly
Marlon Seror, Richard Record and Julian Clarke, World Bank Group
1 The research undertaken for this chapter was supported by the Trade Development Support Program in Cambodia, the Second Trade Development Facility Multi Donor Trust Fund in Lao PDR, and the Umbrella Facility for Gender Equality.
2 See World Bank (2012a) for Cambodia, and EMC (2012) and World Bank (2014a) for Lao PDR.
Glass Barriers: Constraints to Women’s Small-Scale,
Cross-Border Trade in Cambodia and Lao PDR1
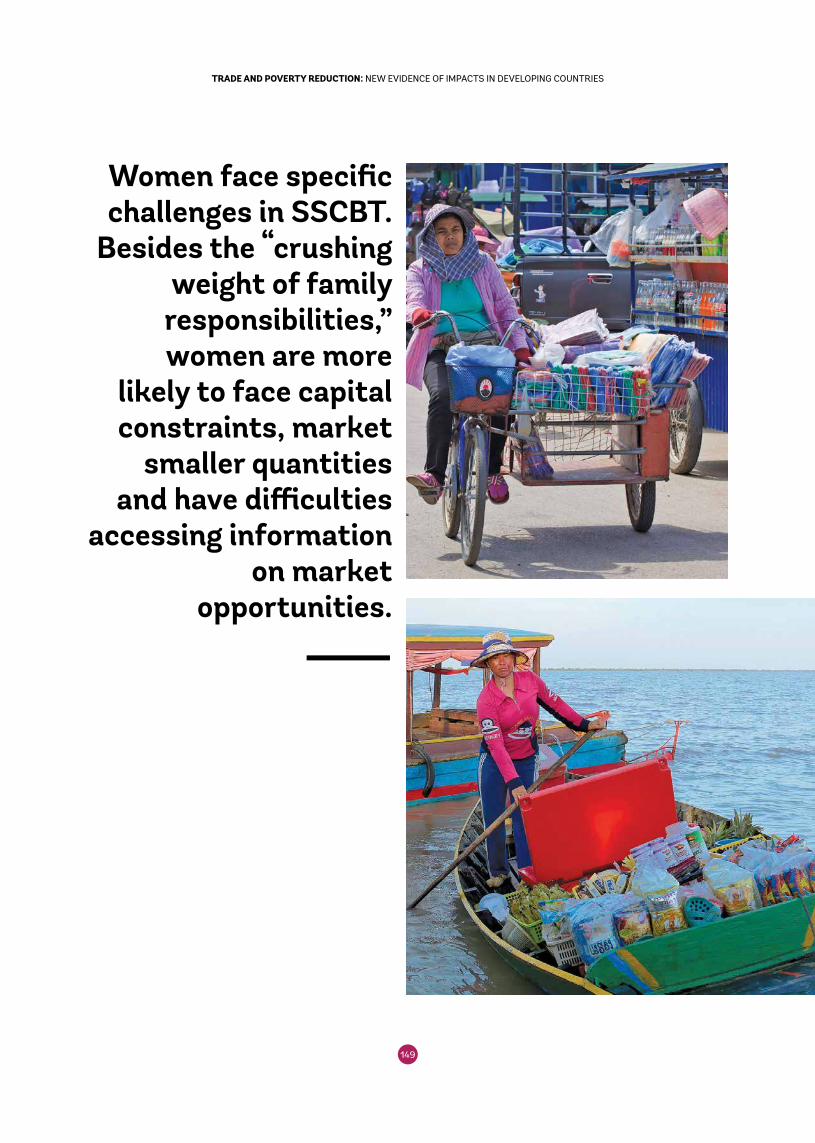
149148
TRADE AND POVERTY REDUCTION: NEW EVIDENCE OF IMPACTS IN DEVELOPING COUNTRIESTRADE AND POVERTY REDUCTION: NEW EVIDENCE OF IMPACTS IN DEVELOPING COUNTRIES
Marlon Seror, Richard Record and Julian Clarke, World Bank Group
Glass Barriers: Constraints to Women’s Small-Scale,
Cross-Border Trade in Cambodia and Lao PDR1
Women face specific challenges in SSCBT.
Besides the “crushing weight of family
responsibilities,” women are more
likely to face capital constraints, market
smaller quantities and have difficulties
accessing information on market
opportunities.
151150
TRADE AND POVERTY REDUCTION: NEW EVIDENCE OF IMPACTS IN DEVELOPING COUNTRIESTRADE AND POVERTY REDUCTION: NEW EVIDENCE OF IMPACTS IN DEVELOPING COUNTRIES
taken up by men (UNIFEM, WB, ADB, UNDP and DFID/UK
2004, World Bank 2012b). Since women’s employment
opportunities are often limited by cultural norms,
restrictions on mobility for safety reasons and household
responsibilities, the fact that trade is considered an
acceptable occupation for women in the Mekong sub-
region (ibid.) makes cross-border trade a valuable avenue
for women’s empowerment. Lao female traders, for
instance, were found in an early study to often earn more
than their husbands (Walker 1999), which may allow
them to gain financial independence. Prior to this study,
women were known to dominate some subcategories of
traders in the Mekong sub-region, e.g., fish traders across
the Cambodian-Thai border (Kusakabe et al. 2008) and
long-distance traders between Lao PDR and Thailand
(Walker 1999). In Africa, small-scale, cross-border trade is
largely carried out by women (World Bank 2011).
Yet women face specific challenges in SSCBT. Besides the
“crushing weight of family responsibilities” (UN Women
2012), women are more likely to face capital constraints,
market smaller quantities and have difficulties accessing
information on market opportunities (World Bank 2012c).
Women are also more likely to be illiterate, which restricts
their access to, and knowledge of, trade policies and
procedures (USAID 2012) and thus further limits business
development. Women often have to hire brokers, which
eats into their profit margins, or seek assistance from
officials, who are predominantly male and not trained
to work in gender-sensitive environments (World Bank
2012b). This may fuel extortion and even harassment, as
shown in East Africa (World Bank 2011, UN Women 2012).
Whereas this study does not find women reporting the
dramatic level of abuse highlighted in the East African
context, women may face binding constraints in their
activity as small-scale, cross-border traders. These
challenges may be “visible” and acknowledged by (at
least some of) the actors in the border economy, e.g.,
discriminatory tariffs or gender-based violence. The
barriers to SSCBT that women face may also be “invisible,”
i.e., not recognized by those actors as related to gender,
or indirectly—through regulations, norms, infrastructure,
etc., that adversely affect women—constraining women’s
participation in cross-border trade.
The contribution of this study is thus to shed light on
the obstacles, both visible and invisible (“glass barriers”
to trade), that prevent women from making the most of
SSCBT for income generation and empowerment. To this
end, we rely on an innovative mix of original qualitative
and quantitative data to both voice the concerns of the
actors in the border economy and econometrically detect
constraints that they fail to perceive or would not express.
Our combination of qualitative and quantitative data
further allows us to infer the constraints faced by women
who selected out of SSCBT. Following the metaphor of
Hausmann, Klinger and Wagner (2008), we shall strive
to voice the concerns of both “camels” (women actually
Our findings highlight that although they do not interpret it
as gender-based discrimination,
women are found to suffer from a higher
tax rate and a tax schedule that deters
them from upgrading to more profitable
cross-border trade activities.
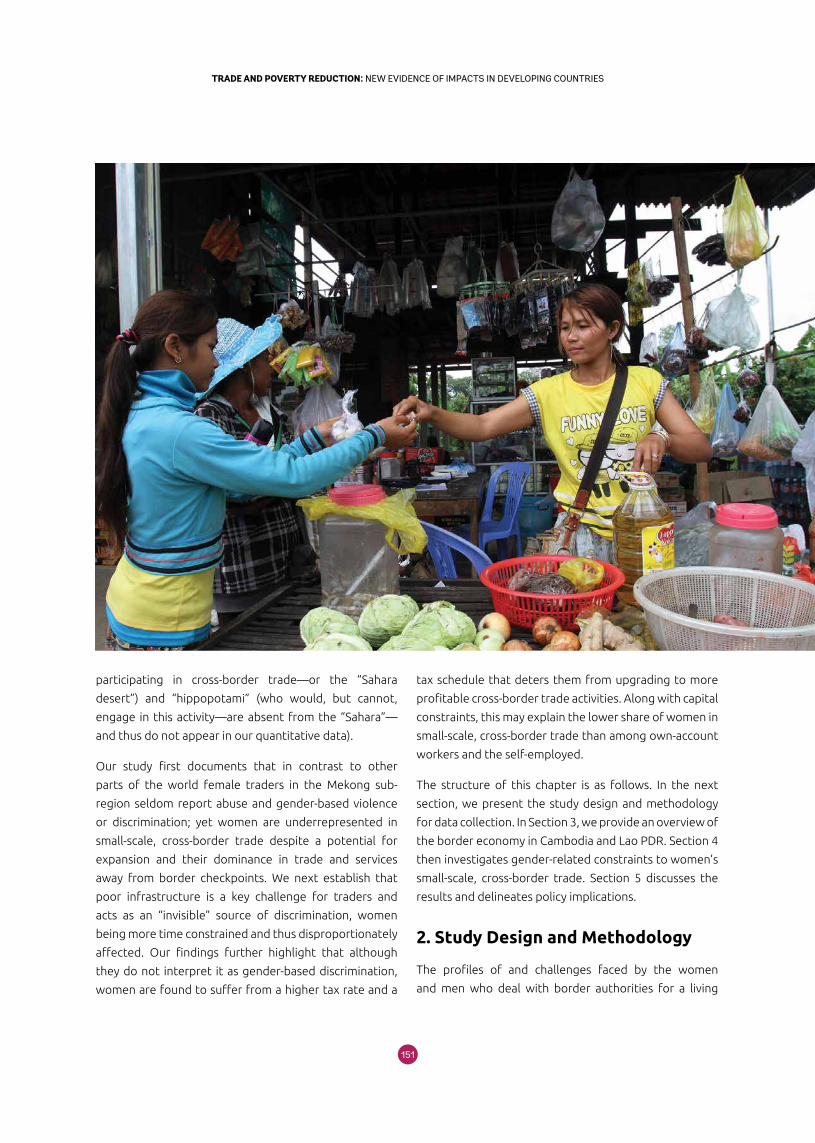
151150
TRADE AND POVERTY REDUCTION: NEW EVIDENCE OF IMPACTS IN DEVELOPING COUNTRIESTRADE AND POVERTY REDUCTION: NEW EVIDENCE OF IMPACTS IN DEVELOPING COUNTRIES
participating in cross-border trade—or the “Sahara
desert”) and “hippopotami” (who would, but cannot,
engage in this activity—are absent from the “Sahara”—
and thus do not appear in our quantitative data).
Our study first documents that in contrast to other
parts of the world female traders in the Mekong sub-
region seldom report abuse and gender-based violence
or discrimination; yet women are underrepresented in
small-scale, cross-border trade despite a potential for
expansion and their dominance in trade and services
away from border checkpoints. We next establish that
poor infrastructure is a key challenge for traders and
acts as an “invisible” source of discrimination, women
being more time constrained and thus disproportionately
affected. Our findings further highlight that although
they do not interpret it as gender-based discrimination,
women are found to suffer from a higher tax rate and a
tax schedule that deters them from upgrading to more
profitable cross-border trade activities. Along with capital
constraints, this may explain the lower share of women in
small-scale, cross-border trade than among own-account
workers and the self-employed.
The structure of this chapter is as follows. In the next
section, we present the study design and methodology
for data collection. In Section 3, we provide an overview of
the border economy in Cambodia and Lao PDR. Section 4
then investigates gender-related constraints to women’s
small-scale, cross-border trade. Section 5 discusses the
results and delineates policy implications.
2. Study Design and Methodology
The profiles of and challenges faced by the women
and men who deal with border authorities for a living
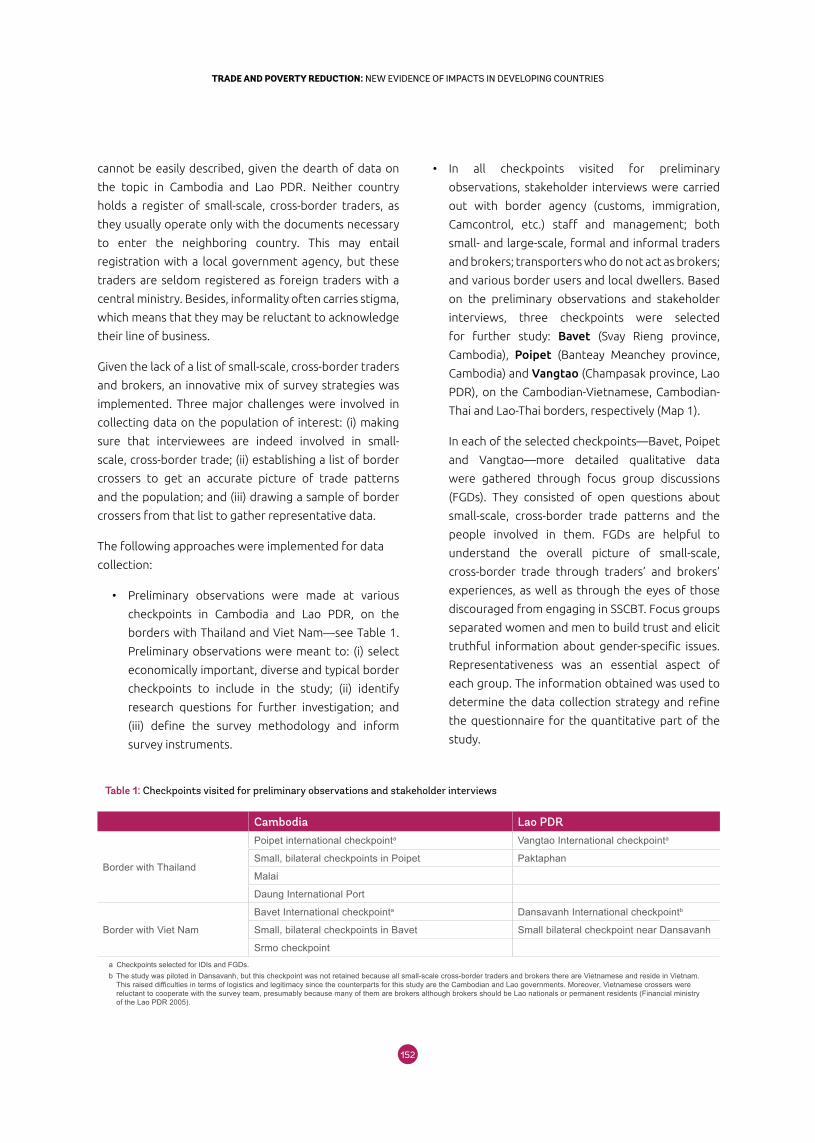
153152
TRADE AND POVERTY REDUCTION: NEW EVIDENCE OF IMPACTS IN DEVELOPING COUNTRIESTRADE AND POVERTY REDUCTION: NEW EVIDENCE OF IMPACTS IN DEVELOPING COUNTRIES
cannot be easily described, given the dearth of data on
the topic in Cambodia and Lao PDR. Neither country
holds a register of small-scale, cross-border traders, as
they usually operate only with the documents necessary
to enter the neighboring country. This may entail
registration with a local government agency, but these
traders are seldom registered as foreign traders with a
central ministry. Besides, informality often carries stigma,
which means that they may be reluctant to acknowledge
their line of business.
Given the lack of a list of small-scale, cross-border traders
and brokers, an innovative mix of survey strategies was
implemented. Three major challenges were involved in
collecting data on the population of interest: (i) making
sure that interviewees are indeed involved in small-
scale, cross-border trade; (ii) establishing a list of border
crossers to get an accurate picture of trade patterns
and the population; and (iii) drawing a sample of border
crossers from that list to gather representative data.
The following approaches were implemented for data
collection:
• Preliminary observations were made at various
checkpoints in Cambodia and Lao PDR, on the
borders with Thailand and Viet Nam—see Table 1.
Preliminary observations were meant to: (i) select
economically important, diverse and typical border
checkpoints to include in the study; (ii) identify
research questions for further investigation; and
(iii) define the survey methodology and inform
survey instruments.
• In all checkpoints visited for preliminary
observations, stakeholder interviews were carried
out with border agency (customs, immigration,
Camcontrol, etc.) staff and management; both
small- and large-scale, formal and informal traders
and brokers; transporters who do not act as brokers;
and various border users and local dwellers. Based
on the preliminary observations and stakeholder
interviews, three checkpoints were selected
for further study: Bavet (Svay Rieng province,
Cambodia), Poipet (Banteay Meanchey province,
Cambodia) and Vangtao (Champasak province, Lao
PDR), on the Cambodian-Vietnamese, Cambodian-
Thai and Lao-Thai borders, respectively (Map 1).
In each of the selected checkpoints—Bavet, Poipet
and Vangtao—more detailed qualitative data
were gathered through focus group discussions
(FGDs). They consisted of open questions about
small-scale, cross-border trade patterns and the
people involved in them. FGDs are helpful to
understand the overall picture of small-scale,
cross-border trade through traders’ and brokers’
experiences, as well as through the eyes of those
discouraged from engaging in SSCBT. Focus groups
separated women and men to build trust and elicit
truthful information about gender-specific issues.
Representativeness was an essential aspect of
each group. The information obtained was used to
determine the data collection strategy and refine
the questionnaire for the quantitative part of the
study.
Table 1: Checkpoints visited for preliminary observations and stakeholder interviews
Cambodia Lao PDR
Border with Thailand
Poipet international checkpointa Vangtao International checkpointa
Small, bilateral checkpoints in Poipet Paktaphan
Malai
Daung International Port
Border with Viet Nam
Bavet International checkpointa Dansavanh International checkpointb
Small, bilateral checkpoints in Bavet Small bilateral checkpoint near Dansavanh
Srmo checkpointa Checkpoints selected for IDIs and FGDs. b The study was piloted in Dansavanh, but this checkpoint was not retained because all small-scale cross-border traders and brokers there are Vietnamese and reside in Vietnam.
This raised difficulties in terms of logistics and legitimacy since the counterparts for this study are the Cambodian and Lao governments. Moreover, Vietnamese crossers were reluctant to cooperate with the survey team, presumably because many of them are brokers although brokers should be Lao nationals or permanent residents (Financial ministry of the Lao PDR 2005).
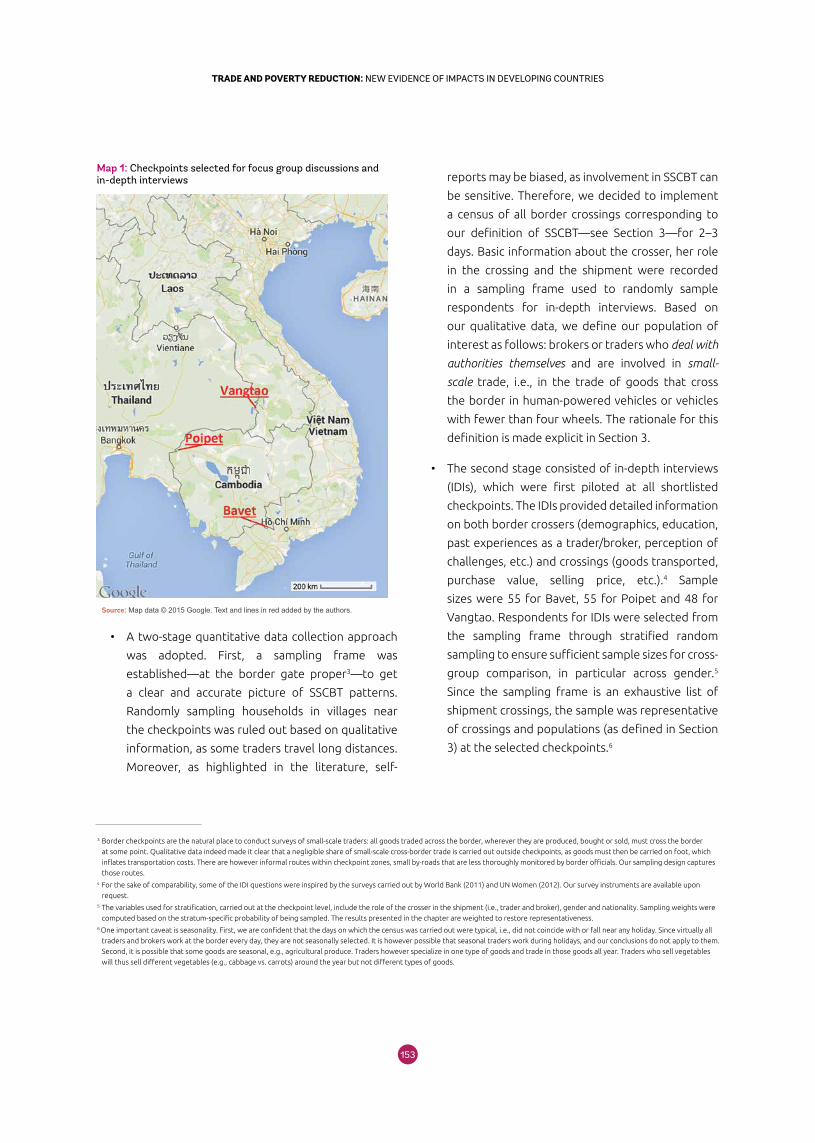
153152
TRADE AND POVERTY REDUCTION: NEW EVIDENCE OF IMPACTS IN DEVELOPING COUNTRIESTRADE AND POVERTY REDUCTION: NEW EVIDENCE OF IMPACTS IN DEVELOPING COUNTRIES
• A two-stage quantitative data collection approach
was adopted. First, a sampling frame was
established—at the border gate proper3—to get
a clear and accurate picture of SSCBT patterns.
Randomly sampling households in villages near
the checkpoints was ruled out based on qualitative
information, as some traders travel long distances.
Moreover, as highlighted in the literature, self-
reports may be biased, as involvement in SSCBT can
be sensitive. Therefore, we decided to implement
a census of all border crossings corresponding to
our definition of SSCBT—see Section 3—for 2–3
days. Basic information about the crosser, her role
in the crossing and the shipment were recorded
in a sampling frame used to randomly sample
respondents for in-depth interviews. Based on
our qualitative data, we define our population of
interest as follows: brokers or traders who deal with
authorities themselves and are involved in small-
scale trade, i.e., in the trade of goods that cross
the border in human-powered vehicles or vehicles
with fewer than four wheels. The rationale for this
definition is made explicit in Section 3.
• The second stage consisted of in-depth interviews
(IDIs), which were first piloted at all shortlisted
checkpoints. The IDIs provided detailed information
on both border crossers (demographics, education,
past experiences as a trader/broker, perception of
challenges, etc.) and crossings (goods transported,
purchase value, selling price, etc.).4 Sample
sizes were 55 for Bavet, 55 for Poipet and 48 for
Vangtao. Respondents for IDIs were selected from
the sampling frame through stratified random
sampling to ensure sufficient sample sizes for cross-
group comparison, in particular across gender.5
Since the sampling frame is an exhaustive list of
shipment crossings, the sample was representative
of crossings and populations (as defined in Section
3) at the selected checkpoints.6
Map 1: Checkpoints selected for focus group discussions and in-depth interviews
Source: Map data © 2015 Google. Text and lines in red added by the authors.
3 Border checkpoints are the natural place to conduct surveys of small-scale traders: all goods traded across the border, wherever they are produced, bought or sold, must cross the border
at some point. Qualitative data indeed made it clear that a negligible share of small-scale cross-border trade is carried out outside checkpoints, as goods must then be carried on foot, which
inflates transportation costs. There are however informal routes within checkpoint zones, small by-roads that are less thoroughly monitored by border officials. Our sampling design captures
those routes.4 For the sake of comparability, some of the IDI questions were inspired by the surveys carried out by World Bank (2011) and UN Women (2012). Our survey instruments are available upon
request.5 The variables used for stratification, carried out at the checkpoint level, include the role of the crosser in the shipment (i.e., trader and broker), gender and nationality. Sampling weights were
computed based on the stratum-specific probability of being sampled. The results presented in the chapter are weighted to restore representativeness.6 One important caveat is seasonality. First, we are confident that the days on which the census was carried out were typical, i.e., did not coincide with or fall near any holiday. Since virtually all
traders and brokers work at the border every day, they are not seasonally selected. It is however possible that seasonal traders work during holidays, and our conclusions do not apply to them.
Second, it is possible that some goods are seasonal, e.g., agricultural produce. Traders however specialize in one type of goods and trade in those goods all year. Traders who sell vegetables
will thus sell different vegetables (e.g., cabbage vs. carrots) around the year but not different types of goods.
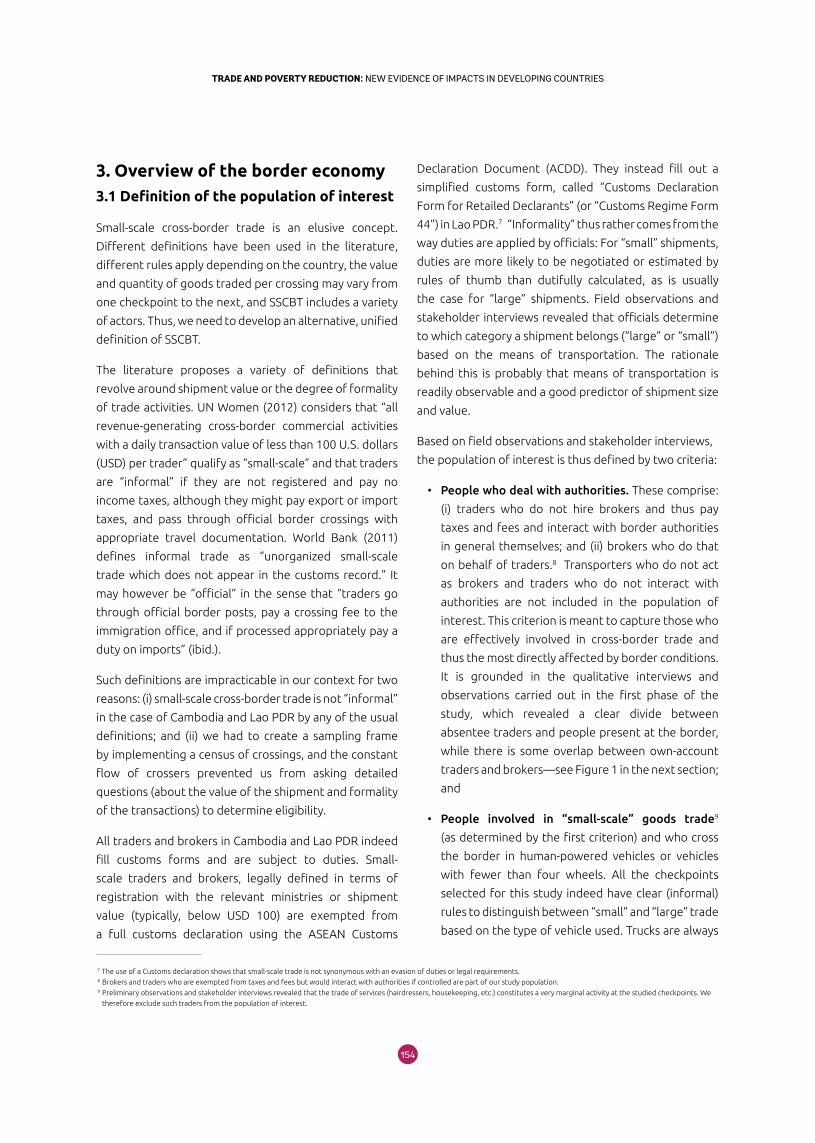
155154
TRADE AND POVERTY REDUCTION: NEW EVIDENCE OF IMPACTS IN DEVELOPING COUNTRIESTRADE AND POVERTY REDUCTION: NEW EVIDENCE OF IMPACTS IN DEVELOPING COUNTRIES
3. Overview of the border economy3.1 Definition of the population of interest
Small-scale cross-border trade is an elusive concept.
Different definitions have been used in the literature,
different rules apply depending on the country, the value
and quantity of goods traded per crossing may vary from
one checkpoint to the next, and SSCBT includes a variety
of actors. Thus, we need to develop an alternative, unified
definition of SSCBT.
The literature proposes a variety of definitions that
revolve around shipment value or the degree of formality
of trade activities. UN Women (2012) considers that “all
revenue-generating cross-border commercial activities
with a daily transaction value of less than 100 U.S. dollars
(USD) per trader” qualify as “small-scale” and that traders
are “informal” if they are not registered and pay no
income taxes, although they might pay export or import
taxes, and pass through official border crossings with
appropriate travel documentation. World Bank (2011)
defines informal trade as “unorganized small-scale
trade which does not appear in the customs record.” It
may however be “official” in the sense that “traders go
through official border posts, pay a crossing fee to the
immigration office, and if processed appropriately pay a
duty on imports” (ibid.).
Such definitions are impracticable in our context for two
reasons: (i) small-scale cross-border trade is not “informal”
in the case of Cambodia and Lao PDR by any of the usual
definitions; and (ii) we had to create a sampling frame
by implementing a census of crossings, and the constant
flow of crossers prevented us from asking detailed
questions (about the value of the shipment and formality
of the transactions) to determine eligibility.
All traders and brokers in Cambodia and Lao PDR indeed
fill customs forms and are subject to duties. Small-
scale traders and brokers, legally defined in terms of
registration with the relevant ministries or shipment
value (typically, below USD 100) are exempted from
a full customs declaration using the ASEAN Customs
Declaration Document (ACDD). They instead fill out a
simplified customs form, called “Customs Declaration
Form for Retailed Declarants” (or “Customs Regime Form
44”) in Lao PDR.7 “Informality” thus rather comes from the
way duties are applied by officials: For “small” shipments,
duties are more likely to be negotiated or estimated by
rules of thumb than dutifully calculated, as is usually
the case for “large” shipments. Field observations and
stakeholder interviews revealed that officials determine
to which category a shipment belongs (“large” or “small”)
based on the means of transportation. The rationale
behind this is probably that means of transportation is
readily observable and a good predictor of shipment size
and value.
Based on field observations and stakeholder interviews,
the population of interest is thus defined by two criteria:
• People who deal with authorities. These comprise:
(i) traders who do not hire brokers and thus pay
taxes and fees and interact with border authorities
in general themselves; and (ii) brokers who do that
on behalf of traders.8 Transporters who do not act
as brokers and traders who do not interact with
authorities are not included in the population of
interest. This criterion is meant to capture those who
are effectively involved in cross-border trade and
thus the most directly affected by border conditions.
It is grounded in the qualitative interviews and
observations carried out in the first phase of the
study, which revealed a clear divide between
absentee traders and people present at the border,
while there is some overlap between own-account
traders and brokers—see Figure 1 in the next section;
and
• People involved in “small-scale” goods trade9
(as determined by the first criterion) and who cross
the border in human-powered vehicles or vehicles
with fewer than four wheels. All the checkpoints
selected for this study indeed have clear (informal)
rules to distinguish between “small” and “large” trade
based on the type of vehicle used. Trucks are always
7 The use of a Customs declaration shows that small-scale trade is not synonymous with an evasion of duties or legal requirements.8 Brokers and traders who are exempted from taxes and fees but would interact with authorities if controlled are part of our study population.9 Preliminary observations and stakeholder interviews revealed that the trade of services (hairdressers, housekeeping, etc.) constitutes a very marginal activity at the studied checkpoints. We
therefore exclude such traders from the population of interest.
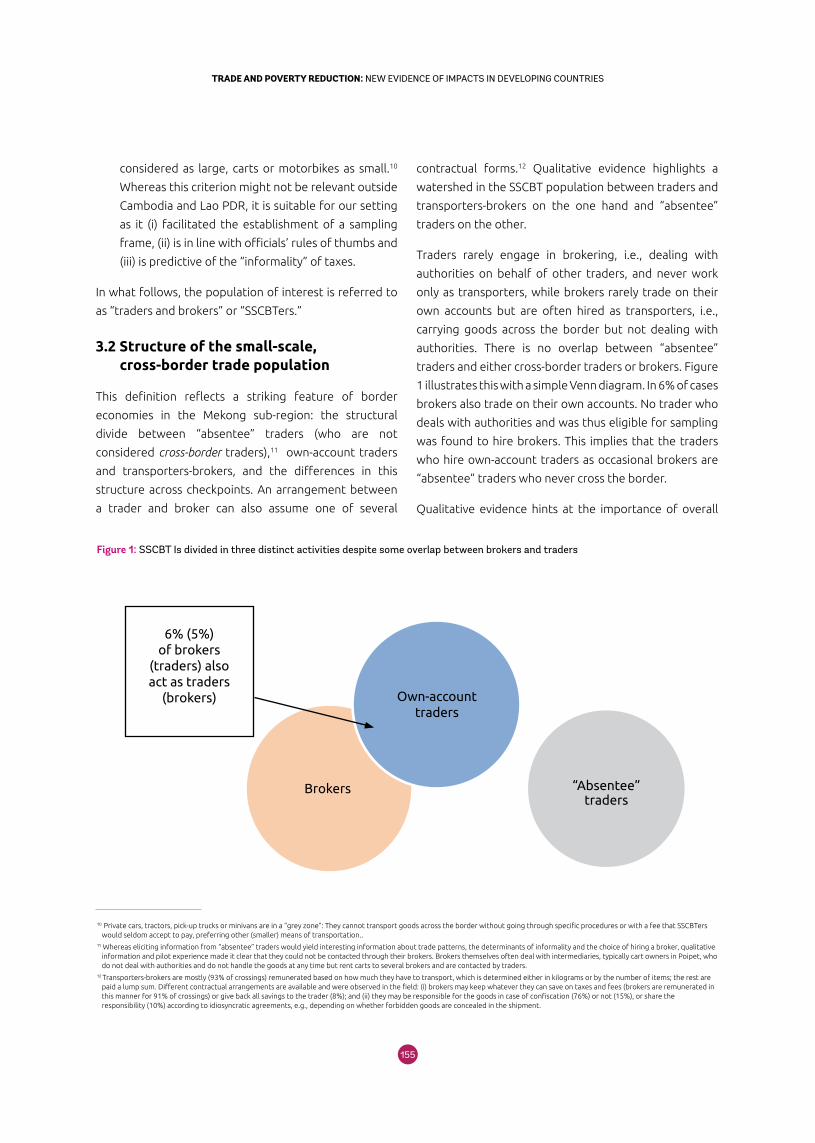
155154
TRADE AND POVERTY REDUCTION: NEW EVIDENCE OF IMPACTS IN DEVELOPING COUNTRIESTRADE AND POVERTY REDUCTION: NEW EVIDENCE OF IMPACTS IN DEVELOPING COUNTRIES
considered as large, carts or motorbikes as small.10
Whereas this criterion might not be relevant outside
Cambodia and Lao PDR, it is suitable for our setting
as it (i) facilitated the establishment of a sampling
frame, (ii) is in line with officials’ rules of thumbs and
(iii) is predictive of the “informality” of taxes.
In what follows, the population of interest is referred to
as “traders and brokers” or “SSCBTers.”
3.2 Structure of the small-scale, cross-border trade population
This definition reflects a striking feature of border
economies in the Mekong sub-region: the structural
divide between “absentee” traders (who are not
considered cross-border traders),11 own-account traders
and transporters-brokers, and the differences in this
structure across checkpoints. An arrangement between
a trader and broker can also assume one of several
contractual forms.12 Qualitative evidence highlights a
watershed in the SSCBT population between traders and
transporters-brokers on the one hand and “absentee”
traders on the other.
Traders rarely engage in brokering, i.e., dealing with
authorities on behalf of other traders, and never work
only as transporters, while brokers rarely trade on their
own accounts but are often hired as transporters, i.e.,
carrying goods across the border but not dealing with
authorities. There is no overlap between “absentee”
traders and either cross-border traders or brokers. Figure
1 illustrates this with a simple Venn diagram. In 6% of cases
brokers also trade on their own accounts. No trader who
deals with authorities and was thus eligible for sampling
was found to hire brokers. This implies that the traders
who hire own-account traders as occasional brokers are
“absentee” traders who never cross the border.
Qualitative evidence hints at the importance of overall
10 Private cars, tractors, pick-up trucks or minivans are in a “grey zone”: They cannot transport goods across the border without going through specific procedures or with a fee that SSCBTers would seldom accept to pay, preferring other (smaller) means of transportation..
11 Whereas eliciting information from “absentee” traders would yield interesting information about trade patterns, the determinants of informality and the choice of hiring a broker, qualitative information and pilot experience made it clear that they could not be contacted through their brokers. Brokers themselves often deal with intermediaries, typically cart owners in Poipet, who do not deal with authorities and do not handle the goods at any time but rent carts to several brokers and are contacted by traders.
12 Transporters-brokers are mostly (93% of crossings) remunerated based on how much they have to transport, which is determined either in kilograms or by the number of items; the rest are paid a lump sum. Different contractual arrangements are available and were observed in the field: (i) brokers may keep whatever they can save on taxes and fees (brokers are remunerated in this manner for 91% of crossings) or give back all savings to the trader (8%); and (ii) they may be responsible for the goods in case of confiscation (76%) or not (15%), or share the responsibility (10%) according to idiosyncratic agreements, e.g., depending on whether forbidden goods are concealed in the shipment.
“Absentee”traders
Brokers
6% (5%) of brokers
(traders) also act as traders
(brokers)
Figure 1: SSCBT Is divided in three distinct activities despite some overlap between brokers and traders
Own-account traders
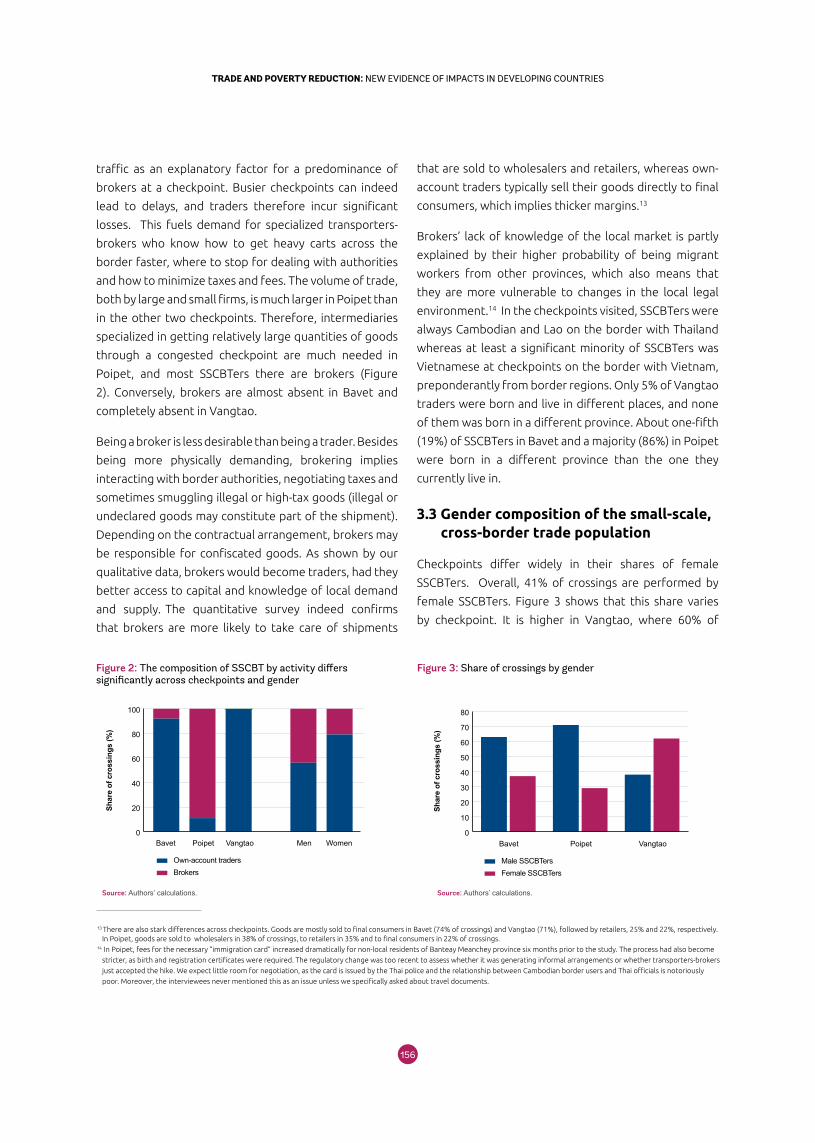
157156
TRADE AND POVERTY REDUCTION: NEW EVIDENCE OF IMPACTS IN DEVELOPING COUNTRIESTRADE AND POVERTY REDUCTION: NEW EVIDENCE OF IMPACTS IN DEVELOPING COUNTRIES
traffic as an explanatory factor for a predominance of
brokers at a checkpoint. Busier checkpoints can indeed
lead to delays, and traders therefore incur significant
losses. This fuels demand for specialized transporters-
brokers who know how to get heavy carts across the
border faster, where to stop for dealing with authorities
and how to minimize taxes and fees. The volume of trade,
both by large and small firms, is much larger in Poipet than
in the other two checkpoints. Therefore, intermediaries
specialized in getting relatively large quantities of goods
through a congested checkpoint are much needed in
Poipet, and most SSCBTers there are brokers (Figure
2). Conversely, brokers are almost absent in Bavet and
completely absent in Vangtao.
Being a broker is less desirable than being a trader. Besides
being more physically demanding, brokering implies
interacting with border authorities, negotiating taxes and
sometimes smuggling illegal or high-tax goods (illegal or
undeclared goods may constitute part of the shipment).
Depending on the contractual arrangement, brokers may
be responsible for confiscated goods. As shown by our
qualitative data, brokers would become traders, had they
better access to capital and knowledge of local demand
and supply. The quantitative survey indeed confirms
that brokers are more likely to take care of shipments
that are sold to wholesalers and retailers, whereas own-
account traders typically sell their goods directly to final
consumers, which implies thicker margins.13
Brokers’ lack of knowledge of the local market is partly
explained by their higher probability of being migrant
workers from other provinces, which also means that
they are more vulnerable to changes in the local legal
environment.14 In the checkpoints visited, SSCBTers were
always Cambodian and Lao on the border with Thailand
whereas at least a significant minority of SSCBTers was
Vietnamese at checkpoints on the border with Vietnam,
preponderantly from border regions. Only 5% of Vangtao
traders were born and live in different places, and none
of them was born in a different province. About one-fifth
(19%) of SSCBTers in Bavet and a majority (86%) in Poipet
were born in a different province than the one they
currently live in.
3.3 Gender composition of the small-scale, cross-border trade population
Checkpoints differ widely in their shares of female
SSCBTers. Overall, 41% of crossings are performed by
female SSCBTers. Figure 3 shows that this share varies
by checkpoint. It is higher in Vangtao, where 60% of
0
10
20
30
40
50
60
70
80
Shar
e of
cro
ssin
gs (%
)
Male SSCBTersFemale SSCBTers
Bavet Poipet Vangtao
Shar
e of
cro
ssin
gs (%
)
Bavet Poipet Vangtao Men Women
Own-account tradersBrokers
0
20
40
60
80
100
Figure 3: Share of crossings by genderFigure 2: The composition of SSCBT by activity differs significantly across checkpoints and gender
Source: Authors’ calculations.
13 There are also stark differences across checkpoints. Goods are mostly sold to final consumers in Bavet (74% of crossings) and Vangtao (71%), followed by retailers, 25% and 22%, respectively. In Poipet, goods are sold to wholesalers in 38% of crossings, to retailers in 35% and to final consumers in 22% of crossings.
14 In Poipet, fees for the necessary “immigration card” increased dramatically for non-local residents of Banteay Meanchey province six months prior to the study. The process had also become
stricter, as birth and registration certificates were required. The regulatory change was too recent to assess whether it was generating informal arrangements or whether transporters-brokers
just accepted the hike. We expect little room for negotiation, as the card is issued by the Thai police and the relationship between Cambodian border users and Thai officials is notoriously
poor. Moreover, the interviewees never mentioned this as an issue unless we specifically asked about travel documents.
Source: Authors’ calculations.
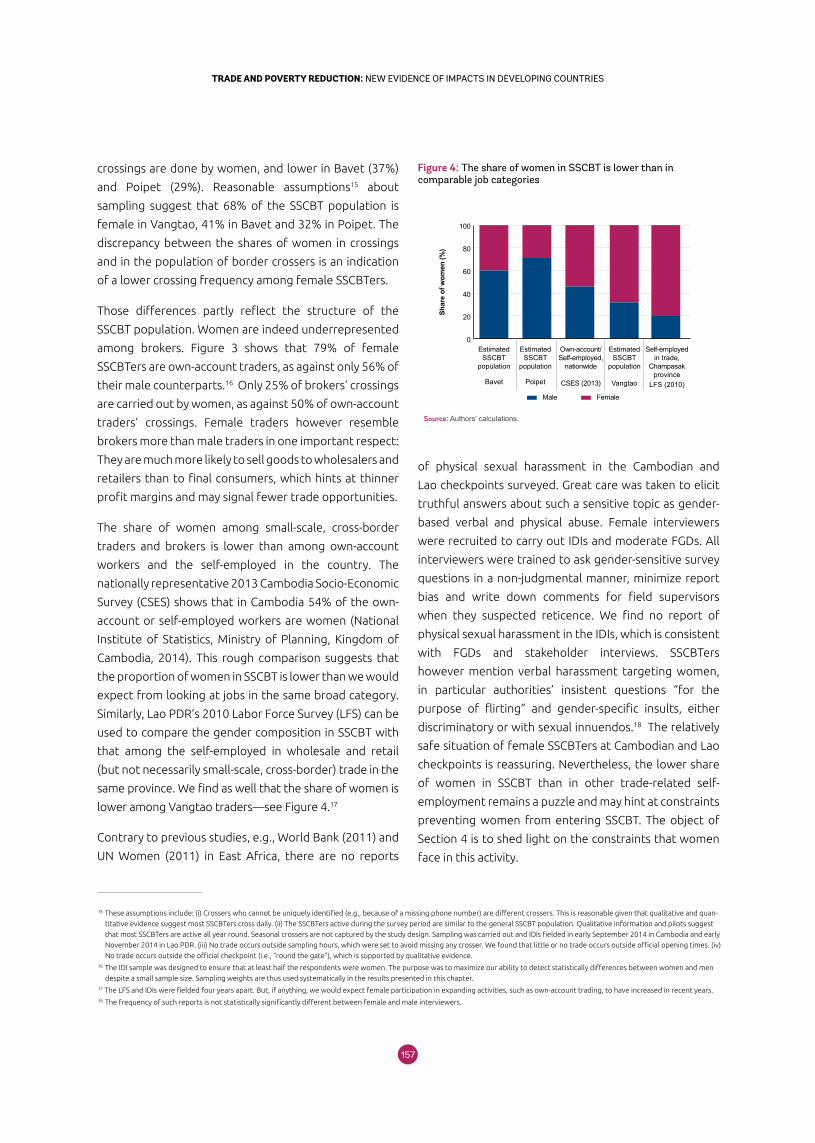
157156
TRADE AND POVERTY REDUCTION: NEW EVIDENCE OF IMPACTS IN DEVELOPING COUNTRIESTRADE AND POVERTY REDUCTION: NEW EVIDENCE OF IMPACTS IN DEVELOPING COUNTRIES
15 These assumptions include: (i) Crossers who cannot be uniquely identified (e.g., because of a missing phone number) are different crossers. This is reasonable given that qualitative and quan-
titative evidence suggest most SSCBTers cross daily. (ii) The SSCBTers active during the survey period are similar to the general SSCBT population. Qualitative information and pilots suggest
that most SSCBTers are active all year round. Seasonal crossers are not captured by the study design. Sampling was carried out and IDIs fielded in early September 2014 in Cambodia and early
November 2014 in Lao PDR. (iii) No trade occurs outside sampling hours, which were set to avoid missing any crosser. We found that little or no trade occurs outside official opening times. (iv)
No trade occurs outside the official checkpoint (i.e., “round the gate”), which is supported by qualitative evidence.16 The IDI sample was designed to ensure that at least half the respondents were women. The purpose was to maximize our ability to detect statistically differences between women and men
despite a small sample size. Sampling weights are thus used systematically in the results presented in this chapter.17 The LFS and IDIs were fielded four years apart. But, if anything, we would expect female participation in expanding activities, such as own-account trading, to have increased in recent years.18 The frequency of such reports is not statistically significantly different between female and male interviewers.
crossings are done by women, and lower in Bavet (37%)
and Poipet (29%). Reasonable assumptions15 about
sampling suggest that 68% of the SSCBT population is
female in Vangtao, 41% in Bavet and 32% in Poipet. The
discrepancy between the shares of women in crossings
and in the population of border crossers is an indication
of a lower crossing frequency among female SSCBTers.
Those differences partly reflect the structure of the
SSCBT population. Women are indeed underrepresented
among brokers. Figure 3 shows that 79% of female
SSCBTers are own-account traders, as against only 56% of
their male counterparts.16 Only 25% of brokers’ crossings
are carried out by women, as against 50% of own-account
traders’ crossings. Female traders however resemble
brokers more than male traders in one important respect:
They are much more likely to sell goods to wholesalers and
retailers than to final consumers, which hints at thinner
profit margins and may signal fewer trade opportunities.
The share of women among small-scale, cross-border
traders and brokers is lower than among own-account
workers and the self-employed in the country. The
nationally representative 2013 Cambodia Socio-Economic
Survey (CSES) shows that in Cambodia 54% of the own-
account or self-employed workers are women (National
Institute of Statistics, Ministry of Planning, Kingdom of
Cambodia, 2014). This rough comparison suggests that
the proportion of women in SSCBT is lower than we would
expect from looking at jobs in the same broad category.
Similarly, Lao PDR’s 2010 Labor Force Survey (LFS) can be
used to compare the gender composition in SSCBT with
that among the self-employed in wholesale and retail
(but not necessarily small-scale, cross-border) trade in the
same province. We find as well that the share of women is
lower among Vangtao traders—see Figure 4.17
Contrary to previous studies, e.g., World Bank (2011) and
UN Women (2011) in East Africa, there are no reports
of physical sexual harassment in the Cambodian and
Lao checkpoints surveyed. Great care was taken to elicit
truthful answers about such a sensitive topic as gender-
based verbal and physical abuse. Female interviewers
were recruited to carry out IDIs and moderate FGDs. All
interviewers were trained to ask gender-sensitive survey
questions in a non-judgmental manner, minimize report
bias and write down comments for field supervisors
when they suspected reticence. We find no report of
physical sexual harassment in the IDIs, which is consistent
with FGDs and stakeholder interviews. SSCBTers
however mention verbal harassment targeting women,
in particular authorities’ insistent questions “for the
purpose of flirting” and gender-specific insults, either
discriminatory or with sexual innuendos.18 The relatively
safe situation of female SSCBTers at Cambodian and Lao
checkpoints is reassuring. Nevertheless, the lower share
of women in SSCBT than in other trade-related self-
employment remains a puzzle and may hint at constraints
preventing women from entering SSCBT. The object of
Section 4 is to shed light on the constraints that women
face in this activity.
0
20
40
60
80
100
EstimatedSSCBT
population
Bavet
EstimatedSSCBT
population
Poipet
Own-account/Self-employed,
nationwide
CSES (2013)
EstimatedSSCBT
population
Vangtao
Self-employedin trade,
Champasakprovince
LFS (2010)
Male Female
Shar
e of
wom
en (%
)
Figure 4: The share of women in SSCBT is lower than in comparable job categories
Source: Authors’ calculations.
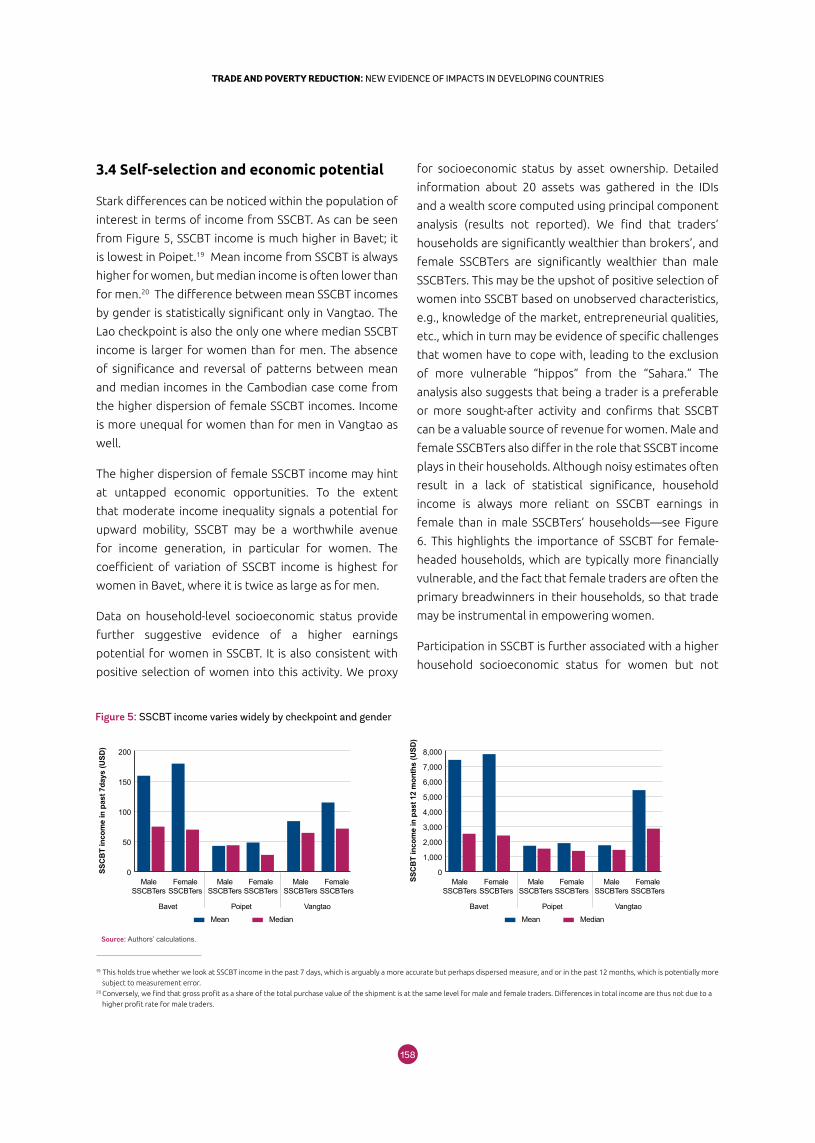
159158
TRADE AND POVERTY REDUCTION: NEW EVIDENCE OF IMPACTS IN DEVELOPING COUNTRIESTRADE AND POVERTY REDUCTION: NEW EVIDENCE OF IMPACTS IN DEVELOPING COUNTRIES
3.4 Self-selection and economic potential
Stark differences can be noticed within the population of
interest in terms of income from SSCBT. As can be seen
from Figure 5, SSCBT income is much higher in Bavet; it
is lowest in Poipet.19 Mean income from SSCBT is always
higher for women, but median income is often lower than
for men.20 The difference between mean SSCBT incomes
by gender is statistically significant only in Vangtao. The
Lao checkpoint is also the only one where median SSCBT
income is larger for women than for men. The absence
of significance and reversal of patterns between mean
and median incomes in the Cambodian case come from
the higher dispersion of female SSCBT incomes. Income
is more unequal for women than for men in Vangtao as
well.
The higher dispersion of female SSCBT income may hint
at untapped economic opportunities. To the extent
that moderate income inequality signals a potential for
upward mobility, SSCBT may be a worthwhile avenue
for income generation, in particular for women. The
coefficient of variation of SSCBT income is highest for
women in Bavet, where it is twice as large as for men.
Data on household-level socioeconomic status provide
further suggestive evidence of a higher earnings
potential for women in SSCBT. It is also consistent with
positive selection of women into this activity. We proxy
for socioeconomic status by asset ownership. Detailed
information about 20 assets was gathered in the IDIs
and a wealth score computed using principal component
analysis (results not reported). We find that traders’
households are significantly wealthier than brokers’, and
female SSCBTers are significantly wealthier than male
SSCBTers. This may be the upshot of positive selection of
women into SSCBT based on unobserved characteristics,
e.g., knowledge of the market, entrepreneurial qualities,
etc., which in turn may be evidence of specific challenges
that women have to cope with, leading to the exclusion
of more vulnerable “hippos” from the “Sahara.” The
analysis also suggests that being a trader is a preferable
or more sought-after activity and confirms that SSCBT
can be a valuable source of revenue for women. Male and
female SSCBTers also differ in the role that SSCBT income
plays in their households. Although noisy estimates often
result in a lack of statistical significance, household
income is always more reliant on SSCBT earnings in
female than in male SSCBTers’ households—see Figure
6. This highlights the importance of SSCBT for female-
headed households, which are typically more financially
vulnerable, and the fact that female traders are often the
primary breadwinners in their households, so that trade
may be instrumental in empowering women.
Participation in SSCBT is further associated with a higher
household socioeconomic status for women but not
0
50
100
150
200
SSC
BT
inco
me
in p
ast 7
days
(USD
)
MaleSSCBTers
FemaleSSCBTers
FemaleSSCBTers
MaleSSCBTers
FemaleSSCBTers
MaleSSCBTers
Bavet Poipet Vangtao
Mean Median
0
1,000
2,000
3,000
4,000
5,000
6,000
7,000
8,000
SSC
BT
inco
me
in p
ast 1
2 m
onth
s (U
SD)
MaleSSCBTers
FemaleSSCBTers
FemaleSSCBTers
MaleSSCBTers
FemaleSSCBTers
MaleSSCBTers
Bavet Poipet Vangtao
Mean Median
Figure 5: SSCBT income varies widely by checkpoint and gender
Source: Authors’ calculations.
19 This holds true whether we look at SSCBT income in the past 7 days, which is arguably a more accurate but perhaps dispersed measure, and or in the past 12 months, which is potentially more
subject to measurement error.20 Conversely, we find that gross profit as a share of the total purchase value of the shipment is at the same level for male and female traders. Differences in total income are thus not due to a
higher profit rate for male traders.
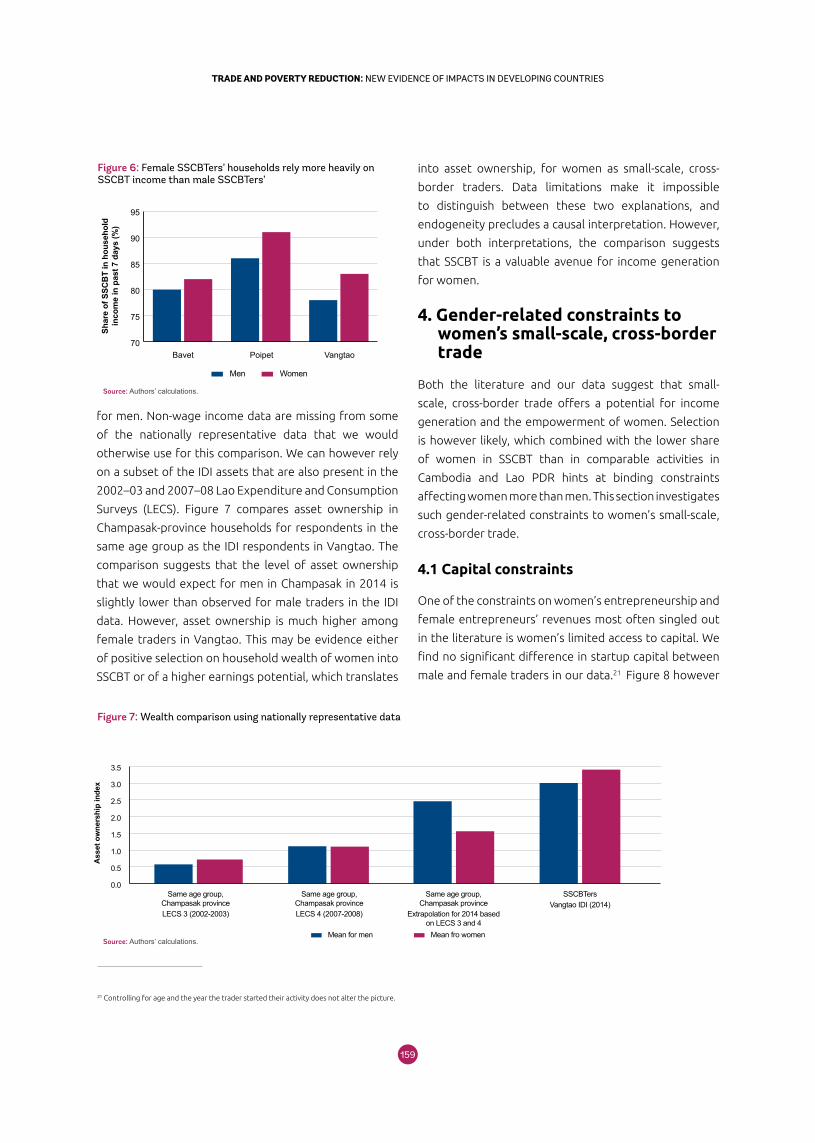
159158
TRADE AND POVERTY REDUCTION: NEW EVIDENCE OF IMPACTS IN DEVELOPING COUNTRIESTRADE AND POVERTY REDUCTION: NEW EVIDENCE OF IMPACTS IN DEVELOPING COUNTRIES
for men. Non-wage income data are missing from some
of the nationally representative data that we would
otherwise use for this comparison. We can however rely
on a subset of the IDI assets that are also present in the
2002–03 and 2007–08 Lao Expenditure and Consumption
Surveys (LECS). Figure 7 compares asset ownership in
Champasak-province households for respondents in the
same age group as the IDI respondents in Vangtao. The
comparison suggests that the level of asset ownership
that we would expect for men in Champasak in 2014 is
slightly lower than observed for male traders in the IDI
data. However, asset ownership is much higher among
female traders in Vangtao. This may be evidence either
of positive selection on household wealth of women into
SSCBT or of a higher earnings potential, which translates
Figure 6: Female SSCBTers’ households rely more heavily on SSCBT income than male SSCBTers’
70
75
80
85
90
95
Shar
e of
SSC
BT
in h
ouse
hold
inco
me
in p
ast 7
day
s (%
)
Men Women
Bavet Poipet Vangtao
Source: Authors’ calculations.
Figure 7: Wealth comparison using nationally representative data
0.0
0.5
1.0
1.5
2.0
2.5
3.0
3.5
Same age group,Champasak provinceLECS 3 (2002-2003)
Same age group,Champasak provinceLECS 4 (2007-2008)
Same age group,Champasak province
Extrapolation for 2014 basedon LECS 3 and 4
SSCBTersVangtao IDI (2014)
Mean for men Mean fro women
Ass
et o
wne
rshi
p in
dex
Source: Authors’ calculations.
into asset ownership, for women as small-scale, cross-
border traders. Data limitations make it impossible
to distinguish between these two explanations, and
endogeneity precludes a causal interpretation. However,
under both interpretations, the comparison suggests
that SSCBT is a valuable avenue for income generation
for women.
4. Gender-related constraints to women’s small-scale, cross-border trade
Both the literature and our data suggest that small-
scale, cross-border trade offers a potential for income
generation and the empowerment of women. Selection
is however likely, which combined with the lower share
of women in SSCBT than in comparable activities in
Cambodia and Lao PDR hints at binding constraints
affecting women more than men. This section investigates
such gender-related constraints to women’s small-scale,
cross-border trade.
4.1 Capital constraints
One of the constraints on women’s entrepreneurship and
female entrepreneurs’ revenues most often singled out
in the literature is women’s limited access to capital. We
find no significant difference in startup capital between
male and female traders in our data.21 Figure 8 however
21 Controlling for age and the year the trader started their activity does not alter the picture.
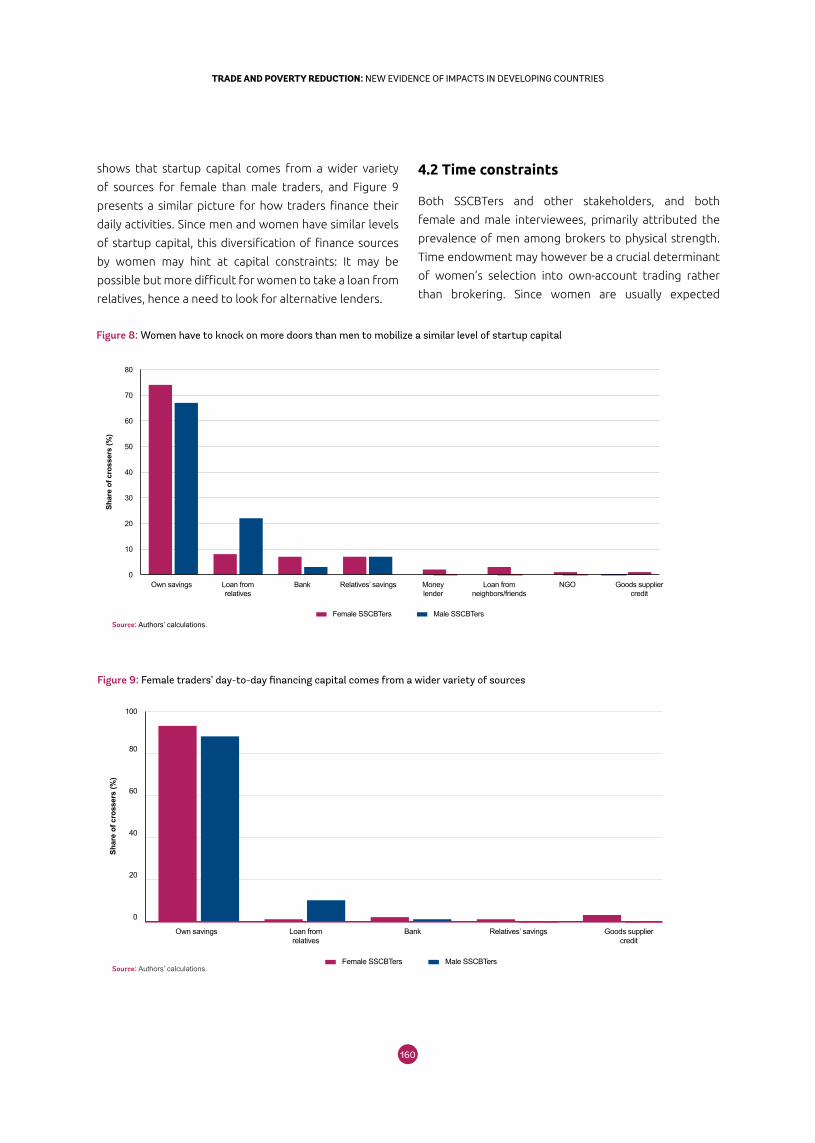
161160
TRADE AND POVERTY REDUCTION: NEW EVIDENCE OF IMPACTS IN DEVELOPING COUNTRIESTRADE AND POVERTY REDUCTION: NEW EVIDENCE OF IMPACTS IN DEVELOPING COUNTRIES
shows that startup capital comes from a wider variety
of sources for female than male traders, and Figure 9
presents a similar picture for how traders finance their
daily activities. Since men and women have similar levels
of startup capital, this diversification of finance sources
by women may hint at capital constraints: It may be
possible but more difficult for women to take a loan from
relatives, hence a need to look for alternative lenders.
4.2 Time constraints
Both SSCBTers and other stakeholders, and both
female and male interviewees, primarily attributed the
prevalence of men among brokers to physical strength.
Time endowment may however be a crucial determinant
of women’s selection into own-account trading rather
than brokering. Since women are usually expected
Figure 8: Women have to knock on more doors than men to mobilize a similar level of startup capital
0
10
20
30
40
50
60
70
80
Own savings Loan fromrelatives
Bank Relatives’ savings Moneylender
NGO Goods suppliercredit
Female SSCBTers Male SSCBTers
Shar
e of
cro
sser
s (%
)
Loan fromneighbors/friends
Source: Authors’ calculations.
Figure 9: Female traders’ day-to-day financing capital comes from a wider variety of sources
Source: Authors’ calculations.
0
20
40
60
80
100
Own savings Loan fromrelatives
Bank Relatives’ savings Goods suppliercredit
Female SSCBTers Male SSCBTers
Shar
e of
cro
sser
s (%
)
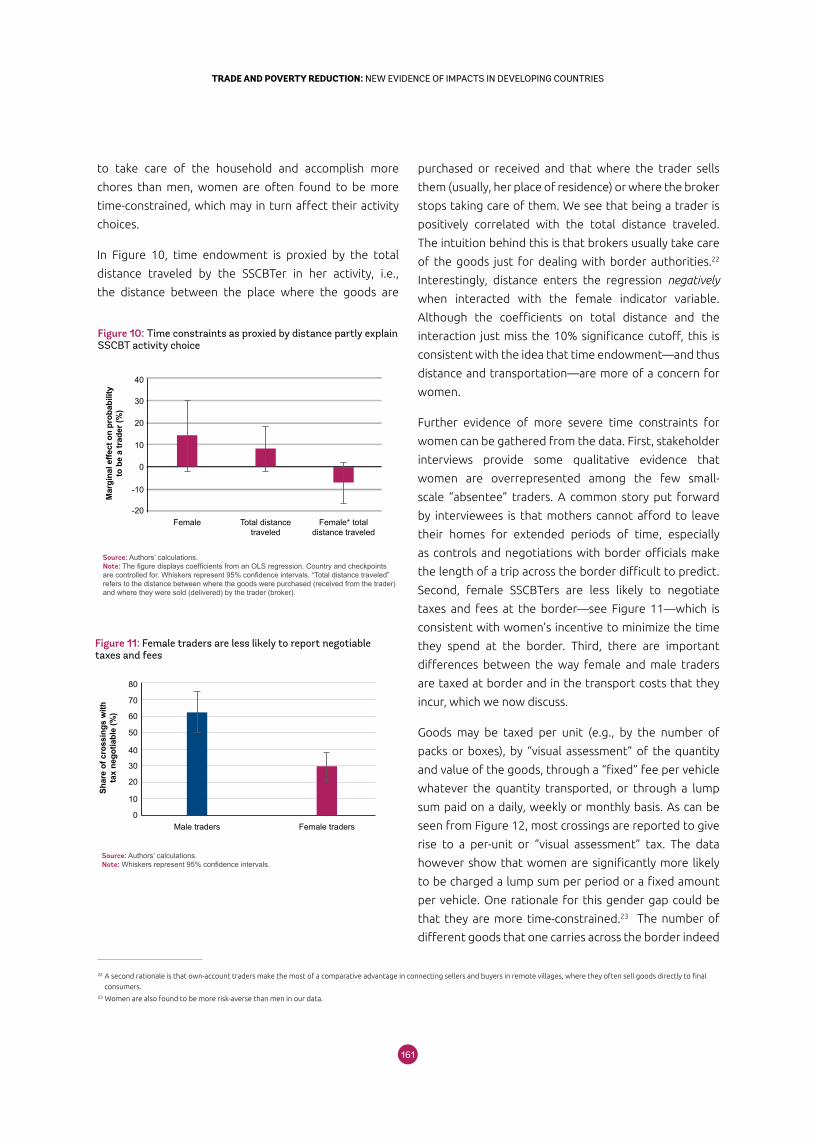
161160
TRADE AND POVERTY REDUCTION: NEW EVIDENCE OF IMPACTS IN DEVELOPING COUNTRIESTRADE AND POVERTY REDUCTION: NEW EVIDENCE OF IMPACTS IN DEVELOPING COUNTRIES
to take care of the household and accomplish more
chores than men, women are often found to be more
time-constrained, which may in turn affect their activity
choices.
In Figure 10, time endowment is proxied by the total
distance traveled by the SSCBTer in her activity, i.e.,
the distance between the place where the goods are
purchased or received and that where the trader sells
them (usually, her place of residence) or where the broker
stops taking care of them. We see that being a trader is
positively correlated with the total distance traveled.
The intuition behind this is that brokers usually take care
of the goods just for dealing with border authorities.22
Interestingly, distance enters the regression negatively
when interacted with the female indicator variable.
Although the coefficients on total distance and the
interaction just miss the 10% significance cutoff, this is
consistent with the idea that time endowment—and thus
distance and transportation—are more of a concern for
women.
Further evidence of more severe time constraints for
women can be gathered from the data. First, stakeholder
interviews provide some qualitative evidence that
women are overrepresented among the few small-
scale “absentee” traders. A common story put forward
by interviewees is that mothers cannot afford to leave
their homes for extended periods of time, especially
as controls and negotiations with border officials make
the length of a trip across the border difficult to predict.
Second, female SSCBTers are less likely to negotiate
taxes and fees at the border—see Figure 11—which is
consistent with women’s incentive to minimize the time
they spend at the border. Third, there are important
differences between the way female and male traders
are taxed at border and in the transport costs that they
incur, which we now discuss.
Goods may be taxed per unit (e.g., by the number of
packs or boxes), by “visual assessment” of the quantity
and value of the goods, through a “fixed” fee per vehicle
whatever the quantity transported, or through a lump
sum paid on a daily, weekly or monthly basis. As can be
seen from Figure 12, most crossings are reported to give
rise to a per-unit or “visual assessment” tax. The data
however show that women are significantly more likely
to be charged a lump sum per period or a fixed amount
per vehicle. One rationale for this gender gap could be
that they are more time-constrained.23 The number of
different goods that one carries across the border indeed
22 A second rationale is that own-account traders make the most of a comparative advantage in connecting sellers and buyers in remote villages, where they often sell goods directly to final
consumers.23 Women are also found to be more risk-averse than men in our data.
Figure 11: Female traders are less likely to report negotiable taxes and fees
-20
-10
0
10
20
30
40
Mar
gina
l effe
ct o
n pr
obab
ility
to b
e a
trad
er (%
)
Female Total distancetraveled
Female* totaldistance traveled
Source: Authors’ calculations.Note: The figure displays coefficients from an OLS regression. Country and checkpoints are controlled for. Whiskers represent 95% confidence intervals. “Total distance traveled” refers to the distance between where the goods were purchased (received from the trader) and where they were sold (delivered) by the trader (broker).
0
10
20
30
40
50
80
70
60
Shar
e of
cro
ssin
gs w
ithta
x ne
gotia
ble
(%)
Male traders Female traders
Figure 10: Time constraints as proxied by distance partly explain SSCBT activity choice
Source: Authors’ calculations.Note: Whiskers represent 95% confidence intervals.
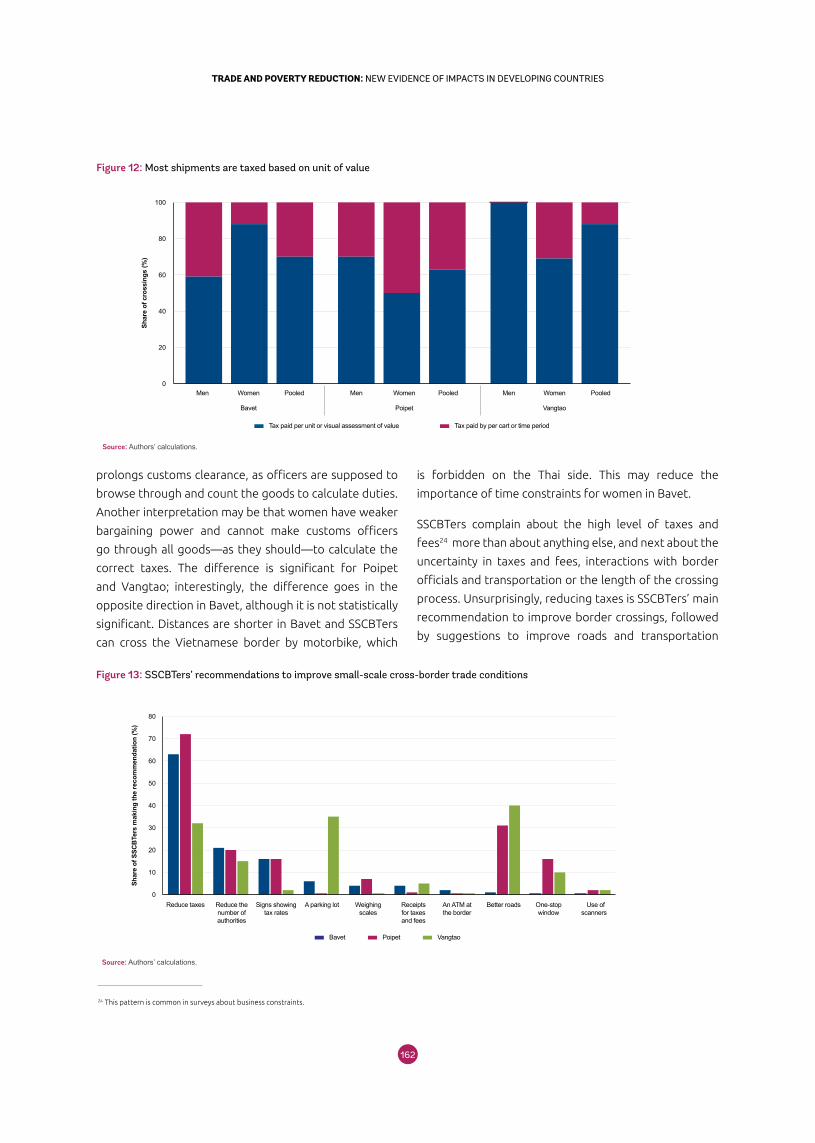
163162
TRADE AND POVERTY REDUCTION: NEW EVIDENCE OF IMPACTS IN DEVELOPING COUNTRIESTRADE AND POVERTY REDUCTION: NEW EVIDENCE OF IMPACTS IN DEVELOPING COUNTRIES
prolongs customs clearance, as officers are supposed to
browse through and count the goods to calculate duties.
Another interpretation may be that women have weaker
bargaining power and cannot make customs officers
go through all goods—as they should—to calculate the
correct taxes. The difference is significant for Poipet
and Vangtao; interestingly, the difference goes in the
opposite direction in Bavet, although it is not statistically
significant. Distances are shorter in Bavet and SSCBTers
can cross the Vietnamese border by motorbike, which
is forbidden on the Thai side. This may reduce the
importance of time constraints for women in Bavet.
SSCBTers complain about the high level of taxes and
fees24 more than about anything else, and next about the
uncertainty in taxes and fees, interactions with border
officials and transportation or the length of the crossing
process. Unsurprisingly, reducing taxes is SSCBTers’ main
recommendation to improve border crossings, followed
by suggestions to improve roads and transportation
Figure 12: Most shipments are taxed based on unit of value
0
20
40
60
80
100
Men Women
Bavet
Pooled Women
Poipet
PooledMen Men Women
Vangtao
Pooled
Tax paid per unit or visual assessment of value Tax paid by per cart or time period
Shar
e of
cro
ssin
gs (%
)
Source: Authors’ calculations.
Figure 13: SSCBTers’ recommendations to improve small-scale cross-border trade conditions
0
10
20
30
40
50
60
70
80
Reduce taxes Reduce thenumber ofauthorities
Signs showingtax rates
Weighingscales
Receiptsfor taxesand fees
A parking lot An ATM atthe border
One-stopwindow
Better roads Use ofscanners
Bavet Poipet Vangtao
Shar
e of
SSC
BTe
rs m
akin
g th
e re
com
men
datio
n (%
)
Source: Authors’ calculations.
24 This pattern is common in surveys about business constraints.
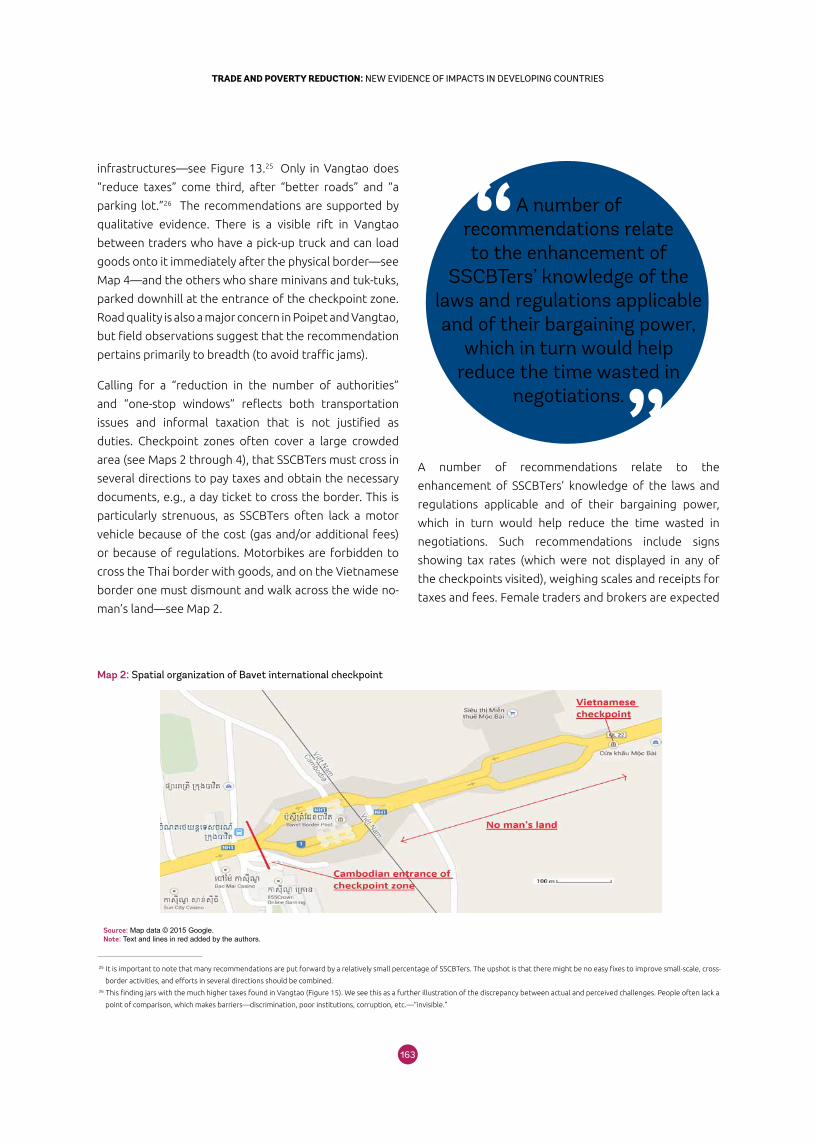
163162
TRADE AND POVERTY REDUCTION: NEW EVIDENCE OF IMPACTS IN DEVELOPING COUNTRIESTRADE AND POVERTY REDUCTION: NEW EVIDENCE OF IMPACTS IN DEVELOPING COUNTRIES
infrastructures—see Figure 13.25 Only in Vangtao does
“reduce taxes” come third, after “better roads” and “a
parking lot.”26 The recommendations are supported by
qualitative evidence. There is a visible rift in Vangtao
between traders who have a pick-up truck and can load
goods onto it immediately after the physical border—see
Map 4—and the others who share minivans and tuk-tuks,
parked downhill at the entrance of the checkpoint zone.
Road quality is also a major concern in Poipet and Vangtao,
but field observations suggest that the recommendation
pertains primarily to breadth (to avoid traffic jams).
Calling for a “reduction in the number of authorities”
and “one-stop windows” reflects both transportation
issues and informal taxation that is not justified as
duties. Checkpoint zones often cover a large crowded
area (see Maps 2 through 4), that SSCBTers must cross in
several directions to pay taxes and obtain the necessary
documents, e.g., a day ticket to cross the border. This is
particularly strenuous, as SSCBTers often lack a motor
vehicle because of the cost (gas and/or additional fees)
or because of regulations. Motorbikes are forbidden to
cross the Thai border with goods, and on the Vietnamese
border one must dismount and walk across the wide no-
man’s land—see Map 2.
A number of recommendations relate to the
enhancement of SSCBTers’ knowledge of the laws and
regulations applicable and of their bargaining power,
which in turn would help reduce the time wasted in
negotiations. Such recommendations include signs
showing tax rates (which were not displayed in any of
the checkpoints visited), weighing scales and receipts for
taxes and fees. Female traders and brokers are expected
Map 2: Spatial organization of Bavet international checkpoint
25 It is important to note that many recommendations are put forward by a relatively small percentage of SSCBTers. The upshot is that there might be no easy fixes to improve small-scale, cross-
border activities, and efforts in several directions should be combined.26 This finding jars with the much higher taxes found in Vangtao (Figure 15). We see this as a further illustration of the discrepancy between actual and perceived challenges. People often lack a
point of comparison, which makes barriers—discrimination, poor institutions, corruption, etc.—“invisible.”
Source: Map data © 2015 Google.Note: Text and lines in red added by the authors.
A number of recommendations relate to the enhancement of
SSCBTers’ knowledge of the laws and regulations applicable and of their bargaining power,
which in turn would help reduce the time wasted in
negotiations.
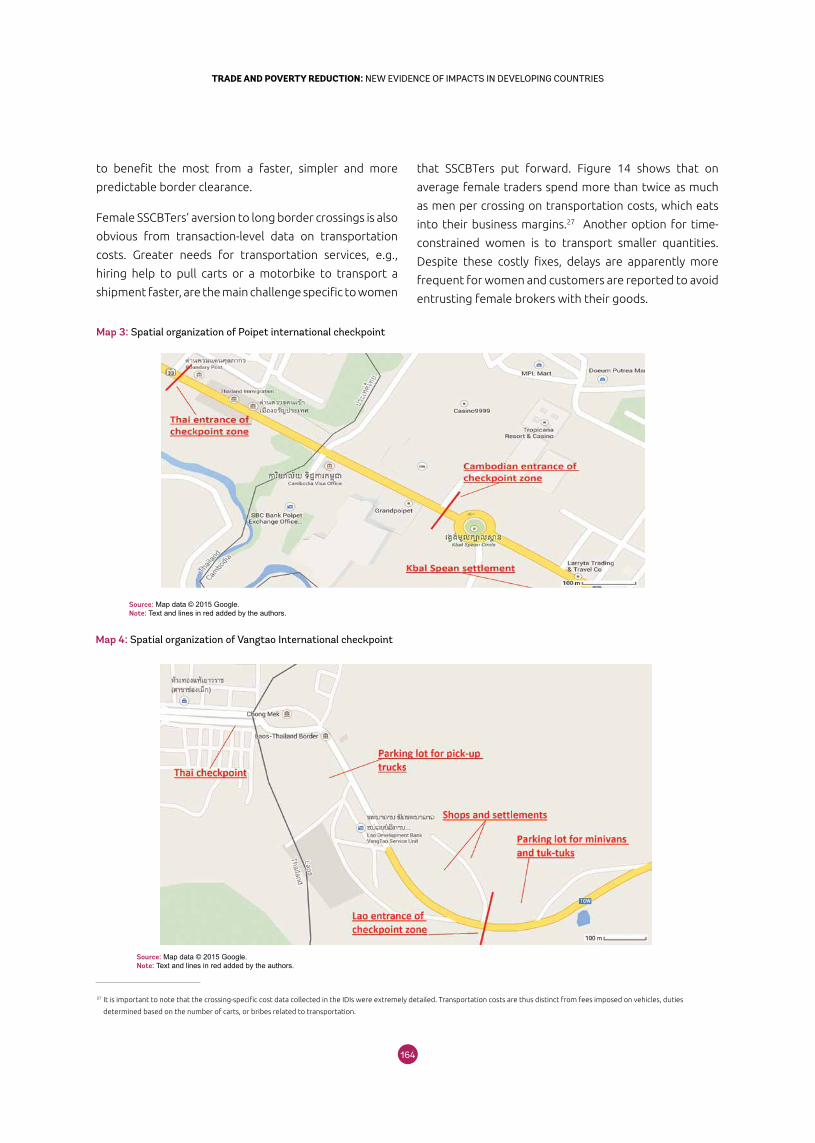
165164
TRADE AND POVERTY REDUCTION: NEW EVIDENCE OF IMPACTS IN DEVELOPING COUNTRIESTRADE AND POVERTY REDUCTION: NEW EVIDENCE OF IMPACTS IN DEVELOPING COUNTRIES
to benefit the most from a faster, simpler and more
predictable border clearance.
Female SSCBTers’ aversion to long border crossings is also
obvious from transaction-level data on transportation
costs. Greater needs for transportation services, e.g.,
hiring help to pull carts or a motorbike to transport a
shipment faster, are the main challenge specific to women
that SSCBTers put forward. Figure 14 shows that on
average female traders spend more than twice as much
as men per crossing on transportation costs, which eats
into their business margins.27 Another option for time-
constrained women is to transport smaller quantities.
Despite these costly fixes, delays are apparently more
frequent for women and customers are reported to avoid
entrusting female brokers with their goods.
Map 3: Spatial organization of Poipet international checkpoint
Source: Map data © 2015 Google.Note: Text and lines in red added by the authors.
Map 4: Spatial organization of Vangtao International checkpoint
Source: Map data © 2015 Google.Note: Text and lines in red added by the authors.
27 It is important to note that the crossing-specific cost data collected in the IDIs were extremely detailed. Transportation costs are thus distinct from fees imposed on vehicles, duties
determined based on the number of carts, or bribes related to transportation.
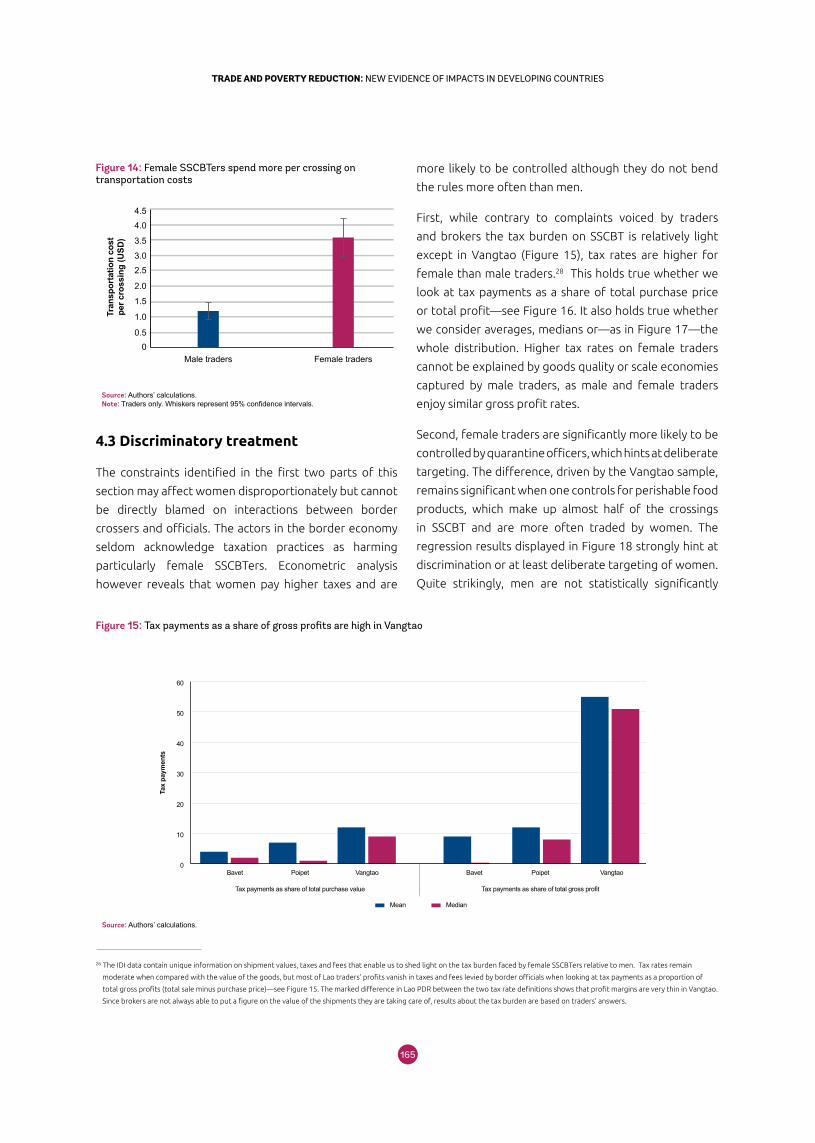
165164
TRADE AND POVERTY REDUCTION: NEW EVIDENCE OF IMPACTS IN DEVELOPING COUNTRIESTRADE AND POVERTY REDUCTION: NEW EVIDENCE OF IMPACTS IN DEVELOPING COUNTRIES
4.3 Discriminatory treatment
The constraints identified in the first two parts of this
section may affect women disproportionately but cannot
be directly blamed on interactions between border
crossers and officials. The actors in the border economy
seldom acknowledge taxation practices as harming
particularly female SSCBTers. Econometric analysis
however reveals that women pay higher taxes and are
more likely to be controlled although they do not bend
the rules more often than men.
First, while contrary to complaints voiced by traders
and brokers the tax burden on SSCBT is relatively light
except in Vangtao (Figure 15), tax rates are higher for
female than male traders.28 This holds true whether we
look at tax payments as a share of total purchase price
or total profit—see Figure 16. It also holds true whether
we consider averages, medians or—as in Figure 17—the
whole distribution. Higher tax rates on female traders
cannot be explained by goods quality or scale economies
captured by male traders, as male and female traders
enjoy similar gross profit rates.
Second, female traders are significantly more likely to be
controlled by quarantine officers, which hints at deliberate
targeting. The difference, driven by the Vangtao sample,
remains significant when one controls for perishable food
products, which make up almost half of the crossings
in SSCBT and are more often traded by women. The
regression results displayed in Figure 18 strongly hint at
discrimination or at least deliberate targeting of women.
Quite strikingly, men are not statistically significantly
Figure 15: Tax payments as a share of gross profits are high in Vangtao
0
10
20
30
40
50
60
Bavet Poipet
Tax payments as share of total purchase value Tax payments as share of total gross profit
Vangtao Bavet Poipet Vangtao
Mean Median
Tax
paym
ents
Source: Authors’ calculations.
Figure 14: Female SSCBTers spend more per crossing on transportation costs
00.5
1.0
1.5
2.0
3.0
2.5
4.5
4.0
3.5
Tran
spor
tatio
n co
stpe
r cro
ssin
g (U
SD)
Male traders Female traders
Source: Authors’ calculations.Note: Traders only. Whiskers represent 95% confidence intervals.
28 The IDI data contain unique information on shipment values, taxes and fees that enable us to shed light on the tax burden faced by female SSCBTers relative to men. Tax rates remain
moderate when compared with the value of the goods, but most of Lao traders’ profits vanish in taxes and fees levied by border officials when looking at tax payments as a proportion of
total gross profits (total sale minus purchase price)—see Figure 15. The marked difference in Lao PDR between the two tax rate definitions shows that profit margins are very thin in Vangtao.
Since brokers are not always able to put a figure on the value of the shipments they are taking care of, results about the tax burden are based on traders’ answers.
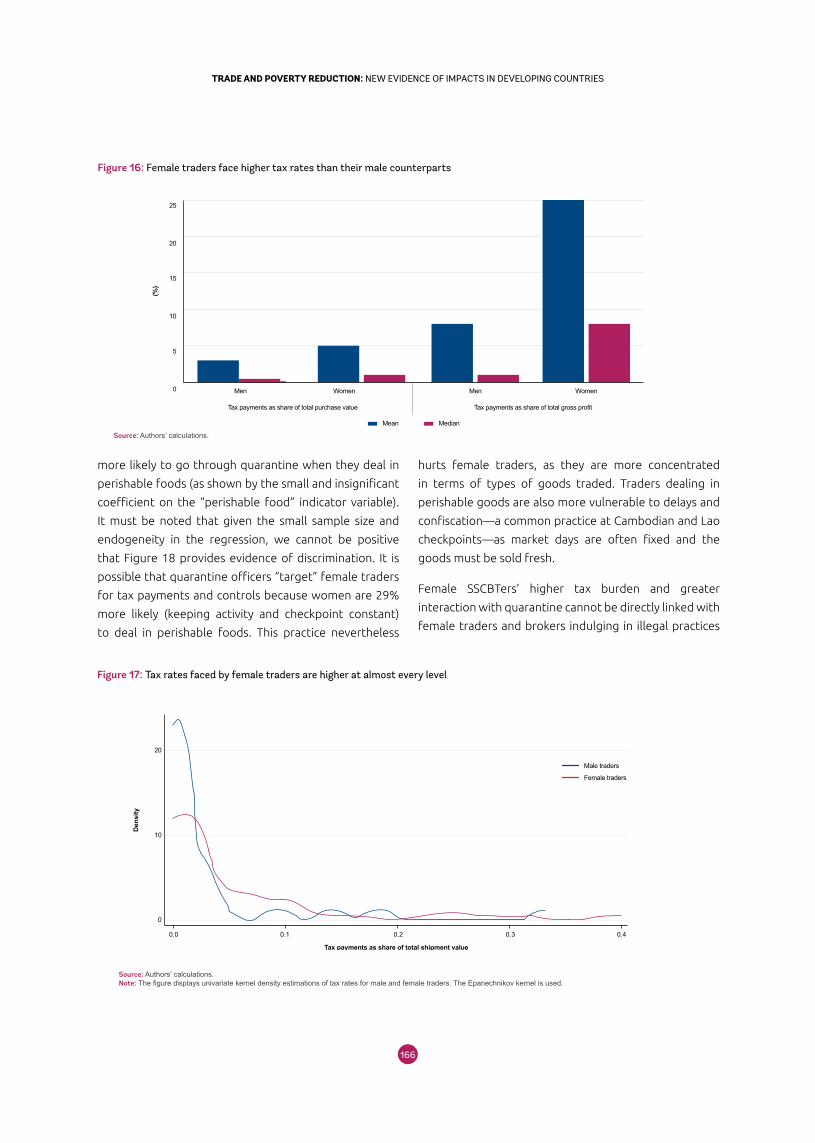
167166
TRADE AND POVERTY REDUCTION: NEW EVIDENCE OF IMPACTS IN DEVELOPING COUNTRIESTRADE AND POVERTY REDUCTION: NEW EVIDENCE OF IMPACTS IN DEVELOPING COUNTRIES
more likely to go through quarantine when they deal in
perishable foods (as shown by the small and insignificant
coefficient on the “perishable food” indicator variable).
It must be noted that given the small sample size and
endogeneity in the regression, we cannot be positive
that Figure 18 provides evidence of discrimination. It is
possible that quarantine officers “target” female traders
for tax payments and controls because women are 29%
more likely (keeping activity and checkpoint constant)
to deal in perishable foods. This practice nevertheless
Figure 16: Female traders face higher tax rates than their male counterparts
0
5
10
15
20
25
Men
Tax payments as share of total purchase value Tax payments as share of total gross profit
Women Men Women
Mean Median
(%)
Source: Authors’ calculations.
hurts female traders, as they are more concentrated
in terms of types of goods traded. Traders dealing in
perishable goods are also more vulnerable to delays and
confiscation—a common practice at Cambodian and Lao
checkpoints—as market days are often fixed and the
goods must be sold fresh.
Female SSCBTers’ higher tax burden and greater
interaction with quarantine cannot be directly linked with
female traders and brokers indulging in illegal practices
Figure 17: Tax rates faced by female traders are higher at almost every level
20
10
0
Tax payments as share of total shipment value
Den
sity
0.0 0.1 0.30.2 0.4
Male traders
Female traders
Source: Authors’ calculations.Note: The figure displays univariate kernel density estimations of tax rates for male and female traders. The Epanechnikov kernel is used.
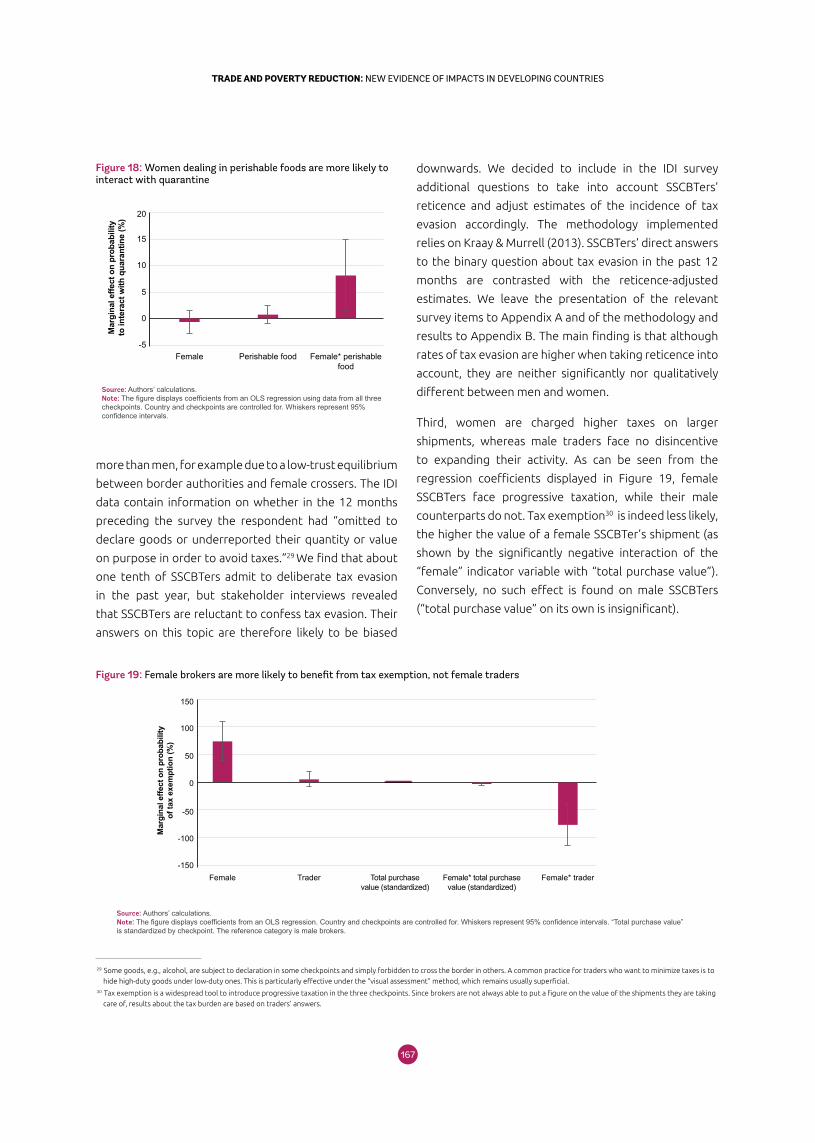
167166
TRADE AND POVERTY REDUCTION: NEW EVIDENCE OF IMPACTS IN DEVELOPING COUNTRIESTRADE AND POVERTY REDUCTION: NEW EVIDENCE OF IMPACTS IN DEVELOPING COUNTRIES
more than men, for example due to a low-trust equilibrium
between border authorities and female crossers. The IDI
data contain information on whether in the 12 months
preceding the survey the respondent had “omitted to
declare goods or underreported their quantity or value
on purpose in order to avoid taxes.”29 We find that about
one tenth of SSCBTers admit to deliberate tax evasion
in the past year, but stakeholder interviews revealed
that SSCBTers are reluctant to confess tax evasion. Their
answers on this topic are therefore likely to be biased
Figure 18: Women dealing in perishable foods are more likely to interact with quarantine
-5
0
5
10
15
20
Mar
gina
l effe
ct o
n pr
obab
ility
to in
tera
ct w
ith q
uara
ntin
e (%
)
Female Perishable food Female* perishablefood
Source: Authors’ calculations.Note: The figure displays coefficients from an OLS regression using data from all three checkpoints. Country and checkpoints are controlled for. Whiskers represent 95% confidence intervals.
downwards. We decided to include in the IDI survey
additional questions to take into account SSCBTers’
reticence and adjust estimates of the incidence of tax
evasion accordingly. The methodology implemented
relies on Kraay & Murrell (2013). SSCBTers’ direct answers
to the binary question about tax evasion in the past 12
months are contrasted with the reticence-adjusted
estimates. We leave the presentation of the relevant
survey items to Appendix A and of the methodology and
results to Appendix B. The main finding is that although
rates of tax evasion are higher when taking reticence into
account, they are neither significantly nor qualitatively
different between men and women.
Third, women are charged higher taxes on larger
shipments, whereas male traders face no disincentive
to expanding their activity. As can be seen from the
regression coefficients displayed in Figure 19, female
SSCBTers face progressive taxation, while their male
counterparts do not. Tax exemption30 is indeed less likely,
the higher the value of a female SSCBTer’s shipment (as
shown by the significantly negative interaction of the
“female” indicator variable with “total purchase value”).
Conversely, no such effect is found on male SSCBTers
(“total purchase value” on its own is insignificant).
Figure 19: Female brokers are more likely to benefit from tax exemption, not female traders
-150
-100
0
-50
50
100
150
Mar
gina
l effe
ct o
n pr
obab
ility
of ta
x ex
empt
ion
(%)
Female Trader Female* traderFemale* total purchasevalue (standardized)
Total purchasevalue (standardized)
Source: Authors’ calculations.Note: The figure displays coefficients from an OLS regression. Country and checkpoints are controlled for. Whiskers represent 95% confidence intervals. “Total purchase value” is standardized by checkpoint. The reference category is male brokers.
29 Some goods, e.g., alcohol, are subject to declaration in some checkpoints and simply forbidden to cross the border in others. A common practice for traders who want to minimize taxes is to
hide high-duty goods under low-duty ones. This is particularly effective under the “visual assessment” method, which remains usually superficial.30 Tax exemption is a widespread tool to introduce progressive taxation in the three checkpoints. Since brokers are not always able to put a figure on the value of the shipments they are taking
care of, results about the tax burden are based on traders’ answers.
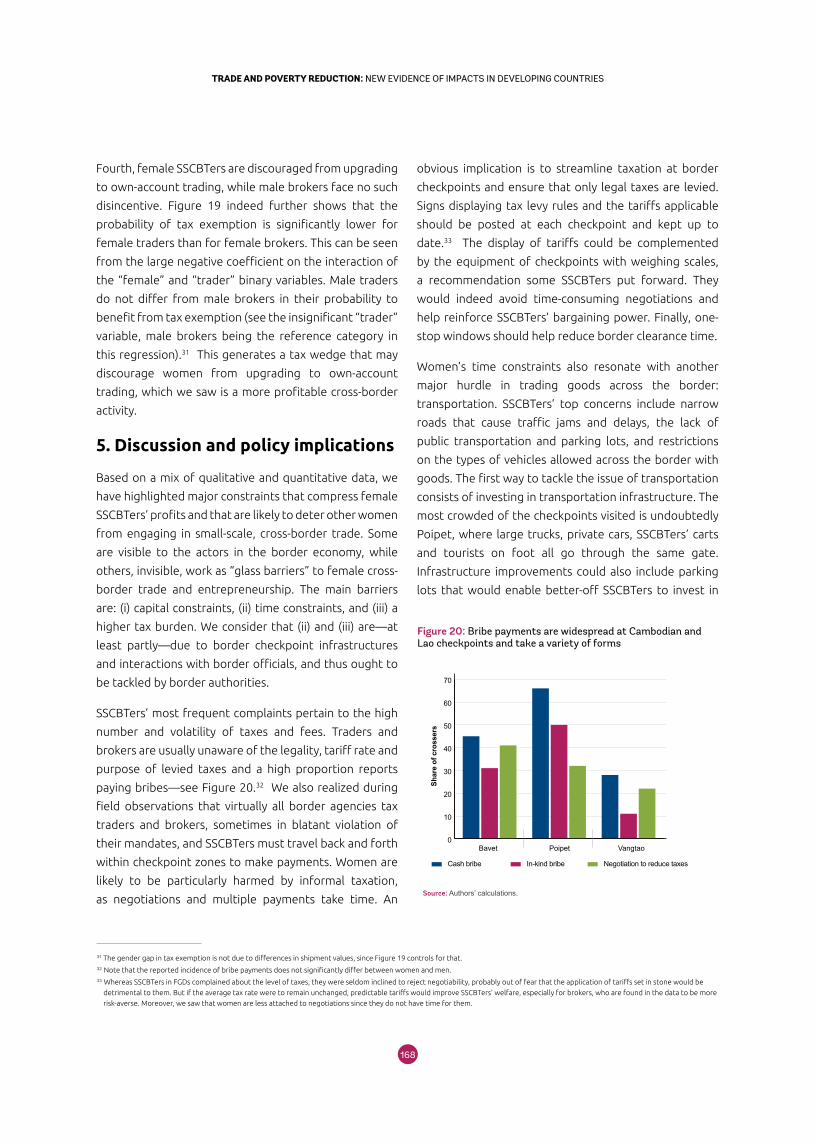
169168
TRADE AND POVERTY REDUCTION: NEW EVIDENCE OF IMPACTS IN DEVELOPING COUNTRIESTRADE AND POVERTY REDUCTION: NEW EVIDENCE OF IMPACTS IN DEVELOPING COUNTRIES
Fourth, female SSCBTers are discouraged from upgrading
to own-account trading, while male brokers face no such
disincentive. Figure 19 indeed further shows that the
probability of tax exemption is significantly lower for
female traders than for female brokers. This can be seen
from the large negative coefficient on the interaction of
the “female” and “trader” binary variables. Male traders
do not differ from male brokers in their probability to
benefit from tax exemption (see the insignificant “trader”
variable, male brokers being the reference category in
this regression).31 This generates a tax wedge that may
discourage women from upgrading to own-account
trading, which we saw is a more profitable cross-border
activity.
5. Discussion and policy implications
Based on a mix of qualitative and quantitative data, we
have highlighted major constraints that compress female
SSCBTers’ profits and that are likely to deter other women
from engaging in small-scale, cross-border trade. Some
are visible to the actors in the border economy, while
others, invisible, work as “glass barriers” to female cross-
border trade and entrepreneurship. The main barriers
are: (i) capital constraints, (ii) time constraints, and (iii) a
higher tax burden. We consider that (ii) and (iii) are—at
least partly—due to border checkpoint infrastructures
and interactions with border officials, and thus ought to
be tackled by border authorities.
SSCBTers’ most frequent complaints pertain to the high
number and volatility of taxes and fees. Traders and
brokers are usually unaware of the legality, tariff rate and
purpose of levied taxes and a high proportion reports
paying bribes—see Figure 20.32 We also realized during
field observations that virtually all border agencies tax
traders and brokers, sometimes in blatant violation of
their mandates, and SSCBTers must travel back and forth
within checkpoint zones to make payments. Women are
likely to be particularly harmed by informal taxation,
as negotiations and multiple payments take time. An
obvious implication is to streamline taxation at border
checkpoints and ensure that only legal taxes are levied.
Signs displaying tax levy rules and the tariffs applicable
should be posted at each checkpoint and kept up to
date.33 The display of tariffs could be complemented
by the equipment of checkpoints with weighing scales,
a recommendation some SSCBTers put forward. They
would indeed avoid time-consuming negotiations and
help reinforce SSCBTers’ bargaining power. Finally, one-
stop windows should help reduce border clearance time.
Women’s time constraints also resonate with another
major hurdle in trading goods across the border:
transportation. SSCBTers’ top concerns include narrow
roads that cause traffic jams and delays, the lack of
public transportation and parking lots, and restrictions
on the types of vehicles allowed across the border with
goods. The first way to tackle the issue of transportation
consists of investing in transportation infrastructure. The
most crowded of the checkpoints visited is undoubtedly
Poipet, where large trucks, private cars, SSCBTers’ carts
and tourists on foot all go through the same gate.
Infrastructure improvements could also include parking
lots that would enable better-off SSCBTers to invest in
Figure 20: Bribe payments are widespread at Cambodian and Lao checkpoints and take a variety of forms
0
10
20
30
40
50
60
70
Bavet Poipet Vangtao
Shar
e of
cro
sser
s
Cash bribe In-kind bribe Negotiation to reduce taxes
Source: Authors’ calculations.
31 The gender gap in tax exemption is not due to differences in shipment values, since Figure 19 controls for that.32 Note that the reported incidence of bribe payments does not significantly differ between women and men. 33 Whereas SSCBTers in FGDs complained about the level of taxes, they were seldom inclined to reject negotiability, probably out of fear that the application of tariffs set in stone would be
detrimental to them. But if the average tax rate were to remain unchanged, predictable tariffs would improve SSCBTers’ welfare, especially for brokers, who are found in the data to be more
risk-averse. Moreover, we saw that women are less attached to negotiations since they do not have time for them.
169168
TRADE AND POVERTY REDUCTION: NEW EVIDENCE OF IMPACTS IN DEVELOPING COUNTRIESTRADE AND POVERTY REDUCTION: NEW EVIDENCE OF IMPACTS IN DEVELOPING COUNTRIES
larger vehicles, or a bus service to the border proper.
Women’s time constraints and high transportation costs
may also be effectively tackled by relieving them of some
of their household duties, for instance through a better
provision of child care—the cost of which could be shared
through a female traders’ association.34
Border-crossing rules need to be altered to facilitate
SSCBT. In Vangtao, SSCBTers refrain from using pick-up
trucks because of the fees attached to crossing the border
with goods in four-wheeled vehicles. Reducing those fees
might be an alternative to enlarging the existing parking
lot. On the border with Thailand, motorbikes are not
allowed to cross with goods, which prevents SSCBTers
from using a cost-effective transportation option and
means that only human-powered carts are available.
On the border with Vietnam riding a motorbike with
goods is forbidden in the checkpoint zone, which forces
traders and brokers to push the heavy shipment for long
distances.
Our findings that women are subject to higher tax rates,
are more often controlled by quarantine and incur much
larger transportation costs are suggestive of “glass
barriers” to female cross-border trade—either hidden
yet real discrimination or challenges that affect women
disproportionately. This is part of the explanation for
the lower share of women in SSCBT compared with
similar jobs in Cambodia and Lao PDR. Such practices
are not justified by a higher propensity to evade taxes,
since women appear no different from men in that
respect, even after adjusting reports for differential
reticence. Training of officials and traders on gender-
based challenges at the border, backed up by monitoring
of the performance of officials could be established to
address these issues together with the establishment of
a complaints and dispute settlement mechanism to allow
women who feel they have been unfairly targeted to
seek redress.
A Charter for Cross-Border Traders and Brokers
reminding all parties in small-scale, cross-border trade—
authorities on both sides of the border, transporters, and
small-scale, cross-border traders and brokers—of their
rights and obligations could be instrumental in improving
border-crossing conditions. The Charter, the exact
contents of which should be discussed with stakeholders,
would list the authorities allowed to operate at border
checkpoints, and which authorities can collect taxes and
fees and which can not. The Charter would also state
rules of conduct, including no discrimination in tax rates
by gender and no verbal or physical violence. Its main
benefits would be to enhance the bargaining power
of the most vulnerable categories of border users and
raise the low level of knowledge of cross-border trade
rules and regulations that characterizes SSCBTers. The
design of the Charter could benefit from experience
from the World Bank’s initiative piloted at the Mwami/
Mchinji crossing between Malawi and Zambia (World
Bank 2014b). As in southern Africa, the Charter would
be displayed at strategic locations, translated into local
languages and disseminated to stakeholder groups.
34 No small-scale traders’ associations exist in Cambodian and Lao checkpoints, but in open discussions about ways to foster small-scale cross-border trade during FGDs, SSCBTers agreed
associations might have a positive impact on their activities. They would however not list them among their recommendations, as they were reluctant to suggest solutions they had never
tried out. Associations have been proven effective in defending female traders’ rights, improving information about prices, providing training and ensuring smooth relationships with border
officials in East Africa.
Our findings that women are subject to higher tax rates, are more often controlled by quarantine and incur much larger transportation costs are suggestive of “glass barriers” to female cross-border trade—either hidden yet real discrimination or challenges that affect women disproportionately.
171170
TRADE AND POVERTY REDUCTION: NEW EVIDENCE OF IMPACTS IN DEVELOPING COUNTRIESTRADE AND POVERTY REDUCTION: NEW EVIDENCE OF IMPACTS IN DEVELOPING COUNTRIES
ReferencesCambodia Development Resource Institute. 2005. “Cambodia’s Cross Border Economy: An Exploratory Study.” Working
Paper 32 by K.A.S. Murshid and Tuot Sokphally, Phnom Penh.
Cambodia Ministry of Agriculture, Fisheries and Forestry. n.d. Agricultural Market Information: Gender Roles in
Agricultural Marketing. Accessed June 6, 2014. http://www.agriculturalmarketinformation.org.kh/en/
information-resources/gender.
EMC. 2012. Time Release Study 2012 Lao PDR. Vientiane: Emerging Markets Consulting, Ltd.
Financial Ministry of the Lao PDR. 2005. “Financial ministerial instruction on the implementation of the law and
enforcing decree to implement the Custom Law No. 05/NA.” Vientiane, May 25.
Hausmann, Ricardo, Bailey Klinger, and Rodrigo Wagner. 2008. “Doing Growth Diagnostics in Practice: A ‘Mindbook’.”
CID Working Paper No. 177, September.
Kraay, Aart, and Peter Murrell. 2013. “Misunderestimating Corruption.” World Bank Policy Research Working Paper
6488.
Kusakabe, Kyoko, Prak Sereyvath, Ubolratana Suntornratana, and Napaporn Sriputinibondh. 2008. “Gendering Border
Spaces: Impact of Open Border Policy Between Cambodia-Thailand on Small-scale Women Fish Traders.” African
and Asian Studies 7: 1-17.
Lesser, Caroline, and Evdokia Moisé-Leeman. 2009. “Informal Cross-Border Trade and Trade Facilitation Reforms in Sub-
Saharan Africa.” OECD Trade Policy Working Paper No. 86.
Ministry of Economy and Finance of the Kingdom of Cambodia. 2005. “Circular on Management of Imported Non-
Commercial Goods No. 009 SHV.” Phnom Penh, December 1.
——. 2010. “Prakas on Procedures of Payment of Duties, Taxes and Other Levies on Imported and Exported Goods No.
571 MEF.BK.” Phnom Penh, August 19.
National Institute of Statistics, Ministry of Planning, Kingdom of Cambodia. 2014. “Cambodia Socio-Economic Survey
2013.” Phnom Penh, July.
Prud’homme, R. 1992. “Informal Local Taxation in Developing Countries.” Environment and Planning C: Government and
Policy 10 (1): 1-17.
UN Women. 2012. Walking in the Dark: Informal Cross-Border Trade in the Great Lakes Region. New York City: UN
Women.
UNIFEM, WB, ADB, UNDP and DFID/UK. 2004. “A Fair Share for Women: Cambodia Gender Assessment.” Phnom Penh.
USAID. 2012. “Women in Cross-Border Agricultural Trade.” Enabling Agricultural Trade Project Policy Brief. no. 4.
October.
Walker, Andrew. 1999. The Legend of the Golden Boat: Regulation, Trade and Traders in the Borderlands of Laos,
Thailand, China and Burma.
171170
TRADE AND POVERTY REDUCTION: NEW EVIDENCE OF IMPACTS IN DEVELOPING COUNTRIESTRADE AND POVERTY REDUCTION: NEW EVIDENCE OF IMPACTS IN DEVELOPING COUNTRIES
Warner, S. 1965. “Randomized-response: A survey technique for eliminating evasive answer bias.” Journal of the
American Statistical Association 60: 63-69.
World Bank. 2014a. Lao PDR Trade and Transport Facilitation Assessment. Vientiane: World Bank.
World Bank. 2014b. The Republic of Zambia Diagnostic Trade Integration Study (DTIS). Washington, D.C.: World Bank.
World Bank. 2012a. Cambodia Lao PDR Trade and Transport Facilitation Assessment. Phnom Penh: World Bank.
World Bank. 2012b. Lao PDR - Mapping the gender dimensions of trade: A preliminary exposition. Vientiane: World Bank.
World Bank. 2012c. Toward Gender Equality in East Asia and the Pacific: A Companion to the World Development Report.
Washington, D.C.: World Bank.
World Bank. 2011. Facilitating Cross-Border Trade between the DRC and Neighbors in the Great Lakes Region of Africa:
Improving Conditions for Poor Traders. Washington, D.C.: World Bank.
——. 2005 and 2009. World Development Indicators. Accessed June 6, 2014. http://databank.worldbank.org/.

173172
TRADE AND POVERTY REDUCTION: NEW EVIDENCE OF IMPACTS IN DEVELOPING COUNTRIESTRADE AND POVERTY REDUCTION: NEW EVIDENCE OF IMPACTS IN DEVELOPING COUNTRIES
Appendix
5.8 In the last 12 months, have you ever omitted to declare goods or underreported their quantity or value on purpose in order to avoid taxes?
□ 1 Yes □ 0 No □ 997 Doesn’t know □ 998 Refuses to answer
Please read out the following script,a making sure the interviewee understands the procedure:Enumerator: Please make sure the card deck is well shuffled (do it a minimum of 5 times before the interview).
I am going to read out a set of questions that describes acts or behaviors that people have expressed. Unlike other questions where you would just respond with a “yes” or “no,” this set has a slight variation to it. Before you answer each question, you will pick a card from this deck. There are 50% of black (spades/clubs) and 50% of red (hearts/diamonds) cards, randomly mixed. Based on which color you pick, I will give you an instruction to provide the appropriate response. Are you ready? I will now read the first question. Please pick a card from the deck, and if it’s a red card, just say YES regardless of whether you have done this or not. If it’s black, please just answer the question. Please do not let me see the card and do not put it back into the deck. This is very important.
1 Yes 0 No
5.9 Have you ever lied to protect yourself? □ □5.10 Have you ever deliberately spoken ill of a member of your family or a friend? □ □5.11 Have you ever deliberately tried to cheat another person? □ □5.12 Have you ever broken a promise? □ □5.13 Have you ever taken something that is not yours without permission and kept it? □ □5.14 Have you ever bought, sold, bartered or been given something that you knew was stolen? □ □5.15 Have you ever mistreated someone because they did not share your opinions or values? □ □5.16 Have you ever been nice to a person only because you thought it would bring you some benefit?b □ □5.17 If you received some extra money that your family did not know about, would you ever hide it from
them and spend it on your own enjoyment? □ □5.18 Have you ever insulted your parents, relatives or other elders? □ □5.19 Have you ever bribed a policeman because you did something wrong on the road? □ □5.20 Have you ever damaged somebody’s property to hurt them? □ □5.21 Have you ever stolen money from a member of your household? □ □Please mix in front of the respondent the cards s/he has picked with the rest of the deck. Do not look at the cards.
a Adapted from Kraay and Murrell (2013).b This question was not exploited in the reticence adjustment procedure because pilot interviews revealed a very high proportion of “Yes,” suggesting a different rate of guilt.
Appendix A. Random-response Procedure included in the IDI Survey
The RRQs included in the IDI questionnaire are presented in the Appendix A. Some of the questions come from Kraay
& Murrell’s battery, which was used in Cambodia among other developing countries to estimate the share of the
population who had been in a situation where a bribe was expected in the past year. The others were developed
based on preliminary observations and qualitative interviews of SSCBTers. They were then fielded along with the other
sections of the survey during pilots in all three checkpoints.
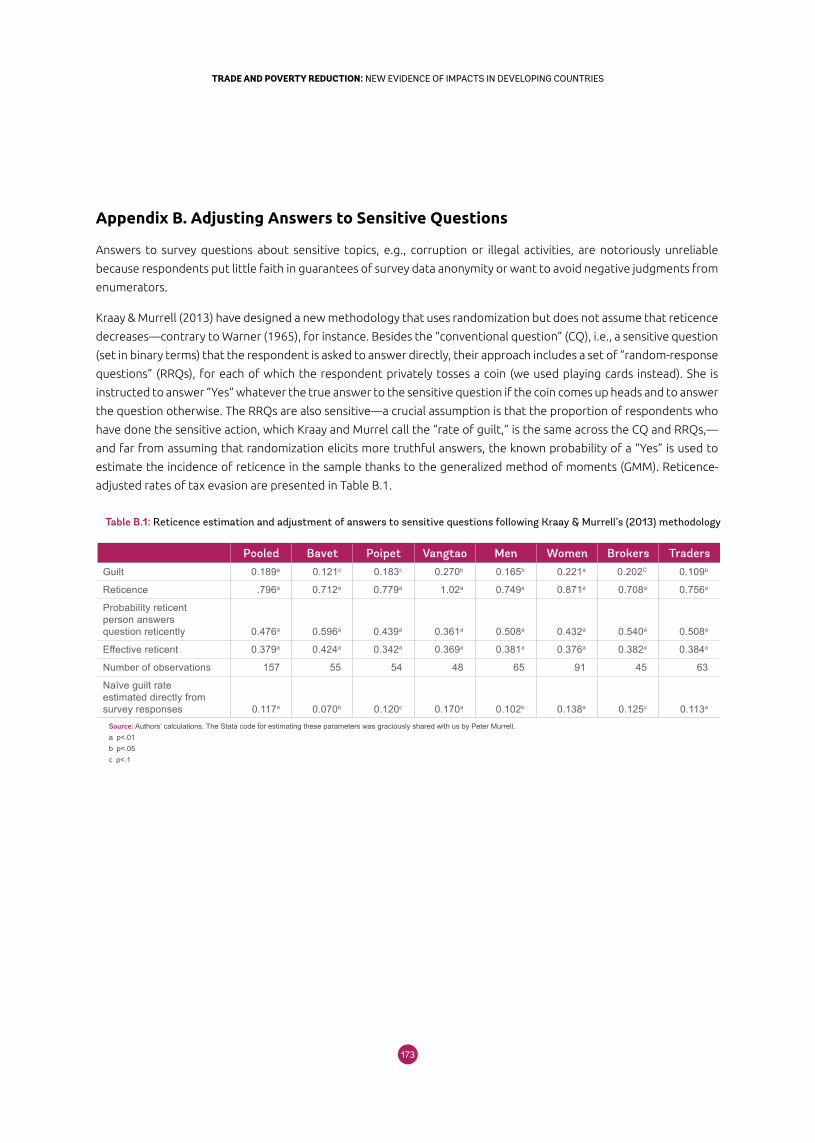
173172
TRADE AND POVERTY REDUCTION: NEW EVIDENCE OF IMPACTS IN DEVELOPING COUNTRIESTRADE AND POVERTY REDUCTION: NEW EVIDENCE OF IMPACTS IN DEVELOPING COUNTRIES
Appendix B. Adjusting Answers to Sensitive Questions
Answers to survey questions about sensitive topics, e.g., corruption or illegal activities, are notoriously unreliable
because respondents put little faith in guarantees of survey data anonymity or want to avoid negative judgments from
enumerators.
Kraay & Murrell (2013) have designed a new methodology that uses randomization but does not assume that reticence
decreases—contrary to Warner (1965), for instance. Besides the “conventional question” (CQ), i.e., a sensitive question
(set in binary terms) that the respondent is asked to answer directly, their approach includes a set of “random-response
questions” (RRQs), for each of which the respondent privately tosses a coin (we used playing cards instead). She is
instructed to answer “Yes” whatever the true answer to the sensitive question if the coin comes up heads and to answer
the question otherwise. The RRQs are also sensitive—a crucial assumption is that the proportion of respondents who
have done the sensitive action, which Kraay and Murrel call the “rate of guilt,” is the same across the CQ and RRQs,—
and far from assuming that randomization elicits more truthful answers, the known probability of a “Yes” is used to
estimate the incidence of reticence in the sample thanks to the generalized method of moments (GMM). Reticence-
adjusted rates of tax evasion are presented in Table B.1.
Table B.1: Reticence estimation and adjustment of answers to sensitive questions following Kraay & Murrell’s (2013) methodology
Pooled Bavet Poipet Vangtao Men Women Brokers TradersGuilt 0.189a 0.121c 0.183c 0.270b 0.165b 0.221a 0.202C 0.109b
Reticence .796a 0.712a 0.779a 1.02a 0.749a 0.871a 0.708a 0.756a
Probability reticent person answers question reticently 0.476a 0.596a 0.439a 0.361a 0.508a 0.432a 0.540a 0.508a
Effective reticent 0.379a 0.424a 0.342a 0.369a 0.381a 0.376a 0.382a 0.384a
Number of observations 157 55 54 48 65 91 45 63
Naïve guilt rate estimated directly from survey responses 0.117a 0.070b 0.120c 0.170a 0.102b 0.138a 0.125c 0.113a
Source: Authors’ calculations. The Stata code for estimating these parameters was graciously shared with us by Peter Murrell.a p<.01b p<.05c p<.1
175174
TRADE AND POVERTY REDUCTION: NEW EVIDENCE OF IMPACTS IN DEVELOPING COUNTRIESTRADE AND POVERTY REDUCTION: NEW EVIDENCE OF IMPACTS IN DEVELOPING COUNTRIES
1. Introduction
Globalization is under fire. Public perceptions
and recent policy debates increasingly appear
to indicate that trade liberalization has been
accompanied by rising income inequality in
developed and developing economies. The fact that trade
liberalization creates both winners and losers has never
been in question. While international trade enhances
economic growth in the aggregate, the distribution of its
benefits may vary by income group, location, gender, and
the formal-informal divide.
The literature on the subject discusses why poor
households may have only marginally benefitted from
trade opening, both as producers and consumers. On
the production side, skilled-biased technological change
associated with trade and FDI is likely to have dampened
the increase in the demand for unskilled labor in
developing economies expected after trade liberalization.
Further, high reallocation costs across sectors, firms and
geographical locations that are particularly burdensome
for poor households affects their ability to move from
contracting to expanding areas of economic opportunity.
On the consumption side, the pass through of lower
prices (resulting from trade liberalization) from the
border to consumers has been affected by high domestic
transport costs and a range of market frictions.1
In analysing the effect of trade opening on greater
economic inclusion, this literature has focused on
the tariff structure in the domestic economy. But the
conditions of access to foreign markets, as determined by
tariff policies of trading partners, are also key to capturing
export opportunities and generating employment and/or
wage gains for poor households. There are, in fact, a few
studies which show that improving conditions of market
access reduce poverty rates.2
What then are the market access conditions for the poor?
Are there ample opportunities for them to reap benefits
from exporting? This is a particularly relevant question
given evidence suggesting that individual countries often
protect their own “poor” (or declining sectors) by raising
tariffs and/or non-tariff barriers on the goods these
households/individuals (or declining sectors) produce.
But, when all countries protect the sectors where the
poor work and if the poor are employed in similar kind of
sectors in different countries, a “coordination problem”
arises: the goods (and services) produced by the poor will
face higher barriers to trade than those provided by the
non-poor, and the resulting decline in the global demand
will lower the price of goods and services that the poor
produce.
Tariff and non-tariff barriers faced by the poor, if relatively
higher, may therefore impair income distribution by
keeping poor workers disconnected from global markets.
Adelina Mendoza, World Trade OrganizationGaurav Nayyar, World Bank
Roberta Piermartini, World Trade Organization
1 For the impact of high domestic transport costs see Nicita (2009), Emran and Hou (2013), and Atkin and Donaldson (2012). For the impact of market frictions see Campa and Goldberg (2002), Atkin and Donaldson (2012), Ural Marchnad (2012) and Han et al. (2016).
2 See, for example, Porto (2010) and McCaig (2011).
Are the “Poor” Getting Globalised?
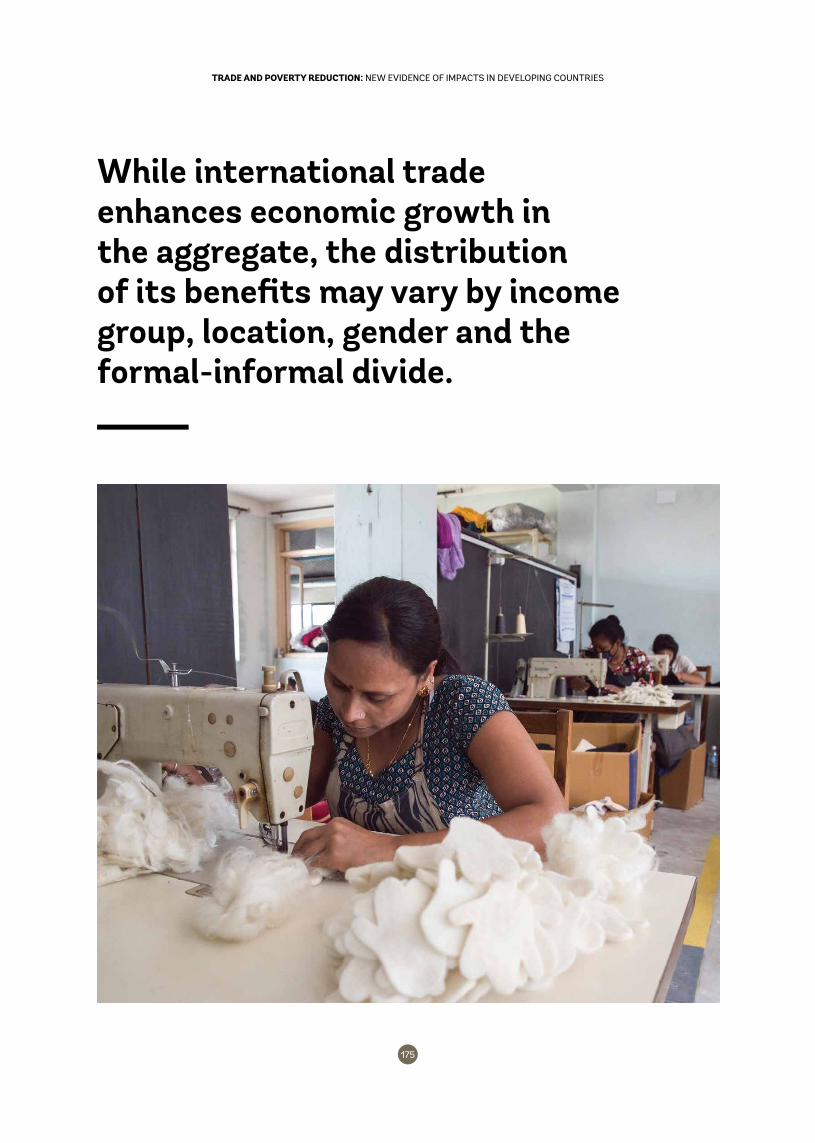
175174
TRADE AND POVERTY REDUCTION: NEW EVIDENCE OF IMPACTS IN DEVELOPING COUNTRIESTRADE AND POVERTY REDUCTION: NEW EVIDENCE OF IMPACTS IN DEVELOPING COUNTRIES
Adelina Mendoza, World Trade OrganizationGaurav Nayyar, World Bank
Roberta Piermartini, World Trade Organization
Are the “Poor” Getting Globalised?
While international trade enhances economic growth in the aggregate, the distribution of its benefits may vary by income group, location, gender and the formal-informal divide.
177176
TRADE AND POVERTY REDUCTION: NEW EVIDENCE OF IMPACTS IN DEVELOPING COUNTRIESTRADE AND POVERTY REDUCTION: NEW EVIDENCE OF IMPACTS IN DEVELOPING COUNTRIES
The potential problem is then not too much globalization,
but too little “inclusive” globalization. This view is in stark
contrast to the rhetoric that is usually seen and heard.
In light of the above, the objective of the paper is to
assess the obstacles that “poor” households in a given
country face when trying to export goods to the rest of
the world. In doing so, it investigates the overall tariff
profile on exports from India. Tariff data is matched with
consumption/income data by the industrial classification
of each household member’s sector of employment.
“Poor” households are not identified by a pre-defined
cut-off in their level of income or consumption, but are
instead analysed along a continuum of decile groups that
form the entire distribution. The scope of “poverty” in
the paper also extends beyond the income dimension
to focus on groups that are often excluded from the
growth process and perhaps are more disconnected from
global trade. These include women, those working in the
informal sector, or those working in rural areas.
The structure of the paper is the following: Section 2
provides a review of the literature. Section 3 outlines the
dataset and methodology. Section 4 describes the results
and Section 5 presents conclusions.
2. Review of the literature
2.1 Trade opening and distributional effects
Trade liberalization, through its impact on prices in
both product and factor markets, affects members of a
household as both producers and consumers (Winters
et al., 2004). In most developing countries, a majority of
poor households rely on labor markets for the bulk of
their income. Standard trade theory predicts that trade
opening increases the demand for the relatively abundant
factor, which suggests that unskilled labor in developing
countries would benefit most from globalization through
a resulting increase in wages or employment or both.
As producers, farm households for example can gain
by selling their output in hitherto unavailable overseas
markets, which may also yield a better return. As
consumers, trade liberalization can be beneficial to the
extent that it reduces the price for imported goods. At
times, these effects can go in opposite directions. For
example, higher prices of agricultural exports would make
the food basket more expensive, which works towards
increases in poverty, but would boost labor demand
and wages, which works towards poverty alleviation.
Therefore, if the household is a net seller—whether of
labor, goods or services—price increases will raise its real
income and vice-versa.
The literature has focused on explaining why the
distributional effects of trade opening, as described
by the theory, depend on a range of other factors in
practice. On the production side, the transfer of skill-
biased technologies associated with trade could reduce
the wages of unskilled labor even in a labor-abundant
country, thereby widening the gap between the rich and
the poor. Similarly, despite shifting low-skilled activities
from rich to poor countries, foreign direct investment
may increase the demand for skilled workers because
jobs which were low skill-intensive in the former may
be relatively skill-intensive in the latter (Wood, 1997).
Further, as trade liberalization reallocates economic
activity across sectors, industries and firms, the short-
run adjustment costs can be high with the burden falling
disproportionately on poor households (Banerjee and
Newman, 2004).
Given the high reallocation costs across geographical
regions within countries, the poor may also only
marginally benefit from greater openness due to sectoral
variation in patterns of trade liberalization combined
with spatial variation in the industrial composition of
the labor force. Take, for instance, evidence from India
which suggests that rural areas with a high concentration
of industries that were disproportionately affected by
tariff reductions experienced slower progress in poverty
reduction (Topalova, 2010). With perfect factor mobility
across regions, labor would migrate in response to wage
and price shocks, equalizing the incidence of poverty
across regions, but the low incidence of internal migration
in India is striking (Kone et al., 2016). Similarly, local labor
markets in Brazil where workers were concentrated in
industries facing the largest tariff cuts were generally
affected more negatively (Kovak, 2013).
The extent to which households benefit from trade
liberalization on the consumption side depends on a
range of factors that influence the pass-through of
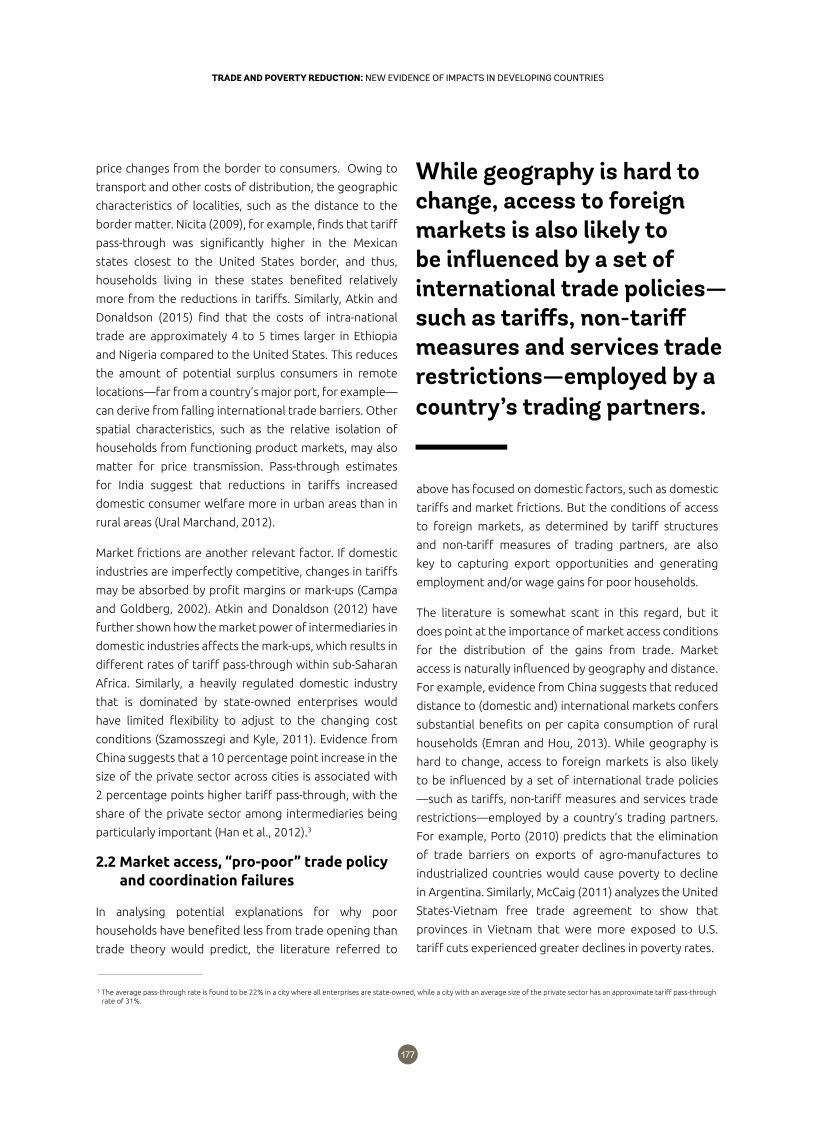
177176
TRADE AND POVERTY REDUCTION: NEW EVIDENCE OF IMPACTS IN DEVELOPING COUNTRIESTRADE AND POVERTY REDUCTION: NEW EVIDENCE OF IMPACTS IN DEVELOPING COUNTRIES
price changes from the border to consumers. Owing to
transport and other costs of distribution, the geographic
characteristics of localities, such as the distance to the
border matter. Nicita (2009), for example, finds that tariff
pass-through was significantly higher in the Mexican
states closest to the United States border, and thus,
households living in these states benefited relatively
more from the reductions in tariffs. Similarly, Atkin and
Donaldson (2015) find that the costs of intra-national
trade are approximately 4 to 5 times larger in Ethiopia
and Nigeria compared to the United States. This reduces
the amount of potential surplus consumers in remote
locations—far from a country’s major port, for example—
can derive from falling international trade barriers. Other
spatial characteristics, such as the relative isolation of
households from functioning product markets, may also
matter for price transmission. Pass-through estimates
for India suggest that reductions in tariffs increased
domestic consumer welfare more in urban areas than in
rural areas (Ural Marchand, 2012).
Market frictions are another relevant factor. If domestic
industries are imperfectly competitive, changes in tariffs
may be absorbed by profit margins or mark-ups (Campa
and Goldberg, 2002). Atkin and Donaldson (2012) have
further shown how the market power of intermediaries in
domestic industries affects the mark-ups, which results in
different rates of tariff pass-through within sub-Saharan
Africa. Similarly, a heavily regulated domestic industry
that is dominated by state-owned enterprises would
have limited flexibility to adjust to the changing cost
conditions (Szamosszegi and Kyle, 2011). Evidence from
China suggests that a 10 percentage point increase in the
size of the private sector across cities is associated with
2 percentage points higher tariff pass-through, with the
share of the private sector among intermediaries being
particularly important (Han et al., 2012).3
2.2 Market access, “pro-poor” trade policy and coordination failures
In analysing potential explanations for why poor
households have benefited less from trade opening than
trade theory would predict, the literature referred to
above has focused on domestic factors, such as domestic
tariffs and market frictions. But the conditions of access
to foreign markets, as determined by tariff structures
and non-tariff measures of trading partners, are also
key to capturing export opportunities and generating
employment and/or wage gains for poor households.
The literature is somewhat scant in this regard, but it
does point at the importance of market access conditions
for the distribution of the gains from trade. Market
access is naturally influenced by geography and distance.
For example, evidence from China suggests that reduced
distance to (domestic and) international markets confers
substantial benefits on per capita consumption of rural
households (Emran and Hou, 2013). While geography is
hard to change, access to foreign markets is also likely
to be influenced by a set of international trade policies
—such as tariffs, non-tariff measures and services trade
restrictions—employed by a country’s trading partners.
For example, Porto (2010) predicts that the elimination
of trade barriers on exports of agro-manufactures to
industrialized countries would cause poverty to decline
in Argentina. Similarly, McCaig (2011) analyzes the United
States-Vietnam free trade agreement to show that
provinces in Vietnam that were more exposed to U.S.
tariff cuts experienced greater declines in poverty rates.
3 The average pass-through rate is found to be 22% in a city where all enterprises are state-owned, while a city with an average size of the private sector has an approximate tariff pass-through rate of 31%.
While geography is hard to change, access to foreign markets is also likely to be influenced by a set of international trade policies—such as tariffs, non-tariff measures and services trade restrictions—employed by a country’s trading partners.
179178
TRADE AND POVERTY REDUCTION: NEW EVIDENCE OF IMPACTS IN DEVELOPING COUNTRIESTRADE AND POVERTY REDUCTION: NEW EVIDENCE OF IMPACTS IN DEVELOPING COUNTRIES
One aspect that the existing literature has neglected
is how domestic trade policies of individual countries,
when considered together, affect access of “poor” and
“rich” households to foreign markets differentially. This
is particularly important in light of evidence of countries
implementing trade (and trade-related) policies that
favor poor households. For example, relying on data
for six Sub-Saharan African (SSA) countries, Nicita et al.
(2014) finds that SSA’s trade policies have a systematic
“pro-poor” bias,4 that is, trade policies redistribute income
from rich to poor households. This is mostly explained by
protection granted to agricultural products that are sold
by poor households—the positive labor income effect
dominates the impact of higher consumption prices and
other forces that benefit skilled over unskilled workers.
The question is what if all countries apply “pro-poor”
trade policies and if the poor are employed in similar
kinds of sectors in different countries?
Strategies that use trade protection to assist poor
households are unlikely to be effective if one also
considers general equilibrium effects.5 There is the
possibility of a “coordination problem” whereby poor
households are less able to benefit from globalization
because they are excluded from the process. Consider
the following. In order to protect producers from low
prices of competing products from the rest of the world,
countries increase import tariffs and other non-tariff
barriers on sectors that employ a large proportion of
those classified as “poor.” If this done by a sufficiently
large number of countries, which together constitute a
“large” country that is a “price-maker” in the world market,
the resulting decline in global demand will lower the price
of goods and services that the poor produce. As a result,
“poor” households will either not be price competitive to
export to markets that have implemented measures of
protection or will receive a lower price in export markets
that have not implemented these measures.
The coordination problem with regard to import
restrictions described here mirrors the literature on
export restrictions and food price volatility (Abbott,
2012; Ivanic and Martin, 2014; Gouel, 2016). Countries
frequently use export restrictions to protect poor
consumers from high or volatile prices on the world
market. However, when countries simultaneously
respond to higher international prices for food, say
rise, by unilaterally imposing export restrictions, the
international price of the commodity in question will only
further increase. Consequently, the “poor” consumers
of this food commodity in countries that imposed the
export restrictions may be unable to benefit from lower
domestic prices.
3. Data and methodology
3.1 Matching household survey data with tariffs and NTMs
The paper uses a novel approach to assess barriers that
individual producers across the income distribution face in
international markets. In doing so, it combines household
survey data on income and consumption from India (see
Box 1) with information on lowest applied tariffs in the
top 15 destination markets (EU counted as one) for
Indian products in 2012.6 This is done by matching India’s
National Industrial Classification (NIC)—which is based
on the International Standard of Industry Classification
(ISIC)—of an individual’s sector of employment, with
tariffs faced in India’s major export markets at the
Harmonized System subheading (6-digit) level.7 The
same concordance was used to determine the variability
of non-tariff measures (NTMs) imposed on imports from
India by the same top importers for the same reference
year across different sectors.8 The number of (NTMs)
applied to India in this analysis includes those applied by
these partners on an MFN basis, e.g., those NTMs that are
not targeted specifically at India but at all exporters to
that country.
The ISIC - HS correlation is not a full match concordance table.
There are ISIC codes for which there is no corresponding HS
4 The authors analyse how reductions in tariffs and non-tariff barriers affect consumer and producer prices, which in turn affect welfare of the average household in the top and bottom 40% of the income distribution defined by household production, household consumption, labor earnings and government transfers.
5 The literature also discusses foregone opportunities driven by dynamic effects. Using protectionist policies to assist the poor may actually harm the poor by limiting productivity increases and structural transformation.
6 These importers account for more than 75% of world imports from India.7 The tariffs at the HS subheading level matched with the ISIC code are averages weighted by the value of imports from each partner. We also look at how much the tariffs faced have declined
from their 1996 level for specific identified sectors. To calculate the reduction in tariffs, the same methodology was used to match tariffs in 1996 for the same partners.8 The data on NTMs were extracted from the WTO’s NTM database—I-TIP. The database shows the number of NTMs by type—SPS, TBT, ADP, CV, SSG, SG, QR, TRQ and XS—in each HS chapter.
179178
TRADE AND POVERTY REDUCTION: NEW EVIDENCE OF IMPACTS IN DEVELOPING COUNTRIESTRADE AND POVERTY REDUCTION: NEW EVIDENCE OF IMPACTS IN DEVELOPING COUNTRIES
code. Hence the analysis only includes activities in which
the associated good/s can be identified with the HS code.
For example, some ISIC codes which refer to construction
(e.g., ISIC “4100 - Construction of buildings”) do not have
a matching HS code, and such observations were dropped
from the calculation of the statistics.9 For the analysis of
NTMs, the statistics were done only on total NTMs without
breakdown by type of NTM.
3.2 Defining the “poor” or “excluded”
In this study, economic “poverty” is measured as a
relative phenomenon based on the analysis of income/
consumption for the entire distribution by decile group.
Consumption expenditure is widely accepted as a proxy
Box 1: Household Survey Data on Employment, Income and Consumption from India
The Government of India’s National Sample Survey Office (NSSO) regularly conducts national household surveys on the subjects of employment and consumption. For the present exercise, the data are taken from the 68th round conducted during the period from July 2011 to June 2012, specifically survey data collected from the questionnaire referred to as “Schedule 10: Employment and Unemployment”. The number of households surveyed was 101,724 (59,700 in rural areas and 42,024 in urban areas). These sample households correspond to 456,999 individuals (280,763 in rural areas and 176,236 in urban areas).
In the employment survey, an individual’s sector of employment is based on activities pursued during certain specified reference periods: one year, one week and each day of the reference week. The activity status determined on the basis of each reference period is referred to as “usual status,” “current weekly status” and “current daily status,” respectively. The “usual status” approach is generally preferred as it is based on a relatively longer time horizon. Nonetheless, the current weekly status approach is important in any analysis of wages because these are expressed in weekly terms. Each approach is guided by the “majority time spent” criterion. For instance, under the “usual status” approach, an individual is considered “employed” in a particular industry if he or she spent the majority of his or her time in the last 365 days on that economic activity, rather than being unemployed or engaged in non-economic activities.
The paper analyzed two correlated datasets from the survey in order to identify the relevant sector of employment.
1. The first relates household-level data based on usual status of the sector of employment of the household head with the corresponding household weekly consumption. Each observation refers to a household with its attendant characteristics, including the rural versus urban distinction. Household weekly consumption was used as proxy for income.
2. The second relates individual-level data based on members within the household reporting an economic activity and corresponding income from such activity during the reference week. The economic activity is the usual principal activity of the household member. Additional information on gender and type of the enterprise (formal or informal based on the number of employees) is also available from this dataset, which provides an added dimension in the analysis of the data.
The advantage of using household consumption levels as a proxy for income is that wage-based data do not include income received by self-employed individuals. Analysis of household-level data was purely based on consumption, even if there are individuals within the household that reported income. For the dataset based on individual respondents, individuals (15 years and above, excluding those studying full time) who had an activity during the week and reported its corresponding earnings are included.
for income owing to the difficulty of getting reliable
quantitative data on household income through direct
enquiries in household surveys (see Box 1). Additional
variables in the data enabled us to also look at groups
traditionally excluded from the process of economic
growth—women, those working in rural areas and those
employed in the informal sector.
4. Results
4.1 Tariffs faced in the export market are inversely related to income
Using household level data, the average income (using
consumption as proxy) and tariff faced in export
9 Only observations of selected respondents who work in ISIC sectors where a correlation with HS (hence tariffs) exists (32% of respondents) are included in the study. The other 68% work in ISIC sectors that do not have ISIC-HS correlation code. This is mainly an issue related to services sectors. Our study, therefore, has to be seen as an analysis of merchandise sectors only.
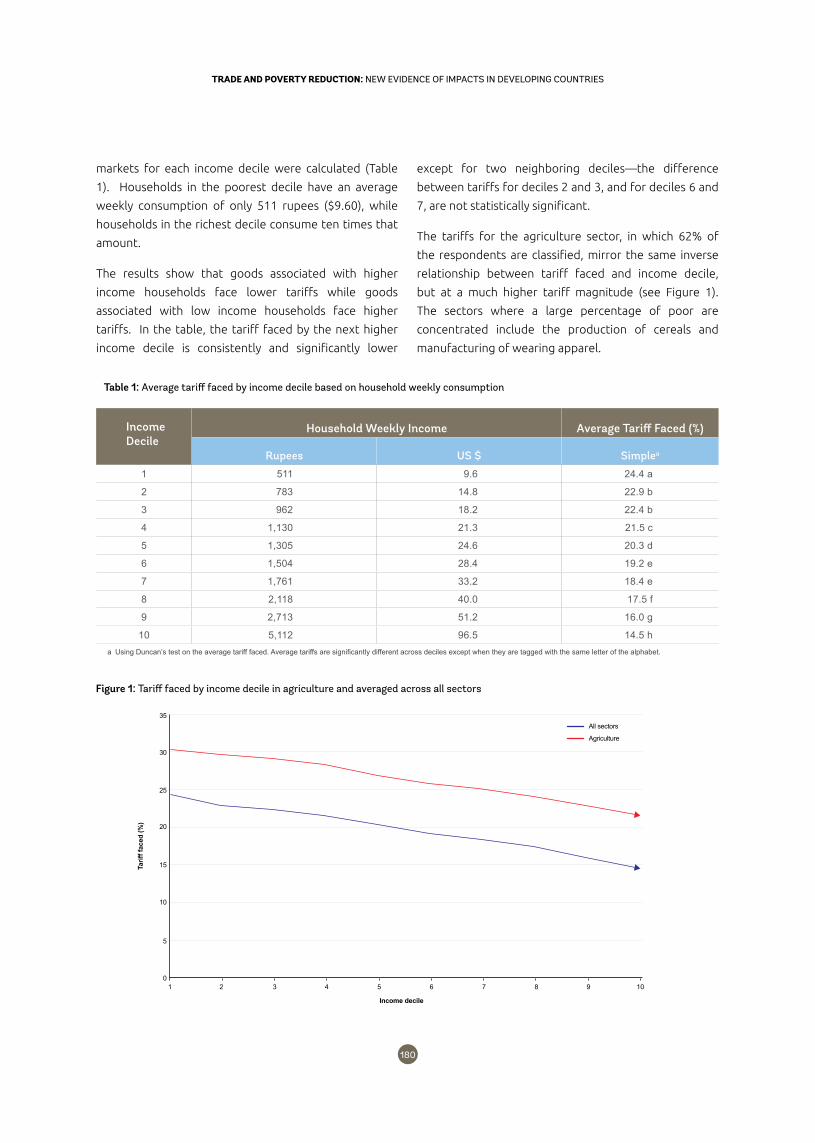
181180
TRADE AND POVERTY REDUCTION: NEW EVIDENCE OF IMPACTS IN DEVELOPING COUNTRIESTRADE AND POVERTY REDUCTION: NEW EVIDENCE OF IMPACTS IN DEVELOPING COUNTRIES
markets for each income decile were calculated (Table
1). Households in the poorest decile have an average
weekly consumption of only 511 rupees ($9.60), while
households in the richest decile consume ten times that
amount.
The results show that goods associated with higher
income households face lower tariffs while goods
associated with low income households face higher
tariffs. In the table, the tariff faced by the next higher
income decile is consistently and significantly lower
except for two neighboring deciles—the difference
between tariffs for deciles 2 and 3, and for deciles 6 and
7, are not statistically significant.
The tariffs for the agriculture sector, in which 62% of
the respondents are classified, mirror the same inverse
relationship between tariff faced and income decile,
but at a much higher tariff magnitude (see Figure 1).
The sectors where a large percentage of poor are
concentrated include the production of cereals and
manufacturing of wearing apparel.
Table 1: Average tariff faced by income decile based on household weekly consumption
IncomeDecile
Household Weekly Income Average Tariff Faced (%)
Rupees US $ Simplea
1 511 9.6 24.4 a
2 783 14.8 22.9 b
3 962 18.2 22.4 b
4 1,130 21.3 21.5 c
5 1,305 24.6 20.3 d
6 1,504 28.4 19.2 e
7 1,761 33.2 18.4 e
8 2,118 40.0 17.5 f
9 2,713 51.2 16.0 g
10 5,112 96.5 14.5 ha Using Duncan’s test on the average tariff faced. Average tariffs are significantly different across deciles except when they are tagged with the same letter of the alphabet.
30
35
25
20
15
10
5
0
Income decile
Tarif
f fac
ed (%
)
1 52 3 4 8 96 7 10
All sectors
Agriculture
Figure 1: Tariff faced by income decile in agriculture and averaged across all sectors
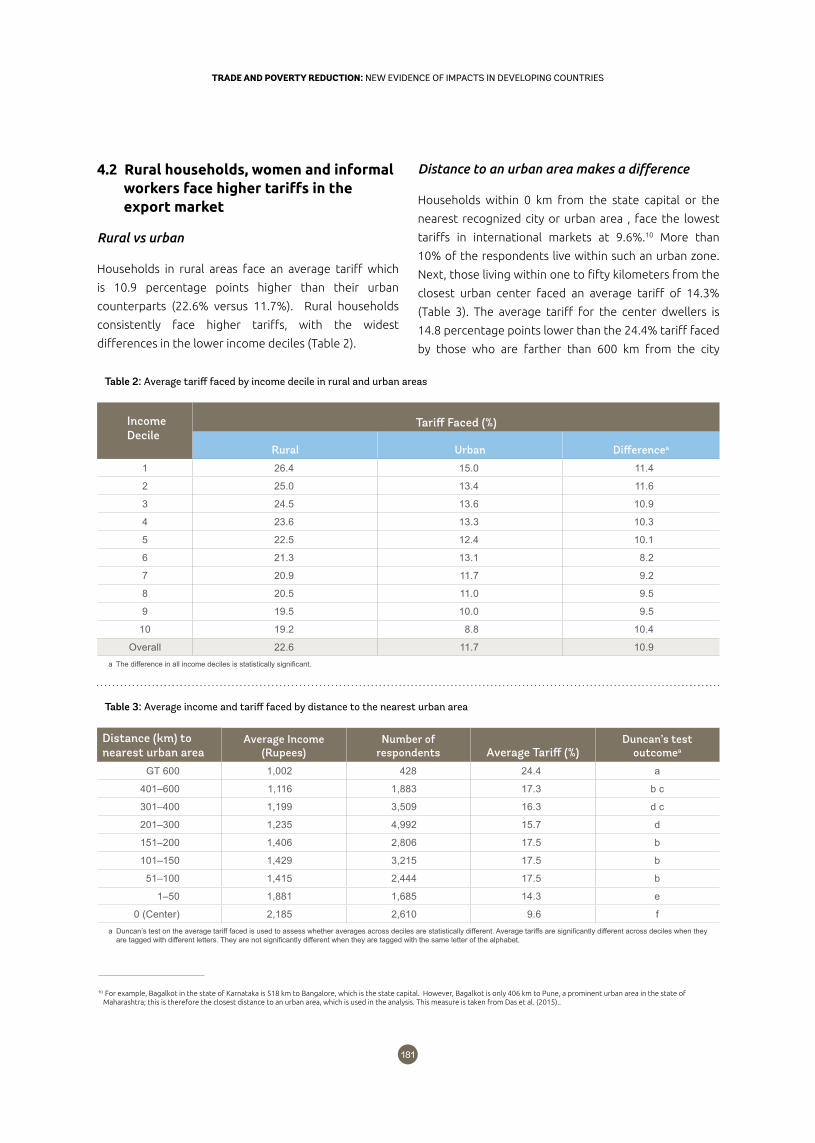
181180
TRADE AND POVERTY REDUCTION: NEW EVIDENCE OF IMPACTS IN DEVELOPING COUNTRIESTRADE AND POVERTY REDUCTION: NEW EVIDENCE OF IMPACTS IN DEVELOPING COUNTRIES
4.2 Rural households, women and informal workers face higher tariffs in the export market
Rural vs urban
Households in rural areas face an average tariff which
is 10.9 percentage points higher than their urban
counterparts (22.6% versus 11.7%). Rural households
consistently face higher tariffs, with the widest
differences in the lower income deciles (Table 2).
Distance to an urban area makes a difference
Households within 0 km from the state capital or the
nearest recognized city or urban area , face the lowest
tariffs in international markets at 9.6%.10 More than
10% of the respondents live within such an urban zone.
Next, those living within one to fifty kilometers from the
closest urban center faced an average tariff of 14.3%
(Table 3). The average tariff for the center dwellers is
14.8 percentage points lower than the 24.4% tariff faced
by those who are farther than 600 km from the city
Table 2: Average tariff faced by income decile in rural and urban areas
IncomeDecile
Tariff Faced (%)
Rural Urban Differencea
1 26.4 15.0 11.4
2 25.0 13.4 11.6
3 24.5 13.6 10.9
4 23.6 13.3 10.3
5 22.5 12.4 10.1
6 21.3 13.1 8.2
7 20.9 11.7 9.2
8 20.5 11.0 9.5
9 19.5 10.0 9.5
10 19.2 8.8 10.4
Overall 22.6 11.7 10.9a The difference in all income deciles is statistically significant.
Table 3: Average income and tariff faced by distance to the nearest urban area
Distance (km) to nearest urban area
Average Income (Rupees)
Number of respondents Average Tariff (%)
Duncan’s test outcomea
GT 600 1,002 428 24.4 a
401–600 1,116 1,883 17.3 b c
301–400 1,199 3,509 16.3 d c
201–300 1,235 4,992 15.7 d
151–200 1,406 2,806 17.5 b
101–150 1,429 3,215 17.5 b
51–100 1,415 2,444 17.5 b
1–50 1,881 1,685 14.3 e
0 (Center) 2,185 2,610 9.6 fa Duncan’s test on the average tariff faced is used to assess whether averages across deciles are statistically different. Average tariffs are significantly different across deciles when they
are tagged with different letters. They are not significantly different when they are tagged with the same letter of the alphabet.
10 For example, Bagalkot in the state of Karnataka is 518 km to Bangalore, which is the state capital. However, Bagalkot is only 406 km to Pune, a prominent urban area in the state of Maharashtra; this is therefore the closest distance to an urban area, which is used in the analysis. This measure is taken from Das et al. (2015)..
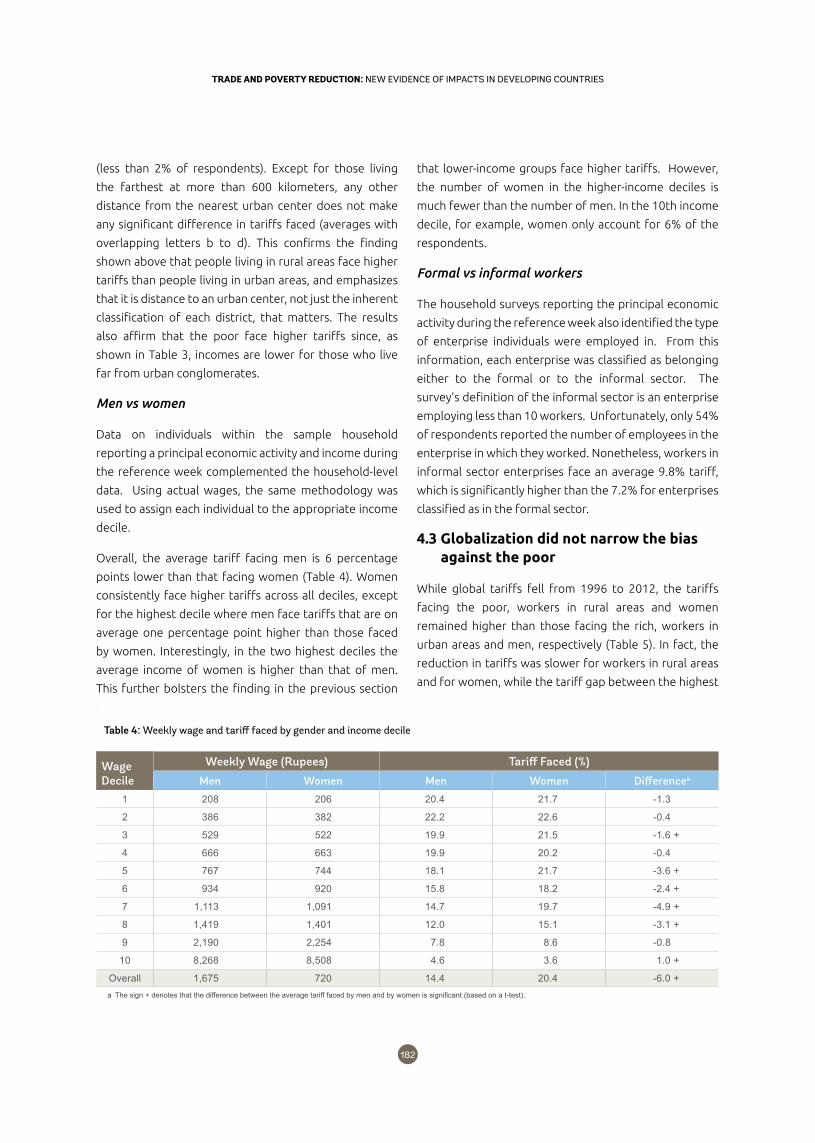
183182
TRADE AND POVERTY REDUCTION: NEW EVIDENCE OF IMPACTS IN DEVELOPING COUNTRIESTRADE AND POVERTY REDUCTION: NEW EVIDENCE OF IMPACTS IN DEVELOPING COUNTRIES
(less than 2% of respondents). Except for those living
the farthest at more than 600 kilometers, any other
distance from the nearest urban center does not make
any significant difference in tariffs faced (averages with
overlapping letters b to d). This confirms the finding
shown above that people living in rural areas face higher
tariffs than people living in urban areas, and emphasizes
that it is distance to an urban center, not just the inherent
classification of each district, that matters. The results
also affirm that the poor face higher tariffs since, as
shown in Table 3, incomes are lower for those who live
far from urban conglomerates.
Men vs women
Data on individuals within the sample household
reporting a principal economic activity and income during
the reference week complemented the household-level
data. Using actual wages, the same methodology was
used to assign each individual to the appropriate income
decile.
Overall, the average tariff facing men is 6 percentage
points lower than that facing women (Table 4). Women
consistently face higher tariffs across all deciles, except
for the highest decile where men face tariffs that are on
average one percentage point higher than those faced
by women. Interestingly, in the two highest deciles the
average income of women is higher than that of men.
This further bolsters the finding in the previous section
that lower-income groups face higher tariffs. However,
the number of women in the higher-income deciles is
much fewer than the number of men. In the 10th income
decile, for example, women only account for 6% of the
respondents.
Formal vs informal workers
The household surveys reporting the principal economic
activity during the reference week also identified the type
of enterprise individuals were employed in. From this
information, each enterprise was classified as belonging
either to the formal or to the informal sector. The
survey’s definition of the informal sector is an enterprise
employing less than 10 workers. Unfortunately, only 54%
of respondents reported the number of employees in the
enterprise in which they worked. Nonetheless, workers in
informal sector enterprises face an average 9.8% tariff,
which is significantly higher than the 7.2% for enterprises
classified as in the formal sector.
4.3 Globalization did not narrow the bias against the poor
While global tariffs fell from 1996 to 2012, the tariffs
facing the poor, workers in rural areas and women
remained higher than those facing the rich, workers in
urban areas and men, respectively (Table 5). In fact, the
reduction in tariffs was slower for workers in rural areas
and for women, while the tariff gap between the highest
Table 4: Weekly wage and tariff faced by gender and income decile
Wage Decile
Weekly Wage (Rupees) Tariff Faced (%)
Men Women Men Women Differencea
1 208 206 20.4 21.7 -1.3
2 386 382 22.2 22.6 -0.4
3 529 522 19.9 21.5 -1.6 +
4 666 663 19.9 20.2 -0.4
5 767 744 18.1 21.7 -3.6 +
6 934 920 15.8 18.2 -2.4 +
7 1,113 1,091 14.7 19.7 -4.9 +
8 1,419 1,401 12.0 15.1 -3.1 +
9 2,190 2,254 7.8 8.6 -0.8
10 8,268 8,508 4.6 3.6 1.0 +
Overall 1,675 720 14.4 20.4 -6.0 +a The sign + denotes that the difference between the average tariff faced by men and by women is significant (based on a t-test).
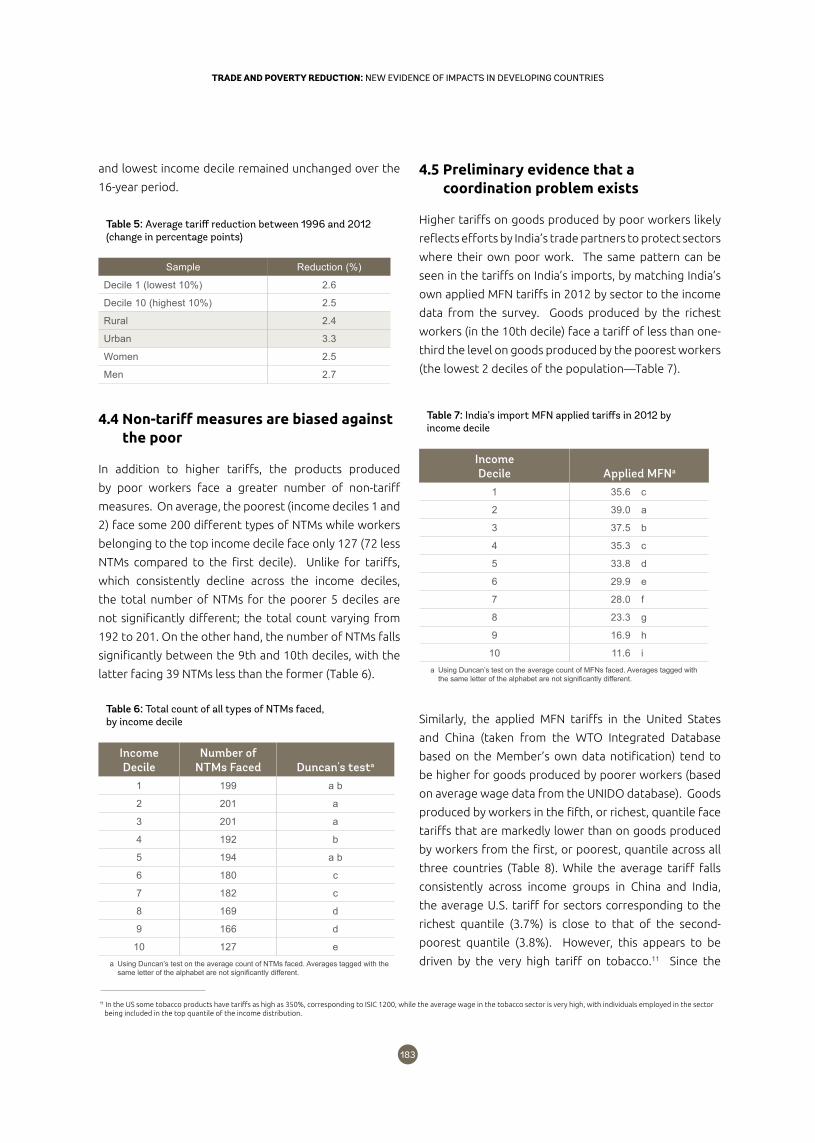
183182
TRADE AND POVERTY REDUCTION: NEW EVIDENCE OF IMPACTS IN DEVELOPING COUNTRIESTRADE AND POVERTY REDUCTION: NEW EVIDENCE OF IMPACTS IN DEVELOPING COUNTRIES
Table 5: Average tariff reduction between 1996 and 2012 (change in percentage points)
Sample Reduction (%)
Decile 1 (lowest 10%) 2.6
Decile 10 (highest 10%) 2.5
Rural 2.4
Urban 3.3
Women 2.5
Men 2.7
Table 6: Total count of all types of NTMs faced, by income decile
IncomeDecile
Number of NTMs Faced Duncan's testa
1 199 a b
2 201 a
3 201 a
4 192 b
5 194 a b
6 180 c
7 182 c
8 169 d
9 166 d
10 127 ea Using Duncan’s test on the average count of NTMs faced. Averages tagged with the
same letter of the alphabet are not significantly different.
4.5 Preliminary evidence that a coordination problem exists
Higher tariffs on goods produced by poor workers likely
reflects efforts by India’s trade partners to protect sectors
where their own poor work. The same pattern can be
seen in the tariffs on India’s imports, by matching India’s
own applied MFN tariffs in 2012 by sector to the income
data from the survey. Goods produced by the richest
workers (in the 10th decile) face a tariff of less than one-
third the level on goods produced by the poorest workers
(the lowest 2 deciles of the population—Table 7).
4.4 Non-tariff measures are biased against the poor
In addition to higher tariffs, the products produced
by poor workers face a greater number of non-tariff
measures. On average, the poorest (income deciles 1 and
2) face some 200 different types of NTMs while workers
belonging to the top income decile face only 127 (72 less
NTMs compared to the first decile). Unlike for tariffs,
which consistently decline across the income deciles,
the total number of NTMs for the poorer 5 deciles are
not significantly different; the total count varying from
192 to 201. On the other hand, the number of NTMs falls
significantly between the 9th and 10th deciles, with the
latter facing 39 NTMs less than the former (Table 6).
Table 7: India’s import MFN applied tariffs in 2012 by income decile
IncomeDecile Applied MFNa
1 35.6 c
2 39.0 a
3 37.5 b
4 35.3 c
5 33.8 d
6 29.9 e
7 28.0 f
8 23.3 g
9 16.9 h
10 11.6 ia Using Duncan’s test on the average count of MFNs faced. Averages tagged with
the same letter of the alphabet are not significantly different.
Similarly, the applied MFN tariffs in the United States
and China (taken from the WTO Integrated Database
based on the Member’s own data notification) tend to
be higher for goods produced by poorer workers (based
on average wage data from the UNIDO database). Goods
produced by workers in the fifth, or richest, quantile face
tariffs that are markedly lower than on goods produced
by workers from the first, or poorest, quantile across all
three countries (Table 8). While the average tariff falls
consistently across income groups in China and India,
the average U.S. tariff for sectors corresponding to the
richest quantile (3.7%) is close to that of the second-
poorest quantile (3.8%). However, this appears to be
driven by the very high tariff on tobacco.11 Since the
and lowest income decile remained unchanged over the
16-year period.
11 In the US some tobacco products have tariffs as high as 350%, corresponding to ISIC 1200, while the average wage in the tobacco sector is very high, with individuals employed in the sector being included in the top quantile of the income distribution.
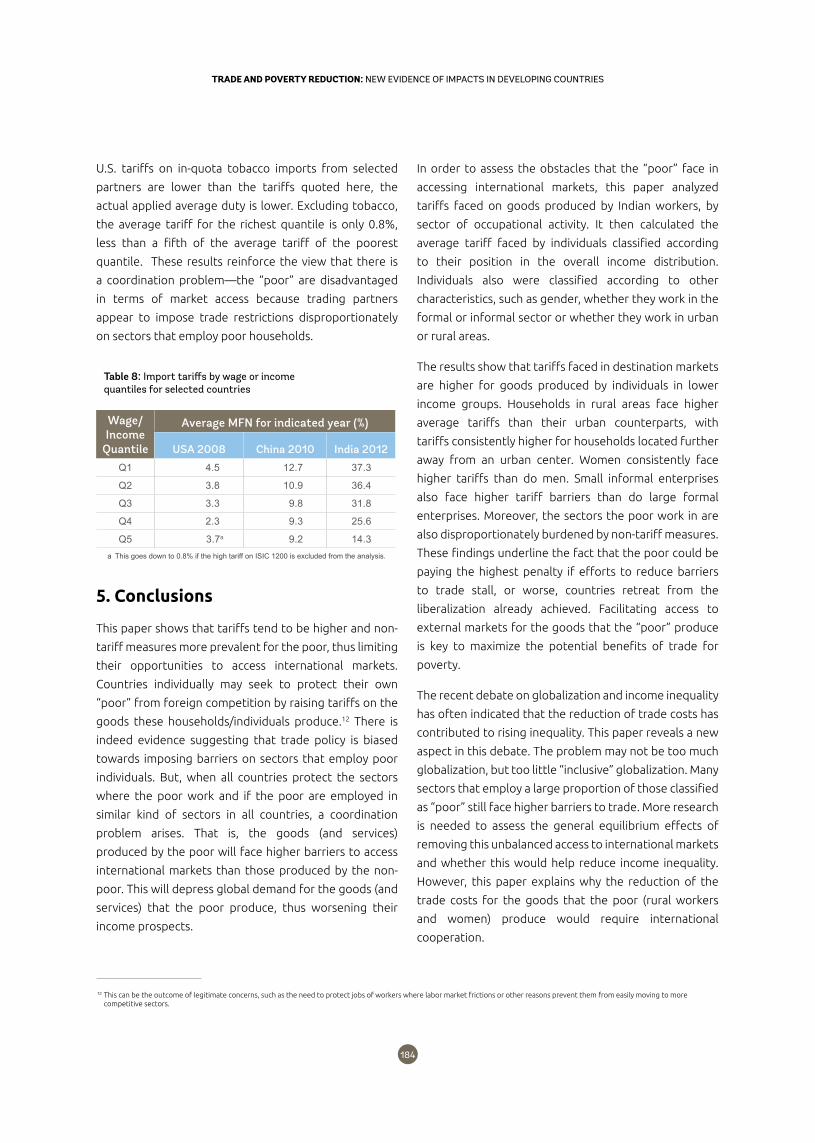
185184
TRADE AND POVERTY REDUCTION: NEW EVIDENCE OF IMPACTS IN DEVELOPING COUNTRIESTRADE AND POVERTY REDUCTION: NEW EVIDENCE OF IMPACTS IN DEVELOPING COUNTRIES
U.S. tariffs on in-quota tobacco imports from selected
partners are lower than the tariffs quoted here, the
actual applied average duty is lower. Excluding tobacco,
the average tariff for the richest quantile is only 0.8%,
less than a fifth of the average tariff of the poorest
quantile. These results reinforce the view that there is
a coordination problem—the “poor” are disadvantaged
in terms of market access because trading partners
appear to impose trade restrictions disproportionately
on sectors that employ poor households.
Table 8: Import tariffs by wage or income quantiles for selected countries
Wage/ Income
Quantile
Average MFN for indicated year (%)
USA 2008 China 2010 India 2012
Q1 4.5 12.7 37.3
Q2 3.8 10.9 36.4
Q3 3.3 9.8 31.8
Q4 2.3 9.3 25.6
Q5 3.7a 9.2 14.3a This goes down to 0.8% if the high tariff on ISIC 1200 is excluded from the analysis.
5. Conclusions
This paper shows that tariffs tend to be higher and non-
tariff measures more prevalent for the poor, thus limiting
their opportunities to access international markets.
Countries individually may seek to protect their own
“poor” from foreign competition by raising tariffs on the
goods these households/individuals produce.12 There is
indeed evidence suggesting that trade policy is biased
towards imposing barriers on sectors that employ poor
individuals. But, when all countries protect the sectors
where the poor work and if the poor are employed in
similar kind of sectors in all countries, a coordination
problem arises. That is, the goods (and services)
produced by the poor will face higher barriers to access
international markets than those produced by the non-
poor. This will depress global demand for the goods (and
services) that the poor produce, thus worsening their
income prospects.
In order to assess the obstacles that the “poor” face in
accessing international markets, this paper analyzed
tariffs faced on goods produced by Indian workers, by
sector of occupational activity. It then calculated the
average tariff faced by individuals classified according
to their position in the overall income distribution.
Individuals also were classified according to other
characteristics, such as gender, whether they work in the
formal or informal sector or whether they work in urban
or rural areas.
The results show that tariffs faced in destination markets
are higher for goods produced by individuals in lower
income groups. Households in rural areas face higher
average tariffs than their urban counterparts, with
tariffs consistently higher for households located further
away from an urban center. Women consistently face
higher tariffs than do men. Small informal enterprises
also face higher tariff barriers than do large formal
enterprises. Moreover, the sectors the poor work in are
also disproportionately burdened by non-tariff measures.
These findings underline the fact that the poor could be
paying the highest penalty if efforts to reduce barriers
to trade stall, or worse, countries retreat from the
liberalization already achieved. Facilitating access to
external markets for the goods that the “poor” produce
is key to maximize the potential benefits of trade for
poverty.
The recent debate on globalization and income inequality
has often indicated that the reduction of trade costs has
contributed to rising inequality. This paper reveals a new
aspect in this debate. The problem may not be too much
globalization, but too little “inclusive” globalization. Many
sectors that employ a large proportion of those classified
as “poor” still face higher barriers to trade. More research
is needed to assess the general equilibrium effects of
removing this unbalanced access to international markets
and whether this would help reduce income inequality.
However, this paper explains why the reduction of the
trade costs for the goods that the poor (rural workers
and women) produce would require international
cooperation.
12 This can be the outcome of legitimate concerns, such as the need to protect jobs of workers where labor market frictions or other reasons prevent them from easily moving to more competitive sectors.
185184
TRADE AND POVERTY REDUCTION: NEW EVIDENCE OF IMPACTS IN DEVELOPING COUNTRIESTRADE AND POVERTY REDUCTION: NEW EVIDENCE OF IMPACTS IN DEVELOPING COUNTRIES
ReferencesAbbott, P. C. (2012). “Export restrictions as stabilization responses to food crisis.” American Journal of Agricultural
Economics 94(2): 428–434.
Atkin, David and Dave Donaldson (2015). “Who’s Getting Globalized? The Size and Implications of Intra-national Trade
Costs.” NBER Working Paper No. 21439.
Banerjee, Abhijit, and Andrew Newman (2004). “Inequality, growth and trade policy”. Massachusetts Institute of
Technology, Department of Economics, and University College London, Department of Economics. Unpublished
Manuscript.
Campa, J. and L. Goldberg (2002), “Exchange Rate Pass-Through into Import Prices: A Macro or Micro Phenomenon?”NBER
working paper No. 8934.
Das, Samarjit, Chetan Ghate, and Peter E. Robertson (2015). “Remoteness, Urbanization, and India’s Unbalanced
Growth.” World Development 66, Pages 572-587.
Donaldson, Dave (2016). “Railroads of the Raj: Estimating the impact of transportation infrastructure.” American
Economic Review, forthcoming.
Emran, M. Shahe, and Zhaoyang Hou (2013). “Access to Markets and Rural Poverty: Evidence from Household
Consumption in China.” The Review of Economics and Statistics 95, No. 2, Pages 682-697.
Freund, Caroline and Caglar Ozden (2016).”Loss Aversion and Trade Policy”, World Bank Policy Research Working
Paper No. 3385.
Gouel, Christophe (2016). “Trade Policy Coordination and Food Price Volatility.” American Journal of Agricultural
Economics 98 (4): 1018-1037
Grossman, Gene M. and Elhanan Helpman (1994). “Protection for Sale,” American Economic Review 84:4, pp.833–50.
Han, Jun, Runjuan Liu, and Junsen Zhang (2012). “Globalization and wage inequality: Evidence from urban China”
Journal of International Economics 87: 288–297.
Ivanic, M. and W. Martin (2014). “Implications of Domestic Price Insulation for Global Food Price Volatility,” Journal of
International Money and Finance 42:272-88.
Kone, Z.L., M.Y. Liu, A. Mattoo, C. Ozden and S. Sharma (2016). “Internal Borders and Migration in India,” mimeo, The
World Bank, Washington D.C.
Kovak, Brian K. (2013). “Regional Effects of Trade Reform: What is the Correct Measure of Liberalization?” American
Economic Review 103(5): 1960–1976
McCaig, Brian (2011). “Exporting Out of Poverty: Provincial Poverty in Vietnam and US Market Access.” Journal of
International Economics 85 (1): 102–13.
187186
TRADE AND POVERTY REDUCTION: NEW EVIDENCE OF IMPACTS IN DEVELOPING COUNTRIESTRADE AND POVERTY REDUCTION: NEW EVIDENCE OF IMPACTS IN DEVELOPING COUNTRIES
Nicita, A., M. Olarreaga and P. Guido (2014). “Pro-poor trade policy in Sub-Saharan Africa.” Journal of International
Economics 92 (2014) 252–265.
Nicita, A. (2009). “Who Benefited from Trade Liberalization in Mexico?” Journal of Development Economics, forthcoming.
Porto, Guido (2010). “International Market Access and Poverty in Argentina.”Review of International Economics 18(2),
396–407.
Szamosszegi , A., and C. Kyle (2011). An Analysis of State-owned Enterprises and State Capitalism in China, US-China
Economic and Security Review Commission.
Topalova, Petia (2010). “Factor immobility and regional impacts of trade liberalization: evidence on poverty from India.”
American Economic Journal: Applied Economics 2 (4), 1–41.
Ural Marchand, Beyza (2012). “Tariff pass-through and the distributional effects of trade liberalization” Journal of
Development Economics 99, issue 2: 265-281.
Winters, L. Alan, Neil McCulloch and Andrew McKay (2004). “Trade Liberalization and Poverty: The Evidence So Far.”
Journal of Economic Literature 42(1): 72-115.
Wood, A. (1997). “Openness and Wage Inequality in Developing Countries: The Latin American Challenge to East Asian
Conventional Wisdom.” World Bank Economic Review 11, no. 1: 33-57.
187186
TRADE AND POVERTY REDUCTION: NEW EVIDENCE OF IMPACTS IN DEVELOPING COUNTRIESTRADE AND POVERTY REDUCTION: NEW EVIDENCE OF IMPACTS IN DEVELOPING COUNTRIES

Trade and Poverty Reduction: New Evidence of Impacts in Developing Countries
Photo credits:
Chhor Sokunthea (World Bank) : page 151
World Bank Flickr Images: pages 27, 103, 114, 121 and 175.
Bigstock Images: pages 10, 17, 19, 20, 22, 37, 38, 39, 49, 59, 71, 76, 85, 86, 99, 119, 123, 127, 149 and 187.
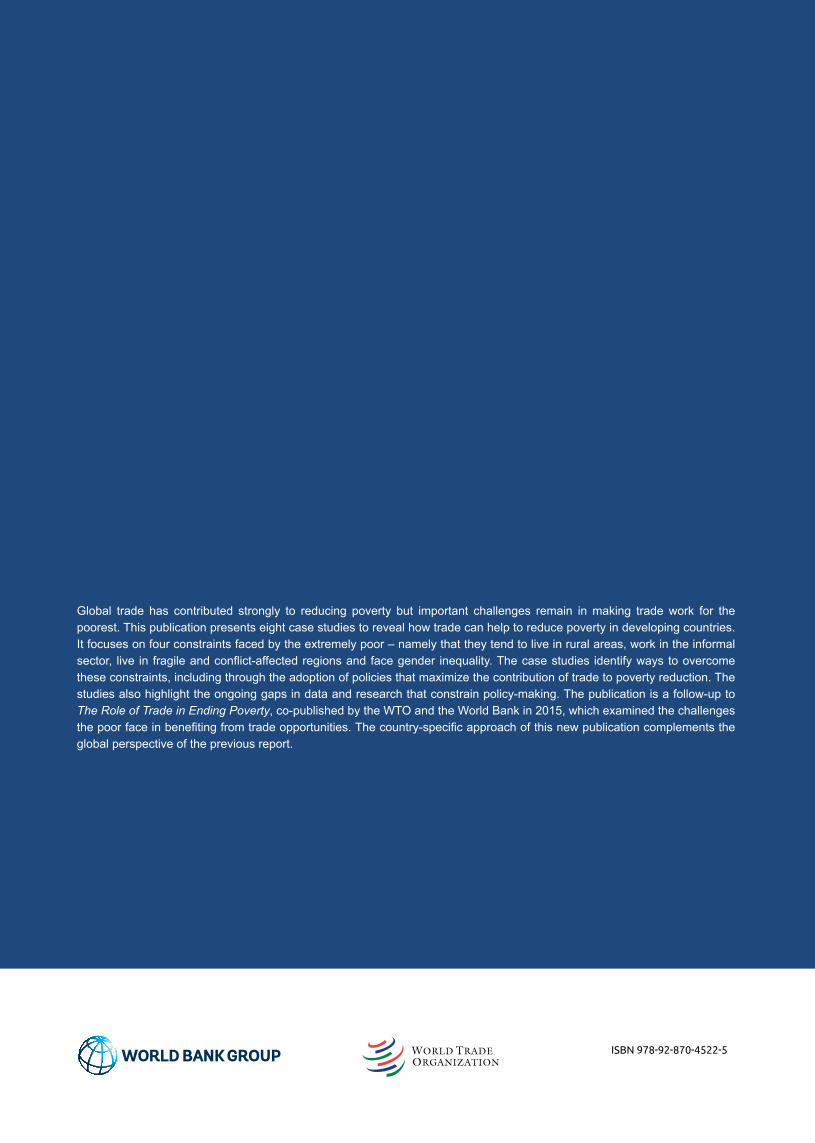
Global trade has contributed strongly to reducing poverty but important challenges remain in making trade work for the poorest. This publication presents eight case studies to reveal how trade can help to reduce poverty in developing countries. It focuses on four constraints faced by the extremely poor – namely that they tend to live in rural areas, work in the informal sector, live in fragile and conflict-affected regions and face gender inequality. The case studies identify ways to overcome these constraints, including through the adoption of policies that maximize the contribution of trade to poverty reduction. The studies also highlight the ongoing gaps in data and research that constrain policy-making. The publication is a follow-up to The Role of Trade in Ending Poverty, co-published by the WTO and the World Bank in 2015, which examined the challenges the poor face in benefiting from trade opportunities. The country-specific approach of this new publication complements the global perspective of the previous report.
ISBN 978-92-870-4522-5